comprehensive membrane science and engineering · 2018-12-09 · comprehensive membrane science and...
TRANSCRIPT


COMPREHENSIVEMEMBRANE SCIENCE AND
ENGINEERING

This page intentionally left blank

COMPREHENSIVEMEMBRANE SCIENCE AND
ENGINEERING
Editors
Enrico Drioli and Lidietta GiornoInstitute of Membrane Technology, ITM-CNR, University of Calabria, Rende (CS), Italy
Volume 1
BASIC ASPECTS OF MEMBRANE SCIENCEAND ENGINEERING
AMSTERDAM � BOSTON � HEIDELBERG � LONDON � NEW YORK � OXFORD
PARIS � SAN DIEGO � SAN FRANCISCO � SINGAPORE � SYDNEY � TOKYO
Academic Press is an imprint of Elsevier

ElsevierThe Boulevard, Langford Lane, Kidlington OX5 1GB, United Kingdom
First edition 2010
Copyright ª 2010 Elsevier B.V. All rights reserved
Permissions may be sought directly from Elsevier’s Science & Technology RightsDepartment in Oxford, UK: phone (+44) (0) 1865 843830; fax (+44) (0) 1865 853333;
email: [email protected]. Alternatively visit the Science & Technology website atwww.elsevierdirect.com/rights for further information
NoticeNo responsibility is assumed by the publisher for any injury and/or damage to personsor property as a matter of products liability, negligence or otherwise, or from any use
or operation of any methods, products, instructions or ideas contained in the materialherein. Because of rapid advances in the medical sciences, in particular, independent
verification of diagnoses and drug dosages should be made.
British Library Cataloging in Publication DataA catalog record for this book is available from the British Library
Library of Congress Control NumberA catalog record for this book is available from the Library of Congress
ISBN: 978-0-444-53204-6
For information on all Elsevier publicationsvisit our website at elsevierdirect.com
Printed and bound in Italy
09 10 11 12 10 9 8 7 6 5 4 3 2 1

Contents of Volume 1
Contributors to Volume 1 vii
Contents of All Volumes ix
Introduction xi
Volume 1 Basic Aspects of Membrane Science and Engineering
Role and Function of Biological and Artificial Membranes
1.01 Biological Membranes and Biomimetic Artificial Membranes 1L. Giorno, R. Mazzei, and E. Drioli, Institute of Membrane Technology, ITM-CNR, University ofCalabria, Rende (CS), Italy
1.02 Functionalized Membranes for Sorption, Separation, and Reaction: An Overview 13A. R. Ladhe, J. Xu, A. M. Hollman, V. Smuleac, and D. Bhattacharyya, University of Kentucky,Lexington, KY, USA
Fundamentals of Transport Phenomena in Membranes
1.03 Modeling and Simulation of Membrane Structure and Transport Properties 29V. N. Burganos, Institute of Chemical Engineering and High Temperature Chemical Processes,Foundation for Research and Technology-Hellas, Patras, Greece
1.04 Fundamentals of Transport Phenomena in Polymer Membranes 75D. R. Paul, University of Texas at Austin, Austin, TX, USA
Basic Aspects of Polymeric and Inorganic Membrane Preparation
1.05 Basic Aspects in Polymeric Membrane Preparation 91H. Strathmann, Universitat Stuttgart, Stuttgart, GermanyL. Giorno and E. Drioli, Institute of Membrane Technology, ITM-CNR, University of Calabria,Rende (CS), Italy
1.06 Advanced Polymeric and Organic–Inorganic Membranes for Pressure-Driven Processes 113S. P. Nunes and K.-V. Peinemann, King Abdullah University of Science and Technology,Thuwal, Saudi Arabia
1.07 Norbornene Polymers as Materials for Membrane Gas Separation 131Y. Yampolskii, A. V. Topchiev Institute of Petrochemical Synthesis, Moscow, Russia
1.08 Amorphous Perfluoropolymer Membranes 147V. Arcella, P. Toniolo, M. Avataneo, A. Ghielmi, and G. Marchionni, Solvay Solexis,Bollate (MI), Italy
v

1.09 Plasma Membranes 159S. Roualdes, V. Rouessac, and J. Durand, Universite Montpellier, Montpellier, France
1.10 Preparation of Membranes Using Supercritical Fluids 199E. Reverchon and S. Cardea, University of Salerno, Fisciano, Italy
1.11 Basic Aspects in Inorganic Membrane Preparation 217A. Buekenhoudt, A. Kovalevsky, Ir J. Luyten, and F. Snijkers, Flemish Institute forTechnological Research (VITO), Mol, Belgium
1.12 Ceramic Hollow Fiber Membranes and Their Applications 253K. Li, Imperial College London, London, UK
1.13 Preparation of Carbon Membranes for Gas Separation 275A. F. Ismail, Universiti Teknologi Malaysia, Johor, Malaysia
1.14 Carbon Nanotube Membranes: A New Frontier in Membrane Science 291M. Majumder, Monash University, Clayton, VIC, AustraliaP. M. Ajayan, Rice University, Houston, TX, USA
Membrane Characterization
1.15 Characterization of Filtration Membranes 311C. Causserand and P. Aimar, Universite de Toulouse, Toulouse, France, CNRS, Toulouse, France
1.16 The Use of Atomic Force Microscopy in Membrane Characterization 337N. Hilal and D. Johnson, Swansea University, Swansea, UK
Index to Volume 1 355
vi Contents of Volume 1

Contributors to Volume 1
P. AimarUniversite de Toulouse, Toulouse, France, CNRS, Toulouse, France
P. M. AjayanRice University, Houston, TX, USA
V. ArcellaSolvay Solexis, Bollate (MI), Italy
M. AvataneoSolvay Solexis, Bollate (MI), Italy
D. BhattacharyyaUniversity of Kentucky, Lexington, KY, USA
A. BuekenhoudtFlemish Institute for Technological Research (VITO), Mol, Belgium
V. N. BurganosInstitute of Chemical Engineering and High Temperature Chemical Processes, Foundation for Researchand Technology-Hellas, Patras, Greece
S. CardeaUniversity of Salerno, Fisciano, Italy
C. CausserandUniversite de Toulouse, Toulouse, France, CNRS, Toulouse, France
E. DrioliInstitute of Membrane Technology, ITM-CNR, University of Calabria, Rende (CS), Italy
J. DurandUniversite Montpellier, Montpellier, France
A. GhielmiSolvay Solexis, Bollate (MI), Italy
L. GiornoInstitute of Membrane Technology, ITM-CNR, University of Calabria, Rende (CS), Italy
N. HilalSwansea University, Swansea, UK
A. M. HollmanUniversity of Kentucky, Lexington, KY, USA
A. F. IsmailUniversiti Teknologi Malaysia, Johor, Malaysia
D. JohnsonSwansea University, Swansea, UK
vii

A. KovalevskyFlemish Institute for Technological Research (VITO), Mol, Belgium
A. R. LadheUniversity of Kentucky, Lexington, KY, USA
K. LiImperial College London, London, UK
Ir. J. LuytenFlemish Institute for Technological Research (VITO), Mol, Belgium
M. MajumderMonash University, Clayton, VIC, Australia
G. MarchionniSolvay Solexis, Bollate (MI), Italy
R. MazzeiInstitute of Membrane Technology, ITM-CNR, University of Calabria, Rende (CS), Italy
S. P. NunesKing Abdullah University of Science and Technology, Thuwal, Saudi Arabia
D. R. PaulUniversity of Texas at Austin, Austin, TX, USA
K.-V. PeinemannKing Abdullah University of Science and Technology, Thuwal, Saudi Arabia
E. ReverchonUniversity of Salerno, Fisciano, Italy
S. RoualdesUniversite Montpellier, Montpellier, France
V. RouessacUniversite Montpellier, Montpellier, France
V. SmuleacUniversity of Kentucky, Lexington, KY, USA
F. SnijkersFlemish Institute for Technological Research (VITO), Mol, Belgium
H. StrathmannUniversitat Stuttgart, Stuttgart, Germany
P. TonioloSolvay Solexis, Bollate (MI), Italy
J. XuUniversity of Kentucky, Lexington, KY, USA
Y. YampolskiiA. V. Topchiev Institute of Petrochemical Synthesis, Moscow, Russia
viii Contributors to Volume 1

Contents of All Volumes
Volume 1 Basic Aspects of Membrane Science and Engineering
Role and Function of Biological and Artificial Membranes
1.01 Biological Membranes and Biomimetic Artificial Membranes1.02 Functionalized Membranes for Sorption, Separation, and Reaction: An Overview
Fundamentals of Transport Phenomena in Membranes
1.03 Modeling and Simulation of Membrane Structure and Transport Properties1.04 Fundamentals of Transport Phenomena in Polymer Membranes
Basic Aspects of Polymeric and Inorganic Membrane Preparation
1.05 Basic Aspects in Polymeric Membrane Preparation1.06 Advanced Polymeric and Organic–Inorganic Membranes for Pressure-Driven Processes1.07 Norbornene Polymers as Materials for Membrane Gas Separation1.08 Amorphous Perfluoropolymer Membranes1.09 Plasma Membranes1.10 Preparation of Membranes Using Supercritical Fluids1.11 Basic Aspects in Inorganic Membrane Preparation1.12 Ceramic Hollow Fiber Membranes and Their Applications1.13 Preparation of Carbon Membranes for Gas Separation1.14 Carbon Nanotube Membranes: A New Frontier in Membrane Science
Membrane Characterization
1.15 Characterization of Filtration Membranes1.16 The Use of Atomic Force Microscopy in Membrane Characterization
Index to Volume 1
Volume 2 Membrane Operations in Molecular Separations
Reverse Osmosis and Nanofiltration
2.01 Fundamentals in Reverse Osmosis2.02 Preparation of Industrial RO, NF Membranes, and Their Membrane Modules and Applications2.03 Current and Emerging Developments in Desalination with Reverse Osmosis Membrane Systems2.04 Transport Phenomena in Nanofiltration Membranes2.05 Nanofiltration Operations in Nonaqueous Systems
Ultrafiltration and Microfiltration
2.06 Ultrafiltration: Fundamentals and Engineering2.07 Fundamentals of Cross-Flow Microfiltration
ix

Gas Separation
2.08 Polymeric Membranes for Gas Separation2.09 Membranes for Recovery of Volatile Organic Compounds
Pervaporation
2.10 Fundamentals and Perspectives for Pervaporation2.11 Selective Membranes for Purification and Separation of Organic Liquid Mixtures2.12 Supported Liquid Membranes for Pervaporation Processes
Dialysis
2.13 Progress in the Development of Membranes for Kidney-Replacement Therapy
Electromembrane Processes
2.14 Electromembrane Processes: Basic Aspects and Applications2.15 Basic Aspects in Proton-Conducting Membranes for Fuel Cells
Index to Volume 2
Volume 3 Chemical and Biochemical Transformations in Membrane Systems
Basic Aspects of Membrane Reactors
3.01 Basic Aspects of Membrane Reactors3.02 Computer-Aided Model-Based Design and Analysis of Hybrid Membrane Reaction-Separation Systems3.03 Modelling and Simulation of Catalytic Membrane Reactors3.04 Multiphase Membrane Reactors
Catalytic Membranes and Membrane Reactors
3.05 Catalytic Membranes and Membrane Reactors3.06 Pervaporation Membrane Reactors3.07 Photocatalytic Processes in Membrane Reactors3.08 Biocatalytic Membranes and Membrane Bioreactors
Biochemical Transformations and Regenerative Medicine
3.09 Hollow Fiber Membrane Bioreactor Technology for Tissue Engineering and Stem Cell Therapy3.10 Membrane Approaches for Liver and Neuronal Tissue Engineering3.11 Separation and Purification of Stem and Blood Cells by Porous Polymeric Membranes
Index to Volume 3
Volume 4 Membrane Contactors and Integrated Membrane Operations
Basic Principles of Membrane Contactors
4.01 Membrane Distillation and Osmotic Distillation4.02 Membrane Crystallization Technology4.03 Membrane Emulsification4.04 Liquid Membranes
Integrated Membrane Operations in Various Industrial Sectors: Case Studies
4.05 Integrated Membrane Operations in Various Industrial Sectors4.06 Basic Aspects and Applications of Membrane Processes in Agro-Food and Bulk Biotech Industries4.07 Membrane Bioreactor in Water Treatment4.08 Membrane Technology: Latest Applications in the Refinery and Petrochemical Field4.09 Membrane Systems for Seawater and Brackish Water Desalination
Cumulative Index
x Contents of All Volumes

Introduction
The last century has been characterized by a huge resource-intensive industrial development, particularly insome Asian countries, spurred by the growth in the global population level, by a significant elongation of lifeexpectation, and by an overall increase in the standards characterizing the quality of life. These positiveaspects of our recent history have been combined however with the emergence of related problems such aswater stress, the environmental pollution, and the increase of CO2 emissions into the atmosphere. Thesenegative aspects of the transformations which have been characterizing our recent progress have been verymuch related to the momentum at which transformations themselves occurred and to the lack of innovationsand introduction of new strategies capable of both controlling and minimizing the relatively obvious negativeaspects of industrial development worldwide. A clear example is represented by the wastewater treatmentstrategy. As illustrated in Figure 1, from 1556 until today, the same concept is basically present in variouswastewater-treatment systems.
The need to achieve a knowledge-intensive industrial development is nowadays well recognized. This willpermit the transition from an industrial system based on quantity to one based on quality. Human capital isincreasingly becoming the driving force behind this socio-economical transformation. The challenge of sustain-able growth relies on the use of advanced technologies. Membrane technologies are in many fields alreadyrecognized as amongst the best-available technologies (BATs) able to contribute to this process (Figure 2).
Process engineering is one of the disciplines most involved in the technological innovations necessary to facethe new problems characterizing the world today and in the future as well. Recently, the logic of processintensification has been suggested as the best process engineering answer to the situation. It consists ofinnovative equipment, design, and process development methods that are expected to bring substantialimprovements in chemical and any other manufacturing and processing, such as decreasing production costs,equipment size, energy consumption, and waste generation, and improving remote control, information fluxes,and process flexibility (Figure 3).
How to implement this strategy is, however, not obvious. An interesting and important case is the continuousgrowth of modern membrane engineering whose basic aspects satisfy the requirements of process intensifica-tion. Membrane operations, with their intrinsic characteristics of efficiency and operational simplicity, highselectivity and permeability for the transport of specific components, compatibility between different mem-brane operations in integrated systems, low energetic requirement, good stability under operating conditionsand environmental compatibility, easy control and scale-up, and large operational flexibility, represent aninteresting answer for the rationalization of chemical and any other industrial productions. Many membraneoperations are practically based on the same hardware (materials), only differing in their software (methods).The traditional membrane separation operations (reverse osmosis (RO), microfiltration (MF), ultrafiltration(UF), and nanofiltration (NF), electrodialysis, pervaporation, etc.), already largely used in many differentapplications, are today conducted with new membrane systems such as catalytic membrane reactors andmembrane contactors. At present, redesigning important industrial production cycles by combining variousmembrane operations suitable for separation and conversion units, thus realizing highly integrated membraneprocesses, is an attractive opportunity because of the synergic effects that can be attained.
In various fields, membrane operations are already dominant technologies. Interesting examples are inseawater desalination (Figure 4); in wastewater treatment and reuse (Figure 5); and in artificial organs (Figure 6).
xi

It is interesting to consider that a large part of the membrane operations realized today at the industrial levelhas been in existence in the biological system and in nature ever since life came into being. A major part of
biological systems is, in fact, well represented by membranes which operate molecular separations, chemical
transformation, molecular recognition, energy, mass and information transfer, etc. (Figure 7).Some of these functions have been transferred at the industrial level with success. We are, however, far away
from being able to reproduce the complexity and efficiency of the biological membranes, to integrate the
Sedimentation tanksof a modern water-treatment plant
Agricola, De ReMetallica, 1556
Membrane technology, today a
dominant technology in effluents
treatment systems
Membrane bioreactors, one of the best availabletechnologies (BATs) for municipal and industrialwastewater treatment
Figure 1 Wastewater-treatment technological approach in the past and today.
Social-economical contest
Membrane technologies
Res
ourc
e-in
tens
ive
syst
em
Request for goods /quality of life
Environment
Globalization
Resourceaccessibility Sustainable
growthBAT
Maximization ofresources use
Clean technologies
Precise, flexible,intensified technologies ..
Advancedtechnologies transfer
Sustainableconsumption
Sustainableproduction
Kno
wle
dge-
inte
nsiv
e sy
stem
From quantity to quality economy:(:(
Quantity Quality
Figure 2 Current social-economical and technological contest driving the transition towards a knowledge-intensive systemto guarantee sustainable growth.
xii Introduction

various functionalities, the capability to repair damage, and to maintain for a very long time their specificactivities, avoiding fouling problems, degradation of the various functions, and keeping the system alive.Therefore, future generations of membrane scientists and engineers will have to address their attention tounderstanding and reproducing the astonishing natural systems, which are at the basis of the life with which weare familiar.
In Comprehensive Membrane Science and Engineering, we have tried to present and discuss the most relevantresults of membrane science and engineering reached during the last years.
Authors from all around the world, senior scientists, and PhD students have contributed to the four volumescovering fundamental aspects of membrane preparations and characterization, their applications in various unit
To design clean and very efficientprocesses in refining and
petrochemicals
One vision of how a future plant employing processintensification may look (right) vs. a conventional plant (left).
Operating with nonpolluting processes involving Processintensification
Savings about 30% (Raw materials + Energy + Operating costs)
Figure 3 Process intensification strategy. Reproduced from Jean-Claude Charpentier, Modern Chemical Engineering in the
Framework of Globalization, Sustainability, and Technical Innovation, Ind. Eng. Chem. Res., Vol. 46, No. 11, 2007.
Figure 4 Membrane desalination plant. RO membrane units from El Paso Desalintion Plant, Texas: the site of the word’s
largest inland desalination plant (104 000 m3 d�1). Production costs for water are less than less than 0.36 $ m�3. From http://
www.epwu.org/167080115.
Introduction xiii

operations, from molecular separation to chemical transformations in membrane reactors, to the optimization of
mass and energy transfer in membrane contactors. Their application in strategic fields, including energy,
environment, biomedical, biotechnology, agro-food, and chemical manufacturing, has been highlighted.
Module Cassette Process train
Figure 5 Submerged membrane module for wastewater treatment. From ZeeWeed� Submerged Membrane System, fromhttp://www.gewater.com.
Membrane
Dopamine-secreting cells
Encapsulated cells forParkinson’s disease
Membrane
Glucose oxydaseGlucose biosensor
Drug release
Membrane
Support
Drug
Adhesive layer
Blood oxygenator
Membrane
Oxygen
Blood
Membrane
Dialysate
Hemodialyser
Insulin
Membrane
Pancreatic isletsBlood
Bioartificial pancreas
Artificial skin
Bioartificial liver
MembraneHepatocytes
Blood
Glucose
Figure 6 Membranes and membrane devices in biomedical applications. Modified from L. De Bartolo e E. Drioli.
‘‘Membranes in artificial organs’’ In Biomedical and Health Research vol. 16: New Biomedical Materials – Basic and Applied
Studies Haris, P.I. and Chapman, D. (Eds.) IOS Press: Amsterdam/Berlin/Tokjo/Washington, (1998) pp. 167–181.
xiv Introduction

Today, the possibility of redesigning a significant number of membrane operations, introduced via industrialproduction, is becoming more and more attractive and realistic.
Strong efforts are however necessary for spreading the available knowledge in membrane engineering to thepublic and for educating the younger generations more and more in the fundamentals and applications of these
creative, dynamic, and important disciplines.With this text we have tried to contribute to these efforts.In Volume 1, fundamental aspects of the transport phenomena, which characterize permeability and
selectivity in molecular separations based on polymeric, inorganic, and mixed-matrix membranes are discussed
together with the basic principles for their preparation in various possible configurations (flat sheets, tubular
fiber, microcapsules, etc.). The basic methodology generally utilized for their characterization is also discussed.In Volume 2, the most relevant membrane operations such as the pressure-driven systems in liquid phase
(MF, UF, NF, and RO) and in gas phase (gas separation and vapor permeation) together with other separation
processes, such as dialysis, pervaporation, and electrochemical membrane systems, are analyzed and discussed
in their basic principles and applications.In Volume 3, the recent interest in the combination of molecular separations with chemical transformations
largely present in biological systems is presented. It is important to recall that the industrial development of
these membrane reactors and catalytic membrane systems is not yet at the level of the more well-known
pressure-driven processes. However, the expectation of a significant fast growth of membrane reactors and
membrane bioreactors is very significant. Interesting success, in fact, can already be indicated by the recogni-
tion of the submerged membrane reactors such as BAT in municipal wastewater treatment and reuse. The
potentialities of this system in the area of bioengineering and biomedical applications are also very attractive,
where bioartificial organs, such as bioartificial liver and pancreas, are in some case already at clinical trial level.Volume 4 is addressed to the description of relatively new membrane operations, where membranes are not
required to be selective. Their role is the optimization of the best mass and energy transfer between different
phases, acting as membrane contactors. Membrane distillation, membrane crystallizers, membrane emulsifiers,
Extracellurar side
Intracellular side
(a)
(b)
Phospholipid(Phosphatldylcholine)
Hydrophilic head
Hydropbobic tail
Figure 7 Biological membrane functions. From http://www.mcgraw-hill.it/.
Introduction xv

membrane strippers, and membrane scrubbers are typical examples of these important new unit operations inmodern process engineering. New materials, for example, highly hydrophobic and nanostructured, and newcomplex configurations, will be developed for further exploitation of these systems.
The combination of all the different membrane operations described in the previous books in a singleindustrial productive cycle may permit the design of totally innovative industrial transformation, and inte-grated membrane operations where a process engineer could utilize the potentialities of the artificial membranesystems to realize a sustainable industrial development in the logic of the process intensification strategy.
It is also important to recall that not only the industrial world will benefit from this approach, but also thedesign of hybrid artificial organs and the development, in general, of regenerative medicine might benefit fromthe same strategy.
Acknowledgments
It has been really interesting and a pleasure working for these last two years for the preparation of the fourvolumes of Comprehensive Membrane Science and Engineering. We have been interacting and discussing with a largenumber of colleagues in reaching our objectives and we wish to thank all of them for the effective collaborationwe have received.
We specially acknowledge our young colleague Dr. Enrica Fontananova, who has been helping from thebeginning to coordinate our work, keeping in contact with all the contributors. Her excellent knowledge andexperience of membrane science and membrane engineering has been quite necessary and fruitful in carryingout her work.
We hope these four volumes will help a large number of researchers, engineers, and technical people toincrease their knowledge and interest in membranology.
Enrico Drioli and Lidietta Giorno
xvi Introduction
1.01 Biological Membranes and Biomimetic ArtificialMembranesL Giorno, R Mazzei, and E Drioli, Institute of Membrane Technology, ITM-CNR, University of Calabria,Rende (CS), Italy
ª 2010 Elsevier B.V. All rights reserved.
1.01.1 Introduction 1
1.01.2 Biological Membrane 2
1.01.2.1 Examples of In Vivo Systems Compartimentalization 7
1.01.2.2 In Vitro Membrane Processes that Simulate In Vivo Systems 8
References 10
Glossary
Aquaporin Protein system that permits the
passage of water through the biological membrane.
Bioartificial synthetic membrane Artificial
membrane system that simulates biological
membrane.
Biological membrane A complex multifunctional
and dynamically structured multicomponent
system acting as an enclosing or separating barrier
within or around a cell.
Biomembrane Biological membrane.
Biomimetic membrane system Artificial
membrane system that biomimics biological
membrane.
Integral protein Structural protein of biological
membrane.
Phytoalexins Substances used from vegetal cells
synthesized in response to pathogen attack.
Phytoanticipin Preformed substances, contained
in vegetal cells used for defense against
pathogens.
1.01.1 Introduction
The key feature that distinguishes a biological mem-
brane from an artificial membrane is that the biological
membrane is extremely selective, precise, and efficient
in terms of: recognition properties; regulation of
passage of diverse atoms and molecules having diverse
physical and chemical properties; signaling and infor-
mation transmission; response to external physical,
chemical, and biochemical stimuli; and self-regulating,
self-healing, and self-cleaning properties.The biological membrane is able to recognize
what the cell needs for its survival and accordingly
promote the exchange of matter, information, and
energy. The cell membrane is able to recognize
harmful components and block their passage into
the cell or even capture and eliminate them. The
cell membrane performs these actions dynamically
with the capacity to adapt to new events.On the other hand, biological membranes would
not be able to satisfy industrial production require-
ments in terms of mechanical stability and
productivity, which must be much higher than the
ones biomembranes can usually afford. On the con-
trary, artificial membranes can guarantee sustainable
productivity and mechanical stability. In fact, unlike
most biological membranes, artificial polymer mem-
branes are very stable and can withstand considerable
pressure, essential requirements for practical use,
such as industrial production, water purification,
and desalination processes. The challenges of man-
made membranes are to achieve selective, recogni-
tion, and response properties similar to the ones
biological membranes can exhibit while maintaining
much higher mechanical and production properties.The biological membrane has evolved through
eons and, according to the evolution theory, it repre-
sents the most suitable system which adapted to the
environment boundary conditions. It can be consid-
ered then, basically as the selected result of a long
trial-and-error process, which most probably started
with much simpler molecules and systems and
evolved into the membranes we know today. The
ambition is that by a rational approach, one may
1

dare to design and achieve such or better perfor-mance and even faster! The challenge is to knowhow. A holistic systems membrane engineeringapproach may represent an integrative strategyto advance the current knowledge achieved in thefield.
It is worth considering that unlike biological mem-branes, which are formed on the basis of a very accurateand regulated bottom-up process (able to also correcteventually mistakes that occurred), artificial mem-branes have been initially developed by very farapproach. Nowadays, bottom-up methodologies arebeing developed, including self-assembling of func-tional molecules. Still, most industrial applicationsrely on traditional polymer membranes. However, theadvances in knowledge about individual element prop-erties, their resulting functions when assembled in acomplex system, as well as about how to prepare com-plex systems, will aid to move toward biomimeticartificial membranes with advanced efficiency. Theterm ‘biomimetic’ is used in the general sense of achiev-ing performance, functions that mimic the biologicalones (this can be achieved with the use of biologicaltools as well as with artificial tools used separately or asintegrated hybrid systems).
1.01.2 Biological Membrane
A biological membrane or biomembrane is a complexmultifunctional and dynamically structured multicom-ponent system acting as an enclosing or separatingbarrier within or around a cell (Figure 1). Such a barrieris a selectively permeable structure finely controllingthe transport of substances in and out of it, needed forcell survival. The size, the charge, and other chemicalproperties of atoms and molecules will determinewhether they will pass through it. Selective permeabilityis the essential key feature for effective separation of acell or organelles from its surrounding. Biological mem-branes also have certain mechanical and elasticproperties. If a particle is too large or otherwise unableto cross the membrane, but it is still needed by the cell, itcould either go through one of the protein channels orbe taken in by means of endocytosis..
The cell membrane contains a wide variety ofbiological molecules, primarily proteins and lipids,which are involved in a variety of cellular processessuch as cell adhesion, ion channel conductance, cellsignaling, and cell signal transduction.
The biological membrane also serves as theattachment point for the intracellular skeleton and,
Extracellular side
Intracellular side
Phospholipid(Phosphatldylcholine)
Hydrophlic head
Hydrophlic tail
(a)
(b)
Integralglobularprotein
GlycolipidCarbohydrate Glycoprotein
Integral alfa-helixprotein
Figure 1 Biological membrane.
2 Role and Function of Biological and Artificial Membranes

if present, the extracellular cell wall (such as in fungi,
some bacteria, and plants).The cell membrane is an amphipathic layer,
composed by a double layer of lipid molecules (usually
phospholipids) and proteins (Figure 1(a)). Amphipathic
phospholipids (Figure 1(b)) spontaneously arrange so
that the hydrophobic tail regions are shielded from the
surrounding polar fluid, causing the more hydrophilic
head regions to associate with the cytosolic and
extracellular faces of the resulting bilayer. This is
considered as a two-dimensional (2D) fluid phase (fluid
mosaic model) where lipid and protein molecules com-
posing it can move with a certain degree of freedom in
the 2D plane (Figure 1(a)) [1]. This continuous
lipid bilayer contains embedded specific proteins and
various structures or domains, including integrins,
cadherins, clathrin-coated pits, caveolaes, protein–
protein complexes, lipid rafts, pickets, and fences formed
by actin-based cytoskeleton, and large stable structures
such as synapses or desmosomes. These proteins and
structures afford the cell membrane the capability to
execute a large variety of specific transactions and
functions.The cell membrane consists of three classes of
amphipathic lipids: phospholipids, glycolipids,
and steroids. The amount of each depends upon the
type of cell, but, in general, phospholipids
are the most abundant. Examples of the major mem-
brane phospholipids include phosphatidylcholine
(PtdCho) 1, phosphatidylethanolamine (PtdEtn) 2,
phosphatidylinositol (PtdIns) 3, and phosphatidyl-
serine (PtdSer) 4.
CH2 OOCR′CH
CH2
R′′COO
O P
O
O–
O CH2CH2N(CH3)3+
+OP
O
O O
CH2CH2 N(CH3)3
Phosphatidylcholine
1,2-Dihexadecanoyl-sn-glycero-3-phosphocholine
OO H
O
1
CH2 OOCR′CH
CH2
R′′COO
O P
O
O–
O CH2CH2NH3
+
OP
O
O
O–
O–
CH2CH2 NH3
Phosphatidylethanolamine
1-Hexadecanoyl, 2-(9Z,12Z-octadecadienoyl)-sn-glycero-3-phosphoethanolamine
O
O
O H
O
2
+
OP
O
O O
O–
1-Octadecanoyl, 2-(5Z,8Z,11Z,14Z-elcosatetraenoyl)-sn-glycero-3-phospho-(1'-myo-inositol)
OO H
O
3
HOOHOH
OHOH
12
X+
(where X = H, Na, K, Ca, etc.)
Biological Membranes and Biomimetic Artificial Membranes 3

The fatty chains in phospholipids and glycolipidsusually contain between 16 and 20 carbon atoms. The16- and 18-carbon fatty acids are the most common.Fatty acids may be saturated or unsaturated, with theconfiguration of the double bonds nearly always cis.The length and the degree of unsaturation of fatty acidchains have important effect on membranes fluidity, asunsaturated lipids prevent the fatty acids from packingtogether tightly, thus increasing the fluidity of themembrane. The ability of some organisms to regulatethe fluidity of their cell membranes by altering lipidcomposition is called homeoviscous adaptation. Theentire membrane is held together via noncovalentinteraction of hydrophobic tails. Under physiologicalconditions, phospholipid molecules in the cell mem-brane are in the liquid crystalline state. It means thelipid molecules are free to diffuse and exhibit rapidlateral diffusion along the layer in which they arepresent. However, the exchange of phospholipidmolecules between intracellular and extracellular leaf-lets of the bilayer is a controlled process.
Plasma membranes also contain carbohydrates,predominantly glycoproteins, but with some glycoli-pids (cerebrosides and gangliosides). For the mostpart, no glycosylation occurs on membranes withinthe cell; rather, generally glycosylation occurs on theextracellular surface of the plasma membrane [2–4].
The glycocalyx is an important feature in all cells,especially epithelia with microvilli. Recent data sug-gest the glycocalyx participates in cell adhesion,lymphocyte homing, and in many others functions.
The penultimate sugar is galactose and the term-inal sugar is sialic acid, as the sugar backbone ismodified in the Golgi apparatus. Sialic acid deriva-tives, such as NANA or N-acetyl-neuraminic acid,carry negative charge, providing an external barrier
to charged moieties. Sialic acids are found mostly inglycoproteins and gangliosides, important integralmembrane proteins that play a role in cell–cellinteractions.
Proteins in the cell membrane can be integralor peripheral (Figure 1(b)). Integral proteinsspan the entire membrane thickness; are consti-tuted of a hydrophilic cytosolic domain, whichinteracts with internal molecules; a hydrophobicmembrane-spanning domain consisting of one,multiple, or a combination of �-helices and�-sheet protein motifs – this domain anchorsthe protein within the cell membrane; and ahydrophilic extracellular domain that interactswith external molecules. They function as ionchannels, proton pumps, and G-protein-coupledreceptors. Peripheral proteins are present on onlyone side of the membrane. They are attached tointegral membrane proteins, or associated withperipheral regions of the lipid bilayer. Theseproteins tend to have only temporary interactionswith biological membranes, and, once havingreacted, the molecules dissociate to carry outtheir role in the cytoplasm. They function asenzymes and hormones.
Lipid-anchored proteins that function as Gproteins are covalently bound to single or multiplelipid molecules, hydrophobically insert into the cellmembrane, and anchor the protein. The proteinsthemselves are not in contact with the membrane.
The amount of protein differs between species andaccording to function, however, the typical amount ina cell membrane is 50%. The cell membrane, beingexposed to the outside environment, is an importantsite of cell–cell communication. Therefore, a largevariety of protein receptors and identification
CH2 OOCR′CH
CH2
R′′COO
O P
O
O–
O CH2CHOO–
OP
O
OO
O
1-Octadecanoyl, 2-(4Z,7Z,10Z,13Z,16Z,19Z-docosahexaenoyl)-sn-glycero-3-phosphoserine
OO H
O
4
X+
(where X = H, Na, K, Ca, etc.)
NH3+
NH3+
X+
H CO
O–
–
4 Role and Function of Biological and Artificial Membranes

proteins, such as antigens, are present on the surface ofthe membrane. Functions of membrane proteins canalso include cell–cell contact, surface recognition,cytoskeleton contact, signaling, enzymatic activity, ortransporting substances across the membrane.
The arrangement of hydrophilic polar heads andhydrophobic nonpolar tails of the lipid bilayer pre-vents polar solutes such as amino acids, nucleic acids,carbohydrates, proteins, and ions from diffusingacross the membrane, but generally allows for passivediffusion of hydrophobic molecules. This affords themembrane the ability to control the transport of thepolar substances via transmembrane protein com-plexes such as pores and gates. Membrane proteinsworking as transmembrane lipid transporter, such asflippases, permit the movement of phospholipidmolecules between the two leaflets that composethe cell membrane (Figure 2).
As mentioned, membranes serve diverse functionsin eukaryotic and prokaryotic cells. One of the mostimportant roles is to regulate the movement of mate-rials into and out of cells. The phospholipid bilayerstructure with specific membrane proteins accountsfor selective permeability and passive and activetransport mechanisms. In addition, membranes inprokaryotes and in the mitochondria and chloroplastof eukaryotes facilitate the synthesis of adenosinetriphosphate (ATP) through chemiosmosis.
When substances move across a membranetoward either chemical or electrical equilibrium, themovement typically requires no net input of energy.Passive transports, such as simple diffusion via gra-dients and facilitated diffusion via carriers, areinstances of such movement (Figure 3).
Water crosses cell membranes by facilitateddiffusion through the lipid bilayer, through waterchannel proteins called aquaporins (Figure 4).The presence of pores or channels in cell
membranes to permit a flow of water was thought
to be because the osmotic permeability of some
epithelial cells was much too large to be
accounted for by simple diffusion through the
plasma membrane. Aquaporins form tetramers in
the cell membrane, which facilitate the transport
Figure 2 Scramblases.
Biologicalmembrane
Outside ofthe cell
Inside ofthe cell
Higher soluteconcentration
Lower soluteconcentration
Sol
ute
Biologicalmembrane
Outside ofthe cell
Inside ofthe cell
Carrierprotein
Highersoluteconcentration
(a)
(b)
Figure 3 Passive transport: (a) simple diffusion via
gradient (concentration); (b) facilitate diffusion via carrier(integral protein).
+
+
2
H2O H2OH2O
H2O
H2O
H2O
H2O
H2O
H2O
H2O
H2OH2O
H2O
Cell membrane Cell membrane
Water channel
+
+
2
H2O H2OH2O
H2O
H2O
H2O
H2O
H2O
H2O
H2O
H2OH2O
H2O
H222O22
H222H
H
H
H2
H
H222
++++
++++O
O22
O
22O22
222O22
H222O22
H222
O
++++
H 2O H
2 OH2OH2O
H2 O
H2 O
H2 O
H 2O
H 2O
H2O
H2O
H2OH2O
H2O
Figure 4 Aquaporin water channel facilitating passive
transport of water.
Biological Membranes and Biomimetic Artificial Membranes 5

of water and, in some cases, other small solutes,such as glycerol. However, selectivity is a centralproperty of such water pores, which are comple-tely impermeable to charged species, such ashydronium ions, H3Oþ, which are stopped onthe way and rejected because of their positivecharges. This is critical for the conservation ofmembrane’s electrochemical potential.
Cells cannot rely solely on passive movement ofsubstances across their membranes. In manyinstances, it is necessary to move substances againsttheir electrical or chemical gradient to maintain theappropriate concentrations inside of the cell or orga-nelle. Moving substances against their gradientrequires energy, because they are being movedaway from equilibrium. Cells use two differenttypes of active transport, which directly or indirectlyrequire chemical energy, such as from ATP, 5, tomove substances in this way.
When the third phosphate group of ATP isremoved by hydrolysis, a substantial amount of free
energy is released (�7.3 kcal mol). The same can be
said for the hydrolysis of the second phosphate of
ADP. Actually, these weak bonds, with low bond
energies, are able to release high amount of energy.If the process uses directly ATP, it is termed
primary active transport. If the transport also
involves the use of an electrochemical gradient, it is
termed secondary active transport. Both types of
active transport require integral membrane proteins.In the primary active transport, the molecule or
ions binds to the carrier site; the binding promotes
ATP hydrolysis; this causes carrier conformation
change that moves molecule to the other side of the
membrane. The sodium–potassium pump is an
example of primary active transport, where energy
from hydrolysis of ATP is directly coupled to the
movement of a specific substance across a membrane
independent of any other species (Figure 5).Secondary active transport uses the downhill flow of
an ion to pump some other molecule or ion against its
gradient. The driving ion is usually sodium (Naþ) with
its gradient established by the Naþ/Kþ ATPase [4].Sometimes, substances are cotransported in the
same direction (symport). Example of this active
indirect transport is the Naþ/glucose pump. The
Naþ/glucose transporter is the transmembrane pro-
tein that allows sodium ions and glucose to enter the
cell together. The sodium ions flow down their con-
centration gradient while the glucose molecules are
pumped up theirs. Later, the sodium is pumped back
out of the cell by the Naþ/Kþ ATPase.When one substance is transported in one direc-
tion at the same time as another substance is being
transported in the other direction (countertransport),
the transport is called antiport.Cells must occasionally move very large particles,
such as food particles or volumes of water, across
their membranes. Cells do this by processes called
endocytosis and exocytosis (bulk transport), where
the substance to be transported is surrounded by an
infolding of the cell membrane (Figure 6).Specific proteins embedded in the cell membrane
can act as molecular signals that allow cells to com-
municate with each other. Protein receptors are
found ubiquitously and function to receive signals
C C
C
O
C
OHOH
HH
H
CH2
H
N
HCN
C
CC
NCH
N
NH2
OPOPOPHO
O
OH
O
OH
O
OH
3' 2'
4' 1'
5'
5
Higher
LowerHigher
Lower
Sod
ium
con
cent
ratio
n gr
adie
nt
Potassium
concentration gradient
ATPADP+Pi
Cytosol
Activetransportchannel
Outsideof the celll
Na+
Na+Na+
K+
K+
Na+
Na+Na+
Figure 5 Scheme sodium–potassium pump, an example
of active primary transport.
6 Role and Function of Biological and Artificial Membranes

from both the environment and other cells. Thesesignals are transduced and passed in a different formin the cell. For example, a hormone binding to areceptor may open an ion channel in the receptorand allow calcium ions to flow into the cell. Otherproteins on the surface of the cell membrane serve asmarkers that identify a cell to other cells. The inter-action of these markers with their respectivereceptors forms the basis of cell–cell interaction inthe immune system.
The cell membrane also plays a role in anchoringthe cytoskeleton to provide shape to the cell and inattaching to the extracellular matrix to help groupcells together in the formation of tissues.
The cytoskeleton underlying the cell membranein the cytoplasm provides a scaffolding for membraneproteins to anchor to, besides forming organellesthat extend from the cell. Indeed, cytoskeletalelements interact extensively and intimatelywith the cell membrane. Anchoring proteins restrictsthem to a particular cell surface – for example, theapical surface of epithelial cells that line the verte-brate gut – and limits how far they may diffuse withinthe bilayer. The cytoskeleton is able to form appen-dage-like organelles, such as cilia, which aremicrotubule-based extensions covered by the cellmembrane, and filopodia, which are actin-basedextensions. These extensions are unsheathed in themembrane and project from the surface of the cell inorder to sense the external environment and/or makecontact with the substrate or other cells. The apicalsurfaces of epithelial cells are dense with actin-basedfinger-like projections known as microvilli, whichincrease cell surface area and thereby increase therate of absorption of nutrients.
1.01.2.1 Examples of In Vivo SystemsCompartimentalization
Living cells are divided into several compartments bya membrane unit. Each compartment has a specificstructure and function and the interactions between
compartments are regulated by specific signals. Oneimportant example of compartimentalization regu-lated by stimuli-responsive action is the defenseagainst pathogens in plants.
The defense mechanism of plants is different incomparison to animals due to the fact that plants aresessile organisms that cannot flee their predators.
Through the course of evolution, plants havebecome nature’s organic chemists par excellence,and collectively synthesize a plethora of secondarymetabolites to defend themselves against herbivoresand microorganisms and adapt to different types ofabiotic environmental stresses.
The compounds used for defense are divided intotwo main categories: phytoanticipins and phytoalex-ins. Phytoanticipins are preformed substances andrepresent the first barrier to pathogens, while phytoa-lexins are synthesized in response to pathogen attack.
Many compounds used in plant defense are storedin a nonactive glucosylated form to chemically sta-bilize and increase the solubility of the defensecompound, to render it suitable for storage in thevacuole, and to protect the plant from the toxiceffects of its own defense system [5].
Upon cell disruption, caused, for example, by achewing insect, the defense compounds are bioacti-vated via hydrolysis of the glucosidic linkagecatalyzed by �-glucosidases. In intact plant tissue,the �-glucosidases are stored separately from thesubstrates (Figure 7).
This two-component system, of which each of theindividual components is chemically inert, providesplants with an immediate chemical defense againstattacking herbivores and pathogens. The catalyticmechanism of �-glucosidase is illustrated inFigure 8.
Two conserved glutamic acid residues serve as acatalytic nucleophile and a general acid/base cata-lyst, respectively. In retaining �-glucosidases, thecatalytic glutamic acid residues are situated onopposite sides of the �-glucosidic bond of thedocked substrate at a distance of 5.5 A [6]. As theinitial step in catalysis, the nucleophile performs anucleophilic attack at the anomeric carbon, whichresults in the formation of a glucose–enzyme inter-mediate. In this process, aglicone departure isfacilitated by protonation of the glucosidic oxygenby the acid catalyst. During the second catalytic step(deglucosylation), a water molecule is activated bythe catalytic base to serve as a nucleophile forhydrolysis of the glucosidic bond and release ofthe glucose. Under suitable conditions, �-
(a) (b)
Figure 6 Bulk transport: (a) endocytosis; (b) exocytosis.
Biological Membranes and Biomimetic Artificial Membranes 7

glucosidases can perform a transglucosylation inwhich the covalently bound glucose in theenzyme–glucose intermediate is transferred to analcohol or a second sugar group. The biologicalactivity of the defense compounds is attributed totheir hydrolysis products, and therefore separationof glucosides and �-glucosidases into different(sub)cellular compartments in intact tissue is a criticalfeature of the two-component defense systems. Asillustrated in Figure 7, the glucosides are stored inthe vacuole [7] while the subcellular localization ofthe generally abundantly expressed �-glucosidasesdiffers in monocotyledonous and eudicotyledenousplants. In some plants, the substrate and the bio-activator are additionally separated at the cellular level.
The separate compartmentalization provides theplant with a two-component defense system, inwhich each separate component is chemically inert.Upon tissue disruption, the glucosides come intocontact with the degrading �-glucosidases resultingin an immediate release of toxic defense compounds.Often, the highest amount of the two components isfound in seedlings and young plant parts in order toprotect the plant from herbivore and pathogen attackat this fragile stage.
1.01.2.2 In Vitro Membrane Processes thatSimulate In Vivo Systems
The ambition to mimic efficiency of biological
membranes and create membrane-based separation
and production systems/devices is among the
visions and challenges of current technological
development. In the development of biomimetic
separation/transformation/sensor technology, indi-
vidual elements, such as channels (ion and water
channels), carriers (transporters), and so on and
overall complex organization/function system are
important aspects to be considered. The first aspect
gives information on the individual blocks that con-
tribute to the creation of high permselectivity. The
second aspect provides information on how they are
integrated in the whole system to achieve and main-
tain the given properties.Generally, each class of transport proteins pro-
motes the passage of specific molecular species in
and out of the cell while preventing the passage of
other components, a property critical for the overall
conservation of the cell’s internal physical-chemical
environment and composition. As previously men-
tioned, aquaporin water channels are highly efficient
OHOHO
OH
OH
OR1
H
AR2
B−
R3
OHOHO
OH
OH
A-R2
B
R3
OHOHO
OH
OH B
R3
OH
H
A-R2
OHOHO
OH
OH B-
R3
AR2
H
OH
Figure 8 Schematic representation of catalytic action of �-glucosidase. From Morant, A.V. , Jørgensen, K., Jørgensen, C.,
et al. Phytochemistry 2008, 69, 1795–1813.
β-Glucosidaseβ-Glucosides
Apoplast
Chloroplast
Vacuole
Eucotyledon
Figure 7 Schematic representation of the different compartmentalization of �-glucosidase and �-glucosides. From Morant,
A.V., Jørgensen, K., Jørgensen, C., et al. Phytochemistry 2008, 69, 1795–1813.
8 Role and Function of Biological and Artificial Membranes

membrane pore proteins capable of transporting watermolecules at very high rates, up to 109 molecules persecond, while preventing hydronium ion passage.Carrier proteins generally have a lower turnover butare capable of transport against gradients by using thechemical energy of ATP. For both classes of proteins,their unique permeability and selective propertiesmake them interesting as candidates in biomimeticmembrane separation design and development. Anideal separation device requires use of such compo-nent properties and transport to be promoted onlythrough them, while the supporting matrix must bevirtually impermeable to anything but the solute inquestion. In practice, however, a biomimetic supportmatrix will generally have permeabilities to water,electrolytes, and nonelectrolytes. Therefore, the effi-ciency of a biomimetic system may depend on therelative contribution to the transport from biologicalcomponents and artificial support. Further, the stabi-lity of the incorporated biological components must beaddressed in order to achieve a sufficient lifetime andmake it feasible for productive application.
A new generation of biomimetic membranes forwater treatment and drug delivery was reported in2007 by researchers at Illinois University [8]. Thehighly permeable and selective membranes are basedon the incorporation of the functional water channelprotein Aquaporin Z into a novel A–B–A triblockcopolymer. The experimental membranes, in theform of vesicles, showed significantly higher watertransport than common reverse-osmosis membranesused in water purification and desalination.
Aquaporin’s biomimetic membrane with embeddedaquaporins have been also reported in References 9–11.The system supported pressures up to 10 bar andallowed a water flux >100 l m�3 h�1. Therefore, thedevelopment of the Aquaporin membrane� is closely
linked to the simultaneous development of suitableporous support materials. The biomimetic membranehas been produced on a scale of few square centimetersand investigations to scale it up to square meters arecurrently in progress. The microfabrication methodbased on CO2-laser ablation to generate support mem-branes with homogeneous apertures ranging from 300down to 84mm in diameter has been used. They arearranged in arrays with the densest packaging having aperforation level of up to 60%. The apertures aresurrounded by a smooth bulge that is formed bymelted material ejected from the aperture duringlaser ablation. Polydimethylsiloxane (PDMS) replicaswere used to visualize and analyze these bulges.
Biocatalytic membranes containing enzyme immo-bilized in polymeric membranes represent anotherexample of biomimetic membrane systems. Referringto the �-glucosidase/oleuropein system previouslydiscussed, where the enzyme is compartmentalizedin the wall and the oleuropein in the vacuole, a similarstructure has been constructed by immobilizing theenzyme in a polymeric porous asymmetric membraneand feeding the substrate oleuropein by convectiveflow. The enzyme was anchored to the membranewhile the oleuropein was converted while passingthrough it. The immobilized �-glucosidase enzymemaintained very high stability and selectivity, thanksto the protection offered by the polymeric membranesupport. Immunochemical analyses showed the distri-bution of the enzyme within the membrane (Figure 9)[12]. The compartmentalization of �-glucosidase witholeuropein can be used for the production of bioactivemolecules; in addition, it can be used as a model forbioactive packaging formulation. The combination ofother membrane concepts, such as membrane emulsi-fication, offers innovative possibilities in thepreparation of functionalized microstructures able to
Figure 9 Black spot indicating the visualization in situ of immobilized protein.
Biological Membranes and Biomimetic Artificial Membranes 9

compartmentalize bioactive molecules mimicking bio-
logical systems.Enzyme immobilization in polymeric and inor-
ganic membranes for the development of bioreactors
is a well-developed strategy (for further information,
see Chapter 3.08). [13, 14]Biomimetic membrane properties are also devel-
oped in tissue engineering and regenerative medicine
applications (for further information, see Chapter 3.10)
[15, 16]. In this area, polymeric membranes are used as
support for cell adhesion and at the same time as
selective barrier to transport molecules in (metabolites)
and out (catabolites) of the compartmentalized
biohybrid system. The membrane may serve as a
lung (to supply oxygen to cultured cells), as a
glomerulus, as a vein, as skin, etc.Biomimetic structures are attracting enormous
interest. Bottom-up techniques, such as self-
assembling [17] and layer by layer (LbL) [14], in
addition to top-down techniques are assumed to
play a key role in the development of controlled
biomimicking artificial structures.
References
[1] Singer, S. J., Nicolson, G. L. Science 1972, 175 (23),720–731 (doi:10.1126/science.175.4023.720).
[2] Alberts, B., Johnson, A., Lewis, J., et al. Molecular Biologyof the Cell, 4th edn.; Garland Science: New York, 2002(ISBN 0-8153-3218-1).
[3] Gray, J., Groeschler, S., Le, T., Gonzalez, Z. MembraneStructure (SWF); Davidson College, 2002.
[4] Lodish, H., Berk, A., Zipursky, L. S., Matsudaira, P.,Baltimore, D., Darnell, J. Molecular Cell Biology, 4th edn.;Scientific American Books: New York, 2004 (ISBN0716731363).
[5] Jones, P., Vogt, T. Planta 2001, 213, 164–174.[6] Davies, G., Henrissat, B. Structure 1995, 3, 853–859.[7] Gruhnert, C., Biehl, B., Selmar, D. Planta 1994, 195,
36–42.[8] Kumar, M., Grzelakowski, M., Zilles, J., Clark, M., Meier, W.
Proc. Natl. Acad. Sci. U.S.A. 2007, 104, 201119–220424.[9] Nielsen, C. H. J. Anal. Bioanal. Chem. 2009, 395,
697–718.[10] Vogel, J., Perry, M., Hansen, J. S., Bolinger, P.-Y.,
Nielsen, C. H., Geschke, O. J. Micromech. Microeng.2009, 19, 025026 (6pp) (doi: 10.1088/0960-1317/19/2/025026).
[11] Hansen, J. S., et al. J. Micromech. Microeng. 2009,19, 025014 (11pp) (doi: 10.1088/0960-1317/19/2/025014).
[12] Mazzei, R., Giorno, L., Mazzuca, S., Drioli, E. J. Membr.Sci. 2009, 339, 215–223.
[13] Giorno, L., Drioli, E. Trends Biotechnol. 2000, 18,339–348.
[14] Smuleac, V., Butterfield, D., Bhattacharyya, A. D.Langmuir 2006, 22, 10118–10124.
[15] Drioli, E., De Bartolo, L. Artif. Organs 2006, 30,793–802.
[16] Stamatialis, D. F., Papenburg, B. J., Girones, M., et al. J.Membr. Sci. 2008, 308, 1–34.
[17] Barboiu, M., Cazacu, A., Michau, M., Caraballo, R., Arnal-Herault, C., Pasc-Banu, A. Chem. Eng. Process.: ProcessIntensificat. 2008, 47, 1044–1052.
10 Role and Function of Biological and Artificial Membranes

Biographical Sketches
Lidietta Giorno is a membrane biotechnologist with background in biological science, chemical technologies,
and new materials. Her research experiences include membrane bioengineering, biocatalytic membrane
reactors, integrated membrane systems for bioseparations and bioconversions, downstream processing based
on molecular separation, membrane chirotechnology, and membrane emulsifier. She has been involved in
membrane science and engineering research and development for almost 20 years.She is a director of the Institute on Membrane Technology of the National Research Council of Italy, ITM-
CNR and is involved in research cooperations at European and international level. She worked abroad in the
USA at Sepracor Inc. (1992); in The Netherlands at ATO-DLO (1994); and in France, at The University of
Compiegne (1997 and 2000). She is a visiting professor at Tianjin University of Science and Technology,
China, since 2008.Lidietta Giorno is a co-author of three books and some 70 peer reviewed scientific papers in international
journals. She is an editorial board member of scientific journals, a member of the referee pool of scientific
journals and research agencies, and a member of international committees and several scientific societies.She has served on the European Membrane Society Council for two mandates and is currently the president
of the EMS Council and editor of the EMS Membrane Newsletter.
Rosalinda Mazzei is a researcher contractor at the Institute on Membrane Technology, ITM-CNR, Italy. She
works in ITM-CNR since 2003. Her research experiences include membrane bioengineering, biocatalytic
membrane reactors, membrane bioseparation and bioconversion and membrane emulsification.
Biological Membranes and Biomimetic Artificial Membranes 11

Professor Enrico Drioli has been working in Membrane Science and Membrane Engineering for many yearseven when a student in chemistry at the University of Naples. He is a full professor at the Department ofChemical Engineering and Materials at the University of Calabria where he founded, in 1993, the Institute ofMembrane Technology of the Italian Research Council. He served there as a director until December 2008. Healso served as dean of the School of Engineering of the University of Calabria during the years 1982-85
He received various award and honors: Doctorate Honoris Causa from University of Paul Sabatier ofToulouse (France) (8 July 2009); International Cooperation Honor Award on September 2005 given by theMembrane Industry Association of China (MIAC) for his special dedication to the International Cooperationbetween China and Europe in the field of membrane and science technology; guest professor in theEnvironment and Safety Engineering Department at the Jiangsu Polytechnic University, China (since June2005); Honorary Member of the A. V. Topchiev Institute of Petrochemical Synthesis at the Russian Academy ofSciences, Moscow (since 1999); Doctorate Honoris Causa in Chemistry and Chemical Technology fromRussian Academy of Science (February 1992); Honorary Professor at the China Northwest University inXi’an, Shaanxi, People’s Republic of China (September 1991); President of the European Society of MembraneScience and Technology (known today as the European Membrane Society) (1982–98); Honorary President ofthe European Membrane Society (since 1999); Member of the International Scientific Advisory Committee ofthe Grand Water Research Institute at Technion – Israel Institute of Technology, Israel (since 2004); Memberand Moderator of the Research Advisory Council of the Middle East Desalination Research Center Oman,Muscat (since May 1997); Member of the International Advisory Board of the State Key Laboratory ofCatalysis, Dalian Institute of Chemical Physics, Chinese Academy of Sciences (since 2007); Founding memberof the European Federation on Regenerative Medicine (since 2006); Expert in the panels of the OECD project‘Nanotechnology and clean water’ (www.oecd.org/sti/nano).
His scientific activity has been mainly in: Membrane Science and Engineering; Membranes in ArtificialOrgans; Integrated Membrane Processes; Membrane Preparation and Transport Phenomena in Membranes;Membrane Distillation and Membrane Contactors; and Catalytic Membrane and Catalytic MembraneReactors.
He is the author of more than 530 scientific papers, and 10 scientific books and holds 18 patents in the field ofMembrane Science and Technology.
Drioli is the Member of the Advisory Boards of: Journal of Membrane Science - Elsevier, and Polish Journal of
Chemical Technology. In addition, he is the member of the International Advisory Board of Journal of Water Supply:
Research and Technology – AQUA. He is also the senior advisor to Chinese Journal of Membrane Science and
Technology (China), and Technology of Water Treatment Journal.
Drioli is the member of the editorial boards for Chemical Engineering and Processing Elsevier: Desalination –Elsevier; Chemical Engineering and Technology Journal – Wiley-VCH; Industrial & Engineering Chemistry Research
(from January 2002 to 2006) – American Chemical Society; Separation Science and Technology – M. Dekker; Clean
Technologies and Environmental Policy – Springer-Verlag; Water Treatment – China Ocean Press (China); Russian
Journal of Physical Chemistry – MAIK Nauka, Interperiodica Publ. (Russia); and Journal of Separation and
Purification Technology – Childwall University Press (China).
12 Role and Function of Biological and Artificial Membranes

1.02 Functionalized Membranes for Sorption, Separation,and Reaction: An OverviewA R Ladhe, J Xu, A M Hollman, V Smuleac, and D Bhattacharyya, University of Kentucky, Lexington,KY, USA
ª 2010 Elsevier B.V. All rights reserved.
1.02.1 Introduction 13
1.02.2 Preparation of Functionalized Membranes 13
1.02.3 Classification of Functionalized Membrane Applications 14
1.02.4 Functionalized Membranes for Material Capture Applications 15
1.02.4.1 Poly(Acrylic Acid) Functionalized Membrane for Ethoxylated Nonionic Surfactant
Capture 15
1.02.4.2 Functionalized Membrane for Silver Capture 17
1.02.4.2.1 Modeling of silver ion transport through the functionalized membrane 18
1.02.5 Functionalized Membranes for Separations 19
1.02.5.1 Single-Layer Polyelectrolyte Functionalized Membranes for Ionic Solute Rejections 20
1.02.5.2 Multilayer Polyelectrolyte Functionalized Membranes Using LbL Assembly in Pores 22
1.02.6 Functionalized Membranes for Catalytic Applications 23
1.02.6.1 Membrane-Immobilized Nanoparticles for Chloro-Organic Dechlorination 23
References 25
1.02.1 Introduction
The development of new-generation materials thatextend the industrial applications of membrane pro-
cesses will require a high level of control of both thecharacteristics of the base polymeric or inorganic
support layer as well as its corresponding surface
properties. Current research in membrane science isnow focusing more on the modification of surface
physical along with chemical properties to developnew membrane materials called functionalized mem-
branes [1–3]. In addition to the size-based separations
by conventional membrane processes, the functiona-lized membranes allow separations based on other
driving forces like charge [4] and physical/chemicalinteractions [5, 6]. Functionalized membranes with
appropriate functional groups can provide applica-
tions ranging from tunable water permeation andseparations [4], toxic metal capture [7], toxic organic
dechlorination [8–12], biocatalysis [13], and others(Figure 1).
The functionalized membranes also provideopportunities for process integration by achieving
separation and reaction in single step [14]. Stimuli-responsive membranes have been developed by func-
tionalization with materials which are sensitive to the
surrounding environment. Such membranes are use-ful for developing biomimetic devices and controlleddrug release applications. Membranes functionalizedwith polyelectrolytes are capable of charge-based ionseparations or toxic metal capture. These micropor-ous membranes allow nanofiltration (NF)-typeseparation at permeabilities much higher than con-ventional membranes [15, 16]. The chapter discussesvarious methods of preparation of functionalizedmembranes and their applications with reference toselected examples.
1.02.2 Preparation of FunctionalizedMembranes
The most common approach for the preparation offunctionalized membranes is by surface modificationof the existing membranes with desired functionalgroups. The desired functional groups can be intro-duced through either covalent or noncovalentattachment mechanism. Some of the commonlyapplied techniques for membrane functionalizationinclude surface chemistry [1], polymer deposition[11, 17] alternate adsorption of oppositely chargedpolyelectrolytes [18–21], plasma or radiation
13

induced grafting [22, 23], gold–thiol chemistry,
[24–26] etc. The polymer deposition inside mem-
brane pores can be achieved either by cross-linking
the desired macromolecules or by in situ polymeriza-
tion of corresponding monomers with simultaneous
cross-linking. Surface chemistry allows covalent
attachment of the desired molecules on the mem-
brane surface. Polymer membrane supports, such as
cellulose, cellulose acetate, alumina, polysulfone,
and poly(vinylidine fluoride) (PVDF), can easily
be functionalized through the surface activation of
pores. Gold–thiol chemistry is studied for well-
defined, polycarbonate track-etched (PCTE) mem-
branes (after gold coating) for fundamental studies
and precise quantification of membrane
performance.Another approach to introduce the functionalities
in membranes is by preparation of hybrid or mixed
matrix membranes [27–30]. Mixed matrix mem-
branes consist of a continuous polymeric phase and
a dispersed inorganic phase. In such membranes, the
dispersed inorganic phase has the desired functional
groups. Generally, the inorganic phase can be incor-
porated within polymer matrix during membrane
preparation. Using silica as the dispersed phase in
the membrane matrix allows the introduction of
novel functionalities through the well-known silani-
zation pathways. In this chapter, representative
applications of the functionalized membranes
prepared using some of the above mentioned techni-ques are described.
1.02.3 Classification ofFunctionalized MembraneApplications
Based on the role of membranes, the applications ofthe functionalized membranes can be classified intothree different categories. The first category is theuse of the functionalized membranes (includinglayer-by-layer (LbL) assembly) for separations,where the modified membranes allow selective per-meation of one of the species and can be used incontinuous mode.
The second category is the application of thefunctionalized membranes for sorption processeswhere the modified membranes act as adsorbents. Ina way this also leads to separation and capture. Aregeneration step is required in order to reuse themembranes. The third category is the use of functio-nalized membranes for catalytic applications wherethe functional groups, enzymes, or immobilizednanoparticles act as catalysts, and convert the reac-tants into products as they pass through themembrane pore. Some examples of each categoryare discussed with emphasis on membrane prepara-tion and membrane performance.
Functionalization
NF-type separation
Metal ions capture
Immobilizedmetal affinity
chromatography
Enzyme immobilization
Bioreaction
Catalysis (SO3H for esterification reaction)
Protein recovery/purification
Metal nanoparticles
Heavy metal removal
Protein recovery/purification
Catalysis
Functional groups: –OH,–NH2, –COOH, –SO3H, etc.
CO2, H2S removal (–NH2, –RNH)
Membrane pore
• High surface area• High reactivity due to the atomic defects
reduction
Figure 1 Applications of functionalized membranes.
14 Role and Function of Biological and Artificial Membranes

1.02.4 Functionalized Membranesfor Material Capture Applications
Membranes functionalized with polyfunctionalmolecules exhibit very high capture capacities.Ladhe et al. [17] studied poly(acrylic acid) functiona-lized membranes for nonionic surfactant capturewhich is important toward reuse solvents used insurfactant-based cleaning operations. Functionalizedmembranes with pore size 200–400 nm have alsobeen studied as adsorbents in the area of toxic metalcapture. It was demonstrated that membranes func-tionalized with covalently attached poly-L-glutamicacid (PLGA) [31] or polycysteine [32] show sorptionof heavy metal ions with high capacity. Figure 2shows a schematic of a membrane functionalizedwith polyfunctional molecules.
The Pb capture with PLGA functionalized mem-brane was 23-fold higher than that with equimolarquantity of glutamic acid. With polyligand functio-nalized membranes, one can obtain metal sorptioncapacities as high as 1.2 g metal/g sorbent. Ritchieand Bhattacharyya [33] demonstrated up to 70%removal of chromium (Cr) from a stream containingmultiple metal ions using two-stage PLGA functio-nalized membranes. Mixed matrix membranesprovide another approach to obtain membrane-based sorbents. The inorganic dispersed phase likesilica can be activated with desired functional groups
with subsequent incorporation into membranematrix. In the following part of this section, applica-
tions of functionalized membranes for nonionic
surfactant capture and silver ion capture arediscussed.
1.02.4.1 Poly(Acrylic Acid) FunctionalizedMembrane for Ethoxylated NonionicSurfactant Capture
Ethoxylated nonionic surfactants are used in many
industrial applications such as food processing, deter-gency, emulsifications, etc. Many of these
applications involve the use of nonaqueous solvents,and a typical waste stream contains ethoxylated non-
ionic surfactants [17] dissolved in hydrophobic
solvents along with other particulates. The separa-tion of the surfactants is an important step for recycle
and reuse of the solvents. In the light of this motiva-tion, a poly(acrylic acid) (PAA) functionalized
membrane process was developed for the capture ofethoxylated nonionic surfactants from a siloxane-
based solvent (Decamethylcyclopentasiloxane or
D5). Nontoxic D5 solvent is being increasingly usedin surfactant-based cleaning operations.
PAA forms a complex with the ethoxylated non-ionic surfactants through hydrogen bonding betweencarboxyl group of the PAA and ethylene oxide group
Convective flow
SH
SH
SH
SH
SH
SH
SH
SH
SH
SH
NH3+
NH3+
NH3+
NH3+
NH3+
NH3+ NH3
+
NH3+
NH3+
NH3+
NH3+
NH3+
NH3+
NH3+
NH3+
NH3+ NH3
+
NH3+
NH3+
NH3+
SH
SH
SH
SH
SH
SH
SH
SH
SH
SH
(a)
(b)
(c)
COO–
COOH
COO–COOH COO–
COO– COO–
COOH
COOH
COO–COOH COO–
COO– COO–
Figure 2 Schematic of membrane pore functionalized with polyfunctional molecules such as (a) COO� (poly(glutamic acid)),
(b) NH3þ (polylysine), and (c) SH (polycysteine). From Ritchie, S. M. C., Kissick, K. E., Bachas, L. G., Sikdar, S. K., Parikh, C.,
Bhattacharyya, D. Environ. Sci. Technol. 2001, 35, 3252–3258.
Functionalized Membranes for Sorption, Separation, and Reaction: An Overview 15

of the surfactant (Figure 3). This interaction is well
studied in the aqueous environment [34–36].The commercially available hydrophilized PVDF
membrane (nominal pore size 650 nm, membrane
thickness 125mm) was used for functionalization.
Aqueous solution of PAA (25 wt.%) containing ethy-
lene glycol (4.3 wt.%) as a cross-linking agent was
permeated through the membrane to coat the mem-
brane pore with PAA layer. The membrane was heated
in oven at 110 �C for 3 h to allow the cross-linking to
occur. Figure 4 shows the schematics of membrane
functionalization with PAA. The process is repeated
multiple times to increase the PAA loading in the
membrane. Extent of functionalization for a typical
membrane with three PAA coatings was 6 mg cm–2.The water permeance (A) of the membrane
decreased from 0.2 cm3 cm�2 s�1 bar�1 (bare mem-
brane) to 1� 10�4 cm3 cm�2 s�1 bar�1 (PAA
functionalized membrane). The permeance (A) can
be represented by Hagen–Poiseuille relation as
follows:
Aw ¼Jw
�P¼
"mr 2p
8�w�Lð1Þ
where Jw is the permeate flux, "m is the membraneporosity, rp is the pore radius, �w is the viscosity ofwater, � is the tortuosity of the membrane pores, and�P is the applied transmembrane pressure. Decreasein the permeance indicates decrease in the poreradius for the functionalized membrane due to func-tionalized PAA coating on the pore wall. Based onthe membrane permeance data (pH 4–6) and usingHagen–Poiseuille equation, the estimated hydrody-namic pore size was about 100 nm down from 650 nmbefore functionalization. The PAA functionalizedmembrane was then studied for capture of
Figure 3 Ethoxylated nonionic surfactants and their interaction with poly(acrylic acid) (PAA). Modified from Ladhe, A. R.,
Radomyselski, A., Bhattacharyya, D. Langmuir 2006, 22, 615–621.
Figure 4 Schematics of membrane functionalization with PAA.
16 Role and Function of Biological and Artificial Membranes
CH 2 CH Poly (acrylic acid)
EOEO EO
Hydrogenbonding
Ethoxylated nonionicsurfactant
COOH
CnH2n+1
n : Number of carbons in alkyl chain (hydrophobic contribution) m : Number of ethylene oxide (EO) groups (hydrophilic contribution)CnEm : General notation for ethoxylated surfactant with n carbon alkyl chain and m ethylene oxide group
O CH2 CH2 OHm
C C
H
H F
FPolyvinylidenefluoride
HO
C COOH C
COOHCOOHC
O
O
O
O
O
O
C
C
O
O
COOH
O O
COO
+CH2 CH2
OHCH2 CH2 **
COOHEthylene glycolPAA
110 °C 3 h
Poly(vinylidene fluoride) membraneNominal pore size: 650 nmMembrane thickness : 125 μm
110 °C, 3 h
PAA functionalized membrane
* *
Repeat the procedure to improvePAA loading in the membrane

ethoxylated nonionic surfactants from their solutionsin D5 and the results are shown in Figure 5.
The figure shows surfactant capture data for sur-factants with varying ethylene oxide content (three,five, and eight ethylene oxide (EO) groups per sur-factant molecule with a 12-carbon alkyl chain). It wasobserved that the membrane capture capacityincreases exponentially with increasing ethyleneoxide content of the surfactants (Figure 4). Thiswas expected as the ethylene oxide groups contribute
toward the PAA–surfactant interaction. The PAA–surfactant complex is sensitive to the pH of thesurrounding environment and can be easily brokenat alkaline conditions. Utilizing this fact, slightlyalkaline water was permeated through the membranecontaining captured surfactant, and approximately70% of the captured surfactant was recovered andmembrane is regenerated. The regenerated mem-brane was successfully applied for the surfactantcapture process.
1.02.4.2 Functionalized Membrane forSilver Capture
Functionalized membranes containing thiol groupscan selectively interact with metal ions such assilver and mercury which is important consideringthe high market value of silver ion and toxic natureof mercury. Ladhe et al. [37] studied thiol functio-nalized silica–polymer composite membrane forsilver capture. Figure 6 shows the schematics forthe membrane preparation. Silica material (Huber874-85-1, 3–5 mm) was functionalized with 3-mercaptopropyltrimethoxy silane through silane
1
10
100
1000
0 1 2 3 4 5 6 7 8 9
Number of ethoxide groups persurfactant molecule
(g o
f sur
fact
ant c
aptu
red/
g of
PA
A)
× 1
03
Figure 5 Surfactant capture by PAA functionalized
membrane. From Ladhe, A. R., Radomyselski, A.,Bhattacharyya, D. Langmuir 2006, 22, 615–621.
+
CH
Silica (3–4 μm base particle size, BET surface area: 708 m2 g–1) + MPTMS + ethanolEvaporate ethanol with continuous stirring
100 °C
3 h
+
OHOH
OHOH
+ Si
CH3O
CH3O
CH3O
SH
Si SH
OCH3
OCH3
Si SH
OCH3
Thiol functionalized silica
MPTMSSilica
SHSH
SH
SH
SHSH
SH
Polysulfone
DMF
Membrane castingon glass plate
Solvent exchange in water bath
Thiol functionalized silica–polysulfonemixed matrix membrane
Silica dispersion and polysulfone dissolution in dimethyl formamide
O C
3
CH3
O S
O
O
Figure 6 Schematics for synthesis of thiol functionalized silica–polysulfone mixed matrix membrane.
Functionalized Membranes for Sorption, Separation, and Reaction: An Overview 17

chemistry. This introduced free surface thiol groups
(–SH) on the surface of the silica material. The thiol
functionalized silica was then dispersed in the solu-
tion of polysulfone in dimethyl formamide (DMF)
solvent. The mixture was then casted on a glass
plate and the glass plate was immediately immersed
into the water bath. The phase inversion process
takes place and the DMF solvent is replaced by
the water which occupies the pores of the mem-
brane surface. The final membrane has the
functionalized silica particles incorporated in the
polysulfone matrix.In order to determine the silver capture capacity
and kinetics, silver nitrate solutions were permeated
through the membrane and the permeate samples
were analyzed using atomic absorption (AA) spec-
troscopy. Figure 7 shows the silver capture data for
varying membrane flux using the thiol functiona-
lized composite membranes. The dotted line
indicates maximum silver capture capacity of the
silica material. It can be observed that with increas-
ing membrane flux, rate of silver capture increased.
This indicates that the thiol–silver interaction is
very fast and the capture process is mass transport
controlled under the experimental conditions.
When exposed to equimolar concentration of silver
and calcium, the membrane captured silver ions
selectively (1.5 mmol g–1 of silica) with negligible
calcium capture (<0.2 mmol g�1 of silica). This
indicates the selectivity of the membrane toward
silver capture. This is important toward practical
applications where the feed stream may have high
concentrations of Na and Ca ions.
1.02.4.2.1 Modeling of silver ion transport
through the functionalized membrane
The silver capture process using the mixed matrix
membrane was modeled using unsteady-state one-
dimensional model. As shown in Figure 8, the mem-
brane was assumed to be composed of three phases:
(1) active silica phase; (2) inert polymer phase; and
(3) aqueous silver solution phase occupying the free
volume fraction of the membrane.The mass balances over the liquid and solid phase
yield following equations:
�@C0
@t 0þ Jw
@C0
@z0þ ð1 –� –�pÞ
@q0
@t 0¼ 0 ð2Þ
@q0
@t 0¼ kðqeq – q0Þ ð3Þ
with initial conditions as follows:
C9ð0;t 9Þ ¼ C0
q9ðz;0Þ ¼ 0
C9ðz9;0Þ ¼ 0
where � is the free volume fraction; �p the polymervolume fraction; (1����p) the fractional volume ofsilica particles; C9 the concentration of Agþ in bulkliquid phase (moles of Agþ/m3 of liquid); q9 theconcentration of silver in silica phase (moles ofAgþ/m3 of silica particles); qeq the maximum con-centration of silver in silica phase for C9 (moles ofAgþ/m3 of silica particles); k the volumetric masstransfer coefficient; Jw the membrane flux (ms�1); t9
the time (s); and z9 the distance down the membranethickness (m).
0
0.5
1
1.5
2
2.5
0 100 200 300 400 500Time (min)
Ag
capt
ured
(m
mol
e g–
1 of
sili
ca)
Figure 7 Silver capture using thiol functionalized silica–
polysulfone mixed matrix membrane. Effect of membraneflux on silver capture capacity and rate of capture. Modified
from Ladhe, A. R., Frailie, P., Hua, D., Darsillo, M.,
Bhattacharyya, D. J. Membr. Sci. 2009, 326, 460–471.
z ′ = 0
z ′ = L
z ′ = z ′
Silver ionsolution
z ′ = z ′ + Δz ′
Functionalizedsilica phase
Inert polymerphase
Figure 8 Schematic representation of the silica–
polysulfone mixed matrix membrane for modeling purpose.Modified from Ladhe, A. R., Frailie, P., Hua, D., Darsillo, M.,
Bhattacharyya, D. J. Membr. Sci. 2009, 326, 460–471.
18 Role and Function of Biological and Artificial Membranes

In this case, the axial diffusion is neglected ascompared to axial convection. Assuming linear rela-
tionship between qeq and C9,
qeq ¼ �C0 ð4Þ
where � is the silver–thiol affinity constant.Equations (2)–(4) were solved using COMSOL.
The comparisons of the predicted data (dotted lines)
with the experimental data are shown in Figure 9.All the required parameters were obtained from
experimental values or correlations. Considering the
fact that no adjustable parameter was used, the rea-
sonable prediction of the experimental data
demonstrates applicability of the model under
varying operating conditions. The model is an effi-cient way to predict the effect of various parameterson the silver capture process. With appropriatechanges, the model can be applied for other processesthat involve mixed matrix membranes for liquid-phase applications including metal capture.
1.02.5 Functionalized Membranesfor Separations
Modification of membranes with immobilized func-tional polyelectrolytes has gained interest due to itspotential for development of high capacity ion-exchange materials [31, 38, 39] and tunable mem-brane separations [40–44]. Some of the commonlyused polyelectrolytes (polypeptides) for such appli-cations are shown in Figure 10. The macromoleculescan be incorporated within the membrane pore struc-ture by single-point covalent attachment through thereactive groups on the membrane surface [41].
Once functionalized, the presence of thesecharged macromolecules inside the pores leads tothe establishment of an electric potential field farremoved from the pore wall. This allows ion exclu-sions in the highly open geometries at highmembrane permeabilities as opposed to the low per-meabilities encountered in the conventionalnanofiltration applications. Thus, one can obtainNF-type separations at very low pressures. Externalstimulants such as pH, ionic strength, and surfactantscan cause change in the degree of ionization ofthe polyelectrolytes leading to the well-known
Time, t ′/60 (min)
Con
cent
ratio
n, C
(C
′/C
0)
Jw = 9.4E-6 m s–1 (k = 0.001 66 1/s)Jw = 3E-5 m s–1 (k = 0.002 84 1/s) R 2 = 0.75
R 2 = 0.91
R 2 = 0.91
0
0.2
0.4
0.6
0.8
1
1.2
0 100 200 300 400
Jw = 8.5E-6 m s–1
30% Silica Loadingk = 0.001 58 1/s
0
0.5
1
1.5
0 200 400
Figure 9 Comparison of the experimental and predicteddata for varying operating conditions. Dotted lines represent
predicted data. From Ladhe, A. R., Frailie, P., Hua, D., Darsillo,
M., Bhattacharyya, D. J. Membr. Sci. 2009, 326, 460–471.
CH2
CH2
CH2
NH2
NH
C
NH
Poly(L-glutamic acid)(PLGA)
+
(CH CH2)n
SO3 Na+
CH2
CH2
CH2
NH
CH2
Poly(L-arginine)(PLA)
Poly(L-lysine)(PLL)
Poly(styrene sulfonate) (PSS)
COOH
CH2
CH2
2
COOH
2
Poly(acrylic acid) (PAA)SH
CH2
Polycysteine
–
n[ NH CH CO ]
n[ NH CH CO ]
n[ NH CH CO ]
n[ NH CH CO ]
Figure 10 Commonly used polyelectrolytes to develop high-capacity ion-exchange membrane materials.
Functionalized Membranes for Sorption, Separation, and Reaction: An Overview 19

helix–coil transitions [42], thus facilitating tunableseparation applications. The helix–coil transitionphenomenon is schematically represented inFigure 11. At pH > 6 (for PLGA, pH < 4, 100%helix) conditions the repulsion between the adjacentionized groups of the polyelectrolyte leads toextended random coil conformation which decreasesmembrane permeability due to added flow resistance.The concept of single-layer polyelectrolyte immobi-lization can be easily extended to nonstoichiometricmultilayer immobilization (LbL assembly) [15],enhancing the density of the ionizable groups in themembrane phase. This section deals with separationcharacteristics of the membranes functionalized witheither single-layer or LbL assembly of chargedpolyelectrolytes.
1.02.5.1 Single-Layer PolyelectrolyteFunctionalized Membranes for Ionic SoluteRejections
Among the various polyelectrolytes used for mem-brane functionalization, poly(amino acid) are themost common as the amine group chemistry providesvarious options for functionalization. Poly(aminoacid) functionalized microporous membranes werestudied for the separation of dilute electrolytes suchas As(V), Cr(III), and Cr(VI) from aqueous solutions[41]. Arsenic and chromium fall under the categoryof toxic metals in water, and stringent governmentregulations on their concentrations demand separa-tion process designed for dilute systems. Arsenic andchromium are typically present in the form of
divalent oxyanions (HAsO42�, CrO4
2�, or Cr2O72�) in
water, and the charge-based membrane separation
process is desirable for the same.In order to achieve the covalent attachment of the
amine-terminated poly-amino acids, reactive groups
on the membrane pore surface are required. The
membrane supports can be derivatized to achieve
required reactive groups. For example, in the case
of cellulosic supports, ozone oxidation creates alde-
hyde groups on the surface. In the case of silica
membranes, the support can be silanized with epoxy-
terminated silanes to achieve highly reactive epoxy
groups on the silica surface. PCTE can be first gold-
coated [43] and then subjected to thiol-terminated
organic monolayer adsorption [24, 44] with subse-
quent oxidation to obtain surface aldehyde groups
[26]. Schematics of the derivatized membranes are
shown in Figure 12. Under appropriate pH condi-
tions, the nonprotonated terminal amine group of the
poly(amino acid) reacts with surface aldehyde/epoxy
groups to form the covalent linkage [41].Table 1 summarizes the solute rejection data for
these membranes. The rejection (R) is calculated by
following equation:
R ¼ 1 –Cp
Cf
� �� 100 ð5Þ
where Cp and Cf are concentrations of the solute inpermeate and feed solutions.
It is interesting to note that the neutral molecules(dextran and PEG) showed significantly lower rejec-
tions (1.5% and 30%, respectively) despite the bigger
size of their molecules (20 and 3.5 nm, respectively)
High pH(random coil)
Charged side-group constituent
Low pH(compact helix)
Coreregion
expands
Side view Top view
Figure 11 Schematics for helix–coil transition of a polyelectrolyte functionalized inside membrane pore. From Onda, M.,
Lvov, Y., Ariga, K., Kunitake, T. J. Ferment. Bioeng. 1996, 82, 502–506.
20 Role and Function of Biological and Artificial Membranes

as compared to the hydrated anions SO42 – and
CrO42 – (0.4 nm) which showed rejections higher
than 80%. It is clear that the observed solute rejec-
tions are not based on physical or steric interactions
but it is a result of charged domain (Donnan exclu-
sion) influencing the transport of the ionic species.The transport of ionic species through the chargedmedia is generally described by the extended
Nernst–Planck (N–P) equation
Jx;i ¼ –DidCi
dxþ vmCi –
DiziCiF
RT
d�
dxð6Þ
where Jx,i is the flux of the ionic solute i in x-direc-tion, Di the diffusivity of the ionic solute, Ci the ionconcentration, vm the velocity across the membrane,zi the ion valency, F the Faraday constant, R the gasconstant, T the temperature, and � the net electro-static potential inside the membrane pore. The first,the middle, and the last term of the equation accounts
O
Partially oxidized (aldehyde-rich) cellulose (pH > 9)
O O
O
O
O
O
Amine terminus
Silica composite membrane (followingsilane derivatization) (pH > 9)
P-AANH2
..
P-AANH2
..
P-AANH2
..
P-AANH2
..
O
O
P-AA Silicaparticles
..H2N
P-AA..
H2N
O
O
Epoxide
O
Gold-coated polycarbonate membrane(modified using gold–thiol chemistry (pH > 9.2)
3-mercapto-1,2-propanediol adsorption
and subsequentoxidation with NaIO4
S CHO Amine terminatepoly(amino acid)
Membrane matrix
CH2
S CHOCH2
S CHOCH2
S CHOCH2
(a)
(c)
(b)
Figure 12 Schematics for single-point covalent attachment of amine-terminated PAA on; (a) cellulose membranes; (b)silica–polyethylene composite (Daramic, Inc) membranes; and (c) gold-coated polycarbonate membrane.
Table 1 Solute rejection for various polyelectrolyte functionalized membranes
Membrane type Solute studied
Size of the hydratedion/molecule(nm)
Observed rejectionR¼ (1�Cp/Cf )�100 (%)
PLGA-silicaa
(n¼ 356, dp¼96 nm)
Na2SO4 0.4 88.6
Na2HAsO4, i.e., (As(V)) 88.7
Na2CrO4, i.e., (Cr(VI)) 0.4 80.0Dextran (neutral) 20 1.5
PLL-cellulosea
(n¼ 461, dp¼100–200 nm)
CaCl2 97 (Ca2þ rejection)
PLGA-PCTEb
(n¼ 116, dp¼30 nm)Polyethylene glycol 3.5 30Na2SO4 0.4 89
a Modified from Hollman, A. M., Scherrer, N. T., Cammers-Goodwin, A., Bhattacharyya, D. J. Membr. Sci. 2004, 239, 65–79.b Modified from Smuleac, V., Butterfield, D. A., Bhattacharyya, D. Chem. Mater. 2004, 16, 2762–2771.n, Number of repeat units in the polyelectrolyte; dp, pore diameter of the unmodified membrane.
Functionalized Membranes for Sorption, Separation, and Reaction: An Overview 21

for diffusional, convective, and electrostatic transportof the ionic solute, respectively.
The ionic rejections by traditional RO and NFmembranes increase with applied transmembranepressure. However for the functionalized micropor-ous membranes, R may decrease at higher permeateflux values owing to the core leakage through themembrane pores. This could be advantageous forselective separations (e.g., Na2SO4 from NaCl).
1.02.5.2 Multilayer PolyelectrolyteFunctionalized Membranes Using LbLAssembly in Pores
LbL assembly offers an easy and inexpensive way tocreate functionalized membranes with multilayers(using nonstoichiometric amounts) of charged poly-electrolytes. It was first suggested by Iler [21] andestablished by Decher and coworkers [19, 20]. Anexcellent review from Ariga et al. [18] summarizesvarious physicochemical fundamentals and possibili-ties for practical applications of the LbL assembly.
Functionalization of the membranes using LbLtechnique allows flexibility in terms of number layersand the layering sequence. A typical schematic ofmembrane functionalization using LbL technique isshown in Figure 13. Depending on the desired appli-cations of the LbL modified membranes, themultilayers can be deposited either on the membranesurface [45–47] or inside the membrane pores byusing convective flow [15]. By varying the deposition
conditions such as pH and supporting electrolyte
concentration, the adsorbed layer properties can be
optimized.Liu and Bruening [47] functionalized the external
surface of porous alumina membranes with multiple
bilayers of poly(styrene sulfonate) (PSS) and
poly(allylamine hydrochloride) (PAH). The mem-
branes were studied by diffusion dialysis and by
NF-type separations of neutral molecules such as
methanol, glucose, sucrose, and glycerol. The mem-
brane performance was evaluated in terms of
selectivity of permeation between the two solutes.
The selectivity was defined as follows:
Selectivity ¼ ð100� R1Þ=ð100� R2Þ ð7Þ
where R1 and R2 are the rejections of solutes 1 and 2,respectively. The findings of the study are listed inTable 2. It is clear that the LbL modification of themembrane increases the glucose/sucrose selectivitysignificantly. It was also interesting to note that bychanging the surface properties of the LbL assemblyby capping it with 1.5 bilayer of [PAA/PAH], theseparation selectivity was enhanced drastically asindicated by their diffusion dialysis experiments.The lower selectivity values in the case ofmethanol/glycerol imply that the pores in the LbL-modified membranes are still too large to separatesmall molecules such as methanol.
Hollman and Bhattacharyya [15] prepared highlypermeable ion-selective membranes through immo-
bilization of polyelectrolyte multilayer within the
External membranesurface or membrane
pore surface
Treatment withpolyelectrolyte
First adsorbed layer ofpolyelectrolyte(electrostatic or
covalent attachmentto the surface)
Treatment withoppositelycharged
polyelectrolyte Alternate treatmentwith oppositely
chargedpolyelectrolytes
Layer-by-layerassembly
Figure 13 Schematics for membrane functionalization with LbL assembly technique.
22 Role and Function of Biological and Artificial Membranes

pores of microporous membranes. The polyelectro-lytes used were PLGA and poly(L-lysine) (PLL).The first layer was covalently attached to the mem-brane support through surface chemistry and the restof the layers were assembled through electrostaticinteractions. Unlike stratified surface deposition, thefilm growth in this case proceeds perpendicular tothe direction of solvent flux. The role of NaCl con-centration in the carrier solvent on polyelectrolyteadsorption was studied. It was observed that as theNaCl concentration was increased from 0 to 0.1 to 0.5M, the polyelectrolyte attachment density increasedfrom 0.1� 10�4 to 0.15� 10�4 to 0.22� 10�4 mmolcm�2, respectively. This can be attributed to a reduc-tion in number of ionic site interactions per adsorbedchain during deposition with increasing salt solution.The membranes show As(V) rejection greater than95% at membrane permeances (pressure < 2 bar) thatexceed commercially available NF membranes.
1.02.6 Functionalized Membranesfor Catalytic Applications
Functionalized membranes have the potential tocontribute significantly toward the improvement ofcatalytic applications by providing alternative sup-port for catalyst immobilization. Membrane-supported catalytic applications not only mitigatethe need for dispersion of the catalyst and its subse-quent removal from reaction mixture, but alsoprovide very high mass transport conditions. Forexample, sulfonated polystyrene graft functionalizedmembranes have been studied as heterogeneous,solid-phase flow through catalyst for esterificationreaction between ethanol and acetic acid [48]. Aresidence time of 20 s in the flow through studiesgave the same conversion as obtained in 11 h forbatch reactions with either membrane or commercialion-exchange resin. This emphasizes the significantimprovement in reaction kinetics using membrane-supported catalyst.
An important area of catalytic applicationsinvolves the use of metal nanoparticles. In additionto the large surface area to volume ratios, the differ-ent electronic properties of the nanoparticles (ascompared to bulk materials) contribute toward thesignificant enhancements in catalytic activities. In thenext section, application of membrane-immobilizedmetal nanoparticles for catalytic dechlorination ofchloro-organics are discussed.
1.02.6.1 Membrane-ImmobilizedNanoparticles for Chloro-OrganicDechlorination
Zero-valent iron-based bimetallic nanoparticles areknown for the degradation of toxic-chlorinatedorganic compounds which is important for ground-water remediation. Nanoparticle synthesis inaqueous phase for dechlorination studies has beenreported [49–51]. However, in the absence of poly-mers or surfactants, the nanoparticles can easilyaggregate into large particles with wide size distribu-tion. Xu and Bhattacharyya [10–12] reported a novelin situ synthesis method of bimetallic nanoparticlesembedded in PAA functionalized microfiltrationmembranes by chemical reduction of metal ionsbound to the carboxylic acid groups. Along withhigh mass transfer rate, reduction of particle lossand prevention of particle aggregation are theadded advantages of membrane-based nanoparticlesynthesis. The procedure for the synthesis ofmembrane-immobilized bimetallic nanoparticles isschematically shown in Figure 14.
PVDF membrane was functionalized either by dipcoating with PAA solution or by in situ polymeriza-tion of acrylic acid monomers inside membranepores. The PAA was converted into sodium form bysoaking the membrane in sodium hydroxide solution.The ferrous ions (Fe2þ) were loaded into membranesby ion exchange between Naþ ions in the membraneand Fe2þ ions from aqueous ferrous chloride solu-tion. The membrane was then immersed in thesodium borohydrate solution to reduce the Fe2þ
Table 2 Selectivity values for neutral solutes using layer-by-layer surface-modified alumina membrane
Film composition Methanol/glycerola Glycerol/glucoseb Glucose/sucroseb
[PSS/PAH]6PSS 1.96 3.7 68
[PSS/PAH]7 2.0 7.7 >100
a Diffusion dialysis experiments.b NF experiments.Modified from Liu, X., Bruening, M. L. Chem. Mater. 2004, 16, 351–357.
Functionalized Membranes for Sorption, Separation, and Reaction: An Overview 23

ions to form Fe0 nanoparticles embedded in thePAA/PVDF matrix. Bimetallic (core/shell) nanopar-
ticles were formed by postdeposition of other metalssuch as Pd or Ni (Pd2þ þ Fe0 ! Fe2þ þ Pd0).Figure 14 also shows the TEM image of the
membrane-immobilized Fe/Pd nanoparticles.According to the TEM-EDS spectra, the Fe/Pd nano-
particles contain 1.9 wt.% Pd. The STEM-EDSmapping images of the nanoparticles demonstrate a
core–shell structure with Fe in the core region and Pdin the shell region. The membrane was studied fordechlorination of 2,29-dichlorobiphenyl (DiCB) in
convective mode.The dechlorination experiments were carried out
at four different residence times and the DiCB con-centration profiles as shown in Figure 15. The figure
also shows the concentrations of the intermediate2-chlorobiphenyl and the final product biphenyl;for 40 s residence time, complete dechlorination ofDiCB takes place at room temperature.
The dechlorination process can be described by atwo-dimensional model. Figure 16 shows the sche-matics of the membrane pore with two regions: (1)
membrane pore region and (2) PAA layer containingFe/Pd nanoparticles. The system can be described bythe following equations:
For the membrane pore region,
Uz
@C
@z¼ Ds
1
r
@C
@rr@C
@r
� �þ Ds
@2C
@z2ð8Þ
For the PAA layer region containing Fe/Pdnanoparticles,
STEM-EDS mapping
Supportmembrane(MF, UF):
PVDF, PES
Dip-coating PAA or insitu polymerization of
acrylic acid
PAA functionalizedmembranes
FeCl2, pH = 5
Fe2+
Fe2+
Fe2+
Fe2+Fe2+
Fe2+
Fe2+
SEM-EDX
Pd/Ni coating
TEM image
Cou
nts
Energy (keV)108642
Pd
Fe
FeFe
O
C
Cu
Cu
Fe = 97.9 wt.%Pd = 1.9 wt.%
Core/Shell structure
50 nm
Fe Pd
NaBH4
Pore size: 50–500 nm
* C C
H
H F
F*
H2C
C
**
OH
O
Polyvinylidenefluoride (PVDF)
Pd or Ni
Poly (acrylic acid)(PAA)
CH
TEM-EDX
Figure 14 Synthesis of bimetallic nanoparticles in functionalized membranes. Modified from Xu, J., Bhattacharyya, D. Ind.
Eng. Chem. Res. 2007, 46, 2348–2359.
24 Role and Function of Biological and Artificial Membranes

Dm1
r
@C
@rr@C
@r
� �þ Dm
@2C
@z2þ ð – kin�SaCÞ ¼ 0 ð9Þ
where C is the PCB concentration; Ds the diffusivityof DiCB in pore fluid; Dm the diffusivity of DiCB inmembrane; kin the reaction rate constant in convec-tive flow; � the Fe/Pd density in PAA layer; Sa thesurface area per unit mass; Uz the fluid velocity inz-axis, Uz¼ 2U0(1 – (r/r1)2), for a fully developedlaminar flow, with U0 being the average velocity.
The equations were solved [12] with appropriateinitial/boundary conditions with kin as the fitting para-
meter to fit the model data to the experimental data.
The model was successfully able to predict the experi-
mental data for varying operating conditions such as
residence time, wt.% of Pd in the bimetallic nanopar-
ticles, and membrane pore size. This model is a useful
tool for the prediction and evaluation of chloro-
organic degradation at various conditions, and for theoptimization of nanoparticles loading in membranes.
Acknowledgments
The authors would like to acknowledge the researchgrant supports from the NIEHS-SBRP program(P42ES007380) and Huber Corporation.
References
[1] Klein, E. Affinity Membranes: Their Chemistry andPerformance in Adsorptive Separation Processes; Wiley:New York, 1991.
[2] Butterfield, D. A., Ed. Biofuncitonal Membrances;Proceedings of the International Conference onBiofunctional Membranes, University of Kentucky,Lexington, KY, 9–11 April 1995; Plenum: New York, 1996.
[3] Roper, D. K., Lightfoot, E. N. J. Chromatogr. A 1995, 702,3–26.
[4] Hollman, A. M., Bhattacharyya, D. Membr. Sci. Technol.Ser. 2003, 8, 329–352.
[5] Datta, S., Bhattacharyya, D., Ray, P. D., Nath, A.,Toborek, M. Sep. Sci. Technol. 2007, 42, 2451–2471.
[6] Datta, S., Ray, P. D., Nath, A., Bhattacharyya, D. J.Membr. Sci. 2006, 280, 298–310.
[7] Smuleac, V., Butterfield, D. A., Sikdar, S. K., Varma, R. S.,Bhattacharyya, D. J. Membr. Sci. 2005, 251, 169–178.
[8] Xu, J. Doctoral Dissertation, University of Kentucky, 2007.[9] Tee, Y.-H., Grulke, E., Bhattacharyya, D. Ind. Eng. Chem.
Res. 2005, 44, 7062–7070.[10] Xu, J., Bhattacharyya, D. Environ. Prog. 2005, 24,
358–366.[11] Xu, J., Bhattacharyya, D. Ind. Eng. Chem. Res. 2007, 46,
2348–2359.[12] Xu, J., Bhattacharyya, D. J. Phys. Chem. C 2008, 112,
9133–9144.[13] Datta, S., Cecil, C., Bhattacharyya, D. Ind. Eng. Chem.
Res. 2008, 47, 4586–4597.[14] Onda, M., Lvov, Y., Ariga, K., Kunitake, T. J. Ferment.
Bioeng. 1996, 82, 502–506.[15] Hollman, A. M., Bhattacharyya, D. Langmuir 2004, 20,
5418–5424.[16] Malaisamy, R., Bruening, M. L. Langmuir 2005, 21,
10587–10592.[17] Ladhe, A. R., Radomyselski, A., Bhattacharyya, D.
Langmuir 2006, 22, 615–621.[18] Ariga, K., Hill, J. P., Ji, Q. Phys. Chem. Chem. Phys. 2007,
9, 2319–2340.[19] Decher, G. Science 1997, 277, 1232–1237.[20] Decher, G., Schmitt, J. Prog. Colloid Polym. Sci. 1992, 89,
160–164.[21] Iler, R. K. J. Colloid Interface Sci. 1966, 21, 569–594.[22] Hautojarvi, J., Kontturi, K., Nasman, J. H., Svarfvar, B. L.,
Viinikka, P., Vuoristo, M. Ind. Eng. Chem. Res. 1996, 35,450–457.
[23] Yamaguchi, T., Nakao, S., Kimura, S. Macromolecules1991, 24, 5522–5527.
[24] Chun, K.-Y., Stroeve, P. Langmuir 2001, 17, 5271–5275.[25] Lee, S. B., Martin, C. R. Chem. Mater. 2001, 13,
3236–3244.[26] Smuleac, V., Butterfield, D. A., Bhattacharyya, D. Chem.
Mater. 2004, 16, 2762–2771.
00.00
0.01
0.02
0.03
0.04
0.05
0.06
0.07
Con
cent
ratio
n
Residence time (s)
2,2'-Dichlorobiphenyl2-ChlorobiphenylBiphenylCarbon balance
20 40
Figure 15 Dechlorination results for 2,29-dichlorobiphenyl
using membrane-immobilized Fe/Pd nanoparticles.
Modified from Xu, J., Bhattacharyya, D. Ind. Eng. Chem.Res. 2007, 46, 2348–2359.
r
z
r1 r20P
PVDF
PVDF
PAA
PAA
Figure 16 Schematic representation of the membrane
pore for modeling purpose. Modified from Xu, J.,
Bhattacharyya, D. J. Phys. Chem. C 2008, 112, 9133–9144.
Functionalized Membranes for Sorption, Separation, and Reaction: An Overview 25

[27] Avramescu, M.-E., Girones, M., Borneman, Z.,Wessling, M. J. Membr. Sci. 2003, 218, 219–233.
[28] Lin, Y.-F., Ma, C.-C. M., Lin, Y.-Y., Yen, C.-Y., Hung, C.-H.Key Eng. Mater. 2007, 334–335, 945–948.
[29] Sambandam, S., Ramani, V. J. Power Sources 2007, 170,259–267.
[30] Yen, C.-Y., Lee, C.-H., Lin, Y.-F., et al. J. Power Sources2007, 173, 36–44.
[31] Bhattacharyya, D., Hestekin, J. A., Brushaber, P.,Cullen, L., Bachas, L. G., Sikdar, S. K. J. Membr. Sci.1998, 141, 121–135.
[32] Ritchie, S. M. C., Kissick, K. E., Bachas, L. G.,Sikdar, S. K., Parikh, C., Bhattacharyya, D. Environ. Sci.Technol. 2001, 35, 3252–3258.
[33] Ritchie, S. M. C., Bhattacharyya, D. Ion Exch. SolventExtr. 2001, 14, 81–118.
[34] Anghel, D. F., Saito, S., Baran, A., Iovescu, A. Langmuir1998, 14, 5342–5346.
[35] Nagarajan, R. J. Chem. Phys. 1989, 90, 1980–1994.[36] Robb, I. D., Stevenson, P. Langmuir 2000, 16, 7168–7172.[37] Ladhe, A. R., Frailie, P., Hua, D., Darsillo, M.,
Bhattacharyya, D. J. Membr. Sci. 2009, 326, 460–471.[38] Hestekin, J. A., Bachas, L. G., Bhattacharyya, D. Ind. Eng.
Chem. Res. 2001, 40, 2668–2678.
[39] Ritchie, S. M. C., Bachas, L. G., Olin, T., Sikdar, S. K.,Bhattacharyya, D. Langmuir 1999, 15, 6346–6357.
[40] Hollman, A. M., Bhattacharyya, D. Langmuir 2002, 18,5946–5952.
[41] Hollman, A. M., Scherrer, N. T., Cammers-Goodwin, A.,Bhattacharyya, D. J. Membr. Sci. 2004, 239, 65–79.
[42] Zhang, W., Nilsson, S. Macromolecules 1993, 26,2866–2870.
[43] Nishizawa, M., Menon, V. P., Martin, C. R. Science 1995,268, 700–702.
[44] Ito, Y., Park, Y. S., Imanishi, Y. Langmuir 2000, 16,5376–5381.
[45] Hong, S. U., Miller, M. D., Bruening, M. L. Ind. Eng. Chem.Res. 2006, 45, 6284–6288.
[46] Krasemann, L., Tieke, B. J. Membr. Sci. 1998, 150, 23–30.[47] Liu, X., Bruening, M. L. Chem. Mater. 2004, 16, 351–357.[48] Shah, T. N., Ritchie, S. M. C. Appl. Catal. A: Gen. 2005,
296, 12–20.[49] Feng, J., Lim, T.-T. Chemosphere 2005, 59, 1267–1277.[50] Lowry, G. V., Johnson K. M. Environ. Sci. Technol. 2004,
38, 5208–5216.[51] Zhang, W.-X., Wang, C.-B., Lien, H.-L. Catal. Today 1998,
40, 387–395.
26 Role and Function of Biological and Artificial Membranes
Biographical Sketches
Dr. Abhay R Ladhe received his bachelor of chemical engineering degree from the University of Mumbai,Institute of Chemical Technology in 2003. Subsequently, in December 2008, he received his PhD degree fromthe Department of Chemical Engineering, University of Kentucky. Professor Bhattacharyya was his researchadvisor. Dr. Ladhe has published five articles and has made six presentations in various meetings. He was therecipient of Elias Klien Founders’ travel award for International Congress on Membranes and MembraneProcesses (ICOM) 2008, Honolulu, Hawaii. At the University of Kentucky, he also received the ResearchChallenge Trust Fund (RCTF) Fellowship. Dr. Ladhe joined Cargill Corporation in 2009 as a researchchemical engineer.
Professor Dibakar Bhattacharyya (DB) is the University of Kentucky alumni professor of chemical engineeringand a fellow of the American Institute of Chemical Engineers. He received his PhD from the Illinois Institute ofTechnology, MS from Northwestern University, and BS from Jadavpur University. He is the co-founder of theCenter for Membrane Sciences at the University of Kentucky. He has published over 175 refereed journalarticles and 20 book chapters, and has recently received four US patents (three on functionalized membranes,and one on hazardous waste destruction technology). He and his group developed a highly novel platform forthe detoxification of organics by membrane-based nanoparticles. He and his graduate students have pioneeredthe development of functionalized membranes for enzyme catalysis, ultrahigh capacity metal capture, andnanostructured metal synthesis for environmental and bioapplications. Dr. Bhattacharyya has received anumber of awards for his research and educational accomplishments, including the 2004 Kirwan Prize forOutstanding Research, Larry K. Cecil AIChE Environmental Division Award, the Kentucky Academy ofSciences Distinguished Scientist Award, Henry M. Lutes Award for Outstanding Undergraduate EngineeringEducator, AIChE Outstanding Student Chapter Counselor Awards, and the University of Kentucky GreatTeacher (1984, 1996, and 2008) Awards. He was the editor (with Butterfield as a coeditor) of a recentlypublished (Elsevier) book New Insights into Membrane Science and Technology: Polymeric and Biofunctional Membranes.
At the 2007 Annual Meeting of the North American Membrane Society, Dr. Bhattacharyya was honored for hiscontributions in the area of membranes and environmental applications.
Functionalized Membranes for Sorption, Separation, and Reaction: An Overview 27

This page intentionally left blank

1.03 Modeling and Simulation of Membrane Structure andTransport PropertiesV N Burganos, Institute of Chemical Engineering and High Temperature Chemical Processes, Foundationfor Research and Technology-Hellas, Patras, Greece
ª 2010 Elsevier B.V. All rights reserved.
1.03.1 Introduction 31
1.03.2 Mechanisms of Transport in Membranes 32
1.03.2.1 Mechanisms of Gas Transport 33
1.03.2.1.1 Knudsen flow and diffusion 33
1.03.2.1.2 Molecular or ordinary or bulk diffusion 34
1.03.2.1.3 Viscous flow 35
1.03.2.1.4 Rarefied gas flow 35
1.03.2.1.5 Surface diffusion 35
1.03.2.1.6 Activated or configurational diffusion 35
1.03.2.1.7 Molecular sieving 36
1.03.2.1.8 Condensation and capillary flow 36
1.03.2.2 Mechanisms of Transport in Fluid–Solid Separations 37
1.03.2.2.1 Fluid transport 37
1.03.2.2.2 Transport of suspended particles 37
1.03.2.3 Mechanisms of Transport in Nonporous Membranes 38
1.03.3 Modeling Approaches 39
1.03.3.1 Flux Relations – Phenomenology 39
1.03.3.2 Pore-Scale Modeling 41
1.03.3.2.1 Pore models 41
1.03.3.2.2 Grain models 43
1.03.3.2.3 Fiber models 45
1.03.3.2.4 Digitized structure models 45
1.03.3.3 Mesoscopic Transport Simulation 48
1.03.3.3.1 Trajectory techniques 49
1.03.3.3.2 Direct simulation Monte Carlo method 51
1.03.3.3.3 Lattice-Boltzmann simulation of flow in porous membranes 53
1.03.3.3.4 Pore-scale simulation of dispersion in porous membranes 54
1.03.3.3.5 Particle-tracking method for dispersion simulation 56
1.03.3.3.6 Pore-scale simulation of membrane fouling 58
1.03.3.3.7 Lattice-Boltzmann simulation of two-phase flow with phase change 59
1.03.3.4 Simulations at the Atomic Scale 64
1.03.3.4.1 Atomistic reconstruction of inorganic membrane materials 64
1.03.3.4.2 Simulated annealing 65
1.03.3.4.3 Simulation of sorption – Monte Carlo technique 65
1.03.3.4.4 Simulation of diffusion – Molecular dynamics 67
1.03.3.4.5 Structure and transport simulation in polymers 69
1.03.4 Concluding Remarks – Multiscale Modeling 70
References 71
NomenclatureBo hydraulic permeability of the membrane
ci concentration of species i
Cs Cunningham correction factor
cs speed of sound
ct total concentration of a
mixture
DB Brownian diffusivity
29

De orientationally averaged effective
diffusivity
Di transport diffusivity of species i within
the pore structure
dI interface thickness
Dij binary ordinary diffusivity of component i
in component j
Dij,e effective ordinary diffusivity of the (ij) pair
Dim diffusion coefficient of component i in
the membrane
DK Knudsen diffusivity
DKe effective Knudsen diffusion coefficient
DKi,e effective Knudsen diffusivity of
component i
Dm molecular diffusivity
dm molecular size
dp characteristic pore size
dpar effective particle diameter
Ds,i self-diffusivity of species i within the
pore structure
Dx,y,ze effective diffusivity in x-, y-, z-direction,
respectively
E potential energy
e~
i velocity in the i-direction in the lattice-
Boltzmann method
F Faraday constant
F~
i force acting on particle i in molecular
dynamics
fi fugacity of species i
fi
�~X ;t�
particle distribution
fieq�~X ;t�
equilibrium distribution function in the
lattice-Boltzmann method
f eqi
�~X;t�
solute distribution function in the lattice-
Boltzmann method
fT transmission probability
~g
i force that accounts for all types of
constraints
H Hurst exponent
Hst isosteric heat of adsorption
kB Boltzmann constant
KH Henry constant
Kn Knudsen number, ratio of the mean free
path to the mean pore size
mi mass of particle i in molecular
dynamics
Ms molecular weight of the sorbate
Mw molecular weight
Ni transport flux of species i_N i transport rate in capillary i
p pressure
Pe Peclet number
Pi membrane permeability
pi partial pressure of component i
p0 vapor pressure for planar interfaces
q scattering vector
qsat saturation concentration
R ideal gas constant
Rf random number in the interval (0, 1)
RZð~uÞ normalized autocorrelation function
�r hydraulic radius of the accessible pore
space of the membrane
ri radius of capillary i
r~
i position vector of particle i in molecular
dynamics
rp pore radius
S� accessible specific surface area
Si solubility
T temperature
Tdesired desired temperature
Tsystem temperature of the system
�u mean thermal speed
ui species mobility
Vi partial molar volume of species i
~X position vector
xi mole fraction of species i
Z configurational integral
Zig configurational integral for a sorbate
molecule in an ideal gas phase
zi species charge number
zð~XÞ phase function
�i9 viscous selectivity parameter
� ¼ (kBT)�1
�ij thermodynamic correction factor for the
(ij) pair
�i activity coefficient of species i
�(r) density fluctuation autocorrelation
function
�ci concentration difference between exit
and entrance faces
� thickness of the adsorbed layer
"� accessible porosity
�B tortuosity factor for bulk diffusion
�K tortuosity factor
� contact angle
�i fractional occupancy of the sorption
sites by component i
�nþ 1 fraction of unoccupied sites
� fluid parameter in the nonideal lattice-
Boltzmann model
mean free path
30 Fundamentals of Transport Phenomena in Membranes

dynamic viscosity
i chemical potential of species i
� kinematic viscosity
� displacement of a test molecule from its
initial position
�x displacement of a molecule in the
x-direction
density of the condensate
0 mass density of the solid
p fluid density
s solute density
� interfacial tension
�n variance of random additions at stage n
of the fBm process
� relaxation time
�s solute relaxation time
� electrostatic potential
� free energy density functional
bulk free energy density
1.03.1 Introduction
The design and preparation of membranes for theefficient separation of gas mixtures and fluid–solidsystems relies heavily on the understanding of theeffects of the internal structure of the membranematerial on the transport and sorption during theseparation process. Although such an interrelation issignificant in numerous other applications of porousmaterials or more general transport systems, its rolein membrane separations becomes truly crucial. It isstraightforward to realize that the interaction of themixture compounds with the membrane material isresponsible, to a large extent, for the rate of theirtransport through the membrane or for their differ-ential ability to percolate across the membrane oreven for the accessibility of the interior of the mem-brane by the particular mixture species.
In fact, demanding separation processes nowadayscall for materials that can offer a sieving operation atthe molecular scale, thus excluding the passage ofcertain mixture species and selectively allow thetransmission of others. A significant amount ofresearch work has already been devoted to the in-depth understanding and quantification of the struc-ture-to-separation interrelation using a multitude ofexperimental and theoretical techniques. Modelingand simulation techniques in membrane science havetraditionally relied on similar efforts in the context ofporous materials and have adapted appropriatelystructure approximations and flux relations. As aresult, pore/grain/fiber models of the internal struc-ture of membranes and their supports have appeared,followed by the application of single, binary, andmulticomponent transport equations, usually invol-ving some tortuosity factors. A significantimprovement in the modeling of the pore structure
was noted when computer-aided reconstructiontechniques started to find extensive use in the litera-ture of porous materials and, later, in that ofmembrane science. Such techniques have the clearadvantage over earlier pore models that the descrip-tion of the structure is in digital form and, as such,can lend itself directly to transport calculations, thusavoiding the assumption of specific geometry of thepores, grains, or any other structural element of thematerial. Progressively, the need to assume somevalue for the tortuosity factor was removed, thanksto the incorporation of molecular trajectories in thecalculation of the diffusion coefficient in porestructures.
However, the need for detailed description ofpenetrant–membrane interactions cannot beremoved as microporous materials become graduallythe target material-type, at least for efficient gasseparation. To this end, molecular simulations haveenjoyed tremendous development in the field ofmembrane science in the recent years, addressingboth the membrane material itself and the transportand sorption phenomena that take place during theseparation process. Needless to say, substantial pro-gress toward the accurate prediction of transport andstructural properties would not be possible withoutthe direct linking of molecular simulations withexperimental data at the atomic level and also withquantum mechanical calculations. Among otherpieces of information, the latter can deliver molecu-lar geometry and electronic properties as well asaccurate data on the molecular interaction potentialsthat can be introduced into the force field models ofMonte Carlo and molecular dynamics techniques.
Nevertheless, despite the significant progress thathas been made at the level of molecular simulationsand the tremendous evolvement of computer
Modeling and Simulation of Membrane Structure and Transport Properties 31

technology that allowed outstanding improvementsin computer performance regarding memory, codecompilation, and computational time, the length andtime scales of molecular simulations remain severalorders of magnitude below the macroscopic scale thatis related to process design and process calculations.Hence, the design, preparation, and application ofmembrane materials have to rely on an appropriatebridging of the molecular scale results to the scale thatwould allow actual material engineering. To this end,it was recently realized that some kind of hierarchicalmodeling could provide the required leverage for thescale-up with minimal loss at each scale-transition ofthe accuracy that was offered by the computations atthe previous scale. Although useful for all types ofmaterials, such an approach is recognized nowadaysas a necessity in the field of polymers, and conse-quently in that of polymeric membranes, whereseveral levels of the so-called coarse-graining processare frequently required to fill the gap of about 10orders of magnitude in the length-scale spectrumand 20 orders of magnitude in the time-scale spectrum[1]. Despite the rapid improvement of computer hard-ware, which on average doubles its efficiency every 2years (Moore’s law) [2] and, recently, does so almostevery 18 months, essential progress in this respectrequires faster algorithms and in-depth understandingof the underlying phenomena that will allow reliablefiltering of the truly needed parameters in the simula-tions across scales.
More specifically, modeling of membrane materi-als and membrane processes is of indisputablesignificance not only for the understanding anddescription of material structure and penetrant trans-port but also for the reliable screening of material andmodule candidates based on performance and end-property predictions that they can offer.Consequently, membrane modeling and simulationcan drastically alleviate the experimental workloadby recommending suitable material structures andseparation process conditions and, equally impor-tantly, excluding whole ranges of poor candidates.
A separate but well-accepted contribution ofmodeling and simulation techniques in the field ofmembrane science and technology is that towardtesting and validation of several theories that havebeen developed for the prediction of transport prop-erties, usually within the general framework ofeffective medium approximation, volume averagingapproaches, smooth field approximation, etc. Theirattractiveness mainly stems from their simplicity andwide applicability to entire classes of materials,
typically porous materials or blends of various com-ponents. However, the strong assumption that suchtheories usually invoke limits their accuracy to levelsthat may not be adequate for fine design or accurateprocess calculations. Therefore, one must resort tomore advanced modeling and simulation techniquesfor testing these theories or even for modification ofthe working equations that usually quantify theunderlying phenomena. Although the review ofthese theories is beyond the scope of this chapter,some reference to them is made in the context ofassessment of the usefulness and performance of thevarious simulators.
The rest of this chapter is organized as follows. Anoverview of the main transport mechanisms duringmembrane-based gas mixture and fluid–solid separa-tion is followed by a presentation of additionalphenomena that take place during gas–liquid andliquid–liquid processing. Emphasis is placed on thetreatment of nanoscale fluid transport, which becomesincreasingly important and interesting in the field ofmicroporous membrane separations. Although numer-ous publications in simulating diffusion at thenanoscale have appeared in the literature, the same isnot true for the simulation of pressure-driven flow ofmixtures at the nanoscale with or without simultaneousdiffusive transport. Then, recent developments in thecomputer-aided reconstruction of the internal struc-ture of porous membranes are discussed, followed bysome fresh ideas on the adaptation of multiphase flowapproaches to the digital representation of compositemembranes. Once such digitized representations areavailable, a variety of transport phenomena can besimulated, and transport properties can be calculatedwithout having to resort to tortuosity factors or anyother structure-related geometrical or topological cor-rection factor. Subsequently, the molecular scale isconsidered and the atomic scale reconstruction of inor-ganic and polymeric membrane materials is discussed.The concept of coarse graining in the context of hier-archical modeling is then presented and the interfacewith macroscopic flux formulations is discussed.
1.03.2 Mechanisms of Transport inMembranes
Depending on the nature of penetrants and theirphysical state, various transport mechanisms are pos-sible, each of which requiring usually its ownmodeling approach. The overview that is presentedhere aims to provide the reader with the necessary
32 Fundamentals of Transport Phenomena in Membranes

understanding of the transport mechanisms to thedegree that will allow, in a later section, the adoptionof the suitable modeling and simulation alternatives.This presentation will also serve as an introduction tothe identification of the different scales that areencountered in membrane modeling.
1.03.2.1 Mechanisms of Gas Transport
Transport of gases through membranes and their sup-ports may involve a large variety of mechanisms,separate or combined. Although different types ofmechanism classification can be envisaged, it appearsvery convenient to employ two indices to identify thevarious transport regimes. The first one is theKnudsen number, Kn, which is defined as the ratio ofthe mean free path, , to some characteristic or aver-age pore size, dp, that is,
Kn ¼
dpð1Þ
The second index is the ratio of the molecule size(usually the equivalent sphere diameter), dm, to thepore size:
bm ¼dm
dpð2Þ
1.03.2.1.1 Knudsen flow and diffusion
The so-called Knudsen transport (flow or diffusion)refers to the transport of gases through a pore or aporous material under conditions that correspond tovery high Kn values. These conditions usuallyinvolve low pressure (large ) or sufficiently smallpores (small dp), the latter being obviously critical inmembrane separations. In this case, penetrant mole-cules exchange momentum almost exclusively withthe pore walls due to the much higher frequency ofmolecule–wall collisions than that of gas phase mole-cular collisions (see Figure 1(a)). Practically, thismechanism dominates transport for Kn >�100.Upon collision with the wall, the gas molecule
(d)
(c)
(b)
(a)
C
A BD
(h)
(g)
(f)
(e)
Figure 1 Schematic representation of fluid transport mechanisms in porous membranes.
Modeling and Simulation of Membrane Structure and Transport Properties 33

undergoes a change in the direction of its motion,departing, typically, at a direction that is unrelated tothe direction of the molecular path prior to collision.Such a diffuse reflection process is consistent withthe assumption that the colliding molecule ismomentarily adsorbed on the surface and is subse-quently reemitted from it. The time that elapsesduring this adsorption stage is assumed to be suffi-cient for the molecule to lose completely its memoryand, hence, to leave eventually the surface into atotally random direction. Experimental evidencehas provided considerable support to this assump-tion, which is customarily used in the simulationswithin this transport regime, as discussed later.
Although both terms, namely, Knudsen flow andKnudsen diffusion, are usually employed inter-changeably, strictly speaking the former term mustbe used for free-molecule transport under the actionof a pressure gradient, whereas the latter under theaction of a concentration gradient. Put in the form ofa driving force formula, Knudsen transport followsthe action of the driving forcerpi/RT, where pi is thepartial pressure of component i, R the ideal gas con-stant, and T the temperature. Considering thatpi¼ xip, where p is the total pressure, it follows that
rpi ¼ xirp þ prxi ð3Þ
where xi is the mole fraction of species i. It is, hence,apparent that both a pressure gradient and a compo-sition gradient can give rise to gas transport [3].
The effective Knudsen diffusion coefficient DK,e isusually related to the tortuosity factor, �K, that pro-vides a measure of the resistance to gas transportowing to the presence of the pore walls along thetortuous pathways across the membrane itself oracross the porous support structure, through theexpression
DK;e ¼"�DK �rð Þ�K
ð4Þ
In Equation (4), "� is the accessible porosity (theisolated void space does not contribute to transport)and DK �rÞð is the Knudsen diffusivity in an infinitelylong cylindrical pore having radius equal to thehydraulic radius of the accessible pore space of thematerial, that is,
�r ¼ 2"�S�
ð5Þ
where S� is the accessible specific surface area.
The relation
DK �rð Þ ¼ 2
3�r �u ð6Þ
where
�u ¼
ffiffiffiffiffiffiffiffiffiffi8RT
�Mw
sð7Þ
is the mean thermal speed of the gas molecules andMw, the molecular weight, implies that DK �rÞð and,hence, DK,e are directly proportional to the quantity(T/Mw)1/2. Hence, the separation factor for binarygas mixtures can be estimated from the square root ofthe inverse ratio of the molecular weights.
It is shown in a later section that the evaluation ofthe tortuosity factor, �K, which is traditionally deter-mined upon fitting to experimental data, can beactually calculated directly, under certain conditions,from modeling and simulation techniques.
1.03.2.1.2 Molecular or ordinary or bulk
diffusion
In the small Kn regime, which is relevant at ambientor elevated pressures (small ) or for relatively largepores (large dp), gas molecules collide mainly witheach other in the gas phase, the molecule–wall colli-sions being quite rare (see Figure 1(b)). This is theregime of molecular, ordinary, or bulk diffusion and,in practice, it is achieved for Kn <�0.01. The effec-tive bulk diffusion coefficient is usually expressed as
DB;e ¼"�Dm
�Bð8Þ
where Dm is the molecular diffusivity in the absenceof pore walls and �B is the tortuosity factor for bulkdiffusion. In general, �B 6¼ �K due to the differentlevel of resistance to transport that the gas moleculesencounter in the interior of the porous material in thebulk and Knudsen diffusion regimes. Again, model-ing and simulation techniques can, in principle,provide good estimates of �B, thus avoiding resortingto fitting experimental data. In addition, as it is alsothe case in the Knudsen transport regime, models andsimulators can elucidate the effect of the pore struc-ture geometry and topology on the resistance to bulkdiffusion in a membrane or in its support layer.However, it must be mentioned that the conditions(operating pressure, temperature, or structural fea-tures) that favor this transport mechanism are not ofmuch interest in the gas mixture separation field dueto the poor separation factors that can be achieved in
34 Fundamentals of Transport Phenomena in Membranes

this case. However, it may well be one of the domi-nant mechanisms of transport in one of the supportlayers, yet, usually of limited importance to the over-all process of gas separation.
1.03.2.1.3 Viscous flow
Under the action of a total pressure gradient,convective flow takes place and the exact drivingforce becomes xirp/RT. That is, each mixture com-ponent is transported through the membrane at a ratewhich is proportional to its mole fraction and tothe pressure gradient. For Kn << 1, the continuumassumption is valid and the classical Stokes,Navier–Stokes, or compressible momentum conser-vation equations can be used in the void space (seeFigure 1(c)). However, integration over the entiremembrane structure is far from straightforward dueto the presence of the pore structure that is usuallyquite complicated. Hence, the Darcy equation orsome other phenomenological equation is typicallyused, depending mainly on the porosity level andalso on the degree of the equations that describe theboundary conditions. In general, the transport coeffi-cient is, in this case, proportional to p/, where isthe dynamic viscosity of the fluid. The proportion-ality constant is the viscous permeability, the value ofwhich is characteristic of the particular membrane orsupport structure. Viscous flow in a porous mem-brane is not by itself very efficient regardingselectivity in a mixture separation, since the mainhydraulic mechanism of separating the species isthe differential driving of the species moleculestoward the center or the edges of the pores.Usually, viscous flow is present as a consequence ofa pressure drop across the two sides of the membranebut it occurs in combination with some diffusionmechanism that undertakes the main separation task.
1.03.2.1.4 Rarefied gas flow
In the event that the condition Kn << 1 is not met andthe total pressure gradient is not zero, rarefied flowdevelops within the pore structure (see Figure 1(d)).Such a condition is frequently present in gas separa-tions owing to the small size of the membrane pores.Although the two extremes (Kn << 1, continuumlimit flow, and Kn >> 1, Knudsen flow) have beenaddressed in a great number of publications andseveral books, the same is not true for moderate Kn
values. The compressibility of the fluid and theposition-dependent viscosity are among the compli-cations that have probably hindered the extensivemodeling treatment of this regime. Typically, in
membrane separations, convective flow in the formof either continuum limit flow or rarefied fluid flowis accompanied by concentration gradient-drivendiffusion of the mixture components, thus compli-cating further the modeling and simulation attempts.However, given the significance of the rarefied flowregime within the areas of micro- and nanofluidics,some special discussion on relevant modelingapproaches is provided later in this chapter.
1.03.2.1.5 Surface diffusion
It is well known that all gases, to a greater or lessextent, may get adsorbed on solid surfaces alongwhich they may be transported, subject to some sur-face concentration gradient, before they are desorbedback into the gas phase (see Figure 1(e)). Thismechanism of gas transport may become significantunder certain conditions of pressure, temperature,and for a specific pore size range. Because of thepractical difficulty in measuring or theoreticallymonitoring surface concentrations, it is preferred toresort to the adsorption isotherm when expressingsurface diffusion fluxes and, thus, to employ thelocal concentration in the bulk phase instead. In theparticular case of sufficiently small bulk concentra-tions to assume linearity in the adsorption isotherm,one may write that the surface flux of species i isproportional to the gradient of the bulk concentra-tion gradient of this species, the proportionalityconstant being the product of the linearity constantof the adsorption isotherm (a function of tempera-ture) and an effective surface diffusivity. The latter isthe product of the surface diffusivity and the specificsurface area of the membrane, multiplied by theporosity and divided by a tortuosity factor, �s [4].Although molecular simulations are the obviouschoice for the description of surface diffusion, thestraightforward additivity of the surface diffusionflux to the gas-phase diffusion flux has been custo-marily employed in phenomenological approaches.
1.03.2.1.6 Activated or configurational
diffusionEven though surface diffusion is itself an activatedtransport process in the sense that it requires someactivation energy to take place, namely, the energythat is needed for hopping of adsorbed moleculesfrom site to site on the pore surface, the term acti-vated or configurational diffusion is typicallyreserved for the process of transport in micropores(<2 nm), the size of which is comparable to that of thepenetrant molecules (see Figure 1(f)). Therefore,
Modeling and Simulation of Membrane Structure and Transport Properties 35

many similarities between the phenomenology ofsurface diffusion and configurational diffusion exist.The practical difference relates to the fact that thepore size in the case of configurational diffusion is toosmall to allow any bulk motion and the entire processis controlled by the interactions of the gas moleculeswith the pore walls.
At least two different transport coefficients arerelevant in this case. The self-diffusivity, Ds,i, is ameasure of the translational mobility of the gas mole-cules of species i within the pore structure and isusually obtained from the calculation of the mean-square displacement per unit of time. The transportdiffusivity, Di, is defined as the proportionality con-stant between the species flux and the negative of theconcentration gradient of the same species. The twodiffusivities are usually related through the Darkenequation [5]
Di ¼ Ds;i@ ln fi
@ ln ci
� �ð9Þ
where fi is the fugacity of species i and ci the con-centration of species i in the adsorbed phase per unitvolume of the porous medium. This is an approxima-tion and, strictly, one should use the so-calledcorrected diffusivity in place of the self-diffusivityin Equation (9) (corrected for the thermodynamicnonidealities).
In membrane-based separation of gas mixtures,the configurational and Knudsen diffusion mechan-isms are the most significant ones. The latter leads tofluxes that are inversely proportional to the squareroot of the molecular weights of the species. Theformer provides permselectivities that depend onthe shape and size of the gas molecules, the poresize, and the interactions between gas moleculesand pore walls.
1.03.2.1.7 Molecular sieving
If the size of the membrane pores is between the size ofthe smaller and the larger molecules in a binary mix-ture, a sieving mechanism develops that can lead tovery high separation factors (see Figure 1(g)). Thesame applies to multicomponent mixtures but furthersieving will then be required to separate the compo-nents with molecule size below or above the meanpore size of the membrane. Separation factors greaterthan 10 could be achieved for membrane pore sizesbelow 0.5 nm. However, in practice, there is a distri-bution of pore sizes in the membrane and moremoderate separation factors are usually reached.
Significant research efforts are made to produce mem-branes with very narrow pore-size distribution in themolecular size range, without, however, sacrificingporosity and losing, therefore, valuable throughput.An additional feature in molecular sieving operationis that of reduced rigidity of the membrane structure(or increased deformability), which may influencedrastically the relative ability of the penetrant mole-cules to pass through the pore space. This feature isencountered especially not only in polymeric mem-branes but also in inorganic ones, and is discussedlater.
1.03.2.1.8 Condensation and capillaryflow
As the relative pressure p/p0 of the gas species isincreased, where p0 is the vapor pressure for planarinterfaces, the amount of adsorbed gas on the porewalls increases and, progressively, the sorption siteoccupancy increases until saturation. Furtherincrease of the relative pressure gives rise to theformation of adsorbed (liquid) layers, which, inturn, grow gradually in thickness and eventuallycoalesce, initially in small pores and progressivelyin larger ones (see Figure 1(h)). For a cylindricalpore, the capillary condensation pressure, pc, isrelated to the pore radius, rp, through the Kelvinequation
RT
Mwln
pc
p0¼ –
2�cos �
rp – �ð10Þ
where is the density of the condensate, � the inter-facial tension, � the contact angle, and � the thicknessof the adsorbed layer. Depending on the level ofadsorption, different mechanisms of transport mayoccur simultaneously. For instance, in the situationdepicted in Figure 1(h), ordinary diffusion takesplace in the gas-phase regions A and B, pressure-drop-driven hydrodynamic flow develops along theadsorbed (liquid) layers C, and capillary pressure-driven flow in area D.
Such situations develop very often in the interiorof porous membranes, not only during operation (forinstance, separation of mixtures of condensablegases) but also during certain pore-structure charac-terization procedures that involve condensable gases,as is the N2 sorption/desorption technique. In bothcases, one needs to have reliable models that will beable to describe and monitor the condensation andcapillary flow phenomena, which, in turn, necessitate
36 Fundamentals of Transport Phenomena in Membranes
the availability of simulators of two-phase flowequipped with the phase transition feature.
It must have become obvious from the above thatseveral different mechanisms of gas transport inmembranes may develop and become dominantdepending on the nature of the gas–membraneinteractions, the membrane pore size, the prevailingconditions, and the nature of the gaseous penetrants(permanent gases or condensable vapors, etc.). Inpractice, one expects that more than one mechan-isms are likely to occur simultaneously because,typically, the membrane pore size follows a certaindistribution across the structure. A usual combina-tion of transport mechanisms in the support layers isthat of Knudsen and ordinary diffusion in the so-called transition diffusion regime, in which caseboth gas-phase and gas-surface collisions areresponsible for the momentum transfer. Other typi-cal examples are the combination of surface andconfigurational diffusion in the active membranelayer, the combination of convective and diffusivetransport in the support layers, and the combinationof liquid- and gas-phase transport with or withoutphase transition in all layers.
1.03.2.2 Mechanisms of Transport in Fluid–Solid Separations
In the presence of solid particles or solutes in thefluid stream, additional transport mechanisms needto be considered, which usually pertain not only tothe interaction of the particles with the externalmembrane surfaces and internal pore walls but alsowith the carrying fluid or with the solvent.
1.03.2.2.1 Fluid transport
The mechanisms of fluid transport in fluid–solidseparations are mainly viscous flow in the case of liquidsuspensions and flow with or without diffusion in thecase of aerosols. Usually, the flow field in the interior ofthe membrane is calculated as the result of the action ofan externally applied pressure drop across the twosides of the membrane. However, depending on thepore size, features of transport that are related to theexistence of very narrow pathways may become sig-nificant, as is the case of the flow in nanofiltration (NF)membranes. The validity of the continuum assumptionis the main issue that is raised in these cases.
1.03.2.2.2 Transport of suspended
particles
Depending on the relative size of suspended particles
and membrane pores but also on particle–wall inter-
actions, various mechanisms of permeation through
or rejection from the membrane structure can be
distinguished. The main types are summarized
below.Hydrodynamic convection. Particles are, in general,
carried along by hydrodynamic drag that originates
from the flow field that develops in the interior of the
membrane. As the particles approach the pore walls,
some significant hydrodynamic resistance comes to
hinder their collision with the solid surface, which
increases rapidly with decreasing clearance and tends
to infinity upon contact if both the particle and the
wall are nonporous. If at least one of the two bodies is
permeable, then the hydrodynamic resistance
remains finite as the stress that is applied to the
fluid is dissipated into the porous body. Because of
the great significance of these phenomena, intensive
analytical and numerical efforts have been made for
the calculation of correction factors to the classical
Stokes hydrodynamic force expression for both por-
ous and nonporous bodies, during normal or
tangential motion of the particles relative to the
pore wall (see, for instance, References 6–12). It is
also interesting to note that in the vicinity of the wall,
hydrodynamic torque becomes considerable giving
rise to particle rotation prior to potential capture.Sedimentation and flotation. Gravitational effects are
usually significant for particles larger than about
1 mm. Depending on the relative density of particles
to that of the carrying fluid, sedimentation or flota-
tion may arise. Nevertheless, in most cases
gravitational effects act in combination with other
migration mechanisms, like hydrodynamically dri-
ven migration, as mentioned above.Particle–wall interactions. In the vicinity of the pore
walls, particle–surface interactions become significant
and as the particle approaches the wall, they become
dominant. Usually, London van der Waals and electro-
kinetic double-layer interactions determine the motion
of particles in the close vicinity of the pore walls. The
attraction that is caused by the former and, usually, also
by the latter changes in most cases – depending, of
course, on the sign of surface and solution charges –
to a net repulsion at clearances smaller than a critical
value due to the switch of the double-layer forces to
rapidly increasing repulsive ones.
Modeling and Simulation of Membrane Structure and Transport Properties 37

Despite the obvious need for estimates of the physi-cochemical constants to describe quantitatively theseinteractions, it has been shown that once these constantsare below or above some critical values, the particleretention rate is not sensitive to the precise value ofthese constants [13]. It must be stressed that in NFmembranes, where the pore size is usually smaller than10 nm, such electrokinetic phenomena may becomedominant and extend over the entire membrane domainresulting, in many cases, in quite high rejection rates.
Sieving. Size exclusion-based separation is theore-tically the simplest mechanism of retention ofsuspended particles that can also lead to very highfiltration efficiencies. However, small pore sizeusually implies unacceptably low permeation,which decreases further during filter operation dueto the creation of a cake on the feed side of themembrane requiring some special treatment for itsremoval, typically backwashing.
Particle diffusion. In liquid filtration, Brownian dif-fusion may become a significant transportmechanism for submicron particles. For sufficientlysmall values of the ratio dpar/dp, where dpar is theeffective particle diameter, the process can beassumed to occur in the continuum limit and, conse-quently, it can be treated as a mass diffusion processthat can be described by the classical diffusion equa-tion. In this case, the ordinary diffusion coefficient isreplaced by the Brownian diffusivity, given by
DB ¼CskBT
3�dparð11Þ
where Cs is the Cunningham correction factor and kB
the Boltzmann constant. If both hydrodynamic dragand Brownian forces are significant, the particle dis-placement results from the combination of aconvective step (determined solely by the localfluid velocity and the time step) and a Brownianstep (of random direction and with magnitude thatis determined by the Brownian diffusivity and thetime step). In the case of aerosols, a similar descrip-tion of particulate transport applies except that thediffusivity of the submicron particles is used in placeof the ordinary diffusion coefficient in the classicalmass diffusion formulation.
1.03.2.3 Mechanisms of Transport inNonporous Membranes
In nonporous (dense) membranes, transport of speciescan take place only through the membrane material
itself, usually in the general sequence of solution,diffusion, and eventual discharge. That is, the speciesis first dissolved into the entrance face of the mem-brane, travels in the interior of the membrane materialthrough some diffusion or conduction process, andeventually exits from the other side into the effluentstream. Consequently, the separation efficiency of themembrane is a function of the solubility ratio anddiffusivity ratio for a binary separation.
Depending on the nature of the transported speciesand that of the membrane material, different types ofdissolution and diffusion are encountered in densemembranes. Of particular interest are the ionic con-ducting membranes, including most notably solidoxides and proton exchange membranes. Among otherapplications, these materials have a central role in fuelcells and, thus, have attracted tremendous attentionfrom investigators in basic and applied material scienceand material engineering.
Solid oxides conduct oxygen and mixed ionicelectronic conductors conduct both oxygen ions andelectrons. The oxygen permeation process involvesusually the following steps: electrochemical surfacereaction at the entrance face of the membrane tocreate oxygen ions, transport of oxygen ions throughthe bulk oxide via a sequence of oxygen vacancies,and surface oxidation reaction at the exit face form-ing molecular oxygen. The exceptional selectivity ofthese membranes and the relatively high fluxes thatare achieved compared to the polymeric membranesare the main attractive features of these materials.However, there are still some technical problemsthat must be overcome before large modules ofthem become operational, like thermal gradient-induced cracking, sealing issues, etc.
Proton exchange membranes can be either poly-meric or inorganic and can be used in power-generation devices as they conduct protons. Althoughseveral types of proton exchange membranes havealready been synthesized, Nafion� appears to be themost studied one. In sulfonated polymers such asNafion�, the hydrogen ions in the SO3H groupsbecome mobilized upon addition of water. A possiblemechanism of hydrogen ion transport through themembrane is that of proton addition into a watermolecule, hopping across the water molecule andthen onto another water molecule, and so on. Analternative or simultaneous transport mechanismmight involve proton combination with a water mole-cule into a complex molecule followed by diffusion ofthis complex molecule through the membranematerial.
38 Fundamentals of Transport Phenomena in Membranes

It is speculated that water becomes less bound ashydration progresses giving rise to the creation of anetwork of pathways through the membrane. In turn,this implies the development of additional mechan-isms of transport, from simple percolation tohydrodynamic flow of water and convective diffusionof ions [14]. The Nernst–Planck equation is relevantin this case, which in the single-phase approximationof the membrane reads
Ni ¼ – zi ui Fcir� –Dirci þ ciu ð12Þ
where Ni is the transport flux of species i, zi is thespecies charge number, ui is the species mobility, ci isthe species concentration, F is the Faraday constant,� is the potential, Di is the species diffusivity, and u isthe solvent velocity. The first term represents thespecies migration due to a potential gradient; thesecond term stands for the purely diffusive contribu-tion to the species flux, and the third term representsthe convective flux of the species, which results fromthe flow field of the solvent. The latter becomesmeaningful at sufficiently high hydration levels sothat individual pore segments have the opportunityto develop in the interior of the membrane. In fact,such a bulk pathway formation is held responsible forundesirable crossover of fuel during fuel-cell opera-tion. Hindrance effects can be included in thisequation through the introduction of correction fac-tors to the convection and diffusion/mobility terms.
In membrane-based ionic separations, as are thecases of NF and reverse osmosis (RO) for water desa-lination, steric hindrances combined with the Donnanand polarization layer effects come to add themselvesto the mechanisms of ion transport through the mem-brane. In these cases, one has to take into account thecorresponding terms in the calculation of the overalltransport potential across the membrane and addressthe phenomena such as exclusion-enrichment andpartitioning at the membrane–bulk interface. Anexcellent review of transport phenomena in nanoflui-dics with emphasis on electrokinetic phenomena wasrecently provided by Schoch et al. [15].
1.03.3 Modeling Approaches
The variety of transport mechanisms that may con-trol transport in the interior of membranes and oftheir porous supports complicates accurate model-ing and simulation of the separation or reactiveprocess. This complication becomes far more severe
if the interplay of these mechanisms with theusually tortuous structure of the membrane istaken into account. In fact, the interrelation betweenstructural features and end properties is the maintarget of modeling efforts not only in the membranesector but in the more general class of functionalmaterials. In the particular case of membranes, how-ever, this becomes a truly multiple scale task for tworeasons: first, the separation of two or more speciesis usually controlled at the microscopic scale (mole-cular or finest pore scale) and second, membranesare typically very thin and require various layers ofsupport to improve their mechanical and functionalproperties. In order to address this complexity,modeling not only at individual scales but alsoacross scales is needed. The analysis that followsborrows concepts and ideas from the more generalclass of porous materials taking into account, wher-ever needed, the peculiarities of the membranematerials. The goal is to provide a framework oftransport modeling and simulation in membranesin a top-bottom approach so that key measurablequantities can be identified on the one hand, and themain modeling pathways are presented on the otheras the internal membrane features are graduallyzoomed in.
1.03.3.1 Flux Relations – Phenomenology
The simplest and most convenient description oftransport phenomena in membranes that providesalso a quantitative relationship between drivingforce and resulting flux is the one that transportphenomenology has to offer. In fact, this is also avery useful approach for the organization and com-pilation of experimental data (flux measurementsunder conditions of pressure or composition gradi-ents). In the general case of multicomponentdiffusion of ideal gases in the absence of pore walls,the Stefan Maxwell equations apply:
–1
RTrpi ¼
Xn
j¼1
j 6¼i
xj Ni – xiNj
Dij
; i ¼ 1; . . . ; n ð13Þ
where pi is the partial pressure of component i, xi, Ni
are the mole fraction and molar flux of component i,respectively, and Dij is the binary ordinary diffusivityof component i in component j. In the presence ofpore walls (case of porous membranes), Equations(13) take the form of the so-called dusty-gas
Modeling and Simulation of Membrane Structure and Transport Properties 39

equations (see, for instance, Reference 4 for furtherdiscussion):
–1
RTrpi ¼
Xn
j¼1
j 6¼i
xj Ni – xiNj
Dij ;eþ Ni
DKi;e; i ¼ 1; . . . ; n ð14Þ
where Dij,e is the effective ordinary or bulk diffusivityof the (ij) pair and DKi,e is the effective Knudsendiffusivity of component i. A common way to expressthe effective diffusivities is through
Dij ;e ¼"��B
Dij ð15Þ
and
DKi;e ¼"��K
DK �rp
� �ð16Þ
with �r P given by Equation (5). In Equations (15) and(16), "� is the accessible porosity whereas the tortu-osity factors, �B and �K, are the same as those used inEquations (4) and (8). In fact, the statement that thetortuosity factor for self-diffusion in the bulk diffusionregime is the same with that for binary diffusion is notof obvious validity. However, this has been verifiedexperimentally and confirmed theoretically bySotirchos and Burganos [16] following a rigorousspectral analysis treatment of multicomponent diffu-sion in pore networks combined with the effectivemedium theory and the smooth field approximation.More specifically, it was proved by Burganos andSotirchos [17] that the diffusional resistance of a net-work of pores of nonuniform size is, to an excellentapproximation, practically identical to that of a net-work of uniformly sized pores with the same topologyas that of the original network, provided that theeffective pore diffusivity is calculated from the effec-tive medium theory equation. Once homogenized, theoverall effective diffusivity can be obtained in astraightforward fashion; for instance, the smoothfield approximation can be used as it becomes exactfor regular networks of pores. If this methodology isapplied to multicomponent mixtures [16], similarexpressions and conclusions can be extracted using aspectral analysis and it turns out that not only theKnudsen tortuosity factor but also the bulk tortuosityfactor is the same for each component. This is a veryconvenient observation that simplifies tremendouslythe measurement or computation of tortuosity factorsas they need to be determined only once, for anyspecies, and can then be applied to the rest of themixture components as well.
For nonideal mixtures, the multicomponent diffu-sion equations must be modified to include the
chemical potential gradients in place of the partial
pressure ones. The flux equations can then be recast
in the form
–xi
RTrTi ¼
Xj 6¼i
xj Ni – xi Nj
ct Dij ;eð17Þ
in the absence of pore walls, with ct the total concen-tration of the mixture [18]. The Gibbs–Duhemequation implies that only n – 1 of Equations (17)are independent, since
Xn
i¼1
cirTi ¼ rp ð18Þ
In the presence of pore walls and under the action ofexternal forces (here, electrostatic force), the flux
equations take the form
–xi
RTrT ;pi –
xi
RTVirp –
xi
RTzi Fr�
¼Xjþi
xj Ni – xiNj
ct Dij ;eþ Ni
ct DKi;eð19Þ
where Vi is the partial molar volume of species i, F isthe Faraday constant, and � is the electrostaticpotential (see [18] for a discussion). The total pres-sure gradient that applies in addition to thecomposition gradient gives rise to viscous flow ofthe mixture and, hence, to convective fluxes foreach component that are additive to the diffusivefluxes. For ideal gases, it has been shown followinga similar spectral analysis for multicomponent con-vective diffusion in pore networks as the onementioned above and applying the effective mediumtheory followed by the smooth field approximation,that a single tortuosity factor is required for theconvective part of the fluxes, which is the same forall components [19]. For nonideal gases, in the pre-sence of viscous flow the flux equations become
–ci
RTrT ;pi –
ci
RTVirp –�i 9ci
B0
�BDKi;erp – cizi
F
RTr�
¼Pnj¼1
xj Ni – xi Nj
Dij ;eþ Ni
DKi;eð20Þ
where ci is the molar concentration of component i,�i9 is a viscous selectivity parameter, B0 is the per-meability of the membrane, and Dim is the diffusioncoefficient of component i in the interior of themembrane [18, 20]. It is accepted that viscous flowhas some separative effect on the mixture transport
40 Fundamentals of Transport Phenomena in Membranes

through the membrane: larger molecules will tendto move close to the center of the pore, whereassmaller molecules may more easily stay closer to thewalls and attach to them depending on their size andon physicochemical interactions. Needless to say,flow may also induce a straining or sieving effecton the mixture transport since larger molecules maybe driven to stationary regions of flow due to inertia,where they may get trapped, whereas smaller mole-cules are more likely to follow the streamlines (inthe absence of diffusion) and be transmitted over tothe permeate side.
The case of micropore diffusion is of particularinterest in the context of membrane-based gas
separations. Given the very small size of the pores
(< 2 nm), which in this case is similar to that of
penetrant molecules, the gas–wall interactions
become dominant (configurational diffusion) and
hopping from sorption site to sorption site becomes
the main mechanism of transport. This surface
diffusion mechanism is obviously affected by the
availability of vacant or occupied sites and the
dusty gas equations now assume the form [18]
–ri ¼ RTXn
j¼1
�j
ui – uj
Dij ;Sþ RT�nþ1
ui – unþ1
Di;nþ1;S; i ¼ 1; . . . ; n
ð21Þ
where �ri is the surface chemical potential gradi-ent, ui is the velocity of species i, �i is the fractionaloccupancy of the sorption sites by component i, and�nþ 1 is the fraction of unoccupied sites
�nþ1 ¼ 1 –Xn
i¼1
�i ð22Þ
The relation of the chemical potential gradients tothose of the surface occupancies is usually cast in the
form [18]
�i
RTri ¼
Xn
j¼1
�ijr�j ð23Þ
where �ij is a thermodynamic factor defined as
�ij ¼ �i
@lnpi
@�j
; i; j ¼ 1; . . . ; n: ð24Þ
The missing link between occupancies and partialpressures of the various components is provided
by the adsorption isotherm for the particular
mixture.In terms of the surface fluxes, Ni,s, the dusty gasequations for micropore diffusion of multicomponent
mixtures become
–�i
RTri¼
Xn
j¼1
j 6¼i
�j Ni;s–�iNj ;s
p"�qsatDij ;Sþ Ni;S
p"�qsatDi;S;i¼1;...;n
ð25Þ
where p is the fluid density, qsat is the saturationconcentration, and subscript S denotes surface terms.An excellent review of the Maxwell-Stefan approachto mass transfer along with a detailed presentationand discussion of the aforementioned equations aregiven in [18].
Membrane structure connectivity and pore-blocking effects have also attracted the interest ofinvestigators in microporous membrane separations[21]. These flux relations find extensive use in appli-cations that involve gas sorption and diffusion inzeolites. However, it must be stressed that this phe-nomenological approach, although quite useful inguiding experimentalists, provides no informationon the magnitudes of the diffusion coefficientsmuch less on their dependence on the membranematerial and structure or on the externally appliedconditions of separation. Any progress on this issuewould require investigation of the internal porestructure of a membrane and switching scale ofobservation down to the pore or grain scale, asdescribed next.
1.03.3.2 Pore-Scale Modeling
The need to have quantitative estimates of the trans-port coefficients in porous materials inspired a largevariety of simplified descriptions of their internalstructure.
1.03.3.2.1 Pore models
The simplest and earliest attempts involved theassumption of straight, uniform, parallel capillariesspanning the interior of the material in the directionof macroscopic transport. Although overly simplis-tic in concept, this model has been adopted bynumerous investigators, who had to invoke a correc-tion factor in their calculations that would accountfor the usually complex structure in actual porousmedia. This is also a very attractive model forexperimentalists, as they only need to measure thistortuosity factor once for each material sample and,thus, achieve a simple transformation from thetransport property in the absence of walls to theeffective one that reflects the interactions of thepenetrant species with the pore walls. Despite thecriticism that such an oversimplification has
Modeling and Simulation of Membrane Structure and Transport Properties 41

experienced, it appears that in certain cases of mod-ern membrane technology and applications, itsemployment offers a quite realistic representationof the actual situation. More specifically, severalproduction routes in the food and pharmaceuticalindustries demand narrow droplet or particle-sizedistributions that can be provided by membraneswith almost uniform, parallel pores of constantcross section. The manufacturing of such idealisticmembranes is already in the market and, obviously,among all other practical advantages that they offer,they also allow a relatively straightforward physicaldescription and mathematical modeling of thetransport phenomena that underlie the membraneoperation (typically, emulsification in a wider senseof the term). It is interesting to note that this is theonly, practically, case in which the tortuosity factorbecomes approximately equal to 1, provided ofcourse that the transport coefficient is not depen-dent upon the pore size or the species concentration.A typical example is that of ordinary diffusion of atrace component in pores with sufficiently largediameter to exclude activated or configurationaldiffusion phenomena. Then, the transport rate, _N k ,through any capillary i would be given from
_Nk ¼ –Dk�rk2 �ck
Lð26Þ
where rk is the radius of capillary k, Dk is the diffusivityof this species in capillary k, �ck is the concentrationdifference between exit and entrance faces, and L isthe length of the capillary in the direction of transport.The transport flux is then given by
ND ¼
Pk
_Nik
A
¼ – �
PDkrk
2
A
�c
L
ð27Þ
where the concentration drop is assumed to be thesame for all capillaries (uniform concentration acrossthe entrance and across the exit face). If the diffusiv-ity is independent of the pore size, then Equation (27)becomes
ND ¼ – "D�c
Lð28Þ
which by comparison with Equation (8) implies that�B¼ 1. This result is valid not only for uniformcapillaries but for distributed sizes also providedthat all capillaries are parallel to the macroscopictransport direction and do not overlap.
Similar results can be obtained for other transportmechanisms in parallel, nonoverlapping pores, pro-vided that the transport coefficient does not dependon the pore size or the local pressure or concentra-tion. This is, for instance, the case of viscous,incompressible flow of liquids in membranes. For anideal gas flowing in a cylindrical capillary under theaction of a pressure gradient in the z-direction, theflux expression reads
Nv ¼ –r 2p
8RT
dp
dzð29Þ
The overall flux can then be found in a fashionsimilar to that used above for the diffusion case. Tobecome more realistic, pore models evolved intomodels of multidimensional arrays of parallel pores,overlapping or nonoverlapping. In the latter case, thetortuosity factor was shown to equal 2 for two-dimensional sets of pores provided that the concen-tration gradient vector lies on the plane that isdefined by the pore axes, and 3 for three-dimensionalsets of pores, provided that the transport coefficient isorientationally averaged [17]. This simple and con-venient result is valid not only for single or binarydiffusion but also for multicomponent diffusion as itwas shown by a spectral analysis method thatemployed the effective medium theory followed bythe rigorous application of the smooth field approx-imation [16].
However, if the pores are allowed to overlap, thenthe simple flux expressions for individual capillariesbecome invalid and a different technique must beemployed. More specifically, if the ratio of the mole-cular size to the size of the pores or, in general, tosome characteristic size of the interstitial space in theinterior of the membrane is sufficiently small tojustify treatment of the traveling molecule as a math-ematical point and neglecting interactions with thepore walls other than diffuse reflection from them,random molecular trajectories can be computed, sub-ject to the prevailing conditions of transport. This isan effort that attracted the strong interest of investi-gators in the area of porous media in the 1980s andelucidated strongly the effects of pore structural fea-tures on the transport (mainly diffusion) coefficients.This technique, along with other techniques that canbe used for the simulation of flow and dispersion inporous membranes, is discussed in the next section.
The addition of spherical chambers to a network ofcapillaries introduces a rich variety of pore geometriesand interfaces into the pore-type representation of the
42 Fundamentals of Transport Phenomena in Membranes

structure of porous membranes. This can be done in awell-defined and ordered manner, like the introduc-tion of spherical chambers at the junctions of regularnetworks of capillaries [22, 23], or in a random, order-less fashion [24]. In both cases, one may assumeentirely random sampling of sphere and cylindersizes to decorate the network or prescribe some spatialcorrelation of sizes among chambers, among capil-laries, or among chambers and capillaries. Obviously,the prediction of transport coefficients in such porestructures has to resort to trajectory computations ornumerical techniques due to the inevitable appearanceof considerable overlapping among pore segments.Despite the increased complexity in the constructionof such pore space representations and in the predic-tion of their transport properties, they have foundextensive use in a wide variety of porous materials,including porous rocks, catalysts, membranes, etc. Themain supporting argument of their use is that theyappear to represent the pore space of a variety ofporous materials better than capillary networks do.In fact, optical or electron microscopy analysis ofconsolidated materials indicate the existence of largepore spaces that are interconnected through narrowpore necks. In addition, it is often convenient to repre-sent the nonsolid space of granular materials by acollection of large cavities and narrow interconnectors.Alternatively, these domains can also be representedby networks of pore necks with converging–diverginggeometry (for instance, sinusoidally shaped ends). Theformer is more suitable for unconsolidated materials,whereas the latter is usually employed for the descrip-tion of the interstitial space in low porosity,consolidated materials. Thanks to the limited poreoverlap in low porosity materials, the technique ofthe equivalent resistor network approximation can beused for the determination of the overall flow perme-ability or gas diffusivity [23].
Briefly, the resistor network approach proceeds asfollows. Suppose that the pore space of a membranecan be represented by a regular network of capillarieswith sinusoidally shaped ends [25]. The decorationof the network bonds with cylindrical segments isachieved through appropriate sampling from thepore-size distribution that results, for instance, fromthe intrusion part of the mercury porosimetry curve[22]. The chamber sites that define the sizes of thesinusoidal openings at the two capillary ends can besampled from the size distribution of large cavities asthey are recognized and quantified from optical orelectron microscopy analyses. The review of effortsfor the determination of the detailed pore topology is
beyond the scope of this chapter. It is noteworthy,however, that elimination of the diameter of a capil-lary renders the particular bond nontransmitting,thus reducing the local coordination number (i.e.,the number of bonds that meet at an intersection)by 1. Application of this pore-eliminating concept tothe entire network with a certain probability at eachneck allows easily the adjustment of the averagecoordination number to the desired value.Subsequently, the flow or diffusion rate in each indi-vidual pore is calculated with some numerical oranalytical technique. The application of the massconservation condition (Kirchoff’s law in the electri-cal resistor analog) gives rise to a set of linearalgebraic equations in terms of the pressure or con-centration value at each node of the network. Theseequations are complemented by the appropriateboundary conditions (usually fixed pressure or com-position at the entrance and exit faces, andperiodicity at the lateral faces) and solved numeri-cally using some conjugate gradient or Gauss–Seidelwith relaxation technique. Once the nodal values forthe pressure or the concentration are determined, theoverall transport property can be calculated in astraightforward manner from the definition of theeffective transport coefficient and taking into accountthe local pressure or composition differences across,usually, the array of those pores that are connected tothe exit face or across the entire network [23].However, care must be exercised before this techni-que is applied to membranes with micro- ormesopores since the continuum assumption may nolonger be valid and some discrete simulation techni-que may be more appropriate to use, as discussed inthe next section.
1.03.3.2.2 Grain models
The representation of the solid part of porous mem-branes by grain packings is a rather realistic approachin several cases, particularly when micro- or nano-powders are used as precursors of the finalmembrane. The construction of the grain model ofa membrane can proceed as follows. Initially, trans-mission electron microscopy analysis of the powderis performed and digital images are obtained. Imageprocessing and image analysis are nowadays possiblethrough appropriate software and allow the direct oralgorithmic counting of grains per unit projected areaor the measurement of the equivalent sphere dia-meters of the grains. Mercury porosimetry or gasadsorption–desorption can be used for the determi-nation of the accessible porosity and the specific
Modeling and Simulation of Membrane Structure and Transport Properties 43

surface area of the powder. Once these quantities,along with the grain size distribution, are known, apacking simulator can lead to the three-dimensionalreconstruction of the powder that will reproduce allthe aforementioned measurable properties.
Different packing models and simulators havebeen suggested in the literature (see, for instance,References 26–28). A typical one, using the ballisticpacking concept, would proceed as follows. First,spherical grain diameters can be sampled from theoriginal (prior to compaction and heating) powdersize distribution, which is obtained using image-processing software as described above.
Subsequently, gravity-driven packing can beapplied to simulate powder packing prior to compres-sion. In fact, any body force into a fixed directionwould give the same result for sufficiently large sys-tems, since gravity itself may not be the dominantexternal force for the nanopowder at hand. The dia-meters that have been sampled are assigned tospherical grains that are allowed to move in the direc-tion of the external force one at a time. Typically, arectangular vessel can be used as a physical containerof the nanopowder, and periodicity is applied in direc-tions that are normal to the direction of the externalforce. Once contact of the sphere with the bottom sideof the vessel is made, the sphere is immobilized and anew sphere is allowed to move along the direction ofthe external force. If the sphere touches anothersphere that has already been immobilized, a decisionmust be made as to whether it will stay there or willcontinue its trajectory. The criterion is certainlyrelated to the desired value of the porosity of thenanopowder, which is determined experimentally asdescribed above. Immediate immobilization upon firstcontact will lead to relatively high porosity values. Ifmore dense packings are sought, then the sphere isallowed to roll over the surface of the sphere that it hasencountered until it comes in contact with a secondsphere. At this position (two contact points) a decisionhas to be made as above. Depending on the actualpacking density, the sphere may get immobilized orroll over both spheres until it acquires a third contactpoint [29]. The sticking probability is common for allspheres and is chosen in a way that allows eventuallythe desired porosity value to be approached. In theaforementioned procedure, sorting of the spheres to bedropped with respect to their size is expected to affectsignificantly the outcome of the simulation regardingthe maximum density that can be achieved but alsothe homogeneity of the porosity across the recon-structed nanopowder. More specifically, if the large
spheres are dropped first, a relatively high value ofporosity will be initially obtained, which will be gra-dually lowered as smaller spheres are dropped andallowed to penetrate into the void space among thelarger ones. On the other hand, if the small spheres aredropped first, a relatively dense packing will be for-mulated that will remain practically unaltered by thesubsequent dropping of the larger spheres. In this case,density gradient packings will be generated whichmay or may not be realistic depending on the actualphysical process of generating the nanopowder.Alternatively, a Monte Carlo procedure can beemployed to generate random packings [27]: at eachstep, a set of N spheres is dropped simultaneously andonly the one that reaches the lowest position isretained as the new member of the stack. This proce-dure was found to perform satisfactorily forsufficiently large N (>105).
To simulate sintering of the nanopowder, which isusually required to improve the mechanical propertiesof the material, mass transfer between touching grainsmust be allowed. Different algorithms have been pre-sented in the literature for the construction of sinteredmaterials with increased grain sizes (see, for instance,the work by Roberts and Schwartz [28]). If electronmicroscope images of the actual sintered sample areavailable, the grain size distribution can be determinedusing an image-analysis technique and the numberdensity of grains per unit area can also be counted.This information can be used in the following way[29]. Rather than developing simulators of the masstransfer at the microscopic scale, a shortcut can bedevised, that allows partial or complete mass transferfrom smaller grains to larger grains provided they arein contact with each other. The decision as to whethercomplete, partial, or no mass transfer will be assumed isbased on the selection of a critical ratio of sizes of thetouching grains, which ensures that eventually thedesired grain size distribution and number density ofgrains are recovered. The smaller the critical size ratio(smaller to larger grain size) for mass transfer to occur,the more limited the extent of sintering and, hence, thesmaller the effect on the porosity and the grain sizedistribution. In order to capture also intermediatestages of the sintering process for two or more touchinggrains, incomplete mass transfer can be assumed tooccur in cases where the size ratios are within a specificinterval of ratio values. To increase the accuracy of thesimulations and to render the whole process morerealistic, the characteristic times of partial or completemass transfer can be employed either from experi-ments or from independent sintering models for
44 Fundamentals of Transport Phenomena in Membranes

touching grains. It has been observed that both thesintering temperature and the heating ramp can affectthe mass transfer process and its kinetics [30]. Such ashortcut approach circumvents the need to get into thedetails of the sintering process, as it is guided by directelectron microscope images of the sintered materialthrough a two-parameter procedure. Obviously, sev-eral variants of this methodology can be formulated butit is noteworthy that the outcome is in any case a three-dimensional granular structure with features that areconsistent with the actual ones and can directly lenditself to flow, mass transport, or sorption computationswithout having to resort to any arbitrary geometrical ortopological assumptions.
However, the lack of topologically ordered,straight conduits of transport in grain modelsexcludes the employment of the convenient resistornetwork technique for the calculation of effectivetransport properties. Numerical techniques must beused for the solution of the differential equations thatdescribe diffusion, flow, or convective diffusion sub-ject to the impermeable grain condition that is usuallyinvoked. If the grains themselves are porous, then aseparate treatment of the transport through them isrequired (for instance, Darcy or Brinkman equation)and the impermeable grain condition is replaced bythe continuity of flux at the grain surface. In additionto the numerical techniques that discretize the differ-ential equation (finite differences, for instance), othertechniques can also be used to solve the diffusion andflow problems in the space among the solid grains,like the lattice-Boltzmann technique, the DirectSimulation Monte Carlo (DSMC) technique, andthe transmission probability or mean-square displace-ment techniques. The advantage of these methodsover the more conventional numerical techniques isthat they can be used also in the case of elevatedKnudsen number, which is of strong interest inseparation applications involving porous membranes.These techniques are discussed in the next section.
1.03.3.2.3 Fiber models
The use of fibrous materials for the construction offilters, membranes, and electrodes for diverse appli-cations is quite common. Reconstruction of suchmaterials on the computer can be implementedusing either finite-length fibers or infinite lengthfibers of distributed diameter in the sense that thefibers extend across the entire control volume.Image-analysis techniques can also be used just asin the grain model case above for the determinationof the fiber length and diameter distributions. Of
particular interest here is the possible correlation oflength to diameter for the same fiber, which mayobviously affect not only the porosity value but alsothe transport properties. An additional parameter inthe fiber models is the orientation of the fibers, whichis obviously not an issue in the spherical grain mod-els. Bundles of parallel fibers in one, two, or threedimensions can be assumed with the same or differ-ent number density per unit volume in eachdirection. Alternatively, systems of randomlyoriented fibers can be employed with structural char-acteristics that are similar to those of thecorresponding randomly oriented capillaries. In fact,it is straightforward to transfer structural propertiesfrom the pore model to the corresponding fibermodel, considering that each of them is the negativeof the other. Porosity in the former is equal to thesolid fraction in the latter; specific surface area is thesame, and so on. Of course, the transport properties ofthe two classes of models are quite different since thefluid will use the pores as conduits of transport in thepore models and the void space among the fibers inthe fiber models. As a result, the resistor networkapproach cannot be applied in the case of fibrousstructures due to the lack of straight conduits oftransport as is the case in the pore models.Diffusion and flow in fiber models can be describedby the corresponding differential equations in thecontinuum limit, which can be solved using somenumerical method (finite differences, finite elements,etc.). The lattice-Boltzmann technique can also beemployed to this end and can deal with both flow andconvective diffusion problems as mentioned in theprevious section. As the Knudsen number increases,the continuum approaches can no longer be used asrarefaction effects must be taken into account. Themolecular trajectory technique is very convenient todescribe diffusion at elevated Kn values and will bedetailed below to a degree that it can be useful forapplications in porous membranes. The same holdsfor the lattice-Boltzmann technique, which can alsobe modified to account for rarefaction effects. Allthese transport phenomena, namely, diffusion ofmulticomponent mixtures, flow, and convective dif-fusion at elevated Kn values, can also be treated bythe DSMC method. These mesoscopic techniquesare discussed in the next section.
1.03.3.2.4 Digitized structure models
If the geometry of the structural features of themembrane does not resemble that of some classicalshape (cylinder, sphere, ellipsoid, etc.) or if the
Modeling and Simulation of Membrane Structure and Transport Properties 45

history of the membrane synthesis route (forinstance, preparation of nanopowder, compaction,thermal sintering etc.) is not known, then a differentclass of structure representation techniques can beused that produce three-dimensional digital arrays ofsolid and void voxels. If the actual porous membranesample can be mapped onto a discrete array of 1 (forvoid) and 0 (for solid), a very convenient representa-tion of the internal structure can be obtained, that canbe subsequently used directly for the numerical solu-tion of the transport equations or for the applicationof various transport simulation methods. Anotheradvantage of such reconstruction procedure is thatno explicit assumption regarding the shape or con-nectivity of the structural features is required. Inaddition, in the case of asymmetric membranes,these techniques can offer distinct digital representa-tion of each layer separately as it has been alreadydemonstrated in the literature [31].
A variety of reconstruction techniques haveappeared over the last decade, most of which arebased on much older reconstruction concepts.However, because of the clear advantage that theyoffer compared to pore or grain models on the onehand and their significance for the accurate repre-sentation of microstructural features in membranescience on the other, a tremendous growth of interestin this direction was noted recently. The serial sec-tioning or serial tomography technique couldtheoretically offer a direct description of the internalstructure of a porous or, in general, biphasic material,provided that the characteristic size of the structuralfeatures is larger than the distance between succes-sive sections and than the pixel size that is used todiscretize the image of each section. Although thistechnique has been applied successfully to geologicalmaterials (e.g., References 32 and 33) and in diagnos-tic medicine, resolution issues arise in the case ofmembranes. In addition, the need to performrepeated, physical sectioning (or, rather, polishing)of the material at equidistant depth levels renders thetechnique impractical. A serious additional difficultyis associated with the need to align the various phy-sical sections with sufficient precision and withtolerance that should be only a small fraction of thepixel size.
The stochastic reconstruction of porous structuresfrom single images is free of the aforementioneddrawbacks and, therefore, has attracted the stronginterest of investigators in the area. In general, theprocedure involves the following steps. First, an opti-cal or electron microscope image of some section of
the material is obtained. Obviously, in the case ofmembranes, electron microscope images of sufficient
resolution are needed to ensure capture of the smal-lest relevant size scale. A second requirement is that
this section be representative of the membrane struc-
ture, which, in turn, implies sufficiently large size ofthe section and care to avoid nontypical segments of
the material. If the material is suspected to beinhomogeneous or anisotropic, as is the case of asym-
metric membranes, then multiple images are neededwith different orientation and within each distinct
layer. The second step involves some image proces-sing and analysis. Specifically, the images are scanned
and saved in electronic form if not directly done soby the electron microscope software. The image files
are then passed through convolution filters andthrough filters that enhance the contrast at the
boundaries between the two phases. The color values
in each pixel are then replaced by the binary values,1 or 0, that indicate majority occupation of the pixel
by void or by solid matter, respectively. The phasefunction of the material is then defined as follows:
( )z x =1 if x belongs to the void space
0 otherwiseð30Þ
where x~
is the position vector. Obviously, the poros-ity of the material section can be obtained in astraightforward manner through the expression
" ¼ hzðx~Þi
where the averaging process involves all pixels on theimage. Note that the porosity that is obtained in thisway involves both the accessible and the inaccessiblevoid volumes. Further structural properties of thebinarized structure can be obtained from the calcula-tion of the n-point correlation function. The 2-pointor autocorrelation function contains already a signif-icant amount of information concerning the phasedistribution on the particular section as it maps thedistance between two pixels on the probability ofthese pixels to share the same value of the phasefunction (i.e., to lie in the same domain, void or solid).
The normalized autocorrelation function is givenby
Rzðu~Þ ¼
�ðzðx
~Þ – "Þzðx
~þ u
~Þ – "Þi
" – "2ð31Þ
and for isotropic structures it becomes one-dimen-sional as it is a function of the distance u ¼ ju
~j only.
46 Fundamentals of Transport Phenomena in Membranes

Needless to say, higher order correlation functionscontain further structural information regarding theparticular material but at the same time they com-plicate the stochastic reconstruction process.
The next step is the generation of three-dimen-sional binary arrays that represent in a discretized
form the biphasic material. The elements of this
array must be such that the porosity and any desired
moment of correlation function are satisfied. The early
efforts in this direction employed conditioning and
truncation of random Gaussian fields [33–35] with
encouraging results regarding both the visual resem-
blance of the reconstructed materials to the actual
ones and the agreement of the calculated transport
properties with the measured ones. However, this
method lacks the flexibility to satisfy further moments
of the correlation function beyond the first two (por-
osity and autocorrelation function). As a result,
biphasic materials with some ordering or correlation
in their interface shape, like granular or fibrous media,
cannot be successfully reconstructed with this method.
A more complicated option would be to include sev-
eral moments of the correlation function, or,
alternatively, other distribution functions that can be
measured or computed on the original actual image
like linear path, chord size etc., in the objective energy
function that is to be minimized. Such a simulated
annealing procedure – in the sense that a minimum
energy configuration is pursued [36] – can lead to
quite satisfactory reconstructions of the material at
the heavy expense, of course, of computational time.An alternative stochastic reconstruction technique
that exploits only porosity and autocorrelation data
but appears to satisfy implicitly more structural
properties than does the Gaussian field method is a
technique that generates three-dimensional binary
arrays that follow fractional Brownian motion (fBm)
statistics. This method has been applied with con-
siderable success not only to geological media but
also to multilayered ceramic membranes, as dis-
cussed below. Briefly, the main concept is based on
the definition of fBm [37] as a process that satisfies
hBH ðx~Þ – BH ðx
~0Þi ¼ 0
h½BH ðx~Þ – BH ðx
~ 0Þ�2i ¼ jx
~– x
~ 0j2H
where H is the Hurst exponent. The term fBmis indeed relevant if one notes that for H¼ 1/2,the classical Brownian process is recovered.Depending on the H value, uncorrelated or
correlated structures can be generated, the degreeof correlation being a monotonic function of theH value. In the context of transport in porousmedia, this technique was first employed to repro-duce correlated permeability maps for large-scalegeological media but following Kikkinides andBurganos [38, 39], it can be applied also to thestructure itself replacing the local permeabilityvalue with the binary index of the correspondingpixel (or voxel) in digitized porous materials. Onefirst assigns random numbers from a Gaussiandistribution with average 0 and standard deviation1 to the corners of a cubical domain that is meantto contain the sample to be reconstructed. Analgorithm that assigns sequential averages tointernal positions of this cube is used, thusincreasing progressively the space discretization.The value of the Hurst exponent, H, is selectedsuch that the autocorrelation function that isdetermined on the image of the actual, physicalsection is recovered to a satisfactory degree.However, such a reconstruction would contain alimited number of pores in each realization sincetheir characteristic size is of the same order ofmagnitude as the correlation length. To circum-vent this problem, the working domain can bedivided into a number of smaller cubes, each ofwhich becomes the starting cube for the applica-tion of the fBm process. To ensure smoothinterweaving, the lattice nodes that lie at theboundaries between these cubes receive contributionfrom all immediately neighboring cubes. Moredetails on this procedure can be found in the articlesby Kikkinides and Burganos [38, 39]. Typical exam-ples of a reconstructed porous material using thefBm procedure are shown in Figure 2 for variousvalues of the Hurst exponent. This technique hasbeen applied to asymmetric alumina membraneswith very satisfactory results [31]. More specifically,all the three layers of the membrane have beenreconstructed in three dimensions using only oneimage per layer. The generated structures werefound to resemble closely the actual ones and thecalculated permeability values were very similar tothe measured ones. It is expected that the methodcan be applied to several other types of membranematerials, not only porous ones, but also, more gen-erally, biphasic ones, such as crystalline–amorphouspolymer blends.
The aforementioned reconstruction techniquescan be applied to membrane materials with charac-teristic pore sizes that can be visible on electron
Modeling and Simulation of Membrane Structure and Transport Properties 47

microscope images. If the characteristic size is in thenanoscale range, then an alternative technique can beused to extract the autocorrelation function.Specifically, for isotropic materials, small angleneutron scattering experiments can provide in animplicit manner the autocorrelation function,according to the equation [40]
I ðqÞ ¼ 4� 2V
Z 10
r 2�ðrÞ sin qr
qrdr ð32Þ
where V is the volume of the material sample, is thescattering length density, �(r) is the density fluctua-tion autocorrelation function, and q is the scatteringvector, given by
q ¼ 4� sin �
for isotropic scattering. Applying the inverse Fouriertransform to Equation (32), the density fluctuationautocorrelation function can be obtained, which, inturn, can lead to the determination of the two-pointcorrelation function from [40]
RzðuÞ ¼ �ðuÞ þ "2
Once the autocorrelation function is known, the restof the reconstruction procedure can be applied asdescribed above, provided of course that the porosityof the membrane is experimentally available.
1.03.3.3 Mesoscopic Transport Simulation
With the exception of some simplified representa-
tions of the internal structure, such as the regular
networks of cylindrical pores, for instance, which
can be treated with continuum flux models, the
majority of membrane reconstructions or structural
models require the employment of some computa-
tional technique for the treatment of the transport
phenomena that take place during separation. This
intermediate scale of study is of key importance for
the understanding and the quantification of the rela-
tionship between the structural features of the
membrane with its end properties. These techniques
can also yield useful estimates of the transport or
sorption properties within finite regions inside the
membrane, which can then be included in local flux
expressions prior to integration toward the macro-
scopic scale. The presentation of the various
transport models and simulation techniques that
follows is focused on the features that are of particu-
lar relevance to porous membranes. These models
assume that the atomic-scale fluid–membrane inter-
actions are lumped into interaction factors that enter
the simulation as boundary conditions, thus avoiding
the need to rescale the window of observation into
and out of the atomic description of the solid phase.
In a later section, such hybrid techniques are also
(a) (b)
(c) (d)
Figure 2 Reconstructions of a porous material using the fractional Brownian motion method: (a) H¼ 0; (b) H¼ 0.1; (c)
H¼0.5; and (d) H¼0.99.
48 Fundamentals of Transport Phenomena in Membranes

discussed in the context of multiscale modeling andsimulation.
1.03.3.3.1 Trajectory techniques
If the molecular size is much smaller than the poresize, one can treat the gas molecule as a mathematicalpoint (dimension 0) that travels in the pore space ofthe membrane. In fact, since as it was mentionedabove the solid surface effects are assumed to belumped into effective parameters of reflection onlyand affect negligibly the molecular motion in thebulk, these trajectories proceed in straight pathsbetween successive collisions in the gas phase orwith the solid walls. The relative frequency of thetwo types of collision is a function of the Knudsennumber. Such techniques were first used for thecalculation of the diffusion coefficient in the bulkphase in the absence of solid surfaces, whereas theiremployment in the estimation of effective diffusioncoefficients in porous materials started in the 1980s.Thanks to their generic character, these techniquescan be directly applicable to porous membranes toprovide tortuosity factor values that can then be usedin the flux models as explained above. In practice,they can be simplified to account only for gas–wallcollisions given that the pore size in actual mem-branes corresponds to large Knudsen number (freemolecule flow regime) or to the configurational dif-fusion regime, which is known to yield sufficientlyhigh separation factors. One can proceed in twodifferent ways to calculate the tortuosity factor in aporous membrane with this type of techniques: cal-culate the transmission probability using moleculartrajectories or calculate the mean square displace-ment of a large number of test molecules per unit oftravel time.
Transmission probability method. Let F1 and F2 be thetwo opposite faces of the working domain that repre-sents a portion of a porous membrane sample(Figure 3) and assume that the concentration of agas species is maintained constant at values c1 and c2,respectively. The concentration drop that is, thus,created gives rise to diffusion in the x-direction,which is normal to the two faces. Suppose that anumber of gas molecules are released from the voidpart of face F1 per unit of time into the void space ofthe working domain. At equilibrium, this rate isobviously proportional to the concentration c1
according to the kinetic theory. These moleculeswill travel in the void space of the sample collidingwith each other and with the pore walls until they
either reach the opposite face F2 (and exit the sample)or return after some travel to the entrance face F1 andexit through it. The fraction of molecules that exitthrough face F2 will provide a measure of the trans-mission probability, fT. The effective diffusivity inthe x-direction will then be given by [41–43]
Dx;e ¼fTLx �u
4
where Lx is the length of the working domain in thex-direction and �u is the mean thermal speed of thegas molecules. More rigorously, one should con-sider the limit of Lx!1 in the above equation toensure that the effective diffusivity value is not afunction of the size of the working domain. In prac-tice, this limit is attained when Lx becomes a fewtimes larger than the correlation length of the struc-ture. The precise value of required Lx dependsstrongly on the Kn value: if the Kn value increases,the molecules take longer paths between successivecollisions and reach the exit faces increasingly fasthaving increasingly smaller opportunities to explorethe interior of the structure and, thus, to furnishinformation about the tortuosity of the availablepathways; as a result, longer samples in thex-direction are required.
Some interesting features of the molecular trajec-tories in the pore space are presented next. Thedistance, 9, between successive collisions in the gasphase is sampled randomly from a Poisson distribu-tion with mean that is equal to the actual mean freepath, , of the gas at the actual pressure and tem-perature of the process. This is accomplished withthe help of the expression
9 ¼ – ln Rf ð33Þ
where Rf is a random number in the interval (0,1).At the new position, the molecule is assumed to
F1 F2
Lx
N1 fTN1
Figure 3 Schematic representation of trajectory
approach for the calculation of effective diffusivities in
porous materials.
Modeling and Simulation of Membrane Structure and Transport Properties 49

suffer a collision with another molecule and con-tinues its trajectory into a randomly selecteddirection. A new free path 9 is calculated fromEquation (33), and the procedure is repeated untileventual exit of the molecule through any of thetwo opposite faces, F1 or F2. A new test moleculeis injected into the working domain; its trajectoryis computed as described above, and so on, until asufficiently large of test molecules has been usedto eliminate statistical errors in the calculation ofthe transmission probability, fT, with an accepta-ble tolerance. If it happens that the moleculeencounters some solid wall prior to reaching theend of the path 9, then its path is interruptedand a molecule–wall collision is allowed to occur.Typically, a random reflection is assumed in thesesimulations, which is compatible with the cosinelaw of reflection (diffuse reflection law). In fact, ithas been shown [23] that if a different reflectionlaw is used, then the effective diffusivity in thepositive x-direction is different from the one inthe negative x-direction, thus inducing sense ani-sotropy in the diffusion process. If the moleculehits any of the faces of the working domain thatare parallel to the mean diffusion direction, thenthe molecule is allowed to reenter the domainfrom the opposite face retaining its direction (per-iodic boundary conditions).
If the same procedure is repeated in the y- andz-direction, the values of the effective diffusivityin these directions are obtained, Dye and Dze,respectively. To overcome possible anisotropydifficulties that may arise artificially due to thefinite size of the working domain, the orientation-ally averaged effective diffusivity is calculatedfrom
De ¼1
3Dxe þ Dye þ Dze
� �
However, although this is quite meaningful for por-ous materials in general, in the particular case ofporous membranes that are used for, say, a specificgas separation, structural anisotropy is far from rareand one should confine the computation of the effec-tive diffusivity in the direction of the concentrationgradient, provided that the membrane thickness ismuch smaller than its width, which is typically thecase in practical applications.
Mean-square displacement method. The transmissionprobability method bases the calculation of the effec-tive diffusivity on the final outcome of the simulated
trajectories of a number of test molecules without any
reference to the time that is required by each mole-
cule to reach any of the opposite faces, either the
entrance (F1) or the exit (F2). Consequently, surface
roughness effects are of no importance in this method
provided that the characteristic roughness scale is
sufficiently small to exclude alteration of the trajec-
tory and to limit its role to the time delay of the
molecular motion only. The mean-square displace-
ment method does account for the time that elapses
during the motion of the test molecules in the inter-
ior of the membrane structure [44–46]. The
molecules are released in this case at randomly
selected positions in the interior of the working
domain and not on some of the external faces. The
trajectory computations are performed in a similar
manner to that in the transmission probability
method except that periodicity is applied to all
faces of the working domain. Thus, the trajectories
are not terminated when crossing any of the external
faces but only when a fixed travel time, t0, has
elapsed, which is common for all the test molecules.
The effective diffusivity in, say, the x-direction is
then calculated from
Dxe ¼ limt0!1
�x2h i
2t0ð34Þ
where �x is the displacement of a molecule in the x-direction from its initial position after the time t0 haselapsed and the average is taken over the entireensemble of test molecules used in the simulation.Time is easily tracked through the speed of thetraveling molecules, which is usually assumed to beconstant and equal to the thermal speed. In fact, it hasbeen shown that the incorporation of the Maxwell–Boltzmann distribution of molecular speeds in thistype of simulation has a negligible effect on the valueof the effective diffusivity [47–50]. To ensure that theeffective diffusivity estimate is not a function oftravel time, sufficiently large travel times must beallowed in the simulation according to Equation (34).For short travel times, traveling molecules do nothave the opportunity to explore statistically adequateregions of the membrane structure and the mean-square displacement is not proportional to the traveltime no matter how many test molecules are used.This has given rise to some confusion in the litera-ture as certain investigators have included thisphenomenon of nonlinearity in the more generalnotion of anomalous diffusion, which, however, is
50 Fundamentals of Transport Phenomena in Membranes

not the case here. The orientationally averaged effec-tive diffusivity is obtained from
De ¼ limt0!1
�2h i6t0
where � is the displacement of a test molecule fromits initial position after time t0.
Coding of this algorithm is not complicated andthe resulting software can be parallelized to reducesignificantly the computational time, thanks to thefact that each test molecule is treated independentlyof the others. This is not to imply that molecularinteractions are neglected since, as it was mentionedabove, the molecular collision frequency is taken intoaccount through the fact that the molecular motion isinterrupted at distances that are randomly sampledfrom the Poisson distribution of free paths with meanequal to the mean free path. This technique is alsoapplicable to, practically, any type of pore structurethat can be generated either with the help of somegeometrical feature (grain, fiber, pore, etc.) model orthrough the application of some reconstruction tech-nique [51]. In the former case, some analyticalfunction is used to describe piecewise the solid–void interface and the intersection of the molecularpathway with it is obtained as the (x, y, z) point thatbelongs to both the interface and the line of themolecular path and is closest to the starting positionfor this step. In the latter case, the medium is dis-cretized into unit cubes (or volume elements, voxels)and the molecule–wall collision sites are found in asimilar manner. Thanks to the straightforwardapplicability of this technique to any pore structure,it has become possible to study the effects of variousstructural features on the tortuosity factor of themembrane material, including most notably those ofthe spatial correlation among pore or grain sizes. Infact, it has been shown that size correlation leads toincreased diffusion coefficients, the precise degree ofthis increase being a function of the degree of corre-lation, the type of the structural elements, theirordering and topology and so on [24].
1.03.3.3.2 Direct simulation Monte Carlo
method
The DSMC method is a stochastic process that issuitable for the simulation of flow and convectivediffusion of gases even at nonzero Knudsen numbervalues, where the continuum limit is not fully vali-dated. In essence, it can be considered as smart andvery efficient molecular dynamics with stochastic
Monte Carlo ingredients. It avoids the need to solvethe equation of motion at the atomic scale or con-struct equilibrium configurations using microscopicflow fields. It also sidesteps the meaningless integra-tion of the straight portions of molecular trajectories.DSMC is an off-lattice pseudoparticle simulationmethod, originally suggested and developed by Bird[52]. The main concept is that instead of attemptingto follow the evolution of the actual number of mole-cules in a control volume, to monitor the trajectoriesof only hundreds of thousands or millions of pseudo-particles that mimic the trajectories of actual mole-cules using some lumped parameters.
The state of the system is defined by the positionsand velocities of a set of such pseudo-particles thattravel and collide with each other in a fixed workingdomain, which is discretized using a certain numberof cells. The average cell size is of the order of /3,where is the mean free path of the molecules at theprevailing conditions of pressure and temperature.This is required in order to be able to resolve largegradients of pressure in flow problems with realisticviscosity values. The system evolution is decom-posed into two relatively uncorrelated subprocesses,namely, that of molecular translation and that ofintermolecular collisions. Implementation of thesesubprocesses involves four distinct steps in the courseof the simulation:
1. Collisionless convection of particles during the time
interval �t. Initially, the particles are assignedvelocities with random orientation and magni-tudes sampled from the Maxwell–Boltzmanndistribution. The time �t is chosen to be smallerthan the collision time for the particular gas underthe particular pressure and temperature condi-tions. Since some of the particles will findthemselves outside their own cells or even outsidethe working domain, it is required at this point toimpose boundary conditions and also define theway of calculating macroscopic quantities. This isalso dictated by the fact that some of the particleswill experience a wall collision within this timeinterval. The molecule–surface interactions aremodeled through the employment of someaccommodation coefficient.
2. Indexing and tracking of the particles. This is animportant step in the DSMC simulations since asignificant portion of the particles may haveswitched cells during the convection step.
3. Intermolecular collisions using a stochastic approach.During this step, a fraction of the particles will
Modeling and Simulation of Membrane Structure and Transport Properties 51

suffer collisions with other particles. In contrast tothe molecular dynamics technique, pairs of parti-cles are chosen randomly and the collisionprobability is calculated for each pair. If this prob-ability, which among others is a function of thevelocities of the two particles, is greater than athreshold value, the collision is allowed to occur;otherwise, the two particles assume their convec-tion-defined positions. To expedite calculations,the no-time-counter approach is usually adoptedaccording to which a preselected number of colli-sions will be allowed to take place, thus avoidingthe tracking of time along the sequence of inter-molecular collisions. To increase the accuracy ofthe computations, the collision frequency isdefined at the cell level but the colliding pairsare selected within subdivisions of the cells, calledsubcells. In this way, pairs of molecules that are inclose vicinity to each other are preferentiallyselected to produce a collision.
4. Calculation of macroscopic quantities. During this stepall macroscopic properties of interest are calcu-lated within the various cells, hence producing amap of these quantities across the workingdomain. These averages can be taken spatially ortemporally depending on the application and onthe role of the corresponding quantities in theparticular process.
Following molecule–surface collisions, the typicalchoices for the selection of the new direction arediffuse (random) and elastic (specular) reflections.The former results in no-slip flow for dense gases(Kn.0) but produces some finite slip velocity for rar-efied gases. Other accommodation coefficients can alsobe used but their detailed discussion is beyond the
scope of this chapter. Instead, it is worth noting thatDSMC is a very useful tool for the simulation of
viscous flow of rarefied gases, the application ofwhich to porous membranes would add significantly
to our understanding and quantification of rarefiedflows in the presence of pore walls. In fact, althoughother numerical techniques can also be used in this
context, DSMC is particularly attractive as it can beeasily combined with pixelized media and digital
reconstructions in contrast to certain other numericaltechniques that become quite complicated when itcomes to treat complex boundaries. In addition,
depending on the boundary conditions (pressure and/or concentration differences) at the two faces of the
membrane, DSMC yields local pressure and concen-tration fields, velocity fields, permeabilities, anddiffusivities for sufficiently narrow-pore structures
that correspond to elevated Kn values.An example of the application of the DSMC
method to the flow of N2 in a porous membranethat is reconstructed using the fBm stochastic recon-struction technique (H¼ 0.99) is shown in
Figure 4(a). The Knudsen number at the exit is setto 2.5. For the sake of comparison, the flow field for
the same gas under the same conditions and the sameporosity but H¼ 0 (uncorrelated structure) is shownin Figure 4(b). The ratio of the permeabilities in
these two cases is equal to 6.23. Note that the perme-ability ratio at the continuum limit is 9.87. Thus, it
appears that flow simulation techniques, such asDSMC, that can treat rarefied gases in tight pore
structures may prove extremely useful in the predic-tion of the actual permeability of porous membranesand guide the design of new or modified materials
with increased separation factors.
(a) (b)
Figure 4 Flow field in a reconstructed porous material (fBm) using the direct simulation Monte Carlo method. (a) H¼ 0.99and (b) H¼ 0.
52 Fundamentals of Transport Phenomena in Membranes

1.03.3.3.3 Lattice-Boltzmann simulation
of flow in porous membranes
The lattice-Boltzmann technique has historicallyevolved from the lattice gas model originally suggestedby Frisch et al. [53] and Wolfram [54]. In the lattice gas,a set of identical particles is assumed to represent theactual fluid. These particles are equipped with theappropriate momenta that will take them from onesite of a regular lattice that spans the working domainto a neighboring site within a unit time interval. Eachsite is either occupied by a single particle or is notoccupied at all. The evolution of the particles in timeand space involves two steps: direction and collision.The lattice-Boltzmann model is based on an ensembleaverage of the evolution equation of the lattice gasparticles so that occupation probabilities or populationdensities are considered in place of individual particles.Depending on the dimensionality of the workingdomain, two-dimensional (square, triangular, etc.) orthree-dimensional (usually cubic) lattices areemployed to discretize space.
The evolution of the particle distribution functionfi ðx
~; tÞ is computed from the equation
fi ðx~þ e
~i ; t þ 1Þ – fi ðx
~; tÞ ¼ –
1
�fi ðx
~; tÞ – f
eqi ðx
~; tÞ
�
where e~
i is the velocity in the i-direction, x~
is theposition vector, � is the relaxation time parameter,and f
eqi ðx
~; tÞis the equilibrium distribution function.
In this equation, the Bhatnagar–Gross–Krook (BGK)approximation [55] has been introduced to simplifythe otherwise quite complicated collision operator.The local density and velocity can be determinedfrom the expressions
¼P
i
fi
u~¼P
i
fi e~
i
It can be shown that in the limits of Kn! 0 andvanishingly small discretization elements in spaceand time, the Navier–Stokes equation
@u˜@tþ u
~?ru ¼ –rp þ �r2u
~
can be derived from the lattice-Boltzmann equation,where � is the kinematic viscosity and p is the pres-sure. The corresponding isothermal equation of stateis given by
p ¼ cs2
where cs is the speed of sound, the precise expressionfor which is a function of the discrete velocity set
and, hence, of the choice of lattice used in the parti-cular application. The kinematic viscosity is relatedto the sound speed and to the relaxation time throughthe expression
� ¼ cs2 � –
1
2
� �
The equilibrium density function can be expanded inthe following form:
feq
i ¼ Aþ Be~
i ? u~þ Cðe
~i ? u
~Þ2 þ Du
~? u~
where A, B, C, and D are numerical coefficients thatare specific to the lattice-type that is used in thesimulation.
The lattice-Boltzmann model offers significantadvantages over the lattice gas model and, conse-
quently, it enjoys increasing use in flow problems.
Technically, it is practically free of the numerical
fluctuations that appear in the lattice gas model.
Galilean invariance is restored in the lattice-
Boltzmann model up to a certain order in wave
number. If one also considers that the viscosity is
easy to adjust and the application to complex geo-
metries, like those encountered in the interior of
porous materials, is rather straightforward, it can be
recognized as an approach with strong potential to
simulate flow in practically arbitrary domains.Upon collision with the pore walls, which in the
lattice-Boltzmann model corresponds to the propa-
gation of a population density to a site that resides at
the solid–void interface, several options are available
concerning the reflected population. Typically, the
bounce-back condition is adopted which, practically,
results in the inversion of the direction of the local fithat arrived at the solid site. In the limit Kn! 0, this
reproduces the no-slip condition. Alternatively, the
population that arrives at a solid site may be redir-
ected into a different direction, satisfying either the
specular reflection law (inversion of the normal to
the wall component of the momentum only) or an
intermediate reflection condition (random selection
of any of the directions from the wall into the main
stream). If some slip velocity is prescribed, the values
of the reflected fi ’s can be selected so that the pre-
scribed slip velocity is recovered.Different choices are also available for the generation
of flow in a certain domain. Specifically, one can either
impose a body force on the population densities in the
direction of macroscopic flow or fix the pressure at the
two ends of the domain, thus maintaining a constant
driving force for flow. In practice, some round off error
Modeling and Simulation of Membrane Structure and Transport Properties 53

may develop and cause instabilities in the computationsthat can usually be prevented through the appropriateselection of the parameters of the simulation. A typicalexample of the application of the lattice-Boltzmanntechnique to the simulation of flow in a network ofpores with distributed size is shown in Figure 5. It isnoteworthy that the mean superficial velocity that iscalculated using the lattice-Boltzmann method isfound to be proportional to the pressure gradient forthe same fluid and the same pore structure for relativelysmall porosity, thus satisfying the Darcy law for flow inporous media.
In the case of porous membranes that have suffi-ciently small pores to make the Knudsen numberfinite (larger than 0), this type of lattice-Boltzmannmodel is inappropriate to describe the flow in theporous microstructure. The Knudsen numberbecomes a function of position and some modificationto the model formulation is required. Various attemptshave been made in this direction that incorporate themean-free-path concept in the model and arrive at
expressions that include the relaxation time � (x~
) as afunction of position. This is, of course, a direct con-sequence of the fact that the density acquires anonnegligible dependence on position and so doesthe kinematic viscosity. Hence, the application of thelattice-Boltzmann model to such porous membranesnecessitates the calculation of a local relaxation timeparameter, which is a function of time as well. Thedynamic viscosity also changes with the Knudsennumber and can be approximated by the harmonicmean of the viscosity in the bulk (away from solidsurfaces) and that in the free molecule flow regime justlike in the diffusion case (Bosanquet expression [56,57]). Interesting and encouraging comparisons of theprediction of the pressure variation during flow in astraight slit-shaped pore as provided by modified lat-tice-Boltzmann simulators to the correspondingpredictions of the DSMC method have been made[58] that, in general, reveal the need for more accurateexpressions for the viscosity in terms of the Knudsennumber. A second major issue in this context is cer-tainly the boundary condition at the pore surface andthe appropriate definition and incorporation in themodel of gas accommodation coefficients on the wall.It is also interesting to note that the use of the con-tinuum approach to describe flow at elevated Kn
values would necessitate the incorporation of an arbi-trary slip velocity to complement the Navier–Stokesequation. However, such an approach suffers from theusually unsafe employment of first- or higher orderslip boundary conditions that involve parameterswhich, in general, cannot be estimated or expressedin any general form. Even if such slip parameters areproperly adjusted to reproduce some desired slip velo-cities, the rest of the flow field ceases to remaincomparable, qualitatively or quantitatively, to thatpredicted by the DSMC or the lattice-Boltzmannmethod. Therefore, one appears to have no choicebut abandon the continuum description and the cor-responding numerical techniques and resort tomesoscopic methods such as the ones that are pre-sented in this section. The areas of micro- andnanofluidics are of particular interest to membranescience and it is expected that an increasing amountof research efforts will be devoted to this type ofmodels and simulators within the membrane field.
1.03.3.3.4 Pore-scale simulation of
dispersion in porous membranes
The complexity of the pore structure that is usuallyencountered in the interior of porous membranes(except for particular cases that involve straight-
(b)
(a)
Figure 5 Flow field at the inlet (a) and outlet (b) of a porous
membrane, as calculated by the lattice-Boltzmann method.
54 Fundamentals of Transport Phenomena in Membranes

through pores for specific applications) gives rise to astrong heterogeneity of the flow field across theporous domain. In turn, this gives rise to dispersionof the solute particles or of the gas species, dependingon the nature of the separation. Additional dispersionfactors that take it away from a given streamlineinclude the Brownian force, gravity, electrostaticforces, etc. The result is the dispersion of the speciesacross some portion or over the entire region of themembrane structure, depending on the scale of het-erogeneity, magnitude of the forces on the variousspecies molecules or particles, and the time scale ofthe particular separation process. The mesoscopicequation that describes dispersion in a porous struc-ture has the same form as that of convection–diffusion equation and this fact has repeatedly causedsome confusion regarding the nature of each processand the differences between them. Except for thehydrodynamic heterogeneity issue that was men-tioned above, one also needs to make the distinctionbetween the scale of strict application of the convec-tion–diffusion equation that uses the moleculardiffusivity (typically, the pore scale) and the applica-tion of the dispersion equation, which involves thelocal macroscopic velocity and the dispersion coeffi-cient in place of the molecular diffusivity (scale of aporous region or of a pore provided that some flownonuniformity develops, for instance, Taylor disper-sion in a tube). Thus, an obvious approach to treatdispersion in pore networks would be to solve theconvection–diffusion equation in each pore segmentand then integrate the flux expression over the scaleof the working domain using the resistor networktechnique. This would still provide a local dispersioncoefficient at the mesoscopic scale and further inte-gration would be needed to upscale to themacroscopic level.
In the event that a pore network cannot reliablyrepresent the void space of the membrane, a reconstruc-tion technique can be employed that will yield either ageometric approximation of the structure (granular,fibrous, etc.) or a stochastic, three-dimensional repre-sentation of the structure as a binary array of 0 and 1. Inany case, the lattice-Boltzmann or some other methodcan be employed to determine the local flow field. Toincorporate convective diffusion or dispersion also, amodified lattice-Boltzmann method can be used, thatcontains two evolution equations, one for the carrierfluid and one for the solute or, in the gas mixture case,one for the mixture as an entity on its own and one foreach component of the mixture. The first equationdescribes the main flow of the carrier fluid or of the
mixture and the second equation describes the stochas-
tic motion of the solute or of the mixture component,
which travels at the mean mixture velocity but also
diffuses at a rate that is proportional to a diffusive
mobility parameter. Such models have been developed
by Dawson et al. [59], Kumar et al. [60], and other
investigators who adapted them to the specific needs
of the application of interest. The species evolution
equation reads
fs;iðx~þ e
~i ; t þ 1Þ – fs;iðx
~; tÞ ¼ –
1
�sfs;i – f
eqs;i
�
where subscript s denotes the solute or the individualspecies and all other terms have the same physicalmeaning as those used in the classical lattice-Boltzmann evolution equation. The solute or speciesdensity is now given from
sðx~; tÞ ¼
Xi
fs;iðx~; tÞ
and the velocity from
susðx~; tÞ ¼
Xi
fs;iðx~; tÞe
~i
The fact that each species or solute sharesthe same mean velocity u, which is the velocity of
the carrier fluid or of the mixture, is reflected on the
constraint
suðx~; tÞ ¼
Xi
feq
s;i ðx~; tÞx
~i
The following form of the convection-diffusionequation is recovered using the Chapman–Enskog
procedure
@ s
@tþr? suð Þ –Dsr2 s ¼ 0
where the diffusion coefficient, Ds, is related to therelaxation time of this species through
Ds ¼ cs2 �s –
1
2
� �
This model has been successfully applied to pore orfracture intersections for various values of the Peclet
number (Pe), which is a measure of the relative
importance of convection and diffusion in a transport
process [64]. More specifically, Pe is defined in this
context as
Pe ¼ uL
Ds
Modeling and Simulation of Membrane Structure and Transport Properties 55

where L is some characteristic length of the system,for instance, the pore length between successiveintersections with other pores or the pore width. Ithas been shown that this lattice-Boltzmann convec-tion–diffusion technique is relatively fast comparedto other techniques for simple pore intersections forlow Pe values. However, it still remains to be seenhow efficient it can prove if applied to complex porestructures of sufficient size to justify definition of adispersion coefficient.
1.03.3.3.5 Particle-tracking method for
dispersion simulation
Once the flow field inside a porous membrane ismade available through the lattice-Boltzmannmethod or any other numerical technique, solutetransport can be simulated by a random walk typeof approach. In the absence of any other force but thehydrodynamic drag and the stochastic Brownianforce, the motion of each particle can be monitoredthrough the vectorial summation of the displacementthat is caused by these two forces [61–63]. Within ashort time interval, �t, the total vectorial displace-ment is given by
�r~¼ u
~ðr~Þ�t þ ��
~ð35Þ
where ��~
is the random vectorial displacement due tothe stochastic thermal motion. The velocity u
~is the
local velocity of the carrier fluid, which is assumed toremain unaffected by the motion of the solute. This isusually justified in the cases of dilute dispersions ofnanoparticles. In all other cases, the distortion of theflow field by the moving solute must be taken intoaccount.
The lattice-Boltzmann or other space-discretizationnumerical technique that can be used to compute themain flow field will provide the local velocity compo-nents at lattice or grid nodes. However, the stochasticnature of the particle motion will clearly necessitatethe knowledge of the values of the velocity compo-nents at off-lattice positions. Various interpolationalgorithms can be employed to this end, the presenta-tion or review of which is beyond the scope of thischapter. The magnitude of the random displacement,��, can be calculated from the equation
Ds ¼��2
6�tð36Þ
The physical meaning of the use of this equation isthe following. During the time �t, the solute particle
will have the opportunity to experience a statisticallyadequate number of unit steps for a meaningful dif-fusive process to develop. This, in practice, impliesthat the value of �t is much larger than the mean timebetween successive free paths. On the other hand, �t
must be sufficiently short to prevent excessively longsteps that would dislocate the particle to a region ofdifferent fluid velocity. That is, the value of �t mustbe limited to time intervals that allow very smallsteps of the particle to ensure smooth, controlledvariation of the local flow field. According to Salleset al. [61], a compromise between these two constantsis to use a �t value that allows a total displacement ofthe particle of the order of a fraction (say 1=2) of thepixel size in binarized pore structures. Once the valueof �t is fixed, the value of �� is calculated fromEquation (36) and a hypothetical sphere is generatedwith center at the current particle position and radiusequal to ��. Since the assumption is made that thestochastic part of the process is diffusive and a largenumber of intermediate steps is taken before thedisplacement �� is achieved, it can be safely assumedthat at the end of the �t interval the particle haslost its memory from the previous position.Consequently, a point on the surface of this spherecan be selected randomly (usually by selecting ran-dom direction cosines in spherical coordinates) andidentified as the position that the traveling particlewould reach if only the diffusion process were takeninto account and the main fluid flow were neglected.Then, the vectorial summation of Equation (35) isperformed to determine the next position of theparticle as the result of both convection and diffusion.Obviously, if a prescribed Pe value is used, the rela-tive importance of convective and diffusivedisplacement is precisely defined: for small Pe values,the diffusive term is the one that dictates the motionof the particle in a stochastic manner whereas forlarge Pe values, particles follow closely the stream-lines because of the limited role of diffusion.However, it must be stressed that even at large Pe
values (e.g., 100 or more) where diffusion is limited,some small stochastic displacement of the particlemay take it to a different streamline, from this oneto a different one and so on, eventually leading it toextensive deviation from the original streamline,especially in the interior of porous membranes withlocally heterogeneous pore structure. This, in turn,may lead to dispersion coefficients that are quitesensitive to the precise value of the Peclet number.It may also have some profound effect on the
56 Fundamentals of Transport Phenomena in Membranes

efficiency of the separation of various solutes or dis-
solved species and the conditions under which suchefficiency can be maximized.
Some care is needed to avoid confusion of thisdispersion algorithm with the implementation of the
diffusion simulation that was presented earlier and
consisted in the computation of molecular trajectories.In that case, each and every individual step of the
molecule is considered following sampling from the
Poisson distribution of paths with mean value that is
equal to the mean free path. The time that elapses
during such individual steps is quite small and, cer-tainly, much smaller than the time interval �t that is
used in the dispersion simulation. Superposition of the
convective and diffusive motions in the latter case is
made possible if the �t value is sufficiently large forEquation (36) to be valid. Another basic difference is
that the stochastic displacement, ��, is constant during
the simulation (i.e., of fixed length) in contrast to the
individual molecular paths which are of distributedlength with mean equal to the mean free path.
Snapshots of the evolution of a set of solute par-ticles that travel in a simulated porous membrane
under the action of a mainstream flow field and a
Brownian field are shown in Figure 6. Note that for
the lower Pe value, the mixing time is of the order of
the flow-through time whereas for the higher Pe
value, the solute particles follow the streamlinesrather closely. However, as it was mentioned above,even a small random displacement off the streamlinemay carry gradually the particle to a different flow
region and eventually lead it to a different poresegment from the one that was initially selected bythe particle. It is straightforward to envisage muchwider dispersion of solute particles at larger scalesdue to the heterogeneity of the fluid flow. Thesephenomena can be studied in depth using the particle
tracking or the lattice-Boltzmann convection–diffusion technique. Recent studies [64] revealed asatisfactory agreement between the predictions ofthese two methods at the scale of a pore intersection.The interesting difference between the two is thatthe particle tracking method is much slower than thelattice-Boltzmann convection–diffusion method for
low Pe values where diffusion is important butbecomes faster than it in the high Pe range whereflow dominates transport. Thus, depending on theconditions, one may select one or the other methodto follow the dispersion process and calculate thedispersion coefficients. In the case of porous filters,it appears that the longitudinal dispersion coefficient
is of more direct significance than that of the
(a)
Figure 6 (a) Dispersion of a pulse in a reconstructed membrane at Pe¼ 0.1. Time sequence: right and down.
Modeling and Simulation of Membrane Structure and Transport Properties 57

transverse one since all measurable quantities ofinterest are along the mean direction. However, inthe case of cross-flow operation using porous mem-branes, both longitudinal and transverse dispersionprocesses become important and retain theirincreased significance along the course of the separa-tion process due to the gradual entrapment ofparticles within the pore space and the concomitantalteration of the structural features of the membranein an asymmetric fashion.
If the pore space of the membrane can be simulatedby a network of individual pores, a resistor-type ofapproach can be used to evaluate the flow field in theinterior of the membrane and the pressure at porejunctions. Once the flow solution is available, disper-sion at each pore segment can be modeled using theconvection–diffusion equation that will yield the soluteconcentration difference across each pore. Using theresistor analog again, this time for the solute massbalance, one can obtain the concentration profile acrossthe entire membrane and from that one can extract thelongitudinal and transverse dispersion coefficients[65, 66]. Alternatively, a random walk technique canbe used to simulate the motion of test particles throughthe pore network using the pore velocities as the maincriterion of selecting the exit-pore from each junction[67]. Within each pore, the particles can either simply
follow the mean pore velocity or allowed to switchstreamlines, thanks to the stochastic diffusion process.A more refined algorithm was recently developed[67a] that accounts also for upstream particle transportat low Pe values.
1.03.3.3.6 Pore-scale simulation of
membrane fouling
In the previous sections, solute particles wereassumed to travel in the interior of a porous mem-brane under the action of the hydrodynamic andBrownian forces. If a particle approaches the porewall, particle–surface interactions become significantand are, eventually, responsible for the capture anddeposition of the particle at the site or its repulsionback to the main stream. Typical forces of this natureare the London van der Waals force and the electro-kinetic (double layer) force. For particles larger thanabout 1mm in size, the gravitational force is usuallytoo significant to neglect, in contrast to the Brownianforce that becomes negligible at room temperature. Inaddition, as the particle approaches the wall, a correc-tion factor must be introduced to the hydrodynamicdrag expression due to the additional hydraulic resis-tance that is exerted by the liquid body that liesbetween the particle and the surface on the travelingparticle. Such correction factors have been calculated
(b)
Figure 6 (b) Dispersion of a pulse in a reconstructed membrane at Pe¼ 100. Time sequence: right and down.
58 Fundamentals of Transport Phenomena in Membranes

both analytically and numerically for porous and non-porous particles and surfaces as discussed earlier inthis chapter (Michalopoulou et al. [10, 11] and refer-ences therein). If both the particle and the wall arenonporous, the drag force increases rapidly to infinityas the clearance decreases to zero and it is only due tothe strongly attractive van der Waals force that theparticle may get captured by the surface. If either theparticle (e.g., an aggregate) or the wall (e.g., a poroussubstrate or a particulate deposit in the context offouling) is porous, the drag force remains finite evenat contact thanks to the flow that develops in theinterior of the porous body. Obviously, this is alsothe case when both bodies are porous. If the particleapproaches the wall in any other direction but thenormal one to it, the drag force gives rise to a hydro-dynamic torque that is responsible for particlerotation, which may affect (usually to a small extent)the precise position of capture. As it was mentionedabove, all these factors have already been taken intoaccount in simulations of particle deposition in porousfilters and membranes resulting in estimates of theparticle removal efficiency and its dependence onthe magnitude of several parameters (for instance,Burganos et al. [13]), including most notably fluidvelocity, particle surface interaction constants, poreshape particle size and density, and flow orientationfor larger particles.
Regarding the algorithm that can be followed toimplement these calculations, one can distinguishtwo main types of approach: integration of the parti-cle trajectory across the entire domain of themembrane sample or resorting to the resistor net-work method. The former can be applied to anystructure type and depending on the quantities thatare pursued, the initial positions of the travelingparticles can be at the entrance face (calculation ofremoval efficiency, monitoring of fouling) or at ran-dom positions in the interior of the membrane(calculations of transport properties such as the long-itudinal and transverse dispersion coefficients). Theresistor network method can be applied to porousstructures that can be approximated by networks ofindividual pore segments. In this case, particle trajec-tories are confined within each pore segment, thedeposition rate is calculated in each and every porein the network, and the population balances written ateach pore intersection are solved for the local pressureprofile and particle fluxes. Then, the overall depositionrate can be calculated and the filtration efficiency alongthe course of the filtration process can be determined.Recently, some concrete progress on the gradual
deposit built up has been made through the dynamicsimulation of suspension flow in filters [68–70]. Morespecifically, the particle trajectories are calculatedleading to estimates of the distribution of the localdeposition rate inside the filter. This information canbe used for the stepwise update of the deposit profileacross the medium and of the concomitant decrease ofthe hydraulic permeability, which necessitates therecalculation of the local pressure profile and localflow field. At some critical value of shear stress, por-tions of the deposited material may get reentrainedinto the main stream, travel downstream, and redepositelsewhere, altering inevitably the flow field and, quiteoften, even the available pathways for transport, lead-ing progressively to fouling. However, it is interestingto note that the deposit plugs are porous and act asexceptional filters themselves though increasing con-siderably the hydraulic resistance. This type ofapproach can also be applied to porous membranesunder certain conditions regarding the relative size ofsolute particles and pores, the concentration of theflowing suspensions, the agglomeration tendency, etc.Note that dense suspensions require a different treat-ment inasmuch as the assumption of independentparticle trajectories, that is, trajectories that remainunaffected by the presence of neighboring particles,becomes invalid just like the assumption of uniformphysicochemical properties throughout the suspension.
1.03.3.3.7 Lattice-Boltzmann simulation
of two-phase flow with phase change
Two-phase flow and phase change processes are fre-quently encountered during a variety of membrane-related processes, including membrane preparation,membrane characterization, and membrane moduleoperation. Notable examples are the infiltration andsintering processes, mercury and gas porosimetry,separation through membrane contactors or perva-porators, membrane emulsification etc. As moderntechnologies require the design of increasingly finerarchitectures in the nanosize range and efficient con-trol of the end properties and of the actual operation,reliable simulators and fast codes are needed that willallow better understanding of the phenomena at thepore scale and provide valuable data to material andtechnology developers.
Lattice-gas and lattice-Boltzmann models can bevery useful in the simulation of two-phase flow withor without phase change, especially if they are to beapplied to porous domains. This is because they areself-adjusting in complex geometries, such as thepore structures in the discretized form of binarized
Modeling and Simulation of Membrane Structure and Transport Properties 59
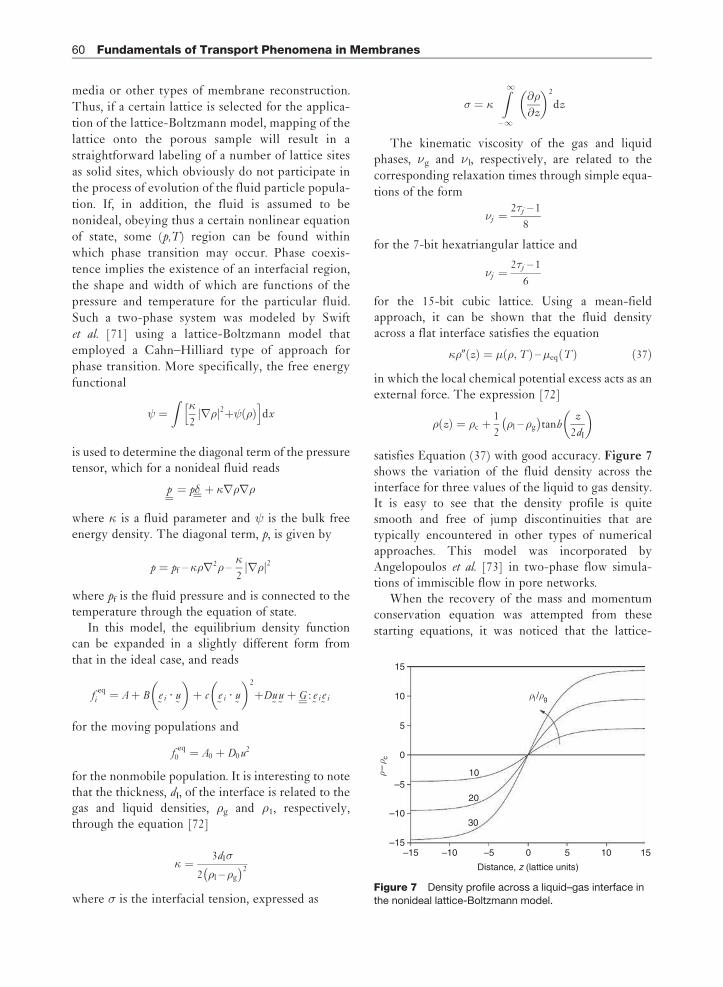
media or other types of membrane reconstruction.
Thus, if a certain lattice is selected for the applica-
tion of the lattice-Boltzmann model, mapping of the
lattice onto the porous sample will result in a
straightforward labeling of a number of lattice sites
as solid sites, which obviously do not participate in
the process of evolution of the fluid particle popula-
tion. If, in addition, the fluid is assumed to be
nonideal, obeying thus a certain nonlinear equation
of state, some (p,T) region can be found within
which phase transition may occur. Phase coexis-
tence implies the existence of an interfacial region,
the shape and width of which are functions of the
pressure and temperature for the particular fluid.
Such a two-phase system was modeled by Swift
et al. [71] using a lattice-Boltzmann model that
employed a Cahn–Hilliard type of approach for
phase transition. More specifically, the free energy
functional
¼Z
�
2r j j2þ ð Þ
h idx
is used to determine the diagonal term of the pressuretensor, which for a nonideal fluid reads
p¼¼ p�¼þ �r r
where � is a fluid parameter and is the bulk freeenergy density. The diagonal term, p, is given by
p ¼ pf –� r2 –�
2r j j2
where pf is the fluid pressure and is connected to thetemperature through the equation of state.
In this model, the equilibrium density functioncan be expanded in a slightly different form from
that in the ideal case, and reads
feq
i ¼ Aþ B e~
i ? u~
� �þ c e
~i ? u
~
� �2
þDu~
u~þ G : e
~i e~
i
for the moving populations and
feq
0 ¼ A0 þ D0u2
for the nonmobile population. It is interesting to notethat the thickness, dI, of the interface is related to thegas and liquid densities, g and 1, respectively,through the equation [72]
� ¼ 3dI�
2 l – g
� �2
where � is the interfacial tension, expressed as
� ¼ �Z1
–1
@
@z
� �2
dz
The kinematic viscosity of the gas and liquidphases, �g and �l, respectively, are related to the
corresponding relaxation times through simple equa-
tions of the form
�j ¼2�j – 1
8
for the 7-bit hexatriangular lattice and
�j ¼2�j – 1
6
for the 15-bit cubic lattice. Using a mean-fieldapproach, it can be shown that the fluid densityacross a flat interface satisfies the equation
� 0ðzÞ ¼ ð ;TÞ –eqðT Þ ð37Þ
in which the local chemical potential excess acts as anexternal force. The expression [72]
ðzÞ ¼ c þ1
2 l – g
� �tanh
z
2dI
� �
satisfies Equation (37) with good accuracy. Figure 7shows the variation of the fluid density across theinterface for three values of the liquid to gas density.It is easy to see that the density profile is quitesmooth and free of jump discontinuities that aretypically encountered in other types of numericalapproaches. This model was incorporated byAngelopoulos et al. [73] in two-phase flow simula-tions of immiscible flow in pore networks.
When the recovery of the mass and momentumconservation equation was attempted from these
starting equations, it was noticed that the lattice-
–15–15
–10
–5
0
5
10
15
–10
30
20
10
–5
ρ – ρ c
ρl /ρg
Distance, z (lattice units)
0 5 10 15
Figure 7 Density profile across a liquid–gas interface in
the nonideal lattice-Boltzmann model.
60 Fundamentals of Transport Phenomena in Membranes

Boltzmann derived momentum equation resemblesclosely the Navier–Stokes equation except for twoterms that contain density gradients and imply lackof Galilean invariance. Although such terms may benegligibly small in the bulk regions of uniform fluids,they become quite large in the interface region due tothe usually large difference in the densities of the twophases. To rectify this, a reformulation of the motionequation and the pressure expression was devised[74–76] that eventually restored the Galilean invar-iance. A similar result was obtained by Inamuro et al.[77] using an asymptotic analysis. Kalarakis et al. [75]demonstrated the success of the modified modelthrough simulations of jet break-up and dropletshearing. The fact that droplet generation can besimulated with the help of this lattice-Boltzmannmodel in a direct manner that allows evolution ofthe interface and snap-off upon exit from the orificeis very encouraging for the employment of this tech-nique for the simulation of emulsification processes.It must be mentioned, however, that since thismethod pays attention also to the interior of theinterface in order to ensure continuous descriptionof the density variation from one phase over to theother, some finite number of lattice sites are inevita-bly required within the interface itself. Thisnecessitates the use of relatively thick interfaces ifthe overall size of the lattice is to remain reasonablysmall for computational reasons. In turn, this corre-sponds to elevated temperature and, to allow phasecoexistence, to elevated pressure, the exact ranges ofwhich depend of course on the state equation and theparameter values that are used. A way to get aroundthis problem, which is not only confined to the freeenergy-based lattice-Boltzmann model but to othermultiphase flow lattice-Boltzmann models also, is touse adaptive meshes for the discretization of space inthe vicinity of the interface [78].
In addition to the advantages of direct applic-ability to digitized pore structures and automaticpropagation of interfaces, another interesting fea-ture of this lattice-Boltzmann model must bestressed, namely, the straightforward incorporationof controlled wettability conditions on the solidsurfaces. This can be done in several ways, theeasiest one involving the local assignment of che-mical potential or density [75] to the solid sites, thusessentially assigning hydrophilicity, hydrophobi-city, or any intermediate situation to each site atthe solid–void interface.
The employment of a nonideal fluid in the modeland, consequently, of a nonlinear state equation
allows spontaneous condensation or evaporation,depending on the prevailing static and flow condi-tions. This phase transition feature can prove to bevery useful in membrane applications that involvecondensable vapors or volatile liquids. It is also avaluable tool for the simulation of pore structurecharacterization processes like the nitrogen adsorp-tion/desorption process. Figure 8 shows varioussnapshots of such a simulation for a granular med-ium, for example, alumina powder prior tocompaction and sintering. As the partial pressure,p, of nitrogen increases, progressive thickening ofthe surface film (sorbed fluid) is noticed leading tocondensation in the narrowest interstitial spacingfirst, followed by condensation in gradually largeropenings according to Kelvin equation, Equation(10). Thus, for a given value of the ratio pc/p0, thepore radius, rp, above which all pores will be emptyof capillary condensate can be calculated.Adsorption and desorption snapshots are shown inthis figure and the well-known hysteresis can beinferred easily. It is obvious that such a tool cangreatly facilitate the interpretation of gas adsorp-tion/desoprtion curves and elucidate the role of thevarious structural features of the membrane or itsprecursors in obtaining the desired transport andseparation properties of the membrane material. Inaddition, the permeability and diffusivity values canbe determined at intermediate stages of the adsorp-tion/desorption process by hypothetically freezingthe sorption process and applying the correspondinglattice-Boltzmann flow simulator or the moleculartrajectory approach.
Application of this two-phase lattice-Boltzmannmodel to the simulation of membrane-based emul-sification can proceed in the following manner [79].A straight-through pore is drilled in an otherwisesolid domain (lattice of solid sites) by changing thelabeling of a set of lattice sites from solid to void. Inthe lattice-Boltzmann model this simply means thatthese sites are allowed to participate in the loop thatupdates the local density functions according to thelattice-Boltzmann equation. Then, the liquid den-sity and liquid kinematic viscosity values areassigned to the liquid sites inside the pore, whereasthe corresponding gas values are assigned to thesites outside the membrane domain. The surfacetension and interface thickness values are alsoselected and some body force is applied to eachliquid site by enhancing the fi values in the directionof the flow. Gradually, a liquid meniscus is formedwhich propagates into the gas region where it is
Modeling and Simulation of Membrane Structure and Transport Properties 61

subjected to a shear flow, the effect of which on the
liquid can be simulated by the effect of a body force
in the direction perpendicular to the pores. The
time of break-up and the size of the droplet that is
thus generated are functions of several parameters,
including the pore size, the relative magnitudes of
the main and cross-flow velocities, the surface ten-
sion, and the liquid viscosity. Figure 9 shows a set of
snapshots taken during such a simulation using the
free energy-based two-phase lattice-Boltzmann
technique.In the event that the pores in the interior of the
membrane are nanosized, a modification of the lat-
tice-Boltzmann method is needed to account for
Figure 8 Snapshots of gas adsorption, condensation, and evaporation in a simulated granular material using the two-
phase lattice-Boltzmann model that allows phase transition. Time sequence: right and down.
Figure 9 Snapshots of membrane-based emulsification
using the two-phase flow lattice-Boltzmann simulator.
Mainstream flow is in the direction of the arrows. Time
sequence: right and down.
62 Fundamentals of Transport Phenomena in Membranes

rarefaction effects. To this end, the models that werepresented in the previous section can be invoked todescribe flow in the elevated Knudsen numberregime within the bulk of the phases. Developmentof a two-phase flow lattice-Boltzmann model awayfrom the continuum limit is currently in progress andis expected to find extensive use in membrane appli-cations involving gas and liquid phases, with orwithout phase change, with pores in the submicronrange.
It is well known that liquid droplets at both thenano- and micron-size scale are subject to coales-cence with each other forming larger droplets. Thisis usually an undesirable event inasmuch as it shiftsthe mean droplet size to larger sizes that do nothappen to share the properties of the original emul-sion. For instance, if microemulsions are pursued forcosmetic or food applications, coalescence into largerdroplets will have a strongly negative effect on theend properties of the final product. In addition, ifliposomes of specific mean size and standard devia-tion are produced by some membrane emulsificationor membrane screening technique, coalescence willlead to larger sizes with larger deviation. Both ofthese changes will reduce the efficiency of theadsorption of the active ingredient in the pathologi-cal tissue and increase its adsorption in healthytissues thus intensifying side effects of drug adminis-tration to the patient. Although several techniquesare considered to mediate these effects, droplet coa-lescence is certainly a phenomenon that requiresreliable simulators with the ability to predict thecorrect dynamics of the process within reasonablecomputational time.
The two-phase flow lattice-Boltzmann method canalso be employed to study droplet coalescence and itsdynamics. Among its advantages over more traditionaltechniques is its ability to simulate coalescence of multi-ple droplets simultaneously and not only of droplets inan isolated pair. Another significant advantage is itsdirect applicability to droplet coalescence in theinterior of any structural configuration includingdigitally reconstructed materials, as described above.Application of the aforementioned simulator is straight-forward and coalescence is driven mainly by the actionof the interfacial tension that tends to minimize thesurface area of the liquid bodies. In fact, not only viscoussintering but also controlled particle sintering can besimulated with this method, leading to structures thatare more connected than the original ones, with lesssurface area and less porosity. Figure 10 shows theevolution of a granular material during viscous sintering
using the lattice-Boltzmann method. If the particles are
assumed to have a solid core that does not participate in
the mass transfer process, surface controlled sintering
can be simulated and the kinetics of the process can be
delayed at an adjustable rate. The degree of sintering
can be easily controlled if microscope images of the final
product are available. Otherwise, this method can be
employed to produce several structural configurations
at intermediate levels of sintering, which can then be
used as input to transport simulators for the prediction
of diffusivities and permeabilities. In this way, one can
have a set of data on the transport properties of the
Figure 10 Simulated sintering of a granular material using
the two-phase flow lattice-Boltzmann method.
Modeling and Simulation of Membrane Structure and Transport Properties 63

membrane or support material at different sinteringlevels. Obviously, this type of information can be veryuseful in the design of improved materials and forguiding the experimentalists to the optimal set of pre-paration conditions.
1.03.3.4 Simulations at the Atomic Scale
The need to resort to microscopic- or atomic-scale simulations originates from at least twomain issues, namely, the control of the separationprocess by nanoscale phenomena and the majorrole that fluid–solid interfaces play during fluidtransport. In both cases, it is self-evident thatsufficient knowledge of the interactions amongatoms and their reliable simulation are of para-mount importance for the design of improvedmembrane materials and for the identification ofthe optimal conditions of operation. In general,one can first reconstruct on the computer theconfiguration of interest at the atomic scaleusing some force field description of the interac-tions among the various constituents of thesystem. The parameters and data that are neededare usually obtained from measurements and ab
initio computations. The next step involves speci-fic attempts to identify stable versions of theconfiguration and suggest modifications at theatomic scale (ion exchange, hydroxylation, andfunctionalization in the general sense) that pro-mise improvements in the end properties of thematerial and its eventual performance duringapplication in some specific separation process.Sorption and transport in these structures canalso be simulated at the atomic scale whereneeded or at the mesoscopic scale, paying parti-cular attention to the fluid interaction with thesolid surfaces. Although rather limited in terms ofthe time and space scale (�10 ns and �10 nm,respectively) which they can span, atomistic simu-lations can provide a vast amount of informationand valuable insight into the competitive transportof species in microporous membranes and bridgethe gap between quantum mechanical calculationson the one hand and mean field theories andmesoscopic simulations on the other. Althoughseveral common features underline the molecularsimulation of inorganic and polymeric membranematerials, it is more convenient to give separatepresentations of these two types of material andstress the differences where needed.
1.03.3.4.1 Atomistic reconstruction of
inorganic membrane materials
The structure of various inorganic materials thathave the potential to be used in membrane systemshas been repeatedly studied at the atomic scale usingMonte Carlo techniques or molecular dynamics. Thereconstruction procedure involves, usually, the fol-lowing intermediate stages. First, positioning of theatoms of the structure takes place at reference bulklattice sites using literature data. A force field isselected to describe the atomic interactions and cal-culate the potential energy of the configuration.Various force fields are available in the literature,ranging from quick and simple to highly sophisti-cated ones that, however, pose more severecomputational demands. Such force fields contain anumber of parameters that are usually estimatedfrom experimental data or ab initio calculations. Atypical example is the general purpose universalforce field (UFF, Rappe et al. [80]), which has beenparametrized for the entire periodic table. It is apurely diagonal, harmonic force field, the parametersof which are generated from rules based on the atomtype, hybridization, and connectivity. Both intramo-lecular (bonded) and intermolecular (nonbonded)interactions are taken into account in the formulationof the expression for the potential energy. Amongintramolecular interactions, most notable contribu-tions are: bond stretching, which is described by aharmonic term; angle bonding, which is given interms of a three-term cosine Fourier expansion; tor-sion, which is expressed using cosine Fourierexpansion terms with the dihedral angle betweenthe two phases defined by an atom quadruplet intheir arguments; inversion, which is expressed in asimilar way as torsion is, but using the angle that isformed by the off-plane bond and the plane that isdefined by the other three atoms in the arguments ofthe cosine Fourier terms. The van der Waals inter-actions are described by the 12-6 Lennard–Jonespotential or the exponential-6 (Buckingham) poten-tial. Electrostatic interactions are also taken intoaccount using atomic monopoles and a screened(distance-dependent) Coulombic term. The nextstep involves the setting of boundary conditions,which can be periodic or of the free surface type.The final stage is the one that involves the minimiza-tion of the potential energy of the structure, usingNewton–Raphson, steepest descent, or conjugategradient techniques. Modifications of the structureare also possible at this stage, for instance, cationaddition or ion exchange (particularly useful in
64 Fundamentals of Transport Phenomena in Membranes

designing zeolites, introduction of structural defects,for example, removal of oxygen atoms from the sur-face of oxides) and any other hypothetical or actualalteration that appears promising or interesting fromthe scientific or technological viewpoints.
In addition to direct literature data for the variousspatial characteristics of a material at the atomicscale, valuable input can be provided by X-ray dif-fraction (XRD) patterns, which can be utilized in aneffort to solve the inverse patterning problem, that is,to find the structural details that reproduce theexperimentally obtained diffraction patterns. Morespecifically, indexing of the X-ray patterns can befirst implemented using a trial reciprocal lattice con-struction technique (for instance, the ITO method[81]). Subsequently, refinement methods can beemployed for the optimum determination of thestructure, like Pawley [82] and Rietveld [83] refine-ments. Initial guesses for such a procedure can beconstructed from the data reported in the literaturefollowed by an energy minimization step using theUFF or some other force field that, however, must beoptimized for the particular material under investi-gation (see also, Navascues et al. [84] for details).
1.03.3.4.2 Simulated annealing
A method to overcome local energy minima and,thus, maximize the efficiency of the energy minimi-zation procedure is using the simulated annealingtechnique. First, energy minimization of the struc-ture under consideration takes place using someforce field description of the atom-to-atom interac-tions and a conjugate gradient technique for theminimization process. Molecular dynamics is subse-quently used under conditions of constant number ofatoms, constant volume, and constant temperature(N, V, and T) until a configuration of atoms movingwith the desired velocity distribution at the specifictemperature is obtained. Then, the temperature isincreased to a different value and the steps of mini-mization and molecular dynamics are repeated asmentioned above. This procedure is repeated at sev-eral temperature levels until a predefined upper limitis reached, which is usually safely below the meltingpoint. Then, the same procedure is repeated in thereverse order, cooling down the system to the initialtemperature. This method can be applied, practi-cally, to any atomic-scale structure to yieldequilibrated configurations with a global energyminimum, avoiding entrapment within local energyminima (see, for instance, Deem and Newsam [85]).Recent experience with zeolite reconstruction,
namely, NaX faujasite (FAU) crystals [86] revealedthat simulated annealing can also offer much reducedstatistical deviation in energy calculations by almosttwo orders of magnitude compared to those in calcu-lations with the nonannealed structure.
1.03.3.4.3 Simulation of sorption – Monte
Carlo technique
Sorption at the atomic scale inside a microporousmaterial is known to control the relative permeationand, eventually, the separation efficiency in numer-ous membrane-based applications. In fact, selectivesorption of one or more species in cavities may eitherfacilitate or obstruct selectively the transport of thesespecies or of the nonsorbed species, depending onwhether pore blocking or pathway clearing takesplace. In the presence of electrostatic interactions, itis obvious that sorption at the different sites insidethe structure may affect strongly the interaction ofthe rest of the species with both the surface ions andthe adsorbed ions.
The thermodynamics of sorption can be calcu-lated using different techniques. The details of thedependence of the partition function on the spatialextent of the system under consideration are incor-porated in the configurational integral, which for anN-dimensional vector of coordinates reads
Z ¼Z
exp – �E r1; r2; . . . ; rNð Þ½ �d3r1d3r2 . . . d3rN
where E is the potential energy, �¼ (kBT)�1, and T isthe temperature at the simulation conditions (see, forinstance, Hecht [87]). Monte Carlo integration is anattractive method to calculate this integral, which inpractice is estimated from
Z ¼ V
N0
XN0
i¼1
exp½ – �Eðr~
i�
where V is the volume of the system and N0 is thenumber of random configurations that areconstructed.
Although Monte Carlo integration is considerablymore efficient than conventional numerical integra-tion techniques, it can be further improved to reducethe generation of configurations that have high prob-ability of overlapping with the solid structure. This isincreasingly important as the number of degrees offreedom increases, as is the case, for instance, withalkane chains [88]. The energy-bias technique isfound to improve drastically the evaluation of theconfigurational integral in such cases.
Modeling and Simulation of Membrane Structure and Transport Properties 65

Properties such as the Henry constant and theisosteric heat of adsorption can be calculated using
postprocessing of the sorption simulation. The latter
is typically performed under conditions of constant
chemical potential, constant volume, and constant
temperature (VT), thus allowing fluctuation in the
number of sorbate molecules that are contained
within a fixed control volume. The Henry constant
(KH) is the ratio of the loading of sorbate molecules
(N) to the pressure (p) of the system in the limit of
low pressure:
KH ¼ limp!0
<N>
p
Equivalently, it is the slope of the sorption iso-therm as p!0 and can be calculated from
KH ¼Ms
RT 0
Z
Zig
where Ms is the molecular weight of the sorbate, 0 isthe mass density of the solid, and Zig is the configura-tional integral for a sorbate molecule in an ideal gasphase [89]. As pressure is reduced, sorbate–sorbateinteractions become less frequent and at the limit ofp!0, sorbate–surface interactions become dominantand control fully the value of the Henry constant.
The isosteric heat of adsorption (Hst) is a measureof the change of the internal energy that is caused by
sorption and is given by
O
(a)
(b)
Si
Na
Al
y
z
8
C
N2
CO2
Figure 11 (a) Ball-and-stick representation of CO2 and N2 molecules sorbed inside the NaX faujasite framework. (b) Solid-
free volume in NaX faujasite. Penetrant molecules can use the gray domain only for their sorption and transport, the interior of
which is shown here in blue for easier identification of the internal morphology. The figure was created with the help of theMaterials Visualizer module of the Materials Studio suite by Accelrys Inc.
66 Fundamentals of Transport Phenomena in Membranes

Hst ¼ R@lnP
@ 1=Tð Þ
� N
¼ RT –@ < U >
@ < N >
� T ;V
A limited dependence of Hst on pressure isindicative of sorbate–surface interaction through dis-
persion–repulsion forces. On the other hand, non-
negligible dependence of Hst on pressure indicates
preferential adsorption near charged surface atoms.
As sorption progresses, additional sorbate molecules
reside far from charged surface atoms at positions of
lower potential energy. Obviously, the precise loca-
tion of sorption sites is very significant in the case of
molecular separations as they are known to affect the
pathways of the rest of the species and, hence, the
separation efficiency. Figure 11(a) shows a snapshot
of CO2 and N2 molecules sorbed in the 12-member
ring of the NaX form of faujasite with Si/Al¼ 1 (see
Krokidas et al. [86] for details). Calculation of the
void volume that is available for sorption and trans-
port through the main cage of this framework is
shown in Figure 11(b): gray color is used to indicate
the external boundary of this solid-free volume and
blue is used to indicate the interior of the free volume
(obtained with the help of Materials Studio�).The interaction of the sorbed molecules with the
internal structure of the microporous membrane can,
to some extent, distort the solid configuration and,
consequently, have some effect on the sorption capa-
city and transport dynamics. Although the solid
structure is, typically, assumed rigid in Monte
Carlo simulations of sorption, relaxation of this
assumption is computationally feasible and can offer
interesting results concerning the accommodation of
sorbate molecules at different loadings and tempera-
ture levels. This is particularly interesting in the case
of zeolites, which are known to have, among others,
exceptional molecular-sieving properties and find
applications in diverse processes over a wide range
of temperature values. This phenomenon is compli-
cated by the fact that zeolite framework distortion
can also be due to temperature changes in addition to
the distortion caused by sorbate–structure interac-
tions and by the fact that these two sources are,
usually, affected by each other. For instance, some
frameworks have been observed to exhibit negative
thermal expansion coefficient and, hence, contract
upon heating with obvious consequences on their
sorption and selective sorption capacity, on their
sieving performance, and on the mechanical stability
of the membrane-support system (for a recent
review, see Caro et al. [90]). Such effects are already
tractable by molecular dynamics techniques, anoverview of which is given next.
1.03.3.4.4 Simulation of diffusion –
Molecular dynamics
The evolution of a microscopic description intime can be simulated by equilibrium or none-quilibrium molecular dynamics. In the absence ofexternal forces that would lead to measurablefluxes, equilibrium molecular dynamics can bevery efficient in monitoring the motion of thefluid and structure atoms (or particles) throughthe integration of Newton’s equation of motionfor each and every individual particle. The self-diffusion coefficient can be calculated with thehelp of molecular dynamics and compareddirectly with pulsed field gradient nuclear mag-netic resonance (NMR) measurements as bothmethods refer to equilibrated systems. If, on theother hand, macroscopic mass transport fluxes aregenerated under the action of externally appliedcomposition gradients, nonequilibrium moleculardynamics can be employed to yield transportcoefficients.
Just like in the case of Monte Carlo simulation ofsorption that was described above, the application ofthe molecular dynamics technique to the calculationof the self-diffusion coefficient requires an equili-brated structure and a reliable force field formodeling the interatomic interactions. Considerablesavings in computational time are achieved if short-range interactions, like dispersive and repulsive ones,are truncated at a cut-off radius, the precise defini-tion of which is based on a tradeoff between accuracyand computational time constraints. In zeolite struc-tures, cut-off radius between 1.2 and 1.8 nm aretypically used. Energy discontinuities and truncationerrors using cutoffs in periodic systems are usuallytreated with dumping functions or Ewald summationtechniques [91, 92]; cutoffs can even be avoided (occa-sionally) using hierarchical approaches (multipoleexpansion methods [93]). If the structure atoms areheld fixed in space, then the computational time canbe severely decreased by constructing look-up tablesfor the sorbate–structure interaction data using theresults of interaction calculations for a certain type ofsorbate atoms that need to be obtained only once.
In the classical limit, the equation of motion
md2r
˜ i
dt 2 ¼ F~
i
Modeling and Simulation of Membrane Structure and Transport Properties 67

must be integrated, where mi, r~
i , and F~
i are the mass,position vector, and force acting on particle i, respec-tively. The force F
~i is given by the expression
F~
i ¼ –rr~
iE þ g
~i
where E is the potential energy of the particle con-figuration and g
~i is a force that accounts for all types
of constraints that develop between the site coordi-nates (e.g., fixed bond lengths) [94].
Once some initial condition is specified in theform of an initial configuration of particles, the equa-
tion of motion can be integrated using some finite
difference scheme. Thus, if the particle positions,
momenta, and interaction data are available at time
t, updating of these quantities is achieved at time
tþ �t, where �t is small enough to ensure conserva-
tion of the total energy of the system with sufficient
accuracy, yet large enough to allow completion of the
computation within reasonable time. Although sev-
eral integration techniques have been reported in the
context of molecular dynamics, the Verlet algorithm
r~ðt þ �tÞ ¼ 2r
~ðtÞ – r
~ðt – �tÞ þ �t 2�
~ðtÞ þ Oð�t 4Þ
where �~
is the local acceleration vector, is probablythe most popular one since it sidesteps the need forexplicit evaluation of the velocities at each time step.However, these can be obtained easily from
v~ðtÞ ¼
r~ðt þ �tÞ – r
~ðt – �tÞ
2�tþ Oð�t 2Þ
if needed, for instance, for the estimation of thekinetic energy. The self-diffusion coefficient can becalculated from the large travel time limit of the ratioof the mean-square displacement to 6t:
Ds;i ¼ limt!1
h½r~
iðtÞ – r~
ið0Þ�2i
6t
The transport diffusivity, Di, is related to the self-diffusivity through Equation (9).
Another useful quantity that can be provided bymolecular dynamics is the mean residence time
(MRT) of the sorbate molecules, which is defined
as the time that the molecules spend within a speci-
fied region. MRT is usually rendered dimensionless
through division by the total time allowed for the
simulation. This is a particularly interesting quantity
for gas molecules near sensitive layers (e.g., gas sen-
sors [95, 96]) and also for membranes as this sorbate–
surface interaction is the precursor stage to sorption.
The dimensionless MRT is given by
MRT ¼
Z 10
transitionNVT ðr
~N ðtÞ=�zÞdt
Z 10
transitionNVT ðr
~N ðtÞÞdt
where r~
is the position vector, N is the number ofparticles in the canonical ensemble (NVT), and thevicinity extends to a distance �z from the surface.This quantity can be calculated at any time stepduring the molecular dynamics procedure as a post-processing calculation and characterizes thetransition of fluid particles from the bulk into theboundary layer. It can also be associated with asteady-state adsorption rate constant [97].
Assigning the desired temperature and maintaining itconstant during the simulation are not straightforward
procedures and some interesting features can be pre-
sented here that can be involved in their
implementation. At the first stage of the simulation, the
particles are assigned velocities that are sampled from
the Maxwell–Boltzmann distribution for the prescribed
temperature. This distribution is subject to change dur-
ing the evolution of the simulation and such a deviation
may become significant for systems that have started
from a configuration that was far from the equilibrated
state. Restoring the desired temperature requires dimin-
ishing of such a deviation and production of
configurations that fulfill the constraints of statistical
mechanics. This can be achieved through the use of
the so-called thermostats, like the direct velocity scaling
procedure. Specifically, each time a nonnegligible
deviation is noted during the simulation, the particle
velocities are readjusted according to the relation
vi 9
vi
� �2
¼ Tdesired
Tsystem
where vi and vi9 are the velocities of particle i priorand after correction, respectively, Tsystem is the tem-perature of the system as it has been calculated at theparticular time step, and Tdesired is the desired tem-perature value [97a]. This thermostat is usuallyemployed in cases where considerable deviationsare obtained and rapid restoring of the correct tem-perature is needed. Finer, yet, slower adjustments canbe made if this thermostat is followed by a lessaggressive thermostat, like the one suggested byBerendsen et al. [98] according to which each particlevelocity is corrected by the factor
68 Fundamentals of Transport Phenomena in Membranes

vi 9
vi
¼ 1 –�t
�
Tsystem –Tdesired
Tsystem
� �� 1=2
where � is some characteristic relaxation time. Suchthermostats can be employed to the simulation of themembrane structure or of the sorbate molecules oreven of the entire sorbate–structure system.
Finally, it must be mentioned that the technique ofmolecular dynamics can be employed in sorption stu-dies as well, not only at the stage of reconstruction(thermal effects in the atomic-scale configuration) butalso during the sorption process itself. More specifi-cally, it has been realized that Monte Carlosimulations of sorption cannot always capture stericphenomena associated with the accessibility of thesorption cages from the ambient. This is easy to visua-lize in materials like zeolites, where large cavities thatcan accommodate a significant amount of sorbatemolecules are not always connected to the rest of thematerial, and eventually to the ambient, throughequally wide avenues. On the contrary, it is wellknown that narrow pathways must be used by sorbatemolecules to gain access to the larger cages. In the caseof faujasite, for instance, which has the potential toperform efficient separation of CO2 and light hydro-carbons, the sodalite cage has an effective diameter ofabout 1.25 nm, whereas the access pathways are only0.74 nm wide. Therefore, the use in Monte Carlosimulation of sorption of an initial configuration thatinvolves a certain number of sorbate molecules withinthe soladite cages is based on the arbitrary assumptionthat these, or further added molecules during thesimulation, have found a way to penetrate into thecage through pathways that are narrower than thesorbate molecule size. If the sorption process is simu-lated in a dynamic way using molecular dynamics,then the initial configuration can be an empty frame-work that is exposed to a reservoir of a prespecifiedconcentration of sorbate molecules. In this way, notonly the accessibility issue but also the concomitantdistortion of the framework can be taken into accountand the sorption capacity can be evaluated in a morerealistic manner.
1.03.3.4.5 Structure and transport
simulation in polymers
Polymeric membranes of relatively large porositycan, in general, be treated in the way describedabove in the context of mesoscopic and macroscopictechniques. In dense polymeric membranes, the fol-lowing expression is typically used for the flux, Ni, ofgas species i:
Ni ¼ DeiSi�pi=L
where �pi is the partial pressure drop across themembrane thickness L, the diffusion coefficient Dei
reflects the mobility of the gas molecules in themembrane, and the gas sorption coefficient, Si,reflects the number of gas molecules that are dis-solved in the membrane. The quantity DeiSi is alsocalled the permeability, Pi, of the membrane as it is ameasure of the capability of the membrane to allowpermeation of the gas.
For a binary mixture, the membrane selectivitycan be written as
Dei
Dej
Si
Sj
where the first ratio is the contribution to the selec-tivity of the relative mobility of the two species,which is strongly effected by the relative size of thetwo types of molecules, and the second ratio is thesorption or solubility selectivity. The two contribu-tions act, typically, in opposite directions thusmaking their study very interesting and useful,since large polymer molecules typically implylower diffusion coefficient and higher solubility.
The diffusivities and solubilities in polymer mem-branes can be calculated using atomistic simulations
and concepts similar to the ones mentioned above for
inorganic materials. Expressions for the potential
energy that involve bonded and nonbonded interac-
tion terms are used both for the atomistic
reconstruction of the polymer structure and for the
calculation of transport and sorption properties.
Atomistic packing of polymers usually follows the
methodology that was suggested by Theodorou and
Suter [99] and defines the configuration through the
specification of the tacticity of the parent chain, of
three Eulerian angles describing its orientation, and
of the rotation angles of the skeletal bonds. The
motion of united atoms is extensively used in packing
and transport simulations of polymers thus lumping
the behavior of individual atoms of the same polymer
part or penetrant molecule and saving considerable
computational time. An interesting method to predict
the infinite dilution solubility or Henry’s constant is
the Widom’s test particle approach [100] according
to which a ghost molecule is injected at a randomly
selected position inside the polymer structure.
Subsequently, the interaction energy of this molecule
with the surrounding atoms of the polymer matrix is
computed and the excess chemical potential is calcu-
lated in the NPT ensemble. Henry’s constant can
Modeling and Simulation of Membrane Structure and Transport Properties 69
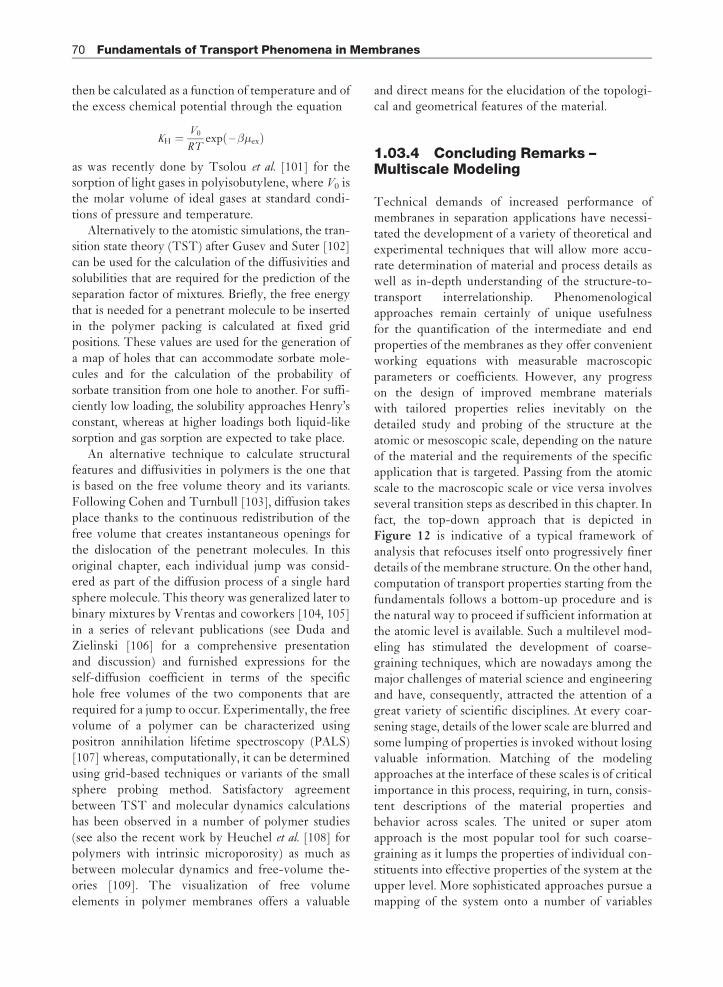
then be calculated as a function of temperature and ofthe excess chemical potential through the equation
KH ¼V0
RTexpð –�exÞ
as was recently done by Tsolou et al. [101] for thesorption of light gases in polyisobutylene, where V0 isthe molar volume of ideal gases at standard condi-tions of pressure and temperature.
Alternatively to the atomistic simulations, the tran-sition state theory (TST) after Gusev and Suter [102]can be used for the calculation of the diffusivities andsolubilities that are required for the prediction of theseparation factor of mixtures. Briefly, the free energythat is needed for a penetrant molecule to be insertedin the polymer packing is calculated at fixed gridpositions. These values are used for the generation ofa map of holes that can accommodate sorbate mole-cules and for the calculation of the probability ofsorbate transition from one hole to another. For suffi-ciently low loading, the solubility approaches Henry’sconstant, whereas at higher loadings both liquid-likesorption and gas sorption are expected to take place.
An alternative technique to calculate structuralfeatures and diffusivities in polymers is the one thatis based on the free volume theory and its variants.Following Cohen and Turnbull [103], diffusion takesplace thanks to the continuous redistribution of thefree volume that creates instantaneous openings forthe dislocation of the penetrant molecules. In thisoriginal chapter, each individual jump was consid-ered as part of the diffusion process of a single hardsphere molecule. This theory was generalized later tobinary mixtures by Vrentas and coworkers [104, 105]in a series of relevant publications (see Duda andZielinski [106] for a comprehensive presentationand discussion) and furnished expressions for theself-diffusion coefficient in terms of the specifichole free volumes of the two components that arerequired for a jump to occur. Experimentally, the freevolume of a polymer can be characterized usingpositron annihilation lifetime spectroscopy (PALS)[107] whereas, computationally, it can be determinedusing grid-based techniques or variants of the smallsphere probing method. Satisfactory agreementbetween TST and molecular dynamics calculationshas been observed in a number of polymer studies(see also the recent work by Heuchel et al. [108] forpolymers with intrinsic microporosity) as much asbetween molecular dynamics and free-volume the-ories [109]. The visualization of free volumeelements in polymer membranes offers a valuable
and direct means for the elucidation of the topologi-cal and geometrical features of the material.
1.03.4 Concluding Remarks –Multiscale Modeling
Technical demands of increased performance ofmembranes in separation applications have necessi-tated the development of a variety of theoretical andexperimental techniques that will allow more accu-rate determination of material and process details aswell as in-depth understanding of the structure-to-transport interrelationship. Phenomenologicalapproaches remain certainly of unique usefulnessfor the quantification of the intermediate and endproperties of the membranes as they offer convenientworking equations with measurable macroscopicparameters or coefficients. However, any progresson the design of improved membrane materialswith tailored properties relies inevitably on thedetailed study and probing of the structure at theatomic or mesoscopic scale, depending on the natureof the material and the requirements of the specificapplication that is targeted. Passing from the atomicscale to the macroscopic scale or vice versa involvesseveral transition steps as described in this chapter. Infact, the top-down approach that is depicted inFigure 12 is indicative of a typical framework ofanalysis that refocuses itself onto progressively finerdetails of the membrane structure. On the other hand,computation of transport properties starting from thefundamentals follows a bottom-up procedure and isthe natural way to proceed if sufficient information atthe atomic level is available. Such a multilevel mod-eling has stimulated the development of coarse-graining techniques, which are nowadays among themajor challenges of material science and engineeringand have, consequently, attracted the attention of agreat variety of scientific disciplines. At every coar-sening stage, details of the lower scale are blurred andsome lumping of properties is invoked without losingvaluable information. Matching of the modelingapproaches at the interface of these scales is of criticalimportance in this process, requiring, in turn, consis-tent descriptions of the material properties andbehavior across scales. The united or super atomapproach is the most popular tool for such coarse-graining as it lumps the properties of individual con-stituents into effective properties of the system at theupper level. More sophisticated approaches pursue amapping of the system onto a number of variables
70 Fundamentals of Transport Phenomena in Membranes

that can characterize the behavior of the system over
sufficiently large length and time scales.The aforementioned issue of multiscale modeling
becomes a true challenge in the case of membrane
nanomaterials for a multitude of reasons.
Commercially viable separations require sufficiently
high separation factors that are favored by sieving at
the molecular or individual particle level. As a result,
atomic-scale design of new or improved materials
becomes a major, direct task that creates tremendous
opportunities for envisaging radical structures with,however, tractable synthesis routes. Because of theusually strong requirement for thin membrane mate-rials (to ensure reasonable throughput), improvedsieving properties must be accompanied by adequatemechanical stability. Additional requirements arefrequently posed by demanding operating conditionsthat may involve high pressure or high temperatureor both. Chemically resistant materials may be alsoneeded depending on the nature of the fluids that willbe handled. This is obviously a heavily complicatedproblem that necessitates a combination of differenttechniques and an algorithm of design and imple-mentation routing. Computational techniques cantruly guide investigations in this direction and arenowadays recognized as indispensable – in combina-tion with sufficiently accurate experimentaltechniques – in a number of design and synthesischallenges, including zeolite framework modifica-tions, dense polymers for selective ionic conduction,pore networking within otherwise dense materials forcontrolled two-phase flow operation etc.
Acknowledgments
The author is indebted to Alexandros Kalarakis,Panagiotis Krokidas, and Vasilis Michalis for someindicative calculations and illustrations that areincluded in this chapter and to Eugene Skouras andVlasis Mavrantzas for discussions and review ofselected portions of the chapter.
References
[1] Theodorou, D. N. Chem. Eng. Sci. 2007, 62, 5697–5714.[2] Moore, G. E. Electronics 1965, 38, 114–117.[3] Sotirchos, S. V., Burganos, V. N. Mater. Res. Soc. Bull.
1999, 24 (3), 41–45.[4] Jackson, R. Transport in Porous Catalysts; Elsevier: New
York, 1977.[5] Darken, L. S. Trans. AIME 1948, 174, 184.[6] Goren, S. L. J. Colloid Interface Sci. 1979, 69, 78–85.[7] Nir, A. J. Eng. Math. 1981, 15, 65–75.[8] Sherwood, J. D. Physicochem. Hydrod. 1988, 10, 3–12.[9] Payatakes, D. Chem. Eng. Comm. 1987, 58, 119–138.
[10] Michalopoulou, A. C., Burganos, V. N., Payatakes, A. C.AIChE J. 1992, 38, 1213–1228.
[11] Michalopoulou, A. C., Burganos, V. N., Payatakes, A. C.Chem. Eng. Sci. 1993, 48, 2889–2900.
[12] Babler, M. U., Sefcik, J., Morbidelli, M., Baldyga, J. Phys.Fluids 2006, 18, 013302.
[13] Burganos, V. N., Paraskeva, C. A., Payatakes, A. C. J.Colloid Interface Sci. 1993, 158, 466–475.
[14] Weber, A. Z., Newman, J. Chem. Rev. 2004, 104,4679–4726.
Figure 12 Modeling across scales from the macroscopic down
to the atomistic one: granular crystalline material with active surface.
Modeling and Simulation of Membrane Structure and Transport Properties 71

[15] Schoch, R. B., Jongyoon, H., Renaud, P. Rev. Mod. Phys.2008, 80, 839–883.
[16] Sotirchos, S. V., Burganos, V. N. AIChE J. 1988, 34,1106–1118.
[17] Burganos, V. N., Sotirchos, S. V. AIChE J. 1987, 33,1678–1689.
[18] Krishna, R., Wesselingh, J. A. Chem. Eng. Sci. 1997, 52,861–911.
[19] Sotirchos, S. V. AIChE J. 1989, 35, 1953–1961.[20] Mason, E. A., Lonsdale, H. K. J. Membr. Sci. 1990, 51,
1–81.[21] Chen, Y. D., Yang, R. T. AIChE J. 1991, 37, 1579–1582.[22] Tsakiroglou, C. D., Payatakes, A. C. J. Colloid Interface
Sci. 1991, 146, 479–494.[23] Burganos, V. N., Payatakes, A. C. Chem. Eng. Sci. 1992,
47, 1383–1400.[24] Burganos, V. N. J. Chem. Phys. 1993, 98, 2268–2278.[25] Constantinides, G. N., Payatakes, A. C. Chem. Eng.
Comm. 1989, 81, 55–81.[26] Coelho, D., Thovert, J.-F., Adler, P. M. Phys. Rev. E 1997,
55, 1959–1978.[27] Kainourgiakis, M. E., Kikkinides, E. S., Galani, A.,
Charalambopoulou, G. C., Stubos, A. K. Transp. PorousMed. 2005, 58, 43–62.
[28] Roberts, J. N., Schwartz, L. M. Phys. Rev. B 1985, 31,5990–5997.
[29] Skouras E. D. Diffusion and Sorption in Gas Sensors Madeof Semiconducting Nanoceramics. PhD Dissertation,University of Patras,2000.
[30] Willett, M. J., Burganos, V. N., Tsakiroglou, C. D.,Payatakes, A. C. Sens. Actuators B 1998, 53, 76–90.
[31] Kikkinides, E. S., Stoitsas, K. A., Zaspalis, V. T.,Burganos, V. N. J. Membr. Sci. 2004, 243, 133–141.
[32] Yao, J., Thovert, J. F., Adler, P. M., et al. Revue de l’ IFP,1997, 52, 3–21.
[33] Adler, P. M., Jacquin, C. J., Quiblier, J. A. Int. J. Mult. Flow1990, 16, 691–712.
[34] Joshi, M. Y. A Class of Stochastic Models for PorousMaterials PhD Dissertation, University of Kansas, 1974.
[35] Quiblier, J. A. J. Colloid Interface Sci. 1984, 98, 84–102.[36] Yeong, C. L. Y., Torquato, S. Phys. Rev. E 1998, 57,
495–506.[37] Mandelbrot, B. B., van Ness, J. W. SIAM Rev. 1968, 10,
422.[38] Kikkinides, E. S., Burganos, V. N. Phys. Rev. E 1999, 59,
7185–7194.[39] Kikkinides, E. S., Burganos, V. N. Phys. Rev. E 2000, 62,
6906–6915.[40] Kikkinides, E. S., Kainourgiakis, M. E., Stefanopoulos, K. L.,
Mitropoulos, A. C., Stubos, A. K., Kanellopoulos, N. K. J.Chem. Phys. 2000, 112, 9881–9887.
[41] Burganos, V. N., Sotirchos, S. V. Chem. Eng. Sci. 1998,43, 1685–1694.
[42] Abbasi, M. H. A Monte Carlo Simulation of the Diffusion ofGases and Radiant Heat Transfer in Porous Solids orPacked Beds. PhD Dissertation, University of California,Berkeley, CA, 1981.
[43] Evans, J. W., Abbasi, M. H., Sarin, A. J. Chem. Phys.1980, 72, 2967–2973.
[44] Akanni, K. A., Evans, J. W., Abramson, I. S. Chem. Eng.Sci. 1987, 42, 1945–1954.
[45] Burganos, V. N., Sotirchos, S. V. Chem. Eng. Sci. 1989,44, 2451–2462.
[46] Burganos, V. N., Sotirchos, S. V. Chem. Eng. Sci. 1989,44, 2629–2637.
[47] Tomadakis, M. M., Sotirchos, S. V. AIChE J. 1993, 39,397–412.
[48] Melkote, R. R., Jensen, K. F. AIChE J. 1992, 38, 56–66.[49] Levitz, P. Europhys. Lett. 1997, 39, 593–598.
[50] Jeans, J. H. The Dynamical Theory of Gases; CambridgeUniversity Press: London, 1925.
[51] Burganos, V. N. J. Chem. Phys. 1998, 109, 6772–6779.[52] Bird, G. A. Molecular Gas Dynamics and the Direct
Simulation of Gas Flows; Clarendon: Oxford, 1994.[53] Frisch, U., Hasslacher, B., Pomeau, Y. Phys. Rev. Lett.
1986, 56, 1505–1508.[54] Wolfram, S. J. Stat. Phys. 1986, 45 (3/4), 471–526.[55] Bhatnagar, P. L., Gross, E. P., Krook, M. Phys. Rev. 1954,
94, 511–525.[56] Beskok, A., Karniadakis, G. E. Microscale Thermophys.
Eng. 1999, 3, 43–77.[57] Pollard, W. G., Present, R. D. Phys. Rev. E 1948, 73,
762–774.[58] Shen, C., Tian, L. B., Xie, C., Fan, J. Microscale
Thermophys. Eng. 2004, 8, 423–432.[59] Dawson, S. P., Chen, S., Doolen, G. D. J. Chem. Phys.
1993, 98, 1514–1523.[60] Kumar, R., Nivarthi, S. S., Davis, H. T., Kroll, D. M.,
Maier, R. S. Int. J. Numer. Methods Fluids 1999, 31,801–819.
[61] Salles, J., Thovert, J. F., Prevors, L., Auriault, J. L.,Adler, P. M. Phys. Fluids A 1993, 5, 2348–2376.
[62] Maier, R. S., Kroll, D. M., Bernard, R. S., Howington, S. E.,Peters, J. F., Davis, H. T. Phys. Fluids 2000, 12,2065–2079.
[63] Salamon, P., Fernandez-Garcia, D., Gomez-Hernandez, J. J. J. Contam. Hydrol. 2006, 87, 277–305.
[64] Michalis, V. K., Kalarakis, A. N., Skouras, E. D.,Burganos, V. N. Comp. Math. Appl. 2008, 55, 1525–1540.
[65] Koplik, J., Redner, S., Wilkinson, D. Phys. Rev. A 1988,37, 2619–2636.
[66] De Arcangelis, L., Koplik, J., Redner, S., Wilkinson, D.Phys. Rev. Lett. 1986, 57, 996–999.
[67] Sahimi, M., Imdakm, A. O. J. Phys. A: Math. Gen. 1988,21, 3833–3870.
[67a] Michalis, V. K., Kalarakis, A. N., Skouras, E. D.,Burganos, V. N. Water Resour. Res. 2009, 45, W08429doi:10.1029/2008WR007659.
[68] Skouras, E. D., Burganos, V. N., Paraskeva, C. A.,Payatakes, A. C. Sep. Purif. Technol. 2007, 56,325–339.
[69] Skouras, E. D., Burganos, V. N., Paraskeva, C. A.,Payatakes, A. C. J. Chin. Inst. Chem. Eng. 2004, 35, 87–100.
[70] Burganos, V. N., Skouras, E. D., Paraskeva, C. A.,Payatakes, A. C. AIChE J. 2001, 47, 880–894.
[71] Swift, M. R., Osborn, W. R., Yeomans, J. M. Phys. Rev.Lett. 1995, 75, 830–833.
[72] Rowlinson, J. S., Widom, B. Molecular Theory ofCapillarity; Clarendon: Oxford, 1982.
[73] Angelopoulos, A. D., Paunov, V. N., Burganos, V. N.,Payatakes, A. C. Phys. Rev. E 1998, 57, 3237–3245.
[74] Holdych, D. J., Rovas, D., Georgiadis, J. G.,Buckius, R. O. Int. J. Mod. Phys. C 1998, 9, 1393–1404.
[75] Kalarakis, A. N., Burganos, V. N., Payatakes, A. C. Phys.Rev. E 2002, 65, 56702-1/13.
[76] Kalarakis, A. N., Burganos, V. N., Payatakes, A. C. Phys.Rev. E 2003, 67, 016702-1/8.
[77] Inamuro, T., Konishi, N., Ogino, F. Comput. Phys.Commun. 2000, 129, 32–45.
[78] Toolke, J., Freudiger, S., Krafczyk, M. Comput. Fluids2006, 35, 820–830.
[79] Kalarakis, A. N., Burganos, V. N. (in preparation).[80] Rappe, A. K., Casewit, C. J., Colwell, K. S.,
Goddard, W. A., III, Skiff, W. M. J. Am. Chem. Soc. 1992,114, 10024–10035.
[81] Visser, J. W. J. Appl. Crystallogr. 1969, 2, 89–95.[82] Pawley, G. S. J. Appl. Crystallogr. 1981, 14, 357–361.[83] Rietveld, H. M. J. Appl. Crystallogr. 1969, 2, 65–71.
72 Fundamentals of Transport Phenomena in Membranes

[84] Navascues, N., Skouras, E. D., Nikolakis, V.,Burganos, V. N., Tellez, C., Coronas, J. Chem. Eng. Proc.2008, 47, 1139–1149.
[85] Deem, M. W., Newsam, J. M. J. Am. Chem. Soc. 1992,114, 7198–7207.
[86] Krokidas, P., Skouras, E. D., Nikolakis, V., Burganos, V. N.Mol. Simul. 2008, 34, 1299–1309.
[87] Hecht, C. E. Statistical Thermodynamics and KineticTheory; Freeman: New York, 1990.
[88] Maginn, E. J., Bell, A. T., Theodorou, D. N. J. Phys. Chem.1995, 99, 2057–2079.
[89] June, R. L., Bell, A. T., Theodorou, D. N. J. Phys. Chem.1990, 94, 1508–1516.
[90] Caro, J., Noack, M., Kolsch, P., Schafer, R. MicroporousMesoporous Mater. 2000, 38, 3–24.
[91] Ewald, P. P. Ann. Phys. 1921, 369, 253–287.[92] Karasawa, N., Goddard, W. A. Macromolecules 1992, 25,
7268.[93] Greengard, L., Rokhlin, V. I. J. Comput. Phys. 1987, 73,
325.[94] Allen, M. P., Tildesley, D. J. Computer Simulation of
Liquids; Clarendon: Oxford, 1987.[95] Skouras, E. D., Burganos, V. N., Payatakes, A. C. J.
Chem. Phys. 1999, 110, 9244–9253.[96] Skouras, E. D., Burganos, V. N., Payatakes, A. C. J.
Chem. Phys. 2001, 114, 545–552.[97] Agmon, N. J. Chem. Phys. 1984, 81, 3644–3647.
[97a] Hu, Y., Sinnott, S. B. J. Comp. Phys. 2004, 200,251–266.
[98] Berendsen, H. J. C., Postma, J. P. M., vanGunsteren, W. F., DiNola, A., Haak, J. R. J. Chem. Phys.1984, 81, 3684–3690.
[99] Theodorou, D. N., Suter, U. W. Macromolecules 1985, 18,1467–1478.
[100] Widom, B. J. Chem. Phys. 1963, 39, 2808.[101] Tsolou, G., Mavrantzas, V. G., Makrodimitri, Z. A.,
Economou, I. G., Gani, R. Macromolecules 2008, 41,6228–6238.
[102] Gusev, A. A., Suter, U. W. J. Chem. Phys. 1993, 99,2228–2234.
[103] Cohen, M. H., Turnbull, D. J. Chem. Phys. 1954, 31,1164–1169.
[104] Vrentas, J. S., Duda, J. L. J. Polym. Sci. Part B: Polym.Phys. 1977, 15, 403–416.
[105] Vrentas, J. C., Vrentas, C. M., Faridi, N. Macromolecules1996, 29, 3272–3276.
[106] Duda, J. L., Zielinski, J. M. Free-Volume Theory. InDiffusion in Polymers; Neogi, P., Ed.; Marcel Dekker: NewYork, 1996; pp 143–171.
[107] Finkelshtein, E. S., Makovetskii, K. L., Gringolts, M. L.,et al. Macromolecules 2006, 39, 7022–7029.
[108] Heuchel, M., Fritsch, D., Budd, P. M., McKeown, N. B.,Hofmann, D. J. Membr. Sci. 2008, 318, 84–99.
[109] Harmandaris, V. A., Angelopoulou, D., Mavrantzas, V. G.,Theodorou, D. N. J. Chem. Phys. 2002, 116, 7656–7665.
Modeling and Simulation of Membrane Structure and Transport Properties 73

Biographical Sketch
Vasilis N. Burganos is research director at the Institute of Chemical Engineering and High TemperatureChemical Processes, one of the seven institutes that comprise the Foundation for Research and Technology,Hellas. He received his diploma in chemical engineering from the National Technical University of Athens,Greece, and his MSc and PhD from the University of Rochester, USA. His research activities are focused in thegeneral areas of transport phenomena and porous materials, with emphasis on diffusion and sorption, separationprocesses, semiconductive sensors, single and multiphase flow in porous media, capillarity, and pore structuralanalysis. He has also developed computer-aided simulators of jet-break-up and atomization for the preparationof microelectronic circuits, and of land contamination by organic mixtures for the purposes of risk assessment.He has coordinated research in several research and development (R&D) projects, funded by the EuropeanCommission, the General Secretariat for Research and Technology, and the industry. He has authored orcoauthored more than 80 publications in scientific journals and international conference proceedings, edited aMaterials Research Society (MRS) bulletin on membranes and membrane processes, organized an MRSsymposium on membranes, and organized or co-organized various international scientific and educationalevents on nanomaterials and porous media
74 Fundamentals of Transport Phenomena in Membranes

1.04 Fundamentals of Transport Phenomena in PolymerMembranesD R Paul, University of Texas at Austin, Austin, TX, USA
ª 2010 Elsevier B.V. All rights reserved.
1.04.1 Introduction 75
1.04.2 Diffusion in Polymers 76
1.04.2.1 Binary Systems: Fick’s Law 76
1.04.2.2 Ternary Systems: Maxwell–Stefan Equations 77
1.04.3 Sorption of Gases and Vapors in Polymers 78
1.04.3.1 Rubbery Polymers 78
1.04.3.2 Glassy Polymers 79
1.04.3.3 Semi-Crystalline Polymers 81
1.04.3.4 Sorption of Gas or Vapor Mixtures 81
1.04.4 Permeation of Gases and Vapors in Polymers 81
1.04.4.1 Rubbery Polymers 81
1.04.4.2 Glassy Polymers 83
1.04.4.3 Semi-Crystalline Polymers 84
1.04.5 Liquid Permeation in Membranes 84
1.04.5.1 Pervaporation 85
1.04.5.2 Reverse Osmosis 85
References 87
1.04.1 Introduction
The objective of this chapter is to provide the begin-
ning researcher or practitioner a comprehensive
introduction to mass transport in polymeric mem-
branes that will help in digesting and perhaps
extending the vast literature that has developed over
the past half-century and continues to grow rapidly.
The scope is limited to systems where transport occurs
by a solution-diffusion mechanism; this implies that the
membrane has no pores or is fully dense. Of course,
useful membranes are generally complex structures,
but the type of interest here has at least a dense skin
that controls the transport at a molecular level.A common feature of all membranes processes is
the transfer of one or more species from an upstream
fluid phase through the membrane to a downstream
fluid phase; the fluid phases may be gases, vapors, or
liquids. In the solution-diffusion process, the species
being transported molecularly dissolve in the poly-
mer membrane, diffuse through the polymer
segments, and then leave the membrane at the down-
stream surface to enter the fluid phase there. The
polymer is an active participant in both the solution
and diffusion processes. The sorption is a
thermodynamic process while the transport is a
kinetic process, and in each the polymer comprising
the membrane has to be considered one of the com-
ponents. In many porous membranes, the membrane
material is not an active participant and only its pore
structure matters, not its molecular structure. In the
following sections the relationships that describe
penetrant diffusion in polymers will be described;
these can vary from very simple to complex depend-
ing on levels of approximation that are permissible.
Then the various sorption or solution relationships
that can be operative will be described for the differ-
ent polymeric states that find use as membranes. The
solution and diffusion relationships are then com-
bined in various forms for describing the
permeation and permselectivity of species through
membranes. These relationships are first developed
for binary systems, that is, the membrane and one
penetrant. In most membrane processes, there are
two or more penetrants since the purpose is to sepa-
rate these species. In some cases, the simple binary
relationships give an adequate description even for
multiple penetrants if the penetrants permeate
more or less independently. However, penetrant–
penetrant interactions in both sorption and diffusion
75

can occur; thus, the reader is introduced to the con-siderably more complex ternary relationships.
There are a number of books [1–8] and reviewarticles [9–16] that the interested reader can consultfor more details and a further introduction to theliterature on membrane processes.
1.04.2 Diffusion in Polymers
Quite often discussion of diffusion in polymersbegins with the following simple relation betweenthe flux of penetrant and the gradient of itsconcentration:
Flux ¼ –DdC
dzð1Þ
where D is the diffusion coefficient. This version ofFick’s law seems intuitive in its similarity to Fourier’slaw for heat conduction or Ohm’s law for electricalcurrent flow. In may cases, this is an entirely appro-priate description of mass transport, but there arecases where the inherent assumptions implicit inEquation (1) are not met so it is useful to go back tomore rigorous beginnings and understand when thesimple version is adequate and when it is not.
1.04.2.1 Binary Systems: Fick’s Law
The diffusive flux of a species in a mixture must beexpressed relative to some frame of reference. Thereare several ways to deal with this but an easily under-standable one is to use a fixed frame of reference orstationary coordinates; this is particularly appropri-ate for membranes since this means relative to themembrane itself. The following are two fully equiva-lent forms of Fick’s law of binary diffusion in three-dimensional (vector) form [17]:
n1 ¼ w1 n1 þ n2Þ – �D 12rw1ð ð2Þ
N1 ¼ x1 N1 þ N2Þ –CD 12rx1ð ð3Þ
where ni is the mass flux of species i relative tostationary coordinates, Ni the molar flux, wi themass fraction of i, xi the mole fraction, � the massdensity of the mixture, C its molar density, and D 12
the binary diffusion coefficient. Either version can beconverted to the other by simple definitions.Corresponding relations can be written for compo-nent 2 by interchanging the subscripts realizing thatD12¼D21. These forms look similar to Equation (1)except for the terms w1 n1 þ n2ð Þ or x1 N 1 þ N 2ð Þ
that are necessary to express what the diffusion fluxesare relative to as will become clearer below. Equation(3) turns out to be more convenient for mixtures ofgases since at constant pressure and temperature, thetotal molar density, C, is a constant; for ideal gasesC¼ RT/p, where p is the total pressure. Equation (2)is more convenient for liquids since the mass density,�, of such a mixture is more likely to be nearlyconstant than C. So how are these relations adaptedto diffusion of a penetrant in a membrane?
First, it is useful to let the membrane component beidentified with the subscript m and the penetrant withthe subscript 1; this is particularly useful for the caseswhen there are other penetrants as we can identify themas 2, 3, etc. In some cases, the binary form of Fick’slaw can be used when there are more than two compo-nents but not always. Second, since diffusion throughmembranes is almost always unidirectional (e.g., thez-direction), Equations (2) and (3) can be written with-out vector notation as done for Equation (1). Third, forall practical cases in steady state, the membrane itself isstationary so the flux of this component is zero. Finally,it is important to recognize that for polymeric mem-branes, molar concentrations and terms like xi or C inEquation (3) are at best ill-defined and at worst notmeaningful since the molecular weight of the polymermay not be unique or may even be infinite. The earliestthermodynamic treatments of polymer mixturesrevealed that mole fractions were not an appropriateway to express compositions in such systems [18]. Thus,Equation (2) provides a more useful form of Fick’s firstlaw for membrane systems. With the simplificationsnoted above, it becomes
n1 ¼ –�D 1m
1 –w1
dw1
dz¼ –
�D 1m
wm
dw1
dzð4Þ
This still does not quite look like the simple form ofEquation (1). First, there is the (1�w1)¼wm termwhich arises because of frame of reference considera-tions or a convection term. As shown later, it isnecessary to include this term in some cases; how-ever, when the content of penetrant in the membraneis very small, w1 << 1, then wm
�¼ 1. In addition, whenthe mass density of the membrane–penetrant mix-ture, �, is constant (this will surely be the case whenw1 << 1), then Equation (4) reduces to
n1 ¼ – D 1md�1
dzð5Þ
where �1 is the mass concentration of species 1 and n1
is the mass flux. Dividing both sides by the molecularweight of 1 leads to
76 Fundamentals of Transport Phenomena in Membranes

N1 ¼ – D 1mdC1
dzð6Þ
where C1 is the molar concentration of 1 and N1 is itsmolar flux; in this simple form the flux and concen-tration can be written in any units so long as they areconsistent. Equation (6) is identical to the familiarEquation (1) noting that D ¼ D 1m. It is clear whatassumptions are behind Equations (1) and (6) andwhy it is necessary to be careful about these detailsin order to have D 1m be the same quantity through allthese different forms.
Of course, for all membrane separations there isalways more than one penetrant so the question is
how to formulate a proper diffusion law for a ternary
or multicomponent mixture. Fortunately, in many
cases it is adequate to use a version of Equations (5)
or (6) applied to each component i. This amounts to
assuming that each component diffuses as if the other
were not present; however, there are several ways
such a simplification can fail. A most common situa-
tion is when the presence of component j affects the
diffusion coefficient for component i, that is,
D 1m ¼ f ðCj Þ or plasticization occurs. Another com-
plication is when the penetrant concentrations are
not small enough to use the approximation wm > 1.
A further complication is when the flux of one spe-
cies is dependent on the gradient of concentration of
other species. It is truly difficult to correctly and
accurately sort out all these potential interactions.
The next section gives a logical starting framework
to deal with these effects.
1.04.2.2 Ternary Systems: Maxwell–StefanEquations
In some simple cases, ad hoc generalizations of
Equations (2) or (3) to multicomponent mixtures
have been suggested [17]; however, in general, this
approach is not sufficient and leads to obvious pro-
blems [16]. A more sound approach is to begin with
the Maxwell–Stefan equations that were originally
developed to describe multicomponent diffusion in
gas mixtures at low density and can be derived from
kinetic theory [17, 19]. These equations have been
extended with good success to dense gases, liquids,
and polymers [17]; many review papers and books
have discussed uses of these equations [17, 20]. A
general form of the one-dimensional Maxwell–Stefan
equations for isothermal multicomponent mixtures
can be written as
di ¼ –Xj 6¼i
xi xj
D�ijvi – vj
� �ð7Þ
where the D�ij are multicomponent diffusion coeffi-cients [17], xi is the mole fraction of i in the mixture,and vi is the velocity of i in the z-direction relative tostationary coordinates. The term di is a generalizedforce (in the z-direction) for component i that causesit to diffuse relative to other species. Its general form is
CRT di ¼ Ci d�mi =dz –wi dpm=dz ð8Þ
where
d�mi
dz¼ RT
d ln ami
dzþ �Vi
dpm
dzð9Þ
where C is the molar density of the mixture, Ci isthe molar concentration of i (note xi¼Ci/C), �m
i isthe chemical potential of i in the membrane, am
i in theactivity of i in the membrane, and pm is the pressurein the membrane. For nonporous-supported mem-branes, the pressure throughout the membrane isconstant (see References 14, 16, and 21–30) so forthe cases of interest here, dpm/dz¼ 0. As a result,Equation (7) simplifies to
–Xj 6¼i
xi xj
D ij
vi – vj
� �¼ xi
d ln ami
dzð10Þ
The pressure that drives many membrane transport
processes does not enter the picture by the flux law
but comes in via the boundary conditions used in the
integration of these equations.Equation (10) can be expressed in forms more
useful for describing diffusion in membranes. In
steady state, the velocity or flux of the membrane
material is zero relative to stationary coordinates,
that is, vm¼ nm¼ 0. Penetrant velocities can be con-
verted to fluxes via
ni ¼ wi�v1 ð11Þ
where � is the mass density of the membrane-penetrants mixture. As noted earlier, use of molefractions is not useful for membrane systems; thisissue can be resolved by converting to volume ormass fractions as discussed in recent papers [16, 31,32]. Mass fractions and fluxes will be used here, andthe conversion can be accomplished by the following:
xi ¼M
Mi
wi ; M ¼X wj
Mj
� � – 1
ð12Þ
where Mi is the molecular weight of i and M is thenumber average molecular weight of the mixture. Itcould be said that M is ill-defined because of the
Fundamentals of Transport Phenomena in Polymer Membranes 77

ambiguity of the molecular weight of the membranematerial; however, this potential complicationappears to be resolved by redefining the diffusioncoefficients. In the end, these diffusion coefficientsmust be determined experimentally. For a ternarysystem, Equation (10) requires three independentcoefficients: D�1m; D�2m, and D�12. With the conver-sion to mass fractions, it becomes useful to redefinethe diffusion coefficients in the following way:
Dij ¼ Dij
Mj
Mð13Þ
since they always appear in these combinations [16,31]; similar redefinitions in terms involving molarvolumes are needed when expressing Equation (10)in terms of volume fractions [32]. With the abovesimplifications, the Maxwell–Stefan equations for the1–2-m ternary can be reduced to the following equa-tions (after considerable algebra):
n1 þw2n1 –w1n2
wm
� �D 1m
D 12
� �¼ –
�w1D 1m
wm
d ln a1
dzð14Þ
n2 þw1n2 –w2n1
wm
� �M2
M1
D 2m
D 12
� �¼ –
�w2D 2m
wm
d ln a2
dzð15Þ
The wm ¼ 1 –w1 –w2ð Þ in the denominator of the
right-hand terms in each of the two equations reflects
convection or frame of reference considerations
inherently included in the Maxwell–Stefan equa-
tions. Alternate forms of Equations (14) and (15) can
be written in terms of gradients of concentration or
weight fractions by making use of the definition
D im ¼ D im@ ln ai
@ ln wi
� �T ;p
ð16Þ
to get
n1 þw2n1 –w1n2
wm
� �¼ –
�D 1m
wm
dw1
dzð17Þ
n2 þw1n2 –w2n1
wm
� �M2
M1
D 2m
D 12
� �¼ –
�D 2m
wm
dw1
dzð18Þ
Equations (17) and (18) can be solved simultaneously
to get independent equations for n1 and n2, but this
adds great complexity [9]. Indeed, this complexity is
why the more rigorous Maxwell–Stefan formulation
is used so infrequently in the membrane literature.
Importantly, Equations (17) and (18) reduce to Fick’s
law, Equation (4), where there is component 2 pre-
sent and likewise, in some cases, where w2 and n2 are
small.
1.04.3 Sorption of Gases and Vaporsin Polymers
Knowledge about the equilibrium sorption of gasesor vapors in polymers is essential for understandingthe process of permeation by the solution-diffusionmechanism. Thus, considerable effort has beendevoted to measuring and interpreting the sorptionisotherms for small molecules in rubbery, glassy, andsemi-crystalline polymers [4–9, 33–38]. The limitingcases described below are useful for understandingthe possibilities. In a subsequent section these modelsare used to set the boundary conditions for permea-tion of gas and vapors in polymers.
1.04.3.1 Rubbery Polymers
Consider an amorphous polymer membrane aboveits glass transition temperature, Tg, surrounded by avapor of component 1 at a partial pressure p1. If thesaturation vapor pressure of 1 is p�1 , then its activity inthe vapor phase is a1 ¼ p1=p�1 . The Flory–Hugginsthermodynamic model for mixing small molecules ofmolar volume �V 1 with large polymer molecules ofmolar volume �V m combines an estimate for theentropy of mixing with a measure of the enthalpyof mixing, expressed in terms of an interaction para-meter �1, to give the following expression for theequilibrium sorption [18]:
ln a1 ¼ ln�1 þ 1 – �V1= �Vmð Þ�m þ �1�2m ð19Þ
where the �i are volume fractions. Figure 1 showsexample calculations, using Equation (19), of theamount of sorption of penetrant 1, expressed as �1,in the membrane at equilibrium versus its activity inthe vapor phase for several values of the dimension-less interaction parameter, �1. At low activity, theextent of sorption is proportional to p1; however, theisotherm shows upward curvature at higher activities.The degree of curvature increases with the extent ofsorption as the interaction parameter decreases orbecomes more favorable for mixing. If the interactionparameter depends on the amount of vapor sorbed,the shape will be altered somewhat but the upwardcurvature remains a generally expected shape forsimple systems where sorption can be modeled as anearly random mixing process.
In the limit of low activities or small extents ofsorption, a linear approximation to the sorption
78 Fundamentals of Transport Phenomena in Membranes
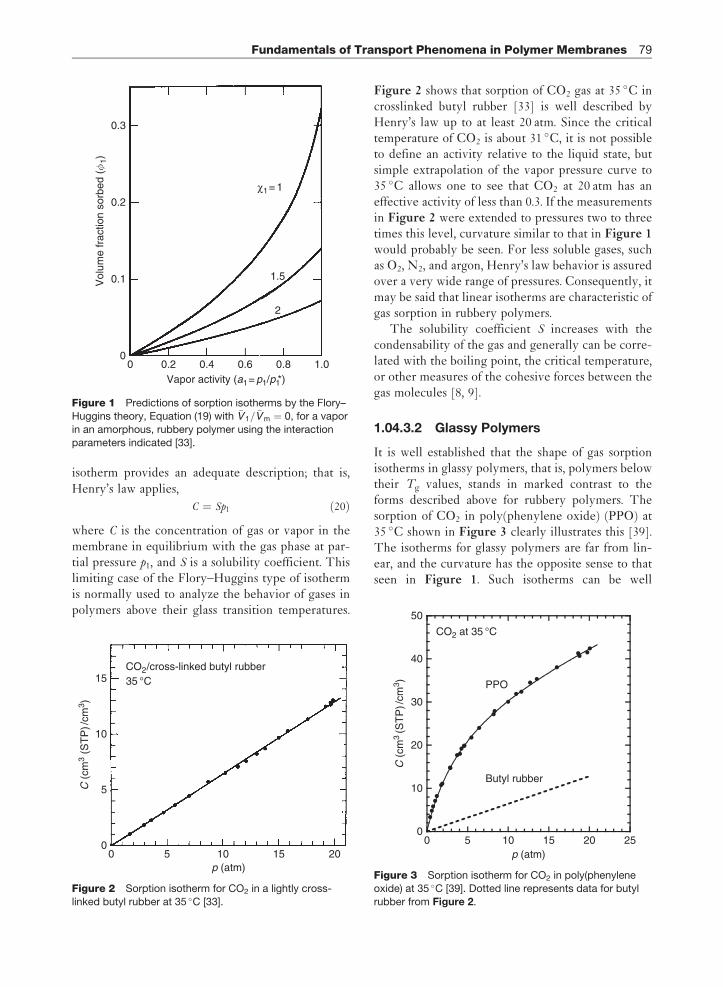
isotherm provides an adequate description; that is,
Henry’s law applies,
C ¼ Sp1 ð20Þ
where C is the concentration of gas or vapor in themembrane in equilibrium with the gas phase at par-tial pressure p1, and S is a solubility coefficient. Thislimiting case of the Flory–Huggins type of isothermis normally used to analyze the behavior of gases inpolymers above their glass transition temperatures.
Figure 2 shows that sorption of CO2 gas at 35 �C incrosslinked butyl rubber [33] is well described byHenry’s law up to at least 20 atm. Since the criticaltemperature of CO2 is about 31 �C, it is not possibleto define an activity relative to the liquid state, butsimple extrapolation of the vapor pressure curve to35 �C allows one to see that CO2 at 20 atm has aneffective activity of less than 0.3. If the measurementsin Figure 2 were extended to pressures two to threetimes this level, curvature similar to that in Figure 1would probably be seen. For less soluble gases, suchas O2, N2, and argon, Henry’s law behavior is assuredover a very wide range of pressures. Consequently, itmay be said that linear isotherms are characteristic ofgas sorption in rubbery polymers.
The solubility coefficient S increases with thecondensability of the gas and generally can be corre-lated with the boiling point, the critical temperature,or other measures of the cohesive forces between thegas molecules [8, 9].
1.04.3.2 Glassy Polymers
It is well established that the shape of gas sorptionisotherms in glassy polymers, that is, polymers belowtheir Tg values, stands in marked contrast to theforms described above for rubbery polymers. Thesorption of CO2 in poly(phenylene oxide) (PPO) at35 �C shown in Figure 3 clearly illustrates this [39].The isotherms for glassy polymers are far from lin-ear, and the curvature has the opposite sense to thatseen in Figure 1. Such isotherms can be well
10p (atm)
CO2/cross-linked butyl rubber35 °C
500
5
10
C (
cm3
(ST
P)/
cm3 )
15
15 20
Figure 2 Sorption isotherm for CO2 in a lightly cross-
linked butyl rubber at 35 �C [33].
0.1Vol
ume
frac
tion
sorb
ed (
φ 1)
0.2
0.3
00 0.2 0.4
Vapor activity (a1= p1/p1*)0.6
2
1.5
χ1= 1
0.8 1.0
Figure 1 Predictions of sorption isotherms by the Flory–
Huggins theory, Equation (19) with �V 1= �V m ¼ 0, for a vapor
in an amorphous, rubbery polymer using the interaction
parameters indicated [33].
0 5 10 15 20 25p (atm)
0
10
20
30
40
50
C (
cm3
(ST
P)/
cm3 ) PPO
CO2 at 35 °C
Butyl rubber
Figure 3 Sorption isotherm for CO2 in poly(phenylene
oxide) at 35 �C [39]. Dotted line represents data for butyl
rubber from Figure 2.
Fundamentals of Transport Phenomena in Polymer Membranes 79

described by a model that is an additive combination
of Henry’s law and a Langmuir isotherm, that is,
C ¼ kdp þ C9Hbp
1þ bpð21Þ
where kd, C9H, and b are parameters of the model. Thisform implies that there are two mechanisms of sorp-tion in glassy polymers [9, 36–41]. Many alternativesto this model and its implied mechanistic aspectshave been suggested over the years [40–55]; how-ever, this so-called dual sorption model continues tobe widely used for describing sorption in glassypolymers.
Generally, gases are more soluble in glassy poly-mers than rubbery ones [9] as may be seen in
Figure 3 by comparing the sorption of CO2 in PPO
versus that in butyl rubber; the dashed line is repro-
duced from Figure 2. Studies have shown that the kD
parameter from the dual sorption model, obtained
from sorption data below Tg, varies smoothly with
temperature through the glass transition forming a
continuous connection with data above Tg, where
simple Henry’s law behavior, that is, Equation (20),
is observed [38]. This, plus other observations, pro-
vide strong evidence that the Henry’s law term in
Equation (21) is physically a manifestation of the
same solubility mechanism operative for gases in
rubbery polymers or organic liquids. Thus, it follows
that the Langmuir term in Equation (21) stems from
the nonequilibrium character of the glassy state, and
this is supported by considerable evidence [9, 55–61].
Additional evidence for this can be seen by examin-
ing the Langmuir capacity term C9H for one gas, CO2,
measured at a single temperature, 35 �C, in a wide
range of glassy polymers; Figure 4 shows that C9Hplotted versus the polymer glass transition tempera-
ture provides a remarkable correlation [56]. It has
been suggested [55] that the Langmuir term arises
from packing of gases like CO2 into the unrelaxed
volume of the glass Vg –Vl
� �with a liquid-like den-
sity. The unrelaxed volume at any temperature T
may be estimated from thermal expansion coeffi-
cients above and below Tg; that is,
Vg –Vl
Vg¼ �l –�g
� �Tg –T� �
ð22Þ
Since �l –�g
� �values are quite similar for most
polymers, it follows from this picture that C9H should
be proportional to Tg –T� �
, as seen in Figure 4. The
support for this interpretation of the Langmuir mode
is the quantitative agreement shown by numerous
sets of experimental observations, including
Figure 4 [57]. From the above, it should be clear
that sorption in glassy polymers will depend on the
material’s prior history as supported by many obser-
vations [60, 61]. The unrelaxed volume of the glass
may decrease with aging time, especially at tempera-
tures just below Tg, leading to decreased sorption
[60]. On the other hand, sorption of gases or vapors
in the polymer may lead to an increased unrelaxed
volume upon desorption that in turn leads to
increased sorption in subsequent experiments [61].
These effects of conditioning are sometimes mani-
fested as hysteresis between sorption and desorption
observations [4].Sorption of large enough amounts of gases and
vapors in any polymer causes plasticization; one
manifestation of this is a reduction in the glass transi-
tion temperature. Because of this, the sorption
isotherm under certain conditions may exhibit the
characteristic glassy-type shape (see PPO data in
Figure 3) at low pressures and then revert to the
characteristic rubbery-type shape (shown by butyl
rubber in Figures 2 and 3) at high pressures [62].
This can be seen for glassy polymers whose Tg values
are not much higher than the temperature of sorption
5000
10
20
30
100 150 200
PSFPC
PS
PETPEMA
C1 H
(cm
3 (S
TP
)/cm
3 )
35 °C
COP
PMMA
PPO/PS
PC/COP
PPO
Tg (°C)
Figure 4 Correlation of measured values of the Langmuir
sorption capacity at 35 �C with the glass transitiontemperature of the polymer [34]. PPO, poly(phenylene
oxide); PSF, polysulfone; PC, polycarbonate; PMMA,
poly(methyl methacrylate); PS, polystyrene; COP,
copolyester; PEMA, poly(ethyl methacrylate); and PET,poly(ethylene terephthalate). Miscible blends of polymer
pairs shown: ( ) PPO/PS; ( ) PC/COP.
80 Fundamentals of Transport Phenomena in Membranes

and whose Tg values are lowered by plasticization asgas or vapor is sorbed such that the original glassbecomes a rubber within the range of pressure overwhich the isotherm is measured. Figure 5 shows anexample of this for sorption of CO2 in a polystyrenecontaining 3 wt.% of the lubricant, mineral oil [62].
1.04.3.3 Semi-Crystalline Polymers
In most cases, penetrants do not dissolve in the crystal-line regions of semi-crystalline polymers [63]. Thereason for this is that usually the crystal is significantlymore dense than the amorphous phase; thus, there ismuch less free volume to accommodate insertion ofpenetrants. However, there are some exceptionswhere the crystals are similar in density as the amor-phous phase in which case there is evidence forsolubility in the crystal phase [64–66]. If there is nosolubility in the crystalline regions, then sorption ismodulated by the extent of crystallinity [63]. Theshape of the sorption isotherm is dictated by whetherthe amorphous phase is above or below its Tg.
1.04.3.4 Sorption of Gas or Vapor Mixtures
For membrane separation processes the feed containstwo or more types of gases. In the simplest of caseswhen the extent of sorption by all species is quitesmall, the individual components sorb as if the othersare not present. However, there can be interactionsbetween the penetrants or between one or more of
the penetrants and the membrane polymer that causemore complex behavior; in these cases, mixed gassorption data may be needed [67, 68]. The mosttypical case is where one component is sorbed to arather considerable extent plasticizing the polymerand, thereby, altering the sorption behavior of othercomponents. In glassy polymers, there may be com-petitive sorption effects that can be described by anextension of the dual sorption model [69].
1.04.4 Permeation of Gases andVapors in Polymers
To understand or describe the permeation of smallmolecules through polymer membranes by the solu-tion-diffusion mechanisms requires combining theresults in Sections 1.04.3 and 1.04.4 using only appro-priate assumptions so that the details of interest canbe captured. Permeation involves transferring com-ponents from an upstream fluid phase into themembrane, diffusion through the membrane, andthen transferring these components to a downstreamfluid phase. Basically, the sorption behavior discussedin Section 1.04.3 defines the boundary conditions forthe diffusion in the membrane discussed in Section1.04.2. In nearly all cases the surfaces of the mem-brane are in equilibrium with the fluid phase towhich they are adjacent. Permeability coefficientsare based on the driving force difference betweenthe upstream and downstream fluid phases whilediffusion coefficients are based on the driving forcedifference between the two surfaces but within themembrane phase.
1.04.4.1 Rubbery Polymers
First, we consider the steady-state permeation ofsimple gases in rubbery polymers where Equations(20) and (6) adequately describe the sorption anddiffusion processes. Assuming D 1m is not concentra-tion dependent, Equation (6) can be integrated acrossthe membrane to get
N1 ¼ D 1mC10 –C1,
,ð23Þ
where , is the membrane thickness, C10 and C1, arethe concentrations of 1 in the membrane at theupstream (z¼ 0) and downstream (z¼ ,) surfaces,respectively. From Equation (20), C10 ¼ S1p10 andC1, ¼ S1p1,, where p10 and p1, are the partial pres-sures of 1 in the upstream and downstream fluidphases, respectively. Thus, Equation (23) becomes
1000
5
10
15
20
p (atm)
20
65 °C
55 °C
45 °C
Polystyrene + 3% mineral oilCO2
30
C (
cm3
(ST
P)/
cm3 )
Figure 5 Effect of temperature on sorption isotherms for
CO2 in polystyrene containing mineral oil [33].
Fundamentals of Transport Phenomena in Polymer Membranes 81

N1 ¼ D 1mS1p10 – S1p1,
,¼ D 1mS1
�p1
,ð24Þ
where �p1 ¼ p10 ¼ p1,. The permeability coefficientP1, in general, is defined by
P1 X,N1
�p1ð25Þ
but is given by the product D 1mS1 in this case.If a second gas 2 is also permeating but the con-
centrations of both 1 and 2 are small enough that D im
and Si are the same as if the other gas were not present,then the permeation in the mixed gas case can bedescribed by the pure gas coefficients. An often-usedmeasure of the selectivity of this permeation process isthe ratio of the permeability coefficients:
P1
P2¼ D 1m
D 2m
� �S1
S2
� �ð26Þ
that is the product of diffusion and solubility selec-tivity components.
Transient permeation experiments are often usedto obtain the P, D , and S coefficients. In this experi-ment, the membrane is degassed from both sides untilno sorbed gas remains. At time t¼ 0, a certain fixedpressure is imposed at the upstream surface of themembrane while the total amount of gas that hasexited the downstream membrane surface until timet, Qt , is measured. The result will look like the graphof Qt versus t shown in Figure 6. Eventually, a steadystate is reached where the flux is given byð1=AÞ dQ =dtð Þss, where A is the membrane area.
Extrapolation of the linear region of Qt versus t
intercepts the time axis at t¼ �. This time lag, �,
reflects the time it takes for a steady-state concentra-
tion profile to build inside the membrane (see inset in
Figure 6). To describe this unsteady-state situation
requires combining Equation (6) with a differential
mass balance to get Fick’s second law:
@C1
@t¼ –
@N1
@z¼ @
@zD 1m
@C1
@z
� �¼ D 1m
@2C1
@z2ð27Þ
The last step is only justified when the diffusion
coefficient does not depend on concentration.
Equation (27) can be solved [70] using the conditions
at the membrane surface described earlier, that is,
C1¼ 0 for all z at t < 0, then for t� 0 C10¼ constant
and C1, = 0. From such a solution, the following
important result can be deduced [70]:
� ¼ ,2
6D 1mð28Þ
Thus, by the transient permeation experiment one
measures � and P from which D 1m is obtained from
Equation (28) and S1 from P1 ¼ D 1m S1. Of course, S1
can also be measured directly using sorption experi-
ments. Often, diffusion and solubility coefficients are
deduced from transient experiments when the
assumptions implicit in the above are not strictly
met, for example, a concentration-dependent diffu-
sion coefficient, in which case these coefficients
should be considered apparent values; they may still
have some utility, however.For rubbery polymers, highly condensable gases
or vapors may no longer follow Henry’s law but
follow relations more similar to those in Figure 1.
In principle, the same methodology described above
can be followed, but certain caveats apply. First, the
solubility coefficient is no longer a constant. Second,
the diffusion coefficient is most likely not constant
due to plasticization. Finally, at high penetrant con-
centrations, the convective terms seen in Equations
(2)–(4) may not be negligible as assumed in
Equations (5) and (6). When there is only a single
penetrant, these problems can be dealt with using
somewhat more complicated mathematical analyses
and more detailed experimental measurements. For
example, Equation (4) can be integrated as follows for
a steady-state analysis:
Z ,
0
n1dz ¼ n1, ¼Z w10
w1,
�D 1m
1 –w1
� �dw1 ð29Þ
Polymer
ss
l
C
Qt
θ
t
t
dQt
dt ss( )
Figure 6 Amount of gas that has permeated through amembrane in time t illustrating a transient permeation
experiment. Inset shows how the concentration profile
develops over time.
82 Fundamentals of Transport Phenomena in Membranes

If one knows D 1m as a function of w1, then theintegration can be carried out, at least numerically,to calculate the flux as a function of the boundaryconditions or the external fluid phase partial pres-sures, or activities, assuming the sorption isothermhas been measured. More often than not, the situationis that n1 has been measured as a function of theexternal fluid phase conditions and the issue is todeduce D 1m (w1) from this information. Often oneassumes a mathematical form for D 1m (w1) such as
D 1m ¼ D 1mð Þ0e – Aw1 ð30Þ
and performs the integration in Equation (29), per-haps with some simplifications, and fits the resultingmathematical form to the experimental data to getthe model parameters.
However, when there are two or more penetrants, asthere always is for separations, this problem grows morecomplex in several respects. In general, the variouscomponents do not sorb or diffuse as if the otherswere not there as in the case for very slightly solublegases (e.g., see Equation (26)). Rather, the permeation ofthe species may be coupled in various ways. At the veryleast, the diffusion coefficient for one species maydepend not only on its own concentration but on theconcentration of all the other species as well. In thesimplest of these cases, all the diffusion coefficientsdepend on the total penetrant concentration, that is,w ¼ w1 þ w2 for the case of two penetrants. Such anapproach has recently been described, and the reader isreferred to Reference 68 for the details.
Coupling at a more subtle level may occur bythe flux of one species depending on the gradient ofthe concentration of another species. These issues, plusthe frame of reference terms, are formally consideredin the Maxwell–Stefan equations discussed in Section1.04.2.2. This level of complexity has rarely been usedin analyzing membrane processes for understandablereasons. However, a recent paper provides an in-depthexperimental study with the results analyzed by theMaxwell–Stefan equations as well as Fick’s law [68]. Inthis case, the contribution of the extra effects includedby the Maxwell–Stefan approach versus Fick’s law wasof similar order as the experimental uncertainty. It ispremature to judge if this conclusion is general or not.
1.04.4.2 Glassy Polymers
Steady-state permeation of a gas through a glassypolymer raises the questions of whether there aretwo populations of sorbed gas as implied by
Equation (21) and, if there are, do they have differentlevels of mobility. A vast body of literature toonumerous to list here has dealt with these questions[9, 57, 72–77]. Within the context of the dual sorptionidea, the following model for the flux of a pure gashas been widely used [9, 57, 72, 73]:
Flux ¼ –DD@CD
@z–DH
@CH
@zð31Þ
where two diffusion coefficients and concen-trations corresponding to the Henry’s lawpopulation (D¼ dissolved) and the Langmuir popu-lation (H¼ holes) in Equation (21) are used. At firstglance, Equation (31) would appear to suggest twoparallel and independent pathways of diffusion; how-ever, Barrer [73] has shown that this model is moregeneral. A steady-state analysis of Equations (21) and(31) shows the permeability coefficient, P, to be givenby [72]
P ¼ kDDD 1þ FK
1þ bp0
� ð32Þ
where F ¼ DH=DD;K ¼ C9Hb=kD, and p0¼ upstreampressure of the permeating gas; the downstream pres-sure has been assumed to be zero. For clarity,subscripts denoting the component have been omitted.Equation (32) indicates that the permeabilitydecreases slightly as p0 increases as has been observedrepeatedly for glassy polymers [9, 57, 58]. Figure 7shows data for CO2 permeation in PPO [39] plotted assuggested by Equation (32); clearly, the experimental
50
55
60
65
70
75
80
0 0.2 0.4 0.6 0.8 1
P (
Bar
rers
)
1/(1 + bp0)
PPO/CO2 at 35 °C
F = 0.06
Figure 7 Permeability of CO2 in poly(phenylene oxide) asa function of upstream pressure, p0, plotted as suggested
by Equation (32). From Maeda, Y. PhD Dissertation,
University of Texas at Austin, 1985.
Fundamentals of Transport Phenomena in Polymer Membranes 83

results conform quite well to this theoretical predic-tion as has been shown repeatedly for glassy polymerswhen complicating factors like plasticization are notimportant [9, 57, 58, 74–77]. The parameters ofEquation (21) can be deduced by fitting of sorptiondata while the parameters DD and F can be obtained byfitting of permeation data to Equation (32); the data inFigure 7 give a value of F¼ 0.06 which is typical ofmost glassy polymers. The implications are that theLangmuir part of the sorption processes in glassypolymers tends to partially trap gas molecules, thatis, their mobility is about an order of magnitude lessthan the gas molecules sorbed by the equilibrium orHenry’s law mode.
An analysis of transient permeation has been madefor the case when Equations (21) and (31) apply[9, 72] and predicts the time lag � to be a complexrelation of the form
� ¼ ,2
6DD1þ f K ; F ; bp0ð Þ½ � ð33Þ
where the function f is quite involved [72]. Thisrelation predicts that � is a decreasing function of p0
as observed experimentally [9, 58]; this is in contrastto the simple equation (28) where � is independent ofthe upstream pressure. Clearly, values of the solubi-lity, diffusion and permeability coefficients for glassypolymers computed by the methods outlined inSection 1.04.4.1 are only apparent values and arepressure dependent. Nevertheless, such quantitiesare useful and widely used in the literature, forexample, Equation (26) continues to be used to assesswhat part of the permselectivity (i.e., P1/P2) is due tosolubility versus diffusive selectivity [4, 8].
The above results assume that effects due to plas-ticization by the sorbed gas are not significant;however, as the concentration of the gas in the poly-mer increases to high enough levels due to very highpressures or high intrinsic solubility (e.g., highly con-densable gases like CO2 or vapors), plasticizationinevitably occurs and the above analyses no longerdescribe the observations. A particularly importantexample of this involves separation of CO2 or lighthydrocarbons from high pressure natural gas [4, 7, 8].Typically, the permeability of glassy polymers toCO2 will first decrease as the driving pressureincreases as expected from Equation (32) and thengo through a minimum and rise with furtherincreases in upstream pressure owing to plasticiza-tion [14–82]. Formally, one can describe such effectsby assigning concentration dependence to the para-meters in Equations (21) and (31) [78]; however, this
increases the number of parameters and the resulting
analyses become very complex and can be devoid ofphysical meaning as a result. Since glassy polymers
are not in equilibrium, the observations also become
time dependent [79, 80] and may show hysteresis as
the pressure is moved up and down [43].For gas separations by glassy polymers, pure gas
permeation behavior is not always a reliable indicatorof mixed gas behavior. As a result, mixed gas mea-
surements for both sorption and permeation may be
needed [82]. Even in the absence of plasticization,
competitive sorption effects can occur such that the
presence of one component affects the transport ofthe other as shown by theoretical analyses and
experiment [83, 84]. These effects can become quite
severe in very high free volume polymers [85]. Of
course, plasticization complicates the behavior even
further [83, 85–87]. An active area of research is thedevelopment of membrane materials that are more
resistant to plasticization [82, 86–89].
1.04.4.3 Semi-Crystalline Polymers
As described in Section 1.04.3.3, the presence of crys-
tallinity in a polymer generally reduces the sorptionof penetrants since usually these molecules do not
enter the crystals. The effects on permeation can be
even more dramatic since the shape of the crystals, in
addition to their amount, affects the diffusion process
owing to the tortuosity effect. In addition, the pre-sence of crystals may alter the mobility of the
penetrant in the amorphous phase. Further discus-
sion of this complex, but important, behavior will not
be given here since generally semi-crystalline poly-
mers are not used for membranes owing to theirusually lower permeability and issues of processing.
The reader can consult a few key references to begin
exploring this subject [90–92].
1.04.5 Liquid Permeation inMembranes
There are at least two important membrane pro-
cesses (reverse osmosis [1, 16] and pervaporation
[2]) that operate by a solution-diffusion mechanism
where the feed is a liquid. Here, the latter is dealtwith briefly while the former is analyzed more
extensively.
84 Fundamentals of Transport Phenomena in Membranes

1.04.5.1 Pervaporation
In this process, a mixture of liquids, for example,ethanol and water or aromatic and aliphatic hydro-carbons, are fed to the upstream side of a densemembrane while the permeate leaves as vapor; thus,the term stems from permeationþ evaporation.This is a very complex process to describe mathe-matically since interactions of the permeating specieswith the polymer and with each other clearly requirethe consideration of plasticization, convective terms,and possibly coupling as treated by the Maxwell–Stefan equations. There is a vast experimental andtheoretical literature on the topic; it is beyond thescope here to review this.
Here, we treat the problem in its simplest possibleform where all of the complications mentioned aboveare ignored. We assume that the equilibrium uptakeof component 1 by the membrane is w1
� and that theactivity of 1 in the polymer is given by am
1 ¼ w1=w�1 .Ignoring convective terms, plasticization or interac-tion issues, the flux of 1 would then be given by [9]
n1 ¼ –�D 1m
,w10 –w1,ð Þ ¼ �w�1 D 1m
,1 – p1=p�1 �
ð34Þ
since by our assumptions am1, ¼ w1=w�1 ¼ p1=p�1 . In
the limit of a high vacuum on the downstream side,the maximum possible flux becomes [9]
n1 ¼�w�1 D 1m
,ð35Þ
We will return to this result later. Clearly, thepermselectivity of species 1 relative to 2 is given bythe product of solubility and diffusivity parts as inEquation (26). Of course, in practice the flux andpermselectivity are described by much more com-plex relations [2, 71].
1.04.5.2 Reverse Osmosis
Reverse osmosis refers to a process where a solvent(species 1) and solute (species 2) are fed to theupstream of the membrane at a high pressure p0
while the permeate stream exits the downstream ata lower pressure p, (typically atmospheric) as a liquidwith a lower content of solute. The most commonapplication of this process is desalination of water (1);however, this technique may be applied to situationswhere solvents and solutes other than water and saltare involved. The main purpose here is to show howthe driving force �p ¼ p0 – p,ð Þ leads to the transport
of solvent across the membrane by a solution-
diffusion mechanism [16].We begin with the binary form of Fick’s law given
in Equation (4); a similar result comes from Equation
(17) when w2 and n2 are small as assumed here. The
convective term in the denominator, (1�w1), can be
ignored when w1 is small but doing so results in a
redefinition of the binary diffusion coefficient when
w1 is significant compared to unity. Equation (4) is
written in either of the following differential or inte-
grated forms when � and D 1m are independent of
concentration:
n1 ¼ –�D 1m
1�w1
dw1
dz¼ �D 1m
, wmh i w10 –w1,ð Þ ð36Þ
The convective term in the denominator of the dif-ferential form means that the concentration profile,or w1 versus z, is not strictly linear which complicatesthe integration. To retain the expected form of theintegration and its associated physical meaning, it isconvenient to define an average value of 1�w1¼wm
designated as wmh i. The thickness in Equation (36) isthe actual thickness of the membrane with a solventgradient which may differ from the dry thicknesswhen there is no solvent in the membrane or theuniformly swollen thickness. The details of comput-ing wmh i and , are given elsewhere [9] and are notrepeated here as it detracts from our main purpose.
The value of w10 –w1, to be inserted in Equation(36) stems from the thermodynamic equilibrium the
two membrane interfaces have with the upstream and
downstream external phases (see schematic in
Figure 8). Paul et al. described an explicit procedure
for handling this thermodynamic analysis in reverse
osmosis or the so-called hydraulic permeation
μm1� = μ s
1�
at z = �
μ1
p0
p�
w10
w1�
0 � z
μm10= μs
10
at z = 0
Figure 8 Chemical potential, pressure, and concentration
profiles in a reverse osmosis membrane.
Fundamentals of Transport Phenomena in Polymer Membranes 85

[21–30]. The fundamental premise of this approach isto realize that the conditions of mechanical equili-brium require the pressure in a homogeneous,supported membrane to be constant throughout itsthickness at the value imposed upstream, p0, as sche-matically illustrated in Figure 8. This point, whichwas somewhat controversial when first introduced,now seems to be well recognized [14–16]. For anyspecies i, or component 1 as shown in Figure 8, thechemical potentials in the phases on each side ofeither membrane-solution interface are equal asstipulated by thermodynamics. Inside either the solu-tion or the membrane phases, we can write thefollowing expression for the chemical potential of i
in terms of activity (or concentration) and pressure asfollows:
�i ¼ �oi þ RT ln ai þ �Vi p – prð Þ ð37Þ
where pr is an arbitrary reference pressure (we willtake this to be p,) and �o
i is a corresponding integra-tion constant that depends on the reference pressurechosen. Equation (37) assumes the membrane orsolution phases are effectively incompressible; andif this is not the case, the last term can be replacedbyR p
pr
�V idp. At the upstream interface (z¼ 0) wherethe pressure is p0 in both the solution and membranephases, thermodynamics connects the activity in thetwo phases as follows:
ami0 ¼ as
i0e – �V mi0
– �V si0ð Þ p0 – p,ð Þ=RT ð38Þ
From this point on, superscripts s and m refer to thesolution and membrane phase. At the downstreamsurface (z ¼ ,), the pressure in the membrane phaseis p 0 while that in the solution phase is p, so there is apressure discontinuity and the activities on eitherside are related by
ami, ¼ as
i,e – �V mi,
p0 – p,ð Þ=RT ð39Þ
In general, the partial molar volume of i will bedifferent in the two phases and will depend on theconcentration in these phases; thus, we need to des-ignate �V i by both a superscript (phase) and asubscript for location (z¼ 0). In many cases, wemay regard �V i as a constant independent of composi-tion which is the same in both phases. In this case,Equations (38) and (39) reduce to the following moresimple forms:
ami0 ¼ as
i0 ð40Þ
ami, ¼ as
i,e – �Vi p0 – p,ð Þ=RT ð41Þ
By a suitable theory or by experiment, the relation-ship between the concentration of i and its activity ina given phase can be established. For example, theFlory–Huggins theory gives a convenient frameworkfor polymer systems.
We see from Equation (40) that the concentrationof solvent in the membrane at its upstream surface inhydraulic permeation is the equilibrium swelling,w10, of the polymer in the pure solvent as
i0 ¼ 1� �
orthe upstream solution for the general case. On theother hand, Equation (41) shows that the pressurediscontinuity decreases the activity of solvent(hence, its concentration) in the membrane at thedownstream surface, that is, solvent is squeezed outleading to a concentration gradient within the mem-brane. This is the origin of the diffusional fluxinduced by the pressure applied upstream.
The general results above can be expressed insome commonly used forms by using the definitionof osmotic pressure in the external liquid phases,
� ¼ – RT,nas1= �V 1, and an assumption of ideality in
the membrane phase, that is, am1 ¼ w1=w�1 , where w�1
is the equilibrium swelling of the membrane in thesolvent 1; when no solute is present, that is, as
1 ¼ 1.With these, Equations (40) and (41) become
w10 ¼ w�1e – �V1�0=RT ð42Þ
w1, ¼ w�1 e – �V1�,=RT�
e – �V1�p=RT�
ð43Þ
Thus, we get
ðw10 –w1,Þ ¼ w�1e – �V1�,=RT 1 – e – �V1ð�p –��ÞRTh i
¼ w10 1 – e – �V1ð�p –��ÞRTh i ð44Þ
where �� ¼ �0 –�,. When the exponent is smallenough, a series expansion of the exponential termis justified such that
w10 –w1,ð Þ ffi w10�V1 ð�p –��Þ
RTð45Þ
Equations (36) and (45) can be combined to get
n1 ¼D 1mCm
10�V1 �p –��ð Þ,RT
ð46Þ
which is the classical result for solvent flux in reverseosmosis when <wm> � 1 and Cm
1 ¼ �w1 [1, 9].To develop a relation for solute (salt) flux from
Fick’s law, it has been correctly argued for desalina-tion purposes that the pressure should have anegligible effect on salt partitioning into themembrane; thus, we can write
86 Fundamentals of Transport Phenomena in Membranes

n2 ¼ – D 2mdCm
2
dzffi D 2m
�Cm2
‘¼ D 2m K2
Cs20 –Cs
2‘
‘
� �
ð47Þ
where K2 is the distribution coefficient for salt (orsolute) between the solution and membrane phases.Using the definition of solute rejection
R ¼ 1 –Cs2,=Cs
20 ð48Þ
and a mass balance, Equations (46) and (47) can becombined to obtain the familiar result [1, 16]
R ¼ 1þ D 2m K2 RT Cs1‘
D 1m Cm1
�V1 �p –��ð Þ
� � – 1
ð49Þ
For our purposes here, it will prove useful to recastthese results in another form by defining permeabil-ity coefficients as follows:
P2 ¼ K2D 2m where K2 ¼ Cm2 =Cs
2 ð50Þ
P1 ¼ K1D 1m where K1 ¼ Cm1 =Cs
1 ffi Cm1 =�1 ð51Þ
where in the latter the solvent concentration in theexternal phase is taken to be the pure solvent density�1 which is valid for relatively dilute solutions. Wenow define a selectivity factor � for solute over sol-vent in analogy with other membrane terminology:
� ¼ P2=P1 ¼ �S�D ¼�1K2
Cm1
� �D 2m
D 1m
� �ð52Þ
where �S and �D represent the solubility and diffu-sivity components.
The limitations of the simple theory embodied inEquations (46) and (49) have been described previously
[9]. One of these is that the simple linear relation
between Cm10 –Cm
1,
� �and the net pressure driving force
given in Equation (46) only holds for small driving
forces. Clearly Cm1,, or w1,, can, at most, only go to zero
and this occurs at infinite pressure. Thus, the relation
between solvent flux and the pressure driving force
must be nonlinear in the general case. The upper limit
on flux, when �p!1, is given by
n1 !Cm
10D 1m
‘ wmh i ð53Þ
or the result of Equation (35) when wmh i� 1. Thus,the limit on solvent flux in reverse osmosis is thesame as that in pervaporation; these connections arereviewed more extensively elsewhere [14, 16].
For reverse osmosis or hydraulic permeation, onemight ask when do nonlinearities in flux–pressure rela-
tionship become important. First, it is important to
recognize three separate causes for nonlinearities. The
simplest arises when the argument of the exponential
term in Equation (44) is too large to use the truncated
series expansion introduced to obtain Equation (45).
The difference between Equations (44) and (45) is 5%
(typical of the level of experimental sensitivity) when�V 1ð�p –��Þ=RT ¼ 0:1. For water where �V 1> 18
cm3 mol�1, this requires pressures of the order of
136 atm or 2000 psi; such pressures are usually not
reached in reverse osmosis applications so nonlinearity
from this source would never be expected. However,
for an organic solvent with �V 1> 100 cm3 mol�1, this
5% discrepancy occurs at the much lower pressure of
24.5 atm or 360 psi; such pressures might easily
be required in such a membrane operation. At�V 1> 300 cm3 mol�1, the pressure is correspondingly
lower at 8.2 atm or 120 psi. Thus, high partial molar
volumes bring these effects into a range where they
may not be negligible; water is a special case because
of its low molecular weight. For highly swollen
membranes, the term wmh i cannot be approximated
as unity and will depend on pressure adding another
potential source of nonlinearity. The final source of
nonlinearity can be the concentration dependence of
the diffusion coefficient.
References
[1] Merten, U., Ed. Desalination by Reverse Osmosis; MITPress: Cambridge, 1966.
[2] Ho, W. S. W., Sirkar, K. K., Eds. Membrane Handbook;van Nostrand Reinhold: New York, 1992.
[3] Kesting, R. E., Fritzsche, A. K. Polymeric Gas SeparationMembranes; Wiley: New York, 1993.
[4] Paul, D. R., Yampol’skii, Y. P., Eds. Polymeric GasSeparation Membranes; CRC Press: Boca Raton, FL, 1994.
[5] Freeman, B. D., Pinnau, I., Eds. Polymeric Membranes forGas and Vapor Separations: Chemistry and Materials;ACS Symposium Series 733; American Chemical Society:Washington, DC, 1999.
[6] Pinnau, I., Freeman, B. D., Eds. Advanced Materials forMembrane Separation; ACS Symposium Series 876;American Chemical Society: Washington, DC, 2004.
[7] Baker, R. W. Membrane Technology and Applications,2nd edn.; Wiley: Chichester, 2004.
[8] Yampol’skii, Y., Pinnau, I., Freeman, B. D., Eds. MaterialsScience of Membranes for Gas and Vapor Separation.Wiley: Chichester, 2006.
[9] Paul, D. R. Ber. Bunsenges. Phys. Chem. 1979, 83, 294–302.[10] Soltanieh, M., Gill, W. N. Chem. Eng. Commun. 1981, 12,
279–363.[11] Paul, D. R., Morel, G. MembraneTechnology. InKirk–Othmer
Encyclopedia of Chemical Technology, 3rd edn.; Mark, H. F.,Othmer, D. O., Eds.; Wiley: New York, 1981; Vol. 15,pp 92–131.
[12] Koros, W. J., Fleming, G. K., Jordan, S. M., Kim, T. H.,Hoehn, H. H. Prog. Polym. Sci. 1988, 13, 339–401.
Fundamentals of Transport Phenomena in Polymer Membranes 87

[13] Koros, W. J., Hellums, M. W. Transport Properties. InEncyclopedia of Polymer Science and Engineering, 2ndedn.; Mark, H. F., Bikales, N. M., Overberger, C. G.,Menges, G., Kroschwitz, J. I., Eds.; Wiley: New York,1989; Supplement volume, pp 724–802.
[14] Wijmans, J. E., Baker, R. W. J. Membr. Sci. 1995, 107, 1–21.[15] Bhattacharyya, D., Mangum, W. C., Williams, M. E.
Reverse Osmosis. In Kirk–Othmer Encyclopedia ofChemical Technology, 4th edn.; Wiley: New York, 1997;Vol. 21, pp 303–333.
[16] Paul, D. R. J. Membr. Sci. 2004, 241, 371–386.[17] Bird, R. B., Stewart, W. E., Lightfoot, E. N. Transport
Phenomena, 2nd edn.; Wiley: New York, 2002.[18] Flory, P. J. Principles of Polymer Chemistry; Cornell
University Press: Ithaca, NY, 1955.[19] Curtiss, C. F., Bird, R. B. Ind. Eng. Chem. Res. 1999, 38,
2515–2522.[20] Zielinski, J. M., Hanley, B. F. AIChE J. 1999, 45, 1–12.[21] Paul, D. R., Ebra-Lima, O. M. J. Appl. Polym. Sci. 1970,
14, 2201–2224.[22] Paul, D. R., Ebra-Lima, O. M. J. Appl. Polym. Sci. 1971,
15, 2199–2210.[23] Paul, D. R. J. Appl. Polym. Sci. 1972, 16, 771–782.[24] Paul, D. R. J. Polym. Sci. A-2 1973, 11, 289–296.[25] Paul, D. R. Diffusive Transport in Swollen Polymer
Membranes. In Permeability of Plastic Films and Coatingsto Gases, Vapors, and Liquids; Hopfenberg, H. B., Ed.;Plenum: New York, 1974; pp 35–48.
[26] Paul, D. R. J. Polym. Sci.: Polym. Phys. Ed. 1974, 12,1221–1230.
[27] Paul, D. R., Paciotti, J. D., Ebra-Lima, O. M. J. Appl.Polym. Sci. 1975, 19, 1837–1845.
[28] Paul, D. R., Ebra-Lima, O. M. J. Appl. Polym. Sci. 1975,19, 2759–2771.
[29] Paul, D. R., Paciotti, J. D. J. Polym. Sci.: Polym. Phys. Ed.1975, 13, 1201–1214.
[30] Paul, D. R. Sep. Purif. Methods 1976, 5, 33–50.[31] Bausa, J., Marquardt, W. AIChE J. 2001, 47, 1318–1332.[32] Fornasiero, F., Prausnitz, J. M., Radke, C. J.
Macromolecules 2005, 38, 1364–1370.[33] Chiou, J. S., Maeda, Y., Paul, D. R. J. Appl. Polym. Sci.
1985, 30, 4019–4029.[34] Toi, K., Morel, G., Paul, D. R. J. Appl. Polym. Sci. 1982,
29, 2997–3005.[35] Suwandi, M. S., Stern, S. A. J. Polym. Sci.: Polym. Phys.
Ed. 1973, 11, 663–681.[36] Vieth, W. R., Howell, J. M., Hsieh, J. H. J. Membr. Sci.
1976, 1, 177.[37] Koros, W. J., Chan, A. H., Paul, D. R. J. Membr. Sci. 1977,
2, 165–190.[38] Koros, W. J., Paul, D. R. J. Polym. Sci.: Polym. Phys. Ed.
1978, 16, 1947–1963.[39] Maeda, Y. PhD Dissertation, University of Texas at Austin,
1985.[40] Barrer, R. M., Barrie, J. A., Slater, J. J. Polym. Sci. 1958,
27, 177–197.[41] Michaels, A. S., Wieth, W. R., Barrie, J. A. J. Appl. Phys.
1963, 34, 1–12; 13–20.[42] Weiss, G. H., Bendler, J. T., Shlesinger, M. F.
Macromolecules 1992, 25, 990–992.[43] Raucher, D., Sefcik, M. D. Gas Transport and Cooperative
Main-Chain Motions in Glassy Polymers. In Industrial GasSeparations; Whyte, T. E., Yon, C. M., Wagener, E. H.,Eds.; ACS Symposium Series 223; American ChemicalSociety: Washington, DC, 1983; pp 89–124.
[44] Mi, Y., Zhou, S., Stern, S. A. Macromolecules 1991, 24,2361–2367.
[45] Lipscomb, G. G. AIChE J. 1990, 36, 1505–1516.
[46] Wissinger, R. G., Paulaitis, M. E. Ind. Eng. Chem. Res.1991, 29, 842–851.
[47] Barbari, T. A., Conforti, R. M. Polym. Adv. Technol. 1994,5, 698.
[48] Barbari, T. A., Conforti, R. M. J. Polym. Sci. Part B: Polym.Phys. 1992, 30, 1261–1271.
[49] Silverman, B. D. J. Appl. Polym. Sci. 1993, 47, 1013–1018.[50] Horas, J. A., Nieto, F. J. J. Polym. Sci. Part B: Polym.
Phys. 1992, 30, 1889–1898.[51] Kirchheim, R. Macromolecules 1992, 25, 6952–6960.[52] Doghieri, F., Sarti, G. C. Macromolecules 1996, 29,
7885–7896.[53] Sarti, G. C., Doghieri, F. Chem. Eng. Sci. 1998, 53,
3435–3447.[54] Baschetti, M. G., Doghieri, F., Sarti, G. C. Ind. Eng. Chem.
Res. 2001, 40, 3027–3037.[55] De Angelis, M. G., Sarti, G. C., Doghieri, F. J. Membr. Sci.
2007, 289, 106–122.[56] Toi, K., Paul, D. R. J. Appl. Polym. Sci. 1982, 27, 2997–3005.[57] Kanehashi, S., Nagai, K. J. Membr. Sci. 2005, 253, 117–138.[58] Chan, A. H., Koros, W. J., Paul, D. R. J. Membr. Sci. 1978,
3, 117–130.[59] Koros, W. J., Paul, D. R. J. Polym. Sci.: Polym. Phys. Ed.
1978, 16, 2171–2187.[60] Chan, A. H., Paul, D. R. Polym. Eng. Sci. 1980, 20, 87–94.[61] Wonders, A. G., Paul, D. R. J. Membr. Sci. 1979, 5, 63–75.[62] Chiou, J. S., Maeda, Y., Paul, D. R. J. Appl. Polym. Sci.
1985, 30, 4019–4029.[63] Michaels, A. S., Bixler, H. J. J. Appl. Polym. Sci. 1961, 50,
393–412.[64] Puleo, A. C., Paul, D. R., Wong, P. K. Polymer 1989, 30,
1357–1366.[65] Larobina, D., Sanguigno, L., Vindetto, V., Guerra, G.,
Mensitieri, G. Polymer 2004, 45, 429–436.[66] Muller-Plathe, F. J. Chem. Phys. 1995, 103, 4346–4351.[67] O’Brien, K. C., Koros, W. J., Barbari, T. A., Sanders, E. S.
J. Membr. Sci. 1986, 29, 229–238.[68] Raharjo, R. D., Freeman, B. D., Paul, D. R., Sarti, G. C.,
Sanders, E. S. J. Membr. Sci. 2007, 306, 75–92.[69] Koros, W. J. J. Polym. Sci.: Polym. Phys. Ed. 1980, 18,
981–992.[70] Crank, J. The Mathematics of Diffusion, 2nd edn.; Oxford
University Press: London, 1975.[71] Matsui, S., Paul, D. R. J. Membr. Sci. 2004, 235, 25–30.[72] Paul, D. R., Koros, W. J. J. Polym. Sci.: Polym. Phys. Ed.
1976, 14, 687–702.[73] Barrer, R. M. J. Membr. Sci. 1984, 18, 25–35.[74] Wang, J.-S., Kamiya, Y. J. Polym. Sci. Part B: Polym.
Phys. 2000, 38, 883–888.[75] Wang, J.-S., Kamiya, Y., Naito, Y. J. Polym. Sci. Part B:
Polym. Phys. 1998, 36, 1695–1702.[76] Wang, J.-S., Naito, Y., Kamiya, Y. J. Polym. Sci. Part B:
Polym. Phys. 1996, 34, 2027–2033.[77] Kamiya, Y., Hirose, T., Mizoguchi, K., Naito, Y. J. Polym.
Sci. Part B: Polym. Phys. 1986, 24, 1525–1539.[78] Chiou, J. S., Paul, D. R. J. Appl. Polym. Sci. 1986, 32,
2897–2918.[79] Chiou, J. S., Paul, D. R. J. Polym. Sci. Part B: Polym. Phys.
1987, 25, 1699–1707.[80] Puleo, A. C., Paul, D. R., Kelley, S. S. J. Membr. Sci. 1989,
47, 301–332.[81] Bos, A., Punt, I. G. M., Wessling, M., Strathmann, H. J.
Membr. Sci. 1999, 155, 67–78.[82] Wind, J. D., Paul, D. R., Koros, W. J. J. Membr. Sci. 2004,
228, 227–236.[83] Koros, W. J., Chern, R. T., Stannett, V. T.,
Hopfenberg, H. B. J. Polym. Sci. Part B: Polym. Phys.1981, 19, 1513–1530.
88 Fundamentals of Transport Phenomena in Membranes

[84] Chern, R. T., Koros, W. J., Yui, B., Hopfenberg, H. B.,Stannett, V. T. J. Polym. Sci. Part B: Polym. Phys. 1984,22, 1061–1084.
[85] Raharjo, R. D., Freeman, B. D., Paul, D. R., Sanders, E. S.,Polymer 2007, 48, 7329–7344.
[86] Wind, J. D., Staudt-Bickel, C., Paul, D. R., Koros, W. J.Ind. Eng. Chem. Res. 2002, 41, 6139–6148.
[87] Wind, J. D., Staudt-Bickel, C., Paul, D. R., Koros, W. J.Macromolecules 2003, 36, 1882–1888.
[88] Hillock, A. M., Koros, W. J. Macromolecules 2007, 40,583–587.
[89] Bos, A., Punt, I. G. M., Wessling, M., Strathmann, H. Sep.Purif. Technol. 1998, 14, 27–39.
[90] Michaels, A. S., Bixler, H. J. J. Polym. Sci. 1961, 50,27–39.
[91] Mogri, Z., Paul, D. R. Polymer 2001, 4, 7765–7780;7781–7789.
[92] Laguna, M. F., Cerrada, M. L., Benevente, R., Perez, E.,Quijoda, R. J. Polym. Sci. Part B: Polym. Phys. 2003, 41,2174–2184.
Fundamentals of Transport Phenomena in Polymer Membranes 89

Biographical Sketch
D. R. Paul holds the Ernest Cockrell, Sr. Chair in engineering at the University of Texas at Austin and is alsothe director of the Texas Materials Institute. He received degrees in chemical engineering from North CarolinaState University (BS) and the University of Wisconsin (MS. and PhD) and then worked at the ChemstrandResearch Center for 2 years. He joined the Department of Chemical Engineering at the University of Texas atAustin in 1967, where he served as the department chairman during 1977–85. His research has involved variousaspects of polymer blends, membranes for separation, drug delivery, packaging, processing, and nanocompo-sites. He has edited numerous books on polymer blends and membranes and has published more than 570research papers. He has received awards for teaching, research, and leadership from the University of Texas,ACS, AIChE, SPE, and the Council for Chemical Research. He has been designated a distinguished graduate ofNorth Carolina State University and of the University of Wisconsin. He was elected to the National Academyof Engineering in 1988 and to the Mexican Academy of Sciences in 2000. He has served as an editor of Industrial
and Engineering Chemistry Research, published by ACS, since 1986.
90 Fundamentals of Transport Phenomena in Membranes

1.05 Basic Aspects in Polymeric Membrane PreparationH Strathmann, Universitat Stuttgart, Stuttgart, Germany
L Giorno and E Drioli, Institute of Membrane Technology, ITM-CNR, University of Calabria, Rende (CS), Italy
ª 2010 Elsevier B.V. All rights reserved.
1.05.1 Materials and Structures of Synthetic Membranes 91
1.05.1.1 Symmetric and Asymmetric Membranes 92
1.05.1.2 Porous Membranes 92
1.05.1.3 Homogeneous Dense Membranes 93
1.05.1.4 Ion-Exchange Membranes 93
1.05.1.5 Liquid Membranes 94
1.05.1.6 Fixed Carrier Membranes 94
1.05.1.7 Other Membranes 94
1.05.1.7.1 Perovskites 94
1.05.1.7.2 Zeolite membranes 94
1.05.2 Membrane Preparation 95
1.05.3 Preparation of Porous Membranes 96
1.05.3.1 Symmetric Porous Membranes Prepared by Sintering, Track Etching, and Leaching
Techniques 96
1.05.3.2 Symmetric Porous Polymer Membranes Made by Phase-Inversion Techniques 98
1.05.4 Preparation of Asymmetric Membranes 99
1.05.4.1 The Preparation of Integral Asymmetric Membranes by Phase Inversion 101
1.05.4.2 The Practical Membrane Preparation by the Diffusion-Induced Phase Separation
Process 101
1.05.4.3 The Practical Membrane Preparation by the Temperature-Induced Phase-Separation
Process 102
1.05.5 Rationalization of the Phase-Inversion Membrane Preparation Process 102
1.05.5.1 Phenomenological Description of the Phase-Separation Process 102
1.05.6 Preparation of Composite Membranes 103
1.05.6.1 Techniques Used for the Preparation of Polymeric Composite Membranes 107
1.05.7 Preparation of Homogeneous Solid Membranes 108
1.05.8 Preparation of Liquid Membranes 109
1.05.9 Preparation of Ion-Exchange Membranes 110
References 110
1.05.1 Materials and Structuresof Synthetic Membranes
Synthetic membranes show a large variety in their
physical structure and the materials they are made
from. Based on their structure, they can be classified
into four groups:
1. porous membranes,2. homogeneous solid membranes,
3. solid membranes carrying electrical charges, and4. liquid or solid films containing selective carriers.
Furthermore, the structure of membranes may be
symmetric, that is, the structure is identical over the
entire cross section of the membrane, or it may be
asymmetric, that is, the structure varies over the cross
section of the membrane.
The materials used for the preparation of mem-branes include polymers, ceramics, glass, metals, or
liquids; and the materials may be neutral or carry
electrical charges, that is, fixed ions. The membrane
conformation can be flat, tubular, or a hollow fiber.
The schematic drawing of Figure 1 illustrates the
The chapter is based on a series of lectures Prof. Strathmann has
given at ITM-CNR during advanced courses for Ph.D Students and
published in the book ‘‘An introduction to membrane science and
technology’’, Strathmann H., Giorno L., Drioli E., CNR, Rome, 2006.
91

morphology, materials, and configuration of sometechnically relevant synthetic membranes.
1.05.1.1 Symmetric and AsymmetricMembranes
As indicated earlier, synthetic membranes may havea symmetric or an asymmetric structure. In a sym-metric membrane, the structure and the transportproperties are identical over the entire cross sectionand the thickness of the entire membrane determinesthe flux. Today, symmetric membranes are mainlyused in dialysis and electrodialysis. In asymmetricmembranes, structural as well as transport propertiesvary over the cross section of the membrane. Anasymmetric membrane consists of a 0.1–1-mm-thickskin layer on a highly porous 100–200-mm-thick sub-structure. The skin represents the actual selectivebarrier of the asymmetric membrane. Its separationcharacteristics are determined by the nature of thematerial or the size of pores in the skin layer. Themass flux is determined mainly by the thickness ofthe skin. The porous sublayer serves only as asupport for the mostly thin and fragile skin and haslittle effect on the separation characteristics or themass transfer rate of the membrane. Asymmetricmembranes are primarily used in pressure-drivenmembrane processes such as reverse osmosis,ultrafiltration, or gas and vapor separation, sincehere the unique properties of asymmetric mem-branes, that is, high fluxes and good mechanicalstability, can be best utilized. Two techniques are
used to prepare asymmetric membranes: one utilizes
the phase-inversion process, which leads to an inte-
gral structure with the skin and the support structure
made from the same material in a single process [1],
and the other resembles a composite structure where
a thin barrier layer is deposited on a porous
substructure in a two-step process [2]. In this case,
barrier and support structures are generally made
from different materials.
1.05.1.2 Porous Membranes
A porous structure represents a very simple form of a
membrane, which closely resembles the conventional
fiber filter as far as the mode of separation is con-
cerned. These membranes consist of a solid matrix
with defined holes or pores which have diameters
ranging from less than 1 nm to more than 10mm.
The macromolecular size of the species to be sepa-
rated plays an important role in determining the pore
size of the membrane to be utilized and the related
membrane process. Porous membranes with average
pore diameters larger than 50 nm are classified as
macroporous; those with average pore diameters in
the intermediate range between 2 and 50 nm are clas-
sified as mesoporous; and membranes with average
pore diameters between 0.1 and 2 nm are classified as
microporous. Dense membranes have no individual
permanent pores, but the separation occurs through
fluctuating free volumes. The schematic representa-
tion of such classification is illustrated in Figure 2.
Membrane configuration
Membrane structures
Homogeneousfilms
Cylindricalpores
Porous skinlayer
Homogeneousskin layer
Sponge-typestructures
Integral asymmetric Composite structures
Homogeneousskin layer
Membrane materials
LiquidsMetalsGlassCeramicsPolymers
Symmetric Asymmetric
Flat sheet Spiral wound Tubular Capillary Hollow fiber
Figure 1 Schematic drawing illustrating the various materials, structures, and configuration of technically relevant synthetic
membranes.
92 Basic Aspects of Polymeric and Inorganic Membrane Preparation

In pressure-driven membrane processes, theseparation of the various components is achieved bya sieving mechanism with the pore diameters and theparticle sizes being the determining parameters. Inthermally driven membrane processes, the separationis based on the principle of phase equilibrium wherethe non-wetability of membrane pores is the deter-mining parameter. Porous membranes can be madefrom various materials such as ceramics, graphite,metal or metal oxides, and various polymers. Theirstructure may be symmetric, that is, the pore dia-meters do not vary over the membrane cross section,or they can be asymmetric, that is, the pore diametersincrease from one side of the membrane to the othertypically by a factor of 10–1000. The techniques forthe preparation of porous membranes can be ratherdifferent and include simple pressing and sintering ofpolymer or ceramic powders, irradiation and leach-ing of templates, as well as phase-inversion andpolymer precipitation procedures or sol–gel conver-sion techniques. Porous membranes are used toseparate components that differ markedly in size ormolecular weight in processes such as micro- andultrafiltration or dialysis [3].
1.05.1.3 Homogeneous Dense Membranes
A homogeneous membrane is merely a dense filmthrough which a mixture of molecules is transportedby a pressure, a concentration, or an electrical poten-tial gradient. The separation of the variouscomponents of a mixture is directly related to their
transport rates within the membrane phase, which isdetermined by their diffusivities and concentrationsin the membrane matrix. Therefore, homogeneousmembranes are referred to as solution–diffusion-type membranes [4]. They can be prepared frompolymers, metals, metal alloys, or, in some cases,ceramics, which may also carry positive or negativeelectrical charges. Since the mass transport in homo-geneous membranes is based on diffusion, theirpermeabilities are rather low. Homogeneous mem-branes are used mainly to separate componentswhich are similar in size but have different chemicalnature in processes such as reverse osmosis, gas andvapor separation, and pervaporation [5]. In theseprocesses, asymmetric membrane structures areused, which consist of a thin homogeneous skinsupported by a porous substructure.
1.05.1.4 Ion-Exchange Membranes
Films carrying charged groups are referred to as ion-exchange membranes. They consist of highly swollengels carrying fixed positive or negative charges. Theproperties and preparation procedures of ion-exchange membranes are closely related to those ofion-exchange resins [6]. There are two differenttypes of ion-exchange membranes:
1. cation-exchange membranes, which contain nega-tively charged groups fixed to the polymer matrixand
2. anion-exchange membranes, which contain posi-tively charged groups fixed to the polymer matrix.
10−10 10−9 10−8 10−7 10−6 10−5 10−4
Membranetype
Membraneprocess
Pore or particlesize (m)
Separatedcomponents
Non-porous
Micro-porous
Meso-porous
Porous
Reverse osmosisGas separationPervaporation
NanofiltrationUltrafiltration
Microfiltration
Gasesvapors
Soluble salts
Sugars
Proteins
Viruses
Bacteria
Emulsions
Colloids
Figure 2 Schematic classification of membranes, related processes, and separated components.
Basic Aspects in Polymeric Membrane Preparation 93

In a cation-exchange membrane, the fixed anions arein electrical equilibrium with mobile cations in theinterstices of the polymer. In contrast, the mobileanions are more or less completely excluded fromthe cation-exchange membrane because of their elec-trical charge, which is identical to that of the fixedions. Due to this exclusion of the anions, a cation-exchange membrane permits transfer of cations only.Anion-exchange membranes carry positive chargesfixed on the polymer matrix; therefore, they excludeall cations and are permeable to anions only.Although there are a number of inorganic ion-exchange materials, most of them based on zeolitesand bentonites, these materials are rather unimpor-tant in ion-exchange membranes compared topolymer materials [7]. The main applications ofion-exchange membranes are in electrodialysis orelectrolysis [8]. They are also used as ion-conductingseparators in batteries and fuel cells.
1.05.1.5 Liquid Membranes
Liquid membranes are mainly used in combinationwith the so-called facilitated transport, which isbased on carriers that transport certain componentssuch as metal ions selectively across the liquid mem-brane interphase.
Generally, it is no problem to form a thin fluidfilm. It is difficult, however, to maintain and controlthis film and its properties during a mass separationprocess. In order to avoid a breakup of the film, sometype of reinforcement is necessary to support such aweak membrane structure. Two different techniquesare used today for the preparation of liquid mem-branes. In the first case, the selective liquid barriermaterial is stabilized as a thin film by a surfactant inan emulsion-type mixture [9]. In the second techni-que, a porous structure is filled with the liquidmembrane phase. Both types of membranes areused today on a pilot-plant stage for the selectiveremoval of heavy metal ions or certain organic sol-vents from industrial waste streams [10]. They havealso been used rather effectively for the separation ofoxygen and nitrogen.
1.05.1.6 Fixed Carrier Membranes
Fixed carrier membranes consist of a homogeneousor porous structure with functional groups, whichselectively transport certain chemical compounds.These membranes can have a symmetric or an asym-metric structure depending on their application.
Fixed carriers may be not only ion-exchange groupsbut also complexing or chelating agents. They areused today, for example, in co- and counter-currenttransport and in the separation of alkane/alkenemixtures.
1.05.1.7 Other Membranes
Inorganic membranes prepared from zeolites [11, 12]and from perovskites [13] have been studied and alsoapplied at the industrial level. The interestingadsorption and catalytic properties of zeolites canbe well utilized when realized in a membraneconfiguration.
1.05.1.7.1 Perovskites
The perovskite systems with their high selectivity forO2 and H2, related to vacancies in the crystallinestructures, introduce a new transport mechanismwhich makes them very promising materials forpotential use as dense ceramic membranes in gasseparation, high-temperature fuel cells, and mem-brane reactors. Perovskite-type oxides have alsoreceived attention because they combine a highelectronic and ionic conductivity. They havebeen already studied as high-temperature super-conductors, ferro- and piezoelectric materials,magneto-resistive materials, and oxygen ion and pro-ton conductors. For practical applications, thesemembranes must possess sufficiently high oxygenpermeability and sustainable structural stability toharsh conditions such as elevated temperature andhigh oxygen or carbon dioxide concentrations.Perovskite membranes can be made as disks or sheetsor tubes by pressing the perovskite powder into theappropriate form and sintering at temperaturesbetween 1100 and 1500 �C.
1.05.1.7.2 Zeolite membranes
Zeolites with their interesting molecular sieving func-tions, large surface areas, controlled host–substrateinteractions, and catalytic properties have alwaysbeen considered of interest for being utilized in mem-brane configurations and operations [14]. Zeolites arethree-dimensional, microporous crystalline materialswith well-defined structures of voids and channels ofdiscrete size, which is accessible through pores of well-defined molecular dimensions that contain aluminum,silicon, and oxygen in their regular framework. Theycan be classified into small, medium, large, and ultra-large pore materials [15]. They can be processed intosymmetric self-supported membranes or asymmetric
94 Basic Aspects of Polymeric and Inorganic Membrane Preparation

supported membranes [16]. The first type is consti-tuted by pure zeolitic phase, while the second oneconsists of the zeolite thin layer formed on a support.Zeolites can separate molecules based on size, shape,polarity, and degree of unsaturation. The combinationof many properties, such as the uniform pore dimen-sions, the ion-exchange properties, the ability todevelop internal acidity, high thermal stability, andlarge internal surface area, makes them uniqueamong inorganic oxides and also leads to uniqueselectivity.
1.05.2 Membrane Preparation
The most important part in any membrane separa-tion process is the membrane itself. Membranes arevery different as far as their structure, function,transport properties, their transport mechanism,and the material they are made from is concerned.Just as diverse as the different membranes are, soalso are the methods of making them. Some mem-branes are manufactured by simple sintertechniques of fine powders, others are prepared byirradiation and track etching of thin films or byinversion of homogeneous liquid mixtures or meltsinto heterogeneous solid phases. Compositemembranes are prepared by dip-coating techniques,interfacial polymerization, and plasma polymeriza-tion. Inorganic membranes are prepared as compositestructures using powder sintering techniques and thesol–gel method. Liquid membranes with mobile selec-tive carriers are prepared as emulsions or supported inporous structures. Fixed carrier and ion-exchangemembranes are prepared by introducing positivelyor negatively charged groups into suited polymerstructures.
The selection of a suitable base material andpreparation technique depends on the type of appli-cation the membrane is to be used in. In someapplications, such as in gas separation or pervapora-tion, the membrane material used as the barrier layeris of prime importance for the performance of themembrane. In other applications, such as in micro- orultrafiltration, the membrane material is not quite asimportant as the membrane structure.
The most important characteristic of a membraneis its selective transport properties, selectivity, andpermeability, that is, permselectivity.
The selectivity, combined with a significantpermeability, results from the intrinsic chemical
properties of the material forming the membrane
and its physical properties.The choice of a given polymer as a membrane
material is not arbitrary, but based on specific prop-
erties, originating from structural factors, such as
molecular weight, chain flexibility, and chain
interaction.The structural factors determine the thermal,
chemical, and mechanical properties of polymers.
Such factors also determine the permeability.The molecular weight distribution is an important
property relative to membrane chain flexibility.
Chain flexibility is determined by two factors:
• the character of the main chain
• the presence and nature of the side chains or sidegroups
Primary covalent bonds occur in network polymers.
Secondary intermolecular forces (dipole forces
(Debye forces); dispersion forces (or London forces);
and hydrogen bonding forces) occur in linear and
branched polymers.The permeability of porous membranes is not
very much influenced by the choice of the polymer,
but chemical and thermal stability and also surface
effects such as adsorption and wettability are affected.
On the contrary, for dense nonporous membranes,
polymeric material directly influences the membrane
performance; in particular, the glass transition tem-
perature and the crystallinity are very important
parameters. The permeability is in general much
lower in the glassy state than in the rubbery state.
Transport takes place through amorphous rather
than crystalline regions. The mobility of the poly-
meric chain is very restricted in the glassy state, since
the segments cannot freely rotate around the main
chain bonds. In the rubbery state, the segments can
freely rotate along the main chain, implying a high
degree of chain mobility.Thermal and chemical stability are favored by
rigid chain, aromatic ring, chain interactions, high
Tg, etc.
Flexible Less flexible
[�C�C�] [�CTC] [�C�CTC�C�] (organic)
[�Si�O�] [�PTN�] (inorganic)
R¼ [�H] no influence on rotational freedomR¼ [�C6H5] reduces rotational freedom.
Basic Aspects in Polymeric Membrane Preparation 95

As the stability of a polymer increases, it generallybecomes more difficult to process. The two effects ofstability and processability oppose each other.
Mechanical behavior involves the deformation of amaterial under the influence of an applied force. Themechanical properties of a polymeric membrane can beimproved by suitable supports, although hollow-fiberand capillary membranes must be self-supporting.
Membrane preparation procedures are oftendeveloped empirically and described in the literatureoften as detailed recipes [17, 18, 19, 20].
1.05.3 Preparation of PorousMembranes
Porous membranes consist of a solid matrix withdefined pores, which have diameters rangingfrom less than 1 nm to more than 10 mm. Theycan be made from various materials, such as ceramics,graphite, metal or metal oxides, and polymers. Theirstructure may be symmetric, or asymmetric.Porous membranes are mainly used in microfiltra-tion and ultrafiltration. They can be classifiedaccording to
• the material they are made of, that is, ceramic orpolymer;
• their structure, that is, symmetric or asymmetric;and
• their pore size and pore-size distribution.
The membrane material determines the mechanicalproperties and the chemical stability of the
membrane. The chemical properties of the materialsuch as its hydrophilicity or hydrophobicity affect itsperformance in a practical application due to specificadsorption of feed mixture constituents.
The methods used most widely today for makingporous membranes are sintering of powders, stretch-ing of films, irradiation and etching of films, andphase-inversion or sol–gel processes. The differentstructures, the material they are made from, theirpreparation, and their typical applications are sum-marized in Table 1.
1.05.3.1 Symmetric Porous MembranesPrepared by Sintering, Track Etching, andLeaching Techniques
Sintering is a rather simple technique to obtain por-ous structures from organic as well as from inorganicmaterials (Table 2).
A powder consisting of certain size particles ispressed into a film or plate and sintered just belowthe melting point of the material. The structure of atypical sintered membrane is shown in the scanningelectron micrograph of Figure 3(a). This photo-graph shows the surface of a porous membranemade by pressing and sintering a plate of fine poly-tetrafluoroethylene powder. The process yields aporous structure of relatively low porosity in therange of 10–40%, and a rather irregular pore struc-ture with a very wide pore-size distribution. Thematerial selection for the preparation of sinteredmembranes is determined mainly by the requiredmechanical properties and the chemical and thermal
Table 1 Porous membranes, their preparation and application
Membrane type Membrane materialPore Size(�m) Preparation process Application
Symmetric porous
structures
Ceramic, metal, polymer,
graphite
0.1–20 Powder pressing and
sintering
Microfiltration, gas
separation
Symmetric porousstructures
Polymer of partialcrystallinity
0.2–10 Extruding and stretching offilms
Microfiltration,battery separator
Symmetric porous
structures
Polymer, mica 0.05–15 Irradiation and etching of
films
Microfiltration,
point-of-use filter
Symmetric porousstructures
Polymer, metal, ceramic 0.5–20 Template leaching of films Microfiltration
Symmetric porous
structures
Polymer 0.5–10 Temperature-induced phase
inversion
Microfiltration
Asymmetric porous
structures
Polymer <0.01 Diffusion-induced phase
inversion
Ultrafiltration
Asymmetric porous
structures
Ceramic <0.01 Composite membrane
gel–sol process
Ultrafiltration
96 Basic Aspects of Polymeric and Inorganic Membrane Preparation

stability of the material in the application of the
final membrane. Sintered membranes are made on
a large scale from ceramic materials such as alumi-
num oxides, graphite, and metal powders such as
stainless steel and tungsten. The particle size of the
powder is the main parameter determining the pore
sizes of the final membrane, typically ranging from
0.2 to 20 mm. The lower limit of the pore diameter is
determined by the particle size of the powder.
Sintered membranes can be made in the form of
disks, cartridges, or fine-bore tubes. They are used
for the filtration of colloidal solutions and suspen-
sions. They are also suitable for gas separation and
widely used for the separation of radioactive
isotopes.Porous carbon membranes are also prepared by
pyrolizing preformed polyacrylonitrile membranes
in an inert atmosphere at 600–800 �C. The mem-
branes are generally coated on a porous ceramic
support or prepared as hollow fibers. Their pore
size is 1–4 nm. The membranes are used for both
ultrafiltration and gas separation. However, they are
very brittle and, thus, difficult to handle in large-
scale practical applications.
Another relatively simple procedure for preparingporous membranes is the stretching of a homoge-
neous polymer film of partial crystallinity. This
technique is mainly employed with films of poly-
ethylene or polytetrafluoroethylene, which have
been extruded from a polymer powder at tempera-
tures close to its melting temperature coupled with a
rapid drawdown. The crystallites in the semi-crystal-
line polymer are aligned in the direction of drawing.
After annealing and cooling, the extruded film is
stretched perpendicular to the direction of drawing.
This leads to a partial fracture of the film, and rela-
tively uniform pores with diameters of 0.2–20 mm are
obtained. A typical stretched membrane prepared
from polytetrafluoroethylene is shown in the scan-
ning electron micrograph of Figure 3(b). The
membranes can be produced as flat sheets as well as
tubes and capillaries. Because of the hydrophobic
nature of the basic polymer, these membranes are
highly permeable for gases and vapors but imperme-
able for aqueous solutions. They are used in sterile
filtration, blood oxygenation, and membrane distilla-
tion. The stretched membranes made out of
polytetrafluoroethylene are also used as water
Table 2 Sintering method
Schematic of the Process Materials used
Heat Powders of polymers Polyethylene, PTFE, polypropylene
Membrane pore size distribution Powder of metals Stinless steel, tungsten
0.1–10mm Powder of ceramics Aluminium oxide, zirconium oxidePorosity: 10–20% with polymers Powder of graphite Carbon
80% with metals Powder of glass Silicalite
(a) (b) (c)
Figure 3 Scanning electron micrographs of (a) a sintered membrane prepared from a polymer powder, (b) a membrane
prepared by stretching an extruded polytetrafluoroethylene film perpendicular to the direction of extrusion, and (c) a capillary
pore polycarbonate membrane made by track etching.
Basic Aspects in Polymeric Membrane Preparation 97

repellent textile. Because of its high porosity, this
membrane has a high gas and vapor permeability,
but it is, up to a certain hydrostatic pressure,completely impermeable to aqueous solutions.
Porous membranes with very uniform, almostperfectly round cylindrical pores are obtained by a
process referred to as track etching [21]. The mem-
branes are made in a two-step process, as shown inFigure 4. A film or foil (polycarbonate) is subjected
to high-energy particle radiation applied perpendi-
cular to the film. The particles damage the polymer
matrix and create tracks. The film is then immersed
in an acid (or alkaline) bath and the polymeric mate-rial is etched away along the tracks to form uniform
cylindrical pores with narrow pore distribution –
pore size 0.2–10 mm and porosity 10%.During the first step, a homogeneous 6–15-mm-
thick polymer film is exposed to collimated chargedparticles in a nuclear reactor. As particles pass
through the film, they leave sensitized tracks where
the chemical bonds in the polymer backbone are
damaged. In the second step, the irradiated film is
placed in an etching bath. In this bath, the damagedmaterial along the tracks is preferentially etched
forming uniform cylindrical pores. The pore density
of a track-etched membrane is determined by the
residence time in the irradiator, while the pore dia-
meter is controlled by the residence time in theetching bath. The minimum pore diameter of these
membranes is approximately 0.01mm. The maximum
pore size that can be achieved in track-etched mem-
branes is determined by the etching procedure and is
�5 mm. The scanning electron micrograph inFigure 3(c) shows a typical track-etched polycarbo-
nate membrane. Capillary porous membranes are
prepared mainly from polycarbonate and polyester
films. The advantage of these polymers is that they
are commercially available in very uniform films of10–15-mm thickness, which is the maximum
penetration depth of collimated particles obtainedfrom a nuclear reactor. Because of their narrowpore-size distribution and low tendency to plug,capillary porous membranes made from polycarbo-nate and polyester have found applications on a largescale in analytical chemistry and microbiologicallaboratories, and in medical diagnostic procedures.Capillary porous membranes are used on an indus-trial scale for the production of ultrapure water forthe electronic industry. Here, they show certainadvantages over other membrane products becauseof their short rinse-down time and good long-termflux stability. Because of their surface filter charac-teristics, particles retained by the membranes can befurther monitored by optical or scanning electronmicroscopy.
Other techniques to produce porous microfiltra-tion membranes are based on micro-lithography andtemplate leaching. These membranes often have anarrow pore-size distribution and high fluxes. Thetemplate leaching technique is also applied to pre-pare membranes from glass, metal alloys, or ceramics[22]. The preparation procedure for porous glass andmetal membranes is relatively simple: two differenttypes of glass or metals are homogeneously mixed;then, one type is dissolved and a network with well-defined pore sizes of the undissolved material isobtained. For example, for porous glass membranes,a homogeneous melt (1000–1500 �C) of a three-component system (e.g., Na2O–Ba2O3–SiO2) iscooled and the system separates in two phases, oneconsisting mainly of SiO2, which is not soluble, whilethe other is soluble. This second phase is leached outby an acid or base and a wide range of pore diametercan be obtained. The minimum pore size achievableis 0.05 mm.
1.05.3.2 Symmetric Porous PolymerMembranes Made by Phase-InversionTechniques
The so-called phase-inversion process, in which apolymer is dissolved in an appropriate solvent andspread as a 20–200-mm-thick film on a plate, a belt, ora fabric support, prepares most commercially avail-able symmetric microporous membranes. Aprecipitant such as water is added to this liquidfilm, causing separation of the homogeneous polymersolution into two phases, that is, a polymer-rich solidphase and a solvent-rich liquid phase. The precipi-tated polymer forms a porous structure containing anetwork of nearly uniform pores. A microporous
Radiationsource
Polymer film
Membrane withporous structure
Etching bath
Figure 4 Track-etching method.
98 Basic Aspects of Polymeric and Inorganic Membrane Preparation

cellulosic membrane made by phase inversion isshown in the scanning electron micrograph of
Figure 5(a).Porous phase-inversion-type membranes can be
made from almost any polymer, which is soluble inan appropriate solvent and can be precipitated in a
nonsolvent. By varying the polymer, the polymerconcentration, the precipitation medium, and the
precipitation temperature, porous phase-inversionmembranes can be made with a very large variety
of pore sizes, from less than 0.1 to more than 20 mm,and with varying chemical and mechanical proper-
ties. These membranes were originally preparedfrom cellulosic polymers by precipitation at room
temperature in an atmosphere of approximately100% relative humidity. Recently, symmetric micro-
porous membranes are also prepared from variouspolyamides, polysulfone, and polyvinylidene difluor-
ide by precipitation of a cast polymer solution inwater. The phase-inversion process is today the
most important technique for obtaining porous struc-
tures. Polypropylene or polyethylene can also beused for the preparation of porous membranes.
However, since these polymers are not readily dis-solved at room temperature, the preparation
technique must be slightly varied. Polypropylene,for example, is dissolved in an appropriate amine at
elevated temperatures. A solution of 20–30% poly-mer is spread at elevated temperature into a film.
The precipitation of the polymer, however, is notinduced by the addition of a nonsolvent but merely
by cooling the solution to a point where a two-phasesystem forms. The resulting open foam structure is
shown in Figure 5(b). The pore size of membranesdepends on the polymer concentration, the solvent
system, the solution temperature, and the coolingrate. This membrane preparation technique isusually referred to as thermal gelation.
The symmetric, porous polymer membranes madeby phase inversion are widely used for separations ona laboratory and industrial scale. Typical applicationsrange from the clarification of turbid solutions to theremoval of bacteria or viruses, the detection of patho-logical components, and the detoxification of blood inan artificial kidney. The separation mechanism is thatof a typical depth filter which traps the particles some-where within the structure. In addition to the simplesieving effect, porous phase-inversion membranesoften show a high tendency of adsorption because oftheir extremely large internal surface. They are, there-fore, particularly well suited when a complete removalof components, such as viruses or bacteria, is desired.They are suited for immobilization of enzymes to beused in modern biotechnology. They are also widelyused for culturing of microorganisms in water qualitycontrol tests.
1.05.4 Preparation of AsymmetricMembranes
Most membranes used today in large-scale separa-tion processes have an asymmetric structure, whichconsists of a very thin, that is, 0.1–1 mm selectiveskin layer on a highly porous �100–200-mm-thicksubstructure, as indicated in the scanning electronmicrographs of Figure 6, which shows the crosssection of an asymmetric membrane with a so-calledgraded pore structure (Figure 6(a)) and an asym-metric membrane with a finger-type structure
(a) (b)
Figure 5 Scanning electron micrograph of the surface of (a) a porous cellulose nitrate membrane prepared from a
homogeneous polymer solution by water vapor precipitation and (b) a porous polypropylene membrane precipitated by
thermal gelation from a hot polymer solution.
Basic Aspects in Polymeric Membrane Preparation 99

(Figure 6(b)). The very thin skin represents the
actual membrane. It may consist of homogeneous
polymer or may contain pores. Its separation char-
acteristics are determined by the nature of the
polymer or the pore size in the skin, while the
mass transport rate is determined by the thickness
of the skin. The porous substructure serves only as a
support for the thin and sometimes fragile skin and
has little effect on separation characteristics or the
mass transfer rate of the membrane.Figure 7 shows the schematic of the equipment
to prepare capillary membrane. A polymer solution
is pumped through the spinneret, where the non-
solvent flowing along the bore forms the lumen of
the capillary (or hollow fiber) membrane as it is
formed in the cogulation bath by phase inversion.Asymmetric membranes are used primarily in
pressure-driven membrane processes such as
reverse osmosis, ultrafiltration, or gas separation,
as it is here that the unique properties in terms of
high mass transfer rates combined with good
mechanical stability can be best utilized. In addition
to high filtration rates, asymmetric membranes are
very resistant to fouling. Conventional symmetric
structures act as depth filters and retain particles
within their internal structure. These trapped
particles plug the membrane and so the flux declines
during use. Asymmetric membranes are surface fil-
ters and retain all rejected materials at the surface
where they can be removed by shear forces applied
by the feed solution moving parallel to the
membrane surface.Two techniques are used to prepare asymmetric
membranes. The first technique utilizes the phase-
inversion process and leads to a membrane where the
skin and the substructure consist of the same poly-
mer. This membrane is referred to as integral
asymmetric. In the second technique, an extremely
Polymersolution
Polymersolution
Bore liquid
SpinneretGearpump
Boreliquid
Pump
Coagulationbath
Flushing bath
Figure 7 Preparation of capillary membranes by immersion precipitation.
200 μm
(a) (b)
Figure 6 Scanning electron micrographs showing the cross section of (a) an asymmetric reverse osmosis membrane with a
graded pore structure and (b) an asymmetric ultrafiltration capillary membrane with a finger-type structure.
100 Basic Aspects of Polymeric and Inorganic Membrane Preparation

thin polymer film is deposited on a preformed poroussubstructure, leading to the so-called compositemembranes.
The development of the first integral asymmetricmembranes by phase inversion was a major break-through in the development of ultrafiltration andreverse osmosis. These membranes were madefrom cellulose acetate and yielded fluxes 10–100times higher than symmetric structures with com-parable separation characteristics. Today, however,most reverse osmosis membranes are compositestructures.
1.05.4.1 The Preparation of IntegralAsymmetric Membranes by Phase Inversion
Asymmetric phase-inversion membranes can be pre-pared from virtually all polymers that are soluble at acertain temperature in an appropriate solvent or sol-vent mixture and can be precipitated as a continuoussolid phase by either changing the temperature or thecomposition of the system by the following generalprocedures [23, 24, 25, 26]:
• cooling of a homogeneous polymer solution,which separates at a certain temperature in twophases;
• evaporation of a volatile solvent from a homoge-neous polymer solution with two or more solventsof different dissolution capacity; and
• addition of a nonsolvent or nonsolvent mixture toa homogeneous solution.
All the three procedures result in the formationof two phases, that is, a liquid phase forming themembrane pores and a solid phase forming themembrane structure, which may be either sym-metric and porous or asymmetric with a more orless dense skin at one or both surfaces of aporous bulk phase. The only thermodynamicpresumption for all the three preparation proce-dures is that the system has a miscibility gapover a defined concentration and temperaturerange.
A phase separation caused by a temperaturechange is called temperature-induced phaseseparation and a phase separation caused by theaddition of a nonsolvent or nonsolvent mixtureto a homogeneous solution is referred to as dif-fusion-induced phase separation. In the practicalmembrane preparation, combination and certainvariations of the basic processes are used to
produce membranes with tailor-made structuresand properties.
1.05.4.2 The Practical MembranePreparation by the Diffusion-Induced PhaseSeparation Process
The diffusion-induced phase-separation processconsists of the following consecutive steps:
• a polymer is dissolved in an appropriate solvent toform a solution,
• the solution is cast into a film of the order of100–500-mm thickness, and
• the film is quenched in a nonsolvent, typicallywater or an aqueous solution.
During the quenching process, the polymer solutionseparates into two phases: a polymer-rich solid phasethat forms the membrane structure, and a solvent-rich liquid phase that forms the liquid-filled mem-brane pores. Generally, the pores at the film surface,where precipitation occurs first and most rapidly, aremuch smaller than in the interior or at the bottomside of the film. This leads to the asymmetric mem-brane structure.
There are different variations to this general pre-paration procedure described in the literature, forexample, sometimes an evaporation step prior tothe precipitation is used to change the compositionin the surface of the cast film and an annealing step isapplied to change the structure of the precipitatedmembrane [27, 28].
The original recipes and subsequent modifica-tions for preparing asymmetric membranes aredeeply rooted in empiricism. Detailed descriptionsof membrane preparation techniques are given in theliterature [1, 25, 29, 30, 31]. Only after extensive useof the scanning electron microscope, which providedthe necessary structural information, was it possibleto rationalize the various parameters responsible forthe membrane structure forming processes. It thenbecame evident that both symmetric and asymmetricporous structures can be prepared by the diffusion-induced phase-separation process from a large num-ber of polymers when the preparation parameters arechosen correspondingly. The actual phase separationor phase inversion cannot only be induced by theaddition of nonsolvent but also be induced by thecontrolled evaporation of a volatile solvent from athree-component mixture of solvent/precipitant/polymer, causing precipitation as the systembecomes enriched in precipitant [24]. Alternatively,
Basic Aspects in Polymeric Membrane Preparation 101

precipitation of a simple two-component polymer-solvent casting solution can be brought about byimbibing precipitant from the vapor phase [20].This technique was the basis of the original porousmembranes and is still used commercially today byseveral companies.
1.05.4.3 The Practical MembranePreparation by the Temperature-InducedPhase-Separation Process
In the temperature-induced phase-separation pro-cess, the precipitation of a casting solution isachieved by cooling a polymer solution whichforms a homogeneous solution only at elevated tem-perature, for example, polypropylene dissolved inN,N-bis-(2-hydroxyethyl)tallow amine [23]. Thetemperature-induced phase-separation process gen-erally results in a symmetric porous structure. Undercertain experimental conditions, it can also result inasymmetric structures [32]. The temperature-induced phase separation is not only applicable topolymers, but it is also used for the preparation ofporous membranes from glass mixtures and metalalloys in combination with a leaching procedure, asindicated earlier.
1.05.5 Rationalization of thePhase-Inversion MembranePreparation Process
Although the recipes given in the literature for thepreparation of porous structures from polymers,metals, or glasses by phase inversion are very differ-ent, they are all based on similar thermodynamic andkinetic parameters, such as the chemical potentialsand diffusivities of the individual components andGibb’s free energy of mixing of the entire system.Identification of the various process parameters is thekey to understanding the membrane formationmechanism – a necessity for optimizing membraneproperties and structures.
1.05.5.1 Phenomenological Descriptionof the Phase-Separation Process
A quantitative treatment considering all thermody-namic and kinetic parameters involved in thephase-inversion process is difficult. However, a phe-nomenological description of the process with the aidof the phase diagram of a mixture consisting of a
polymer, one or more solvents, and nonsolvents atconstant or different temperatures is very useful for abetter understanding of the relation between mem-brane structure and the different preparationparameters. It must, however, be realized that thephase diagram is the thermodynamic description ofan equilibrium state. In the membrane formationprocess, the phase separation is also determined bykinetic parameters, and thermodynamic equilibriumis generally not obtained on a macroscopic scale. Thequantitative description of the kinetics is difficult.However, just a general thermodynamic descriptionof the phase separation based on the phase diagram ofthe polymer/solvent/nonsolvent system providesvaluable information concerning the membranestructures obtained by the phase-inversion process.
The temperature-induced phase separation of atwo-component polymer mixture is illustrated inFigure 8(a), which shows a phase diagram of a two-component mixture of a polymer and a solvent as afunction of temperature. The diagram indicates amiscibility gap over a wide range of composition atlow temperature. Above a certain temperature, thepolymer and solvent form a homogeneous solution atall compositions. At other temperatures, the system isnot stable at certain compositions and will separateinto two phases. This region is referred to as themiscibility gap, which is surrounded by the binodalecurve. If a homogeneous polymer–solvent mixture ofa certain composition at a temperature Tl, as indi-cated by point A in Figure 8(a), is cooled to thetemperature T2, as indicated by point B, it will sepa-rate into two different phases, the composition ofwhich is indicated by the points B9 and B0. Thepoint B0 represents the polymer-rich phase and thepoint B9 the solvent-rich polymer-lean liquid phase.The lines B9–B and B0–B represent the ratio ofthe amounts of the two phases in the mixture, thatis, the overall porosity of the obtained porous system.If the polymer concentration in the polymer-richphase has reached a certain value, its viscosity isincreased to such an extent that it can be consideredas solid. The polymer-rich phase forms the solidmembrane structure and the polymer-lean phasethe liquid-filled pores.
The phase separation induced by the addition of anonsolvent to a homogeneous polymer solution is illu-strated in Figure 8(b), which shows a three-componentisothermal phase diagram. The three-component mix-ture exhibits a miscibility gap over a wide range ofcompositions. If a nonsolvent is added to a solutionconsisting of polymer and solvent, the composition of
102 Basic Aspects of Polymeric and Inorganic Membrane Preparation

which is indicated by the point A on the solvent–poly-
mer line, and, if the solvent is removed from themixture at about the same rate as the nonsolvent enters,
the composition of the mixture will change followingthe line A–B. When the composition of the system
reaches the miscibility gap it will separate into twophases forming a polymer-rich phase represented by
the upper boundary of the miscibility gap, which isdetermined by the binodale and a polymer-lean phaserepresented by the lower boundary of the miscibility
gap. When the solvent is replaced completely by thenonsolvent, the mixture has reached the composition
represented by point B. The point B represents a mix-ture of the solid polymer-rich phase and a liquid
polymer lean phase of compositions B9 and B99, respec-tively. Instead of adding a nonsolvent to a polymer–
solvent mixture, phase separation can also be achievedby evaporation of a solvent from a solvent/polymer/
nonsolvent mixture, which is used as casting solutionfor the membrane [24].
The description of the formation of porous sys-tems by means of the phase diagrams, as illustrated inFigure 8, is based on the assumption of thermody-
namic equilibrium. It predicts under whichconditions of temperature and composition a system
will separate into two phases. However, it will notprovide any information concerning the size of the
domains of the two phases and their shapes, that is,the pore size, the pore shape, that is, finger- orsponge-like, and the pore-size distribution of the
membrane. These parameters are determined bykinetic parameters such as the diffusivities of the
various components in the mixture, the viscosity ofthe solution, and the chemical potential gradients,
which act as driving forces for the diffusion of thevarious components in the mixture. As these para-meters change continuously during the phaseseparation, which constitutes the actual membraneformation process, no transient states of equilibriumwill be achieved. Therefore, the kinetic parametersare difficult to determine by independent experi-ments and, thus, they are not readily available. Thismakes a quantitative description of the membraneformation mechanism very difficult.
The phase-inversion process can make both sym-metric and asymmetric membranes with ratherdifferent structures from a variety of polymers, asindicated before in the scanning electron micro-graphs of Figures 5 and 6. Polymers that are usedtoday on a commercial basis to prepare membranesby the phase-inversion process for various applica-tions and processes are listed in Table 3. Theresistance of some of the polymers to organic solventsis reported in Table 4.
1.05.6 Preparation of CompositeMembranes
In processes such as reverse osmosis, gas separation,and pervaporation, the actual mass separation isachieved by a solution–diffusion mechanism in ahomogeneous polymer layer. Since the diffusion pro-cess in a homogeneous polymer matrix is relativelyslow, these membranes should be as thin as possible,as indicated before. Therefore, an asymmetric mem-brane structure is mandatory for these processes.Unfortunately, many polymers with satisfactory
A
BTem
pera
ture
T1
T2B″B′
PolymerSolvent
Critical point
Liquid phase
Solid phase
SpinodaleBinodale
Solvent
Polymer
Nonsolvent
B′
B″
B
A
Critical point
Binodale
Spinodale
Liquid phase Miscibility gap
(a) (b)
Figure 8 Schematic diagram showing the formation of a microporous system by (a) thermal precipitation of a two-
component mixture and (b) addition of a nonsolvent to a homogeneous polymer solution in a three-component mixture
exhibiting a miscibility gap at certain conditions of temperature and composition. A, casting solution; B, membrane porosity;
B9, polymer-lean phase; B0, polymer-rich phase.
Basic Aspects in Polymeric Membrane Preparation 103

selectivity and permeability for the various compo-nents in gas mixtures or liquid solutions are not well
suited for the phase-inversion membrane preparationprocess. This has led to the development of the so-called composite membranes. A typical compositemembrane is shown schematically and as scanning
electron micrograph in Figures 9(a) and 9(b). It iscomposed of a 20–1000-nm-thin dense polymer bar-rier layer formed over an approximately 50–100-mm-thick porous film.
The advantages of composite membranes overintegral asymmetric structures are that differentpolymers may be used for the porous support and
the selective barrier layer. This means that poly-mers, which show the desired selectivity for acertain separation problem, but are not suited forpreparation into integral asymmetric membranesbecause of poor mechanical strength or poor film-
forming properties, may well be utilized as theselective barrier in composite membranes. On theother hand, polymers suited for the preparation ofporous structures but without the required proper-
ties for a certain separation task can be used assupport structure. This expands the variety of avail-able materials for the preparation of membraneswith properties required in a given separation task
considerably.The preparation of composite membranes
involves two steps: the first is the preparation of a
suitable porous support and the second is the pre-paration of the actual barrier layer on the surface ofthe support structure. The performance of a com-posite membrane is not only determined by the
properties of the selective barrier layer, but it isalso significantly affected by properties of the por-ous support.
Although, almost exclusively, the actual barrierlayer determines the selectivity of a compositemembrane, its flux rate is also to some extent deter-mined by the pore size and overall porosity of thesubstructure. The effect of pore size and overallporosity is illustrated in Figure 10 that shows anidealized homogeneous barrier layer on a poroussupport.
The actual diffusion pathway of the componentthrough the barrier layer into a pore of the supportstructure is always longer than the thickness ofthe barrier layer zo but shorter than the longestpath zmax.
If it is assumed that the transport in the supportstructure is exclusively through the pores, the effec-tive path length can be expressed as a function of theoverall membrane porosity, the thickness of the bar-rier layer, and the radius of the pores in the supportstructure by
zeff ¼ !zo þ ð1 –!Þ1
2
ffiffiffiffiffiffiffiffiffiffiffiffiffiffiffiffiffiffiffiffiffir 2
1 –!
!
� �sþ z2
o þ zo
!ð1Þ
Here, zeff and zo are the effective diffusion pathlength and the thickness of the barrier layer, respec-tively, r is the radius of the pores in the supportstructure, and ! is the surface porosity of the supportstructure.
This relationship, which can be obtained by sim-ple geometric considerations [33], indicates that theeffective diffusion path length z
effis strongly affected
by the surface porosity of the substructure.According to Equation (1), the effective diffusionlength is approximately equal to the thickness ofthe barrier layer at relatively high surface porosity(>50%). However, it increases by an order of mag-nitude when the porosity is less than 1% if thebarrier layer thickness is assumed to be approxi-mately the same as the pore radius. Accordingly,the flux decreases by the same magnitude. Thegeometrical consideration expressed in Equation(1) indicates that the surface porosity of the supportlayer significantly affects the membrane flux. Theporosity should always be as high as possible toachieve optimal flux rates with thin-film compositemembranes. To ensure adequate mechanicalstrength, the pore diameter should not be signifi-cantly greater than the film thickness.
Table 3 Polymers of commercial membranes prepared
by phase inversion and their applications
Membrane material Membrane process
Cellulose acetate EP, MF, UF, RO
Cellulose esters (mixed) MF, DPolyacrylonitrile (PAN) UF
Polyamide (aromatic, aliphatic) MF, UF, RO, MC
Polyimide UF, RO, GSPolypropylene MF, MD, MC
Polyethersulfone UF, MF, GS, D
Polysulfone UF, MF, GS, D
Sulfonated polysulfone UF, RO, NFPolyvinylidenefluoride UF
EP, elctrophoresis; MF, microfiltration; UF, ultrafiltration; RO,reverse osmosis; GS, gasseparation; NF, nanofiltration; D,dialysis; MD, membrane distillation; MC, membrane contactore.
104 Basic Aspects of Polymeric and Inorganic Membrane Preparation

Table 4 Most common polymers used to prepare membrane and resistance to organic solvents
Polymer / Solvent Methanol Amyl alcohol Tetra-hydrofuran Hexane Xylene Toluene Acetone Ethyl ether
Aliphatic polyamide (PA) (nylon-6)
N
H
(CH2)5 C
O
SC LC NC LC - - LC LC
Aromatic polyamide (PA) (nomex)
C N
HO
SC LC NC LC - - LC LC
Polyimide (PI)
O O
C
C C
C
O O
N N
LC - NC - - NC - -
Polypropylene (PP)
CC
H
CH3
H
H
LC LC SC NC SC LC LC LC
Polyvinylfluoride (PVDF)
CC
F H
F H
LC LC LC LC LC LC NC LC
(Continued )

Table 4 (Continued)
Polymer / Solvent Methanol Amyl alcohol Tetra-hydrofuran Hexane Xylene Toluene Acetone Ethyl ether
Polysulfone (PS)
O C O
CH3
SO2
CH3
LC LC NC LC NC NC NC LC
Polyetheretherketone (PEEK)
O O C
O
- - - LC - LC NC -
LC, long compatibility; SC, short compatibility; NC, noncompatible.

1.05.6.1 Techniques Used for thePreparation of Polymeric CompositeMembranes
The techniques used for the preparation of compo-site membranes may be grouped into four generalprocedures:
• casting of the barrier layer, for example, on thesurface of a water bath and then laminating it onthe porous support film;
• coating of the porous support film by a polymer,a reactive monomer, or pre-polymer solution,followed by drying or curing with heat or radiation;
• gas-phase deposition of the barrier layer on theporous support film from a glow dischargeplasma; and
• interfacial polymerization of reactive monomerson the surface of the porous support film.
Casting an ultrathin film of cellulose acetate on awater surface and transferring the film on a poroussupport constitute one of the earliest techniques usedfor preparing composite reverse osmosis membranes.However, this technique is no longer used today [34].
Coating a porous support structure by dipping itinto a polymer or pre-polymer solution is todayapplied mainly for the preparation of composite mem-branes to be used in gas separation and pervaporation.Particularly, polymers such as polydimethylsiloxane,which are available as soluble pre-polymers and whichcan easily be crosslinked by a heat treatment
procedure, thus becoming insoluble in most solvents,
are suited for the preparation of this type of composite
membrane. If the pore dimension in the support mem-
brane is selected properly, the pre-polymer is unable
to penetrate the support, and a rather thin uniform
barrier layer of 0.05–1-mm thickness can easily be
prepared. A typical composite membrane prepared
by dip coating is shown in Figure 9(b), which is the
scanning electron micrograph of an asymmetric poly-
sulfone ultrafiltration membrane that was coated by a
1 wt.% solution of polydimethylsiloxane in an appro-
priate solvent followed by thermal crosslinking [33].Gas-phase deposition of the barrier layer on a dry
porous support membrane by plasma polymerization
was also successfully used for the preparation of
reverse osmosis membranes. Although reverse osmo-
sis membranes with excellent desalination properties
showing salt rejection in excess of 99%, and fluxes of
1.2 m3 m–1 d–1 when tested with seawater, have been
prepared on a laboratory scale by plasma polariza-
tion, it is not used on a large-scale industrial
production of composite membranes [35].Today, by far the most important technique for
preparing composite membranes is the interfacial
polymerization of reactive monomers on the surface
of a porous support film. The first membrane pro-
duced on a large scale with excellent reverse osmosis
desalination properties was developed in the early
1970s in the North Star Research Institute under the
code name NS 100 [36, 37]. The procedure for the
Selective layer
Porous support
(b)(a)
Figure 9 (a) Schematic diagram of a composite membrane showing the porous support structure and the selective skin
layer, and (b) scanning electron micrograph of a composite membrane with polydimethylsiloxane as the selective layer on a
polysulfone support structure.
2r
zoSelective barrier layer
Porous support structure
zmax
Figure 10 Schematic drawing illustrating the diffusion path of a component through a selective barrier layer of a compositemembrane (zo represents the shortest and zmax the longest path).
Basic Aspects in Polymeric Membrane Preparation 107

preparation of this membrane, which exhibited waterfluxes of about 1 m3 m2 d–1 and salt rejections inexcess of 99% when tested with seawater at 6 MPapressure, was rather simple [38]. A polysulfone sup-port membrane was soaked in an aqueous solution of0.5–1% polyethyleneimine, which was reacted inter-facially at the membrane surface with a 0.2–1%solution of toluene diisocyanate in hexane. A heat-curing step at 110 �C leads to further crosslinking ofthe polyethyleneimine. The preparation of compo-site membranes based on piperazine and trimesoylchloride is shown schematically in Figure 11.
The process seems to involve two types of reactions.In a first step, the piperazine reacts rapidly at the inter-face with the trimesoyl chloride to form a polyamidesurface skin while amine groups below this surfaceremain unreacted. In the second heat treatment step,internal crosslinking of these amine groups takes place.Thus, the final membrane has three distinct layers ofincreasing porosity: (1) the dense polyamide surfaceskin, (2) a thin crosslinked piperazine layer, whichextends into the pores of the support film, and (3) theactual polysulfone support membrane.
1.05.7 Preparation of HomogeneousSolid Membranes
The selective barriers of many composite mem-branes may be considered as homogeneous solidmembranes as discussed earlier. In homogeneous
solid membranes, the entire membrane consists of a
dense, solid, and pore-free structure. They are made
from polymers as well as inorganic materials such as
glass or metal. Because of their high selectivity for
different chemical components, homogeneous mem-
branes are used in various applications, which
generally involve the separation of low-molecular-
mass components with identical or nearly identical
molecular dimensions. The most important applica-
tions are in gas separation.One of the more important homogeneous solid
metal membranes is the palladium or palladium
alloy membrane used for the separation and purifica-
tion of hydrogen [39]. The permeability of hydrogen
in palladium, palladium alloys, and several other
metals such as platinum, silver, and nickel is several
orders of magnitude higher than that of any other gas.
The permeability of hydrogen in palladium alloy
membranes is highly temperature dependent and
separation is carried out at elevated temperature
of about 300 �C. Membranes generally consist of
10–50-mm-thick metal foils. Because of their high
selectivity, these membranes are used to produce
high purity in excess of 99.99% hydrogen.Homogeneous silica glass membranes are homo-
geneous structures that show promise as selective
barriers for the separation of helium. Like metal
membranes, glass membranes are employed at ele-
vated temperature. Homogeneous glass membranes
also have a high selectivity for hydrogen ions and are
used as the selective barrier in pH electrodes.
Porous support Impregnationliquid 1+ reactant A
Immersionliquid 2 + reactant B
Polymerization Compositemembrane
C C
C
ClCl
Cl
O O
O
+HN
NH C C
C
O O
O
N
N N
N
N
N
+ HCl
Piperazine Trimesoyl chloride
Figure 11 Schematic diagram showing the formation of a composite membrane by interfacial polymerization of piperazine
with trimesoyl chloride.
108 Basic Aspects of Polymeric and Inorganic Membrane Preparation

1.05.8 Preparation of LiquidMembranes
Liquid membranes are important in combinationwith facilitated and coupled transport, which utilizesselective carriers, as discussed earlier, to transportcertain components such as metal-ions selectivelyand at a relatively high rate across the liquid mem-brane. Liquid membranes generally consist of a thinfilm separating two phases, which may be aqueoussolutions or gas mixtures. The material used for theliquid membrane should be immiscible with waterand should have a low vapor pressure to guaranteelong-term stability of the membrane. It is relativelyeasy to form a thin oil film between two aqueous orgas phases. It is difficult, however, to maintain andcontrol this film and its properties during a massseparation process. Two different techniques areused today for the preparation of liquid membranes.In the first preparation technique, leading to the so-called supported membranes, the pores of a porousmembrane are filled with the selective liquid barriermaterial as shown in Figure 12(a). In the secondtechnique, the liquid membrane is stabilized as athin oil film by a surfactant in an emulsion-typemixture as illustrated in Figure 12(b). In the sup-ported liquid membranes, the porous structureprovides the mechanical strength and the liquid-filled pores the selective separation barrier. Bothtypes of membranes can be used for the selectiveremoval of heavy metal-ions or certain organic com-ponents from industrial effluents [40–43]. They havealso been used rather effectively for the separation ofoxygen and nitrogen [44].
The preparation of supported liquid membranes isextremely simple. To maximize the useful lifetime ofa membrane, the liquid membrane material shouldhave low viscosity, low vapor pressure (i.e., highboiling point), and when used in aqueous solutions,
low water solubility. The porous substructure shouldhave a high porosity and a pore size small enough tosupport the liquid membrane phase under hydro-static pressure; the polymer of the substructureshould be hydrophobic because most liquid mem-branes are used with aqueous feed solutions. Inpractice, liquid membranes are prepared by soakinga hydrophobic porous membrane made from polyte-trafluorethylene such as Gore-Tex� or frompolyethylene such as Cellgard� [45], in a hydropho-bic liquid. The liquid may be a selective carrier suchas an oxime or a tertiary or quaternary amine dis-solved in kerosene. The disadvantage of supportedmembranes is their thickness, which is determined bythe thickness of the porous support structure. Thelatter is in the range of 10–50 mm, and therefore about100 times thicker than the selective barrier of anasymmetric polymer membrane. Thus, the fluxes ofsupported liquid membranes can be low even whentheir permeabilities are high.
The preparation of the unsupported liquid mem-brane is more complex [9]. Here, two immisciblephases, that is, the hydrophobic oil-type membranephase and a water phase, often referred to as strippingsolution, are mixed to form an emulsion of waterdroplets in a continuous oil phase, which is stabilizedby the addition of a surfactant. This emulsion is thenadded to the second aqueous phase, the feed solutionwith the first emulsion forming droplets in the secondaqueous phase. The overall result is the separation oftwo aqueous phases by an oil phase forming theliquid membrane. Ideally, droplets form in this pro-cess, in which the aqueous phase is surrounded by arelatively thin hydrophobic phase, the membrane,which is surrounded by a second continuous aqueousphase. In reality, several aqueous droplets are foundin a single hydrophobic droplet as shown inFigure 12(b) and the diffusion pathways becomelonger. With another aqueous solution, the
Liquid membranePorous support
Aqueous phases
(a)
Liquid membrane phase
Stripping solution Feed solution
(b)
Figure 12 Schematic drawing of (a) supported hollow-fiber liquid membrane and (b) the preparation of an emulsion-type
liquid membrane.
Basic Aspects in Polymeric Membrane Preparation 109

component to be eliminated is supplied to the origi-nal emulsion and passes through the membrane intothe internal solution.
1.05.9 Preparation of Ion-ExchangeMembranes
Ion-exchange membranes consist of highly swollengels carrying fixed positive or negative charges. Theproperties and preparation procedures of ion-exchange membranes are closely related to those ofion-exchange resins. As with resins, there are manypossible types with different polymer matrixes anddifferent functional groups to confer ion-exchangeproperties on the product. Although there are a num-ber of inorganic ion-exchange materials, most ofthem based on zeolites and bentonites, these materi-als are rather unimportant in ion-exchangemembranes and will not be discussed further.
The types of ion-exchange membranes include (1)cation-exchange membranes, which contain nega-tively charged groups fixed to the polymer matrix,and (2) anion-exchange membranes, which containpositively charged groups fixed to the polymermatrix. Moreover, it is possible to laminate cation-and anion-exchange layers to obtain a bipolarmembrane.
In a cation-exchange membrane, the fixed anionsare in equilibrium with mobile cations in the inter-stices of the polymer.
The matrix of a cation-exchange membrane con-tains fixed anions. Mobile cations are referred to ascounterions. In contrast, the mobile anions, called co-ions, are more or less completely excluded from thepolymer matrix because of their electrical charge,which is identical to that of the fixed ions. Due tothe exclusion of the co-ions, a cation-exchange mem-brane permits transfer of cations only. Anion-exchange membranes carry positive charges fixedon the polymer matrix; therefore, they exclude allcations and are permeable to anions only.
For the practical preparation of ion-exchangemembranes two rather different procedures areused. A quite simple technique is based on mixingan ion-exchange resin and a binder polymer, such aspolyvinylchloride and extruding the mixture as afilm at a temperature above the melting point of thepolymer. The result is a heterogeneous membranewith relatively large domains of ion-exchange mate-rial and no conductive regions of the binder polymer.To obtain ion-exchange membranes with satisfactory
conductivity the fraction of ion-exchange resin mustbe in excess of 50–70 wt.%. This often leads to ratherhigh swelling and to poor mechanical stability of themembrane. Furthermore, the size of the ion-exchange particles should be as small as possible,that is, <2–20 mm in diameter to be able to makethin membranes with low electrical resistance andhigh permselectivity. Nevertheless, the method isstill used today on a large scale for the preparationof ion-exchange membranes.
More recently homogeneous ion-exchange mem-branes are produced either by a polymerization ofmonomers that carry anionic or cationic moieties orby introducing these moieties into a polymer whichmay be in an appropriate solution or a preformedfilm.
References
[1] Kesting, R. E. J. Appl. Polym. Sci. 1973, 17, 1771.[2] Cadotte, J. E., Petersen, R. I. Thin Film Reverse Osmosis
Membranes: Origin, Development, and Recent Advances.In Synthetic Membranes; Turbak, A. F., Ed.; ACSSymposium Series 153, Vol. I, Desalination; AmericanChemical Society: Washington, DC 1981, pp 305–325.
[3] Cheryan, M. Ultrafiltration and Microfiltration Handbook;Technomic Publishing: Lancaster, PA, 1998.
[4] Merten, U. Transport Properties of Osmotic Membranes.In Desalination by Reverse Osmosis; Merten, U., Ed.; MITPress: Cambridge, MA, 1966; pp 15–54.
[5] Raymond, Z. R., Flemming, G. K. Gas Permeation. InMembrane Handbook; Ho, W. S., Sirkar, K. K., Eds.; VanNostrand Reinhold: New York, 1992.
[6] Strathmann, H. Ion-Exchange Membrane SeparationProcesses; Elsevier: Amsterdam, 2004.
[7] Helfferich, F. Ion-Exchange; McGraw-Hill: London, 1962.[8] Spiegler, K. S. Electrochemical operations. In Ion-
Exchange Technology; Nachod, F. C., Schubert, J., Eds.;Academic Press: New York, 1957.
[9] Li, N. N. AIChE J. 1971, 17, 459.[10] Kemperman, A. J. B., Rolevink, H. H. M., Bargeman, D.,
van den Boomgaard, T., Strathmann, H. J. Membr. Sci.1998, 138, 43.
[11] Dessau, R. M., Grasselli, R. K., Lago, R. M., Tsikoyiannis,J. G. Processes for converting feedstock organiccompounds. US Pat. 5316661, 1994.
[12] Haag, W. O., Tsikoyiannis, J. G. Membrane Composed ofa Pure Molecular Sieve. US Pat. 5019263, 1991.
[13] Tsai, C. Y., Dixon, A. G., Ma, Y. H., Moser, W. R.,Pascessi, M. R. J. Am. Ceram. Soc. 1998, 81(6), 1437.
[14] Tavolaro, A., Drioli, E. Adv. Mater. 1999, 11 (12), 975–996.[15] Nagy, B., Bodart, P., Hannus, I., Kiricsi, I. In Synthesis,
Characterization and Use of Zeolitic MicroporousMaterials; Konya, Z., Tubak, V., Eds. DecaGen: Szeged-Szoreg, Hungary, 1998.
[16] Bein, T. Chem. Mater. 1996, 8 (8), 1636–1653.[17] Hood, H. P., Nordberg, M. E. Treated Borosilicate Glass.
US Pat. 2106744, 1938.[18] Loeb, S., Sourirajan, S. High Flow Porous Membranes for
Separating Water from Saline Solutions. US Pat.3133132, 1964.
110 Basic Aspects of Polymeric and Inorganic Membrane Preparation

[19] Pall, D. B. Process for Preparing Hydrophilic PolyamideMembrane Filter Media and Product. US Pat. 4340479, 1982.
[20] Zsigmondy, R. Filter and Method of Producing Same. USPat. 1421341, 1922.
[21] Fleischer, R. L., Price, P. B., Walker, R. M. Sci. Am. 1969, 220, 30.[22] van Rijn, C. J. M. Nano and Micro Engineered Membrane
Technology; Elsevier: Amsterdam, 2004.[23] Hiatt, W. C., Vitzthum, G. H., Wagner, K. B., Gerlach, K.,
Josefiak, C. Microporous Membranes Via Upper CriticalTemperature Phase Separation in Material Science ofSynthetic Membranes; Lloyd, D. R., Ed.; ACS SymposiumSeries 269; 1985; pp 229 –244.
[24] Kesting, R. E. Phase Inversion Membranes. In MaterialScience of Synthetic Membranes; Lloyd, D. R., Ed.; ACSSymposium Series 269; 1985; Vol. 131.
[25] Manjikian, S. Ind. Eng. Chem. Prod. Res. Dev. 1967, 6, 23.[26] Strathmann, H., Production of Microporous Media by
Phase Inversion Processes. In Material Science ofSynthetic Membranes; Lloyd, D. R., Ed.; ACS SymposiumSeries 269; 1985; Vol. 165.
[27] Strathmann, H., Scheible, P., Baker, R. W. J. Appl. Polym.Sci. 1971, 15, 811.
[28] Wijmans, J. G., Baaij, J. P. B., Smolders, C. A. J. Membr.Sci. 1983, 14, 263.
[29] Broens, L., Altena, F. W., Smolders, C. A. Desalination1980, 32, 33.
[30] Frommer, M. A., Feiner, I., Kedem, O., Block, R.Desalination 1970, 7, 393.
[31] Sourirajan, S., Kunst, B. Cellulose Acetate and OtherCellulose Ester Membranes. In Reverse Osmosis andSynthetic Membranes; Sourirajan, S., Ed.; NationalResearch Council Canada: Ottawa, 1977.
[32] Kamide, K., Manabe, S. Role of Microphase SeparationPhenomena in the Formation of Porous PolymericMembranes. In Material Science of SyntheticMembranes; Lloyd, D. R., Ed.; ACS Symposium Series269; 1985; Vol. 197.
[33] Strathmann, H., Gudernatsch, W., Bell, C.-M.,Kimmerle, K. Chem. Ing. Technol. 1988, 60, 590.
[34] Riley, R. L., Lonsdale, H. K., Lyons, C. R., Merten, U. J.Appl. Polym. Sci. 1967, 11, 2143.
[35] Yasuda, H. Composite Reverse Osmosis MembranesPrepared by Plasma Polymerization. In Reverse OsmosisSynthetic Membranes; Sourirajan, S., Ed.; NationalResearch Council Canada: Ottawa, 1977.
[36] Cadotte, J. E. Reverse Osmosis Membrane. US Pat.4277,344, 1981.
[37] Rozelle, L. T., Cadotte, J. E., Cobian, K. E., Kopp, C. V.Nonpolysaccharide Membranes for Reverse Osmosis:NS 100 Membranes for Reverse Osmosis and SyntheticMembranes. In Reverse Osmosis Synthetic Membranes;Sourirajan, S., Ed.; National Research Council Canada:Ottawa, 1977.
[38] Cadotte, J. E. Evolution of Composite Reverse OsmosisMembranes. In Material Science of SyntheticMembranes; Lloyd, D. R., Ed.; ACS Symposium Series269; 1985; Vol. 229.
[39] Kammermeyer, K. Gas and Vapor Separation by Meansof Membranes. In Progress in Separation andPurification; Perry, S., Ed.; Wiley-Interscience: NewYork, 1972.
[40] Cussler, E. L. Diffusion; Academic Press: Cambridge, MA,1984.
[41] Kimura, S. G., Matson, S. L., Ward, W. J., III IndustrialApplications of Facilitated Transport. In RecentDevelopments in Separation Science; Li, N. N., Ed.; CRCPress: Boca Raton, FL, 1979 Vol. V.
[42] Schultz, J. S., Goddard, J. D., Suchdeo, S. R. AIChE J.1974, 20, 417.
[43] Ward, W. J., III AIChE J. 1970, 16, 405.[44] Baker, R. W., Roman, J. C., Lonsdale, H. K. J. Membr.
Sci. 1987, 31, 15.[45] Babcock, W. C., Baker, R. W., Lachapelle, E. D.,
Smith, K. L. J. Membr. Sci. 1980, 7, 71–87.
Basic Aspects in Polymeric Membrane Preparation 111

Biographical Sketch
Heinrich Strathmann was born in Detmold, Germany in 1934. He received his Diplome d’Ingenieur (Dipl.-Ing.) inchemistry from the University of Darmstadt, Germany in 1961. In 1965, he was awarded a doctorate degree inchemistry by the University of Darmstadt, Germany. In 1982, he was awarded the habilitation degree, by theUniversity of Tubingen, Germany. Since 1988, he has been a professor at the University of Stuttgart, Germany.
From 1962 to 1966, he worked as a research assistant at the University of Aachen, Germany. Between 1966and 1971, he was associated with Amicon Corp., Lexington, MA, USA. From 1971 to 1982, he was associatedwith Forschungsinstitut Berghof GmbH, Germany. Between 1982 and 1992, he worked with the FraunhoferInstitute for Bioengineering, Stuttgart, Germany. From 1988 to 1992, he was a professor at the University ofStuttgart, Germany. Between 1992 and 1999, he was a professor at the University of Twente, the Netherlands.From 1999 to 2000, he was a professor at the University of Colorado, Boulder, USA. He has been professoremeritus at the University of Stuttgart, Germany since 2000.
He was with the editorial board of the Journal of Membrane Science in 1976. He was an editor of Separation and
Purification Technology (1997–2002). He worked in the fields of desalination (1978), filtration and separation(1987–2002), and gas separation and purification (1982–96).
Apart from being a member of the scientific advisory board of various companies, he holds membership invarious scientific organizations such as DECHEMA, Frankfurt, Germany and European Membrane Society.He is also a member of the board of scientific organizations such as the European Membrane Society (1984–98)(vice-president), UNESCO Center for Membrane Technology, Sydney, Australia (1993–98), and the UN-University, Environmental Science, Gwangju, Korea (2003–06).
He has authored three textbooks on Membrane Science and Technology, coauthored eight reference books, andhas more than 200 scientific publications and 36 patents to his credit.
His responsibilities include teaching chemical engineering and supervising PhD students.He is a recipient of various awards including the 1994 Honorary Professor at the Dalian Institute Chemical
Physics, 1998 Willy Hager Price and gold medal, 2005 Honorary Professor at the South China CentralUniversity, and 2007 R. Barrer Price of the European Membrane Society.
112 Basic Aspects of Polymeric and Inorganic Membrane Preparation

1.06 Advanced Polymeric and Organic–InorganicMembranes for Pressure-Driven ProcessesS P Nunes and K-V Peinemann, King Abdullah University of Science and Technology, Thuwal, Saudi Arabia
ª 2010 Elsevier B.V. All rights reserved.
1.06.1 Membranes for Pressure-Driven Processes 113
1.06.1.1 RO Membranes 113
1.06.1.2 NF Membranes 115
1.06.1.2.1 Antifouling 116
1.06.1.3 Membranes for GS 117
1.06.1.3.1 Mixed-matrix membranes 118
1.06.2 Next Generation of Membrane Materials 119
1.06.2.1 Next Generation of Mixed-Matrix Membranes 119
1.06.2.2 Molecular Imprinted Membranes 120
1.06.2.3 Block Copolymers 120
1.06.2.4 Organic–Inorganic Self-Assembly 121
1.06.2.5 Organically Modified Inorganic Membranes 121
1.06.2.6 Membranes with Carbon Fillers 121
1.06.2.7 Responsive Membranes 123
1.06.2.7.1 Response to temperature 123
1.06.2.7.2 Electric and electrochemical response 125
1.06.2.7.3 Photo-response 125
1.06.3 Final Remarks 125
References 126
1.06.1 Membranes for Pressure-Driven Processes
A more detailed review of membranes and mem-brane materials has been published before [1]. In
this chapter, first the state of the art of conven-
tional membranes for pressure-driven processes(reverse osmosis (RO), nanofiltration, ultrafiltra-
tion, and gas separation) will be summarized,
taking into account the most representative exam-ples currently in application. Thereafter, the
emphasis is placed on recent developments of
advanced polymeric and organic–inorganic mate-rials for membranes.
Certainly, the most used method for polymerporous membrane preparation is the so-called
phase inversion, which consists of the induction
of phase separation in a previously homogeneouspolymer solution either by temperature change, by
immersing the casting solution in a nonsolvent
bath (wet process) or by exposing it to a nonsol-vent atmosphere (dry process). The wet process is
the most common and is at least part of the
industrial production of ultrafiltration, RO, andgas separation (GS), giving a high permeable andselective asymmetric structure. Additional thincoating steps can be further performed to givethe needed selectivity for RO or GS. The prepara-tion of asymmetric membranes by phase inversionand the influence of parameters such as castingsolution composition and temperature have beentopics of many reviews [1–6] and will not bedetailed here.
1.06.1.1 RO Membranes
RO is long established as a large-scale industrialmembrane process. The large desalination plantsaround the world are running with RO technology.One of the early materials used for membrane pro-duction is cellulose acetate (CA), easily prepared byphase inversion with a solution cast on a nonwovenand immersed in water. The characteristic structureof an integral asymmetric membrane is formed with aselective top layer and pores of increasing size acrossthe membrane. CA is still being successfully used,
113

especially in water treatment (in spiral wound mod-
ules) with relatively high chlorine tolerance and
stability in applications where the feed water has a
high fouling potential, such as in municipal effluents
and surface water supplies. The handicap of CA
membranes is evident for applications in chemical
and pharmaceutical industries when organic solvents
are part of the feed or in processes operating at
temperatures higher than 50 �C or pH lower than 3
or higher than 7. For these conditions aromatic poly-
amides have a much higher solvent resistance and
may be used in a wider pH range (pH 4–11). The
main application is the treatment of brackish water
and seawater. They can be produced in very thin
hollow fibers with large surface area/volume. The
main disadvantage is the very low chlorine tolerance.
Desalination and wastewater treatment need mem-
branes with large flows. A very successful class of
membranes for this application is that of thin film
composites (TFCs), prepared by interfacial polymer-
ization on the surface of a porous support. A very
good review of composite membranes was published
by Petersen and coworkers [7, 8]. TFC membranes
usually allow quite high water flows with low salt
solubility. They consist of an ultrathin layer, usually
of polyamide or polyetherurea, which is polymerized
in situ and cross-linked on an asymmetric porous
support, usually polysulfone. Since the dense selec-
tive layer is very thin, the membranes can operate at
higher flux and lower pressure. The chemical stabi-
lity is very good, although the chlorine tolerance is
low. They can operate in a pH range of between 2
and 11. The membrane preparation consists of
immersing the porous support in an aqueous solution
containing a water-soluble monomer. After that the
support is immersed in a solution of the second
monomer in a nonpolar solvent. Both monomers are
only allowed to react at the interface between organic
and aqueous solution, forming a thin polymer layer
at the surface of the porous support. As soon as
the polymer layer is formed, it acts as a barrier for
the monomer transport and avoids the continuity of
the polycondensation. On the other hand, any defect
on the polymer layer is immediately repaired with a
kind of self-healing mechanism, since monomer
transport and polycondensation is allowed at that
point (Figure 1).One of the most successful TFC membranes is the
FilmTec FT-30, developed by Cadotte et al. [7, 8]
and now commercialized by Dow Water Solutions.
The reaction involved in the preparation of the
FT-30 is as follows:
NH2
NH2
CO
Interfacepolymerization
CI
COCI
CIOC
Figure 1 Thin film-coating membrane preparation.
114 Basic Aspects of Polymeric and Inorganic Membrane Preparation

The polyamide layer is formed on an asymmetricmicroporous polysulfone support cast on a polyestersupport web. The polyester web gives the majorstructural support, and the polysulfone support withsmall surface pores with diameter of �15 nm is theproper substrate for the formation of a 0.2-mm poly-amide top layer. The maximum operating pressure ofthe FT-30 is �7 MPa with free chlorine tolerance<0.1 ppm.
Although the membranes for RO are well estab-lished in the market, new membranes are required forrelated emerging fields. This is the case of osmoticpower or pressure retarded osmosis plants, a concept,which has been independently proposed in the 1970sby Norman [9], Jellinek [10], and Loeb [11] and isnow becoming a reality in Norway. An introductionon this technology is given in Reference [12]. Thetechnology takes advantage of the high osmotic pres-sure which is built when salt water from the sea meetswater from fjords and rivers (Figure 2).
The pressure is about 29 bar at 20 �C for 35 gsalt l�1 (seawater). The pressure is enough to moveturbines and provide 2.2 MW of energy, workingwith water flow rate of 1 m3 s�1. In typically large
rivers, water flows at about 10 000 m3 s�1. For eachMW 200 000 m2 of membrane would be required,signifying a huge market for membranes. Therequirements for these membranes are high saltrejection like in RO, however with much higherwater fluxes, as well as much thinner and openerporous supports (Figure 3).
Membrane performance �5 W m�2 is needed tomake the process economically competitive.Currently, the best commercial cellulose derivativemembranes have around one-tenth of the neededperformance. The best commercial TFC membranesfor RO would give 0.1 W m�2. Membranes devel-oped at the laboratory are available for 3.7 W m�2.
1.06.1.2 NF Membranes
While RO and ultrafiltration are long implementedin several applications, the lack of available mem-branes with cutoffs between 400 and 4000 g mol�1
has been effectively filled much later with the devel-opment of nanofiltration membranes. Nanofiltrationis important for water softening, removal of organiccontaminants, concentration and demineralization of
Turbine
Fjord Seawater
Osmotic pressure
Figure 2 Principles of osmotic power.
RO PRO
Higher flowHigh rejectionThin and open
support
Fresh
High flowHigh rejection
High compactionstability
Sea
60–80 bar
11–15 bar
Figure 3 Membrane requirements for reverse osmosis
(RO) and for osmotic power.
Advanced Polymeric and Organic–Inorganic Membranes for Pressure-Driven Processes 115

whey, concentration of sugar and juice, etc. An exten-sive review on principles and applications ofnanofiltration has been published recently [13].
Analogously to the RO membranes, interfacialpolycondensation has been used for the developmentof NF membranes. Dow Water Solutions offers aseries of FILMTEC membranes: NF55, NF70, andNF90 (water flow of NF55 > NF70 > NF90) withrejection of at least 95% magnesium sulfate. Thetop layer is a fully aromatic cross-linked polyamide.NF270 is composed of a semi-aromatic piperazine-based polyamide layer on top of a polysulfone micro-porous support reinforced with a polyesternonwoven [14]. The membrane is very hydrophilicand its surface is negatively charged leading to therepulsion of also negatively charged solutes.Hydranautics commercializes the ESNA membraneseries, also a TFC with an aromatic polyamide layer.
GE-Osmonics (part of GE Water Technologies)commercializes the Desal� five nanofiltrationmembranes. The membrane has 4 layers, a polyesternonwoven, an asymmetric microporous polysulfone,and two proprietary thin films, which might be basedon sulfonated polysulfone and polypiperazineamide [7].Desal� nanofiltration membranes work also at very lowpH levels.
Another way to obtain nanofiltration membranes isthe modification of RO membrane [15–17], by treat-ment with acid, triethanolamine or the coating ofultrafiltration membranes with different polymersolutions [18, 19] like hydroxyalkyl derivatives of cel-lulose. A new approach was proposed by Lu et al. [20].They deposited six-arm rigid star amphiphiles on amethanol/PVA-conditioned polysulfone membraneand stabilized the resulting film by stitching the build-ing blocks. These stars are shape-persistent moleculeswith hydrophilic arms and a hydrophobic core, whichcould anchor to the support membrane through non-covalent supramolecular interactions. Rejection oforganic contaminants such as rhodamine and As(III)was confirmed.
A key issue for nanofiltration today is theimprovement of solvent stability of the availablemembranes, since it would open a wide range ofpotential applications in the chemical and pharma-ceutical industries.
SelRO� nanofiltration membranes, later commer-cialized by Koch Membrane Systems, are examplesof excellent solvent-resistant membranes on the mar-ket. New material developments will be reviewed.The MPS-44 and -50 membranes are stable inalkanes, alcohols, acetates, ketones, and aprotic
solvents. The MPS-44 is a hydrophilic membranesuitable, for instance, for separation processes in sol-vent mixtures containing water and organics. Soluteswith molecular weights around 250 g ml�1 can thenbe separated or concentrated, while the compositionof the solvent mixture does not change through themembrane. The hydrophilic MPS-50 is a nanofiltra-tion membrane for use in a pure organic medium.The membrane composition is not completely dis-closed. Patents of the same company, whichintroduced them [21, 22], describes the cross-linkingof porous polyacrylonitrile (PAN) membranes byimmersion in metal alkoxide solutions and heating,leading to insolubility in dimethylformamide (DMF),N-methyl-2-pyrrolidone (NMP), or dimethyl sulfox-ide (DMSO). Cross-linked PAN membranes coatedwith polydimethylsiloxane have been tested for fil-tration of oligomers in organic solvents [23]. Coatingwith a hydrophilic polymer (e.g., polyethylenimine),which is later cross-linked, brings the membrane cut-off to the NF range. Vanherck et al. [24] reportedasymmetric Matrimid�-based polyimide membranesfor nanofiltration, both unfilled and filled with nano-sized zeolite precursors and cross-linked with aro-matic p-xylylenediamine. Membranes were thenstable in the aprotic solvents DMF, NMP, dimethy-lacetamide (DMAc), and DMSO.
1.06.1.2.1 Antifouling
One of the most common issues in pressure-drivenmembrane separation processes applied to liquids isfouling. Most of the polymers used for preparation ofporous membranes have a rather hydrophobic char-acter, which make them susceptible to adsorption oforganics. Many strategies have been proposed in thelast decades to overcome this problem, varying fromchemical grafting to plasma surface modification [1].The use of plasma for surface modification of mem-branes has been reviewed by Kramer et al. [25].Grafting using plasma has been explored for instanceby Belfort and Ulbricht [26, 27]. Grafting promotedby ultraviolet (UV)-irradiation [28] is a commonalternative to add quaternary ammonium groups tothe membrane surface, increasing the positive chargeand control fouling. Some new developments ontechnologies for water treatment have been recentlysummarized by Shannon et al. [29], including mem-branes with reduced fouling susceptibility. Reducingoperation prices in membrane processes can beachieved if less cleaning is necessary. Furthermoremultistep production of membranes increases price.Taking this into account, an interesting approach is
116 Basic Aspects of Polymeric and Inorganic Membrane Preparation

the use of additives such as comb copolymers withhydrophobic backbones and hydrophilic side chains,which can be automatically positioned in the mem-brane surface and pore walls during the membraneformation (Figure 4) [30–33].
1.06.1.3 Membranes for GS
Compared to other fields of membrane application,such as water treatment, food processing, and dialy-sis, GS still has a limited market. However with thedevelopment of new membranes and with theincreasing need for clean industrial processes andlow emission plants, the importance of GS is con-stantly increasing. A motivation is the need formodernization of the energy sector leading to cleanrefineries and coal power plants. Although manyprocesses in this field require high temperature andtherefore favor inorganic membranes, polymericmembranes can potentially be applied for the treat-ment of platformer off-gases (H2/hydrocarbonseparation) in refineries and for CO2 separationfrom other gases in coal plants. Membranes stabletill 250 �C would also allow the application inwater-gas shift reactors. Developments on mem-branes for CO2 separation are being reported in theliterature with increasing frequency.
A special class of polymers is constituted by poly-mers with very high-free volumes, like somefunctionalized polyacetylenes, which bridge the gapbetween microporous and dense polymeric materials.The best-known examples for these polymers arepoly(1-trimethylsilyl-1-propyne) (PTMSP) andpoly(4-methyl-2-pentyne) (PMP). Although thePMP was already synthesized in 1982 [34], its highgas permeabilities were first published in 1996 byMorisato and Pinnau [35] at MTR, Menlo Park.MTR is currently evaluating the performance ofPMP membranes for hydrocarbon separation. Anattractive application of membranes in this field isnatural gas hydrocarbon dew pointing, the separationof higher hydrocarbons like butane present in natural
gas from methane. The performance of PTMSP and
PMP for hydrocarbon separation is superior to all
other known polymers. The main reason why these
membranes have not been applied in large scale is
their capability to strongly absorb low-vapor-pres-
sure components, leading to a drastically reduced
permeability. Recently, it has been reported that the
flux and even the selectivity of PMP and PTMSP
can be enhanced by the addition of nanoparticles [36,
37]. Merkel et al. [36] added fumed silica to PMP and
observed a simultaneous increase of butane flux and
butane/methane selectivity. This unusual behavior
was explained by fumed-silica-induced disruption of
polymer chain packing and an accompanying
increase in the size of free volume elements through
which molecular transport occurs. Gomes et al. [37]
incorporated nano-sized silica particles by sol–gel
technique into PTMSP and found also for this poly-
mer a simultaneous increase in flux and selectivity. It
has to be studied if physical aging of the polyacety-
lenes is reduced by the addition of nanoparticles.A new class of polymers with high-free volumes
has been introduced recently by Budd et al. [38]. The
molecular structure of these polymers contains sites
of contortion (e.g. spiro-centers) within a rigid back-
bone (e.g., ladder polymer). The inventors call this
polymer class polymers of intrinsic microporosity
(PIMs), because their porosity arises as consequence
of the molecular structure and is not generated solely
through processing. Recently, the tertiary structure
of these polymers has been confirmed by molecular
modeling [39, 40]. The gas permeation properties of
membranes formed from PIM-1 were investigated at
the GKSS Research Center [41]. With an oxygen
permeability of 370 Barrer and an O2/N2 selectivity
of 4.0, the PIM-1 shows an extraordinary behavior as
GS polymer. However, long-term measurements
revealed a physical aging of PIM-1 analogous to
PTMSP, which resulted in reduced permeabilities.
When the aging problems can be solved, the PIMs
will be a highly interesting polymer class for fabrica-
tion of GS membranes. The research in high-free
volume polymers with intrinsic microporosity will
remain very attractive. Large-scale membrane appli-
cations for gas and vapor separation will emerge.Membrane separation is an emerging technology
for CO2 capture. With increasing energy costs,
methane purification from biogas becomes more
and more attractive. Large international projects
evaluate the possibility to capture carbon dioxide
from flue gas by membrane separation.
PAN
PAN
–(CH2 – CH2 – O)n–
Figure 4 Membrane preparation with antifoulingcharacteristics. (Adapted from Ref. [29]).
Advanced Polymeric and Organic–Inorganic Membranes for Pressure-Driven Processes 117

Recently, Lin and Freeman [42] have reported anoverview on material selection for membrane pre-paration to remove CO2 from gas mixtures. CO2
solubility and CO2/gas solubility selectivity in sol-vents and polymers containing different polar groupswere discussed. It was concluded that ethylene oxide(EO) units in the polymer appear to be the mostuseful groups to achieve high CO2 permeability andhigh CO2/light gas selectivity. Homo-poly(ethyleneoxide) (PEO) consists of EO monomeric units, but itsdisadvantage is the strong tendency to crystallize andconsequently it presents low gas permeability [43].
Block copolymers containing EO units aspoly(amide-b-ether) have been shown as alternativematerial for this purpose. Copolymers of this type areproduced under the trade name Pebax� ARKEMA.The PA blocks provide the mechanical strength, andgas transport occurs through the PEO phase. Blockcopolymers with immiscible soft and rigid blocks likePebax� can form various microphase-separatedstructures. Varying the polyamide and polyether seg-ment, molecular weight, and the content of eachblock, the mechanical, chemical, and physical prop-erties can be conventionally modeled. Pebax� hasbeen demonstrated as promising membrane materialsfor acid gas treatment [44]. Bondar et al. [44] havestudied CO2/N2 and CO2/H2 separation using dif-ferent grade of Pebax� membranes. They havereported high CO2/N2 and CO2/H2 selectivity,which were attributed to high CO2 solubility due tothe strong affinity of the polar ether linkages for CO2.Kim et al. [45] have also reported high permeabilityand high selectivity for CO2 over N2 as well as SO2
over N2, and these properties were attributed topolarizability of gases due to PEO segments.Mesoblends of polyether block copolymers andpoly(ethylene glycol) (PEG) were generated byPatel and Spontak [46] and it was found that CO2/H2 selectivity can be improved by incorporation ofPEG. The effect of PEG in the polymer chain to CO2
transport properties in different polymer systems wasalso described by other researchers [47–51] and itwas proven that EO units influence CO2 transportin glassy and rubbery polymers. It was shownrecently that blends of low molecular weight withPebax� exhibit exceptional properties for carbondioxide separation [52, 53].
1.06.1.3.1 Mixed-matrix membranes
Many of the more recent membranes are not onlypolymeric but contain an inorganic phase. Theadvantage of organic–inorganic materials for
membranes is the possibility of achieving synergeticeffects on permeability and selectivity, as well asintroducing new functionalizations and improvingmechanical and thermal stability. Tailoring innovativematerials with organic and inorganic phases coexistingin a nanoscale with multifunctionalization is anappealing approach to control at the same time freevolume and gas solubility.
The most representative examples of introducingpermeable inorganic fillers in a polymeric matrix forseparation purposes are the so-called mixed-matrixmembranes. Not only rather passive particles areincluded, but molecular sieves such as zeolites andalso functionalized fillers, which might be muchmore active in the separation process. The termmixed-matrix membrane has been introduced byKulprathipanja et al. [54], who performed pioneeringwork in the field of polymer/zeolite hybrid mem-branes. Kulprathipanja showed that the CO2/H2
selectivity of CA could be reversed by the additionof silicalite. The silicalite-CA membrane had a CO2/H2 selectivity of 5.1, whereas the pure CA membraneexhibited a selectivity of 0.77.
te Hennepe et al. [55], from the university ofTwente, proved for the first time that the incorpora-tion of silicalite in PDMS increased the ethanol/water selectivity significantly under steady-stateconditions in pervaporation experiments. Later itwas shown by Jia et al. [56] that using the sameapproach (silicalite in PDMS), the gas selectivitycould also be changed due to a molecular sievingeffect. However, the effects were too small to be ofany interest for practical applications. One problemof these membranes was that the permeability ratioPPDMS/Pzeolite was too high (see Equation (2)).
The formation of polymer chains or networkswith organic and inorganic segments has been usedby different membrane groups. Molecular sieves suchas zeolites have a much higher selectivity for manygas mixtures than polymeric membranes due to theirwell-defined pore sizes. The preparation of defect-free zeolite layers on a large scale is extremely diffi-cult. The possibility of incorporating zeolites into aflexible organic polymer matrix enables the combi-nation of the superior gas selectivities of thesemolecular sieves with the processibility of polymericmembranes [57].
The estimation of the permeability and selectivityof membranes with permeable fillers can be doneusing the equation derived by Maxwell [58] to cal-culate the electric conductivity of a metal in whichsmall spheres of a second metal are dispersed. The
118 Basic Aspects of Polymeric and Inorganic Membrane Preparation

permeability of the membrane to a defined gas is asfollows:
P ¼ Pc½Pd þ 2Pc – 2�dðPc –PdÞ�=½Pd þ 2Pc þ �dðPc –PdÞ�ð1Þ
The selectivity for gases 1 and 2 of a membraneprepared with a continuous phase of permeabilitiesPc1 and Pc2 and a dispersed phase with permeabilitiesPd1 and Pd2 can be calculated therefore by
�eff ¼ �c1þ 2Prel – 2� Prel – 1ð Þ1þ 2Prel þ � Prel – 1ð Þ
1�dþ 2Prel
�cþ � Prel
�c– 1�d
� �1�dþ 2Prel
�c– 2� Prel
�c– 1�d
� �ð2Þ
where �c and �d are the selectivity of the continuousand dispersed phases for the gas pair 1 and 2, and Prel
is the permeability ratio between continuous anddispersed phase.
From this equation, it can be seen that the selec-tivity highly depends on the permeability of the fillerand of the matrix. When the polymer permeability istoo high, the selectivity of the mixed-matrix mem-brane approaches the polymer selectivity. However,if the permeability of the filler and the matrix is nottoo far apart, the properties of the membrane willhave a large contribution from the highly selectivefiller. The compatibility between inorganic molecu-lar sieves and polymers is very important in order toeliminate gas diffusion pathways at the interfacebetween them, as discussed by Moore and Koros [59].
1.06.2 Next Generation of MembraneMaterials
The phase inversion membrane manufacture processis responsible for the breakthrough of the membranetechnology and its implementation in numerousindustrial applications. New advanced filtration pro-cesses are now conceivable but they requiremembranes with much narrower pore-size distribu-tion and better chemical resistance. A sharp pore-sizedistribution can only be obtained with the implemen-tation of new materials and new manufacturetechnologies. Approaches under investigation to tai-lor pore size include block and graft/combcopolymers, which self-assemble to form regularnanopores.
Furthermore, new separation tasks could be ful-filled if the membrane pores would specificallyrespond to different stimuli and act analogously to
biological gates. It is also possible to imagine mem-branes which are self-cleaning with fouling-resistantsurfaces, as well as self-healing membranes. The mostinspiring source for new developments is natureitself, which is full of supramolecular chemistry,self-assemblies, controlled textures, sophisticatedarchitectures, and functional systems. The followingsections discuss as to how to tailor pores using self-assembly approaches, how to produce hierarchicalstructures using organic–inorganic materials, how topromote a jump in the current membrane propertiesby using nanotubes, and how to manufacture a newgeneration of membranes, which react to externalstimuli.
1.06.2.1 Next Generation of Mixed-MatrixMembranes
There are still manufacturing problems to besolved, before mixed-matrix membranes are intro-duced in commercial GS. We see an increasingnumber of patents filed by big companies activein GS [60–63], and it can be concluded thatmixed-matrix membranes are on the brink of prac-tical application. The development of new mixed-matrix materials for GS will remain an attractiveresearch field. Besides classical zeolites and carbonmolecular sieves (CMSs), new selective adsorbantshave to be considered. One candidate, for example,might be metal-organic frameworks (MOFs), three-dimensional (3D) nanoporous networks of transi-tion metal complexes. MOFs have been reviewedby Kitagawa et al. [64] and Rowsell and Yaghi [65].A huge number of architectures have been pub-lished in the last years. The possibility of tailoringthe structures and choosing the right linkers tobuild networks with sieve dimensions able to dis-criminate gas permeants is particularly attractivefor membrane development. Issues such as stabilityand reproducibility must however be controlled.Recent findings suggest that MOFs can revolutio-nize GS and storage [66]. MOFs are nanoporousmetal-organic soft materials analogous to zeolites,but with all the chemical diversity of polymericcompounds. MOFs exhibit a very high porositywith exactly tailorable pore sizes. One example isan MOF with manganese atoms, which has beenreported recently [67]. This material, which fea-tures permanent porosity with pore aperturediameters of �0.45 nm, sorbs carbon dioxide butessentially completely excludes methane andnitrogen. Won et al. [68] recently reported
Advanced Polymeric and Organic–Inorganic Membranes for Pressure-Driven Processes 119

membranes made of polysulfone and [Cu2(PF6)(NO3)(4,49bpy)4] 2PF6?2H2O]n and tested themfor hydrogen/methane separation. Atomicallydetailed simulations were used to predict the per-formance of MOFs as membranes for GSs, usingthe separation of CO2/CH4 mixtures by MOF-5 asan example [69]. A particularly interesting hybridframework has been reported by Serre et al. [70],which is able to swell under external stimuli suchas pressure, temperature, light, gas or solventadsorption. The highest reported swelling orbreathing is 40%. Hence, mixed-matrix membranescontaining this MOF might be very attractive fornatural gas and biogas purification. This is just oneexample for potential future developments ofmixed-matrix membranes.
1.06.2.2 Molecular Imprinted Membranes
One elegant and very specific way to control poresizes is the concept of molecular imprinted mem-branes. This approach has been explored bydifferent groups [71, 72]. A nice review on that andother functional membranes has been published byUlbricht [71]. One procedure to prepare imprintedmembranes is the polymerization of a functionalmonomer in the presence of an analyte (template),which will be imprinted in the polymer and laterextracted [72]. The extraction gives a specific recog-nition site able to selectively bind analogousmolecules. Other procedure is the preparation ofmembranes from polymer blends via phase separa-tion. One polymer has the function of building themembrane structure and is chosen among those wellinvestigated for phase inversion asymmetric mem-branes (e.g., CA, polysulfone, and PAN). Thesecond polymer is added to provide strong interac-tion with the small molecules, which are included astemplates. The small template molecules are addedto the casting solution and, after a fast membraneformation by phase inversion in a coagulation bath,are extracted, leaving sites which are particularlyfavored for accommodating other analogous mole-cules in a filtration process. Since the sites areexpected to have a certain chemical affinity for theoriginal molecule, the functional mechanism is simi-lar to antibodies or enzymes.
1.06.2.3 Block Copolymers
Block copolymers have been proposed for pore for-mation in membranes for a long time [73–79]. Ishizu
and Amemiya [75] used block copolymers to developcharge mosaic membranes, polymeric films withmicrophase separation containing both negativelyand positively charged phases. Pebax�, a commercialblock copolymer of polyamide and PEO, has beenused for nanofiltration [18] and gas separation [44].Lee et al. [74] synthesized copolymers with one blockcontaining isoprene and the second functional silylgroups. The immiscibility between the two differentblocks led to microphase separation. The dense filmswere cross-linked by promoting the hydrolysis andcondensation of the silyl-containing blocks. Theisoprene blocks were decomposed with ozone andfurther leached with solvent, creating pores in a poly-siloxane matrix. The pore size could be controlled byusing copolymers with bocks of different sizes. Phillipet al. [76] prepared membranes based on triblock copo-lymer of polylactide–poly(dimethylacrylamide)–polystyrene (PLA–PDMA–PS). By controlling therelative block length, spherical domains, lamellae,and cylinders of PLA coated with PDMA in a con-tinuum of PS could be obtained. The PLA blocks werethen removed by etching with aqueous base to formregular pores with diameter 13.7 nm. One of the mainproblems is however to establish a method to verti-cally orient micro-domains and ensure poreconnectivity from one side to the other. One possibi-lity is the application of external fields [77, 78].Peinemann et al. [79] prepared integral asymmetricmembranes from diblock copolymer poly (styrene-b-4-vinylpyridine), PS-b-P4VP in a mixture of highand low boiling point solvents, observing the forma-tion of cylindrical porous structure of 40 nm diameter,perpendicular to the membrane surface. A follow-upof this work with new forms of self-assembly formembranes is continuing at KAUST (Figure 5).
500 nm
Figure 5 Membranes prepared from self-assemblies of
PS-b-P4VP block copolymer. From Peinemann, K.-V.,
Abetz, V., Simon, P. F. W. Nat. Mater. 2007, 6, 992–996.
120 Basic Aspects of Polymeric and Inorganic Membrane Preparation

The volatile solvent starts to evaporate, leading toa concentration gradient between one side of themembrane to another. By increasing the copolymerconcentration, conditions for phase separation arereached, forming the domains, which will later giverise to the pores, spreading along the gradient andguiding the growth of the cylindrical domains. Ikkalaand ten Brinke [80] summarized the potential appli-cation of self-assembly of polymeric supramoleculesas basis for tunable nanoporous materials and smartmembranes. They proposed the use of flow, electricor magnetic field to align comb-shaped copolymers,which self-organize in cylinders, aiming the applica-tion for membranes.
1.06.2.4 Organic–Inorganic Self-Assembly
The concept of molecular self-organization and self-assembly first from small molecules to supramolecu-lar structures using a bottom-up strategy has beenexplored by Lehn [81]. Barboiu et al. [82] have beenusing the self-organization of organic–inorganicmolecules to prepare hybrid membranes by the sol–gel process. The membranes can function forinstance as an ion-powered adenosine triphosphatepump. For the membrane formation, molecules con-taining macrocyclic groups (e.g., crown ether) areself-organized in solution forming a superstructurewith strong H-bonds, which is later polymerized bysol–gel, forming a hybrid heteropolysiloxanematerial.
Nature can be the best inspiration for neworganic–inorganic materials [83]. Silicic skeletons ofunicellular organisms Radiolaria and diatoms have aregular complex and finely porous morphology. Abig challenge is to manufacture membranes withsimilar pores. In the last years, some approacheshave been made, bringing some possibility in thisdirection. The group of Wiesner [84, 85] uses blockcopolymers and inorganic precursors to create reg-ular organic–inorganic structures. An example is theuse of an amphiphilic poly(isoprene-block-EO) blockcopolymer (PI-b-PEO) in combination with 3-(gyci-dyloxypropyl)trimethoxysilane, GLYMO, andaluminum sec-butoxide, which by sol–gel synthesisgenerates an organically modified aluminosilicatenetwork. A regular porous structure results aftercalcination.
Another interesting organic–inorganic nanopor-ous materials with potential use for membranes areperiodic mesoporous organosilicas with domainfunctionality [86, 87]. Organic groups embedded
into pore walls brought a new direction in theresearch of mesoporous molecular sieves. Thesematerials are synthesized using bridged organosilicaprecursors ((EtO)3Si-R-Si(OEt)3) in conditions ana-logous to those for the preparation of mesoporoussilicas. Compared to pure mesoporous silica, theorganic modification allows tuning hydrophobicityand hydrophilicity of the porous network. In com-parison with microporous zeolites, they featureincreased pore dimensions and the ability to controlthe molecular recognition properties of the porousnetwork by altering organic functionalities.Mesoporous silica with –CH2–CH2–/–CHTCH–bridges and with benzene rings have been reported,which can be used for further functionalization.
1.06.2.5 Organically Modified InorganicMembranes
In this chapter emphasis is given to polymeric mem-branes and polymeric membranes with inorganiccomponents. On the other hand, inorganic poroussieves can be functionalized with organic segments.The early efforts to graft organic groups into themicropores of zeolites generally failed, resulting inthe modification of primarily the external surface ofthe crystals. The first microporous, crystalline sili-cates with organic groups covalently bound withinthe micropores [88] were made by adding organosi-lanes [(CH3O)3SiR] to the silicate synthesis gel andincorporating into the zeolites during synthesis,yielding organic-functionalized molecular sieveswith potential application for catalysis.
Ordered anodized alumina substrates are availablewith very regular pores, which can be functionalizedby using silanes. They can work then as scaffolds withselective gates on the pores if surface-bound mole-cules that change conformation with pH are furtherattached to the silanes functionalities [89, 90].
1.06.2.6 Membranes with Carbon Fillers
The preparation of carbon membranes has the moti-vation of high thermal stability (in nonoxidativeenvironment) and the possibility of operation in thepresence of organic solvents. CMS membranes areusually obtained by pyrolysis of organic polymerslike cellulose [91] and polyimide [92]. The porousstructure can be tailored by choosing the right poly-mer precursor, the pyrolysis temperature andenvironment, and the time spent at this temperature.A detailed review of CMS membranes is beyond the
Advanced Polymeric and Organic–Inorganic Membranes for Pressure-Driven Processes 121

scope of this chapter. Exotemplating is an alternativemethod for the preparation of hierarchically struc-tured meso-macroporous carbon materials. In thisapproach suitable templates such as alumina mem-branes, zeolites, zirconia, and mesoporous silica areimpregnated with carbon precursors such as sucroseand carbonized under nonoxidizing conditions. Thetemplates are then washed out with fluoridric acid.Carbon porous structures with aligned macrochan-nels were reported by Su et al. [93].
However, carbon membranes have drawbacks,which have still hindered their successful industrialapplication. They are brittle and the production pro-cess in large scale is much more expensive andcomplex than that of polymeric membranes.Promising approaches for polymeric membranedevelopment are being reported in the last yearsusing different geometries of carbon fillers: CMSs,fullerenes, and carbon nanotubes (CNTs).
The dispersion of CMSs as filler for Matrimid�
5218 and Ultem� 1000 has been successfullyexplored by the group of Koros in mixed-matrixmembranes [94]. It was shown that the CMS particlesproduced a membrane having significantly enhancedeffective permselectivities (CO2/CH4 and O2/N2)and fast-gas permeabilities (CO2 and O2) over theintrinsic properties of the pure polymer matrix phasealone. For the CO2/CH4 separation, enhancementsby as much as 45% in CO2/CH4 permselectivity and200% in CO2 permeability over the correspondingintrinsic permeation properties of the pure polymermatrix phases were observed.
Homogeneously fullerene-dispersed membranesfor GS were first prepared using a matrix of poly(1-trimethylsilyl-1-propyne) [95]. The fullerene in thatcase was just physically dispersed. Sterescu et al. [96]prepared poly(2,6-dimethyl-1,4-phenylene oxide)(PPO) membranes with covalently attached fuller-enes (C60). The idea was that their hard-sphereproperties may inhibit molecular polymer-chainpacking possibly resulting in a high-free volume.The PPO-bonded C60 membranes exhibit signifi-cantly higher gas permeability (up to 80%) incomparison to pure PPO, without compromise inselectivity.
CNTs offer a unique combination of properties:high aspect ratio/high surface area, electron conduc-tivity, superhydrophobicity, and frictionless surfacesto lead to fast fluid flow, simple functionalization, anddispersion in organic polymers, capability to enhancemechanical strength with small filler content as wellas the potentially close control of pore dimension at
the nanometer scale [97, 98]. Furthermore, the func-tionalization can be directed to the entrance of theCNT, giving an excellent opportunity for develop-ing gates for separation.
During the CNT growth process, the nanotube sizeis set by the diameter of the catalyst particle [99, 100],offering a practical route for pore diameter controlthrough well-determined catalyst synthesis. Aimingmembrane application, introducing nanotubes withwell-defined inner core sizes into polymer films shallenable a fine control of pore dimension at the nan-ometer scale. These characteristics started to beexplored in membrane applications for gas and liquidseparation [101–105]. Hinds et al. [101] made a pio-neering contribution, reporting on the preparation ofan aligned CNT membrane for gas permeation andfor transport of RuðNH3Þ3þ6 ions in aqueous solution.He followed theoretical predictions [101], which sug-gest that the diffusivity of light gases inside CNTswith diameter around 1 nm to be orders of magnitudehigher than in other porous structures like zeolites,due to the inherent molecular smoothness. After thefirst simulations [104] of water transport in nanotubes,experimental results also demonstrated higher thanexpected flow rates, making CNT membranes pro-mising candidates for water desalination with thepossibility of tailoring the tube diameters to retainsalt [106]. Salt rejection coefficients that match orexceed those of commercially available nanofiltrationmembranes, while exceeding their flux by up to 4times [107].
CNTs have also been proposed for manufacturingelectrodes for water desalination promoting flowthrough capacitor [99]. Furthermore, they are con-sidered as mechanical support for catalysts [100] andcould therefore be an attractive additive in the designof a new generation of catalytic membranes.
Furthermore by choosing nanotubes with suita-ble electron conductivity and controlling theirdistribution in the polymer electrolyte, an optimumcatalyst–electrode–electrolyte interphase layercould be tailored [98].
However although the idea of using nanotubes formembranes is fascinating, there are many challengesinvolved. The first challenge is to prepare the poly-mer composite with aligned CNTs and free ofdefects. Another possible issue is the propensity forfouling given the hydrophobic nature of CNTs.CNT alignment has been claimed to be advanta-geous in different membrane applications. Someauthors [108] predicted higher gas permeabilitywhen the CNTs are aligned. Furthermore for the
122 Basic Aspects of Polymeric and Inorganic Membrane Preparation

aligned tubes, superhydrophobicity might be muchmore evident. Different alignment strategies havebeen reported in literature [103, 109–111]. Nednooret al. [109] obtained a vertically aligned array ofmultiwalled CNTs grown on quartz by chemicalvapor deposition (CVD). The space between thetubes was filled with polystyrene and the membranewas removed from the quartz by treatment withfluoridic acid. Prehn pressed a carpet of CNTsgrown on silicon wafers against a thin layer of meltedpolystyrene, detached it from the silicon substrate,and further coated the nanotubes with ionic polymeraiming the use as fuel cell membrane-electrodeassemblies. The styrene was then dissolved makingthe CNT tips free for catalyst deposition. Mi et al.[111] grew vertically aligned CNTs directly on aporous alumina support and filled the space betweenthe CNTs with polystyrene as well. Kim et al. [103]fabricated the membrane by orienting functionalizedsingle-wall CNTs with a filtration method [112].
A very interesting property of CNTs is thesuperhydrophobicity. Once water is inside thepores, an exceptional flux is observed, exceedingall the initial predictions. The high flux may bedue to the CNTs’ atomically smooth, hydrophobicwalls allowing considerable slip of water throughthe pores [29]. However, for water to wet the nano-tube membranes, some work is required. Modifyingthe surfaces of the membrane, as discussed for nano-filtration membranes, can alter the surfaceproperties, and thus potentially decrease the energybarrier to enter the tubes. Wang et al. [113] studiedthe effect of the application of external potential onthe droplet stability and wetting behavior of wateron CNTs and demonstrated that water can beefficiently wet and pumped through superhydro-phobic aligned multiwalled nanotube membranesby application of a small positive direct current(DC) bias.
Membranes containing CNTs are therefore con-sidered to have a great potential for waterdesalination [105]. As mentioned before, the waterdesalination with membranes is an established pro-cess and some of the currently used membranes havebeen developed for decades. According to recentpapers, a new generation of membranes could befeasible with nanotubes, inspired by biological waterpores, known as aquaporins [114, 115]. The flow ratesof water through nanotubes have been reported to beexceptionally high and independent of the tubelength. The use of nanotubes in membranes mightmake real the dream of mimicking protein ion
channels by precisely gated with selective and rever-sible chemical interactions. With this idea Nednooret al. [109] prepared membranes with aligned CNTs,after activating the CNT tips to have carboxylicgroups, and further derivatized them with a moleculethat binds to a bulky receptor. The receptor canopen/close the pore entrance. Successful resultswere demonstrated by functionalizing nanotubeswith a desthiobiotin derivative that binds reversiblyto streptavidin.
Majumder et al. [116] proposed the use of CNTsfor voltage-gated membranes, taking advantage ofthe fact that CNTs are conductors inside an insulat-ing matrix allowing for the concentration of electricfield at the tips. Modest voltages (100 mV) could thenbe applied to control the steric environment of thechannel entrance. Besides the functionalization, tech-nological challenges for CNT membranes will be thescaling up, increasing the pore density per area of theactive layer and decreasing the cost of membranefabrication. However, the synthesis of CNTs isbecoming less expensive and at least multiwalledCNTs are already available now in large scale.
1.06.2.7 Responsive Membranes
A concept which leads to new generation of advancedmembranes is that of switchable surfaces. A review onintelligent surfaces was recently published by Graset al. [117].
1.06.2.7.1 Response to temperature
The response of polymers to stimuli has beenknown for a long time. Probably, the most-reportedand well-investigated effect of this kind is the con-traction and expansion of polymer chains in solutionby simply changing the temperature. Heskins andGuillet [118] published in 1968 their investigationon poly(N-isopropylacrylamide) reporting that thesystem has a lower critical solution temperature(LCST) at 32 �C. Polymer–solvent interactions ingeneral can improve or deteriorate as the tempera-ture increases. Numerous systems are known forwhich the thermodynamic conditions for polymerdissolution improve with the temperature. In thiscase, the thermodynamic phase diagram is deter-mined by upper critical solution temperatures,below which demixing occurs. This is the case formany polymers in organic solvents. On the opposite,the solubility of poly(N-isopropylacrylamide)increases when the temperature decreases. Above
Advanced Polymeric and Organic–Inorganic Membranes for Pressure-Driven Processes 123

LCST water becomes a bad solvent for this polymer
(Figures 6 and 7).The polymer chains react then by contracting
themselves above the LCST and expanding below
it. In the particular case of this polymer, the expan-
sion is due to strong hydrogen bonds between the
amide groups in the polymer chains and the sur-
rounding water molecules. Water is in this form
retained in the polymer gel. As the temperature
increases above the LCST, the polymer hydrophobic
groups are exposed and the hydrogen bonds with
water are interrupted. The water molecules are
squeezed out of the gel while the polymer chains
shrink [119].With an LCST near the body temperature, this
system was predestinated for biomedical
applications, being the object of investigation for
drug delivery [120], bioseparation [121], enzyme
immobilization [122], and cell culture for tissue engi-
neering [123].Another very interesting aspect of analogous sys-
tems is that the LCST can be shifted if additional
factors such as pH or ionic strength are changed.
However, although thermo-responsible gels have
found applications for instance in chromatography,
their application in the membrane manufacture
came much later, since as a film they are not self-
supportable. Different approaches have been used to
overcome this disadvantage, mainly the copolymer-
ization and preparation of phase inversion porous
membranes [124, 125] and the manufacture of
HH
H
HH
HNN
T
LCST
Response to temperature
N N
HO
T < LCST T > LCST
O O
φ
O
O OO O
HH
H
HH HH
HH
HH
HH
N
N
N
N
N
N
N
N
O
O
O
O
O
O
OO
Figure 7 Change of conformation of poly(N-isopropylacrylamide) in thermal-responsive Membranes. Modified from Gras,
S. L., Mahmud, T., Rosengarten, G., Mitchell, A., Kalantar-Zadeh, K. ChemPhysChem 2007, 8, 2036–2050.
T
LCST
T < LCST
T > LCST
UCST
φ
Figure 6 Lower critical solution temperature (LCST) andthermal-responsive membranes.
124 Basic Aspects of Polymeric and Inorganic Membrane Preparation

composite membranes by grafting onto high-strength
polymeric micro-porous films such as track-etched
polycarbonate [119] or PET membrane [126].Besides temperature there is a large variety of
external stimuli, which can trigger changes in surface
hydrophobicity, including electrical, electrochemi-
cal, and photonic effects.
1.06.2.7.2 Electric and electrochemical
response
By applying voltage to a surface, electric charge is
generated and wettability and even chemical proper-
ties can change [127–136]. Change on wettability
when voltage is applied is illustrated in Figure 8.This effect is achieved for instance by changing
the redox state. A conceivable membrane could have
redox-active groups attached to its pore walls. The
groups could be oxidized by the electric charge,
forming cations and making the membrane hydro-
philic, analogously to what is observed for
surfactants. After withdrawing the voltage, the
membranes would become hydrophobic again.
Bulky molecules such as rotaxanes can respond to
electrochemical impulses or to changes in proton
concentration nearby by changing their conforma-
tion. They are being considered for potential
application as artificial molecular muscles, but
could also be useful if attached to membranesurfaces [137].
Electrochemically responsive surfaces, whichcould be useful for membranes, could be preparedby attaching hydrophobic chains with negativelycharged tips. This was demonstrated by Lahannet al. [138] for mercaptohexadecanoic acid moleculeson gold surface. If electrical potential is applied, thenegatively charged tips (carboxylic groups) arebended to the surface exposing the hydrophobicpart of the chain.
1.06.2.7.3 Photo-response
It has been reported that molecules such as azoben-zene suffer reversible isomeric changes ofconformation by illumination with UV light(Figure 9) [139].
The cis form is more hydrophobic and lessexpanded than the trans. The grafting of similar seg-ments onto membrane pore surfaces would alsoselectively change their flow rates. Isomerizationunder UV light is also observed for pyrimidine[140] and spiropyran [141].
1.06.3 Final Remarks
The research on nanotechnology is dramaticallygrowing in the last years. Many of the innovativeapproaches reported for other applications can beadapted to tailor membrane surface and pore size.Micro-patterning of membranes has been success-fully used to increase their surface and flow [142].Taking into account the different approaches men-tioned in this chapter and combining othernanofabrication methods such as photolithography,
V
Figure 8 Electric-responsive surfaces.
UV light
Hydrophobicity
transcis
Figure 9 Photoresponsive materials.
Advanced Polymeric and Organic–Inorganic Membranes for Pressure-Driven Processes 125

layer-by-layer assembling [143], and conventional
methods of membrane preparation, it will be possible
to tune pores and surface functionalities. Some years
ago, the membrane field seemed to be stagnated, after
testing a large range of available homopolymers for
manufacture, which in many cases was upscaled and
brought to successful implementation in industrial
separation processes. With the application of recent
achievements of nanoscience, new challenges for
membrane development are now becoming reality
and it is clear that innumerous possibilities are still
open for exploration.
References
[1] Nunes, S. P., Peinemann, K.-V. Membrane Technology inthe Chemical Industry, 2nd edn.; Wiley-VCH: Weinheim,2006.
[2] Kesting, R. E. Synthetic Polymeric Membranes. AStructural Perspective; Wiley: New York, 1985.
[3] Strathmann, H. J. Membr. Sci. 1981, 9, 121–189.[4] Baker, R. W., Cussler, E. L., Eykamp, W., Koros, W. J.,
Riley, R. L., Strathmann, H. Membrane SeparationSystems: Recent Developments and Future Directions;Noyes Publishing: Park Ridge, NJ, 1991.
[5] Mulder, M. Basic Principles of Membrane Technology;Kluwer: Dordrecht, 1991.
[6] Nunes, S. P. Trends Polym. Sci. 1997, 5, 187–191.[7] Petersen, R. J. J. Membr. Sci. 1993, 83, 81–150.[8] Cadotte, J. E., Petersen, R. J., Larson, R. E.,
Erickson, E. E. Desalination 1980, 32, 31.[9] Norman, R. W. Science 1974, 186, 350.
[10] Jellinek, H. H. G. (Potsdam, NY), Osmosis Process forProducing Energy. US Pat. 3,978,344, November 1974.
[11] Loeb, S. Science 1975, 189, 654–655.[12] Peinemann, K.-V., Gerstandt, K., Skilhagen, S. E.,
Thorsen, T., Holt, T. Membranes for Power Generation byPressure Related Osmosis. In Membranes for EnergyConversion; Peinemann, K.-V., Nunes, S. P., Eds.;Wiley-VCH: Weinheim, Germany, 2008; pp 263–274.
[13] Schafer, A. I., Fane, A. G., Waite, T. D., Eds.Nanofiltration – Principles and Applications; Elsevier:Oxford, UK, 2005.
[14] Manttari, M., Pekuri, T., Nystrom, M. J. Membr. Sci. 2004,242, 107–116.
[15] Cadotte, J. E., Walker, D. R. (Filmtec). Novel WaterSoftening Membranes. US Pat. 4,812,270, March 1989.
[16] Wheeler, J. W. (Du Pont). Process for Opening ReverseOsmosis Membranes. US Pat. 5,262,054, November1993.
[17] Mickols, W. E. (Dow Chemical). Method of TreatingPolyamide Membranes to Increase Flux. US Pat.5,755,964, May 1998.
[18] Nunes, S. P., Sforca, M. L., Peinemann, K. V. J. Membr.Sci. 1995, 106, 49–56.
[19] Schmidt, M., Peinemann, K. V., Paul, D., Rodicker, H.Angew. Makromol. Chem. 1997, 249, 11–32.
[20] Lu, Y., Suzuki, T., Zhang, W., Moore, J. S., Marinas, B. J.Chem. Mater. 2007, 19, 3194–3204.
[21] Linder, C., Perry, M., Nemas, M., Katraro, R. (Aligena).Solvent Stable Membranes. US Pat. 5,039,421,August 1991.
[22] Perry, M., Yacubowicz, H., Linder, C., Nemas, M.,Katraro, R. (Membrane Products Kiryat Weizmann).Polyphenylene Oxide-Derived Membranes forSeparation in Organic Solvents. US Pat. 5,151,182,September 1992.
[23] Ebert, K., Koll, J., Dijkstra, M. F. J., Eggers, M. J. Membr.Sci. 2006, 285, 75–80.
[24] Vanherck, K., Vandezande, P., Aldea, S. O.,Vankelecom, I. F. J. J. Membr. Sci. 2008, 313, 135–157.
[25] Kramer, P. W., Yeh, Y.-S., Yasuda, H. J. Membr. Sci.1989, 46, 1–28.
[26] Belfort, G., Ulbricht, M., J. Appl. Polym. Sci. 1995, 56,325–343.
[27] Ulbricht, M., Belfort, G. J. Membr. Sci. 1996, 111,193–215.
[28] Wang, D. (Millipore). Hydrophobic Membrane HavingHydrophilic and Charged Surface and Process. US Pat.5,137,633, August 1992.
[29] Shannon, M. A., Bohn, P. W., Elimelech, M.,Georgiadis, J. G., Marinas, B. J., Mayes, A. M. Nature2008, 452, 301–310.
[30] Deratani, A., Li, C. L., Wang, D. M., Lai, J. Y. Ann. Chim.Sci. Mat. 2007, 32, 107–118.
[31] Hester, J. F., Banerjee, P., Mayes, A. M. Macromolecules1999, 32, 1643–1650.
[32] Hester, J. F., Mayes, A. M. J. Membr. Sci. 2002, 202,119–135.
[33] Wang, Y. Q., Wang, T., Su, Y., Peng, F., Wu, H., Jiang, Z.Langmuir 2005, 21, 11856–11862.
[34] Masuda, T., Kawasaki, M., Okano, Y., Higashimura, T.Polym. J. 1982, 14, 371.
[35] Morisato, A., Pinnau, I. J. Membr. Sci. 1996, 121,243–250.
[36] Merkel, T. C., Freeman, B. D., Spontak, R. J., et al.Science 2002, 296, 519–522.
[37] Gomes, D., Nunes, S. P., Peinemann, K. V. J. Membr. Sci.2005, 246, 13–25.
[38] Budd, P. M., Ghanem, B. S., Makhseed, S.,McKeown, N. B., Msayib, K. J., Tattershall, C. E. Chem.Commun. 2004, 2, 230–231.
[39] Heuchel, M., Fritsch, D., Budd, P. M., McKeown, N. B.,Hofmann, D. J. Membr. Sci. 2008, 318, 84–99.
[40] Ghanem, B. S., McKeown, N. B., Budd, P. M., Fritsch, D.Macromolecules 2008, 41, 1640–1646.
[41] Budd, P. M., Msayib, K. J., Tattershall, C. E. et al. J.Membr. Sci. 2005, 251, 263–269.
[42] Lin, H., Freeman, B. D. J. Mol. Struct. 2005, 739, 57–74.[43] Lin, H., Freeman, B. D. J. Membr. Sci. 2004, 239, 105–117.[44] Bondar, V., Freeman, B. D., Pinnau, I. J. Polym. Sci., Part
B: Polym. Phys. 1999, 37, 2463–2475.[45] Kim, J. H., Ha, S. Y., Lee, Y. M. J. Membr. Sci. 2001, 190,
179–193.[46] Patel, N. P., Spontak, R. J. Macromolecules 2004, 37,
1394–1402.[47] Okamoto, K., Fujii, M., Okamyo, S., Suzuki, H.,
Tanaka, K., Kita, H. Macromolecules 1995, 28,6950–6959.
[48] Patel, N. P., Hunt, M. A., Lin-Gibson, S., Bencherif, S.,Spontak, R. J. J. Membr. Sci. 2005, 251, 51–57.
[49] Kawakami, M., Iwanaga, H., Hara, Y., Iwamoto, M.,Kagawa, S. J. Appl. Polym. Sci. 1982, 27, 2387–2393.
[50] Li, J., Wang, S., Nagai, K., Nakagawa, T., Mau, A. W.-H. J.Membr. Sci. 1998, 138, 143–152.
[51] Kim, J. H., Ha, S. Y., Nam, S. Y., Rhim, J. W., Baek, K. H.,Lee, Y. M. J. Membr. Sci., 2001, 186, 97–107.
[52] Car, A., Stropnik, C., Yave, W., Peinemann, K.-V. J.Membr. Sci. 2008, 307, 88–95.
[53] Car, A., Stropnik, C., Yave, W., Peinemann, K.-V. Sep.Purif. Technol. 2008, 62, 110–117.
126 Basic Aspects of Polymeric and Inorganic Membrane Preparation

[54] Kulprathipanja, S., Neuzil, R. W., Li, N. N. Separation ofFluids by Means of Mixed Matrix Membranes. US Pat.4,740,219, 26 April 1988.
[55] te Hennepe, H. J. C., Bargeman, D., Mulder, M. H. V.,Smolders, C. A., J. Membr. Sci. 1987, 35, 39–55.
[56] Jia, M., Peinemann, K.-V., Behling, R.-D. J. Membr. Sci.1991, 57, 289–292.
[57] Nunes, S. P. Organic–Inorganic Membranes. In InorganicMembranes: Synthesis, Characterization and Applications;Mallada, R., Menendez, M., Eds.; Elsevier, 2008; pp121–134.
[58] Maxwell, J. C. A Treatise on Electricity and Magnetism;Dover: New York, 1873; Vol. 1, p 440.
[59] Moore, T. T., Koros, W. J. J. Mol. Struct. 2005, 739,87–98.
[60] Miller, J., Kuperman, A., De Vu, Q. Mixed MatrixMembranes with Small Pore Molecular Sieves andMethods for Making and Using Membranes. US Pat.20,050,139,066, 30 June 2005.
[61] Koros, W. J., Wallace, D., Wind, J. D., Miller, S. J.,Staudt-Bickel, C., Vu, De Q. Crosslinked andCrosslinkable Hollow Fiber Mixed Matrix Membranesand Method of Making Them. US Pat. 6,755,900, 29June 2004.
[62] Kulprathipanja, S., Charoenphol, J. Mixed MatrixMembrane for Separation of Gases. US Pat. 6,726,744,October 2002.
[63] Ekiner, O. M., Kulkarni, S. S. Process for Making HollowFiber Mixed Matrix Membrane. US Pat. 6,663,805,September 2002.
[64] Kitagawa, S., Kitaura, R., Noro, S. Angew. Chem. Int. Ed.2004, 43, 2334–2375.
[65] Rowsell, J. L. C., Yaghi, O. M. Microporous MesoporousMater. 2004, 73, 3–14.
[66] Snurr, R., Hupp, J. T., Nguyen, S. T. AIChE J. 2004, 50,1090–1095.
[67] Dybtsev, D. N., Chun, H., Yoon, S. H., Kim, D., Kim, K. J.Am. Chem. Soc. 2004, 126, 32–33.
[68] Won, J., Seo, J. S., Kim, J. H., et al. Adv. Mater. 2005, 17,80.
[69] Keskin, S., Sholl, D. S. J. Phys. Chem. C 2007, 111,14055–14059.
[70] Serre, C., Mellot-Draznieks, C., Surble, S., Audebrand, N.,Filinchuk, Y., Ferey, G. Science 2007, 315, 1828–1831.
[71] Ulbricht, M. Polymer 2006, 47, 2217–2262.[72] Tasselli, F., Donato, L., Drioli, E. J. Membr. Sci. 2008, 323,
235–240.[73] Brooks, T. W., Daffin, C. L. Polym. Prepr. 1969, 10,
1174–1181.[74] Lee, J.-S., Hirao, A., Nakahama, S. Macromolecules
1989, 22, 2602–2606.[75] Ishizu, K., Amemiya, M. J. Membr. Sci. 1990, 54, 75–87.[76] Phillip, W. A., Rzayev, J., Hillmyer, M. A., Cussler, E. L. J.
Membr. Sci. 2006, 286, 144–152.[77] Morkved, T. L., Lu, M., Urbas, A. M. et al. Science 1996,
273, 931–933.[78] Schmidt, K., Schoberth, H. G., Ruppel, M., et al. Nat.
Mater. 2008, 7, 142–145.[79] Peinemann, K.-V., Abetz, V., Simon, P. F. W. Nat. Mater.
2007, 6, 992–996.[80] Ikkala, O., ten Brinke, G. Science 2002, 295, 2407–2409.[81] Lehn, J. M. Supramolecular Chemistry: Concepts and
Perspectives; Wiley-VCH: Germany, 1995.[82] Barboiu, M., Cerneaux, S., van der Lee, A., Vaughan, G. J.
Am. Chem. Soc. 2004, 126, 3545–3550.[83] Sanchez, C., Arribart, H., Guille, M. M. G. Nat. Mater.
2005, 4, 277–288.[84] Toombes, G. E. S., Mahajan, S., Thomas, M., et al. Chem.
Mater. 2008, 20, 3278–3287.
[85] Simon, P. F. W., Ulrich, R., Spiess, H. W., Wiesner, U.Chem. Mater. 2001, 13, 3464–3486.
[86] Jones, J. T. A., Wood, C. D., Dickinson, C., Khimyak, Y. Z.Chem. Mater. 2008, 20, 3385–3397.
[87] Inagaki, S., Guan, S., Ohsuna, T., Terasaki, O. Nature2002, 416, 304–305.
[88] Jones, C. W. Science 2003, 300, 439–440.[89] Jirage, K. B., Hulteen, J. C., Martin, C. R. Science 1997,
278, 655–658.[90] Hollman, A. M., Bhattacharyya, D. Langmuir 2004, 20,
5418–5424.[91] Grainger, D., Hagg, M.-B. J. Membr. Sci. 2007, 306,
307–317.[92] Steel, K. M., Koros, W. J. Carbon 2003, 41, 253–266.[93] Su, B.-L., Vantomme, A., Surahy, L., Pirard, R., Pirard, J.-P.
Chem. Mater. 2007, 19, 3325–3333.[94] Vu, D. Q., Koros, W. J., Miller, S. J. J. Membr. Sci. 2003,
221, 233–239.[95] Higuchi, A., Yoshida, T., Imizu, T., et al. J. Polym. Sci.,
Part B: Polym. Phys. 2000, 38, 1749–1755.[96] Sterescu, D. M., Bolhuis-Versteeg, L., van der
Vegt, N. F. A., Stamatialis, D. F., Wessling, M. Macromol.Rapid Commun. 2004, 25, 1674–1678.
[97] Reich, S., Thomsen, C., Maultzsch, J. Carbon Nanotubes:Basic Concepts and Physical Properties; Wiley-VCH:Weinheim, 2004.
[98] Prehn, K., Adelung, R., Heinen, M., Nunes, S. P.,Schulte, K. J. Membr. Sci. 2008, 321, 123–130.
[99] Zhang, D., Shi, L., Fang, J., Dai, K. J. Mater. Sci. 2007, 42,2471–2475.
[100] Planeix, J. M., Coustel, N., Coq, B., et al. J. Am. Chem.Soc. 1994, 116, 7935–7936.
[101] Hinds, B. J., Chopra, N., Rantell, R., Andrew, R.,Gavalas, V., Bachas, L. G. Science 2004, 303, 62–65.
[102] Skoulidas, A. I., Ackerman, D. M., Johnson, J. K.,Sholl, D. S. Phys. Rev. Lett. 2002, 89, 185901.
[103] Kim, S., Jinschek, J. R., Chen, H., Sholl, D. S., Marand, E.Nano Lett. 2007, 7, 2806–2811.
[104] Hummer, G., Rasaiah, J., Noworyta, J. Nature 2001, 414,188–190.
[105] Corry, B. J. Phys. Chem. B 2008, 112, 1427–1434.[106] Holt, J. K., Park, H. G., Wang, Y., et al. Science 2006, 312,
1034–1037.[107] Fornasiero, F., Park, H. G., Holt, J. K., et al. Proc. Natl.
Acad. Sci. U.S.A. 2008, 105, 17250.[108] Li, W., Wang, X., Chen, Z., Waje, M., Yan, Y. Langmuir
2005, 21, 9386–9389.[109] Nednoor, P., Chopra, N., Gavalas, V., Bachas, L. G.,
Hinds, B. J. Chem. Mater. 2005, 17, 3595–3599.[110] Liu, Z., Lin, X., Lee, J. Y., Zhang, W., Han, M., Gan, L. M.
Langmuir 2002, 18, 4054–4060.[111] Mi, W., Lin, Y. S., Li, Y. J. Membr. Sci. 2007, 304, 1–7.[112] Yang, D. J., Wang, S. G., Zhang, Q., Sellin, P. J., Chen, G.
Phys. Lett. A 2004, 329, 207–213.[113] Wang, Z., Ci, L., Chen, L., Nayak, S., Ajayan, P. M.,
Koratkar, N. Nano Lett. 2007, 7, 697–702.[114] Walz, T., Smith, B. L., Zeidel, M. L., Engel, A., Agre, P. J.
Biol. Chem. 1994, 269, 1583–1586.[115] Qiao, R., Georgiadis, J. G., Aluru, N. R. Nano Lett. 2006,
6, 995–999.[116] Majumder, M., Zhan, X., Andrews, R., Hinds, B. J.
Langmuir 2007, 23, 8624–8631.[117] Gras, S. L., Mahmud, T., Rosengarten, G., Mitchell, A.,
Kalantar-Zadeh, K. ChemPhysChem 2007, 8,2036–2050.
[118] Heskins, M., Guillet, J. E. J. Macromol. Sci. Chem. 1968,2, 1441–1455.
[119] Lue, S. J., Hsu, J.-J., Wei, T.-C. J. Membr. Sci. 2008, 321,146–154.
Advanced Polymeric and Organic–Inorganic Membranes for Pressure-Driven Processes 127

[120] Chilkoti, A., Dreher, M. R., Meyer, D. E., Raucher, D. Adv.Drug Delivery Rev. 2002, 54, 613–630.
[121] Piskin, E. Int. J. Pharm. 2004, 277, 105–118.[122] Kim, H. K., Park, T. G. Enzyme Microb. Technol. 1999, 25,
31–37.[123] Kikuchi, A., Okano, T. J. Control. Release 2005, 101, 69–84.[124] Ying, L., Kang, E. T., Neoh, K. G. Langmuir 2002, 18,
6416–6423.[125] Ying, L., Kang, E. T., Neoh, K. G., Kato, K., Iwata, H. J.
Membr. Sci. 2004, 243, 253–262.[126] Spohr, R., Reber, N., Wolf, A., et al. J. Control. Release
1998, 50, 1–11.[127] Feng, L., Li, S., Li, Y., et al. Adv. Mater. 2002, 14, 1857–1860.[128] Lau, K. K. S., Bico, J., Teo, K. B. K., et al. Nano Lett. 2003,
3, 1701–1705.[129] Verplanck, N., Galopin, E., Camart, J.-C., Thomy, V. Nano
Lett. 2007, 7, 813–817.[130] Sondag-Huethorst, J. A. M., Fokkink, L. G. J. Langmuir
1994, 10, 4380–4387.[131] Gallardo, B. S., Gupta, V. K., Eagerton, F. D., et al.
Science 1999, 283, 57–60.[132] Tajima, K., Huxur, T., Imai, Y,. Motoyama, I., Nakamura, A.,
Koshinuma, M. Colloids Surf. A 1995, 94, 243–251.
[133] Gallardo, B. S., Metcalfe, K. L., Abbott, N. L. Langmuir1996, 12, 4116–4124.
[134] Aydogan, N., Gallardo, B. S., Abbott, N. L. Langmuir1999, 15, 722–730.
[135] Gallardo, B. S., Abbott, N. L. Langmuir 1997, 13,203–208.
[136] Riskin, M., Basnar, B., Chegel, V. I., et al. J. Am. Chem.Soc. 2006, 128, 1253–1260.
[137] Balzani, V., Credi, A., Silvi, S., Venturi, M. Chem. Soc.Rev. 2006, 35, 1135–1149.
[138] Lahann, J., Mitragotri, S., Tran, T.-N., et al. Science 2003,299, 371–374.
[139] Ichimura, K., Oh, S.-K., Nakagawa, M. Science 2000, 288,1624–1626.
[140] Abbott, S., Ralston, J., Reynolds, G., Hayes, R. Langmuir1999, 15, 8923–8928.
[141] Bunker, B. C., Kim, B. I., Houston, J. E., et al. Nano Lett.2003, 3, 1723–1727.
[142] Peters, A. M., Lammertink, R. G. H., Wessling, M. J.Membr. Sci. 2008, 320, 173–178.
[143] Ariga, K., Hill, J. P., Ji, Q. Phys. Chem. Chem. Phys. 2007,9, 2319–2340.
128 Basic Aspects of Polymeric and Inorganic Membrane Preparation

Biographical Sketches
S. P. Nunes is a principal reserch scientist at the Advanced Membranes and Porous Materials Center atKAUST, Saudi Arabia. She was the head of Department of Membranes for Sustainable Energy at GKSS,Germany. She has been working in the membrane field for more than 25 years and is the author of more than 10patents, 120 papers in scientific journals, and is the co-editor of five books. Her main research topics have beenmembranes for fuel cell, CO2, and hydrogen separation for energy application. She received her PhD inchemistry in 1985 at the University of Campinas, Brazil, where shelater worked as an assistant and associateprofessor from 1987 to 1997, after being a Humboldt fellow at the University of Mainz, Germany and workingat Pirelli ResearchCenter in Brazil. She has coordinated European projects and co-organized several workshopsand congresses in the field of membranes and polymer science.
Klaus-Viktor Peinemann is a co-founder of the GMT Membrantechnik GmbH, honorary professor at theUniversity of Hannover, Germany, and principal reserch scientist at the Advanced Membranes and PorousMaterials Center of KAUST, Saudi Arabia. He is the author of more than 20 patents, 85 papers in scientificjournals, and is the co-editor of five books. He has been the president of the European Membrane Society andhas more than 25 years of experience in membrane development and application, coordinating projects andco-organizing several workshops and congresses in the field of membranes. He received his PhD in chemistry in1985 at the University of Kiel, Germany, worked at Membrane Technolgy Research, USA in 1986, and washead of the Department of Membrane Development at GKSS, Germany for several years. His main researchtopics have been membranes for gas separation, nanofiltration, reverse osmosis and osmotic power.
Advanced Polymeric and Organic–Inorganic Membranes for Pressure-Driven Processes 129

This page intentionally left blank

1.07 Norbornene Polymers as Materials for MembraneGas SeparationY Yampolskii, A.V. Topchiev Institute of Petrochemical Synthesis, Moscow, Russia
ª 2010 Elsevier B.V. All rights reserved.
1.07.1 Introduction 131
1.07.2 Norbornene Polymers Obtained via ROMP 132
1.07.3 Addition-Type Norbornene Polymers 138
1.07.3.1 Structure and Free Volume 138
1.07.3.2 Transport and Thermodynamic Properties 141
1.07.4 Membrane Properties of Different Types of Norbornene Polymers 143
1.07.5 Conclusions 144
References 144
Glossary
Addition polymerization Process of
polymerization of norbornene and norbornadiene
monomers by opening of double bonds and
formation of completely saturated products with
retaining bicycling fragments in the main chain.
Diffusion coefficient or diffusivity D
(m2 s�1) Proportionality constant between the
molar flux due to molecular diffusion and the
gradient in the concentration of the species (or the
driving force for diffusion).
Fractional free volume (FFV) The method that
characterizes free volume in polymers; it is based
on calculation of occupied volume found via van
der Waals volume and determination of specific
volume (reciprocal density) of polymers.
Inverse gas chromatography The method for
investigation of physicochemical (thermodynamic)
properties of polymers; it is based on
measurements of specific retention volumes of
certain solutes in the polymers dispersed in a
chromatographic column.
Permeability coefficient P (Barrer or mol m�1 s�1
Pa�1) Parameter defined as a transport flux per
unit transmembrane driving force per unit
membrane thickness.
Permselectivity Dimensionless parameter
defined as the ratio of the permeability coefficient of
component A to that of component B.
Positron annihilation lifetime spectroscopy
(PALS) The method based on measuring lifetimes
of positrons in polymers and other condensed
phases; it allows an estimation of size and
concentration of free volume elements.
Ring opening metathesis
polymerization Process of polymerization of
strained norbornene and norbornadiene monomers
with formation of unsaturated cyclo-linear
products.
Robeson diagram The correlation of permeability
coefficients Pi and permselectivity Pi/Pj for different
gas pairs in polymers.
Solubility coefficient S (mol cm�3 Pa�1 or cm3
(STP) cm�3 atm�1; STP means at standard
temperature 273.2 K and 1 atm) Parameter which
indicates how much gas is taken up by the
membrane when equilibrated with a given gas
pressure.
Sorption isotherm Dependence of the
concentration of gas dissolved in the membrane on
gas pressure.
1.07.1 Introduction
Norbornene (bicyclo[2.2.1]hept-2-ene) and its deri-
vatives present an unusually interesting group of
monomers. Depending on the choice of catalysts
they can produce a wealth of polymeric materials
with variations of both chemical and spatial struc-
tures, as well as physicochemical and membrane
properties.
131

In the presence of the catalysts on the basis ofWCl6, RuCl3, and Re2O7/Al2O3, as well as
Grubbs Ru complexes, strained structure of these
bicycles is prone to ring-opening metathesis poly-
merization (ROMP), which leads to formation of
cyclolinear, unsaturated polymers, as shown in
Scheme 1.Polymers of norbornene itself and its various
derivatives with side groups, such as CN,
Si(CH3)3, Ge(CH3)3, CF3, and Cl, have been
prepared and investigated as potential membrane
materials. Because of the presence of double bonds
in the main chain, different cis–trans configurations
of the polymer units can be obtained depending on
the choice of the catalysts. It was shown that the
properties of the polymers prepared (such as gas
permeability, free volume, and solubility coeffi-
cients) strongly depend on the nature of the side
groups and the cis-content in the main chains. All
the metathesis polynorbornenes (MPNBs) have
relatively flexible chains; however, the structure
of the side groups results in strong variation of
the glass transition temperatures, which can be
above 200 �C.However, since norbornenes are cyclo-olefins,
they can also be polymerized via the opening of
double bonds in the presence of Ni and Pd
catalysts. This reaction, addition-type polymeriza-
tion, leads to bulky bicyclic repeat units that do
not contain unsaturated bonds (Scheme 1).
Properties of addition-polymerized polynorbor-
nenes (APNBs) are entirely different from those
of the MPNBs: APNBs, nonsubstituted or with
small side groups, have extremely high glass tran-
sition temperatures.The chapter presents a survey of the gas per-
meation properties of various norbornene polymers
of both types, as well as a discussion of their struc-
ture based on the application of computer
modeling, and the studies of free volume in these
polymers.
1.07.2 Norbornene PolymersObtained via ROMP
Since the 1980s various polynorbornenes (PNBs) of
this type with different side groups were prepared
mainly in the presence of WCl6-based catalysts.
Their gas permeation parameters were character-
ized, and a summary of the results is given in
Table 1. It is known that the glass transition tem-
peratures, Tg, which can serve as a measure of thestiffness of polymer chains, can affect the gas per-
meation parameters [6]. The relationship among
chemical structure of MPNB, their Tg, and perme-
ability coefficients allows an analysis of this trend
for a big group of polymers having similar
structure.Appearance of bulky (SiMe3) or small polar
(CN) groups as substituents leads to strong increase
in Tg. However, polymers with longer substituents
due to self-plasticization show much lower Tg: thus,
the polymer with SiMe2CH2SiMe3 side group has
Tg as low as 24 �C, that is, lower than Tg of unsub-
stituted PNB (polymer 1 of Table 1). So low is itsTg that in many respects this polymer behaves as a
rubber: its sorption isotherms are convex to the
pressure axis (in contrast to those of other, glassy
MPNBs) [2] and the permeability coefficient of
ethane is larger than that of methane [1], which is
typical for rubbers. Similar trends in the variations
of Tg can be noted for CN-containing polymers 6–8as well as the polymers 10–12 that include alkyl
side groups. The growth of the P values caused by
the appearance of SiMe3 group is approximately the
same independently of other substituents R2 (cf. the
pairs of polymers 1–2 and 5–6).Although the effects of SiMe3 groups as struc-
tural modifiers are well known for various classes ofpolymers [6], Table 1 gives interesting information
on the effects of the introduction of a small and
polar CN group, which behaves in an opposite
manner as compared with SiMe3. For example, a
n
n
n
MetathesisPolymerization
AdditionPolymerization
Scheme 1
132 Basic Aspects of Polymeric and Inorganic Membrane Preparation

comparison of the polymers 2 and 6 indicates that
replacement of H atom by CN group results in
significant decreases in the P, D, and S values,
which are accompanied by relatively small tradi-
tional tradeoff increase in selectivity. Much
stronger growth in selectivity is observed for the
pair of the polymers 1–5: CN-containing polymer
is much less permeable but has substantially greater
selectivity.Returning to the question of the effects of chain
stiffness on permeability, it can be concluded that
there is no unified trend for MPNB presented.
Although in certain cases, an increase in chain
stiffness is accompanied by noticeable growth of
permeability, some polymers with relatively flex-
ible side groups (e.g., polymers 3 and 9) are
characterized by low Tg and relatively large
P(O2) values. In spite of some variations in perme-
ability (by one order) and permselectivity, these
parameters of the considered group of MPNB do
not reach the range of values attractive for practi-
cal application.Another bicyclic unsaturated compound, nor-
bornadien, is also capable of giving high-
molecular-mass products via ROMP.
Polynorbornadienes differ from PNBs by the pre-
sence of an additional double bond in the five-
member cycle. This hardly affects chain structureand packing, so the gas permeation parameters ofboth groups of polymers are rather similar, asTable 2 illustrates.
Much more interesting results were obtained fordisubstituted PNBs having hydrogen atoms replacedby larger groups in positions 5 and 6:
n
123
4
5 6
7
It is seen from Table 3 that such polymers havepermeability coefficients larger at least by an orderthan those of nonsubstituted PNB. It is also obvious
Table 1 The effects of the side groups of substituted MPNB with the general structure on their properties. (catalyst:
WCl6 with different cocatalysts; transport parameters reported at room temperature)
R2R1
n
No R1 R2
Tg
(�C)P(O2)(Barrer)
D(O2) 107
(cm2 s�1)S(O2) 102
(cm3(STP) cm�3 cm�1 Hg�1) �(O2/N2) Ref.
1 H H 31; 42 2.8 1.5 0.19 1.9 [1–3]
2 H SiMe3 113 30 4.2 0.71 4.2 [1–3]
3 H SiMe2CH2SiMe3 24 16 2.1 0.76 4.3 [1–3]4 H CH2GeMe3 - 7.7 - - 4.3 [4]
5 CN H 140 0.53 0.70 0.075 6.3 [5]
6 CN SiMe3 211 7.6 1.7 0.15 4.6 [5]7 CN CH2SiMe3 128 11 1.7 0.65 4.2 [5]
8 CN SiMe2SiMe3 120 4.4 1.2 0.36 4.6 [5]
9 CN SiMe2OSiMe3 88 15.3 6.5 0.23 4.4 [5]
10 CN Et 134 1.7 1.5 0.11 5.2 [5]11 CN Pr 108 2.0 1.0 0.19 5.0 [5]
12 CN n-Bu 87 2.4 1.8 0.13 4.6 [5]
13 H Cl - 2.3 - - 2.6 [1]
14 H CH2Cl - 0.46 - - 1.9 [1]
Table 2 Permeability coefficients of
poly(trimethylsilylnorbornene) (PTMSNB) and
poly(trimethylsilylnorbornadiene) PTMSNBD: catalyst WCl6/
1,1,3,3-tetramethyl-1,3-disilacyclobutane) [7]
P(Barrer)
No Polymer H2 O2 N2 CO2 CH4
2 PTMSN 77 21 6.2 79 17
15 PTMSNBD 81 20 4.9 64 8.5
Norbornene Polymers as Materials for Membrane Gas Separation 133

that an introduction of two bulky substituents ren-ders polymers much more permeable than those thatinclude only one bulky group (see Table 1). It shouldalso be noted that increases in permeability are notaccompanied by decreases in permselectivity as itoften takes place (Table 4).
Gas sorption in MPNB was also studied exten-sively [2, 8, 9]. Sorption isotherms in all glassy PNBsat room temperature (25–30 �C) have the form con-sistent with the dual-mode sorption model, that is,concave to the pressure axis. The only exception isnonsubstituted PNB, whose low Tg (31 �C) is thereason for transition to the rubbery state induced byvery small concentration of solute: this results insorption isotherms concave to the concentrationaxis (Figure 1).
The order of isotherms of various gases is usuallygoverned by condensability. So the common orderof the sorption isotherms is as follows:
He < N2 < Ar < CH4 < CO2 < C2H6 (see, e.g., [2, 9]).An unexpected result was obtained in studies offluorine-containing polymers 17 and 18 of Table 3
and 4: in these cases, the sorption isotherm of ethaneis located below that of carbon dioxide (Figure 2).
This was, apparently, a first evidence of reducedsolubility of hydrocarbons in fluorine-containingpolymers due to unfavorable interactions between
C–H and C–F bonds of solutes and polymers exten-sively studied and discussed eventually [10–12].
Free volume in MPNB was experimentally eval-uated using different probe methods – positronannihilation lifetime spectroscopy (PALS), spinprobe method (SPM), and inverse gas chromatogra-
phy (IGC).The simplest and a common way to estimate free
volume in polymers is to use the Bondi method [13]for the determination of the fractional free volume(FFV): FFV¼ 1�Vocc/Vsp, where Vocc is the
Table 3 Transport properties of disubstituted polynorbornenes and poly(norbornene
spirocyclopropane)
P(Barrer)
No PolymerTg
(�C) H2 O2 N2 CO2 CH4 C2H6 Ref.
1
n
31 21 2.8 1.5 15.4 2.5 1.4 [1]
16
SiMe3Me3Sin
167 375 95 25 445 45 30 [7]
17
FF CF3
CF3 n
169 166 50 17 200 13 6.6 [8]
18
FF
OC3F7F n
77 130 55 17 200 18 14 [8]
19
n
- 7.0 1.0 0.3 2.0 0.4 0.2 [1]
134 Basic Aspects of Polymeric and Inorganic Membrane Preparation

occupied volume that can be calculated via van derWaals volume of the repeat units and Vsp is thespecific volume or the reciprocal density of the poly-mers. In MPNB the values of FFV are in the range0.16–0.20 and do not strongly depend on the struc-ture of the polymers. The studies of MPNB using thePALS method indicated that size distribution of free
volume in these polymer is monomodal and the radiiof microcavities R calculated using the Tao–Eldrupequation [14, 15] are in the range 2.9–4.1 A, whichcorresponds to the volumes of microcavities Vf of100–290 A3. A rough correlation is observed betweenthe R and Vf values and the permeability and diffu-sivity of these polymers [8].
Table 4 Separation factors �ij¼Pi/Pj of several disubstituted polynorbornenes [1, 7, 8]
Polymer O2/N2 H2/N2 CO2/CH4
n
1.9 14.4 6.3
SiMe3Me3Sin
3.8 15 9.9
FF CF3
CF3n
2.9 9.8 15.4
FF F
OC3F7n
3.2 7.6 11
402000
10
20
30
40
50
60 80 100
CH4
CO2
C2H6
C (cm3(STP)cm–3)
Ar
N2
He
P (atm)
Figure 1 Sorption isotherms in metathesis polynorbornene at 25 �C [8]. From Yampolskii, Yu. P., Bespalova, N. B.,
Finkelshtein, E. Sh., Bondar, V. I., Popov, A. V. Macromolecules 1994, 27, 2872–2878.
Norbornene Polymers as Materials for Membrane Gas Separation 135

It is known that the frequency of rotation of stablefree radical 2,2,6,6-tetramethylpiperidine-1-oxyl(TEMPO) can serve as a measure of the size ofmicrocavity in polymers [16] (so-called spin probemethod (SPM)). The frequencies of rotation � ofTEMPO in MPNB presented in Tables 1 and 3were found to be 0.1 10�9 s�1 for 1, 0.5 10�9 s�1 for2, and 10�9 s�1 for 17. For the two latter polymers the� values are indicative of fast rotation and, hence, ofrelatively large size of microcavity, which is consis-tent with the results of the PALS method [17].
The IGC method has been used successfully forcharacterization of free volume in high-permeabilitypolymers (see Reference 6, p 191). It was shown [18]that the volume of microcavity in poly[5,6-bis(tri-methylsilyl)norbornene] (polymer 16 of Table 3) isabout 820 A3, which is in agreement with itsrelatively high gas permeability.
It is known that the microstructure of polymermain chains such as tacticity of polyolefins andcis–trans configuration of the chains of dienes caninfluence many physicochemical properties,including their gas permeability. Since the micro-structure of the polymers is a result of thepolymerization conditions and nature of the cata-lysts used, one can control stereochemistry, forexample, by varying temperature, and the typeof solvents and catalysts employed during poly-merization. Ivin et al. [19] studied the cis/trans-double bond distribution in ROMP PNBs. Theyused a variety of catalysts (WCl6, MoCl5, ReCl5,etc.) and a number of cocatalysts and additives.
Strong effects of the cis/trans ratio in a polyace-tylene on its diffusivity were demonstrated byMorisato et al. [20]. A study of similar effectsin PNB and poly(trimethylsilyl norbornene)(PTMSNB) were undertaken using three catalyticsystems: Re2O7/Al2O3 promoted with tetrabutil-tin, WCl6-phenylacetylene, and RuCl3 3H2O[21, 22]. The Re catalyst induced the formationof the prevailing concentration of a cis-configura-tion (70–75%), while the Ru catalyst led to theformation of a trans-configuration (cis-content of20–31%). The W catalyst had the poorest stereo-selectivity: cis-content 55–67%.
Table 5 summarizes the effects of the microstruc-ture of the two MPNBs. The cis-content wasdetermined using infrared (IR) spectroscopy. Theintensities of the 750 and 970 cm�1 bands were usedfor finding the content of cis- and trans-units, respec-tively, in the case of PNB; for PTMSNB, thecontent of trans-units was calculated via the inten-sity of the band at 970 cm�1, while the band at1250 cm�1 (�-Si-CH3) was used as an inner stan-dard. Somewhat different trends were observed forthe two chemical structures of MPNBs. For PNB,the cis-content weakly affected the glass transitiontemperature, but the permeability coefficients ofthe polymers with the smallest cis-content weremarkedly lower. An opposite observation can bemade for PTMSNB: a noticeable sensitivity of Tg
to the cis-content and very weak variations of the P
values. Qualitatively similar conclusions can bemade based on the results of Steinhauser and
402000
20
40
60
80
100
120
60 80 100
CH4
CO2
C2H6
C (cm3(STP)cm–3)
Ar
N2
He
P (atm)
Figure 2 Sorption isotherms in poly[5,5-difluoro-6,6-bis(trifluoromethyl)norbornene] at 25 �C [8]. From Yampolskii, Yu. P.,Bespalova, N. B., Finkelshtein, E. Sh., Bondar, V. I., Popov, A. V. Macromolecules 1994, 27, 2872–2878.
136 Basic Aspects of Polymeric and Inorganic Membrane Preparation

Koros [23], who used more stereoselective cata-
lysts: ReCl5/EtAlCl2/ethyl acrylate catalyst
allowed obtaining PNB with cis-content >98%
(Tg¼ 67 �C) and IrCl3 xH2O/EtAlCl3 catalyst
that produced PNB (Tg¼ 36 �C) with cis-content
of 12%. It was shown that the polymer obtained in
the presence of the Re catalyst was more perme-
able by a factor of 1.5–3. Some difference between
the results of the works in References 21 and 23
can be explained by tacticity of the polymers pre-
pared in the presence of different catalytic systems:
racemic dyads that correspond to head–head and
tail–tail sequences in one case and atactic (tail–
head and head–tail connections) in other cases. In
this situation, the trans- and cis-double bonds are
not statistically distributed but instead form
microblocks. There is no sufficient information in
the literature to confirm or discard these
statements.Another interesting group of MPNB was studied
by Mexican researchers [9, 24–26]. These authors
prepared MPNB by polymerization of N-substituted
exo-norbornene-5,6-dicarboximides. As radicals, 1-ada-
mantyl, cyclohexyl, and phenyl were chosen. In
addition, copolymers with norbornene and the product
of hydrogenation of double bonds in the main chain were
prepared and tested. The incentives for these studies
were hopes to obtain polymers with more rigid chains
that would have higher permeability and permselectiv-
ity. The results presented in Table 6 show that indeed
these polymers have much more rigid chains: their glass
transition temperatures are in the range 129–233 �C.
Table 5 Gas permeability coefficients P, Barrer of polynorbornenes (PNBs) and poly(trimethylsilyl
norbornenes) (PTMSNBs) with different microstructure [21, 22]
CatalystCis-content(%)
Tg
(�C) H2 He O2 N2 CO2 CH4
PNBRe 70 43 17.7 12.9 3.2 0.80 14.4 1.4
W 55 42 19.4 13.0 2.6 0.75 13.9 1.9
Ru 20 35 7.3 6.0 - 0.20 3.1 0.26
PTMSNB
Re 75 59 51 56 18 4.4 72 9.2W 67 101 77 58 21 6.2 79 17
Ru 31 85 67 51 16 4.8 66 4.8
Table 6 Transport properties of MPNB with dicarboximide moiety substituted by various groups [24–26]
NO O
R n
P(Barrer)
RTg
(�C) H2 O2 N2 CO CO2 CH4 C2H6
Adamantyl 271 12.8 1.59 0.50 0.51 8.39 0.58 0.07
Cyclohexyl 129 16.1 2.13 0.61 1.04 18.11 1.12 0.13Cyclopentyl 174 - 1.95 0.45 - 8.8 0.54 -
Phenyl 233 11.0 1.44 0.31 0.52 11.44 0.54 0.09
Phenyla 197 7.22 0.66 0.12 0.21 4.51 0.15 -
a The double bonds of the main chains were hydrogenated.
Norbornene Polymers as Materials for Membrane Gas Separation 137

However, apparently due to strong interchaininteractions caused by polar dicarboximide groups,permeability is reduced by one to two orders ascompared with other MPNBs (see, e.g., Table 3).Permselectivity of this new group of MPNB is,indeed, somewhat higher than those of otherMPNBs characterized so far (see Table 4), althoughthe actual values of separation factors reported inTable 7 are not very attractive if being comparedwith polymers of other classes (e.g., polyimides) [27].This subject is discussed in a more detailed mannersubsequently in this chapter.
So far, main attention was directed to gas permea-tion parameters of MPNB. However, recently,pervaporation behavior of hydrogenated poly[5-(N-carbozoyl methylene)-2-norbornene] was reported[28]. Polymerization of such derivatives of norbornenein the presence of Ru catalysts was described earlier[29, 30]. It was shown that this polymer behaves as amaterial of highly selective hydrophilic membrane. Inseparation of 90 wt.% aqueous ethanol mixtures, highdegree of enrichment of permeate with water wasachieved. The separation factors of water/ethanolare in the range 350–600 at 25–55 �C, and it puts thispolymer among the most selective in hydrophilic per-vaporation. However, the observed permeation ratesof 300–400 g m�2 h indicate that the membranes madeof this polymer are not very permeable. The permea-tion rates decrease in the series of alcohols C1–C4,which shows that the process is diffusivity controlled.
1.07.3 Addition-Type NorbornenePolymers
A possibility of polymerization of norbornene poly-mers via the opening of double bonds in the presenceof Ni and Pd catalysts has been demonstrated byseveral authors [31–33]. These polymers haveentirely different properties: much higher glass tran-sition temperatures, greater thermal stability, and, in
some cases, larger free volume, which are determinedby bulky, bicyclic structure of their repeat unit (seeScheme 1).
1.07.3.1 Structure and Free Volume
Three structural features determine the unusualtransport properties of APNB:
• bulky repeat units that are the cause for very rigidmain chains;
• possibility of formation of stereoisomers in theprocess of polymerization in the presence of dif-ferent catalysts; and
• effects of the side groups: the effects here arestronger that those in the polymers with moreflexible main chains.
It has been shown using the Monte Carlo simulation[34] that the polymers produced in the presence ofPd and Ni catalysts have different microstructures. Inthe presence of the Pd catalysts, highly stereoregular2,3-erythro diisotactic structure is formed. In thisconfiguration, the bridgehead carbons point in alter-native directions (Stereoarchitecture A). Suchstereochemical assignment was confirmed by nuclearmagnetic resonance (NMR) spectroscopy [35].The polymers produced in the presence of the Nicatalyst are atactic materials, which supposedlyincludes 2,3-erythro diisotactic units (75%) and2,3-erythro disyndiotactic units (25%), randomlydistributed throughout the polymer main chain(Stereoarchitecture B). In the latter configuration,the bridgehead carbons point in the same direction.Further modeling work [36] suggested that the poly-mers with stereoarchitecture A have large gapsbetween polymer chains as a consequence of thelong persistence length of helical chains. By contrast,the polymers with stereoarchitecture B have moredisruption and form more compact clusters. Theseassumptions were consistent with the results of thestudy of the methyl-substituted APNB using wide-angle X-ray diffraction (WAXD) and the PALSmethod [37]. In particular, it was shown that thepolymer with stereoarchitecture A is characterizedby somewhat larger size of microcavity and, hence,larger diffusion coefficients.
APNBs were studied in detail using WAXD[37–40]. In all the cases, completely amorphous struc-tures were demonstrated with two peaks of amorphoushalo observed in WAXD pattern. This is typical forhigh free volume, high-permeability polymers such aspolyacetylenes [41–43] and amorphous Teflons AF
Table 7 Separation factors �ij¼Pi/Pj of MPNB with
dicarboximide moiety substituted by various groups [24–26]
R O2/N2 H2/N2 CO2/CH4
Adamantyl 3.2 25.6 14.5
Hexyl 3.5 26.4 16.2Phenyl 4.6 35.5 21.2
Phenyla 5.5 60.2 30.0
a The double bonds of the main chains were hydrogenated.
138 Basic Aspects of Polymeric and Inorganic Membrane Preparation

[42]. For low-permeability polymers, such as polyi-
mides, one peak of amorphous halo is characteristic.
Different interpretations for this behavior can be
found in the literature. Wilks et al. [38] assumed that
low 2� peaks can be attributed to intermolecular inter-
actions (or intersegmental d spacing), while the high
2� peaks are predominantly due to intramolecular
interactions. The summary of WAXD data is given
in Table 8.The results obtained for substituted APNB with
different side groups allow one to note a distinct effect
of chemical structure onto the observed d spacing
(dB1). The smallest dB1 value is observed for nonsub-
stituted APNB [39]. There is an evident trend in the
dB1 values for alkyl substituents of increasing size: the
largest value is observed for the polymer with hexyl
side chain. It means that larger side groups tend to
push the polymer backbones apart. The largest value
of dB1 is observed for the bulky substituent – SiMe3. A
study of two methyl-substituted PNBs with different
stereoarchitecture did not reveal any difference in the
observed d spacing [37]. It can be added that computer
simulation (molecular dynamics method) provided a
nice agreement with the experimental WAXD data
[38]. All the APNBs are characterized by larger d
spacing than that of conventional glassy polymers,
such as polycarbonates and polysulfones, where the
corresponding values of d spacing (4–6 A) indicate
more densely packed chains.The most reliable experimental tool for probing
free volume in polymers is PALS. This method is
based on the measurement of lifetime spectra of
positrons in polymers – lifetimes � i (ns) and corre-
sponding intensities Ii (%). Longer lifetimes �3 (or �3
and �4) (the so-called ortho-positronium (o-Ps)
lifetimes) can be related to the mean size of free
volume elements (FVEs) in polymers using the
universally accepted Tao–Eldrup equation [14, 15].
A single o-Ps lifetime gives a monomodal size distri-
bution of free volume. In highly permeable polymers,
usually two o-Ps lifetimes (�3 and �4) give better
statistical fit, so bimodal size distribution of free
volume results. Table 9 summarizes the results of
the application of this method to APNB.The largest size of FVEs (microcavities) found by
this method is observed in SiMe3-substituted APNB.
It can also be noted that here bimodal size distribu-
tion of free volume is observed, which is typical of
other highly permeable polymers [44, 45]. In alkyl-
substituted APNB, an increase in the length of the
Table 9 PALS data of APNB
R Catalyst�3
(ns)I3(%)
�4
(ns)I4(%)
R3/R4
(A)Vf
(A3) Ref.
H Ni(acac) 2.87 36.4 - - 3.58 (R3) 192 [39]Me Pd 3.49 32.2 - - 3.95 (R3) 258 [38]
Ni 3.15 33.3 - - 3.74 (R3) 219 [37]
Bu Pd 2.95 32.5 - - 3.60 (R3) 195 [38]
C6H13 Pd 2.77 31.6 - - 3.48 (R3) 176 [38]SiMe3 a 3 10 7 30 3.7/5.7 212/775 [40]
a [(Nph)2Ni]-methylaluminoxane.
Table 8 X-ray scattering data of APNB with different side groups
d spacinga
(A)
Catalyst R2�1
(deg)2�2
(deg) dB1 dB2 Ref.
Ni(acac)2 H 10 18.5 8.8 4.7 [39]
Pd Me 9.5 18.2 9.3 4.9 [38]
Pd Bu 7.2 18.8 12.3 4.7 [38]Pd C6H13 6.6 19.2 13.5 4.6 [38]
[(Nph)2Ni]-methylaluminoxane SiMe3 6.5 15.5 13.6 5.7 [40]
a The d spacing is found as the Bragg’s distance dB ¼ �/(2sin �), where � is the wavelength of Cu-K� radiation (1.54 A).
Norbornene Polymers as Materials for Membrane Gas Separation 139

side group is accompanied by certain decreases in thesize of FVEs. Apparently, larger substituents partly
fill microcavities that are located along main chains.It indicates that the WAXD and PALS methods giveindependent information: the chains are pushed apart
by larger side groups, but this effect is overridden bypartial filling of FVEs. The values of o-Ps lifetimes
and corresponding radii of FVEs in alkyl-substitutedAPNB are of the same order as those in MPNB.
Free volume in the SiMe3-substituted APNB wasalso studied using IGC [46]. In this method, thepartial molar enthalpies of mixing �Hs are deter-
mined for a series of molecular probes – n-alkanesof different size. For glassy polymers, the correlationsof �Hs versus the size of the probes (e.g., the critical
volume Vc or molecular volume Vb at boiling point)pass through a minimum. It was assumed (see
Reference 6, p 191) that the coordinates of theseminima (Vc(min)) correspond to the average size of
FVEs in the polymer. The values of Vc(min) increasewhen gas permeability and diffusivity of the poly-mers increase. Figure 3 shows such correlation for
the SiMe3-substituted APNB and, for comparison,for some other silicon-containing polymers.
It is seen that the addition-type polymer is char-acterized by (1) very large size of FVEs and (2) bybimodal size distribution of free volume. This type of
size distribution is common in the PALS studies ofhigh-permeability polymers, so finding it by using an
independent technique confirms those results. Thesize of larger FVEs can be estimated as 1260 A3 if one
assumes that the sorbed phase has the critical density
(Vc as the scaling parameter) and 500 A3 for theassumption of liquid density (Vb as the scaling para-
meter). Hence, the observed value of the size of free
volume is qualitatively consistent with the results ofthe PALS method. For two other polymers presented
in this figure, the coordinates of the minima corre-
spond to smaller sizes of FVEs, which is in agreementwith their lower gas permeability.
It can be added that the results of the application ofSPM to the investigation of APNB are in agreement
with the data obtained using other probe methods. It
was shown that the rotation frequency of the spinprobe TEMPO was 1� 109 s�1 in SiMe3-containing
APNB and 0.6� 109 s�1 for nonsubstituted PNB [17].The changes of the FFV as determined using the
Bondi method [13] for APNB with different sidegroups are in line with the results of more refined
methods for evaluation of free volume: thus, in non-
substituted APNB, FFV¼ 0.115–0.15 [39, 40]; in Me-
substituted APNB, FFV¼ 0.17–0.18 [37, 48]; and forthe polymer having SiMe3 group as a substituent,
FFV¼ 0.275 [40].It is interesting that APNB can be used for obtaining
nanoporous materials not only because of intrinsic, loosepacking of their chains but also by means of chemical
transformations. These polymers are distinguished by
good thermal stability (decomposition temperatures in
inert atmosphere are above 350–40 0 �C) [37, 40].However, graft copolymers with thermally labile
compounds (e.g., polylactide) allow obtaining, after
–30
–20
–10
0
10
100 300 500 700 900 1100Vc (cm3mol–1)
ΔHm
(kJ
mol
–1)
C3C12
1
2
3
Figure 3 Correlation of �Hm vs. the critical volume of solutes for different polymers [18, 46, 47]. (1) SiMe3-substituted
APNB; (2) bis-SiMe3-substituted MPNB (polymer 16 of Table 3); and (3) polyvinyltrimethylsilane. From Starannikova, L.,
Pilipenko, M., Belov, N., Yampolskii, Yu., Gringolts, M., Finkelshtein, E. J. Membr. Sci. 2008, 323, 134–143.
140 Basic Aspects of Polymeric and Inorganic Membrane Preparation

performing subsequent pyrolysis at 250 �C, nanoporousthin films, where thermally stable PNB forms a matrix(porosity up to 18%) [49].
1.07.3.2 Transport and ThermodynamicProperties
Table 10 presents permeability coefficients ofAPNB that differ by chemical structure andstereoarchitecture.
The strong effects of the chemical structure on theobserved P values are obvious. Thus, a replacementof H atoms by Me group results in a drastic (by afactor of 8–10) increase in permeability. An evenmore dramatic increase is observed due to theappearance of the bulky SiMe3 group: here the per-meability increases by two orders. The increases inthe length of the alkyl substituents in the series Me,n-Bu, and n-C6H13 result in a reduction of gas per-meability. Apparently, it is caused by the self-plasticization effect (decreases in Tg to 280 �C forthe Bu-derivative and even to 150 �C for the polymercontaining C10H21 group [48]). Such more flexiblechains can be packed better, so a decrease in freevolume is observed. The differences in the stereo-architecture of the polymers having the samechemical structure, but obtained in the presence ofdifferent catalysts (e.g., Ni and Pd), are also mani-fested in permeability coefficients: Me-substitutedpolymers, including 2,3-erythro diisotacticsequences, are characterized by greater permeabilitycoefficients for all the gases.
The most permeable among the considered groupof polymers is SiMe3-substituted APNB. It is well
known that the introduction of bulky Si(CH3)3 group
in various main chains results in a noticeable increase
in gas permeability [6]. However, the quantitative
effects can be different for various polymer classes.
Thus, in the case of relatively flexible main chain
(vinylic-type polymers such as polyethylene or poly-
styrene) the increases in the P values amount to
usually one order. The same is true for MPNB. For
APNB, the effect is much stronger – P increases by
nearly two orders of magnitude. It can be related to
much more rigid main chains in APNB. However,
the largest separation factors �ij¼ Pi/Pj are observed
for nonsubstituted APNB, so the well-known tradeoff
behavior is also observed for this group of norbor-
nene polymers. (We return to this subject later in this
chapter.)An important shortcoming of some high free-
volume, high-permeable polymers (e.g., poly(1-tri-
methylsilyl-1-propyne) (PTMSP)) is their tendency
to reduce permeability in time (the so-called aging).
Therefore, all the polymers that have high gas per-
meation parameters should be tested on time stability
of their P values. Corresponding experiments carried
out with the films of SiMe3-substituted APNB
showed that a very weak decrease (<4%) in perme-
ability is observed during 50 days when the film was
subjected to tests at 20–60 �C. For comparison, per-
meability of PTMSP decreased for the same period
by a factor of 2–3 [50].Since the SiMe3-substituted APNB showed such
a high gas permeability, its transport properties
were studied in more detail [40, 46]. An interesting
feature that can be potentially important from
the practical viewpoint is solubility-controlled
Table 10 Permeability coefficients P, barrer of APNB (at 22–35 �C)a
R Cat He H2 O2 N2 CO2 CH4 Ref.
H Ni(acac)2 - - 10.8 2.7 49.1 - [39]
Nib 29.4 41.5 6.9 1.5 33.6 2.6 [40]CH3 Pd 309.4 502.1 89.2 24.1 396.3 30.3 [48]
Pd 174.4 - - 12.6 202.1 16.9 [37]
Ni 88.8 - - 4.3 81.1 5.6 [37]n-C4H9 Pd 66.7 110.7 33.3 11.2 141.9 28.4 [48]
70 - - 9.9 139.7 23.0 [38]
n-C6H13 Pd 36.8 57.2 19.8 6.9 83.8 18.7 [48]
53.4 - - 8.2 109.8 23.1 [38]n-C10H21 Pd 38.9 62.4 25.3 8.7 111.1 28.1 [48]
Si(CH3)3 Nib 790 1680 780 297 4350 790 [40]
840 1800 980 390 4480 993
a No detailed information on the nature of the catalysts used if not stated otherwise.b [(Nph)2Ni]-methylaluminoxane; the variation in the values of P corresponds to differences in molecular mass.
Norbornene Polymers as Materials for Membrane Gas Separation 141

selectivity of this and other high-permeability, highfree-volume polymers revealed in separation ofhydrocarbons according to their molecular mass.As permeability coefficients can be presented asthe product P¼DS, where D is the diffusion coeffi-cient and S is the solubility coefficient, thevariations of the P values for the series penetrantscan be ascribed to corresponding trends of the D
and S values [51]. In conventional glassy polymers,size sieving or mobility selectivity, which is deter-mined by the variations of the diffusion coefficients,prevails; therefore, the separation factors revealhigher permeation rates of lighter components, forexample, �(C4H10/CH4) <1. By contrast, in rub-bers, the diffusion coefficients only weakly dependon the penetrant size, so the opposite inequality�(C4H10/CH4) > 1 is valid, because the solubilitycoefficient becomes a parameter more sensitive topenetrant size and properties. It is important that insome high free-volume glassy polymers (first andforemost, PTMSP) solubility-controlled permeationbehavior is observed as well [52].
In this regard, it was interesting to comparepermeability coefficients of APNB with SiMe3
side group and other polymers for n-alkanes C1–C4 at 1 atm (Table 11). It can be concluded thatthis polymer reveals the solubility-controlledselectivity of separation: permeability coefficientof n-butane is much greater than that of methane.This is a common type of behavior of several highfree-volume polymers as the data for some poly-acetylenes also show (Table 11). It can be ascribedto open porosity type of free volume typical forthese polymers.
It can be mentioned that another polymer withbulky units in the main chain has been described –exo-polybicyclopentadiene (PBCPD).
n
It has also very high glass transition temperature,above 400 �C. Its transport parameters are shown inTable 12. The values of the permeability and solu-bility coefficients of this polymer are similar to thoseof alkyl-substituted APNB, whereas the diffusioncoefficients are somewhat lower.
The diffusion coefficients of several gases in sub-stituted APNB are presented in Table 13. For
substituted polymers, the diffusion coefficients
increase with increasing intersegmental d spacing.
The largest D values are observed for the polymer
containing bulky SiMe3 group. By contrast, for alkyl-
substituted polymers, there is no positive correlation
with the free volume as sensed by PALS: the larger D
values are observed for the polymer with C6H13 side
groups, which is characterized by smaller radius of
FVEs [37, 38]. It is worth noting that for the polymer
with SiMe3 group both WAXD and PALS data are in
agreement with the observed high D values for all the
gases [40, 46].The second, thermodynamic contribution of per-
meability is the solubility coefficient S. Table 14
Table 11 Permeability of high free volume polymers in
respect of hydrocarbonsa
P(Barrer)
Polymer CH4 C2H6 C3H8 C4H10 Ref.
APNSi 790 1430 1740 17 500 [40]
PTMSP 15 000 31 000 38 000 - [52]
PMP 2900 3700 7300 26 000 [53]AF2400 435 252 97 - [45]
a PTMSP, polytrimethylsilylpropyne; PMP, polymethylpentyne;AF2400, random copolymer of 13% tetrafluoroethylene and of87% 2,2-bis(trifluoromethyl)-4,5-difluoro-1,3-dioxole.
Table 13 Diffusion coefficients D 108 cm2 s�1 of APNB at
35 �C [37, 38, 46]
Side group Catalyst Ar CH4 N2 CO2 O2
Me Ni 12.3 3.2 7.5 23.2 -
Pd 26 8 24 48 -
Bu Pd 69 27 55 75 -
C6H13 Pd 150 62 201 118 -SiMe3 Nia - 180 270 320 500
a [(Nph)2Ni]-methylaluminoxane; at 22 �C.
Table 12 Transport properties of exo-PBCPD [54]
GasP(Barrer)
D 108
(cm2 s�1)S(cm3(STP)/cm�3 atm�1)
H2 81.8 - -
He 49.5 - -O2 20.9 44 0.36
N2 5.8 19 0.23
CO2 131 21 4.7CH4 10.4 8.2 0.96
142 Basic Aspects of Polymeric and Inorganic Membrane Preparation

shows the S values for substituted addition-type
PNBs. Joint consideration of Tables 10, 13, and 14
indicates that the increases in the diffusion rate is not
the determining factor for the permeability coeffi-
cients for all gases in alkyl-substituted APNB. The
decrease in the P values for methyl- to hexyl-sub-
stituted polymers is a result of a decrease in the
solubility coefficients. The situation is quite different
for the polymer with SiMe3 group: it is distinguished
by the largest values of both S and D (in agreement
with its large free volume). An unusual resultobtained for alkyl-substituted APNB can imply thatsolubility-controlled permeation should be charac-teristic for these polymers (and not only for thepolymer with SiMe3 group). Hence, further studiesof permeation of hydrocarbons C1–C4 in these poly-mers are highly desirable, as well as more detailedatomistic modeling of their structure.
1.07.4 Membrane Properties ofDifferent Types of NorbornenePolymers
In assessment membrane applicability of differentpolymers, it is common to consider the so-calledRobeson diagrams [55] (correlations of the perme-ability coefficients Pi and separation factors Pi/Pj)and the position of the data points of certain poly-mers in those diagrams. Norbornene polymers arenow among the most explored groups of polymers.
Table 14 Solubility coefficients S cm3(STP)cm�3 atm�3 of
APNB at 35 �C [37, 38, 46]
Side group Catalyst Ar CH4 N2 CO2 O2
Me Ni 0.76 1.56 0.41 3.21 -
Pd 0.67 1.30 0.44 2.66 -Bu Pd 0.27 0.64 0.14 1.42 -
C6H13 Pd 0.11 0.29 0.03 0.70 -
SiMe3 Nia - 3.6 0.91 9.8 1.3
a [(Nph)2Ni]-methylaluminoxane; at 22 �C.
10001
1 10 100 1000 10 000 100 000
10
100
10 000100
P (H2) (Barrer)
10P (O2) (Barrer)10.10.01
1
α (O
2/N
2)
100(c)
10
10.1 1 10 100
P (CO2) (Barrer)1000 10 000 100 000
α (C
O2/
CH
4)
α (H
2/ N
2)
10(a) (b)
Figure 4 Robeson diagrams of MPNB and APNB for (a) O2/N2 pair; (b) H2/N2 pair; (c) CO2/CH4 pair. MPNB open points,
APNB closed points.
Norbornene Polymers as Materials for Membrane Gas Separation 143

On the one hand, this permitted elucidation of var-ious effects of chemical structure of polymers ontotheir transport parameters and free volume, whichwas the subject of the previous section. On the otherhand, an analysis of their permeability and perms-electivity seems also to be meaningful. The Robesondiagrams for MPNB and APNB for several gas pairsare shown in Figure 4.
It is seen that the cloud of the data points of APNBis shifted to greater permeability as compared withthat of MPNB. Interestingly, in the diagram for theCO2/CH4, no obvious tradeoff can be discerned: theincreases in the P values are not accompanied by areduction in selectivity. By contrast, an evident tra-deoff can be observed for the O2/N2 gas pair. Thedata points for both types of norbornene polymersare located below the upper bound of Robeson,although in some cases they are rather close to this.
Bearing in mind the high permeability of SiMe3-substituted APNB for n-butane and large selectivityof this polymer in separation of n-butane/methanepair as well as strong effects of the solubility coeffi-cients on P of other APNBs, as has been mentionedearlier, it is of interest to consider the correspondingRobeson diagram for this gas pair. Although selectivityof separation of n-butane/methane was not reported forother norbornene polymers, some data are available forpolymers of other classes of membrane materials: sili-con-containing rubbers [56, 57], polyacetylenes [58],and high free-volume polymers charged with nanopar-ticles [59]. Analysis of such data indicates that APNBbelongs to the most attractive materials, as can bejudged by the combination of its P(C4) and P(C4)/P(C1) values obtained in pure gas permeation experi-ments. If these results will be confirmed in mixed gasruns, this polymer can be considered as a material forseparation of natural and associated petroleum gas.
1.07.5 Conclusions
Norbornene polymers now form one of the mostexplored groups of glassy polymers, potential mate-rials for gas-separation membranes. An analysis of thestructure–properties relationships provides muchinformation on the effects of side groups, structure,and stiffness of the main chains that can be used indirected search for advanced membrane materials ofother classes. Much more interesting results havebeen obtained for addition-type norbornene poly-mers. Here, significantly smaller number of thestructures has been examined so far, so much is yet
to be done. From the synthetic viewpoint, thesepolymers pose a bigger challenge: in contrast toeasy and fast polymerization with ring opening dueto high strain of norbornene ring, here the process ofcyclo-olefin polymerization is often slow and sensi-tive to impurities in the monomers. By contrast, thealready estimated transport parameters of some ofthe polymers of this group are very attractive. Theyindicate solubility-controlled permeation ratherunusual in glassy polymers, so addition-type poly-mers of norbornene derivatives are promisingcandidates for separation of hydrocarbon gasmixtures. Further studies are needed to evaluatetheir value as actual materials for gas- and vapor-separation membranes.
References
[1] Finkelshtein, E., Bespalova, N., Portnykh, E., et al. Polym.Sci. 1993, 35, 589–593.
[2] Bondar, V., Kukharskii, Yu., Yampolskii, Yu.,Finkelshtein, E., Makovetskii, K. J. Polym. Sci. Part B:Polym. Phys. 1993, 31, 1273–1283.
[3] Finkelshtein, E. Sh., Portnykh, E. B., Makovetskii, K. L.,Ostrovskaya, I. Ya., Bespalova, N. B., Yampolskii, Yu. P.Synthesis of Membrane Materials by ROMP ofNorbornenes. In Metathesis Polymerization of Olefins andPolymerization of Alkynes; Imamoglu, Y., Ed.; NATO ASISeries C; Kluwer: Dordrecht, 1998; Vol. 506, pp 189–199.
[4] Finkelshtein, E., Portnykh, E., Ushakov, N., Gringolts, M.,Yampolskii, Yu. Macromol. Chem. Phys. 1997, 198,1085–1090.
[5] Kawakami, Y., Toda, H., Higashino, M., Yamashita, Y.Polym. J. 1988, 20, 285–292.
[6] Yampolskii, Yu., Pinnau, I., Freeman, B. D., Eds. MaterialsScience of Membranes for Gas and Vapor Separation;Wiley: Chichester, 2006.
[7] Finkelshtein, E. Sh., Gringolts, M. L., Ushakov, N. V.,Lakhtin, V. G., Soloviev, S. A., Yampol’skii, Yu. P. Polymer2003, 44, 2843–2851.
[8] Yampolskii, Yu. P., Bespalova, N. B., Finkelshtein, E. Sh.,Bondar, V. I., Popov, A. V. Macromolecules 1994, 27,2872–2878.
[9] Tlenkopachev, M., Vargas, J., Almareaz-Giron, M. A.,Lopez-Gonzales, M., Riande, E. Macromolecules 2005,38, 2696–2703.
[10] Merkel, T. C., Bondar, V., Nagai, K., Freeman, B. D.Macromolecules 1999, 32, 370–374.
[11] Bondar, V. I., Freeman, B. D., Yampolskii, Yu.Macromolecules 1999, 32, 6163–6171.
[12] Song, W., Rossky, P. J., Maroncelly, M. J. Chem. Phys.2003, 119, 9145–9162.
[13] Bondi, A. Physical Properties of Molecular Crystals,Liquids, and Glasses; Wiley: New York, 1968.
[14] Tao, J. J. Chem. Phys. 1972, 56, 5499–5510.[15] Eldrup, M., Lightbody, D., Sherwood, J. N. Chem. Phys.
1981, 63, 51–58.[16] Wasserman, A. M., Kovarsii, A. L. Spin Probes and Labels
in Physical Chemistry of Polymers; Nauka: Moscow, 1986(in Russian).
[17] Yampolskii, Y., Motyakin, M., Wasserman, A., et al.Polymer 1999, 40, 1745–1752.
144 Basic Aspects of Polymeric and Inorganic Membrane Preparation

[18] Yampolkii, Yu., Soloviev, S., Gringolts, M. Polymer 2004,45, 6945–6952.
[19] Ivin, K. J., Laverty, D. T., O’Donnell, J. H., Rooney, J. J.,Steward, C. Macromol. Chem. 1979, 180, 1989.
[20] Morisato, A., Miranda, N. R., Freeman, B. D., et al. J. Appl.Polym. Sci. 1993, 49, 2065–2074.
[21] Yampolskii, Yu., Finkelshtein, E., Makovetskii, K., et al.Polym. Sci. A 1996, 38, 959–963.
[22] Yampolskii, Yu., Finkelshtein, E., Makovetskii, K., Bondar, V.,Shantarovich, V. J. Appl. Polym. Sci. 1996, 62, 349–357.
[23] Steinhauser, T., Koros, W. J. J. Polym. Sci. Part B: Polym.Phys. 1997, 35, 91–99.
[24] Diaz, K., Vargas, J., Del Castillo, L. F.,Tlenkopatchev, M. A., Aguilar-Vega, M. Macromol. Chem.Phys. 2005, 206, 2316–2322.
[25] Contreras, A. P., Tlenkopatchev, M. A., del Mar Lopez-Gonzales, M., Riande, E. Macromolecules 2002, 35,4677–4684.
[26] Vargas, J., Santiago, A. A., Tlenkopatchev, M. A.Macromolecules 2007, 40, 563–570.
[27] Gas Permeation Parameters of Glassy Polymers.Database, No. 3585, Informregistr RF, Moscow, 1998.
[28] Wang, Y.-C., Li, C.-L., Lee, K.-R., Liaw, D.-J. J. Membr.Sci. 2005, 246, 59–65.
[29] Lee, J. H., Park, J. W., Ko, J. M., Chang, Y. H., Cjoi, S. K.Polym. Bull. 1993, 31, 339.
[30] Finkelshtein, E., Portnykh, E., Ushakov, N.,Greengolts, M., Fedorova, G., Plate, N. Macromol.Chem.Rapid Commun. 1994, 15, 2039.
[31] Kaminsky, W. Macromol. Chem. Phys. 1996, 197, 3907.[32] Makovetskii, K. L. Vysokomol. Soed. B 1999, 41,
1525–1543.[33] Janiak, Ch., Lassahn, P. J. Mol. Catal. A: Chem. 2001,
166, 193.[34] Ahmed, S. PhD Dissertation, Georgia Institute of
Technology, Atlanta, 1998.[35] Barnes, D. A., Benedikt, G. M., Goddall, B. L., et al.
Macromolecules 2003, 36, 2623–2632.[36] Chung, W. J. PhD Dissertation, Georgia Technological
Institute, Atlanta, 2003.[37] Wilks, B. R., Chung, W. J., Ludovice, P. J., Rezac, M. R.,
Meakin, P., Hill, A. J. J. Polym. Sci. Part B: Polym. Phys.2003, 41, 2185–2199.
[38] Wilks, B. R., Chung, W. J., Ludovice, P. J., Rezac, M. E.,Meakin, P., Hill, A. J. J. Polym. Sci. Part B: Polym. Phys.2006, 44, 215–233.
[39] Zhao, C., do Rosario Ribeiro, M., de Pinho, M. N.,Subrahmanyam, V. S., Gil, C. L., de Lima, A. P. Polymer2001, 42, 2455–2462.
[40] Finkelshtein, E., Makovetskii, K., Gringolts, M., et al.Macromolecules 2006, 39, 7022–7029.
[41] Yampolskii, Yu., Shishatskii, S., Shantorovich, V., et al. J.Appl. Polym. Sci. 1993, 48, 1935–1944.
[42] Korikov, A. PhD Thesis, TIPS, Moscow, 2001.[43] Masuda, T., Isobe, E., Higashimura, T. Macromolecules
1985, 18, 841–845.[44] Consolati, G., Genco, I., Pegoraro, M., Zanderighi, L. J.
Polym. Sci. Part B: Polym. Phys. 1996, 34, 357–367.[45] Alentiev, A., Yampolskii, Yu., Shantarovich, V.,
Nemser, S. M., Plate, N. J. Membr. Sci. 1997, 126, 123–132.[46] Starannikova, L., Pilipenko, M., Belov, N.,
Yampolskii, Yu., Gringolts, M., Finkelshtein, E. J. Membr.Sci. 2008, 323, 134–143.
[47] Yampolskii, Yu., Kaliuzhnyi, N., Durgaryan, S.Macromolecules 1986, 19, 846–850.
[48] Dorkenoo, K. D., Pfromm, P. H., Rezac, M. E. J. Polym.Sci. Part B: Polym. Phys. 1998, 36, 797–803.
[49] Oh, S., Char, K. Polym. Prepr. 2007, 97, 803–804.[50] Robeson, L. M., Burgoyne, W. F., Langsam, M.,
Savoca, A. C., Tien, C. F. Polymer 1994, 35, 4970–4978.[51] Freeman, B., Pinnau, I. Trends Polym. Sci. 1997, 5,
167–173.[52] Merkel, T. C., Bondar, V., Nagai, K., Freeman, B. D. J.
Polym. Sci. Part B: Polym. Phys. 2000, 38, 273–296.[53] Morisato, A., Pinnau, I. J. Membr. Sci. 1996, 121,
243–250.[54] Makovetskii, K., Yampolskii, Yu. (unpublished results).[55] Robeson, L. M. J. Membr. Sci. 1991, 62, 165–185.[56] Robb, W. L. Ann. N.Y. Acad. Sci. 1968, 146, 119–137.[57] Alentiev, A., Economou, I. G., Finkelshtein, E., et al.
Polymer 2004, 45, 6933–6944.[58] Pinnau, I., Morisato, A., He, Zh. Macromolecules 2004,
37, 2823–2828.[59] Merkel, T. C., He, Zh., Pinnau, I., Freeman, B. D.,
Meakin, P., Hill, A. J. Macromolecules 2003, 36,8406–8414.
Norbornene Polymers as Materials for Membrane Gas Separation 145

Biographical Sketch
Yuri Yampolskii, professor, doctor of science (chemistry), and head of laboratory of membrane gas separation,A. V. Topchiev Institute of Petrochemical Synthesis (TIPS), Russian Academy of Sciences, graduated from theM. V. Lomonosov Moscow State University, Chemical Faculty, in 1961. Since 1961, he has been a staff memberof TIPS. His first period of research (1961–75) focused on kinetics of hydrocarbon pyrolysis and free radicalreactions. The results of these years are summarized in a monograph, Yu.P. Yampolskii ‘Elementary processesand mechanism of hydrocarbon pyrolysis’, Moscow, Khimia, 1990.
His current field of expertise and scientific interests include membrane science and technology, materialscience, physical chemistry of polymers, and thermodynamics of sorption.
He has authored/co-authored about 300 peer-reviewed publications including six books. He won the awardof the government of Russian Federation in 1995 for research in membrane science and technology.
He is currently a member of the scientific councils in the Institute of Petrochemical Synthesis, an associatedmember of IUPAC; and a member of the editorial board of the journal Separation and Purification Technology, aRussian journal Membrany. He has presented plenary lectures on invitation at many international symposia,congresses, and conferences, including IUPAC, ICOM, Euromembranes, ACS meetings, NAMS, andIMSTEC.
146 Basic Aspects of Polymeric and Inorganic Membrane Preparation

1.08 Amorphous Perfluoropolymer MembranesV Arcella, P Toniolo, M Avataneo, A Ghielmi, and G Marchionni, Solvay Solexis, Bollate (MI), Italy
ª 2010 Elsevier B.V. All rights reserved.
1.08.1 Introduction 147
1.08.2 Hydrophobic Perfluoropolymer Membranes 148
1.08.3 Hydrophylic Perfluoropolymer Membranes 152
References 154
Glossary
Cytop� Homopolymer of
perfluorobutenylvinylether (Asahi glass).
Galden� Low-boiling perfluoropolyether fluids
(Solvay Solexis).
Hyflon� AD Amorphous copolymer of
tetrafluoroethylene and 2,2,4-trifluoro-5-
trifluoromethoxy-1,3-dioxole (Solvay Solexis).
Hyflon� ion Copolymer of tetrafluoroethylene and
short-side-chain sulfonyl vinyl ether (Solvay
Solexis).
Nafion� Copolymer of tetrafluoroethylene and
sulfonyl vinyl ether (Du Pont).
Teflon� AF Copolymer of tetrafluoroethylene and
2,2-bistrifluoromethyl-4,5-difluoro-1,3-dioxole (Du
Pont).
NomenclaturePolymers
PFA copolymer of tetrafluoroethylene and
perfluoropropyl vinyl ether
FEP copolymer of tetrafluoroethylene and
perfluoropropene
1.08.1 Introduction
Membranes based on fluoropolymer materials are of
increasingly greater interest in industrial applications
due to a remarkable combination of outstanding prop-
erties. In addition, amorphous perfluoropolymers,
having a high solubility in fluorinated solvents, can be
advantageously used for the preparation of membranes
both by solution and by melt processing. The extre-
mely high thermal and chemical resistance, associated
with other unique physical properties (low dielectric
constant, optical transparency, water and oil repel-
lence, etc.), justifies their use in not only highly
extreme but also profitable areas. With the sustained
price rise of crude oil in the international market,
fluorine products, that previously had a high cost,
have started to show a satisfactory performance/price
ratio and this explains why the demand for fluorinated
products in the market is growing so drastically.
A recent study, published by the US NationalAcademy of Sciences [1], indicates that carbon diox-
ide emissions from fossil-fuel burning and industrial
processes have been accelerating at a global scale,
with their growth rate increasing from 1% for the
1990–99 period to more than 3% for the 2000–04
period. The growth rate of CO2 emissions is highest
in rapidly developing economies, such as China;
however, developed countries, with less than a
sixth of the world’s population, still contribute
more than two-thirds of the total emissions of the
greenhouse gas.The complexity of this problem requires different
actions in different areas, for example, the develop-
ment of new sources and systems for energy supply,
including the clean use of coal, advanced nuclear
systems, and renewable energy systems. From an
industrial point of view, the major contribution will
probably be from the introduction of new
147

technological processes that can guarantee lowerpower consumption. Industrial separation of liquidsand gases is a typical example of a high energy con-suming process since traditional technologies arebased on condensation, distillation, evaporation, anddrying operations. On the contrary, membrane-separation processes are much more economical interms of energy necessary for the operation, sincethey require only less energy consumption pressuresystems. The simplicity of the membrane technologyand the possibility of production of different mem-branes with different selectivity make them verypromising for a wide range of applications. An impor-tant process in the topic of clean energy sources, away for the production of hydrogen, is the steamreforming of carbon; however, this process requiresthe separation of a mixture of hydrogen and carbondioxide and other gases. The membrane technologyrepresents, in this case, a suitable and economicalalternative to obtain pure hydrogen.
In the market, different types of membranes areavailable: ceramic (zeolite), metal (palladium, plati-num, and nickel), glass, and organic polymericmembranes. Regarding organic polymeric mem-branes, the possibility to not only modify theseparation mechanism (adsorption, diffusion, or acombination of both) but also regulate the selectivityby varying the porosity and the character of themembrane (hydrophilic or hydrophobic) makesthem useful for a wide variety of potential applica-tions. In highly extreme conditions, for example,reactive chemicals and high temperatures, fluori-nated membranes are definitely the most valuablechoice. In this chapter, a review of the developmentsin the field of amorphous perfluoropolymer mem-branes, with both hydrophobic and hydrophiliccharacter, is presented and discussed. Hydrophobicmembranes are often used in the filtration andseparation of gases, since they allow gases and vapors,which have a low surface tension, to pass while
excluding liquids, such as water, which have a highersurface tension. They are also finding application inemerging water treatment membrane processes, suchas membrane distillation. Hydrophilic perfluoropo-lymer membranes are permeable to water and, forthis reason, they can find application in electroche-mical electrolyzers (chloro-alkali [2] and HClelectrolysis [3]), fuel cells (proton exchange mem-brane fuel cells [2] and direct methanol fuel cells [4]),energy storage and delivery devices, microfiltration[5], reverse osmosis and ultrafiltration [5], perva-poration [5], electrodialysis, diffusion dialysis [6],and membrane catalytic reactors [7].
1.08.2 HydrophobicPerfluoropolymer Membranes
Hydrophobic amorphous perfluoropolymers can beobtained by the incorporation of bulky groups, forexample, dioxolenic units, into perfluorinated chainswith the aim of avoiding the crystallization andincreasing the glass transition temperature (Tg) ofthe material. Amorphous perfluoropolymers haveexceptional properties such as very good mechanicalstrength, high thermal and chemical resistance, lowsurface energies, low dielectric constant, low refrac-tive indexes, and high optical transmission across abroad wavelength from ultraviolet (UV) to nearinfrared. As they are soluble in fluorinated solvents,amorphous perfluoropolymers can be easily pro-cessed both by melt (extrusion, compression, andinjection molding) and by solution, such as diffu-sion-induced phase separation (DIPS), casting, spincoating, and dip coating. Spin coating is used toobtain an ultrathin, uniform thickness coating on aflat surface, whereas nonplanar surfaces can becoated by dipping.
A commercial hydrophobic amorphous perfluoro-polymer is represented by Hyflon� AD (Figure 1),
OCF3
CF2
(a) Hyflon® AD (b) Teflon® AF (c) Cytop®
CF CF2
n
mCF2C
OO
CF CF CF2
CF3 CF3
CF2 CF2 CF CF
n
CF2
n
m
C
O O CF2
CF2
O
Figure 1 Structure of three commercial perfluorinated amorphous glassy polymers: (a) Hyflon� AD, (b) Teflon� AF, and(c) Cytop�.
148 Basic Aspects of Polymeric and Inorganic Membrane Preparation

which is produced by Solvay Solexis by microemul-sion free radical polymerization of tetrafluoroethylene(TFE) and 2,2,4-trifluoro-5-trifluoromethoxy-1,3-dioxole (TTD).
Unlike other fluoropolymers such aspolytetrafluoroethylene (PTFE), copolymer of tetra-fluoroethylene and perfluoropropyl vinyl ether(PFA), and copolymer of tetrafluoroethylene andperfluoropropene (FEP) which are semicrystalline,Hyflon� AD is completely amorphous when theTTD molar content is in the range of 25–100%.Independent from the composition, Hyflon� ADgrades show high glass transition temperatures (Tg),which are always above room temperature [8]; thiscan be explained by considering the presence of thecyclic units and their steric hindrance which severelylimits chain motion. Increasing the TTD content ofthe copolymer concomitantly increases its Tg up192 �C which corresponds to the Tg of the TTDhomopolymer. Table 1 shows the Tg values forHyflon� AD grades with different TTD contents.In the same table, Tg values for two other amorphousglassy polymers commercially available from Du
Pont (Teflon� AF) and Asahi Glass (Cytop�) are
shown for comparison [9, 10]. The structures of
these two polymers are also shown in Figure 1. In
addition, for Teflon� AF, the permeability to gases
increases with the Tg of the copolymer.Teflon� AF is a copolymer of perfluoro-2,2
dimethyldioxole (PDD) with TFE, whereas Cytop�
is homopolymer obtained by cyclopolymerization of
perfluoro-butenylvinylether (BVE) characterized by
a controlled alternating structure with a Tg equal to
108 �C.The high solubilities in perfluorinated solvents
associated with low solution viscosities make
Hyflon� AD copolymers very attractive for solution
processes membranes preparation [11]. Both features
allow great flexibility in the selection of proper con-
ditions for the preparation of membranes with
different structures. Moreover, low solution viscos-
ities imply greater ease of purification. This aspect is
very important, since, in the polymer and polymeric
solutions, it is often crucial to avoid the presence of
both suspended and dissolved contaminants, such as
dust, or dissolved organic molecules. In fact, this is of
great importance for the preparation of composite
membranes where the permselective layer is extre-
mely thin and no defects are allowed.Different procedures have been tuned to prepare
various membrane typologies matching different
application requirements. Examples of preparation
methods and conditions for obtaining different mem-
brane structures are presented in Table 2. In these
examples, Galden� HT 110 and Galden� HT 55 are
perfluoropolyether oils [12] with the following
structure:
CF3O�ðCF2�CF2OÞn�ðCF2OÞm�CF3
with normal boiling points equal to 110 and 55 �C,respectively.
Table 1 Glass transition temperature (Tg) of amorphous
perfluoropolymers at different compositions
TFE TTD PDD BVE
Polymer (% mol) Tg (�C)
TTD homopolymer NA 100 NA NA 192
Hyflon� AD 60 40 60 NA NA 125
Hyflon� AD 40 60 40 NA NA 95PDD homopolymer NA NA 100 NA 335
Teflon� AF 2400 13 NA 87 NA 240
Teflon� AF 1600 35 NA 65 NA 160Cytop� NA NA NA 100 108
NA, not available.
Table 2 Examples of preparation procedures for different flat-sheet membrane types obtained from Hyflon� AD 60
Membrane type Symmetric Asymmetric Composite
Method Solution casting Dry–wet phase inversion Spin coating
Solvent Galden� HT 110 Galden� HT 55 PerfluoroeptaneSolution concentration (by weight) 10% 10% 1%
Temperature for solvent elimination 50 �C 25 �C 25 �CNonsolvent NA n-perfluoropentane NA
Temperature of coagulation bath NA 12 �C NASupport Glass Glass PVDF
NA, not available.
Amorphous Perfluoropolymer Membranes 149
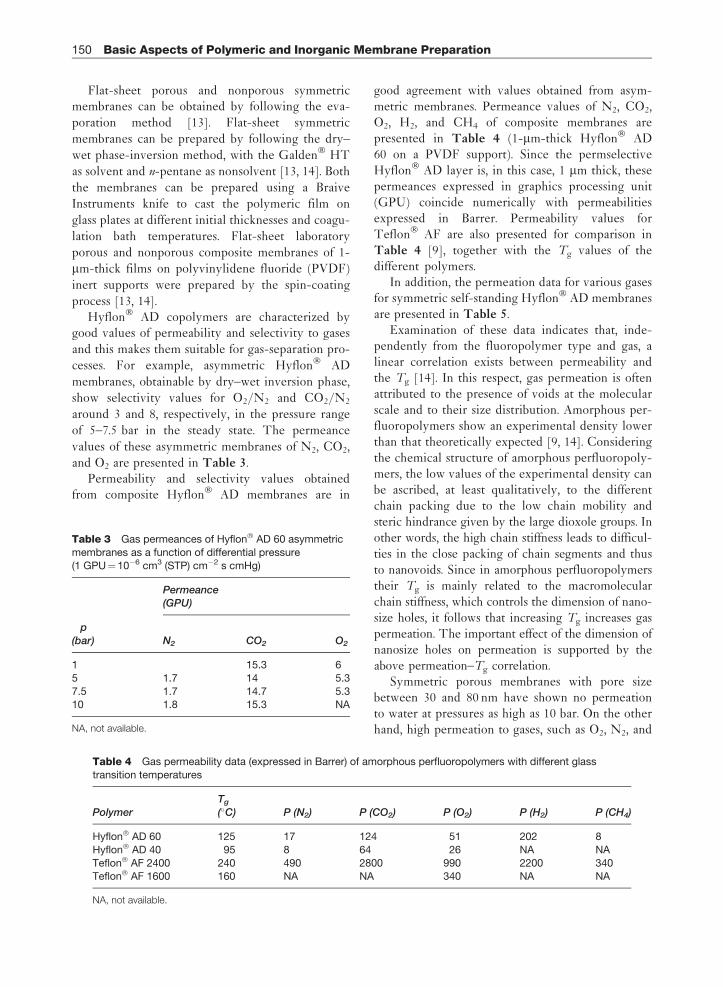
Flat-sheet porous and nonporous symmetricmembranes can be obtained by following the eva-
poration method [13]. Flat-sheet symmetric
membranes can be prepared by following the dry–
wet phase-inversion method, with the Galden� HT
as solvent and n-pentane as nonsolvent [13, 14]. Both
the membranes can be prepared using a Braive
Instruments knife to cast the polymeric film on
glass plates at different initial thicknesses and coagu-
lation bath temperatures. Flat-sheet laboratory
porous and nonporous composite membranes of 1-
mm-thick films on polyvinylidene fluoride (PVDF)
inert supports were prepared by the spin-coating
process [13, 14].Hyflon� AD copolymers are characterized by
good values of permeability and selectivity to gases
and this makes them suitable for gas-separation pro-
cesses. For example, asymmetric Hyflon� AD
membranes, obtainable by dry–wet inversion phase,
show selectivity values for O2/N2 and CO2/N2
around 3 and 8, respectively, in the pressure range
of 5–7.5 bar in the steady state. The permeance
values of these asymmetric membranes of N2, CO2,
and O2 are presented in Table 3.Permeability and selectivity values obtained
from composite Hyflon� AD membranes are in
good agreement with values obtained from asym-metric membranes. Permeance values of N2, CO2,O2, H2, and CH4 of composite membranes arepresented in Table 4 (1-mm-thick Hyflon� AD60 on a PVDF support). Since the permselectiveHyflon� AD layer is, in this case, 1 mm thick, thesepermeances expressed in graphics processing unit(GPU) coincide numerically with permeabilitiesexpressed in Barrer. Permeability values forTeflon� AF are also presented for comparison inTable 4 [9], together with the Tg values of thedifferent polymers.
In addition, the permeation data for various gasesfor symmetric self-standing Hyflon� AD membranesare presented in Table 5.
Examination of these data indicates that, inde-pendently from the fluoropolymer type and gas, alinear correlation exists between permeability andthe Tg [14]. In this respect, gas permeation is oftenattributed to the presence of voids at the molecularscale and to their size distribution. Amorphous per-fluoropolymers show an experimental density lowerthan that theoretically expected [9, 14]. Consideringthe chemical structure of amorphous perfluoropoly-mers, the low values of the experimental density canbe ascribed, at least qualitatively, to the differentchain packing due to the low chain mobility andsteric hindrance given by the large dioxole groups. Inother words, the high chain stiffness leads to difficul-ties in the close packing of chain segments and thusto nanovoids. Since in amorphous perfluoropolymerstheir Tg is mainly related to the macromolecularchain stiffness, which controls the dimension of nano-size holes, it follows that increasing Tg increases gaspermeation. The important effect of the dimension ofnanosize holes on permeation is supported by theabove permeation–Tg correlation.
Symmetric porous membranes with pore sizebetween 30 and 80 nm have shown no permeationto water at pressures as high as 10 bar. On the otherhand, high permeation to gases, such as O2, N2, and
Table 3 Gas permeances of Hyflon� AD 60 asymmetric
membranes as a function of differential pressure
(1 GPU¼10�6 cm3 (STP) cm�2 s cmHg)
Permeance(GPU)
�p(bar) N2 CO2 O2
1 15.3 6
5 1.7 14 5.3
7.5 1.7 14.7 5.310 1.8 15.3 NA
NA, not available.
Table 4 Gas permeability data (expressed in Barrer) of amorphous perfluoropolymers with different glass
transition temperatures
PolymerTg
(�C) P (N2) P (CO2) P (O2) P (H2) P (CH4)
Hyflon� AD 60 125 17 124 51 202 8
Hyflon� AD 40 95 8 64 26 NA NA
Teflon� AF 2400 240 490 2800 990 2200 340Teflon� AF 1600 160 NA NA 340 NA NA
NA, not available.
150 Basic Aspects of Polymeric and Inorganic Membrane Preparation

CO2, was observed. Composite membranes prepared
by casting the polymeric solution (1% weight) on
PVDF supports have shown unique combination of
features:
• excellent organophobicity and hydrophobicity;
• gas fluxes higher than many commercial gas-separation membranes; and
• high chemical/wear resistance.
Contact angle measurement to distilled water com-
pared with experimental results obtained on self-
supported membranes and other commercial mem-
branes are presented in Table 6. Contact angles of
120� and above for the amorphous perfluoropolymer
membranes demonstrate the high hydrophobic char-
acter of these membranes.To test the organophobic character of the mem-
branes, contact angles to hexadecane was measured.
In this case, the contact angle is around 65�, which is
a high value compared to other values reported in the
literature (see Table 7). This result confirms the
strong organophobicity of the membranes, which
corresponds to excellent fouling resistance and
inertness.Oxygen permeation data through Hyflon� AD
porous composite membranes in comparison to
other commercial gas-separation membranes are pre-
sented in Table 8.
Table 5 Gas permeability for symmetric membranes of Hyflon� AD 40 and Hyflon� AD 60 at 35 �C and 50 psig
GasCritical volume(cm3 mol�1)
Permeability(10�10 cm3(STP) cm cm�2 s cmHg)Hyflon� AD 40
Permeability(10�10 cm3(STP) cm cm�2 s cmHg)Hyflon� AD 60
He 57.3 211 387H2 65.0 83 182
O2 73.4 25 57
Ar 74.6 15 33N2 88.6 8 20
CO2 92.9 53 128
CH4 99.4 4 10
NF3 119.0 3 6C2H4 129.1 3 6
CF4 140.0 0.56 0.9
C2H6 146.7 2.5 3.3
C3H6 181.0 NA 4.3C3H8 200.8 0.94 1.1
NA, not available.
Table 6 Contact angle to water for different
membranes
Membrane polymer Contact angle to H2O
PMMA 76
PEEK-WC-NO2 80
PES 82PVDF 90
PE 96
PTFE 118
HYFLON� AD 60 120HYFLON� AD 60 on PVDF 122
Table 7 Contact angle to hexadecane for different
membranes
Membrane polymer Contact angle to C16H34
PS 1
PTFE 39
CMS-7 on PP 57HYFLON� AD 60 60
CMS-7 on PS 63
HYFLON� AD 60 on PVDF 65
Table 8 Oxygen permeation data through
Hyflon� AD composite membranes in
comparison to commercial gas separation
membranes
Membrane polymerPermeance to O2
(GPU)
Generon polycarbonate 7Permea polysulfone 15
Dow 4-methylpentene-1 90
Ethyl cellulose 100
Gore-TEX 350 (5 bar, 16 �C)Silicone rubber 500
HYFLON� AD 60 on PVDF 700 (5 bar, 27 �C)
Amorphous Perfluoropolymer Membranes 151

1.08.3 Hydrophylic PerfluoropolymerMembranes
Perfluorinated polymers with sulfonic pendant
groups are the basic materials used for the prepara-tion of hydrophilic membranes. These polymers aregenerally obtained in a three-step process:
1. free radical copolymerization of TFE and a sulfo-nyl fluoride vinyl ether (SFVE), whose generalformula can be indicated as CF2¼CF-ORf-SO2F
(where Rf is a perfluoroalkyl a perfluoro oxy alkylunit);
2. reaction with an alkaline aqueous solutions atmedium temperature (70–80 �C) to convert the–SO2F group into –SO3X, where X is a metal
cation; and3. treatment with a strong acid solution to convert the
–SO3X into –SO3H – the commonly used strongacids are H2SO4, HCl, and HNO3.
In the second step, the transformation of the polymerinto an ionomer, that is, an ion-containing polymer,leads to a dramatic change of the physicochemical
properties of these materials due to the formation ofionic regions (generally referred to as clusters) [15].As a consequence, ionomers consist of an amorphousphase, an ionic phase and, if the TFE content is
relatively high, a crystalline phase.Among the sulfonic perfluorinated polymers,
Nafion� (Du Pont), a copolymer of TFE and anSFVE of formula CF2¼CF–OCF2CF(CF3)OCF2
CF2SO2F, is the most extensively studied and
used. It was developed in the late 1960s as a poly-mer electrolyte for fuel cells designed for NationalAeronautics and Space Administration (NASA)
spacecraft missions. Since then, Nafion� and poly-mers of the same family (Aciplex� from AsahiChemical and Flemion� from Asahi Glass) have
found wide application in the chloro-alkali indus-try, due to their very high chemical inertness.They are also called long-side-chain (LSC) poly-mers[15–17] because they contain long pendant
group carrying the ionic functionality.Starting from the 1980s, increasing efforts were
dedicated to the development of a short-side-chain
(SSC) ionomer [18], obtained by copolymerization ofTFE and CF2¼CF–OCF2CF2SO2F, with the aim ofimproving the power output and the working tem-perature in the fuel cells. In particular, Solvay Solexis
has applied its proprietary fluorovinylether processfor the production of the SSC monomer at the indus-trial scale with a relatively simple process (Figure 2).
The polymerization of TFE and the SSC mono-mer is carried out by free radical polymerizationtaking advantage of the Solvay Solexis proprietarymicroemulsion polymerization process [19]. This
technology, broadly applied to the polymerizationof other Solvay Solexis fluoropolymers, is able togive very high polymerization kinetics and high-molecular-weight polymers with accurate control of
the molecular structure. The polymer obtained isnamed as Hyflon� ion and its structure is shown inFigure 3 both in the –SO2F and in the –SO3H form.
When the molar ratio TFE/SFVE in the polymeris approximately lower than 4, that is, when theSFVE molar content is higher than about 20%, thepolymer is completely amorphous. On the contrary,
at higher value of TFE/SFVE, a semicrystallinestructure, due to the aggregation of the PTFEsequences, is observed.
CF2=CF2 + SO3
CF2=CFOCF2 CF2SO2F(a) + CFCI=CFCI
(a)
CF2 FOCF2 CF2SO2FCF2
SO2O
F2
cat.
Addition Dechlorination
Figure 2 Solvay Solexis route for the synthesis of the SSC sulfonylfluoridevinylether monomer.
Hyflon® ion Hyflon® ion H
( () )CF2 CF2CF2 CFm n
OCF2CF2SO2F
( () )CF2 CF2CF2 CFm n
OCF2CF2SO3H
(b)(a)
Figure 3 Structure of (a) Hyflon� ion and (b) Hyflon� ion H.
152 Basic Aspects of Polymeric and Inorganic Membrane Preparation

The glass transition temperature of Hyflon� ion isa function of polymer composition and decreases
from about 50 to 5 �C for SFVE contents increasing
from 10% to 30% (molar) when the polymer is in its
precursor (i.e., SO2F) form. Therefore, amorphous
Hyflon� ion polymer precursors are rubbers at
room temperature and can be dissolved in a variety
of perfluorinated (such as Galden�) [12] or partially
fluorinated solvents (such as H-Galden�) [20]. At
high TFE content, when the crystalline phase
appears, these copolymers become scarcely soluble
in any solvent. In this case, films can be prepared by
taking advantage of the melt processability of the
polymer.The thermal stability of Hyflon� ion polymers is
very high due to its perfluorinated nature.
Thermogravimetric analysis (TGA) shows 1%
weight losses at temperatures as high as 420 �C(Figure 4).
Amorphous Hyflon� ion membranes are suitablefor the use in separation processes [21], for example,
in microfiltration, ultrafiltration, and iperfiltration of
aqueous solutions, especially where aggressive reac-
tants require a chemically inert membrane. High
wettability required in these applications is guaran-
teed by the ionic nature of the polymer. These
amorphous membranes can also find applications as
proton exchangers in fuel cells or in membrane reac-
tors [22]. Indeed, it is known that one of the most
important problems for the good functioning of fuel
cells is the membrane drying at the anode side and
the excessive hydration from the cathode side. A
better permeability of the membrane to water allows
to limit these drawbacks and to obtain a lower resis-
tance to proton transport and, as a result, a higher
conductivity of the membrane in the cells. In all of
these applications, semicrystalline ionomer mem-branes do not perform as well due to the lowerwater permeability.
More specifically, in applications such as perva-poration processes used to dehydrate wet gases,Hyflon� ion ionomers can be coated on microporoussubstrates to obtain ultrahigh wettability membraneswhich exhibit high water flux properties and low gaspermeability, particularly when they are in the wetstate. The microporous inert support is generally afluorinated polymer, for example, bistretched PTFE.The technology described in the literature [21] canallow the incorporation of different amounts of iono-mer to obtain membranes of different porosities.Figure 5 shows the surface structure of a Hyflon�
ion membrane obtained by this method starting froma bistretched PTFE substrate shown in Figure 6.
80
60
40
20
100
050 150 250 350 450 550 650
Temperature (°C)
Wei
ght (
%)
Figure 4 Dynamic TGA (in air at 10 �C min�1) of a Hyflon�
ion of EW¼ 900 g mol�1.
Figure 5 Hyflon� ion membrane deposited on a PTFEsubstrate.
Figure 6 PTFE substrate used for the preparation of the
membrane with Hyflon� ion.
Amorphous Perfluoropolymer Membranes 153

Depending on the type of filtration, it is possibleto control the membrane porosity by regulating the
amount of ionomer deposited on the support. For
example, membranes with a high permeability suita-
ble for microfiltration are obtained with an amount of
deposited ionomer from 0.5% to 10% by weight
(referred to the system support and membrane). On
the contrary, when the amount of ionomer is higher
than 30% by weight, the pores are almost completely
occluded and these membranes can be suitable for
iperfiltration processes. Therefore, an entire range of
hydrophilic membranes, particularly useful in water
treatments, can be obtained.In Figure 7, the permeability of water through the
amorphous membrane (Hyflon� ion with TFE/
SFVE¼ 3) is reported as a function of the ionomer
content on the membrane.The membrane porosity for liquid flow and the
occlusion of gases can also be modified by cross-
linking of the ionomer [21, 22]. This can be achieved
either by an ionic or by a radical route, by introdu-
cing specific curing comonomers during the Hyflon�
ion polymerization. Cross-linking is normally per-
formed after the Hyflon� ion SO2F precursor is
deposited on the inert support and before the hydro-
lysis steps. The level of cross-linking allows to
control the amount of ionomer on the membrane at
the end of the fabrication process, and thus both the
permeability and the stability of the ionomer coating
on the membrane. If the ionomer is not cross-linked,
high-temperature conditions or exposure to swelling
chemicals (e.g., polar organic solvents) can lead to
leaching out of the amorphous ionomer in time from
the membrane in use. This can result in a loss of
wettability of the membrane, eventually leading to
local or diffuse dewetting, and possible pollution of
the filtrate.
References
[1] Raupach, M. R., Marland, G., Ciais, P., Le Quere, C.,Canadell, J. G.,Klepper, G., Field, C. B. Global andRegional Drivers of Accelerating CO2 Emissions, 2007,http://www.pnas.org/cgi/reprint/0700609104v1(accessed November 2009).
[2] Eisenberg, A., Yaeger, H. L., Eds. Perfluorinated IonomerMembranes; ACS Symposium Series 180; ACS:Washington, DC, 1982.
[3] Trainham, J. A., III, et al., inventors; E. I. Du Pont deNemours and Company, assignee. 1995. ElectrochemicalConversion of Anhydrous Hydrogen Halide to HalogenGas Using a Cation-Transporting Membrane. US Pat.5,411,641, 22 November 1993.
[4] Yeager, H. L., Gronowski, A. A. Membrane Applications. InIonomers: Synthesis, Structure, Properties and Applications;Tant, M. R., Mauritz, K. A., Wilkes, G. L., Eds.; BlackieAcademic and Professional: London, 1997; pp 333–164.
[5] Moya, W., inventor; Millipore Corporation, assignee.2001. Surface Modified Polymeric Substrate andProcess. US Pat. 6,179,132, 13 March 1998.
[6] Naylor, T. deV. Rapra Rev. Rep. 1996, 8(5), 39–45.[7] Olah, G. A., Iyer, P. S., Prakash, G. K. S. Synthesis 1986,
7, 513–531.[8] Navarrini, W., Tortelli, V., Colaianna, P., Abusleme, J.,
inventors; Ausimont S.p.A., assignee. 1997. Eur. Pat.Specificat. 0,633,257 B1, Date of application: 24 June1994.
[9] Resnick, P. R., Buck, W. H. Teflon� AF AmorphousFluoropolymers. In Modern Fluoropolymers. HighPerformance Polymers for Diverse Applications;Scheirs, J., Ed.; Wiley: Chichester, UK, 1997;pp 397–419.
[10] Sugiyama, N. Perfluoropolymers Obtained byCyclopolymerization and Their Applications. In ModernFluoropolymers. In High Performance Polymers forDiverse Applications; Scheirs, J., Ed.; Wiley: Chichester,UK, 1997; pp 541–556.
[11] Colaianna, P., Brinati, G, Arcella, V. inventors; AusimontS.p.A., assignee. 1999. US Pat. 5,883,177, Date ofapplication: 21 April 21 1997.
[12] Sianesi, D., Marchionni, G., De Pasquale, R. J.Perfluoropolyethers (PFPEs) from PerfluoroolefinPhotooxidation: Fomblin� and Galden� Fluids. InOrganofluorine Chemistry, Principles and CommercialApplications; Banks, R. E., Smart, B. E., Tatlow, J. C.,Eds.; Plenum: New York, 1994; pp 431–461.
[13] Gordano, A., et al. Korean Membr. J. 1999, 1(1), 50–58.
1
10
100
1000
10 000
0 20 40 60 80Ionomer on the membrane (wt.%)
Wat
er p
erm
eabi
lity
(lm
–2 h
atm
)
Figure 7 Permeability of water through an amorphous membrane of Hyflon� ion (m/n¼ 3).
154 Basic Aspects of Polymeric and Inorganic Membrane Preparation

[14] Arcella, V., Colaianna, P., Maccone, P., et al. J. Membr.Sci. 1999, 163, 203–209.
[15] Tant, M. R., Darst, K. P., Lee, K. D., Martin, C. W.Structure and Properties of Short-Side-ChainPerfluorosulfonate Ionomers. In Multiphase Polymers:Blends and Ionomers, Utracki, L. A., Weiss, R. A., Eds.;ACS Symposium Series 395; ACS: Washington, DC,1989; pp 370–400.
[16] Fielding, H. C. Fluoropolymer Membranes. InFluoropolymers ’92. Synthesis, Properties andCommercial Applications: Paper 5, UMIST, Manchester,6–8 January.
[17] Heitner-Wirguin, C. J. Membr. Sci. 1996, 120, 1–33.[18] Prater, K. J. Power Sources 1990, 29, 239–250.[19] Apostolo, M. Arcella, V. inventors; Ausimont S.p.A.,
assignee. 2002. Eur. Pat. Applicat. 1,172,382 A2, Date ofapplication: 19 June 2001.
[20] Marchionni, G., Bassi, M., Fontana, G., Maccone, P.,Ajroldi, G. J. Fluor. Chem. 1999, 98, 41–54.
[21] Arcella, V., Ghielmi, A. Porous Hydrophilic Membranes.US Pat. 6,902,676 B2, 7 June 2005.
[22] Arcella, V., Ghielmi, A. Porous Hydrophilic Membranes.US Pat. 6,896,777 B2, 24 May 2005.
Amorphous Perfluoropolymer Membranes 155

Biographical Sketches
Vincenzo Arcella received his doctorate degree in chemical engineering from the University of Naples in 1977.
During 1978–81, he did his research on fluid dynamics and polymerization engineering at the Donegani
Research Institute of the Montedison Group. During 1982–86, he was responsible for the Fluoropolymers
Process Development group at the Research Center of Montefluos S.p.A (Montedison Group).During1987–92, he was responsible for the research and development of fluoroelastomers at Ausimont S.p.A.
(Montedison Group). He worked on polymerization and posttreatment processes in 1990 and 1992 as a contract
professor at Padua University.During 1993–99, he was involved in the research and development of fluoroelastomers and melt-processable
fluoropolymers at Ausimont S.p.A. Since January 2000, he has been engaged in doing the research on
polytetrafluoroethylene (PTFE).In 2001, he received a Laurea honoris causa in science conferred by the Saint Petersburg State Institute of
Technology (Russia). He is currently the R&T director at Solvay Solexis S.p.A.
Paolo Toniolo graduated in chemical science from the University of Padua in 2000. From 2001 to 2004, he was
a researcher in the Vibrational Spectroscopy Lab at the Research Center of Solvay Solexis S.p.A. Between 2004
and 2005, he was a researcher in the Nuclear Magnetic Resonance Lab. Since 2005, he has been working in the
Innovative Fluoromaterials group as a project leader who deals with renewable energies and sustainable
development.
156 Basic Aspects of Polymeric and Inorganic Membrane Preparation
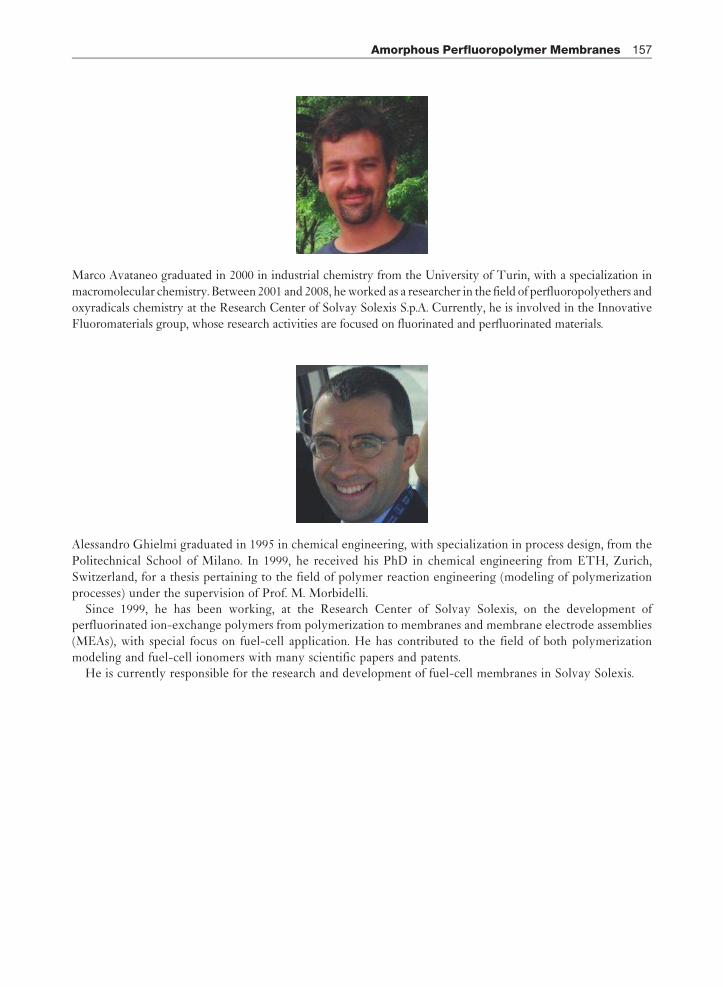
Marco Avataneo graduated in 2000 in industrial chemistry from the University of Turin, with a specialization in
macromolecular chemistry. Between 2001 and 2008, he worked as a researcher in the field of perfluoropolyethers and
oxyradicals chemistry at the Research Center of Solvay Solexis S.p.A. Currently, he is involved in the Innovative
Fluoromaterials group, whose research activities are focused on fluorinated and perfluorinated materials.
Alessandro Ghielmi graduated in 1995 in chemical engineering, with specialization in process design, from the
Politechnical School of Milano. In 1999, he received his PhD in chemical engineering from ETH, Zurich,
Switzerland, for a thesis pertaining to the field of polymer reaction engineering (modeling of polymerization
processes) under the supervision of Prof. M. Morbidelli.Since 1999, he has been working, at the Research Center of Solvay Solexis, on the development of
perfluorinated ion-exchange polymers from polymerization to membranes and membrane electrode assemblies
(MEAs), with special focus on fuel-cell application. He has contributed to the field of both polymerization
modeling and fuel-cell ionomers with many scientific papers and patents.He is currently responsible for the research and development of fuel-cell membranes in Solvay Solexis.
Amorphous Perfluoropolymer Membranes 157

Giuseppe Marchionni graduated in industrial chemistry from the University of Bologna in 1979. From 1982, heworked at the Research Center of Montefluos S.p.A. (successively Solvay Solexis S.p.A) in the field offluorinated products, focusing his activity on the industrial development of the new processes and products.Since 2008, he has been responsible for the Basic Inter-BU Research area, coordinating three research groups:oxyradical chemistry, monomers and intermediates, and innovative fluoromaterials. He is the author of nearly60 scientific papers and holds 60 patents in the field of fluorine chemistry.
158 Basic Aspects of Polymeric and Inorganic Membrane Preparation

1.09 Plasma MembranesS Roualdes, V Rouessac, and J Durand, Universite Montpellier, Montpellier, France
ª 2010 Elsevier B.V. All rights reserved.
1.09.1 Introduction 160
1.09.2 Basic Aspects of Plasma Processes and Related Materials 160
1.09.2.1 Fundamentals of Plasmas and Plasma Chemistry 160
1.09.2.2 Plasma Treatments 162
1.09.2.3 PECVD or Plasma Polymerization 162
1.09.2.3.1 Deposition mechanism 162
1.09.2.3.2 Structural properties of PPs 164
1.09.2.3.3 Transport properties of PPs 166
1.09.3 Plasma Membranes for Gas or Liquid Separation 167
1.09.3.1 Gas Permeation 167
1.09.3.2 Pervaporation 169
1.09.3.3 Liquid Separation 170
1.09.3.3.1 Hydrophilic nature enhancement by plasma process for filtration applications 171
1.09.3.3.2 Hydrophobic-nature enhancement by plasma polymerization for filtration applications 177
1.09.3.3.3 Selectivity enhancement by plasma processes in electrodialysis application 178
1.09.4 Plasma Membranes for Energy-Production Devices 178
1.09.4.1 Rechargeable Batteries 178
1.09.4.1.1 Nickel–cadmium (Ni–Cd) batteries 178
1.09.4.1.2 Redox-flow batteries 179
1.09.4.1.3 Lithium ion (Li-ion) batteries 181
1.09.4.2 Fuel Cells 182
1.09.4.2.1 Acidic fuel cells 183
1.09.4.2.2 Alkaline fuel cells 188
1.09.5 Plasma Membranes for Sensors 189
1.09.5.1 Ion-Sensitive Sensors 189
1.09.5.2 Gas Sensors 190
1.09.5.2.1 Resistive-type sensors 190
1.09.5.2.2 Plasma materials combined with quartz crystal microbalance 190
1.09.6 Recent Studies and Future for Innovating Porous Plasma Membranes 190
1.09.6.1 Tubular Plasma Membranes 190
1.09.6.2 New Coupled Methods 191
1.09.7 Conclusions 192
References 193
Glossary
Cobb test A method for measuring the water
absorption of sized paperboard, by determining the
mass of water absorbed through one surface under
a definite temperature, pressure, and time.
Corona discharge A type of localized discharge
that results from high, nonuniform electric fields at
atmospheric pressure, accompanied by ionization
of surrounding atmosphere.
Debye length The scale over which mobile charge
carriers (e.g., electrons) screen out electric fields in
plasmas and other conductors. In other words, the
Debye length is the distance over which significant
charge separation can occur.
Duty cycle The ratio of run time to the total cycle
time.
Electron cyclotron resonance The phenomenon
involving electrons in a static and uniform magnetic
159

field moving in a circle due to the Lorentz force. The
circular motion may be superimposed with a
uniform axial motion, resulting in a helix, or with a
uniform motion perpendicular to the field, for
example, in the presence of an electrical or
gravitational field, resulting in a cycloid.
Faraday cage A conductive enclosure that blocks
out external static electromagnetic fields.
Free volume The ratio of empty space between
molecular chains to the total volume of the material.
Ionization degree The ratio of density of ionized
species to the total density of species in a gaseous
phase.
Magnetron A diode vacuum tube in which the flow
of electrons from a central cathode to a cylindrical
anode is controlled by crossed magnetic and
electric fields; used mainly in microwave
oscillators.
Mean free path The average distance traveled by
a particle between collisions with other particles.
Sputtering The physical process whereby atoms
in a solid target material are ejected into the gas
phase due to bombardment of the material by
energetic ions (from a plasma). The ejected atoms
then deposit onto a nearby substrate surface to
form a coating.
1.09.1 Introduction
Plasma processes were initially developed for micro-electronics in the 1950s. They represent a clean(producing few or no effluents) and also extremelyflexible technology whose basic equipment, welladapted to automation, makes it possible to achievegoals as varied as possible in terms of their specificproperties of use; their costs of operation are more-over relatively weak. Based on these advantages, theyare used today in many fields of materials chemistry(particularly in the field of membranes) even if theirindustrialization is not very developed, because ofthe high cost of the equipment necessary for theirimplementation and due to a certain conservatism ofthe industrialists reticent to introduce this newtechnology, however promising.
The first part of this chapter presents basic aspectsof plasma processes and transport phenomena inplasma membranes in relation to their structuralproperties. The parts following further deal withstate of the art on plasma membranes in their mainfields of application. Only the applications related toactive membranes providing the transport of specificspecies are presented, that is, gas or liquid separation(particularly in environment matters), energy pro-duction devices, and sensors. Applications usingmembranes as barrier materials (especially packa-ging), for which the use of plasma processes is notso innovative, are not developed here. For each fieldof application, particular attention is paid to thespecificities of plasma membranes in terms of struc-tural and transport properties in comparison with
more conventional membranes. The last part of thischapter is devoted to recent studies and prospects forinnovating porous plasma membranes.
1.09.2 Basic Aspects of PlasmaProcesses and Related Materials
1.09.2.1 Fundamentals of Plasmas andPlasma Chemistry
Defined by Crookes in 1879 as the fourth state ofmatter, plasma is a partially ionized and overall neu-tral medium generated by the application of anelectric field to a gas phase at low pressure (<10Torr) [1–4]. The energy of the applied electric fieldis transferred to free electrons which collide with thegas molecules. Such inelastic impacts make the elec-trons gain enough energy (up to 50 eV) to induce theionization of gas molecules. Such ionized species(acquiring energies typically in the range of 0–2 eV)initiate a large number of complex reactions (ioniza-tion, excitation, neutralization, recombination, de-excitation, etc.) constituting what is called a glowdischarge. A glow discharge implies a large varietyof species: electrons, negative and positive ions,radicals, neutral atoms and molecules, and alsophotons (emitted by radiative de-excitation) whosemixture constitutes the plasma state.
Plasma is essentially characterized by its energyand electronic density. Depending on the values ofboth the microscopic parameters, different kinds ofnatural or artificial plasmas can be distinguished andclassified into two categories: hot plasmas and cold
160 Basic Aspects of Polymeric and Inorganic Membrane Preparation

plasmas. Hot plasmas are generated by an arc dis-charge at a pressure equal to or even higher than theatmospheric one. Highly widespread in nature (in theform of comets, galaxies, flashes, lightning), they arecharacterized by a high frequency of collisionbetween electrons and gas molecules and a high gastemperature reaching many thousands of degrees.Artificial plasmas, generated by continued or alter-nating discharge at low frequency (25–450 kHz),radio frequency (RF) (1–500 MHz), or microwavefrequency (500 MHz to some GHz) at rather lowpressure (10�2–10 Torr), are cold plasmas. Cold plas-mas are characterized by energy and electronicdensity equal to 1–10 eV and 1010 cm�3, respectively.Their ionization degree is lower than 10�3 so that thegas phase is mainly made up of neutral species in anexcited state (radicals). A characteristic of these plas-mas is the absence of thermodynamic balancebetween the electronic temperature (several thou-sands of degrees) and that of the gas (near to theambient). Cold plasmas are generally achieved bymeans of two types of reactors: (1) a tubular-typereactor with an external coil or ring electrodes forexcitation by RF discharge and (2) a bell-jar-typereactor with internal parallel-plate metallic electro-des. In the latter case, a low-frequency or RF voltagefor discharge excitation is generally used. Microwavedischarges have become widely used as well, withvarious methods of application of microwave energy(the most frequent is the multimode cavity also calledmicrowave oven mode). Magnetic fields have alsobeen employed to assist the plasma mode: electroncyclotron resonance discharge and planar orcylindrical magnetrons.
The interaction between cold plasma anda material placed within it (substrate) results inseveral types of effects occurring simultaneouslyor consecutively. Four major effects are generallydistinguished:
1. Etching. This occurs by a combination of reac-tive species of the gas phase with atoms orgroups of atoms of the substrate leading tothe creation of active sites on the surface ofthe substrate (ablation of surface) and to theformation of volatile species which diffuse inthe gas phase.
2. Functionalization. It occurs by the fixing of reactivespecies of the gas phase on active sites of the sur-face of the substrate.
3. Crosslinking (in the case of a polymeric substrate).This occurs due to the opening (under the action
of the reactive species of plasma) of the bondsbetween atoms of the surface of the substrateallowing them to reorganize (by bridging betweenthe macromolecular chains).
4. Formation of a deposit on the surface of the substrate.This occurs by a recombination of the reactivespecies adsorbed on the surface of the substrate.
The prevalence of one of these effects on theothers is directly related to the nature of the gassubjected to the electric discharge. In the case ofplasmas involving noncondensable gases (monoa-tomic or diatomic gases), the three principaleffects are etching, functionalization, and cross-linking. The substrate undergoes only surfacemodifications; the related plasma processes arereferred to as plasma treatments. In the case ofplasmas involving condensable gases (organic,inorganic, or organometallic compounds), thedominating effect is the formation, on the surfaceof the substrate, of a deposit made up of a three-dimensional matrix formed from fragments of thereagent gas combined in a random way. Therelated plasma process is called plasma-enhancedchemical vapor deposition (PECVD) or plasmapolymerization in the particular case of gases oforganic compounds.
The nature of the gas subjected to the electricdischarge is not the only plasma parameter. Manyother parameters have a high influence on the effectsundergone by the substrate:
1. Geometrical nature. The size and shape of the reac-tor chamber, location, nature, and morphology ofthe electrodes, localization of the gas(es) inlet(s),and pumping outlet;
2. Phenomenological nature. The frequency of the elec-tric discharge (which controls the kinetic energyof the charged species), power of the electricdischarge (which controls the degree of fragmen-tation of the species), gas(es) reactivity and flowrate(s) (controlling the residence time of the spe-cies in the plasma), ratio of different gases,working gas pressure (which controls the resi-dence time as well as the average energy of theelectrons, the mean free path of the species, andthe density of the gas), and temperature of thesubstrate (controlling the mobility, the absorption,and the desorption of the reactive species on thesurface of the substrate).
The manufacture of a tailor-made material requiresthe rigorous control of all these parameters.
Plasma Membranes 161

1.09.2.2 Plasma Treatments
Plasma treatments are mainly used for the surfacemodification of polymers or metals. The predomi-nant surface effect is directly related to the nature ofthe gas subjected to the electric discharge.Chemically reactive gases, such as ammonia (NH3),nitrogen (N2), oxygen (O2), carbon dioxide (CO2),water vapor (H2O), tetrafluoromethane (CF4), etc.,especially, support the reactions of functionalization:grafting of amine-type or amide-type functionalgroups in the case of NH3 or N2, grafting of peroxideor hydroxide functions in the case of O2 or H2O,grafting of C¼O, C–OH, and C(¼O)OH functionsin the case of CO2, and grafting of CFx functions inthe case of CF4. Hydrogen (H2) gas primarily sup-ports the phenomenon of crosslinking. Chemicallyinert gases, such as rare gases (argon (Ar) and helium(He)), mainly support the effect of etching.
In the field of membranes, the implementation ofplasma treatments has grown rapidly in the last dec-ade. Plasma treatments have been especially appliedfor improving the wettability, printability, adhesion,or biocompatibility of conventional polymer mem-branes, modulating their transport properties (bychanging the hydrophilic/hydrophobic balance, pro-viding the grafting of specific functional groups, orcrosslinking the surface chains) or reinforcing theirmechanical, thermal, and chemical stability (essen-tially under the effect of crosslinking). However, it isgenerally known that, in the case of some specificpolymer membranes, the effect gained in such mod-ifications may disappear or significantly diminishduring storage. Moreover, plasma treatments cansometimes alter the physico-chemical properties ofmaterial, particularly polymer surfaces. An efficientway to overcome this limitation is the implementa-tion of a process named plasma-induced graftpolymerization or plasma grafting. In this process,plasma is used only to create on the polymer surfacefunctionalities that are able to initiate conventionalpolymerization of monomers containing multiplebonds. The reaction may be carried out in twoways: in the vapor phase of monomer or in solution.Its principle is the following. Plasma treatments caninduce radical formation on polymer surface throughion bombardment and ultraviolet (UV) radiation.The radicals formed on the surface of the treatedpolymers can be very stable in vacuum but reactrapidly on exposure to a reactive gas. So if thevapor phase of an unsaturated monomer is intro-duced into a plasma reactor just after the surface
treatment of a polymer substrate, the radicals formedon the surface of the polymer substrate immediatelycause the polymerization of the monomer. The pro-cess can also be implemented in solution. In this case,the polymer substrate is released from the reactorafter the plasma treatment and then exposed to atmo-sphere. In the presence of oxygen or air, peroxidesand hydroperoxides are created on the polymer sur-face; such functions may initiate the polymerizationof a desired monomer in solution. In both cases(vapor-phase route or solution route), grafting den-sity and the length of grafted brush can be regulatedto some extent by plasma and grafting parameters.One primary advantage of this technique is the abil-ity to modify surface properties of the polymersubstrates permanently without affecting the bulkmechanical and chemical properties.
1.09.2.3 PECVD or Plasma Polymerization
1.09.2.3.1 Deposition mechanism
The PECVD or plasma polymerization process ismainly used in the preparation of inorganic, hybrid,or polymer-like thin layers. In the field of mem-branes, most of the plasma deposits are preparedusing organic precursors; in this case, the depositionprocess is referred to as plasma polymerization inpreference to PECVD. Plasma polymerization haslittle in common with classic polymerization. Manyside reactions occur during film deposition. This canbe understood by the poor selectivity of the breakingup of chemical bonds in plasma. The mechanism ofdeposition is not yet well understood. This difficultyarises from the complexity and variety of activespecies, reaction steps, and the dependence on var-ious plasma parameters. Several kinetic models ofplasma polymerization have been proposed. Themost popular ones are the models of Lam et al. [5],Poll et al., [6], and Yasuda [1]. These models involve acompetitive ablation and polymerization (CAP)mechanism which gives an account of the rathercomplicated and interrelated influences of fragmen-ted elements in the deposition of plasma polymers(PPs). It is important to mention that chain-growthpolymerization cannot occur in vacuum. This is sim-ply because there are too many chain-carryingspecies but not enough monomers with a well-defined chemical structure capable of chain-growthpolymerization. With the occurrence of fragmenta-tion of the monomer structure, the situation becomeseven worse. The way in which a PP is formed inplasma has been explained by the rapid step-growth
162 Basic Aspects of Polymeric and Inorganic Membrane Preparation
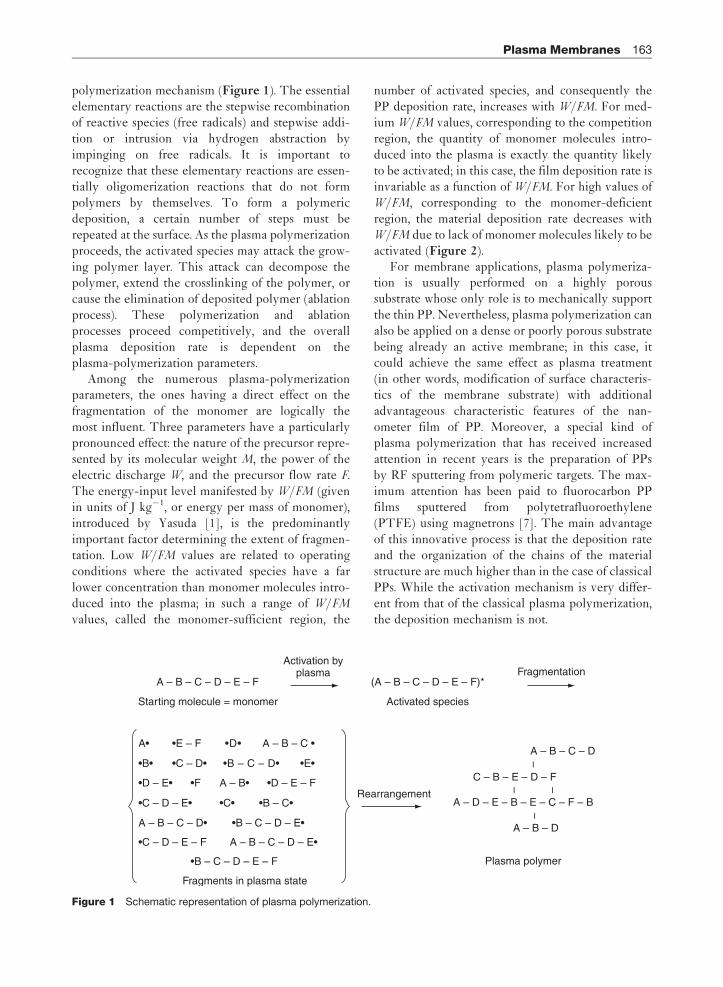
polymerization mechanism (Figure 1). The essentialelementary reactions are the stepwise recombinationof reactive species (free radicals) and stepwise addi-tion or intrusion via hydrogen abstraction byimpinging on free radicals. It is important torecognize that these elementary reactions are essen-tially oligomerization reactions that do not formpolymers by themselves. To form a polymericdeposition, a certain number of steps must berepeated at the surface. As the plasma polymerizationproceeds, the activated species may attack the grow-ing polymer layer. This attack can decompose thepolymer, extend the crosslinking of the polymer, orcause the elimination of deposited polymer (ablationprocess). These polymerization and ablationprocesses proceed competitively, and the overallplasma deposition rate is dependent on theplasma-polymerization parameters.
Among the numerous plasma-polymerizationparameters, the ones having a direct effect on thefragmentation of the monomer are logically themost influent. Three parameters have a particularlypronounced effect: the nature of the precursor repre-sented by its molecular weight M, the power of theelectric discharge W, and the precursor flow rate F.The energy-input level manifested by W/FM (givenin units of J kg�1, or energy per mass of monomer),introduced by Yasuda [1], is the predominantlyimportant factor determining the extent of fragmen-tation. Low W/FM values are related to operatingconditions where the activated species have a farlower concentration than monomer molecules intro-duced into the plasma; in such a range of W/FM
values, called the monomer-sufficient region, the
number of activated species, and consequently thePP deposition rate, increases with W/FM. For med-ium W/FM values, corresponding to the competitionregion, the quantity of monomer molecules intro-duced into the plasma is exactly the quantity likelyto be activated; in this case, the film deposition rate isinvariable as a function of W/FM. For high values ofW/FM, corresponding to the monomer-deficientregion, the material deposition rate decreases withW/FM due to lack of monomer molecules likely to beactivated (Figure 2).
For membrane applications, plasma polymeriza-tion is usually performed on a highly poroussubstrate whose only role is to mechanically supportthe thin PP. Nevertheless, plasma polymerization canalso be applied on a dense or poorly porous substratebeing already an active membrane; in this case, itcould achieve the same effect as plasma treatment(in other words, modification of surface characteris-tics of the membrane substrate) with additionaladvantageous characteristic features of the nan-ometer film of PP. Moreover, a special kind ofplasma polymerization that has received increasedattention in recent years is the preparation of PPsby RF sputtering from polymeric targets. The max-imum attention has been paid to fluorocarbon PPfilms sputtered from polytetrafluoroethylene(PTFE) using magnetrons [7]. The main advantageof this innovative process is that the deposition rateand the organization of the chains of the materialstructure are much higher than in the case of classicalPPs. While the activation mechanism is very differ-ent from that of the classical plasma polymerization,the deposition mechanism is not.
A – B – C – D – E – F
Starting molecule = monomer
A• •E – F •D• A – B – C •
Rearrangement
•B•
•D – E•
•C – D – E•
•C – D – E – F A – B – C – D – E•
A – B – C – D• •B – C – D – E•
•B – C – D – E – F
Fragments in plasma state
Plasma polymer
•B – C••C•
•D – E – FA – B••F
•C – D• •B – C – D• •E•
(A – B – C – D – E – F)*
Activated species
Activation byplasma Fragmentation
A – B – C – D
––
– –
C – B – E – D – F
A – D – E – B – E – C – F – B
A – B – D
Figure 1 Schematic representation of plasma polymerization.
Plasma Membranes 163

1.09.2.3.2 Structural properties of PPsPPs, noted PP–X (X being the monomer), are notformed by the repetition of a monomer unit likeclassical polymers. They are disorganized thin films,with short and branched chains (randomly termi-nated with frequent crosslinks) often not remindersof the monomers they come from. In terms of mate-rial properties, PPs present a great number ofadvantages when compared to films synthesized, onthe one hand, by other techniques of vacuum deposi-tion and, on the other hand, by liquid-route synthesismethods:
1. Like all vacuum-deposition techniques, plasmapolymerization makes it possible to produce verythin films with thicknesses of few nanometers tofew microns (Figure 3), which is impossible withconventional polymerization. The deposition ratecan be high (several mm min�1) [8, 9], making theprocess ideal for industrial applications.
2. One of the major interests in this technique is thepossibility of depositing materials at ambient tem-perature on substrates sensitive to heat such asconventional organic polymers (which is not pos-sible with conventional chemical vapor deposition(CVD) – chemical plating in pyrolytic phasevapor). The polymeric supports constitute glasses,semiconductors, ceramics, and metal surfaces –the large variety of substrates on which plasmadeposits have good adherence.
3. The materials deposited by plasma polymeriza-tion are generally dense, amorphous, strongly
crosslinked, and present a low density of defectsand holes compared with those obtained by othervacuum-deposition techniques such as evapora-tion or sputtering.
4. The three-dimensional and highly crosslinkedstructure of the plasma deposits is at the originof a number of very specific properties of thesematerials, properties that one does not find in theircounterparts worked out by conventional ways:chemical inertia, good thermal stability, anticor-rosive character, and barrier properties withrespect to oxygen and water vapor in particular.
5. Plasma polymerization makes it possible to adjustthe chemical composition and the microstructureof deposited materials, and thus modify the
W/FM parameter
Competition region
Mon
omer
-suf
ficie
nt r
egio
n Monom
er-deficient regionPla
sma-
poly
mer
dep
ositi
on r
ate
Figure 2 Domains of plasma-polymer deposition.
Figure 3 SEM micrography of a plasma polymer
deposited onto a porous carbon substrate.
164 Basic Aspects of Polymeric and Inorganic Membrane Preparation

physical and chemical properties of these materi-
als by a simple variation of the parameters of the
process, and this is a field much broader than the
other deposition techniques. If, from a technolo-
gical point of view, this requires a rigorous control
of the parameters of the process, the complexity
and variety of active species and reaction steps
directly related to the plasma parameters offer a
high degree of flexibility in prepared materials
properties.
The microstructural properties of deposits dependmostly on the parameters of plasma polymerization,
particularly on the W/FM parameter. In the mono-
mer-sufficient region (low W/FM values), monomer
molecules are subjected to less fragmentation for
plasma polymerization and PPs with less rearrange-
ment and a small loss of some groups such as
hydrogen, methyl, hydroxyl, and carbonyl groups
are formed. Under such soft synthesis conditions,
plasma polymerization retains more of the molecular
structure of the monomer; PPs are more organic, less
highly crosslinked, and thus resemble more conven-tional polymers – they are said to be polymer-likematerials. In the monomer-deficient region (highW/FM values), monomer molecules are subjected toheavier fragmentation, and PPs with much morerearrangements and a larger loss of some groups(especially carbon-based ones) are formed. Undersuch drastic synthesis conditions, PPs are harder,more inorganic, and more highly crosslinked; theyare said to be ceramic like. For intermediate valuesof W/FM, a wide range of hybrid materials can bemanufactured. Figure 4 [10] depicts the influence ofthe Yasuda parameter on the plasma materials struc-ture in the case of hexamethyldisiloxane (HMDSO),widely used as monomer in plasma polymerization.For a single monomer, W/F can be used instead ofW/FM as the main process-control parameter. In softplasma conditions, the plasma film synthesized fromHMDSO has a structure close to that of the HMDSOmonomer and also polydimethylsiloxane (PDMS),which is the closest conventional polymer, as shownby Fourier transform infrared (FTIR) spectroscopy;this plasma film is thus called PDMS-like PP; its
Si
O C
Low W/FSoft conditions
PP–HMDSO
High W/FHard conditions
Amorphous silica
MS
Plasma polymer
No dilution Oxidant dilution
Yasuda W/F TAmorphous and inorganic
PECVD hybrid films
m/q
Monomer
MS
FTIR
2000.0
0.2
0.4
0.6
0.8
1.0
40 60 80m/q
100 120 140 160200.0
0.2
0.4
0.6
0.8
1.0
40 60 80 100 120 140 1603500 2500
Wave number (cm–1)
ppM2
a–SiO2:H (C)
PDMS
HMDSO
1500 500
Light species
H
Precursor: Hexamethyldisiloxane (HMDSO)
Figure 4 PECVD extreme conditions to obtain a polymer-like or an amorphous silica film from the same precursor HMDSO.
Plasma Membranes 165

density is quite low, equal to 1.1. In hard plasma
conditions, the obtained plasma film is similar to
amorphous hydrogenated silica with a density of 2.2;
it is denoted as a-SiO2:H (a for amorphous, :H for
hydrogenated); dilution with an oxidative gas such as
O2 or N2O in the plasma reactor enables to achieve
this silica structure at lower W/F values. Mass spec-
trometry (MS) is a very useful technique to reveal the
low fragmentation of the monomer in soft plasma
conditions, and in contrast, it also reveals the forma-
tion of many light species due to strong fragmentation
in highly energetic plasmas. Figure 5 shows the sche-
matic structures relative to a PDMS-like PP (and
a conventional PDMS polymer as reference) and an
amorphous hydrogenated silica.Although considered as dense materials, PPs are
characterized by a free volume comparable to ultra-
microporosity (spaces between chains lower than
0.7 nm). Changing the plasma parameters in the pre-
paration of films enables the tuning of this free
volume as well as the chain flexibility. The
approaches that may achieve enhanced free volume
and chain flexibility can be summarized as follows:
(1) minimization of the W/FM parameter; (2) pulsing
of the RF field to reduce the plasma-on time; (3) use
of a Faraday cage around the substrate; (4) position-ing the sample downstream from the plasma zone(postdischarge configuration); (5) use of monomerscontaining polymerizable double bonds; and (6) useof a cold substrate. It is possible to further increasefree volume and change it into micro- (pore diameterbetween 0.7 and 2 nm) or meso- (pore diameter ofsome nanometers) porosity by adding a porogen inthe plasma reactor as comonomer and then eliminat-ing it from the prepared film by thermal or UVposttreatment [11, 12]. The porogen approach ismainly applied to polymer-like plasma films.Indeed, ceramic-like plasma materials are usuallyrequired for their highly dense structure; neverthe-less, they sometimes contain some microporositynaturally due to chain breakage caused by veryhigh degrees of crosslinking [13].
1.09.2.3.3 Transport properties of PPs
The high degree of flexibility in free volume andchemical structure of prepared materials makesthem good candidates for use as membrane materials.PPs have been used as membrane materials since the1980s; the first reported study was by Yasuda [14].Their main advantages in such an application field
Si SiSi
Si Si
SiSi
Si
Si
Si
Si
Si
SiSi
SiSi
Si
Si
Si
SiSi
Si
Si
Si
Si
O O
O
OO
O
OO
O
O O
O
O
O
Si
SiSiSi
Si
SiSi
Si
Si
Si
Si
Si
Si
Si
Si
Si
Si
Si
SiSi
SiSi
Si
Si
Si
Si
CH
CHCH
O
O
O
O
O O
O
O
O O O
O
O
O
O O
O
O O
O
O
H
OH
O
O
OO
O
O O
O
O O
O
O
OO
OO
O
CH
CHCH
CH
CH
CH
HO H
CH
CH
CH CHHCH
CH
CH CH H
H
H
CH
CH
CH
CH
CH
H
CH2
CH
CH2CH2
CH2CH
CH2
CH2
CHCH2
CHCH
CH CHCH
CHCH H
CHCH
CH CH
CHCHCH
CH
CH
CH
CHCHCHCH
CHCH
CH
(a) PDMS (b) PP-HMDSO
(c) a-SiO2:H
CH
CH
H
H
H
H HH
H
CH
CH
CH
CH CH
CH
Figure 5 Schematic structures relative to a PDMS-like plasma polymer (b), a conventional PDMS polymer as reference (a)and an amorphous hydrogenated silica (c).
166 Basic Aspects of Polymeric and Inorganic Membrane Preparation

are their high degree of crosslinking giving them high
separation efficiency as well as high chemical and
thermal stabilities, and their small and easily tunable
thickness enabling a modulation of their permeation
ability. As PPs are not self-supportive, they must be
deposited onto a symmetric or an asymmetric sup-
port with a surface pore size and a surface roughness
that is in agreement with the deposited thickness.
This support primarily acts as a mechanical support.
The plasma polymerization technique cannot deposit
thin films on the pore walls inside porous substrates
as can be done by counterdiffusion CVD, but plasma
polymerization is able to modify the mouth of the
pores at the surface of substrates, especially if the
latter are macroporous (pore diameter above
50 nm). In this case, the final membrane properties
depend both on the PP and on the starting support as
the duration of the applied plasma polymerization
process is not enough to make a complete and
homogeneous layer. In the case of a complete homo-
geneous layer, transport properties will be mainly
governed by the intrinsic separation properties of
the PP.The first developed plasma membranes were
intended for gas permeation or retention and also
pervaporation; more recently, plasma membranes
have been prepared for liquid-separation processes
(nanofiltration and ultrafiltration, essentially). For
gas or liquid separation, membranes providing high
fluxes of penetrants are required. Polymer-like
plasma films are more suitable in this case. If the
plasma film does not totally plug the porosity of its
support, the transport properties across the mem-
brane will be controlled by the viscous flow. If the
plasma film constitutes a complete homogeneous
layer at the surface of its support, the transport prop-
erties of the membrane will be mainly governed by
solution-diffusion, microporous surface diffusion, or
molecular sieving mechanisms inherent to the PP.
Being highly crosslinked in essence, polymer-like
plasma materials are generally not as permeable as
conventional membranes. In order to enhance their
permeability, the easiest solution consists in reducing
their thickness, to the detriment of their mechanical
stability. Another solution is to increase their free
volume and/or chain flexibility to make them resem-
ble more conventional polymers. For gas retention
(packaging application essentially), membranes pro-
viding low fluxes of penetrants are required.
Ceramic-like plasma films are more suitable in this
case; their transport properties are rather controlled
by the molecular sieve mechanisms as in the case ofclassical crystallized ceramics.
The development of polymer-like plasma filmshas been more recently applied to fields using ion-conducting membranes such as electromembraneprocesses (electrodialysis in particular), electroche-mical sensors, or, more broadly, energy-productiondevices (fuel cells, Li-ion batteries, etc.). Such appli-cations require the use of materials having a goodswelling in water and containing specific functions,often charged, distributed in an ordered manner inorder to form effective channels of ionic conduction.Obtaining such materials by plasma polymerizationis particularly challenging and requires delicateresearch in the choice of the precursor(s) and theadjustment of plasma parameters.
1.09.3 Plasma Membranes for Gas orLiquid Separation
1.09.3.1 Gas Permeation
Studies on permselective efficiency of gas-permeationmembranes subjected to plasma treatment witha noncondensable gas, that is, without any depositionof new material, have been very few in the past 5–10years. Recently, Kumasawa and coworkers studiedthe gas permselectivity of polyethylene [15] andpolypropylene [16] membranes after a 5-min longN2 or NH3 plasma treatment. They found that nitro-gen was not significantly incorporated into thepolymer network and that CO2 permeability coeffi-cients slightly increased after plasma treatmentwhereas N2 ones were not affected, which givesthese plasma-treated polymer membranes an edgeover classical glassy polymers like polyimides, interms of CO2 separation factor.
Most authors were interested in the preparation ofPPs on porous substrates. Gas permeabilities ofplasma membranes prepared, using HMDSO or octa-methylcyclotetrasiloxane (OMCTSO) are presentedin Figure 6 according to their deposition conditions[13]. Gas-transport properties in such membraneswere mainly controlled by the diffusion mechanism.Indeed, for soft plasma conditions, gas permeabilitiesincreased with W/FM because the number of flexiblesiloxane bonds rose (as could be shown by chemicalcomposition analysis not depicted here); for hardplasma conditions, gas permeabilities decreasedwith W/FM due to densification of the materials:chain crosslinking was the limiting factor in thisregion. Whatever the monomer might be, H2 (the
Plasma Membranes 167

lightest gas) should logically show the highest per-meability. Nevertheless, the sorption phenomenonwas also influential (particularly for PPs synthesized
in soft plasma conditions) as shown by the highpermeability coefficients of CO2 in PP–HMDSO
and CH4 in PP–OMCTSO.Inagaki and coworkers tested several hydrocar-
bon-based and fluorine-based precursors for the
preparation of plasma-polymerized membranesintended for the separation of oxygen from nitrogen.
An ideal selectivity up to �(O2/N2)¼ 5 could bereached [17] and was strongly dependent on the
C–CFn concentration in materials [18] (Figure 7).In these 300–500-nm thick membranes, it wasassumed that the less-fluorinated carbon units played
an important role in the oxygen/nitrogen separation.Polymer-like plasma membranes could be further
treated (by plasma-ion bombardment and pyrolysis)
in order to increase the H2/N2 ideal selectivity up to
45 keeping a high hydrogen permeance:
2� 10�6 mol m�2 s�1 Pa�1 at 150 �C [19].In drastic plasma conditions and starting with a
silazane vapor precursor, thin silicon carbonitride
plasma membranes were deposited onto an asym-
metric mesoporous alumina support whose average
surface pore size was 5 nm [20]. Such membranes
allowed separating light gases from heavier ones
without a strong reduction in permeability due to
their low thickness in the range 50–150 nm. Due to
their high thermal stability, these membranes were
especially adapted to hydrogen separation in the
presence of water at intermediate temperatures.
Figure 8 presents the evolution of the nitrogen
and helium permeability coefficients and the
helium–nitrogen ideal selectivity as a function of
the synthesis conditions. This selectivity was
N2
CH4
CO2
0 20000
1.0 × 10⁻¹⁴
2.0 × 10⁻¹⁴
3.0 × 10⁻¹⁴
4.0 × 10⁻¹⁴
5.0 × 10⁻¹⁴
6.0 × 10⁻¹⁴
(a) (b)
4000
Yasuda parameter
6000 8000 10 000 0 2000 4000
Yasuda parameter
6000 8000 10 000
H2
N2
CH4
CO2
H2
Per
mea
bilit
y co
effic
ient
(m
ol m
–1 S
–1 P
a–1)
0
1.0 × 10⁻¹⁴
2.0 × 10⁻¹⁴
3.0 × 10⁻¹⁴
4.0 × 10⁻¹⁴
5.0 × 10⁻¹⁴
6.0 × 10⁻¹⁴
Per
mea
bilit
y co
effic
ient
(m
ol m
–1 S
–1 P
a–1)
Figure 6 Permeability coefficients relative to different PECVD membranes (from polymer-like to amorphous silica a-SiO2:H)
synthesized from HMDSO (a) or OMCTSO (b).
0
1.0
2.0P O
2/P
N2 3.0
4.0
5.0
20 40C-CFn concentration (mol.%)
60 80 100
Figure 7 Ideal O2/N2 selectivity (calculated as the ratio of
the O2 permeability PO2 to the N2 permeability PN2) forplasma polymers containing C–CFn functions.
0
10
10
20
Idea
l sel
ectiv
ity α
He/
N2
Per
mea
bilit
y(1
0–17
mol
m–1
s–1
Pa–1
)
30
100
1000
1000 2000
N2
He
150 °C
P/X3000 4000
Figure 8 He and N2 permeabilities and He/N2 ideal
selectivity as a function of P/X at 150 �C of a–SiNXCY:H
membrane deposited by PECVD on alumina (pore
diameter: 5 nm).
168 Basic Aspects of Polymeric and Inorganic Membrane Preparation

strongly dependent on the plasma parameters. Thex-axis in Figure 8 corresponds to the dilution ofhexamethyldisilazane (HMDSN) in ammonia toobtain silicon carbonitride layers: X¼ [HMDSN]/([HMDSN]þ[NH3]). At X¼ 1 (pure HMDSN),the material was flexible enough, allowing theheaviest gas to permeate. When increasing theammonia dilution, the material became morerigid and selective. The ideal selectivity He/N2
could be over 30. At low X, the growth of theinorganic-like plasma material became columnarwith defects, which explained the increase in thepermeability coefficients and the decrease in theideal selectivity of He/N2.
1.09.3.2 Pervaporation
Vilani and coworkers [21, 22] studied polyurethanemembranes used to separate methanol from methyl-t-butyl ether by pervaporation after an acrylic acidvapor plasma treatment. They showed that a shorttime modification with a high plasma input power(100 W) allowed the increase of selectivity factorfrom 5 to 30 and also the permeate flux (Figure 9)[21]. They attributed these evolutions to an increaseof C¼C contribution and a loss of C–N content thatmight result in crosslinking at the surface due todecrease in surface free volume and chain flexibility.
Upadhyay and Bhat [23] proved the strongefficiency of a nitrogen plasma treatment(Figure 10) compared to oxygen or air plasma
treatments of nonporous polyvinyl alcohol-basedmembranes. The extremely high selectivity of thenitrogen-treated membranes toward water mole-cules (over 1200 in isopropyl alcohol (IPA)–watermixture with IPA weight fraction below 0.8) couldbe attributed to surface crosslinking whereas airand oxygen plasma-etched amorphous regionsdecreased the swelling of the treated membranesand their selectivity to water.
Yamaguchi and coworkers [24] used the techni-que of plasma-induced graft polymerization tomodify the surface of porous high-density polyethy-lene with acrylate for the removal of dissolvedorganics from water. The argon plasma power was10 W, the pressure in the plasma reactor was0.1 mbar, and the reaction time was 60 s. A series ofacrylates (same concentration and same temperature)was used; the monomer which had the longest chainshowed the lowest reaction rate. Pervaporation ofdilute aqueous solution of 1,1,2-trichoroethane wasvery efficient. More recently, Li and coworkers [25]changed the surface of PTFE by plasma-inducedgrafting polymerization of acrylamide in order toincrease the pervaporation performance for thedehydration of aqueous alcohol solutions(Figure 11). The water contact angle of suchPTFE–g–PAAm membranes was 50� and theirwater permeation rate could go up to 373 g m�2 h�1.An accurate argon plasma exposure time to polymer-ize the grafted AAm had to be applied to prevent anyetching of the PTFE surface.
0
5
10
15
20
25
30
Sel
ectiv
ity fa
ctor
(α)
10 20 30 40 50 60 70 80 90 1000
5
10
15
20
Per
mea
te fl
ux ×
mem
bran
eth
ickn
ess
(kg
μm/m
–2h–1
)
Plasma power (W )
Figure 9 Effect of the acrylic acid plasma power on the permeate flux and selectivity factor in plasma-treated polyurethane
membranes. Treatment time: 1 min.
Plasma Membranes 169

In the experiment we conducted, thin plasma-polymerized films made by using HMDSO orOMCTSO were tested as pervaporation membranesfor the recovery of organics (phenol, chloroform,pyridine, and methylisobutylketone) from aqueousstreams [26]. More drastic conditions in the prepara-tion of films induce an increase in the quantity oforganics and water permeabilities, and therefore adecrease in selectivities, directly related to the den-sification of the membrane structure. In soft plasmaconditions, selectivities are close to those of PDMSbut permeabilities are three orders of magnitudelower. Yet, performances are comparable due to thesmall thickness of plasma-polymerized layers.
1.09.3.3 Liquid Separation
Membranes intended to cause liquid separation areporous membranes. Depending on their pore width,
they are referred to as macroporous membranes (forpore diameter higher than 50 nm), mesoporous mem-
branes (for pore diameter between 2 and 50 nm), ormicroporous membranes (for pore diameter lower
than 2 nm). These are more suited for reverse osmo-sis (using micropores), electrodialysis (also using
micropores), nanofiltration (using mesopores withpore diameter lower than 10 nm), ultrafiltration
(using big mesopores or small macropores), or micro-filtration (using macropores). Conventionally,
various kinds of materials and structures are useddepending on the aimed application.
The main conventional membrane materialsused for filtration of noncharged species (reverseosmosis, nano-, ultra-, and microfiltrations) in
aqueous solutions are polysulfone (PSU), poly-ethersulfone (PES), polyacrylonitrile (PAN),
polypropylene, polyurethane, polyimide, PDMS,polyvinylidene fluoride (PVDF), PTFE, and
0.75
α
0
200
400
600
J (g
m2h–1
)J
(gm
2h–1
)
800
1000
1200
0.85Weight fraction of IPA
0.95
100
200
300
400
500
600
0
0.75
α
0
2
4
6
8
10
(a)
(b)
12
14
0.85 0.95
2000
4000
6000
8000
10 000
αJ
T = 75 °C
T = 75 °C
0
Figure 10 Flux (J) and selectivity (�) measured at 75 �C of polyvinyl alcohol membranes as a function of water–IPA mixture:untreated (a); treated in nitrogen plasma for 5 min (b).
170 Basic Aspects of Polymeric and Inorganic Membrane Preparation

poly(ethylene)terephthalate. With regard to
shapes, flat, in the form of a tube, or hollow
fiber membranes can be envisaged. These mem-
branes generally present good bulk properties
such as thermal stability, mechanical strength,
and solvent resistance. Nevertheless, their filtra-
tion properties are weak and some of them
(especially microporous ones used for proteins
separation) are likely to suffer from fouling due
to their high hydrophobic nature. Plasma modifi-
cation can provide a solution to these problems
via plasma treatments using air, Ar, He, N2, NH3,
CO2, or water vapor, plasma-induced graft poly-
merization, or plasma polymerization. The aim of
plasma modification is to obtain specific function-
alities (acidic, amphoteric, or basic) at the surface
of the membrane making it more hydrophilic. In
the case of the separation of water from hydro-
phobic liquids (oil, diesel, etc.) by ultrafiltration,
of great importance in petroleum, pharmaceutical,
cosmetics, and nutritional oil industries, the sur-
face of commonly used conventional membranes
(porous materials such as filter paper or polyester
textile) is, on the contrary, too hydrophilic.
Plasma polymerization using fluorine-based or
organosilicon monomers is a promising technique
to make these membrane surfaces turn
hydrophobic.The membranes used for the separation of
charged species by electrodialysis are ion-exchange
polymer membranes. Such membranes can suffer
from chemical instability in some aggressive acidic
or alkaline media; moreover, their ion selectivity is
not always very good. The deposition of a highly
crosslinked PP on their surface can enhance their
chemical stability as well as their ion selectivity.
1.09.3.3.1 Hydrophilic nature enhancement
by plasma process for filtration applications
Plenty of work has been devoted to PSU membraneswidely used in microfiltration or ultrafiltration pro-cesses, in particular for low protein adsorption inserums and plasma. There have been several reportson hydrophilization of PSU surfaces after plasmatreatment by noncondensable gases, plasma-inducedgraft polymerization, or plasma polymerization.Some of them are as follows:
• Plasma treatments. PSU as well as PES have beenwidely treated by CO2 plasmas. Wavhal and Fisher[27, 28] used a reactor equipped with an additionalcylindrical glass membrane holder (Figure 12). Themembrane, first cleaned in methanol, was thenoriented perpendicular to the gas flow. This arrange-ment allowed the penetration of the plasma throughthe depth of the membrane. The pressure in thereactor was set to 150–160 mTorr, the RF power(13.56 MHz) was ignited at 5, 10, and 20 W (forPSU membranes) and in the range 20–35 W (forPES membranes). The treatment time varied from10 to 300 s for PSU membranes and from 0.5 to15 min for PES ones. Microstructural characteriza-tions by FTIR and X-ray photoelectron spectroscopy(XPS) displayed the effect of CO2 plasma treatmentsof PES films. After a 24-h exposure to air, the –OHstretching band (3200–3700 cm�1) and the C¼Oabsorption band (1700–1800 cm�1) on FTIR spectrasignificantly changed. Thereafter, only small changeswere observed. XPS elemental compositions of bothsides of the PES membranes were determined beforeand after plasma treatment. For a plasma treatment of30 s, both sides were equally modified: the oxygenconcentration increased by 47%. For longer treat-ment times, the composition of both sides did not
F F F F F F F F H F H O F OH
F H F H O F OH
Ar plasma
H2 plasma
Monomer spray
...M....M...M...
...M....M...M...
O
=O=O
=O=O
O=
O=O= O=
H 2N
−
H 2N
NH 2 NH 2
−NH 2
−NH2 −NH
2
−NH2
−NH2
Figure 11 Schematic description of grafting of hydrophilic monomer onto PTFE membrane by plasma-induced graft
polymerization process.
Plasma Membranes 171

change even when both the plasma power and treat-
ment time increased. High-resolution XPS C1s, O1s,
and S2p spectra are discussed in Reference 28.
Contact-angle measurements were performed on
both sides of PSU and PES membranes. The main
conclusion was that the enhanced wettability of the
treated membranes did not change even after storage
in air for 6 months. The authors discussed the pene-
tration of the reactive plasma species inside the depth
of the membranes. Stacking up two membranes (open
side 1–tight side 1/open side 2–tight side 2) allowed
one to explore the depth of the plasma treatment
through the membrane. As the treatment time
increased, the four surfaces became more hydrophi-
lic. This means that the plasma reactive species
penetrated the depth of the membranes. The pene-
tration depth was estimated to be approximately
150–300 mm which was consistent with the Debye
length estimated to be 100–200 mm under the chosen
plasma conditions. This was in accordance with pre-
vious results from the same authors concerning H2O
plasma treatment applied to PSU and PES
membranes [29, 30].
Gancarz and coworkers worked on the modifica-tion of PSU membranes in a microwave(2.45 GHz)-
pulsed CO2 plasma discharge. The plasma conditions
(gas flow rate, total pressure, power, duty cycle, and
time of treatment) are described in Reference 31.
Surface tension, dispersive, and polar components
were determined. The results showed a rapid
increase in hydrophilicity (polar and dispersive com-
ponents were equal). The surface reactions occurred
during the first minute of treatment and no change in
the measured parameters was observed after 1 min of
plasma treatment. The storage of the samples for 24 h
in air caused a small decrease in the polar component
but the total surface tension still remained relatively
high. Figure 13 shows the dependence of contact-
angle measurements of PSU membranes before and
after CO2 plasma versus pH of water solution.
Although the contact angle of the nonmodified PSU
was independent of pH up to 13, that of the modified
PSU decreased for pH > 7. These results confirmed
the acidic character of the PSU surface after the CO2
plasma modification which was as predicted by
Shahidzadeh-Ahmedi and coworkers [32].
Liquids
Gases
Gases
RF matchingnetwork
Capacitancemanometer
MembraneTo
pump
Membraneholder
9 cm
Figure 12 Plasma reactor equipped with an additional cylindrical glass membrane holder used by Wavhal and Fisher.
080
82
84
86
88
2 4 6pH of water solution
Con
tact
ang
le (
degr
ee)
8 10 12 14 015
20
25
30
(b)(a) 35
2 4 6pH of water solution
Con
tact
ang
le (
degr
ee)
8 10 12 14
Figure 13 The pH of water as a function of (a) contact angle of untreated PSU membranes and (b) CO2 plasma-modified
PSU membranes.
172 Basic Aspects of Polymeric and Inorganic Membrane Preparation

In other papers, Gancarz and coworkers [31, 33]showed that plasma treatment had an influence onthe pore size of the PSU membranes. They estimatedthe pore size with an assumption distribution usingdextran standards. It was clearly seen that the poresize became larger after plasma modification due toablation (Figure 14(a)). Consequently, the filtrationproperties of the PSU membranes changed: the waterflux through them showed a minimum after 2 min ofplasma treatment and then increased (Figure 14(b)).The water-flux decrease for plasma treatmentsshorter than 2 min could be ascribed to the prefer-ential ablation of hydrophilic groups making the poresurface more hydrophobic, thereby inducing waterretention; this effect produced an increase in the poresize. After a 2-min treatment, increase in the pore sizebecame the main effect and the water flux increased.
In the same research group, nitrogen and ammo-nia plasma were also used to modify the surface ofPSU membranes and improve their filtration proper-ties. The effect of N2 plasma was an increase inhydrophilicity during the first 2 min of treatment;the polar component was a little higher than thedispersive contribution [34]. For longer treatments,a slow increase in surface tension was observed. Thestorage of membranes in air for 1 day resulted in adecrease in the total surface tension and the polarcomponent. This could be due to the mobility ofsurface functionalities or sorption of hydrophobicmoieties of laboratory air. The treated membraneswere kept in double-distilled water. The total surfacetension decreased in the first week and was stableafter that; at the same time, the dispersive contribu-tion increased while the polar component decreased.Pore-size distribution of PSU membranes after 2-and 10-min N2 plasma treatment is shown inFigure 15. The average pore size became slightly
larger and the distribution wider, a proof of equili-brium between etching and grafting of nitrogenfunctions. NH3 and NH3/Ar plasma caused anincrease in pore-size diameter and the effect wasnot dependent on treatment time [35].
CO2, N2 and NH3, and NH3/Ar plasma-treatedPSU membranes were tested for protein filtration.Fluxes of buffer (Jb
0), bovine serum albumin (BSA)solution (Jp), buffer after BSA filtration (Jb
f ), andbuffer after cleaning (Jb
c) for two different pHvalues (3 and 9) are shown in Figure 16. Fromthese values, fouling index (FI), flux recoveryafter cleaning (FR), reduction of flux in filtration(RF), and protein retention (SR) are reported inReference 36 (Figure 17). Considering the bestresults as corresponding to lowest FI and RF (lessintensive fouling) and highest FR (best flux recov-ery), the best performances were obtained withCO2 and N2 plasma treatments. The indices forthe membrane modified with NH3/Ar plasmawere not as good as those for NH3. In all cases,there were no significant differences at variousvalues of pH. This means that the modified mem-brane surface had an amphoretic character.
Unfortunately, plasma treatments can alter thephysico-chemical properties of materials, particu-larly polymer surfaces. In the particular case ofPSU membranes, plasma treatments can lead tophotodegradation. Gesner and Kelleher [37] showedthe most susceptible bonds for degradation(Figure 18); Poncin-Epaillard and coworkers [38]compared the degradation effects of plasma treat-ments to those of radical photooxidation. FTIRspectra of the surface were recorded using attenu-ated total reflectance (ATR) technique in order toobtain information about the structural change ofthe membranes after plasma treatment. Intensities
00
0.1
0.2
0.3(1)
(2)
(3)
0.4
0.5
21 54 6In R
PD
D(R
)
97 83 10
(a)
00
20
40
60
80
100
120
140
2 4 6Treatment time (min)
Wat
er fl
ux (
dm3
m−
2 h−
1 )
8 10
(b)
Figure 14 (a) Pore-size distribution of PSU membranes before treatment (1), after CO2 plasma for 2 min (2), and for 10 min(3). PDD(R), pore diameter distribution; ln R, logarithm of the pore radius in nm; and (b) The water flux of CO2 plasma-treated
PSU membranes as a function of plasma treatment time.
Plasma Membranes 173

of few bands characteristic of the membranes
increased showing the reaction between the surface
and the stable radicals created by the plasma.
A large number of new absorption bands appeared
in the spectra just after plasma treatment; subse-
quently, some of them decreased during the first
48-h storage in air. Photodegradation mechanism
of membranes was deduced from FTIR observa-
tions. Scission takes place at every bond except the
aromatic C–C and C–H bonds. Several steps may
be distinguished: creation of free-radical sites due to
surface bombardment by species in the plasma,
chain cleavage with loss of volatile species, further
gas-phase reactions of the primary volatile products
in the plasma, reaction of the free-radical sites on
the polymer, and reaction of the residual free
radicals with oxygen and nitrogen after exposure
to the air.
0.4(a)
0.35
0.3(1)(2)(3)0.25
0.2
0.15
PD
D(R
)
0.1
0.05
0.00 1 2 3 4 5
In R6 7 8 9 10
(b) 0.40
0.35
0.30
0.25
0.20
0.15
PD
D(R
)
0.10
0.05
0.0
PSV
PSV
1 min per sec 7 min per sec
In R0 2 4 6 8 10
(c) 0.40
0.35
0.30
0.25
1 min per sec7 min per sec
0.20
0.15
PD
D(R
)
0.10
0.05
0.0
In R0 2 4 6 8 10
Figure 15 Pore-size distribution of PSU membranes treated with N2 (a), NH3 (b), and NH3/Ar (c). In the case of N2 (a), (1), (2),
and (3) correspond to untreated, 2-min long-treated and 10-min long-treated membranes, respectively. PDD(R) refers to the
pore diameter distribution and ln R the logarithm of the pore radius in nm.
174 Basic Aspects of Polymeric and Inorganic Membrane Preparation

• Plasma-induced graft polymerization. Plasma treat-ment of membranes with gases such as CO2,nitrogen, ammonia, or oxygen increases the hydro-philicity of the asymmetric ultrafiltrationmembranes but the hydrophilicity can decreasewith aging in air; moreover, the etching effect ofthe plasma treatment can be detrimental for
membrane integrity [39]. Plasma-induced graftpolymerization can be a convenient techniquefor durable pore filling and hydrophilicityenhancement without alteration of the mem-branes. Some studies have been devoted to graftpolymerization by immersion of the plasma-acti-vated membranes in the monomer solution to be
100
Jb0
Jbf
Jbc
Jp
90
80
70
60
50
40
30
20
10
0
PSU/3
CO 2/p
H3
CO 2/p
H9
N 2/p
H9
NH 3/p
H9
NH 3-A
r/pH9
N 2/p
H3
NH 3/p
H3
NH 3-A
r/pH3
PSU/9
Figure 16 Fluxes of buffers and BSA solution through untreated and plasma-treated PSU membranes.
PSU/3
CO 2/p
H3
CO 2/p
H9
N 2/p
H9
NH 3/p
H9
NH 3-A
r/pH9
N 2/p
H3
NH 3/p
H3
NH 3-A
r/pH3
PSU/9
120 FI
RF
FR
SR100
180
60
40
20
0
Figure 17 Filtration indexes for pristine and plasma-modified PSU membranes.
Plasma Membranes 175

grafted; acrylic or methacrylic acids were grafted
on PAN and PSU [40], and N-vinyl-2-pyrroli-
done was grafted on PAN [41]. Graftpolymerization was also implemented in vapor
phase: acrylic and methacrylic acids on PAN
and PSU [40, 42], styrene on PAN [43, 44], 2-
hydroxy-ethyl methacrylate [40] or sodium vinyl-
sulfonate on PTFE [45], N-vinyl-2-pyrrolidone
on polypropylene [46], and allylamine or diami-
nocyclohexane on PVDF [47]. In all these
studies, an equivalent plasma activation wasused: the membrane was irradiated with an inert
gas (He, Ar, N2, O2, etc.) in a plasma reactor for
10–300 s and then, either exposed to air for 5–
10 min before grafting in the case of liquid-phase
grafting, or put in contact with the monomer
vapor to be grafted (in the plasma reactor) in
the case of vapor-phase grafting. Generally, an
RF generator (13.56 MHz) was used in a capaci-
tively coupled reactor, and the input powervaried between 20 and 100 W at a total pressure
of 0.1–0.5 mbar. The postexposure to air, or/and
the presence of water vapor in the plasma reactor,
generated the formation of peroxides at the sur-
face of the membranes. After grafting, membranes
were finally rinsed in de-ionized water and dried.
We report here the results of Zhao and coworkers
[42] related to grafting of acrylic acid on PAN
membranes. XPS measurements proved the pre-
sence of acrylic acid grafted on the substrate. The
field effect scanning electron microscopy
(FESEM) photographs showed the smooth sur-face and the pore filling of the membranes. The
pore size decreased with the irradiation time in
the first step and then increased for plasma acti-
vation longer than 60 s (Figure 19). The effect of
graft polymerization was a continuous decrease
in the pore size and the enhancement of hydro-
philicity. As a result of pore filling of PAN, the
water-permeation flux through the membranes
decreased with plasma input power and graft
reaction time. Saccharose solution filtration ver-
sus graft reaction time was studied. The retention
of saccharose reached about 75% after 15 min of
plasma-induced graft polymerization. Similarresults were obtained by the same team with
plasma grafting of styrene [40, 42]. The pore-
size distribution showed a decrease from 14 to
8 nm with an increase of plasma input power and
graft reaction time. Such plasma-grafted poly-
merized PAN membranes were effective in de-
waxing the lube oil stock by mixing a de-waxing
solvent (methyl ethyl ketone or toluene). The
membrane exhibited a rejection of oil up to
73% in de-waxing solvent. Flux and rejection
increased with grafting time.
In the case of plasma amino-functionalization of
PVDF, plasma-induced graft polymerization using
allylamine or diaminocyclohexane as monomer to
0
5 6 7 8R (nm)
9 10 11
1
2
3
dV/d
R (
cm3
g–1 n
m–1
)
dV/d
R (
cm3
g–1 n
m–1
)4
5(a) (b)
c
db
e
a
abcdef
------
0 s30 s60 s90 s120 s150 s
abcdef
------
0 min5 min10 min15 min20 min30 min
f
0
5 6 7 8R (nm)
9 10 11
1
2
3
4
5
6
7
c
d
b
e
a
f
Figure 19 Pore-size distribution of acrylic acid-grafted PAN membranes. Effect of plasma graft-polymerization on (a)
plasma time and (b) graft reaction time. dv/dR, the variation of the membrane specific volume (v) as a function of the pore
radius (R).
C
CH2
H
CH3
O S O
O
O
Figure 18 Formula of PSU and chemical bonds likely tobreak by photodegradation.
176 Basic Aspects of Polymeric and Inorganic Membrane Preparation

be grafted was compared to continuous and pulsed
plasma polymerization using nitrogen–hydrogen
mixture or ammonia as plasma monomer [47].
A higher degree of functionalization with diamino-
cyclohexane was achieved when the grafting method
was applied.
• Plasma polymerization. Acrylic acid deposited byplasma polymerization was compared to that
which was plasma grafted on PSU membranes
[48]. Plasma polymerization was performed with
a microwave (2.45 GHz) plasma discharge. Pulsed
plasma (pulse frequency of 125 Hz and 25% of
duty cycle) and postdischarge techniques were
applied. A low-powered plasma (30 W) resulted
in a plasma-polymerized film very similar to
conventional poly(acrylic acid). The polymeri-
zation yield was similar for both approaches:
34 mg cm�2 for graft-polymerized (GP) and
20 mg cm�2 for plasma-polymerized films. The
pore-size distribution of plasma-polymerized
membrane was a little wider than that of the
GP one; however, the average pore size was
smaller. A dramatic decrease of water flux
through modified PSU membranes was observed
with the degree of grafting in the case of GP-
modified membranes, while plasma-polymer-
ized-modified membranes showed a linear
decrease of water flux (Figure 20).
Protein filtration used the same procedure as pre-
viously described in Section 1.09.2.2. Parameters FI,
FR, RF, and SR were compared for GP and plasma-
polymerized membranes for two pH values. The
results are given in Table 1. Compared to untreated
PSU membrane, modified membranes displayed bet-
ter performances in basic solution than in the acidic
solution of BSA: lower FI (fouling index) and RFF
(reduction of flux in filtration), higher FR (flux
recovery after cleaning) and comparable SR (protein
retention). No significant differences appeared
between GP-modified and plasma-polymerized-
modified membranes.
1.09.3.3.2 Hydrophobic-nature
enhancement by plasma polymerizationfor filtration applications
Selective membranes for the separation of water from
hydrophobic liquids can be obtained by depositing a
hydrophobic plasma-polymerized thin layer on por-
ous materials such as filter paper or polyester textile.
Organosilicon and fluorine-based compounds can be
used as plasma monomers. Bankovic and coworkers
[49] used HMDSN or HMDSN–n-hexane mixture
as monomer. The contact-angle values obtained with
water for the treated surface ranged from 135 to
155 � . Aging did not affect the membrane perfor-
mance. Water adsorption measured by Cobb test
decreased from values ranging from 300 to
9000 g m�2 for nontreated surfaces to values ranging
from 0 to 20 g m�2 for treated ones. These surface
treatments were suitable for obtaining selective
membranes to separate water from organic-polar
(ethanol, 2-propanol, carbon tetrachloride, phenol,
etc.) and nonpolar (n-hexane, cyclohexane, heptane,
dodecane, benzene, etc.) compounds of different
chain lengths.
00
10
20
30
40
50
60
70(a) (b)
50 100
Grafting yield (μg cm–2)
Wat
er fl
ux (
dm3
m–2
h–1
)
150 200 250 300 030
40
50
60
70
20 40
Polymerization yield (μg cm–2)
Wat
er fl
ux (
dm3
m–2
h–1
)
60 80 100 120
Figure 20 Water flux through treated PSU membranes as a function of the: (a) grafting yield in the case of acrylic
acid grafting by plasma-induced graft polymerization and (b) polymerization yield in the case of plasma polymerization
of acrylic acid.
Plasma Membranes 177

1.09.3.3.3 Selectivity enhancement by
plasma processes in electrodialysis
application
The only study that reported selectivity enhancementof membranes in electrodialysis was by Vallois andcoworkers [50]. To improve the ionic selectivity ofcation-exchange Nafion� (perfluorosulfonated poly-mer commercialized by Du Pont de Nemours) andsulfonated polyimide (sPI) membranes for the recov-ery of acid from solutions containing metallic salts, athin film of polyethylene imine (PEI) was depositedon the membrane surface by two techniques. The firstone was a plasma preetching of membranes by a 50%O2–50% Ar plasma discharge followed by a classicalelectrodeposition of PEI in solution. The secondtechnique was plasma polymerization involving anethylene–ammonia mixture. PEI-electrodepositedmembranes led to a reduction in transport number ofcopper (in a solution containing protons and copperions) by 65% and 26% when compared to pristinemembranes, for Nafion� and sPI respectively.PEI-plasma polymerized membranes led to a greaterreduction of 74% and 59%. So the plasma polymer-ization method appeared to be more effective than theconventional electrodeposition of a positively chargedpolyelectrolyte to increase the ionic selectivity of ion-exchange membranes.
1.09.4 Plasma Membranes forEnergy-Production Devices
1.09.4.1 Rechargeable Batteries
Batteries are still irreplaceable and are used in a largevariety of applications wherein their favorable elec-trical properties, excellent reliability, and lowmaintenance are of importance. In batteries, electri-cal energy is generated by conversion of chemicalenergy via redox reactions at the electrodes. In itselementary construction, a battery cell comprises two
plates (anode and cathode), a battery separator, andan electrolyte. When a load is applied to the battery,electrons are generated at the anode (by its oxida-tion), pass through the load, and then return to thebattery cell at the cathode, which is then reduced[51–53]. Separators play a key role in all batteries.They make a physical barrier between the positiveand negative electrodes incorporated into most cellsto prevent flow of any electric current between them.On the other hand, they have to allow for rapidtransport of the ionic charge carriers that are neededto complete the circuit inside the battery duringcharging and discharging of an electrochemical cell.This means that the separator must be a good electricinsulator and at the same time a good ionic conduc-tor. Moreover, the separator is the smallest (byvolume) and the weakest part of the battery and, asa rule, the cycle life of the cell and its performanceare limited by failure of the separator. So, in additionto a minimal electrolytic resistance (good conductiv-ity of ions) and electric insulation, the importantrequirements for a good separator include the follow-ing: good mechanical properties and chemicalresistance to degradation by electrolyte or the activeelectrode materials. A manufacture at low cost wouldbe another advantage. In most batteries, the separa-tors are made of either woven and nonwoven fabricsor microporous polymeric films. As electric noncon-ductors with a high degree of porosity, such materialsusually meet both requirements of electric insulationand good ionic conduction. Nevertheless, thesematerials are often not very mechanically and che-mically resistant in aggressive media like the waybatteries are. Plasma processes (treatment or deposi-tion) can be promising for overcoming this problem.
1.09.4.1.1 Nickel–cadmium (Ni–Cd)
batteries
One of the application fields for Ni–Cd batteries ismilitary and civil aviation service. In addition to thegeneral requirements presented before, Ni–Cdbatteries must be very reliable and in some casesmust exhibit high power factor; it means that allconstituents of the unit cell, including the separator,must be of highest quality. Separators in sealedNi–Cd (and also nickel metal-hydride) batterieshave to be highly permeable to gas molecules forovercharge protection and act as an electrolyte reser-voir. In these batteries, the separators are generally abilayer system made of a polypropylene membranewith porosity of 50%, or more, and a nonwovenfabric mat. Separators in open or valve-regulated
Table 1 Comparison of parameters for graft-
polymerized and plasma-polymerized membranes
pH¼3 pH¼9
PSU GP PP PSU GP PP
FI 59.9 66.1 65.7 53.5 40.7 41.6
FR 53.2 42.2 45.1 68.4 80.0 76.5
RFF 82.5 77.2 82.2 72.9 53.6 64.3
SR 95 76 93.6 98.6 92.6 97.1
178 Basic Aspects of Polymeric and Inorganic Membrane Preparation

high-power Ni–Cd cells should have very low thick-ness (in the current technology, 25.4 mm seems to bethe standard thickness) with minimal electrolyticresistance. In these specific batteries, the separatorsused are made of either cellulose (Cellophane) ormicroporous polyolefine films. Unfortunately, all ofthese separator materials have some drawbacks. Inparticular, porous polypropylene membranes showvery high electrolytic resistance and poor wettabilityby KOH solution. Several ways are described in theliterature to overcome this disadvantage. Themethod most often used for this purpose includesthe application of surfactants or priming of themembranes with certain solvents; unfortunately,such a method does not enable permanently stablesurface hydrophilization and the achievement ofminimum electrolytic resistance of the membrane.Other methods include treatments by flame, coronadischarge, photons, electron beam, ion beam, X-raysand �-rays, and above all plasma, which can providethe polymer with a new, stable, and monofunctionalsurface. The most noteworthy papers dealing withplasma processes concern poly(acrylic acid)-graftedor -deposited 25-mm polypropylene microporousfilms [54, 55]. The first method implemented byCiszewski and coworkers [54] was plasma polymer-ization of acrylic acid in the presence of Ar givingrise to the deposition of a poly(acrylic acid)-likeplasma polymer at the surface of the polypropylenemembrane. The second method was plasma-inducedgraft polymerization with acrylic acid [54, 55]. Anargon plasma (using a pulsed-microwave discharge)was first applied to the polypropylene film in order togenerate activated sites on its surface, and then thefilm was put in contact with acrylic acid, either invapor phase in the plasma chamber once the dis-charge was off or in liquid solution at elevatedtemperature or under UV irradiation. With bothmethods, presence of uniformly grafted poly(acrylicacid) on the polypropylene surface was confirmedby XPS, SEM, and FTIR–ATR methods.Polypropylene films grafted in solution under UVirradiation are those that exhibit the best perfor-mance. The electrolytic area resistance of suchmembranes is very low (around 60 m� cm2 at roomtemperature), stability is very good (100 cycles with-out any change), and the performance of real Ni–Cdcells with the separator (2000 W dm�3 at 0.6 V) iscomparable with cellulose membrane, considered tobe the best commercial separator. Furthermore, thegrafted polypropylene does not have the disadvan-tages of Cellophane. It is then a good candidate for an
inexpensive and safe separator in rechargeable high-power Ni–Cd batteries.
1.09.4.1.2 Redox-flow batteries
Redox-flow batteries generally consist of two solu-tions divided by a separator. Each solution containsredox cations (e.g., Fe2þ/Fe3þ, Cr2þ/Cr3þ), protons,and anions. The overall performance of redox-flowbatteries is strongly dependent on the separatorpermselectivity among ions of the same polarity.Indeed, the transport of the redox ions through theseparator decreases the cell efficiency and cyclicity.Although an anion-exchange membrane might besuitable as a barrier against the redox cations, itselectrical resistance is generally too high comparedto that of conventional cation-exchange membranes.Furthermore, some anionic complex ions containingthe redox species may permeate through anion-exchange membranes. Cation-exchange membranes,on the other hand, generally exhibit lower electricalresistance, but are readily permeated by the redoxcations. Taking into account these considerations, thebest separator would be a cation-exchange mem-brane (classically, Nafion�) having a high protonpermselectivity. Unfortunately, the selectivity ofNafion� among different counterions is generallylow. The deposition of an anion-exchange membraneon the surface of Nafion� can be the solution. Theprinciple of the enhancement of monovalent cationpermselectivity is given in Figure 21. Due to theelectrostatic repulsion from the fixed anions in thecation-exchange membrane, the anion cannotpermeate through the membrane. Similarly, thetransport of monovalent cations and multivalentcations is also suppressed by the electrostatic repul-sion from the fixed cations in the thin anion-exchange overlayer. However, since the repulsionexerted on monovalent cations from the fixed cationsis weaker than that on multivalent cations, monova-lent cations can be preferentially transported. A highfixed cation density in the thin anion-exchange over-layer will give rise to a high permselectivity ofmonovalent cations. This enhancement will beachieved, however, at the expense of membrane con-ductance. Plasma polymerization is a useful methodfor forming an ultrathin uniform layer which tightlyadheres to Nafion�. A thin layer having groups con-taining nitrogen (e.g., pyridine rings or amines) isrequired so that it could behave as an anion-exchangelayer once the groups containing nitrogen have beenpositively charged (or quaternized) in acidic ormethyl halogenide solution.
Plasma Membranes 179

Ogumi and coworkers were the only researchersinterested in using plasma polymerization in the fieldof redox-flow batteries (in the period 1989–95). First,they performed classical plasma polymerization; theyused 4-vinylpyridine as monomer, with argon as dilut-ing gas, in an RF plasma reactor with postdischargeconfiguration [56–59]. Nafion� 117, pretreated withoxygen plasma for the best adhesion of the 100–300-nm thick plasma polymer, was used as supportingcation-exchange membrane. Quaternization of theplasma polymer was performed by immersion of thebilayer membrane in 1-bromopropane–propylenecarbonate solution. Microstructural characterizationsshowed that the plasma-polymer deposition rate wasconsistent with the CAP mechanism (highest value:1000mg h�1 cm�2) for input powers and pressures inthe range 5–10 W and 10–40 Pa, respectively. Thepreservation of the pyridine rings was favored at lowinput power and high pressure. The cation perms-electivity of the bilayer membrane was evaluatedmeasuring the Fe2þ transport number in HCl/FeCl2or LiCl, CH3COOLi, and CH3COOH/FeCl2solution. The lower the Fe2þ transport number, thehigher the cation permselectivity. It could beobserved that the lowest Fe2þ transport numberswere obtained for plasma polymers synthesized athigh input power, low pressure, and high layer
thickness; in the best synthesis conditions (50 W,10 Pa, 300-nm thickness), it was as low as 10�2
(whereas it is equal to 0.6 for pristine Nafion�), butat the cost of high membrane resistance equal to15 � cm2 (whereas it is equal to 0.5 � cm2 for pristineNafion�). High resistance could be ascribed tothe existence of an interfacial layer formed bypenetrating nitrogen-containing species in Nafion�,that quaternized forming a tightly bonded ionpair between the sulfo group of Nafion� and thequaternized amino or the pyridil groups. Some yearslater, the same research team performed plasma-induced grafting polymerization of 4-vinylpyridineor 3-(2-aminoethyl)aminopropyltrimethoxysilaneonto Ar or O2 plasma-activated Nafion� 117[60, 61]. Quaternization of the overlayer in the1-bromopropane–propylene carbonate solution wasthe final step of the bilayer membrane preparation.The cation permselectivity of the bilayer membranewas evaluated measuring the Fe2þ transport numberin a LiCl, CH3COOLi, and CH3COOH/FeCl2 solu-tion. The argon plasma activation was more beneficialto the cation permselectivity than the O2 plasmaactivation, due to the fact that radicals formed by O2
activation compete with amino radicals to fix on thesurface of activated Nafion�. The use of 3-(2-ami-noethyl)aminopropyltrimethoxysilane as grafting
CathodeCation-exchange
membrane
A– C++
Anode
C+
+–
Anion-exchangelayer
Figure 21 Principle of the enhancement of monovalent ion permselectivity through a cation-exchange membrane.
180 Basic Aspects of Polymeric and Inorganic Membrane Preparation

compound was more beneficial to the cation perms-electivity than the use of 4-vinylpyridine because thenumber of amino groups fixed from the first com-pound was higher than from the second. For the bestplasma gas-grafting compound couple, Fe2þ transportnumber and membrane resistance as low as 7.5� 10�3
and 6 � cm2 could be measured respectively. Here,the resistance is not too high as in the case of plasma-polymerized overlayers because nitrogen-containingcationic species was absent in the plasma and theinterfacial layer between Nafion� and the overlayerdid not form.
1.09.4.1.3 Lithium ion (Li-ion) batteries
In recent times, considerable attention has beenfocused on the preparation of solid-state Li-ion bat-teries utilizing solid polymer electrolytes, instead oftraditional corrosive liquid electrolytes. Several Li-ion conducting polymer/salt complexes, especiallypolyethers with alkali metal salts, have been shownto be promising candidates as solid electrolytesowing to their relatively high ionic (Liþ) conductiv-ity (10�6–10�8 S cm�1) at low or even roomtemperature. Since these solid polymer electrolytesgenerally have lower ionic conductivity than liquidelectrolytes (10�4–10�6 S cm�1), ultrathin films arerequired to decrease actual film resistance. However,it is not easy to prepare an ultrathin film of solidpolymer electrolyte because the thinner the film, theeasier the generation of pinholes by conventionaltechniques. Plasma polymerization is an attractivemethod for providing an ultrathin uniform polymerlayer strongly adhering to battery electrodes.
Among polyethers, those containing siloxane unitsare attractive because it is known that the introductionof siloxane units into the polymer leads to a low glasstransition temperature, which favors the enhancementof the ionic conductivity of the solid polymer electro-lyte. Ogumi and coworkers published many papers inthis field during the period 1988–90. Their approachwas based on the hybridization of a plasma polymerformed from an organosilicon compound with alithium-based compound and eventually a third com-pound, polyethylene oxide (PEO) or polypropyleneoxide (PPO), whose polarity increases the ionicconductivity. As a first strategy, they prepared aPDMS-like plasma film using an RF discharge, thensoaked the plasma polymer in a lithium salt solution,and lastly dried it. First, they used OMCTSO as asingle monomer and a mixture of PPO and LiClO4 inbutanol as the impregnation solution, and studied theinfluence of the RF input power and the lithium salt
concentration on the microstructural and transportproperties of the prepared films [62–64]. Whateverthe input power may be, plasma films were thin (1–3mm), very highly crosslinked (density: 1.45), andcharacterized by a uniform distribution of ClO4
� andLiþ species. In accordance with the CAP mechanismdescribed earlier, the polymer deposition rate exhib-ited a maximum (170mg h�1 m�2) for a medium valueof input power (10 W); in such plasma conditions,plasma polymers were closed to conventionalPDMS. For higher values of input power, methylgroup elimination and Si–O–Si crosslinking reactionsmade the films resemble the structure of silica.Consequently, the film’s lithium conductivity was allthe more high as the input power in the preparation ofmaterials became lower. Concerning the influence ofthe LiClO4 concentration, two regions could be dis-tinguished: in the low concentration range (<4 wt.%),an increase in salt concentration increased the numberof ionic carriers inducing an increase in the conduc-tivity; in the high concentration range (>4 wt.%),crystallized domains of LiClO4 appeared on the filmsdecreasing the conductivity with decrease in lithiumsalt concentration. Electrochemical measurementsshowed that the films were made up of a microheter-ogeneous structure (OMCTSO segments–PPOsegments) in which the PPO segments were thosemainly contributing to the ionic dissociation ofLiClO4. In best operating conditions, a rather goodconductivity of 2.6� 10�6 S cm�1 (resistance: 40� cm2) at 60 �C could be achieved. Tests on the cellsrevealed a fairly good rechargeability (cycling at10–40mA cm2) but a large internal resistance, certainlydue to lack of a close contact between the membraneand the electrodes due to the formation of a resistivelayer at the interface. With the aim of having onesingle mobile species (only Liþ) on the films, morefavorable to high ionic conduction than two mobilespecies, Ogumi and coworkers [65] added methylmethanesulfonate or methyl benzenesulfonate in theOMCTSO plasma discharge in order to obtainPDMS-like plasma polymers containing –SO3Rgroups. Such materials were successively soaked inLiI–propylene carbonate and butanol–PEO solutionsto get hybridized PDMS-like (containing –SO3Li)/PEO films. Microstructural characterizations showeda better efficiency of methyl benzenesulfonate ratherthan methyl methanesulfonate for the introduction of–SO3R groups into the polymer matrix. Uniform dis-tribution of –SO3Li and good attachment of thesegroups on the polymer matrix were demonstrated. Inbest operating conditions, a rather good conductivity
Plasma Membranes 181

of 1.3� 10�6 S cm�1 (resistance: 80 � cm2) at 60 �Ccould be achieved. As a second strategy, Ogumi andcoworkers prepared a poly[tris(2-methoxyethoxy)-vinylsilane]-like plasma membrane using an RFdischarge, then sprayed the plasma polymer witha lithium salt solution, deposited a second layer ofplasma polymer on top of the sprayed solution,and lastly dried the multilayer structure so thatthe lithium salt solution could uniformly diffusethrough both the polymer layers. First, they usedtris(2-methoxyethoxy)vinylsilane (TMVS) as theonly monomer and a methanol–LiClO4 mixture asthe sprayed solution whose uniform diffusion in mate-rials was demonstrated [66, 67]. A good conductivityof 4.4� 0�5 S cm�1 (resistance: 2.3 � cm2) at 100 �Cand a good rechargeability when integrated in a Li-ionbattery were obtained. Nevertheless, the problem oflarge-cell internal resistance previously observed forPDMS-like plasma films was also observed forpoly(TMVS)-like membranes. In order to overcomethis problem, Ogumi and coworkers [68] addedmethylacrylate in the TMVS plasma discharge inorder to obtain co-poly(TMVS)-poly(methylacry-late)-like plasma polymers containing –COORgroups, then sprayed LiI–propylene carbonate solu-tion before a second deposition of plasma polymer,and a final drying. Microstructural characterizationsshowed a uniform distribution of –COOLi and a goodattachment of these groups on the polymer matrix.Nevertheless, only a very low conductivity of10�8 S cm�1 at room temperature could be achievedeven for materials synthesized in best operating con-ditions, which may be ascribed to the weak acidity ofcarboxylic acid groups. A bit later, in the middle of the1990s, Kwak and coworkers [69] reported for the firsttime the preparation of a lithium-conductive plasmamembrane using the combination of plasma polymer-ization with plasma sputtering. The implementation ofan RF discharge in a chamber containing C2H4 ashydrocarbon monomer (introduced with a diodegun), Ar and O2 as diluting gases, and Li3PO4 target(placed on a magnetron) as lithium source enabled toobtain thin lithium-conductive composite plasmafilms. Such films were found to be randomlycrosslinked alkanes with sporadic distribution of unsa-turated C–C bonds. In addition, the films were foundto contain various functional groups resulting from thereactions with the process gas species in the plasma: inparticular, C–O–C, –OH, and C¼O groups. The ele-ments originating from Li3PO4 target were found toincorporate into both the polymeric backbone and thedispersed inorganic phase. The film deposition rate
was consistent with the CAP mechanism; the amountof inorganic phase was tunable with the operatingconditions. The ionic conductivity was found toincrease with the amount of inorganic phase in films(highest value: 2.7� 10�9 S cm�1 at 40 �C), while theactivation energy (0.8–0.9 eV) was found to depend onthe crosslinking and coordination site densities in thepolymer backbone. Authors pointed out that highestconductivities would have been obtained with single-phased macromolecules which could be producedusing a pulsed discharge or a single monomer sourcecontaining all the desired elements (hydrocarbongroups and lithium). More recently, Choi and cow-orkers [70] were interested in electrospun PVDFnanofiber webs as base materials for ion-conductivemembranes. The ion conductivity of the polymerelectrolyte formed using these nanofiber webs andLiN(CF3SO2)2 electrolyte solution embedding theporous polymer matrix was up to 2.0� 10�3 S cm�1
at room temperature. Despite being highly conduc-tive, the clogging of pores of these membranes isnecessary so that they could be used as a separator inLi-ion batteries. To serve this purpose, Choi andcoworkers deposited a polyethylene-like plasmalayer (from ethylene monomer subjected to aplasma discharge) onto the PVDF nanofiber websbefore impregnating them with lithium salt.The ethylene plasma-treated mat performed therole of a shutter by melting the polyethylene-typelayer grafted on the PVDF nanofibers. In our group,lithium-ion-conductive membranes made up ofoctamethylcyclotetrasiloxane-based plasma filmsimpregnated with LiPF6 were prepared. Satisfyingconductivities of 10�6 S cm�1 were measured(nonpublished results).
1.09.4.2 Fuel Cells
A better control of natural resources needs the devel-opment of technologies for energy production thatcauses less potential environmental impacts. Fuelcells are often perceived as being one of the possiblesolutions to provide clean energy. Their operatingprinciple is generally described as an electrochemicaland controlled combustion of fuel (hydrogen, metha-nol, etc.) and oxygen with simultaneous productionof electricity, water, and heat. This combustion takesplace within a structure, usually called fuel-cell core,mainly composed of two catalyzed electrodes (theanode where the fuel is oxidized and the cathodewhere the oxygen is reduced) separated by an elec-trolyte. The electrolyte plays two key roles: on the
182 Basic Aspects of Polymeric and Inorganic Membrane Preparation

one hand, it forms a physical barrier between bothelectrodes preventing contact between the fuel andoxygen; on the other hand, it provides the transportof ions produced at one electrode and consumed atthe other. Among the different kinds of fuel cells, theones using a polymer membrane as an electrolyte areat present more widely studied. These fuel cells havenumerous advantages: they are less sensitive to car-bon dioxide than the others; they present a lowworking temperature (in the range 80–100 �C)enabling a quicker starting, a higher operating flex-ibility, and a better thermal management than otherkinds of fuel cells; moreover, they are of multipleuses (stationary, transport, and portable applications),and cover a large power range (0.1 W–10 MW). Forthe specific market of portable electronic devices(mobile phones, microcomputers, cameras, smallrobots, etc.) requiring fuel cells in a microscale, poly-mer electrolyte fuel cells are particularly promising.Two different types of polymer electrolyte fuel cellscan be distinguished depending on the acid or basicnature of the electrolyte. Those using an acidicpolymer electrolyte are called proton exchangemembrane fuel cell (PEMFC) (Figure 22(a)), ormore generally, solid polymer fuel cell (SPFC)which includes direct methanol fuel cell (DMFC)and direct ethanol fuel cell (DEFC); their powerdensity is up to 500 and 100 mW cm�2 for PEMFCand DMFC, respectively. Fuel cells using an alkalinepolymer electrolyte, very recently conceptualized,are called solid alkaline membrane fuel cells(SAMFCs) (Figure 22(b)). Due to their simple hand-ling, high safety, and high energy density, alcohols,
especially methanol, are preferred to hydrogen tosupply fuel cells on a microscale.
1.09.4.2.1 Acidic fuel cells
The electrolyte of PEMFC and DMFC is an acidicion-exchange membrane, typically made up of a per-fluorinated polymer matrix on which proton-exchange groups such as phosphonic acid (–PO3H),carboxylic acid (–COOH), or more often sulfonicacid (–SO3H) are grafted. The main role of thiselectrolyte is to provide the transport of protonsfrom the anode where they are produced by theoxidation of fuel to the cathode where they are con-sumed by the reduction of oxygen into water(Figure 22(a)). Until now, research relative to thedevelopment of electrolyte membranes for PEMFCsor DMFCs has essentially focused on the Nafion�
membrane known as a good proton-exchange mate-rial (proton conductivity: 0.01–0.1 S cm�1) with quitehigh chemical stability. Nevertheless, the Nafion�
membrane has many drawbacks which highly limitthe competitiveness of acidic polymer electrolytefuel cells, notably a high cost (800Em�2), a conduc-tion ability highly dependent on its water contentlimiting its use at temperatures lower than 100 �C,and a high methanol permeability in DMFC((2.5–3)� 10�6 cm2 s�1). The methanol permeability,which causes not only a mixed potential at the cath-ode but also a considerable amount of fuel loss[71, 72], is a very limiting feature. This methanolcrossover phenomenon results from the large perco-lation size of the water-swollen Nafion� membranes.Although their large percolation size is the main
Anode
Membrane
(a) (b)
H2 O2H+
e– e–
e–e–
Cathode
+–
Anode
Membrane
H2
H2OH2O
O2OH–
e– e–
e–e–
Cathode
+–
Figure 22 Schematic principle of PEMFC-type (a) and SAMFC-type (b) fuel cells.
Plasma Membranes 183

reason for the high proton conductivity of Nafion�
membranes, it unfortunately allows the methanolmolecules to penetrate through the membranes atthe same time [73, 74]. As other handicaps, the lowmechanical strength of Nafion�, due to the lack ofintermolecular crosslinkage between the polymerskeletons, and the difficulty in reducing its thicknesslimit its use in micro-fuel cells. So, recent researchefforts concentrate on the development of new kindsof membranes which could be advantageous alterna-tives to Nafion�. Main studies have been performedwith the goal of developing alternative membranes,focusing on the reduction of methanol permeability.Studies were generally divided into two categories.The first was to modify the Nafion� membranes byblending them with other polymer/inorganic materi-als or by surface modification. The second was todevelop new synthetic polymeric membranes thathave ionic clusters with a small percolation size.Among many methods, plasma processes are promis-ing techniques for contributing toward bothapproaches:
• Surface modification of Nafion� by plasma processes.Implementation of plasma processes on Nafion�
aims at reducing the methanol crossover as a prior-ity and also reinforcing the mechanical, thermal,and/or chemical resistance. A simple efficientapproach consists in plugging the pores at the sur-face of Nafion� by palladium deposition usingargon plasma combined with sputtering of a palla-dium target. The methanol permeability of Nafion�
could be divided by a factor 1.5 [75, 76], but at thecost of proton-conductivity decrease (30% reduc-tion) [76] leading to an unchanged or slightlyimproved fuel cell performance at low current den-sity (where the effects of proton conductivity andmethanol crossover on fuel cell performance areboth important), and unfortunately, a worse fuelcell performance at high current density (wherethe effect of methanol crossover is generally quitenegligible). Bae et al. [77] used the plasma-inducedgraft polymerization to deposit a sulfonated poly-styrene layer on the surface of Nafion�. Afteractivation of the surface by argon plasma, theNafion� was soaked in a styrene orstyrene–divinylbenzene (DVB) (as crosslinkingagent) solution for grafting reaction, and thensoaked in a acetic sulfate–1,2-dichloroethane mix-ture for sulfonation reaction. It was shown thatincreasing the DVB concentration in the graftingsolution induced a reduction of the grafting
reaction rate and consequently, a reduction of thethickness, degree of swelling, ionic cluster size, andwater uptake of the grafted layer. The methanolpermeability of the modified Nafion� decreased asthe DVB concentration was increased up to5 mol.% (due to reduction of the degree of swelling,ionic cluster size, and water uptake of the graftedlayer) and then reached a plateau at about 2� 10�6
cm2 s�1 (83% of that of Nafion�) above 5 mol.%(under the tradeoff effects of the reduction of thegrafted layer thickness and the reduction of thedegree of swelling, ionic cluster size, and wateruptake of the grafted layer). As the acidity of sul-fonic acid groups attached to styrene is lower thanthat of sulfonic acid groups in Nafion�, the protonconductivity of the modified Nafion� was lowerthan that of pristine Nafion�. This proton conduc-tivity showed an opposite trend toward methanolpermeability; it increased as the DVB concentrationwas increased up to 5 mol.% (under the effect ofthe reduction of the grafted layer thickness) andthen reached a plateau at about 0.03 S cm�1 (90%of that of Nafion�) above 5 mol.% (under the tra-deoff effects of all microstructural features).Other authors were interested in the deposition of aplasma polymer onto the surface of Nafion�. Walkerand coworkers [78–81] used a hexane–H2 mixture ortetrafluoroethylene (TFE) as precursor(s) in a pulsedmicrowave discharge; polyethylene-type or PTFE-type plasma films with thicknesses in the range 200–300 nm were deposited on Nafion� 117, respectively.The methanol permeability could be reduced by afactor of 15 and 20, respectively, due to the lowmethanol sorption ability of plasma films. In return,the proton resistance increased by a factor of 7 in thecase of the polyethylene-type plasma film (no pub-lished value in the case of the PTFE layer) [80]. Kimand coworkers [82] deposited a silica-like plasmalayer on Nafion� 115 using tetraethoxysilane plasma.For plasma films with thickness lower than 10 nm,the methanol permeability was reduced by 40%without simultaneous decrease of proton conductiv-ity, inducing a fuel cell performance increase of 20%.Finsterwalder and Hambitzer [7] deposited a 370-nmthick sulfonated PTFE-like plasma film on Nafion�
112 using the plasma sputtering of a PTFE targetunder the effect of an argon plasma combined withthe plasma polymerization of a sulfonated monomer(SO2, CF3SO3H, or ClSO3H). The CF fragmentsstemming from the PTFE sputtering combined withthe sulfur components coming from the sulfonatedmonomer fragmentation to form a coherent thin film.
184 Basic Aspects of Polymeric and Inorganic Membrane Preparation

In the case of SO2, the sulfur components were smal-ler than for other sulfonated monomers; thus, theresulting monomer was made up of shorter chainsand was consequently more highly crosslinked; so thereduction of the methanol permeability was morepronounced: by a factor of 10 when compared tothe pristine Nafion�. In return, the proton resistancewas multiplied by 20, due to the inability of SO2 toform sulfonic acid groups in the plasma layer. In thecase of CF3SO3H or ClSO3H, giving rise to less-rigidplasma polymers containing sulfonic acid groups, notonly was the reduction of the proton resistance less(factor 4) but methanol permeability was reduced aswell (factor 5). Very recently, Prakash and coworkers[83] prepared phosphorus-doped silicate glass (PSG)films as a proton-conductive overlayer on Nafion�.Silicate glasses with adequate proton conductivityare ideal because they are inexpensive, reliable,easily fabricated by PECVD over a wide range ofthicknesses, and can serve as a methanol barrier layerto lower the fuel crossover rate in DMFCs. Themagnitude of the ionic conductivity in phosphor-ous-doped silica glasses depends on free volumeand pore surface area (for ion transport), chemicalstructures in the glass (e.g., –Si–OH and –P–OHconcentration), intermediate range order, and thelocal bonding environment in the glass network. Aglow discharge of a mixture of SiH4, PH3, and N2Ogave rise to 2–3 mm thick films showing proton con-ductivity up to 2.5� 10�4 S cm�1 in the bestsynthesis conditions, that is, at low substrate tem-perature (100 �C) favorable for the incorporation ofphosphorus and silanol into the films, at high inputpower increasing the silanol defect sites, and at mod-erate pressure enhancing the defect density of thefilms. Polarization experiments with pristineNafion� and PSG-coated Nafion� indicated thatthe presence of the PSG film significantly improvedcell performance (the open-circuit voltage wasincreased by approximately 65 mV and the currentdensity at 0.4 V was nearly tripled).
• New synthetic polymeric membranes mixing conventional
and plasma materials. The development of mixed con-ventional-plasma membranes aims at obtaining newsynthetic polymeric membranes being cheaper thanNafion� and/or having ionic clusters with a smallerpercolation size for a low methanol crossover and alsohigh mechanical, thermal, and/or chemical stability.Won and coworkers [84] focused on cost reduction;they used sulfonated polystyrene-block-poly(ethylene-ran-butylene)-block-polystyrene (sSEBS), muchcheaper than Nafion�, as the proton-conductive
membrane. As sSEBS is less stable and more permeableto methanol than Nafion�, they deposited onto it aplasma-polymerized layer using maleic anhydride asprecursor and then soaked it in two successive solu-tions: first a NaOH–NaHCO3–H2O solution to changesuccinic anhydride groups into carboxylic acid saltgroups and second in a HCl solution to get proton-conductive carboxylic acid groups. Increasing the flowrate of maleic anhydride monomer decreased themethanol permeability down to 1.4� 10�6 cm2 s�1 atthe cost of reduction of proton conductivity (downto 6 � 10�3 S cm�1) in spite of the presence of pro-ton-conductive groups in the plasma layer. With thesame aim, Lue and coworkers [85] used GEFC� as aproton-conductive membrane and deposited onto it aperfectly adherent and mechanically stable polyfluor-oethylene-like plasma layer using perfluoroheptanediluted in Ar as monomer. A parametric study showedthat the input power in the plasma discharge was themost dominant factor; at highest input power, it givesrise to the plasma layer with the highest hydrophobicnature and crosslinking degree together with the low-est water uptake and ionic exchange capacity, themethanol permeability was minimal, being 3.3� 10�8
cm2 s�1 (smaller by a factor of 73 when compared tothat of GEFC�) at the cost of a minimal proton con-ductivity (1.1� 10�4 S cm�1, smaller by a factor of 50compared to that of GEFC�). Other authors imple-mented the concept of pore-filling electrolytemembrane which consisted in filling a porous polymer(chosen for its low cost, its mechanical, thermal, andchemical stability as well as for its rigidity unfavorableto methanol crossover) with an ion-conductive graftedpolymer – grafting being performed via plasmaactivation. Using this technique, the grafted polymercan grow from the pore surface via covalent bondsand fill the entire substrate porosity; its mobility(in particular its ion conductivity) is high as it is alinear polymer. Yamaguchi and coworkers [86] imple-mented this technique using PTFE as porous substrate,argon plasma as grafting activation source, and acrylicacid as grafting monomer. The pore-filling electrolytemembrane showed low methanol permeability (10times lower than that of Nafion� up to 130 �C) andhigh durability up to 180 �C. On the same principle,Bae and Kim [87] used polypropylene as porous sub-strate, argon plasma as grafting activation source, andstyrene as grafting monomer; a post-sulfonation wasrealized soaking the membrane in a acetic sulfate–1,2-dichloroethane mixture. Small grafting and sulfonationtimes induced low methanol permeability (down to8.6� 10�7 cm2 s�1) and also low ion-exchange
Plasma Membranes 185

capacity (1–1.5 meq. g�1) and low proton conductivity(3� 10�3 S cm�1), leading to the lowest fuel cell per-formance (16 mW cm�2 at best) when compared withNafion� (21 mW cm�2), ascribed to de-laminationbetween the membrane and catalyst layers. Finally,another strategy consisted in impregnating a porousstable polymer with Nafion� solution, the porouspolymer being first fluorinated on the surface and inthe pores by plasma treatment in order to increase thesoaking amount of Nafion� and its interfacial stabilitywith the porous polymer. Bae and coworkers [88] usedthis strategy with porous polypropylene as substrateand Freon-116 as plasma gas; methanol permeabilityten times lower than Nafion� (at cost of proton con-ductivity 103 times lower) at room temperature couldbe measured.
• Plasma ion-conductive membranes. All studies pre-viously described, used plasma as the graftingactivation source or as the means of modulating thetransport properties of conventional ion-conductivepolymers. These studies showed that, becausemethanol transport and proton conductivity have akind of tradeoff relationship in conventional poly-mers, it is difficult to selectively reduce one withoutaffecting the other and vice versa. As the mass trans-port and especially the ionic transport mechanism isvery different in plasma polymers, ion-conductivemembranes made up of only plasma materials couldovercome this limitation. Many research teams wereinterested in preparing plasma ion-conductive mem-branes. The main required criteria for a good ion-conductive membrane are: high water content whenimmersed in electrolytic solution, a large quantity ofionizable functional groups favorably distributed inthe polymer matrix, and a small thickness. The man-ufacture of ion-conductive membranes by plasmapolymerization is a real challenge. Indeed, highwater content implies plasma polymers made up ofsufficiently airy and flexible chains. Now plasmapolymers are known to be naturally highly cross-linked. To overcome this lock, it is necessary, first,to choose a precursor with long and flexible chains orat best containing spacers in its structure (e.g., phenylgroups) and then initiate the synthesis process with asoft plasma discharge in order to preserve the con-stitutive elements of the precursor likely toconstitute the skeleton of the final material. Thesecond required criterion (large quantity of ionizablefunctional groups favorably distributed in the poly-mer matrix) is also very challenging. Indeed, plasmapolymers are generally composed of nonionized andrandomly distributed groups. The choice of a
precursor containing the required ionizable func-
tional group in its structure and the implementation
of a soft plasma discharge may enable producing a
material rich enough in ionizable groups.
Nevertheless, control of the arrangement of thesegroups in the polymer matrix remains utopian.
Inagaki and coworkers [89–91] used a mixture offluorocarbon compound (perfluorobenzene (PFB),
pentafluorobenzene (PnFB), or tetrafluorobenzene
(TFB)) and SO2 (as source of sulfonic acid groups)
or CO2 (as source of carboxylic acid groups) asmonomers in an RF plasma discharge. The highest
deposition rate (14 mg cm�2 min�1), ion-exchange
capacity (1.3 meq. g�1), and proton conductivity
(4.3� 10�5 S cm�1) were obtained for the TFB–
SO2 (75 mol.%) mixture. Ogumi and coworkers
implemented an RF- or low-frequency-plasma poly-
merization using methyl benzenesulfonate (MBS),
benzenesulfonyl chloride (BSC), benzenesulfonyl
fluoride (BSF), or trifluoromethanesulfonic acid
(TFMS) as a source of sulfonic acid groups mixed
with 1,3-butadiene, trifluorochloroethylene
(TFCE), hexafluoropropene (HFP), or octafluoro-
cyclobutane (OFCB) as monomer for the matrixedification; argon was used as the diluting gas. In
the case of the MBS–butadiene mixture [92, 93], the
200-nm thick plasma polymers were soaked in a LiI–
butanol solution to hydrolyze the sulfonic ester
groups into lithium sulfonate ones. For low-input-
power values (enabling the preservation of sulfonic
ester groups during the plasma polymerization),
synthesized plasma polymers showed the highest
ion-exchange capacity (1.4 meq. g�1), yet the lowest
proton conductivity (1.8� 10�4 S cm�1) due to high
crosslinking, but low proton resistance (0.04 � cm2)
when compared with Nafion� due to its very smallthickness. In the case of the BSC– or BSF–butadiene
mixture [94, 95], the plasma polymers were soaked
in a NaOH–H2O–methanol solution to hydrolyze
the sulfonic halide groups into sodium sulfonate
ones. For BSF, sulfonyl fluoride groups were intro-
duced into the plasma polymers, whereas BSC
tended to decompose during plasma polymerization.
This difference was discussed based on results
obtained by in situ mass spectrometry and molecular
orbital calculations. For BSF, the parent ion
([C6H5SO2F]þ� was the major species which intro-
duced the sulfonic fluoride groups into the plasma
polymers because S–F bond cleavage was difficult.However, the parent ion of BSC was unstable in the
glow discharge plasma and cleavage of the S–Cl
186 Basic Aspects of Polymeric and Inorganic Membrane Preparation

bond was facile and produced Cl radicals. For low-input-power values, plasma polymers from BSFshowed the highest ion-exchange capacity (1.5meq. g�1) when compared with Nafion�. In thecase of the TFMS–TFCE mixture [96], plasmapolymers containing sulfonic acid groups weredirectly obtained. Increasing the concentration ofTFMS in the plasma reactor induced an increase ofthe sulfonic acid group content and consequently anincrease of proton conductivity up to5� 10�5 S cm�1. Although intrinsically less conduc-tive than Nafion�, plasma polymers exhibited thesame proton resistance (2 � cm2) due to their smallthickness. From the same monomer mixture butusing TFCE as carrier gas for TFMS instead ofargon, Brumlik and coworkers [97] obtained con-ductivities ten times higher (6� 10�4 S cm�1) atroom or at higher temperatures. Plasma polymerscontaining sulfonic acid groups could also beobtained from TFMS–HFP or TFMS–OFCB mix-tures by Ogumi et al. Under the best plasmaconditions (low input power, high pressure), HFP-based plasma polymers showed the lowest ion-exchange capacity (0.7 meq. G�1) and the lowestproton conductivity (1.8� 10�4 S cm�1) when com-pared with Nafion� due to their highly crosslinkedstructure [98, 99]; OFCB-based plasma polymersexhibited the best proton conductivity(10�4 S cm�1) when water vapor (more effective inpreserving the sulfonic acid groups than argon) wasadded into the plasma discharge [100]. The sulfo-nated polytetrafluoroethylene-like plasma filmdeposited on Nafion� 112 by Finsterwalder andHambitzer [7] (described previously) from PTFEand SO2, CF3SO3H, or ClSO3H was also used assingle plasma membrane. The highest ion conduc-tivity (>10�4 S cm�1), water uptake capacity (c. 8.5mmol g�1), and ion-exchange capacity (c. 0.15 mmolg�1) exhibited membranes polymerized withClSO3H. Finsterwalder and Hambitzer proposed anexplanation for the poor conductivity of plasmapolymers containing sulfonic acid groups. Thispoor conductivity is probably attributed to its sec-ondary structure. While in Nafion�, flexiblebackbone and side chains allow the sulfonic acidgroups to agglomerate into a polar cluster, the mobi-lity of sulfonic acid groups, and thus the extent ofphase separation, was drastically reduced in the rigidcrosslinked plasma polymers. The rigid matrix ofthe plasma polymers hampers an effective ionic-communication network via ion channels, and sulfo-nic acid groups remain isolated from each other,
thereby not contributing to the proton transport.Water-uptake measurements indicate that the num-ber of water molecules per sulfonic acid group ishigher in the plasma polymers in Nafion�, so thatthe hydration water is more bulk like and Grotthustransport (the apparent jumping of protons fromwater to adjacent water molecules through the mem-brane) is favored. The effect of higher hydrationcould thus compensate for the little extent of phaseseparation. Nevertheless, this compensation isgenerally not important enough. The only compen-sation very profitable to plasma polymers is theirlow thickness which makes them as competitive asNafion� in terms of ion conduction despite their lowintrinsic conductivity.
Such observations could also be made in ourgroup which has been working for some years onthe preparation of sulfonated polystyrene-typeplasma membranes from styrene/trifluoromethane-sulfonic acid (CF3–SO3H) precursor mixture in anRF capacitively coupled plasma reactor [101–107].Styrene was used as a polymerization agent givingrise to the formation of a carbonaceous matrix con-taining aromatic spacing groups (preventing toohighly crosslinked structures), and trifluoromethane-sulfonic acid as a sulfonation agent to promoteprotonic conductivity. The recent use of a pilot-scale reactor equipped with a pulsed power sourceand sophisticated monomer-injection devices [107]enabled the synthesis of very uniform plasma mem-branes with thicknesses of some tens of microns for adeposition duration of some hours (optimal growthrate: 160 nm min�1) and a structural stability of up to140 �C in air. In such optimized membranes, theproportion of sulfonic acid groups was much higherthan in Nafion� and the protonic conductivityreached 1.7� 10�3 S cm�1. Although these conduc-tivities were 40 times lower than that of Nafion�(7� 10�2 S cm�1 measured in the same cell), theprotonic transport ability of plasma membranes wasnot less competitive thanks to very small thicknesses.Low crossover to methanol (2.3� 10�5 mol m�2 s�1),40 times lower than that of Nafion� (10�3 mol m�2
s�1) was also demonstrated. Such plasma membraneswere then integrated in a cell comprising two elec-trodes made up of commercial E-TEK on which Ptcatalyst was deposited by plasma sputtering [108];the obtained membrane–electrode assembly(Figure 23) showed perfect interfaces between alllayers promising high cell performance (work in pro-gress). In the future, the outcome of this work wouldbe the development of such devices entirely
Plasma Membranes 187

composed of plasma materials (diffusion layers pre-pared by PECVD from a hydrocarbon-basedmonomer) in a single integrated plasma process.
Although less acidic than sulfonic acid groups,phosphonic acid ones (–PO3H) present the advan-tage of higher chemical and thermal stability. Mexand coworkers [109, 110] worked on the preparationof highly thermally stable (up to 200 �C in air) pro-ton-conductive plasma membranes containingphosphonic acid groups using a mixture of TFEand phosphonicvinyl acid (PhVA) as monomers.Both monomers exhibit �-bonds, which permittedplasma polymerization to be achieved without frag-mentation of the phosphonic acid groups, andensured a chemical binding of these groups intothe polymeric backbone of the membrane. Whenprepared at low input power, plasma membranesshowed very high proton conductivity (up to 0.56S cm�1 at 30 �C) and very promising fuel cellperformance. Replacing PhVA by water vapor(intended to incorporate –OH� as proton exchangergroups) decreased the proton conductivity (0.14S cm�1 at 30 �C in the best synthesis conditions)but increased the cell performance, thanks to lowerfuel permeability directly related to higher degree ofcrosslinking [111].
Lastly, a recent original study by Gruber andMuller [112] has to be mentioned; their work con-sisted in enhancing PEMFC performance byintroducing additional thin layers to sputter-depos-ited Pt catalyst in order to improve accessibility ofhydrogen to catalyst sites which are not directlyadjacent to the micropores of the gas diffusion layer.The introduction of a H2-permeable PDMS-like
plasma membrane (prepared from HMDSO) under-neath the anode catalyst layer improved the PEMFCperformance by about 18%.
1.09.4.2.2 Alkaline fuel cells
The development of solid alkaline fuel cells(SAMFCs), as a new class of promising fuel cells interms of performance and low cost, has very recentlybeen investigated. The operating principle ofSAMFCs is a hybrid concept between that of bothDMFCs and classical alkaline fuel cells (AFCs) usedin spatial applications (since Gemini programs in1965) (Figure 22(b)). The electrolyte of SAMFCs isan alkaline ion-exchange membrane, typically madeup of a hydrocarbon-based polymer matrix on whichhydroxyl-exchange groups as quaternary amines (–N(CH3)3
þ) are grafted. The main role of this electro-lyte is to provide the transport of hydroxyl ions fromthe cathode where they are produced by the reductionof oxygen into water to the anode where they areconsumed by the oxidation of fuel. The expectedadvantages of SAMFCs, when compared to classicalAFCs, are the possibility of easy handling and stockingfuel (in this case, methanol) and the easy control ofcarbonation due to the solid nature of the electrolyte(in this case, a membrane instead of an alkaline solu-tion in AFCs). When compared to DMFCs, theexpected advantages of SAMFCs include decrease ofmethanol crossover due to the basic nature of theelectrolyte and the possibility of using a less-expensivenonprecious metal catalyst. For such fuel cells, one ofthe main challenges is the development of hydroxyl-exchange membranes showing high anionic conduc-tivity, low fuel permeability, and high chemicalstability. The chemical stability of anion-exchangemembranes in strong basic media is particularly pro-blematic due to the well-known Hofmann degradationof quaternary amine groups in concentrated alkalinesolutions [113, 114]. Very few studies have beendevoted to the development of membranes forSAMFCs yet; these membranes are generally madeup of a conventional polymer matrix (based on ethy-lene oxide, epichlorhydrin, hydrocarbon, orfluorocarbon chains) on which are grafted aliphaticor aromatic hydrocarbon side chains containing qua-ternary amine groups. To our knowledge, only twogroups have been working on the development of suchmembranes by plasma polymerization: Ogumi’s groupand our team. Ogumi and coworkers [115] studied theplasma polymerization of 4-vinylpyridine post-qua-ternized with 1-bromopropane. In best synthesisconditions, the prepared plasma polymers had
Plasma-polymerized membrane
Catalyzed electrode
Catalyzed electrode
30.0 μm× 1.50 k
Figure 23 SEM micrography of a fuel cell core whose
membrane and catalyst are synthesized using plasmaprocesses.
188 Basic Aspects of Polymeric and Inorganic Membrane Preparation

a thickness of 10mm, a hydroxyl conductivity of5.4� 10�4 S cm�1 and a related resistance of1.9 � cm2. When compared to commercial membranes(e.g., ADP Morgan� from Solvay, AHA fromTokuyama Co.), these plasma membranes were intrin-sically ten times less conductive (due to their highlycrosslinked structure) but as competitive due to theirlow thickness. Used as an interfacial layer between acommercial AHA membrane and an E-TEK anode,such a plasma-polymerized film led to an improve-ment of the anodic triple point; an increase of theanodic current by a factor 4.5 was measured. In ourgroup, hydroxyl-conducting polyethylene-typeplasma polymers containing amine groups were pre-pared by plasma polymerization of triallylamine(N-(CH2–CH¼CH2)3) in a pulsed RF discharge[104–106, 116]. The choice of triallylamine as precur-sor was related to the assumption that theimplementation of a very soft plasma discharge shouldenable to the polymerization of triallylamine via itsdouble bonds and therefore preserve the tertiaryamine entities –NR3 in the final materials. In orderto get highly conductive materials, plasma polymerscoming out of the plasma reactor were put in contactwith a methylhalide compound (ICH3, 30% in acet-onitrile) with the aim of changing –NR3 groups intoquaternary amine functions –NR4
þwell known to havevery efficient anion-conductive functions. In fact, onlyamine functions at the upper surface of plasma filmswere really quaternized. Synthesized materials beforeor after methylation were uniform, very adherent onany substrate, and with thicknesses ranging between10 nm and 10mm. In best synthesis conditions(low input power and high pulse frequency), plasma-polymerized membranes before methylation showed ahydroxyl conductivity of 4� 10�5 S cm�1 anda related resistance of 0.7 � cm2 (close to that ofconventional membranes). Conduction ability ofplasma-polymerized membranes after methylationwas not significantly higher as expected by the lowimpact of the quaternization reaction. The integrationof these plasma membranes into fuel cells is now inprogress.
1.09.5 Plasma Membranes forSensors
Plasma polymerization is an attractive technique forproviding novel, thin, highly crosslinked, stronglyadherent, and active membrane materials for sensors.Two big families of sensors can be distinguished:
ion-sensitive sensors such as electrochemical biosen-sors or ion-selective electrodes and gas sensors.
1.09.5.1 Ion-Sensitive Sensors
All studies presented in the part devoted to energy-production devices concern plasma membraneswhose ionic conduction, strong adherence, and highstability properties make them also suitable for use inion-sensitive sensors. In addition to these studies,others dealing specifically with membranes for sen-sors can be mentioned.
Some groups worked on the preparation of ion-selective electrodes. Kurosawa and coworkers [117]deposited a fluorinated membrane containing sulfo-nyl groups on a Millipore� filter by plasmapolymerization, using a mixture of perfluorobenzeneand SO2. After impregnation with dioctylphthalate,the prepared plasma membrane showed anessentially Nernstian response for tetraphenylpho-sphonium, typical lipophilic cation, at aconcentration in the range 10�2–10�5 M (samerange as for Nafion�) and had long life time. Zengand coworkers [118] reported the deposition of anultrathin anionic exchange layer on Nafion� byplasma polymerization of ethylene and ammonia.The proton-selectivity coefficient of the plasma-modified Nafion� membrane was measured and theresults showed that a linear Nernst response wasexhibited and the selectivity of proton was enhanced.
Other groups dealt with the manufacture of elec-trochemical biosensors. Such biosensors consist ofionic-conductive membranes (active layers) depos-ited onto electric conductive supports (electrodes).Phosphonic-acid-containing plasma polymers can begood candidates for active layers of biosensors,thanks to their ionic conductance, strong adherence,permselectivity, and biocompatibility. Danilich andcoworkers succeeded in the preparation of plasmacopolymers from perfluoroallylphosphonic acid(PAPA) alone or mixed with argon as carrier gas,pentafluoroallyldiethylphosphonate with or withoutargon as carrier gas, or a mixture of PAPA withchlorotrifluoroethylene. In all cases, lightly fluori-nated, highly crosslinked materials containingphosphonic acid groups could be obtained in opti-mized synthesis conditions; such materials showed astrong adherence to gold electrodes in aqueousmedia and exhibited a good ionic conductivity upto 4.2� 10�3 S cm�1 [119]. Highest deposition rates(up to 40 nm min�1) could be obtained using PAPAdiluted by argon [120].
Plasma Membranes 189

1.09.5.2 Gas Sensors
Studies that present different integrated sensors pro-duced using microelectronic fabrication techniquessuch as PECVD or plasma-etching techniques with-out dealing with the interaction between the activeplasma material and the detected gas are not treatedhere. Two aspects, more related to gas transport oraffinity, are presented in this part: first, some resultson transducers to convert specific gas concentrationsand traces into an electromagnetic signal using aplasma-polymerized active layer, and second, fewresults on plasma-polymerized membranes used toenhance the selectivity of gas sensors.
1.09.5.2.1 Resistive-type sensors
Inagaki [121] developed resistive-type humidity sen-sors from PECVD thin films synthesized usingorganosilicon precursors containing nitrogen (e.g.,trimethylsilyldimethylamine (TMSDMA)) and thenquaternized with methyl bromide. Figure 24 showsthe drastic decrease of electrical resistance of thequaternized PECVD thin film when humidityincreases.
Another resistive-type sensor was studied by Dai[122] for trimethylamine (TMA) gas detection. Thesensor consisted in a double layer of TiO2 and Fe2O3
obtained in an inductive coupled reactor from TiCl4and Fe(CO)5 gas precursors. Figure 25 shows thesensitivity of such a sensor to different gas traces asa function of operating temperature.
1.09.5.2.2 Plasma materials combined
with quartz crystal microbalance
Numerous groups have studied the combination of amass-type sensor, quartz crystal microbalance (QCM),with a PECVD selective layer. The PECVD depos-ited layer is used as a preconcentrator for organiccompounds. Plasma polymers of organosilicon com-pounds have been proved to strongly solubilizeorganic compounds. QCM analyses using such plasmapolymers were carried out to characterize the solubi-lity of simple gases [13] and hydrocarbon vapors [123]and diluted organic liquid-like chloroform in water[124]. Figure 26(a) presents the solubility of the firstsix saturated hydrocarbon vapors in two organosiliconcomposite membranes (synthesized using octamethyl-trisiloxane (OMTSO) or hexamethylcyclotrisiloxane(HMCTSO)), measured by QCM. Figure 26(b) evi-dences the frequency shift due to the dilutedchloroform when a PP–HMDSO film was depositedon the quartz compared to that of pristine quartz.
1.09.6 Recent Studies and Future forInnovating Porous Plasma Membranes
1.09.6.1 Tubular Plasma Membranes
The growth of a plasma-polymerized membrane byPECVD inside a long tubular support was recentlypossible with the setup shown in Figure 27(a) [125].The setup consisted of a full concentric reactor witha noncondensable/reactive plasma top zone. Theoxygen plasma was moved from this zone toward
the inner surface of the support up to the depositionzone where the condensable (organosilicon) precur-sor exited from a capillary. The capillary diameterwas small enough to avoid any deposition inside,even if the capillary was crossing the full plasmatop zone. Figure 27(b) shows the local depositionprofile of a plasma-polymerized film at the bottom
20 30
103
104
105
106
107
40 50
Relative humidity (%)
Ele
ctric
al r
esis
tanc
e (o
hm)
60 70 80 90 100
Figure 24 Electrical resistance as a function of relative
humidity for plasma films prepared from TMSDMA: (*)
unquaternized (0.45mm tick); (^) quaternized (0.45mm
thick); (�) quaternized (0.82mm thick).
190 Basic Aspects of Polymeric and Inorganic Membrane Preparation

end of the capillary. To obtain a regular thin layer
(Figure 27(c)) deposited on the inner side of a com-
mercial macroporous alumina tube, the support was
moved along its axis. Figure 28 presents the hydro-
gen and nitrogen permeance evolutions as a function
of (T/M)0.5 (T being the temperature in kelvin, M
being the gas molecular weight) for a plasma-poly-
merized tetramethylsilane membrane showing that,
at low temperatures a possible effect of the adsorp-
tion on the PECVD micropore surface can not be
totally neglected [126].
1.09.6.2 New Coupled Methods
New methods to produce porous silica or hybrid
silica membranes by PECVD have been recently
studied. They are based on the use of two vapor
precursors: an organosilicon one to form the silica-
based skeleton and the other one, generally a
hydrocarbon compound with a low thermal stabi-
lity (often called porogen), intended to form the
porosity or initiate a high roughness leading to a
porous film. As a first approach, the two precursors
were codeposited by PECVD. A further thermal or
UV treatment was applied to remove most of the
organic part that issued from the porogen plasma
polymerization [11]. Open mesoporosity was then
created [12]. As a second approach, depositions of
the two precursors were sequentially and cyclically
applied, changing the energetic plasma conditions
at each sequence: hard plasma conditions were
chosen for the deposition of an inorganic a-
SiO2:H layer from the organosilicon precursor;
soft plasma conditions were implemented for the
deposition of a polymer-like a-C:H film from the
porogen compound. During sequences under dras-
tic conditions, both deposition of a-SiO2:H and
etching of a-C:H simultaneously took place.
Porosity and pore size could be controlled by the
PECVD deposition times during each cycle [127].
These hybrid and porous materials that have good
thermal and chemical stabilities are promising for
applications in liquid filtration in drastic condi-
tions, where conventional polymers cannot be
used.
10 000
1000
100
100
CH4
C2H6 C3H8
n-C6H14
) isobutane
n-butane (
OMTSO:HMCTSO 3:1OMTSO:HMCTSO 1:3 r = 0.9990
150 200Critical volume (cm3 mol–1)
Sol
ubili
ty (
mol
m3 p
a–1)
× 10
3
250 300 350 400 0.0
–400
–300
–200
–100
ΔF (
Hz)
PP–HMDSO on quartz(b)(a)Pristine quartz
0
0.5 1.0 1.5 2.0 2.5 3.0Time (min)
3.5 4.0 4.5 5.0 5.5 6.0
Figure 26 (a) Solubility of the first hydrocarbons as a function of their critical volume in composite PP–OMTSO/PP–
HMCTSO membranes; (b) frequency variation of a quartz (�F) with a PP–HMDSO film under the effect of chloroform
adsorption.
0 80
5
10
15
20
25
30
110 140
Operating temperature (°C)
170 200
1
32
4
1. TMA
2. C2H5OH
3. NH3
4. Gasoline
5. Coal gas
Sen
sitiv
ity (
Vg/
Va)
6. H2
56
230 260
Figure 25 Gas sensitivity (Vg/Va, Vg being the electric
resistance in the case of air, Va being the electric resistance
in the case of air) of PECVD TiO2–Fe2O3 deposits to differentgases at the same concentration of 300 ppm as a function of
operating temperature.
Plasma Membranes 191

1.09.7 Conclusions
The potentialities of plasma processes in modifyingor depositing thin layers on materials surface areexceptionally broad, hence their increasing interestin the membrane field since the 1980s.
Plasma treatments from noncondensable gas(es)are especially applied for improving the wettability,printability, adhesion, or biocompatibility of conven-tional polymer membranes, modulating theirtransport properties (by changing the hydrophilic/hydrophobic balance, providing the grafting of spe-cific functional groups, or crosslinking the surfacechains) or reinforcing their mechanical, thermal,and chemical stability (essentially under the effectof crosslinking).
PECVD or plasma polymerization using conden-sable precursors makes possible the deposition of thinlayers whose physical and chemical properties can belargely tuned by the simple variation of the para-meters of the process, and this is a field much broaderthan other deposition techniques. If, from a techno-logical point of view, this requires a rigorous controlof the parameters of the process, the complexity andvariety of active species and reaction steps directlyrelated to the plasma parameters offer a high degreeof flexibility in prepared materials properties. Thishigh degree of flexibility makes them good candi-dates as membrane materials. Their main advantagesin such an application field are their high degree ofcrosslinking giving them high separation efficiency aswell as high chemical and thermal stabilities, and
00
500
1000
(b)
(c)
(a)
2
O2
V, 4
0 kH
z
4 6 8 10
Position (mm)
Condensable precursor
Enamel
Moving support tube(alumina)
Membrane
Guidethermocouple
Precursor localfragmentation
by plasma
1 μm
Gro
wth
rat
e (n
mm
in–1
)
12 14 16 18
Figure 27 (a) PECVD setup to deposit thin films or membranes inside a tube. (b) Growth profile of a plasma-polymerized
layer. (c) SEM picture of a plasma-polymerized layer deposited onto an alumina support; the tubular support was regularly
moved to obtain an homogeneous membrane.
192 Basic Aspects of Polymeric and Inorganic Membrane Preparation

their small and easily tunable thickness enabling a
modulation of their permeation ability.The first developed plasma-modified or plasma-
polymerized membranes were intended for gas per-
meation or retention and also pervaporation; more
recently, since the 1990s, plasma membranes have
been prepared for liquid-separation processes (nano-
filtration and ultrafiltration, essentially). The
development of polymer-like plasma films has been
more recently applied to fields using ion-conducting
membranes, such as electromembrane processes
(electrodialysis in particular), electrochemical sen-
sors, or, more broadly, energy-production devices(fuel cells, Li-ion batteries, etc.). For all these appli-
cations, plasma processes have enabled promising
breakthroughs due to their high versatility in terms
of prepared materials. In the current environmental
context, plasma processes which represent a very
clean technology are all the more promising. Owing
to these advantages, industrialists should be con-
vinced to introduce it and secure more markets in
the future decade.
References
[1] Yasuda, H. Plasma Polymerization; Academic Press:Orlando, FL, 1985.
[2] d’Agostino, R. Plasma Deposition, Treatment and Etchingof Polymers; Academic Press: New York, 1990.
[3] Biederman, H., Osada, Y. Plasma PolymerizationProcesses; Elsevier: Amsterdam, 1992.
[4] Inagaki, N. Plasma Surface Modification and PlasmaPolymerization; Technomic Publishing: Lancaster, 1996.
[5] Lam, D. K., Baddour, R. F., Stancell, A. F. Fundamentalsof Plasma Polymerization. In Plasma Chemistry ofPolymers; Shen, M., Ed.; Marcel Dekker: New York, 1976.
[6] Poll, H. U., Arty, M., Wickleder, K. H. Eur. Polym. J. 1976,12, 505–512.
[7] Finsterwalder, F., Hambitzer, G. J. Membr. Sci. 2001, 185,105–124.
[8] Kim, Y., Cho, S., Lee, H., Yoon, H., Yoon, D. Surf. Coat.Technol. 2003, 174–175, 166–169.
[9] Storgaard-Larsen, T., Leistiko, O. J. Electrochem. Soc.1997, 144, 1505–1513.
[10] Ayral, A., Julbe, A., Rouessac, V., Roualdes, S.,Durand, J. Microporous Silica Membrane – BasicPrinciples and Recent Advances. In Membrane Scienceand Technology; Malada, R., Menendez, M., Eds.;Elsevier: Amsterdam, 2008; Vol. 13, Chapter 2, pp 33–79.
[11] Favennec, L., Jousseaume, V., Rouessac, V., Fusalba, F.,Durand, J., Passemard, G. Mater. Sci. Semicond.Process. 2004, 7, 277–282.
[12] Rouessac, V., Puyrenier, W., Broussous, L.,Rebiscoul, D., Ayral, A. Proceedings of the 9thInternational Conference on Inorganic Membranes(ICIM9), Lillehammer, Norway, 25–29 June; Bredesen, R.,Raeder, H., Eds.; 2006; pp 484–487.
[13] Roualdes, S., Sanchez, J., Durand, J. J. Membr. Sci.2002, 198 (2), 299–310.
[14] Yasuda, H. J. Membr. Sci. 1984, 18, 273–284.[15] Nakata, M., Kumazawa, H. J. Appl. Polym. Sci. 2006, 101,
383–387.[16] Teramae, T., Kumazawa, H. J. Appl. Polym. Sci. 2007,
104, 3236–3239.[17] Inagaki, N., Tasaka, S., Park, M. S. J. Appl. Polym. Sci.
1990, 40, 143–153.[18] Inagaki, N., Tsutsumi, D. Polym. Bull. 1986, 16, 131–136.[19] Wang, L. J., Chau-Nan Hong, F. Microporous
Mesoporous Mater. 2005, 77, 167–174.[20] Julbe, A., Rouessac, V., Durand, J., Ayral, A. J. Membr.
Sci. 2008, 316, 176–185.[21] Vilani, C., Weibel, D. E., Zamora, R. R. M., Habert, A. C.,
Achete, C. A. Appl. Surf. Sci. 2007, 254, 131–134.[22] Weibel, D. E., Vilani, C., Habert, A. C., Achete, C. A. J.
Membr. Sci. 2007, 293, 124–132.[23] Upadhyay, D. J., Bhat, N. V. J. Membr. Sci. 2004, 239,
255–263.[24] Yamaguchi, T., Tominaga, A., Nakao, S. I., Kimura, S.
AIChE J. 1996, 42 (3), 892–895.[25] Li, C.-L., Tu, C.-Y., Inagaki, N., Lee, K.-R., Lai, J.-Y. J.
Appl. Polym. Sci. 2006, 102, 909–919.[26] Roualdes, S., Durand, J., Field, R. W. J. Membr. Sci.
2003, 211, 113–126.[27] Wavhal, D. S., Fisher, E. R. J. Polym. Sci. Part B: Polym.
Phys. 2002, 40, 2473–2488.[28] Wavhal, D. S., Fisher, E. R. Desalination 2005, 172,
189–205.[29] Steen, M. L., Hymas, L., Harvey, E. D., Capps, N. E.,
Castner, D. G., Fisher, E. R. J. Membr. Sci. 2001, 188,97–114.
[30] Steen, M. L., Jordan, A. C., Fisher, E. R. J. Membr. Sci.2002, 204, 341–357.
[31] Gancarz, I., Pozniak, G., Bryjak, M. Eur. Polym. J. 1999,35, 1419–1428.
[32] Shahidzadeh-Ahmedi, N., Arefi-Khonsari, F.,Amouroux, J. J. Mater. Chem. 1995, 5, 229–236.
[33] Bryjak, M., Gancarz, I., Krajciewicz, A., Piglowski, J.Angew. Makromol. Chem. 1996, 234, 21–29.
00
1
2
3
2 4
125 °C
b
125 °C
25 °C
25 °C
6
(T/M)0.5
8 10
Per
mea
nce
(mol
m–2
s–1
pa–
1 ) ×
106
Figure 28 H2 (N ) and N2 (�) permeances of a PP–tetramethylsilane membrane as a function of (T/M)0.5
(T being the temperature in kelvin, M being the gas
molecular weight). Reproduced with permission from
pages, X., Rovessac, V., Cot, D., Nabias, G., Durand, J.Sep. Purif. Technol. 2001, 25, 399–406.
Plasma Membranes 193

[34] Gancarz, I., Pozniak, G., Bryjak, M. Eur. Polym. J. 2000,36, 1563–4569.
[35] Bryjak, M., Gancarz, I., Pozniak, G., Tylus, W. Eur. Polym.J. 2002, 38, 717–726.
[36] Bryjak, M., Gancarz, I. Angew. Makromol. Chem. 1994,219, 117–124.
[37] Gesner, B. D., Kelleher, P. G. J. Appl. Polym. Sci. 1968,12, 1199–1208.
[38] Poncin-Epaillard, F., Chevet, B., Brosse, J. C. Eur. Polym.J. 1990, 26, 333–339.
[39] Vigo, F., Nicchia, M., Uliana, C. J. Membr. Sci. 1988, 36,187–199.
[40] Ulbricht, M., Belfort, G. J. Membr. Sci. 1996, 111, 193–215.[41] Zhao, Z. P., Li, J., Wang, D., Chen, C. X. Desalination
2005, 184, 37–44.[42] Zhao, Z. P., Li, J., Zhang, D. X., Chen, C. X. J. Membr. Sci.
2004, 232, 1–8.[43] Zhao, Z. P., Li, J., Chen, J., Chen, C. X. J. Membr. Sci.
2005, 251, 239–245.[44] Chen, J., Li, J., Zhao, Z. P., Wang, D., Chen, C. X. Surf.
Coat. Technol. 2007, 201, 6789–6792.[45] Inagaki, N., Tasaka, S., Goto, Y. J. Appl. Polym. Sci. 1997,
66, 77–83.[46] Liu, Z. M., Xu, K. Z., Wan, L. S., Wu, J., Ulbricht, M. J.
Membr. Sci. 2005, 249, 21–31.[47] Muller, M., Oehr, C. Surf. Coat. Technol. 1999, 116–119,
802–807.[48] Gancarz, I., Pozniak, G., Bryjak, M., Frankiewicz, A. Acta
Polym. 1999, 50, 317–326.[49] Bankovic, P., Demarquette, N. R., da Silva, M. L. P. Mater.
Sci. Eng. 2004, B112, 165–170.[50] Vallois, C., Sistat, P., Roualdes, S., Pourcelly, G. J.
Membr. Sci. 2003, 216, 13–25.[51] Falk, S. U., Salkind, A. J. Alkaline Storage Batteries; Wiley:
New York, 1969.[52] Barak, M. Electrochemical Power Sources – Primary and
Secondary Batteries; Peter Peregrinus: Stevenage, 1980.[53] Linden, D. Handbook of Batteries; McGraw-Hill: New York,
1995.[54] Ciszewski, A., Gancarz, I., Kunicki, J., Bryjak, M. Surf.
Coat. Technol. 2006, 201, 3676–3684.[55] Ciszewski, A., Kunicki, J., Gancarz, I. Electrochim. Acta
2007, 52, 5207–5212.[56] Ogumi, Z., Uchimoto, Y., Tsujikawa, M., Takehara, Z.-I. J.
Electrochem. Soc. 1989, 136 (4), 1247–1248.[57] Ogumi, Z., Uchimoto, Y., Tsujikawa, M., Takehara, Z.-I.,
Foulkes, F. R. J. Electrochem. Soc. 1990, 137 (5),1430–1435.
[58] Ogumi, Z., Uchimoto, Y., Tsujikawa, M., Yasuda, K.,Takehara, Z.-I. Bull. Chem. Soc. Jpn. 1990, 63,2150–2153.
[59] Ogumi, Z., Uchimoto, Y., Tsujikawa, M., Yasuda, K.,Takehara, Z.-I. J. Membr. Sci. 1990, 54, 163–174.
[60] Yasuda, K., Yoshida, T., Uchimoto, Y., Ogumi, Z.,Takehara, Z.-I. Chem. Lett. 1992, 21, 2013–2016.
[61] Takehara, Z.-I., Ogumi, Z., Uchimoto, Y., Yasuda, K. J.Adhes. Sci. Technol. 1995, 9 (5), 615–625.
[62] Ogumi, Z., Uchimoto, Y., Takehara, Z.-I. J. Electrochem.Soc. 1988, 135 (10), 2649–2650.
[63] Ogumi, Z., Uchimoto, Y., Takehara, Z.-I. J. PowerSources 1989, 26, 457–460.
[64] Ogumi, Z., Uchimoto, Y., Takehara, Z.-I. J. Electrochem.Soc. 1989, 136 (3), 625–630.
[65] Ogumi, Z., Uchimoto, Y., Takehara, Z.-I., Foulkes, F. R. J.Electrochem. Soc. 1990, 137 (1), 29–34.
[66] Ogumi, Z., Uchimoto, Y., Takehara, Z.-I. J. Chem. Soc.,Chem. Commun. 1989, 6, 358–359.
[67] Ogumi, Z., Uchimoto, Y., Takehara, Z.-I., Kanamori, Y. J.Chem. Soc., Chem. Commun. 1989, 21, 1673–1674.
[68] Uchimoto, Y., Ogumi, Z., Takehara, Z.-I. Solid State Ion.1990, 40/41, 624–627.
[69] Kwak, B. S., Zuhr, R. A., Bates, J. B. Thin Solid Films1995, 269, 6–13.
[70] Choi, S.-S., Lee, Y. S., Joo, C. W., Lee, S. G., Park, J. K.,Han, K.-S. Electrochim. Acta 2004, 50, 339–343.
[71] Heinzel, A., Barragan, V. M. J. Power Sources 1999, 84,70–74.
[72] Arico, A. S., Srinivasan, S., Antonucci, V. Fuel Cells 2001,1, 133–161.
[73] Kreuer, K. D. J. Membr. Sci. 2001, 185, 29–39.[74] Ren, X., Gottesfeld, S. J. Electrochem. Soc. 2001, 148,
A87–A93.[75] Choi, W. C., Kim, J. D., Woo, S. I. J. Power Sources 2001,
96, 411–414.[76] Yoon, S. R., Hwang, G. H., Cho, W. I., Oh, I.-H.,
Hong, S.-A., Ha, H. Y. J. Power Sources 2002, 106,215–223.
[77] Bae, B., Ha, H. Y., Kim, D. J. Membr. Sci. 2006, 276,51–58.
[78] Walker, M., Baumgartner, K.-M., Ruckh, M., Kaiser, M.,Schock, H. W., Rauchle, E. J. Appl. Polym. Sci. 1997, 64,717–722.
[79] Walker, M., Baumgartner, K.-M., Kaiser, M., Kerres, J.,Ullrich, A., Rauchle, E. J. Appl. Polym. Sci. 1999, 74,67–73.
[80] Walker, M., Baumgartner, K.-M., Feichtinger, J.,Kaiser, M., Rauchle, E., Kerres, J. Surf. Coat. Technol.1999, 116–119, 996–1000.
[81] Feichtinger, J., Galm, R., Walker, M., et al. Surf. Coat.Technol. 2001, 142–144, 181–186.
[82] Kim, D., Scibioh, M. A., Kwak, S., Oh, I.-H., Ha, H. Y.Electrochem. Commun. 2004, 6, 1069–1074.
[83] Prakash, S., Mustain, W. E., Park, S.-O., Kohl, P. A. J.Power Sources 2008, 175, 91–97.
[84] Won, J., Choi, S. W., Kang, Y. S., et al. J. Membr. Sci.2003, 214, 245–257.
[85] Lue, S. J., Hsiaw, S.-Y., Wei, T.-C. J. Membr. Sci. 2007,305, 226–237.
[86] Yamaguchi, T., Hayashi, H., Kasahara, S., Nakao, S.-I.Electrochemistry 2002, 70 (12), 950–952.
[87] Bae, B., Kim, D. J. Membr. Sci. 2003, 220, 75–87.[88] Bae, B., Chun, B.-H., Ha, H.-Y., Oh, I.-H., Kim, D. J.
Membr. Sci. 2002, 202, 245–252.[89] Inagaki, N., Tasaka, S., Horikawa, Y. J. Polym. Sci. Part A:
Polym. Chem. 1989, 27, 3495–3501.[90] Inagaki, N., Tasaka, S., Kurita, T. Polym. Bull. 1989, 22,
15–20.[91] Inagaki, N., Tasaka, S., Chengfei, Z. Polym. Bull. 1991, 26,
187–191.[92] Ogumi, Z., Uchimoto, Y., Yasuda, K., Takehara, Z.-I.
Chemi. Lett. 1990, 6, 953–954.[93] Uchimoto, Y., Yasuda, K., Ogumi, Z., Takehara, Z.-I. J.
Electrochem. Soc. 1991, 138 (11), 3190–3193.[94] Uchimoto, Y., Yasuda, K., Ogumi, Z., Takehara, Z.-I.,
Tasaka, A., Imahigashi, T. Ber. Bunsenges. Phys. Chem.1993, 97 (4), 625–630.
[95] Uchimoto, Y., Endo, E., Yasuda, K., et al. J. Electrochem.Soc. 2000, 147 (1), 111–118.
[96] Ogumi, Z., Uchimoto, Y., Takehara, Z.-I. J. Electrochem.Soc. 1990, 137 (10), 3319–3320.
[97] Brumlik, C. J., Parthasarathy, A., Chen, W.-J., Martin, C. R.J. Electrochem. Soc. 1994, 141 (9), 2273–2279.
[98] Yasuda, K., Uchimoto, Y., Ogumi, Z., Takehara, Z.-I. Ber.Bunsenges. Phys. Chem. 1994, 98 (4), 631–635.
[99] Yasuda, K., Uchimoto, Y., Ogumi, Z., Takehara, Z.-I. J.Electrochem. Soc. 1994, 141 (9), 2352–2355.
[100] Yoshimura, K., Minaguchi, T., Nakano, H., et al. J.Photopolym. Sci. Technol. 2000, 13 (1), 13–20.
194 Basic Aspects of Polymeric and Inorganic Membrane Preparation

[101] Mahdjoub, H., Roualdes, S., Sistat, P., Pradeilles, N.,Durand, J., Pourcelly, G. Fuel Cells 2005, 5 (2),277–286.
[102] Roualdes, S., Topala, I., Mahdjoub, H., Rouessac, V.,Sistat, P., Durand, J. J. Power Sources 2006, 158 (2),1270–1281.
[103] Brault, P., Roualdes, S., Caillard, A., et al. Eur. Phys. J.Appl. Phys. 2006, 34, 151–156.
[104] Durand, J., Rouessac, V., Roualdes, S. Ann. Chim. Sci.Mat. 2007, 32 (2), 145–158.
[105] Roualdes, S., Schieda, M., Durivault, L., Guesmi, I.,Gerardin, E., Durand, J. Chem. Vap. Depos. 2007, 13 (6–7),361–363.
[106] Roualdes, S., Ennajdaoui, A., Schieda, M., Larrieu, J.,Durand, J. Membr. News 2007, 74, 9–13.
[107] Ennajdaoui, A., Larrieu, J., Roualdes, S., Durand, J. Eur.Phys. J. – Appl. Phys. 2008, 42 (1), 6–16.
[108] Caillard, A., Coutanceau, Ch., Brault, P., Mathias, J.,Leger, J.-M. J. Power Sources 2006, 162, 66–73.
[109] Mex, L., Muller, J. Membr. Technol. 1999, 115, 5–9.[110] Mex, L., Sussiek, M. Chem. Eng. Commun. 2003, 190,
1085–1095.[111] Mex, L., Ponath, N., Muller, J. Fuel Cells Bull. 2001, 39,
9–12.[112] Gruber, D., Muller, J. J. Power Sources 2007, 171,
294–301.[113] Bauer, B., Strathmann, H., Effenberger, F. Desalination
1990, 79, 125–144.
[114] Sata, T., Tsujimoto, M., Yamaguchi, T., Matsusaki, K. J.Membr. Sci. 1996, 112, 161–170.
[115] Matsuoka, K., Chiba, S., Iriyama, Y., et al. Thin Solid Films2008, 516, 3309–3313.
[116] Schieda, M., Roualdes, S., Durand, J., Martinent, A.,Marsacq, D. Desalination 2006, 199, 286–288.
[117] Kurosawa, S., Kamo, N., Arimura, T., et al. Jpn. Oil Chem.Soc. 1994, 43 (11), 1007–1010.
[118] Zeng, R., Pang, Z., Zhu, H. J. Electroanal. Chem. 2000,490, 102–106.
[119] Danilich, M. J., Gervasio, D., Burton, D. J.,Marchant, R. E. Macromolecules 1995, 28, 5567–5574.
[120] Danilich, M. J., Marchant, R. E. Plasmas Polym. 2002, 7(2), 127–149.
[121] Inagaki, N. Thin Solid Films 1984, 118, 225–230.[122] Dai, G. Sens. Actuat. B 1998, 53, 8–12.[123] Rouessac, V., Tuluc, P., Durand, J. J. Membr. Sci. 2004,
230, 49–59.[124] da Silva, M. L. P., Tan, I. H., Nascimento Filho, A. P.,
Galeazzo, E., Jesus, D. P. Sens. Actuat. B 2003, 91,362–369.
[125] Pages, X., Rouessac, V., Cot, D., Nabias, G., Durand, J.Sep. Purif. Technol. 2001, 25, 399–406.
[126] Shindo, Y., Hakuta, T., Yoshitome, H., Inoue, H. J. Chem.Eng. Jpn. 1983, 16, 120–126.
[127] Barranco, A., Cotrino, J., Yubero, F., Espinos, J. P.,Contreras, L., Gonzales-Elipe, A. R. Chem. Vap. Depos.2004, 10, 17–20.
Plasma Membranes 195

Biographical Sketches
Dr. Stephanie Roualdes received her master’s degree in chemical engineering from Institut National
Polytechnique de Lorraine in 1997, and her PhD in materials chemistry from University of Montpellier in
2000. After spending a few months in the University of Bath as a lecturer, she worked again at the University of
Montpellier where she secured a permanent position as a lecturer in 2002. Since then, she has been teaching
physico-chemistry (electrochemistry, thermodynamics, and analytical chemistry) and materials science and
leading a master formation on materials since 2005. As an academic researcher at the European Membrane
Institute, she has worked on the synthesis of thin layers or modification of polymer membranes by plasma-
enhanced chemical-vapor deposition for applications in membrane processes such as gas permeation or
electrodialysis or in energy-production devices. Currently, she has been focusing on the development of ion-
conductive plasma-polymerized membranes for microfuel cells. She has over 25 publications in refereed
journals, 2 patents, and has also coauthored 2 chapters in books. Since 2001, she has been partner in 6 French
or European projects, and advisor or coadvisor to over 20 masters, PhD, or postdoctoral students.
Dr. Vincent Rouessac (Phd in 1977) has an experience of 13 years in materials synthesis and characterization,
with almost 9 years in research on plasmas. His focus at the European Membrane Institute has been on the
surface modifications and PECVD materials. His current topics of interest are the synthesis and characteriza-
tion of new hybrid and inorganic PECVD films for gas-separative membranes and for microelectronics and
surface modifications by plasma. He has also specialized in the static and dynamic characterizations of
deposited thin films: nanoporosity, swelling, and vapor affinity by coupled techniques (quartz crystal micro-
balance, ellipsometry, and X-ray reflectometry) with vapor adsorption, gas transfers, and permselectivities by
permeance measurements. He is author or coauthor of 38 peer-reviewed articles, 2 book chapters, and 50
communications in national and international conferences. He has cosupervised four PhD students and is
currently supervising two more.
196 Basic Aspects of Polymeric and Inorganic Membrane Preparation

Dr. Jean Durand joined the CNRS in 1977 after his PhD. He has been a senior researcher at EuropeanMembrane Institute (EMI) since 1977. His main focus has been on the study of C3v symmetry compounds, thecrystal growth of ABO4 compounds, and the development of cold plasmas techniques for microelectronics and,since 1982, membrane applications. He was EMI deputy director during 1994–2002. Supervisor of the Plasmaand Membrane team in EMI, he is the author of more than 170 papers and 50 proceedings. He has scientificresponsibilities in the Chemical High School of Montpellier (ENSCM) and in the Carnot Institute.
Plasma Membranes 197

This page intentionally left blank
1.10 Preparation of Membranes Using Supercritical FluidsE Reverchon and S Cardea, University of Salerno, Fisciano, Italy
ª 2010 Elsevier B.V. All rights reserved.
1.10.1 State of the Art 199
1.10.1.1 Solvent-Induced Phase Separation 200
1.10.2 Preparation of Membranes by SCF-Induced Phase Separation 200
1.10.2.1 Preparation of Membranes 201
1.10.2.2 Characterization of Membranes 201
1.10.3 Experimental Results 201
1.10.3.1 Flat Membranes 204
1.10.3.1.1 Effect of the operative parameters 204
1.10.3.1.2 Application of the SC-IPS to water-soluble polymers 210
1.10.3.2 Loaded Membranes 211
1.10.3.3 Membranes for Scaffolding Applications 212
1.10.4 Conclusions and Perspectives 214
References 215
Glossary
Binodal curve Curve defining the region of
composition and temperature in a phase diagram
for a mixture across which a transition occurs from
miscibility of the components to conditions where
single-phase mixtures are metastable or unstable.
Interaction parameter It is employed in the Flory–
Huggins theory, to account for the contribution of
the noncombinatorial entropy of mixing and the
enthalpy of mixing to the Gibbs energy of mixing.
Spinodal curve Curve defining the region of
composition and temperature for a mixture across
which a transition occurs from conditions where
single-phase mixtures are metastable to conditions
where single-phase mixtures are unstable and
undergo phase separation by spinodal
decomposition.
Nomenclature� interaction parameter
1.10.1 State of the Art
Polymeric membranes can be used for several indus-
trial applications [1–3], such as gas separation,
reverse osmosis, ultrafiltration, microfiltration, cata-
lytic reactions, drug controlled release, and tissue
engineering. Each application requires specific char-
acteristics for membrane material and structure. In
the case of microfiltration and ultrafiltration, the pore
size and the porosity of the membrane determine the
efficiency of the filtration. For gas separation, the
permeability and the selectivity of the membrane
determine the efficiency of the operation. For cata-
lytic reactions and controlled release, the distribution
of the catalyst (or of the drug) along the membrane
structure and an appropriate porosity are
fundamental.Majority of membranes are prepared by con-
trolled phase separation of polymeric solutions into
a polymer-rich phase and a polymer-lean phase.
Phase separation of polymer solutions can be induced
in several ways; the two main techniques are
199

thermally induced phase separation (TIPS) and sol-vent-induced phase separation (SIPS) [4]. Theperformance of the membranes obtained by theseprocesses strongly depends on the morphologyobtained during phase separation and subsequentsolidification.
To analyze the membrane formation mechanism,phase diagrams are frequently used and can indicatemembrane morphologies that will be formed. Binaryphase diagrams provide information for the TIPSprocess, whereas ternary isothermal phase diagramsare useful for the prediction of the phase transitionsthat can occur when phase separation is induced by anonsolvent (i.e., SIPS). This type of analysis is alsouseful to describe supercritical-induced formation ofmembranes.
1.10.1.1 Solvent-Induced PhaseSeparation
This process presents many analogies with the oneassisted by supercritical fluids (SCFs). In SIPS, apolymer solution is cast as a film on a support orextruded through a die, and is subsequentlyimmersed in a nonsolvent bath. The second solvent(or antisolvent) is a good solvent for the solvent in thesolution but the polymer is not soluble in it.Therefore, the solvent in the polymer solution issolubilized by the nonsolvent and a solid-phase pre-cipitates. At least three components are involved andcomplex diffusion and convection processes can playan important role. The possible combinations of thethree components can be plotted in a triangular phasediagram. The corners represent the pure compo-nents, the axes of the three binary compositions,and points in the triangle a ternary composition.
The phase diagram is, as a rule, divided into ahomogeneous region and an area representing aliquid–liquid (L–L) demixing gap. The boundary ofthe L–L demixing gap is usually called the binodalcurve; usually the L–L demixing is subdivided into aregion of spinodal demixing, bounded by the spino-dal curve, and two regions of nucleation and growthbetween the binodal and the spinodal curves [5, 6].The point where the binodal and the spinodal coin-cide is called the critical point. A metastable areaexists between the spinodal and the binodal curveat low polymer concentration, an unstable area issurrounded by the spinodal curve, and a secondmetastable area exists at higher polymer concentra-tions. The size and the location of the demixing gapdepend on the molar volumes of the components, the
polymer–solvent interaction parameter, the poly-
mer–nonsolvent interaction parameter, and the
solvent–nonsolvent interaction parameter [7].All transitions, different from L–L demixing, are
usually referred to as gel transitions in the literature.
These include viscosity transitions and transitions
due to solid–liquid demixing and vitrification. For
amorphous polymers, membrane structures can be
stabilized by vitrification, whereas semicrystalline
polymers can exhibit crystallization (solid–liquid
(S–L) demixing) concurrently with L–L demixing.
At high polymer concentrations and low nonsolvent
concentrations, the polymer crystallizes from solu-
tion; at moderate polymer concentrations and with
moderate nonsolvent concentrations, L–L demixing
occurs without the interference of S–L demixing; at
higher nonsolvent concentrations, L–L demixing
interferes with S–L demixing.This process suffers various limitations that
induced some researchers to find new preparation
processes. In particular, it involves the use of two
solvents that must be expensively removed from
the membrane with posttreatments, since residual
solvents can cause problems for the use in several
applications. Moreover, relatively long formation
times and a limited versatility characterize this
process, due to the reduced possibility to modulate
cell size and membrane structure once the polymer–
solvent–nonsolvent system is fixed.
1.10.2 Preparation of Membranes bySCF-Induced Phase Separation
In this technique, a SCF replaces the liquid nonsol-
vent used in SIPS. A SCF is a substance at a
temperature and pressure above its thermodynamic
critical point (i.e., the highest temperature and pres-
sure at which the substance can exist as a vapor and
liquid in equilibrium). SCFs are suitable as substi-
tutes for organic solvents since they can show liquid-
like solvent power, gas-like diffusion, and zero sur-
face tension. In addition, close to the critical point,
small changes in pressure or temperature result in
large changes in density, allowing many properties to
be tuned. As a rule, CO2 has been chosen as the SCF
because it is safe, readily available, and has a low cost.
It also allows supercritical operation at relatively low
pressures and at near-room temperatures
(pc¼ 7.21 MPa, Tc¼ 31.1 �C).
200 Basic Aspects of Polymeric and Inorganic Membrane Preparation

Compared to the SIPS method, supercritical CO2
phase-separation process can have severaladvantages:
1. SC-CO2 can form and dry the polymer membranerapidly, without the collapse of the structure dueto the absence of a liquid–vapor interface whenthe supercritical mixture solvent–nonsolvent isformed. Moreover, the membrane can be obtainedwithout additional posttreatments because thepolymer solvent is completely extracted.
2. It is easy to recover the liquid solvent, since itdissolves in SC-CO2 and can be removed fromgaseous CO2 by depressurization, in a separatorlocated downstream of the membrane formationvessel.
3. SC-CO2 allows one to modulate the membranemorphology, as well as cell and pore size by sim-ply changing the pressure and temperature thatproduce different solvent powers and diffusivities.
1.10.2.1 Preparation of Membranes
In the majority of the published papers, polymericmembranes are prepared in a laboratory apparatusequipped with a high-pressure vessel, in whichSC-CO2 contacts the polymer solution in a singlepass. An example of experimental apparatus is sche-matically reported in Figure 1.
Membrane casting process is similar to the tradi-tional procedure. Homogenous solutions of polymerare prepared by stirring the solution that is thenplaced in a membrane formation cell, on which it isspread to control the thickness of the film. The cell israpidly placed inside the membrane preparation ves-sel (D) to avoid evaporation of the solvent. Thevessel is then rapidly closed and filled withSC-CO2, up to the desired pressure using a high-pressure pump (C).
CO2 flows from a tank (A) and passes through achiller (typically, a glycolic bath: B) to be sent to thepumping system as a subcooled liquid to avoid cavi-tation. After the pump, a preheater is usually placedto warm CO2 above its critical temperature.Thereafter, SC-CO2 flows into the vessel (E) andcontacts the polymeric solution. Usually, the pro-cess can be divided in two parts: (1) the operation isperformed in batch mode up to the final set pres-sure; and (2) a valve (F) is opened and the operationis performed in a continuous mode delivering aconstant SC-CO2 flow rate in the membrane forma-tion vessel. Pressure and temperature are heldconstant and, during this step, the phase-separatedmembrane is also dried; then, the vessel isdepressurized.
1.10.2.2 Characterization of Membranes
Various characterizations of membranes obtained bySC-CO2-assisted process have been presented in lit-erature. In particular, scanning electron microscopy(SEM), porosity, cell and pore size, differential scan-ning calorimetry (DSC), X-ray diffraction pattern(XRD), mechanical tests, solvent residue, N2, andwater flux analysis have been performed. A detaileddescription of the results is reported in the followingsection.
1.10.3 Experimental Results
A schematic representation of the results until nowobtained in literature is reported in Tables 1and 2.We summarized these results considering thepolymer used, the parameters analyzed, the char-acterizations performed, the morphologiesobtained, and the possible industrial applications.In the following, we analyze the results presentedand the possible trends in the research on theformation of membranes by SC-CO2-assistedphase inversion.
F
E
D
CB
A
Figure 1 Schematic drawing of a typical SC-IPS apparatus:(A) CO2 tank; (B) chiller; (C) high pressure pump for CO2;
(D) CO2 preheater; (E) high pressure vessel; and (F)
micrometric valve.
Preparation of Membranes Using Supercritical Fluids 201

Table 1 Representation of the parameters analyzed in literature regarding the SC-IPS process
Polymer
Analyzed
parameters Solvents
Polymer concentration
(% (w/w))
Temp. range
(�C)
Pressure range
(MPa)
Depress. rate
(min)
Addition of another compound
(% (w/w))
Nonsolvent
modification Ref.
Flat membranes
Cellulose
acetate
S, C, T, P Acetone
Methylacetate
1,3-dioxolane
2-butanone
5–40 45–65 10–20 - - - [8, 9]
Nylon-6 C, P TFE 15 - 10.4–17.3 - - - [10]
PEEK-WC C, P, T NMP 10–20 45–65 8–20 - - - [11]
PLLA S, C, P, DR, N Chloroform
THF
20–25 - 13–16 2–30 - THF-CO2
0:100–2:98
[12, 13]
PMMA C, S, P, T DMSO
Acetone
THF
1–25 35–65 15–25 - - - [14]
PolystyreneC,
T, P
Toluene 15–30 25–70 8–16 - - - [15]
Polysulfone C, T, P, S, DR, PCL
Conc.
Chloroform
NMP
MP
DMF
DMA
DMSO
DMPA
2–30 35–65 10–20 1–60 PCL content 0–50 - [16–18]
Polycarbonate T, P, PEG Conc. DCM 16 30–60 11–19 - PEG content 0–30 - [19]
PVA C, T, P DMSO 1–35 35–55 10–20 - - - [20]
PVDF C, T, P, PMMA
Conc.
Acetone
DMAC
1–20 35–65 8–20 - PMMA
Content 1.5–7.5
- [21–23]
Loaded membranes
PMMA/
amoxicillin
C, T, P, Drug Conc. DMSO,
acetone
10–40 35–65 15–25 - Drug content 0–30 - [24]
Membranes for scaffolding applications
PLLA C, T, P DCM 10–30 35–65 10–23 - - - [25, 26]
C, polymer concentration; P, pressure; T, temperature; S, solvent; DR, depressurization rate.

Table 2 Summary of the results obtained in literature regarding the SC-IPS process
Polymer Characterizations Morphologies Mechanisms Possible applications Ref.
Flat membranes
Cellulose acetate SEM, WP Cellular L–L demixing Microfiltration [8]Cellulose acetate SEM, QTD Cellular, bicontinuous, microparticles L–L demixing Filtration [9]
Nylon-6 SEM, QTD Cellular, sponge-like L–L and S–L demixing Filtration [10]
PEEK-WC SEM, N2 flux Dense, cellular, sponge-like L–L and S–L demixing Filtration [11]PLLA SEM, X-ray, PM Dense, cellular L–L demixing Gas separation
Microfiltration
[12]
PLLASEM Cellular L–L demixing Microfiltration [13]
PMMA SEM, QTD Cellular, bicontinuous, microparticles L–L demixing Filtration [14]Polystyrene SEM Cellular L–L demixing Filtration [15]
Polysulfone SEM, QTD Cellular, bicontinuous, microparticles L–L demixing Filtration [16]
Polysulfone SEM, QTD, WP Cellular L–L demixing Microfiltration [17]
Polysulfone/PCL CA, WP, MS Cellular L–L demixing Microfiltration [18]PC SEM, TS Cellular L–L demixing Microfiltration [19]
PVA SEM, QTD, DSC, X-ray Dense, cellular, bicontinuous, microparticles L–L demixing Filtration [20]
PVDF SEM, X-ray, DSC, TGA Sponge-like L–L and S–L demixing Microfiltration [21]PVDF SEM, QTD, DSC, X-ray Sponge-like L–L and S–L demixing Microfiltration [22]
PVDF SEM, DSC Sponge-like L–L and S–L demixing Microfiltration [23]
Loaded membranesPMMA/amoxicillin SEM, DSC, DR Cellular L–L demixing Controlled release [24]
Membranes for scaffolding applications
PLLA SEM Cellular and sponge-like L–L and S–L demixing Tissue engineering [25]PLLA SEM, SR, MS Sponge-like Gel drying Tissue engineering [26]
SEM, scanning electronic microscopy; WP, water permeability; QTD, qualitative ternary diagram; PM, polarized microscopy; TS, tearing stress analysis; DSC, differential scanningcalorimetry; X-ray, X-ray analysis; TGA, thermogravimetry analysis; DR, dissolution rate; SR, solvent residue analysis; MS, mechanical stress analysis; CA, contact angle analysis.

1.10.3.1 Flat Membranes
1.10.3.1.1 Effect of the operative
parameters
The effect of the operative parameters in the SC-
induced phase-separation (SC-IPS) process has been
investigated by several authors [8–23]. The most
relevant parameters in the formation of membranes
by SC-IPS include: polymer concentration, pressure,
temperature, and type of solvent. In some cases, other
process parameters have also been investigated such
as the depressurization rate and the addition of
another polymer in the starting solution. In the fol-
lowing, we report an organized summary of the
results obtained.�Effect of polymer concentration. Various ranges of
concentration have been investigated depending on
the polymer–solvent system used; polymer
concentrations with a minimum of 1% w/w and a
maximum of 40% w/w have been processed.Depending on the process conditions and on the
type of polymer used, four main morphologies were
observed as a result of different polymer concentra-
tions. Examples of SEM images of these
morphologies are reported in Figures 2(a)–2(d): a
dense structure (Figure 2(a)–polyvinyl alcohol
(PVA)), a cellular structure (Figure 2(b)–polymethyl
methacrylate (PMMA)), a bicontinuous structure
(Figure 2(c)–cellulose acetate), and a particulate
structure (Figure 2(d)–PVA).In the traditional phase inversion, the mass trans-
fer of the nonsolvent in the cast solution and of the
solvent in the coagulation bath is responsible for the
modification in the composition of the polymer–
solvent–nonsolvent system. The possible paths can
be schematically reported in a ternary phase diagram
(b)(a)
(d)(c)
100 µm Mag: 250×
20 µm Mag: 1000× 10 µm Mag: 5000×
100 µm Mag: 500×
Figure 2 Different membrane morphologies obtained starting from a different polymer concentration: (a) dense structure
(polyvinyl alcohol (PVA)), (b) cellular structure (polymethyl methacrylate (PMMA)), (c) bicontinuous structure (celluloseacetate), (d) particulate structure (PVA).
204 Basic Aspects of Polymeric and Inorganic Membrane Preparation

indicating them as the composition paths. In
Figure 3, a qualitative ternary phase diagram is pre-
sented in which an L–L demixing gap, divided into a
region of spinodal demixing, two regions of nuclea-
tion and growth located between the binodal and the
spinodal curve, and a gelation region are schemati-
cally reported.The arrows numbered from 1 to 4 report the
different composition paths that can occur during
the formation of membranes:
1. The concentration of the polymer in the ternarysystem increases because the outflow of the solvent
from the solution is faster than the inflow of the
nonsolvent; the phase inversion does not occur and
the polymer molecules solidify by gelation and/or
crystallization into a dense structure (Figure 2(a)).
This situation is also possible in the case of a super-
critical nonsolvent, when the system is very
concentrate and the diffusion of the nonsolvent is
very reduced. The formation of dense structures
has been observed, for example, for the system
PVA/dimethyl sulfoxide (DMSO)/SC-CO2 [20].2. The ternary polymer solution becomes meta-
stable; nucleation and growth of droplets of the
polymer-lean phase occurs with solidification of
the polymer-rich phase, leading to a cellular
structure (Figure 2(b)); in this case, both porous
or dense skins can be obtained depending on the
polymer–solvent–nonsolvent system processed.
This morphology has been frequently observed
in the case of SC-CO2-IPS, for example, for the
system PMMA/DMSO/SC-CO2 [14].3. The ternary polymer solution becomes unstable;
spinodal phase separation with the subsequent
solidification of the polymer-rich phase takes
place, leading to the formation of a bicontinuous
structure (Figure 2(c)); in this case, porous skins
are usually obtained. This morphology has also
been observed in the case of SC-IPS, for example,
for the cellulose acetate/acetone/SC-CO2 system
[8].4. In this case, nucleation and growth of droplets of
the polymer-rich phase is obtained, followed
by solidification of the polymer-rich phase; a
bead-like (particulate) structure is obtained
(Figure 2(d)). Besides, this kind of morphology
has been obtained by SC-IPS, as in the case of
PMMA/DMSO/SC-CO2 [14] system.
In the case of dense structure (Figure 2(a)), starting
from the highest polymer concentration, the compo-
sition path can enter in the upper part of the ternary
phase diagram (path 1) due to both the high concen-
tration of the system and the slow diffusion of the
SC-CO2. In this manner, the accumulation of the
polymer due to the outflow of the solvent occurs
before the phase separation of the solution causing
the dense layer formation.In the region in which cellular structures are
produced (path 2), as the polymer concentration in
the starting solution is increased, the cell diameter
usually decreases, as in the example reported in
Figure 4. In the case of polysulfone membranes
[16], increasing the polymer percentage from 15%
to 30% w/w, the mean diameter of the cells
Solvent
1
Nonsolvent
Polymer
Binodal
Spinodal
3
2
1
Gel
4
2 3 4
Figure 3 Ternary phase diagram of a generic polymer/solvent/nonsolvent system with various composition paths
indicated by arrows and numbers; the typical membrane
structures related to the composition paths are also
reported.
00
10
20
30
40
50
60
70
15%
30%
20%
Cel
ls (
%)
Diameter (µm)10 20 30 40 50 60
Figure 4 Cell size distribution at different polysulfone
concentrations in N-methyl-2-pyrrolidone (NMP), obtainedoperating at 45 �C and 20 MPa.
Preparation of Membranes Using Supercritical Fluids 205

decreases and reduces from about 20 to 3 mm; corre-spondingly, the cell size distribution sharpens.
An explanation of this result has been presented inFigure 5 considering again a qualitative ternary dia-gram. Three different compositions paths, starting atthree different polymer concentrations (15%, 20%,and 30% w/w), show that the nucleation and growthof the droplets of the polymer-lean phase, withfurther solidification of the polymer-rich phase, canbe the controlling mechanism. Increasing the poly-mer concentration in the starting solution, that is,passing from point 3 to point 1, the operative point(the intersection between the tie-line and the com-position path) shifts toward the polymer-rich phase.Therefore, using the lever rule, we can observe thatthe quantity of the polymer- lean phase decreases. Asa consequence, there will be a smaller amount ofpolymer-lean phase (smaller cells) inside a fixedvolume of membrane.
Decreasing the polymer concentration, it is possi-ble to fall in the spinodal decomposition region ofFigure 3 (path 3). In this case, a complete connectionamong the cells is obtained and high-porosity mem-branes are produced (Figure 2(c)) with porous skins.
Starting from dilute solutions, the operative pointcan lie in the region characterized by the fourth masstransport mechanism (path 4 in Figure 3) and, as aconsequence, more or less networked microparticlescan be produced (particulate structure). An explana-tion of this morphology is possible considering theexistence of a second concurring mechanism of poly-mer precipitation under the action of SC-CO2. Atvery low concentrations, the process driven bySC-CO2 can be very fast and a part of polymer-rich
phase can form microparticles. At lowest concentra-tions, this mechanism can become dominant and onlymicroparticles can be obtained. These results agreewell with those obtained in the case of celluloseacetate [8] and PVA [20] membranes. The processis substantially the same that it is obtained duringbatch supercritical antisolvent (GAS) experimentsdevoted at the production of microparticles [27]. Inthis type of experiments, a polymer solution at lowconcentration is placed inside a vessel and CO2 israpidly pumped to reach the final pressure and acts asa nonsolvent for the polymer. Therefore, it is possibleto assume that, when the percentage of polymer inthe solution is very low, the liquid solution is rapidlydried by SC-CO2, the polymer precipitates as singleor connected microparticles, and the continuoussolid structure (membrane) is not formed. A contri-bution to the formation of these morphologies canalso be attributed to the viscosity of the samples.When the viscosity of the sample increases (highpercentage of polymer), a slower demixing isobtained and the polymer can rearrange to form thesemisolid structure during the contact with SC-CO2.On the contrary, at low viscosities (low amount ofpolymer), the process is very fast, the porous struc-ture is not formed, and the polymer tends to formmicroparticles as in GAS experiments.
For crystallizable polymers, for example, poly-vinylidene fluoride (PVDF) [21–23], S–L demixingcan also take place during the phase-inversion pro-cess. In this case, the resulting membrane will exhibitcharacters from both types of phase demixing. TheS–L demixing occurs in the crystallizable segmentsof the polymer to form membranes consisting ofinterlinked crystalline particles (leafy morphology).As crystallization is a slow process compared to L–Ldemixing, a crystallization-dominated membranestructure is difficult to prepare. An example ofPVDF–hexafluoropropylene (HFP) membraneobtained by SC-CO2 phase-separation process isreported in Figure 6. It is possible to observe that acellular structure is obtained, but cell walls are notsmooth; they are characterized by a leafysubstructure.
In addition, in this case, it is possible to use as areference the traditional phase-inversion process toexplain these results; depending on the solvent andnonsolvent combination used, it is possible to obtainmembranes with a structure either largely dominatedby L–L demixing (cellular, bicontinuous, or bead-like morphology) or related to S–L demixing (leafymorphology). The application of these
NMP CO2
Polysulfone
1
2
3
Binodal
Spinodal
Figure 5 Hypothesized phase diagram for the ternary
system polysulfone/N-methyl-2-pyrrolidone (NMP)/
supercritical CO2. Composition paths: (1) 30% w/w, (2) 20%w/w, and (3) 15% w/w of polysulfone.
206 Basic Aspects of Polymeric and Inorganic Membrane Preparation

considerations to the phase-inversion methodassisted by SC-CO2 indicates that, in the case ofPVDF–HFP membranes, L–L demixing is the domi-nant mechanism during the precipitation process;indeed, cellular structures have been obtained. Onthe other hand, the leafy morphology observed onthe walls of cellular structures suggests that an S–Ldemixing (i.e., the crystallization process) occurs too.Therefore, both the demixing mechanisms (L–L andSL) concur to the formation of PVDF–HFP mem-branes and a competition between L–L and S–Ldemixing has to be taken into consideration.
The crystallization occurring during the forma-tion of PVDF–HFP membranes process confirmsthe presence of a gelation region, delimited by agelation line. The position of this line stronglydepends on the nature of the solvent–nonsolventsystem used [21]. Therefore, according to the resultsobtained and to the general knowledge on the for-mation of PVDF–HFP membranes, it is possible tohypothesize a qualitative ternary diagram for PVDF–HFP/solvent/SC-CO2 system in which the gelationline is very close to the solvent apex [21]. As aconsequence, the polymer solution contactsSC-CO2 and its composition continuously changesby diffusion of SC-CO2 in the liquid phase; at thebeginning, the gelation line is crossed inducing anS–L demixing that causes the formation of the leafymorphology. Then, the composition pathway con-tinues its trajectory inside the ternary diagrammoving toward the pure polymer apex since it fallsin a region characterized by one of the solidificationmechanisms typical of L–L demixing. As a conse-quence, a solid structure caused by the superposition
of the S–L and L–L phase-separation mechanisms isobtained.�Effect of SC-CO2 density (pressure and temperature).
SC-CO2 density depends on the process pressure andtemperature and largely determines the solventpower of the antisolvent. Indeed, by increasing pres-sure and/or decreasing temperature it is possible toincrease the SC-CO2 solvent power and, as a conse-quence, to influence the phase-separation process.
An example of the effect on the final membranemorphologies is observable in the case of PVAmembranes [20]. Experiments were performed start-ing from 1% w/w PVA–DMSO solutions. Varioussets of process parameters from 10 MPa, 55 �C(329 kg m�3) to 20 MPa, 35 �C (866 kg m�3) wereexplored. As shown in Figure 7, for this system, themorphology completely changes by increasingSC-CO2 density: at 10 MPa and 55 �C, a membranewith a cellular structure is obtained (Figure 7(a)); at15 MPa and 45 �C, the structure becomes bicontin-uous (Figure 7(b)) and is formed by filaments andcrosslinked microparticles; and at 20 MPa and 35 �C,a membrane is not formed but well-defined sphericalsubmicroparticles are generated with a diameterranging between 0.2 and 0.7 mm (Figure 7(c)).
It is possible to explain these results consideringthe kinetic aspect of the SC-CO2 phase-separationprocess [20]. When the pressure is high (20 MPa) andthe temperature is low (35 �C) (i.e., high SC-CO2
solvent power), the outflow of the solvent from thesolution is limited and the trajectory of the pathwaysmoves toward the pure antisolvent vertex, leading tothe formation of microparticles (Figure 7(c)); bydecreasing pressure (15 MPa) and increasing tem-perature (45 �C), the process becomes slower andthe pathway enters in the central region of demixinggap (part of the solvent is lost by outflowing), leadingto bicontinuous structures (Figure 7(b)). A furtherdecrease of pressure (10 MPa) and increase of tem-perature (55 �C) produce an increase of the outflowof the solvent and the pathway enters inside theupper demixing gap (between spinodal and binodalcurves), leading to a cellular structure (Figure 7(a)).Decreasing the SC-CO2 solvent power again, the cellsize decreases because the operative point shiftstoward the polymer-rich phase.
Another example of the effect of pressure and tem-perature on membrane morphologies is reported in thecase of polysulfone membranes [16]. In this case, thetrend observed was the same; however, differentlyfrom PVA membranes [20], the thermodynamicaspects of the process were considered. Indeed, the
10 µm Mag: 5000×
Figure 6 Leafy substructure of the cell walls of
polyvinylidene fluoride–hexafluoropropylene (PVDF–HFP)
membranes obtained at 20 MPa, 55 �C, and 20% w/w.
Preparation of Membranes Using Supercritical Fluids 207

authors considered that the shape and size of the mis-
cibility curve vary with pressure (and with
temperature). Three possible binodal curves, related
to the different pressures tested, were proposed [16].
The enlargement of the miscibility gap with a pressure
reduction is in accordance with the studies on the fluid
phase behavior in ternary systems containing dense
CO2 [28] which explains the results obtained (i.e.,
cellular structure is obtained and cell size decreases
with the SC-CO2 solvent power). Indeed, for a fixed
polymer concentration, the enlargement of the binodal
curve causes an increase of the polymer-lean phase/
polymer-rich phase ratio generating a larger amount
of polymer-lean phase (larger cells) inside a fixed
volume of membrane. It is possible to suppose that an
increase of temperature causes an effect similar to the
decrease of pressure since in both cases a reduction of
the SC-CO2 density is obtained; as a consequence, the
affinity between SC-CO2 and the liquid solvent
decreases and the cell size increases due to the forma-
tion of a larger quantity of the polymer-lean phase.�Effect of the liquid solvent. The use of different
solvents influences the demixing process that is
related to the demixing gap in the phase diagram
[29] and the diffusion kinetics such as the exchange
rate between nonsolvent and solvent [30]. The posi-
tion of the binodal curve is influenced by the nature
of components in the mixture, particularly by the
interaction parameters [4]. According to van de
Witte et al. [4], it is possible to define three interac-
tion parameters among polymer (1), solvent (2), and
nonsolvent (3):
1. polymer/solvent (�12),2. polymer/nonsolvent (�13), and3. solvent/nonsolvent (�23).
�13 is constant when the polymer and the nonsolvent
are fixed, whereas �23 and �12 vary with the solvent
used. A couple polymer/solvent with a low mutual
affinity (i.e., high �12) produces an increase in the
magnitude of the demixing gap, especially at very
low values of �23 (i.e., high solvent/nonsolvent affi-
nity), whereas a low compatibility of the solvent–
nonsolvent mixture (i.e., high �23) results in large
differences in solvent/nonsolvent ratio at equilibrium.
The determination of the interaction parameters is
difficult, but a rapid indication for these values can be
obtained by the solubility parameter approach [31–35].
Indeed, interaction parameters are inversely propor-
tional to the difference between the solubility
parameters of compounds. The solubility parameters
represent the attractive strength between the mole-
cules of the compounds and have been defined as the
square root of the cohesive energy density (J cm�3)1/2.
Usually, the smaller is the difference of the solubility
parameter value, the higher is the compounds misci-
bility (i.e., mutual affinity) [31].
(a)
(b)
(c)
10 µm Mag: 5000×
10 µm Mag: 5000×
500 nm Mag: 20000×
Figure 7 Effect of supercritical CO2 density on membrane
morphology and cell size at 1% w/w polyvinyl alcohol (PVA) in
DMSO, operating at: (a) 10MPa, 55 �C (329kg m�3); (b) 15MPa,45 �C (741kg m�3); and (c) 20MPa, 35 �C (866kg m�3).
208 Basic Aspects of Polymeric and Inorganic Membrane Preparation

When the casting solution is immersed in acoagulant bath, the exchange of solvent and nonsolventacross the interface of the polymer solution causes thephase inversion at a different exchange rate thatdepends on the solubility and diffusion parameters ofthe nonsolvent. In a process that uses SC-CO2,the diffusion process is very fast and, consequently,the exchange rate is probably controlled by the differ-ence between solubility parameters. When SC-CO2 isused as the nonsolvent, it is also necessary to take in toaccount that its solubility parameter varies with theoperative conditions; for example, an increase of theoperating pressure produces an increase of miscibilitybetween SC-CO2 and the liquid solvent. The contin-uous variation of the affinity between solvent andnonsolvent is one of the key steps in the flexibility ofthe supercritical-assisted phase-inversion method. Thesolubility parameter for SC-CO2 can be calculated, atdifferent operative conditions, using the empiricalequation of state (EOS) of Huang et al. [33]. The differ-ence between solubility parameters of liquid solventsand SC-CO2 modifies with a similar trend for allsolvent–SC nonsolvent couples. Considering the caseof PMMA membranes [14], the difference betweensolubility parameters of DMSO and SC-CO2 is largerthan between tetrahydrofuran (THF) and SC-CO2; thisindicates that, at the same operative conditions, THFhas a higher miscibility with the nonsolvent thanDMSO. Therefore, during membrane formation,SC-CO2 can diffuse into PMMA–THF solutionsquicker than into PMMA–DMSO solutions, makingthe solution faster to phase-separate, resulting in highermembrane porosity (high interconnectivity). It has beenreported [36–38] that smaller membrane cells areassociated with faster diffusion of the coagulant throughthe casting solution. To confirm this consideration, itis possible to observe in Figure 8 that, at the sameoperating conditions, cells of PMMA membranes pre-pared using THF as solvent are smaller than those ofthe membranes prepared using DMSO.
The increase of cell size with the decrease ofmutual affinity between solvent and nonsolvent canbe explained considering that, when the mutual affi-nity is low, the outflow of the solvent into the SC-CO2
phase is slow as well. This means that there is timeenough for the polymer-lean phase, formed by thephase separation, to grow leading to the formationof larger pores. Another consequence is that, whenexperiments with low PMMA concentrations (3%and 5% w/w) were performed, membranes withcellular structure were obtained in DMSO (i.e., slowprocess), whereas, using acetone or THF (high
affinity), the process was faster and PMMA precipi-
tated as networked microparticles (particulate
structure).�Effect of the depressurization rate. An example of the
effect of depressurization rate on the membrane
morphologies has been reported by Temtem et al.
[17] for polysulfone membranes. They verified that
higher depressurization rates produce larger pores.
Similar trends were obtained with all solvents used.
These observations are divergent from the results
obtained by Xu et al. [13] in the preparation of
poly-L-lactic acid (PLLA) membranes that found no
changes in membrane structure with different
depressurization rates. In any case, according to
Temtem et al. [17], when the depressurization is
performed, the polymer precipitation is already
occurred due to the continuous extraction of the
solvent. In a slow depressurization, the CO2 diffuses
slowly out of the polymer phase without affecting the
polymer structure. A quick depressurization of the
large amount of CO2 dissolved in the polymer should
result in a slight deformation of the existing pores
and, consequently, in the increase of the mean
diameter of the pores. The analysis of SEM images
of the membrane surface produced by these authors
confirms the above-mentioned explanation: fast
depressurizations tend to increase surface porosity
and promote the appearance of fissures in the mem-
brane top layer. Water flux through the membranes
increases by increasing the rate of the depressuriza-
tion. These results have not found confirmations in
other works; however, it is possible to suppose that
for some polymers SC-CO2 can also act as a foaming
agent during the depressurization. Indeed, it is
known from literature on SC-CO2-assisted foaming
00
5
10
15
20
DMSO
Acetone
THF
Cel
ls (
%)
Diameter (µm)10 15 205
Figure 8 Polymethyl methacrylate (PMMA) cell sizedistributions obtained operating at 35 �C, 25 MPa, and 25%
(w/w) and using different solvents.
Preparation of Membranes Using Supercritical Fluids 209

processes [39] that, if the depressurization tempera-ture is above the actual glass transition temperatureof the CO2/polymer mixture, nucleation and growthof gas bubbles inside the polymer can occur. Thisphenomenon can also interfere with the final mem-brane morphologies adding some differentpeculiarities to the post-phase-separation structure.�Effect of the addition of another polymer. Many studies
in the traditional phase-inversion process assumethat the incorporation of another polymer in thecasting dope is an effective method to manipulatethe morphology of the formed membrane andthereby to modify the membrane properties. Aninteresting example of investigation about this para-meter for SC-IPS process is the one reported byHuang et al. [23] in the case of formation of PVDFmembranes. They investigated the effect of PMMAcontent in the casting solution on the membranestructure. The casting solution was prepared by dis-solution of polymer (PMMA and/or PVDF) indimethylacetamide (DMAC) to form a solution con-taining 15% w/w of polymer.
By increasing the PMMA content in the startingsolution, the cell shape ceases to be spherical and thecell wall structure changes significantly. For purePVDF membranes, the cell wall is composed ofuniform spherulite particles. When PMMA concen-tration in the solution is above 4.5% w/w, the cellwall is composed by a continuous matrix. The mem-branes generated at 1.5% w/w of PMMA areintermediate between these two cases; that is, thecell wall is composed of a continuous matrix inwhich many spherulite particles are embedded.Moreover, as the PMMA content in the dopeincreases, the cell size becomes less uniform. In addi-tion, for the membrane produced from the solutioncontaining 4.5% w/w of PMMA, both the cell sizeand the porosity are larger than those of the mem-branes formed at other PMMA concentrations.Although PVDF content in the casting dope decreaseswith the increase of PMMA content, crystallizationstill occurs in the late stage of the phase-inversionprocess. This is evident from the DSC thermogramsof the membranes prepared from the casting dopes atdifferent PMMA/PVDF mass ratios [23]. The meltingpoint (Tm) of PVDF crystals decreases with increasingPMMA content in the dope. With the addition ofPMMA at 7.5% w/w in the casting dope, the crystal-linity decreases to 30%, indicating the inhibition ofcrystallization. Such a dramatic decrease in crystalli-nity is related to the good miscibility between PMMAand PVDF. These authors also found that when
PMMA content is below 4.5% w/w, the crystallinityof PVDF in all the membranes is higher than that oforiginal PVDF powder, indicating the occurrence ofCO2-induced crystallization.
Another example of incorporation of a secondpolymer in the starting solution is the one reportedby Kim and Lee [19] for formation of polycarbonate(PC) membranes. They investigated the effect ofpolyethylene glycol (PEG) concentration on poros-ity and tearing stress of PC membranes. Theseauthors found that porosity increases (from 65% to72%) and the density of membranes decreases (from1.19 to 1.14 g cm�3) with an increase of the initialPEG concentration from 10% to 30% w/w.
1.10.3.1.2 Application of the SC-IPS to
water-soluble polymers
The major drawback of the SC-CO2-assisted phase-inversion technique is the very limited affinitybetween CO2 and water at the ordinary process con-ditions; as a consequence, this process cannot be usedto produce membranes of water-soluble polymers(i.e., the majority of biopolymers). To remove theselimitations, Reverchon and Cardea [40] proposed thephase inversion of water-soluble polymers usingliquids expanded by SC-CO2. A SC-CO2 expandedliquid is a mixture that shows intermediate physicalproperties between liquids and SCFs obtained oper-ating at conditions above the CO2 critical point butbelow the mixture critical point. This process hasbeen applied to the production of PVA membranesusing expanded ethanol. In this manner, it is possibleto take advantage of the capability of the organicsolvent to solubilize large quantities of water and ofthe presence of SC-CO2 to confer near-critical prop-erties to the solution, even operating at very lowtemperatures with respect to the critical temperatureof the liquid solvent.
The feasibility of this process was demonstrated andthe analysis regarding the effect of process parameterson formation of PVA membranes and morphology wasperformed. Several ethanol:CO2 ratios (from 20:80 to80:20 w/w), PVA concentrations (from 10% to 30%w/w), temperatures (from 35 to 65 �C), and pressures(from 15 to 25 MPa) were tested. The obtained PVAmembranes were characterized by open cellular struc-tures with cell size ranging between 0.5 and 4 mm; denseor porous skins were obtained at different process con-ditions. An example of a membrane section obtained isshown in the SEM images given in Figure 9. Theseresults add further flexibility to the SC-IPS process,opening the process to the production of biopolymeric
210 Basic Aspects of Polymeric and Inorganic Membrane Preparation

membranes. Moreover, the selection of solvent/CO2
ratio as a process parameter gives one further possibility
of modulating the membrane morphology.
1.10.3.2 Loaded Membranes
PMMA porous membranes have been prepared using
the SC-IPS process and then they have been loaded
with an antibiotic, amoxicillin, using two different
techniques: dissolving it in the same organic solvent
used to solubilize the polymer or suspending the
drug in the organic solution formed by polymer and
solvent [24]. The obtained porous membranes, pro-
duced at various drug loading, were characterized by
SEM to study the morphology and cell size, and by
DSC to analyze the interaction of drug–polymer in
the structure.The presence of the suspended drug does not
interfere with the structure morphology (i.e., a
cellular structure is obtained as in the case of pure
PMMA [14]). Probably, it depends on the fact that
amoxicillin dispersed in the solution does not influ-
ence the type of mass transport mechanism occurring
during the phase separation. At larger drug percen-
tages, a relevant increase of cell size is observed. This
result can be related to two concurring effects: (1) the
increase of drug percentage is accompanied by a
decrease of the polymer percentage in the solution;
therefore, the quantity of polymer-rich phase
decreases (i.e., larger cells are obtained); (2) the pre-
sence of the drug influences the polymer-rich phase
solidification acting as an obstacle in the organization
of the solid phase.
The drug, initially dispersed, remains in this formduring the membrane formation process, since the
SC-IPS is an extremely fast process. SEM images of
these membranes support this hypothesis (Figure 10).Indeed, surfaces and cell walls present a distributed
irregularity (roughness) that was not observed in pure
PMMA structures. This result is due to the presence
of the drug; that is, amoxicillin is encapsulated inside
the polymeric structure. As the drug percentage
increased, the surface roughness also increases.Another important confirmation of the hypothesis
of drug encapsulation is obtained by DSC analysis.
Indeed, DSC can give qualitative and quantitative
information about the physicochemical status of the
drug in the polymeric structures. The thermograms
100 µm Mag: 500× Mag: 5000×10 µm
Figure 9 Cross section of a polyvinyl alcohol (PVA) membrane obtained at P¼20 MPa, T¼45�C, C¼10% w/w, and with an
ethanol:CO2 ratio of 60:40 w/w.
10 µm Mag: 5000×
Figure 10 High magnification of a polymethyl
methacrylate (PMMA) structure prepared using acetone,
containing 30% w/w of amoxicillin, (20 MPa, 45 �C, and80% (w/w) acetone); cell wall roughness is evident.
Preparation of Membranes Using Supercritical Fluids 211

of PMMA membranes obtained from acetone and
containing percentages of amoxicillin varying from
0% to 30% w/w are shown in Figure 11. The DSC
of pure amoxicillin is also reported for comparison.
The lowering of the melting temperature and
enthalpy of amoxicillin suggests an interaction due
to the formation of a physical mixture.DSC analysis suggests some interesting considera-
tions: first, it confirms the encapsulation of amoxicillin
inside the structure; second, it shows evidence that
polymer and drug maintained their physical charac-
teristics in the membranes; that is, the system behaves
as a physical mixture of two components and substan-
tially confirms the results of SEM analysis.The same authors also prepared solutions with
DMSO and a mixture formed by PMMA and amox-
icillin. Moreover, in this case, PMMA-connected
porous structures were successfully obtained. They
show a uniform yellow color that is characteristic of
amoxicillin, whereas, in the experiments with the
amoxicillin suspension, the color of the membrane
remained white. However, cell surfaces are smooth
for all drug concentrations tested. The DSC analysis
has been used again to compare the thermograms of
the PMMA membranes obtained from DMSO and
containing percentages of amoxicillin varying from
0% to 30% w/w. In this case, even at higher amox-
icillin percentages, the characteristic peak of
amoxicillin is not present in the thermograms.The membrane characteristics observed (color,
cell surface, and DSC analysis) show evidence that
the two procedures lead to totally different interac-
tions. In particular, when amoxicillin is dissolved
together with PMMA in the starting solution, it ishomogenously distributed inside the polymericmatrix, forming a solid solution. These authors alsoperformed some drug release experiments to verifythe efficiency of SC-CO2-assisted encapsulation pro-cess and to study the effect of the collocation of drugin the structure on the release kinetics. They per-formed experiments using the PMMA porousmembranes, obtained by starting from dissolved anddispersed amoxicillin with a content of 10% and 20%w/w of amoxicillin. Untreated amoxicillin dissolvescompletely in 10 min, whereas they observed anamoxicillin prolonged release of 20 h in the case ofthe dissolved drug PMMA membranes. No bursteffect was observed; that is, no initial fast release ofthe drug has been verified, which means that no drugis present in the outer layer of the structure. Theseresults agree with the previous considerations onSEM and DSC analysis confirming that amoxicillinforms a solid solution with PMMA.
In the case of dispersed drug, it dissolves comple-tely in 3 h. Moreover, an initial burst release wasobserved (from 0 to 25 min) indicating that, probably,in this case, part of the drug molecules are exposed atthe surface of polymer structure.
1.10.3.3 Membranes for ScaffoldingApplications
Another possible application of polymeric mem-branes is related to tissue engineering. Indeed,several tissues show a membrane-like structure.However, the substitution of different biologicalmaterials requires different scaffold characteristicsand they share a series of common peculiarities thathave to be simultaneously obtained [41, 42]:
• A high regular and reproducible three-dimensional(3-D) structure (macrostructure) similar to the oneof the tissue to be substituted.
• A porosity exceeding 90% and an open poregeometry that allows cell growth and reorganiza-tion; indeed, porosity and pore interconnectivitydirectly affect the diffusion of nutrients and theremoval of metabolic wastes.
• A suitable cell size depending on the specifictissue to be replaced. For example, in the regen-eration of bone tissues, cell sizes ranging between200 and 400 mm and up to 500 mm are commonlyindicated.
• High internal surface areas. The scaffold shouldbe not only highly porous and interconnected but
0
d
c
b
aH
eat f
low
End
o
Temperature (°C)
30 60 90 120 150 180 210
Figure 11 Thermograms of polymethyl methacrylate(PMMA) structures containing different percentages of
suspended drug: (a) PMMA, (b) 10% amoxicillin, (c) 30%
amoxicillin, and (d) amoxicillin.
212 Basic Aspects of Polymeric and Inorganic Membrane Preparation

should present nanostructural surface character-
istics that allow cell adhesion, proliferation, and
differentiation. The cells of different tissues, such
as bones, tendon, cartilage, cardiac valves, and
blood vessels, are submerged in a collagen matrix
with a fibrous structure having diameters ranging
between 50 and 500 nm. As a consequence, a
fibrous structure should be formed on the walls
of the scaffold to allow cell growth.
• Mechanical properties to maintain the prede-signed tissue structure. The correct values
depend on the organs to be repaired; for example,
a bone temporary scaffold should present a com-
pressive modulus of the order of 100 kPa.
• Biodegradability, biocompatibility, and a properdegradation rate to match the rate of the neo-
tissue formation. For this reason, the choice of
the polymer is very important because the bio-
degradability of the various polymers largely
varies from one polymer to the other.
Porous structures of PLLA were prepared using the
SC-IPS method by Tsiventzelis et al. [25]. The
uniform cross sections and the cellular pores of the
final samples indicated the occurrence of an L–L
demixing process, followed by crystallization of the
polymer-rich phase, as the dominant mechanism of
the phase separation and pore production. The aver-
age pore size decreased with the increase of CO2
density either by increasing the pressure or by
decreasing the temperature, whereas the average
pore diameter decreased with the increase of the
initial polymer concentration.The structures obtained using this approach have
various limitations. Indeed, it is very difficult to
obtain complex 3-D structures (i.e., usually films or
hollow fiber membranes are generated) and the pre-
sence of the rough nanofibrous internal structure,
which should mime the natural extracellular matrix
necessary to obtain a good cell adhesion and growth
(smooth cell walls are usually obtained).For these reasons, Reverchon et al. [26] tested a
new SCF-assisted technique for the formation of 3-D
PLLA scaffolds, which consists of three subprocesses:
the formation of a polymeric gel loaded with a solid
porogen, the drying of the gel using SC-CO2, and the
washing with water to eliminate the porogen.The PLLA scaffolds produced using this process
have the following characteristics:
1. Adequate internal structure. These properties areconferred to the scaffold by the original fibrous
nanometric substructure that is characteristic ofthe polymeric gel. The very porous structureobtained should also aid in the efficient removalof the porogen.
2. Accurate reproduction of the shape and 3-D struc-ture of the tissue to be substituted.
3. Controlled and large porosity (> 90%).4. Very large connectivity at micronic and nano-
metric levels.5. Very short processing time.6. Absence of solvent residues.
When PLLA gel drying is performed by SC-CO2, thesupercritical mixture formed during the process(solvent þ CO2) has no surface tension and can beeasily eliminated in a single step by the continuousflow of SC-CO2 in the drying vessel. The majorproblem in gel drying is the possibility of gel collapse.In this case, the absence of surface tension avoids thisproblem preserving the nanoporous structure. On theother hand, large interconnected cavities necessaryto mime the tissue to be replaced are completelymissing.
For this reason, the authors evaluated the possibi-lity of superimposing a microporous structure in theaerogel to obtain a scaffold. They proposed a hybri-dization of the supercritical drying process with theparticulate leaching. Indeed, it is possible to producelarge cells inside a polymeric matrix using a porogen,an insoluble compound, which is introduced into thepolymeric solution before the gelation. Theysuccessfully processed large and complex 3-D gelstructures (i.e., bone-shaped gels), confirming thepossibility of producing scaffolds with a specific geo-metry without size limitations and characterized byporosity of about 95%. Moreover, the overall processtime is about 4 h, whereas the traditional process (i.e.,freeze-drying) requires approximately 7 days.
Then, they optimized interconnection among thecells, increasing the pore connection by pressurizingat 1 MPa the suspension liquid polymer þ porogen,before gelation. This pressure is sufficient to inducethe contact among the porogen particles (i.e., fructose)that produces interconnection among the cells in thescaffold preserving the structure integrity. SEMimages are reported in Figure 12. In these images, itis possible to observe the cellular structure (inducedby porogen inclusion) and the nanofibrous substruc-ture (produced by the polymeric gel) characterizingnot only the polymeric network, but also the cells wall.In particular, fibers ranging between 50 and 400 nmadd further porosity and interconnectivity and
Preparation of Membranes Using Supercritical Fluids 213

produce the wall roughness that should be the key
factor for cellular adhesion and growth.Figure 12(b) is particularly significative in repre-
senting the structure of the cell walls. This image
confirms that the presence of porogen particles
during the gelation process did not influence the
nanoporous structure formation also on the surfaces
in contact with the porogen.The solvent residue present in the produced scaf-
folds obtained after 4 h of drying was 263 ppm, which
is lower than the limit of USP 467 Pharmacopea. By
increasing the drying process time up to 8 h, as
expected, solvent residue sensibly decreased down
to a minimum of < 5 ppm.The compressive modulus of some of the scaffolds
obtained was measured to verify if mechanical resis-
tance was compatible with the one required for bone
scaffolding application. Stress–strain analysis indi-
cated compressive modulus up to 81 kPa obtained
for 15% w/w PLLA scaffolds.
The inclusion of hydroxyapatite particles inside thepolymeric structure can modify the scaffold resistanceand improve the formation of an environment suitablefor bone cells growth; indeed, hydroxyapatite formsmore than 30% of the natural bones and can behave asa support for the structure, increasing the compressivemodulus. It also allows one to create an environmentthat better mimes the extracellular matrix. For thisreason, the authors loaded hydroxyapatite nanoparticlesinside the starting solution before the gelation.
As it is possible to observe from SEM image reportedin Figure 13, a modification of the scaffold morphologyis evident if compared to unloaded PLLA scaffold.Hydroxyapatite nanoparticles appear on the surface ofpolymeric fibers of cell wall, forming a hybrid particle–fiber cross-linked structure. Moreover, the scaffoldcompressive modulus, as expected, increases.
1.10.4 Conclusions and Perspectives
The SC-IPS process has substantially maintained thepromises demonstrating to be fast and capable toproduce membranes whose morphology can betuned through the proper selection of the processparameters. Organic solvents used in the processhave been rapidly and completely eliminated.
In the near future, we expect that SC-IPS will beextensively applied to hydrosoluble polymers andpolymer blends that have, at present, only beendemonstrated in terms of feasibility. Loaded mem-branes and scaffolds obtained by SCF-assistedprocesses are also promising applications that stillrequire a large experimentation.
(a)
(b)
100 µm Mag: 250×
200 nm Mag: 50 000×
Figure 12 Scanning electron microscopy (SEM) images
of the same part of a poly-L- lactic acid (PLLA) scaffold
obtained at different magnifications: (a) image of cavities;(b) enlargement of part of a cavity.
2 µm Mag: 10 000×
Figure 13 Scanning electron microscopy (SEM) image of
a hydroxyapatite loaded scaffold cell wall.
214 Basic Aspects of Polymeric and Inorganic Membrane Preparation

Comprehensive characterization of SC-IPS mem-branes is also required together with the targeting of
the various membranes toward specific industrial
applications. The scale-up of the process should
then be performed.
References
[1] Mulder, M. Basic Principles of Membrane Technology;Kluwer: Dordrecht, 1992.
[2] Lonsdale, H. K. J. Membr. Sci. 1982, 10, 81–91.[3] Pusch, W., Walch, A. Angew. Chem. Int. Ed. Engl. 1982,
21, 660–685.[4] van de Witte, P., Dijkstra, P. J., van der Berg, J. W. A.,
Feijen, J. J. Membr. Sci. 1996, 117, 1–31.[5] Binder, K. Materials Science and Technology, A
Comprehensive Treatment; VHC: New York, 1991; pp405–472.
[6] Cahn, J. W. Trans. Metal. Soc. AIME 1968, 242, 166–195.[7] Tompa, H. Polymer Solutions; Butterworths: London, 1956.[8] Reverchon, E., Cardea, S. J. Membr. Sci. 2004, 240,
187–195.[9] Matsuyama, H., Yamamoto, A., Yano, H., et al. J. Membr.
Sci. 2002, 204, 81–87.[10] Kho, Y. W., Kalika, D. S., Knutson, B. L. Polymer 2001, 42,
6119–6127.[11] Cardea, S., Gugliuzza, A., Schiavo Rappo, E., Aceto, M.,
Drioli, E., Reverchon, E. Desalination 2006, 200, 58–60.[12] Xu, Q., Pang, M., Peng, Q., Li, J., Jiang, Y. J. Appl. Pol.
Sci. 2004, 94, 2158–2163.[13] Xu, Q., Pang, M., Peng, Q., et al. J. Appl. Pol. Sci. 2005,
98, 831–837.[14] Reverchon, E., Schiavo Rappo, E., Cardea, S. Pol. Eng.
Sci. 2006, 46, 188–197.[15] Matsuyama, H., Yamamoto, A., Yano, H., et al. J. Membr.
Sci. 2001, 194, 157–163.[16] Reverchon, E., Cardea, S. J. Supercrit. Fluids 2005, 35,
140–146.[17] Temtem, M., Casimiro, T., Aguiar-Ricardo, A. J. Membr.
Sci. 2006, 283, 244–252.[18] Temtem, M., Casimiro, T., Aguiar-Ricardo, A., Mano, F. J.
J. Supercrit. Fluids 2008, 43, 542–548.[19] Kim, M. S., Lee, S. J. J. Supercrit. Fluids 2004, 31, 217–225.
[20] Reverchon, E., Cardea, S., Rapuano, C. J. Appl. Pol. Sci.2007, 104, 3151–3160.
[21] Reverchon, E., Cardea, S. Ind. Eng. Chem. Res. 2006, 45,8939–8945.
[22] Cao, J. H., Zhu, B. K., Ji, G. L., Xu, Y. Y. J. Membr. Sci.2005, 266, 102–109.
[23] Huang, S., Wu, G., Chen, S. J. Membr. Sci. 2007, 293,100–110.
[24] Reverchon, E., Cardea, S., Schiavo Rappo, E. J. Membr.Sci. 2006, 273, 97–105.
[25] Tsivintzelis, I., Pavlidou, E., Panayiotou, C. J. Supercrit.Fluids 2006, 40, 317–322.
[26] Reverchon, E., Cardea, S., Rapuano, C. J. Supercrit.Fluids 2008, doi:10.1016/j.supflu.2008.01.005.
[27] Reverchon, E. J. Supercrit. Fluids 1999, 15, 1–22.[28] Gauter, K. Fluid Multiphase Behavior in Ternary Systems
of Near-Critical CO2. PhD Thesis, Delft University, TheNetherlands, 1998.
[29] Reuvers, A. J. Membrane Formation: Diffusion InducedDemixing Processes in Ternary Systems. PhD Thesis,Twente University of Technology, The Netherlands, 1987.
[30] Kang, Y. S., Kim, H. J., Kim, U. Y. J. Membr. Sci. 1991, 60,219–232.
[31] Zhou, X. D., Zhang, S. C., Huebner, W., Ownby, P. D.,Hongchen, G. J. Mater. Sci. 2001, 36, 3759–3768.
[32] Williams, L. L. Removal of Polymer Coating withSupercritical Carbon Dioxide. PhD Thesis, Colorado StateUniversity Fort Collins, CO, 2001.
[33] Huang, F., Li, M., Lee, L., Starling, K. J. Chem. Eng. Japan1985, 18, 490–497.
[34] So, M. T., Eirich, F. R., Strathamann, H., Backer, R. W.Polym. Lett. 1973, 11, 201–215.
[35] Sedlacek, B., Kahovec, J., Eds. Synthetic PolymericMembranes; Walter de Gruyter: Berlin–New York, 1987;pp 141–194.
[36] Yao, C. W., Budford, R. P., Fane, A. G. J. Membr. Sci.1988, 38, 113–125.
[37] Radovanovic, P., Thiel, S. W., Hwang, S. T. J. Membr. Sci.1992, 65, 231–246.
[38] Strathman, H., Kock, K., Aimar, P., Baker, R. W. T.Desalination 1975, 16, 179–203.
[39] Reverchon, E., Cardea, S. J. Supercrit. Fluids 2007, 40,144–152.
[40] Reverchon, E., Cardea, S. J. Supercrit. Fluids 2008,doi:10.1016/j.supflu.2008.01.017.
[41] Liu, X., Ma, P. X. Ann. Biomed. Eng. 2003, 32, 477–492.[42] Ma, P. X. Mater. Today 2004, 7, 30–40.
Preparation of Membranes Using Supercritical Fluids 215

Biographical Sketches
Ernesto Reverchon is a full professor and the head of the Supercritical Fluids Research Group operating at theUniversity of Salerno. He is also the director of the Chemical and Food Engineering Department.
He developed several new processes (in some cases, up to the industrial scale) based on the use of super-critical fluids; his current research focuses mainly on new challenges in supercritical fluids, such asthe engineering of nanoparticles and nanocomposites for a controlled drug delivery in the human body andthe development of nanostructured scaffolds for tissue repairing.
He has more than 250 scientific publications on international journals and conferences; among them morethan 210 are related to SCF. He has 15 patents on supercritical fluid products or processes. Furthermore, he hasauthored one book and six chapters in international scientific books.
Prof. Reverchon is currently a member of the editorial board of the Journal of Supercritical Fluids (Elsevier)and has been guest editor of some issues of this journal; he has been guest editor of an issue of IEC Res. (2006).He has been invited or plenary lecturer at many international congresses; he is a referee of the AustralianResearch Council for the evaluation of research based on SCF.
Dr. Stefano Cardea obtained his PhD degree in 2006. His activity, in collaboration with Prof. Reverchon at theUniversity of Salerno, is devoted to different techniques assisted by SC-CO2 for the formation of porousmaterials: (1) SC-CO2 polymer foaming process; (2) SC-CO2 phase-inversion processes for membranesformation starting from polymeric solutions; (3) SC-CO2 gel drying process for membrane formation startingfrom polymeric gels; and (4) formation of nanostructured scaffolds for tissue repairing.
He has 12 scientific publications on international journals and he is also the co-author of one patent.
216 Basic Aspects of Polymeric and Inorganic Membrane Preparation

1.11 Basic Aspects in Inorganic Membrane PreparationA Buekenhoudt, A Kovalevsky, Ir J Luyten, and F Snijkers, Flemish Institute for Technological Research(VITO), Mol, Belgium
ª 2010 Elsevier B.V. All rights reserved.
1.11.1 Introduction to Inorganic Membranes 219
1.11.2 General Principles of Inorganic Membrane Synthesis 219
1.11.3 Powder Preparation 221
1.11.3.1 Introduction 221
1.11.3.2 Milling 221
1.11.3.3 Chemical Powder Preparation 222
1.11.3.3.1 Solid-state reaction 222
1.11.3.3.2 Wet powder preparation 222
1.11.4 Shaping 223
1.11.4.1 Introduction 223
1.11.4.2 Pressing 224
1.11.4.3 Slip Casting 224
1.11.4.4 Extrusion 225
1.11.4.5 Tape Casting 225
1.11.4.6 Suspension Techniques Coupled to Phase Inversion 226
1.11.4.7 Foam Techniques 228
1.11.4.7.1 The replication of a polymeric template 228
1.11.4.7.2 Direct foaming of a ceramic slurry 229
1.11.4.7.3 Miscellaneous techniques 230
1.11.4.8 Leaching Techniques 230
1.11.4.9 Techniques for Making Straight Pores 231
1.11.5 Temperature Treatment 231
1.11.5.1 Drying 231
1.11.5.2 Calcination 231
1.11.5.3 Sintering 232
1.11.5.4 Thermal Stability of Membranes 233
1.11.5.5 Thermal Treatment of Layers 233
1.11.6 Layer Deposition 234
1.11.6.1 The Multilayer Architecture 234
1.11.6.2 Powder Suspension Layers 235
1.11.6.2.1 Introduction 235
1.11.6.2.2 Dip and spin coating 235
1.11.6.2.3 Alternative coating methods 236
1.11.6.3 Sol–Gel Layers 236
1.11.6.3.1 Colloidal and polymeric sols 236
1.11.6.3.2 Drying and heat treatments 238
1.11.6.3.3 Silica and other metal oxides 238
1.11.6.4 Template-Mediated Layers 238
1.11.6.4.1 Introduction 238
1.11.6.4.2 Sharp pore-size distribution 239
1.11.6.4.3 Ordered porosity 239
1.11.6.5 Chemical Vapor Deposition 241
1.11.6.6 Carbon Layers 242
1.11.6.7 Zeolite Layers 242
1.11.6.8 Metal Layers 243
217

1.11.6.8.1 Introduction 243
1.11.6.8.2 Foil preparation and wrapping 243
1.11.6.8.3 Electroless plating 244
1.11.7 Functionalization 245
1.11.7.1 Hydrophobization 245
1.11.7.2 Catalytic Functionalization 246
References 247
Glossary
Calcination Thermal treatment of a green product
at relatively low temperature (typically <600 �C) in
order to remove the organic additives.
Critical thickness Maximum thickness limit to
form a defect-free thin inorganic layer on top of a
porous support. Above the critical thickness,
tensile stresses cause defects in the layer.
Electroless plating A nongalvanic method to form
a metal or metal alloy coating on a substrate
(without the use of external electrical power). In the
process, the substrate is submerged in an aqueous
solution of metal ions. A reducing agent (typically
hydrated sodium hypophosphite) is used to react
with the metal ions and to deposit metal.
Extrusion A wet inorganic shaping technique in
which a stiff plastic paste of an inorganic powder
and suitable additives is forced by high pressure
through an orifice or die, in order to form long
tubular-type shapes (the cross section does not
need to be circular).
Foam A sponge-like, very open porous structure
with pores typically in the range of a few hundred
micrometers up to a few millimeters.
Green product A dry article consisting of
inorganic particles shaped in a certain form, with
the aid of organic additives, before thermal
treatments. The mechanical strength of the green
shape is limited.
Phase inversion A wet shaping technique specific
for polymer and inorganic membranes suitable for
producing hollow fibers, capillaries, and flat sheets.
In the phase inversion process, a viscous
suspension consisting of a polymer powder,
organic additives, and eventually an inorganic
powder in a suitable solvent, is first shaped in the
desired form, and subsequently contacted with a
nonsolvent for the polymer. In the nonsolvent bath,
polymer-rich and polymer-poor phases are formed,
leading to a consolidation of the wet shape.
Replica technique A method in which an
inorganic replica is made from a polymeric shape,
by immersion of the polymeric shape into a
concentrated inorganic suspension, and
subsequent burning out of the polymer by a
suitable thermal treatment.
Shaping The fabrication step in which powders
are formed into useful shapes with the aid of
organic additives.
Sintering Thermal treatment of a green product at
relatively high temperature, leading to surface
diffusion of solid matter and neck formation
between the inorganic particles and to a partial or
complete densification.
Slip casting A versatile inorganic shaping
technique in which an aqueous slip of an inorganic
powder is poured into a porous mold (mostly
plaster), and left to dry.
Sol–gel process A process for forming
mesoporous and microporous inorganic layers,
converting a solution (sol) containing small
inorganic particles (colloidal sol) or inorganic
polymeric structures (polymeric sol) into a gel, by
removal of the solvent in the solution through
evaporation or through contact with a porous
support. The sol is formed by hydrolysis and
condensation of alkoxide or salt precursors in an
organic solvent with an appropriate amount of
water.
Solid-state reaction A reaction in which a mixture
of solid inorganic reactants is heated in order to
produce a new solid composition.
Tape casting A wet inorganic shaping technique
in which a pseudo-plastic suspension of an
inorganic powder and suitable additives is spread
out over a moving carrier with the aid of a blade or a
knife, in order to form thin flat shapes.
218 Basic Aspects of Polymeric and Inorganic Membrane Preparation

1.11.1 Introduction to InorganicMembranes
Inorganic membrane science and technology is thelatest developed field of membrane separation tech-nology, which, until recently, was dominated by theearlier developed polymer membranes. As is com-
mon for recent developments, the field of inorganicmembranes is still undergoing rapid change andinnovation. The strong evolution and growth of thefield account for the success of the dedicated
International Conference on Inorganic Membranes(ICIMs), initiated in 1989 in Montpellier, France,organized biannually, and alternately in the US,Europe, and Asia. The proceedings of these confer-
ences give a good overview of the field: the latestdevelopments, innovative ideas, new potential appli-cations, bottlenecks, state of commercialization,
industrial interest, etc.For most users, inorganic membranes are a rela-
tively new product. However, in fact, their
development started in the 1940s in order to enrichuranium for the Manhattan Project in World War IIand for the subsequently constructed nuclear powerplants [1]. This extensively used technology led to
the first commercialization of inorganic membranesin the early 1980s and involved membranes withpores in the micrometer range, dedicated for micro-filtration of liquids. Today, a wide variety of
inorganic membranes exist in the market, coveringnot only the whole range of liquid filtrations,including pervaporation, but also a whole range ofmaterials from different ceramics, over glass to
metals. The latest commercializations are a titaniananofiltration membrane with pores just below 1 nmand a Linde type A (LTA) zeolite membrane with
pores of 0.4 nm [2] (NF membranes commercializedby the German company HITK e.v. under thetradename Inopore�). Current research and devel-opment (R&D) efforts will lead to new membranes
in the market, on both sides of the pore-size spec-trum. On the one hand, there is a new R&Dfocusing on developing high-quality gas-separationmembranes, mainly driven by the trend toward sus-
tainable energy production. Among the potentiallyinteresting membranes are dense ion-conducting ormetal membranes, and zeolite and microporous car-bon membranes. On the other hand, macroporous
foams are developed intended for rough filtrationapplications, as bone scaffolds, or as efficient catalystsupports.
So far, commercialized membrane applicationshave been strongly (liquid separation) or exclusively(gas separation) dominated by polymer membranes.The share of inorganic membranes is currently esti-mated to be about 12% [3]. However, inorganicmembranes will have their share of the future growthof membrane technology, if their strong points, beingadvantages over the polymeric alternatives, can beused:
• Their relatively high thermal stability, compati-ble with high-temperature operations, andsuitable for real reaction–filtration integration,allowing therefore, for example, a shift of thereaction equilibrium as in membrane reactors.
• Their relatively high chemical stability and goodcorrosion resistance, compatible with highly aggres-sive media, allowing filtration in, for example,aprotic solvents that dissolve all currently exist-ing polymeric membranes; in addition, allowingvery aggressive cleaning, opening even econom-ical implementation of ceramic membranes indrinking water production from difficult surfacewaters.
• Their biocompatibility facilitating their use inhighly certified industries such as the pharmaceu-tical and food industry.
• Their noncompactability under high pressure,allowing application at more moderate pressuresand without lengthy pretreatments.
• Their mechanical strength.
• Their long lifetime.
However, inorganic membrane production isintrinsically more expensive and complicated.Inorganic membrane applications will thereforemainly be found in those fields where polymermembranes cannot or do not perform well. It isalso to be expected that the more aggressive situa-tions (temperature and chemicals), in whichinorganic membranes have great potential, willalso call for clever solutions for suitable moduleconstruction (e.g., higher surface-to-volume ratio)and appropriate sealing (e.g., high-temperaturegas-tight sealing).
1.11.2 General Principles ofInorganic Membrane Synthesis
Despite the wide pore-size range of all existinginorganic membranes, their synthesis shows somecommon aspects.
Basic Aspects in Inorganic Membrane Preparation 219

All synthesis starts from suitable powder prepara-tion from precursor material. Subsequently, these
powder particles are packed in a green product with
a certain shape (flat or tubular). This can be done by
wet or dry shaping techniques, facilitated by using
one or more organic additives (in the role of binders,
dispersants, and plasticizers). After shaping, the
synthesis involves one or more heat treatments. A
temperature treatment at relatively low temperature
is required in order to remove the organic additives
(calcination), and to consolidate the particle packing
in the green product by initial neck formation
between the particles (presintering). The pore size
that can be obtained in this processing depends on
the particle size of the starting powders, and is there-
fore limited to a minimum of about 0.1 mm. For
denser membranes, a treatment at higher tempera-
tures (sintering) follows, thereby causing serious
material movements leading to a partial or complete
densification of the green product. This sintering
process gives the shaped article also its full mechan-
ical strength.As a result of these synthesis steps, in principle,
membranes with a wide variety in pore sizes can be
made. However, to make both porous and dense
membranes suitable for real applications, all com-
mercial and commercially interesting membranes
always consist of a multilayer composition in which
a coarse-porous support provides the necessary
mechanical strength, and the porous or dense top
layer is responsible for the separation aimed at. One
or more intermediate layers between support and top
layer take into account a gradual decrease of the pore
size in the multilayer composition. Figure 1 shows a
scanning electron microscopy (SEM) picture
revealing the typical multilayer structure of an inor-
ganic membrane. In this manner, the membranes can
combine a high flux and a high separation factor. The
coarse-porous supports are fashioned as described
above. The dense or fine-porous membrane layers
coated on the porous supports are produced using
other specific techniques. Layers with big mesopores
can be produced from colloidal powder suspensions,
whereas layers with meso- and micropores are pro-
duced by sol–gel techniques or chemical vapor
deposition (CVD). Particular techniques exist for
microporous carbon and zeolite layers. The dense
or fine-porous membrane layers also require a tem-
perature treatment similar to that of the coarse-
porous supports in order to consolidate their
microstructure.In specific cases, the formed inorganic membranes
are further functionalized by chemical modification
of the membrane surface. This functionalization is
used in order to either change the affinity of the
membrane surface, or obtain catalytically active
membranes.This general scheme for inorganic membrane
synthesis, which also clarifies the structure of this
chapter, is shown in Figure 2.This chapter gives a concise but broad overview
of the different aspects of the state-of-the-art inor-
ganic membrane synthesis. For more extended
treatments in the literature, the reader is referred to
three excellent books: Inorganic Membranes
Characterisation and Applications [4], Fundamentals of
Inorganic Membrane Science and Technology [5], and
Inorganic Membranes for Separation and Reaction [3].
Other interesting references are provided as well.
However, this chapter also focuses particularly on
Polymeric toplayer(anatase)
Colloidal interlayers(anatase)
Main support(α-Al2O3)
Figure 1 Scanning electron microscopy (SEM) picture of a titania nanofiltration membrane showing the typical multilayer
structure of an inorganic membrane. Reproduced with permission from Van Gestel, T., Vandecasteele, C., Buekenhoudt, A.,
et al. J. Membr. Sci. 2002, 207, 73–89.
220 Basic Aspects of Polymeric and Inorganic Membrane Preparation

the new trends, the recent developments, and theinnovations related to membrane preparation in thishighly evolving field.
1.11.3 Powder Preparation
1.11.3.1 Introduction
The starting powders for inorganic membranes arehigh-purity specialty chemicals. Powder preparationis a crucial step in the fabrication of inorganicmembranes. High-purity, submicrometer powderswith controlled physical characteristics, such asparticle size, and, preferably, narrow particle-sizedistribution, are required for good membranepreparation. The characteristics of the inorganicpowders used have a significant effect on the subse-quent processing route and on the quality of the finalmembrane. Therefore, the proper choice of a powdersynthesis method is an important task, especially forfine-porous or dense membranes.
The particle size (and, to some extent, the mor-phology) is an important parameter in membranepreparation, because it affects the porosity (or den-sity) and the pore size of the final membrane. Forporous membranes, when only neck formation
between the packed particles takes place, the ratioof pore size to grain size is about 3 (the exact ratiodepends on the particle shape). For dense mem-branes, small-size starting particles with anappropriate size distribution, which lead to a max-imum packing density and final density, are essentialto give complete densification in the sintering step.Moreover, as explained in Section 1.11.5, therequired sintering temperatures to achieve completedensification in the case of small particles are muchlower. Densification can also be improved by intro-ducing sufficiently small-sized particles into apacking of large particles.
To obtain high-quality top layers, the particle sizeand particle-size distribution of the support areimportant as well. The pore size of the supportmust be adapted to the grain size of the layer to bedeposited. The presence of large pores on the surfaceof the support could lead to penetration of the grainsinto the support and thus, to defects in the subse-quent membrane layers. Defects can equally beformed by extra-large particles present on the surfaceof the support.
1.11.3.2 Milling
Good powder preparation commonly involves oneor more mechanical milling steps in order toprovide the breakdown of agglomerates and to adjustthe particle size and particle-size distribution.Currently, a variety of mills can be used, includingball mills, roller mills, and attrition mills [6]. Themost widely used are ball mills, utilizing the energyof balls which move in a jar and crush the agglomer-ates. Ball mills can, in turn, be categorized dependingon the method used to impart the motion to the balls(e.g., vibration, tumbling, and agitation). The mainadvantages of this method include low cost andapplicability to different kinds of membranematerials, whereas the main disadvantage is theincorporation of impurities from the mill andthe milling medium into the powder. This can beavoided by the use of fluid-energy mills, wherethe powder is entrained in two impinging streamsof high-velocity air so that particles are broken up byimpact. Incorporation of impurities can also bereduced by lining the mill chamber with a plastic orceramic material and by using ceramic stirrers andgrinding medium.
In recent years, there has been growing interest innew techniques such as high-energy milling (alsonamed mechano-chemical synthesis or mechanical
Powder preparation
Shaping
PressingSlip castingExtrusionTape castingSuspension spinningFoam techniquesLeaching techniquesTechniques for straight pores
FunctionalizationHydrophobizationCatalytically active coating
Powder suspensions layersSol–gel layersTemplate-mediated layersChemical vapor depositionCarbon layersZeolite layersMetal layers
Layer deposition
Temperature treatment
DryingCalcinationSintering
MillingChemical powder preparation
Figure 2 General scheme for the preparation of inorganic
membranes.
Basic Aspects in Inorganic Membrane Preparation 221

activation) [7]. It involves high-intensity vibratorymilling for an extended period of time, leading tochemical interactions between the components and,as such, the formation of the final product having thedesired composition and particle size at the sametime. This method is most suitable for producingmaterials that are otherwise difficult to make(e.g., silicides and carbides). The incorporation ofimpurities is, however, much more severe than forconventional milling.
1.11.3.3 Chemical Powder Preparation
A variety of chemical methods is being used for thepreparation of high-quality inorganic powders.Several reviews of the subject are available in theliterature [6–8]. With respect to inorganic mem-branes, the solid-state reaction route and synthesisfrom liquid solutions (precipitation and sol–gelmethods) are considered to be the most appropriate.The most important methods are described in thefollowing subsections.
The production of inorganic membrane powdersby vapor-phase reaction is less frequently used. Inthis process, reactant gases are mixed and heated tonucleate and grow particles from the gas phase. Forthe reaction, a number of different heat sources canbe used, such as a direct-current or induction-coupled plasma, a laser, or a furnace.
1.11.3.3.1 Solid-state reaction
The solid-state reaction route involves chemicaldecomposition reactions, in which a mixture ofsolid reactants is heated to produce a new solidcomposition and gases. This method is commonlyused for the production of complex oxides fromsimple oxides, carbonates, nitrates, hydroxides, oxa-lates, alkoxides, and other metal salts. Usually, theprocedure includes several annealing steps with mul-tiple intermediate milling steps to increase thehomogeneity of the mixture, and to decrease theparticle size of the powder. Extra milling alsomakes the powder more active in the subsequentheat-treatment steps (i.e., more sinter active). Thesolid-state route is relatively inexpensive andrequires simple apparatus. Moreover, large volumesof powder can be prepared in a relatively simplemanner. However, compared to the wet powder pre-paration routes described below, the obtainedpowder shows relatively high agglomeration, and,therefore, relatively large particle size as well asrelatively limited homogeneity.
1.11.3.3.2 Wet powder preparation
The disadvantages of the solid-state reaction can beovercome by using liquid preparation methods, gen-erating powders either by precipitation or by sol–gelprocesses. These methods offer a better control of thepurity, chemical composition, and, in particular, theparticle size. They involve a solvent removal step(e.g., filtration, centrifugation, and evaporation) and,eventually, a heating step to achieve the desired crys-tallinity. The production cost of these methods is,however, relatively high, and large-scale productionis difficult.
Usually, the precipitation of metal cations is per-formed using oxalate, hydroxide, carbonate, citrate,acetate, or cyanide ions from aqueous solutions. Thechoice of the precipitating agent depends on thecomposition of the target material, taking intoaccount the solubility of the precipitates. In additionto conventional precipitation, a number of otherprecipitation processes can be used, including pre-cipitation under pressure (hydrothermal) andsimultaneous precipitation of more than one cation(coprecipitation). Hydrothermal precipitation (oftenfrom hydroxides) can produce mixed cation precipi-tates and can precipitate oxides directly, whereasconventional precipitation usually produces hydro-xides or salts, which must be heat treated to formoxides. Coprecipitation is used for many advancedmultication powders to obtain more intimate mixingof the cations than can be achieved by mixing oxidesor salts of the individual cations. Because of theintimate mixing produced by coprecipitation, thetemperature required to produce the desired crystal-line phase in the powder is usually lower than formixtures of individual oxides.
In case fine particles and, especially, a good che-mical homogeneity are required, a few methodsutilize the formation of a gel or a high-viscosityresin from liquid precursors as an intermediate stepin the synthesis of ceramic powder. Sol–gel proces-sing may include the formation of a polymeric gel bythe hydrolysis, condensation, and gelation of a metalalkoxide solution, followed by drying and groundingto produce the powder. In the Pechini method, fromstarting materials, the metal ions are complexed in anaqueous solution with carboxylic acids, such as citricacid; subsequently, they undergo polyesterificationunder heating with a polyhydroxy alcohol, and,after the removal of the excess liquid, form a resin.The resin is then heated to decompose the organicconstituents, ground, and heat treated to produce thedesired powder. The citrate gel method includes the
222 Basic Aspects of Polymeric and Inorganic Membrane Preparation

formation of a viscous liquid containing polybasicchelates between metal cations and citric acid, heat-ing in vacuum to form an amorphous solid, andsubsequent pyrolysis in air at elevated temperaturesto produce a crystalline powder. The glycine–nitrateprocess is one of the general classes of combustionmethods for the preparation of ceramic powders. Ahighly viscous mass formed by evaporation of a solu-tion of metal nitrates and glycine is ignited toproduce the powder. In this case, a short exposureto high temperatures during the ignition step pro-vides the very fine size and crystalline nature of thepowder.
Preparation of membrane materials in a fine par-ticulate form can also be achieved by special thermaltreatment of a precursor liquid solution, for example,spray drying or plasma spray drying [9] and spraypyrolysis [10] or freeze drying [11].
1.11.4 Shaping
1.11.4.1 Introduction
The fabrication step in which powders are formedinto useful membrane shapes is called shaping or,alternatively, green forming. A wide variety of pro-cesses, wet and dry, can be used for shaping. Many ofthem are common techniques in the production oftraditional or other advanced inorganic materials,and are useful for all different inorganic materialtypes, namely, ceramics, metals, and glasses.
In all these techniques, organics, in large or smallquantities, are added to the powder to facilitate theshaping process. In the wet-shaping techniques, a slipor paste is first formed by adding solvents (water orothers) and other organic additives to the powder.The amount of organic additives is kept as low aspossible. Additives are required to obtain the desireddispersity of the powder particles in the slip/paste,and the desired rheology of the slip/paste, and toavoid deflocculation. Binders are used to providecohesion between the powder particles, to give ade-quate green strength, and to avoid crack formation.The pH of the slip/paste is often controlled in orderto steer the degree of flocculation of the powder.Moreover, the slip/paste has to be mixed carefully,and subsequently degassed to remove any entrappedair before fabrication in order to avoid flaws formedon the surface of the final product. The slip/pastepreparation is crucial for every shaping process andrequires optimization of a number of factors, includ-ing viscosity, solid content, slip/paste stability,
casting rate, drying rate, and drying shrinkage. Allthis involves an understanding of the surface chem-istry of the particles in the slip. Since each powderreacts differently, good slip/paste preparation is avery empirical process. Moreover, it is important tonotice that, although all the organic additives areremoved in the subsequent thermal treatments andthe powder of choice is the only remaining constitu-ent in the final product, these organic ingredients,nevertheless, codetermine the final quality of themembrane formed. In order to optimize the finalmembrane material, a good characterization of theslip/paste can be of importance. Different techniquessuch as particle-size measurements, zeta potentialmeasurements, and viscosity measurements can beused.
After shaping, the subsequent thermal treatmentsdetermine the final porosity of the membrane (seeSection 1.11.5). In the case of low-temperature calci-nation and presintering, the particle size of thepowder used determines the porosity. If the particlesare packed densely and only necks are formedbetween the particles by the heat treatment, thepore size is typically about one-third to one-fifth ofthe particle size (the exact factor depends on theparticle shape). Consequently, the pore size is typi-cally limited to about 0.1 mm, although nanopowders,in principle, could lead to nanometer pores [12]. Theformed coarse-porous bodies are commonly used assupports for further coatings and subsequent forma-tion of finer-porous or dense membranes (Section1.11.6). In case the temperature treatment involves acarefully performed high-temperature sintering, thegreen products can also be turned into fully densemembranes (see Section 1.11.5). However, as theso-formed dense membranes are, in most cases, rela-tively thick, these membranes are mainly used forlaboratory tests and are of no commercial interest.
It has become very clear that the surface quality ofthe support is very important in order to be able toform high-quality multilayer membranes. This is dueto the fact that defects or irregularities in the supportusually produce defects in the layers coated on top ofit. The necessity of a good-quality support is mostimportant when microporous or dense membranes isthe final product. Defects can be extra-large pores orbroken out grains. Surface irregularities causing sur-face roughness are detrimental, although someroughness can be flattened by sufficiently thicklayers.
In the following subsections, a short overview ofthe shaping techniques that are currently used for
Basic Aspects in Inorganic Membrane Preparation 223

membrane fabrication is given, the details of whichcan be found in References 3–5. For recent adapta-tions of the described methods and innovativeapproaches, the reader is referred to the publishedliterature cited elsewhere in the text.
1.11.4.2 Pressing
Powder pressing (or die pressing or compaction, uni-axial pressing or compaction of powder or granules)is a cheap industrially important process, alreadyused for a longtime, and used as a production stepfor many classes of materials. As such, powder press-ing is a shaping technique that is also applied for thefabrication of ceramic and metallic membranes. It isbelieved that there is still scope for improvement,for example, by computer modeling of the powder-compaction process [13, 14].
Powder pressing uses a metal die (mostly har-dened steel or eventually a more wear-resistantalloy) to compact dry or slightly humid powders.Disks, pellets, and cylinders are the most-used diegeometries. The pressures applied strongly dependon the powder or mix to be compacted, and can varyfrom a few tens of MPa to several hundreds of MPa.The use of high pressure not only ensures thestrength of the green body but also reduces shrinkageduring the subsequent heat treatments. The presenceof a few percent of water allows one to work withreduced pressures, compared to completely drypressing. Often, a little amount of binder is added inorder to reduce friction, minimize the wear of tool-ing, and give a more homogeneous densitydistribution as well as a higher quality of the greencompact.
The maximum obtainable ratio of height to dia-meter of a compact is recognized to be a majorlimitation of standard powder die compaction. Thisis due to pressure differences and resulting inhomo-geneous density distribution for relatively long diecavities. Uneven pressure distribution is also a reg-ular cause of cracks in pressed bodies. One way tocircumvent all these bottlenecks is by using coldisostatic pressing (CIP). In CIP, the loose powder isplaced in a flexible rubber mold (with eventually asteel mandrel in its center in order to make tubularshapes). The rubber mold is submerged in the liquidin a thick-walled pressure vessel. Characteristic toapplying the pressure through the fluid is that theforces applied to a submerged body is equal in alldirections.
Powder pressing (standard pressing and CIP) isused in the fabrication of both fully dense membranesand porous membranes, depending on the subse-quent temperature treatment (Section 1.11.5). Theporous membranes can also be used as supports forfurther coating (Section 1.11.6). Porous membraneshave also been made by compaction of a mixture ofan inorganic powder and a pore former (e.g., graphiteor starch). By applying a two-step process, pressingcan also be used to form asymmetric membranesconsisting of a dense top layer on a porous supportthat can be cosintered [15].
However, pressing has mainly been used to makemembranes for laboratory coating and other labora-tory tests; it has not been used for the fabrication ofcommercial membranes.
1.11.4.3 Slip Casting
Slip casting is a very economical and traditionalshaping process for ceramics, in which the startingpowders are suspended in water to form the slip.From the slip, green shapes are formed by pouringthe slip into porous molds mostly made of plaster.The capillary action of the porous mold draws waterfrom the slip and forms a solid layer on the inside ofthe mold. After pouring out the excess slip, theformed part is partially dried in the mold to cause itto shrink away from the mold and to develop ade-quate rigidity for further handling. The final strengthand porosity are reached by subsequent thermaltreatment (Section 1.11.5).
Although many complex shapes are possible withslip casting (e.g., main process to form sanitary ware),in the inorganic membrane synthesis, this process ismainly used to form flat or single tubular ceramicmembranes (dense as well as porous, depending onthe subsequent thermal treatment).
As mentioned before, in case the resulting greenshape after thermal treatment is used as a support forfurther coating (Section 1.11.6), the quality of thesurface is very important. Surface irregularities caus-ing surface roughness can hinder the coating of adefect-free and thin top layer. In order to obtainbetter supports with smoother surfaces, the methodof slip casting can be combined with centrifugation,specifically for tubular supports. The result of thiscentrifugal slip casting is a much better packing of thepowder in the support layer [16]. In this method ofcentrifugal casting, a cylindrical mold is filled withthe slip, and rotated around its central axis. Theparticles will then start to move toward the cylinder
224 Basic Aspects of Polymeric and Inorganic Membrane Preparation

wall and form a cast with increasing thickness. Thecentrifugal forces cause the largest particles to moveto the mold wall first, followed by the smaller parti-cles. The quality of the outside surface of the tube isdetermined by the surface quality of the mold, whilethe inside surface quality is determined by the slipquality and consists of the smallest particles in theslip. In order to combine the high surface quality ofthe tubes with good strength and high permeability,the particle size of the used powder and the tempera-ture treatment is important. For further optimization,a multilayer centrifugal casting or the casting of a slipusing a mixture of powders with different particlesize can be used [17].
1.11.4.4 Extrusion
Extrusion is a green-forming technique used to formtubular shapes. It has been used for all inorganicmaterials (e.g., metals, ceramics, and glasses) and toform a wide variety of tubular shapes: single tubes,multichannel tubes, monolithic honeycomb tubes,and capillaries. Extrusion is a process in which astiff plastic paste is forced by high pressure througha suitably shaped orifice or extrusion die. The plas-tic paste is strong enough to maintain its physicalintegrity after shaping by the die, even in the greenstate (before drying and thermal treatment). It isalso possible to extrude a double-layer structurewhere the two layers are made of particles of differ-ent sizes in one step.
The final strength and porosity of the shapedtubes are again determined by the subsequent ther-mal treatments (Section 1.11.5). Likewise, both fullydense membranes and porous membranes or supportscan be produced in this manner.
Extrusion is the common process used to makethe supports of all commercially available tubularinorganic membranes. Figure 3 gives an overviewof some of the different tubular designs that are inuse today. As regards materials, mainly �-aluminais used, and some cordierite (2MgO?2Al2O3?5SiO2),mullite (3Al2O3?2SiO2), silicon carbide, siliconnitride, etc., as well as metals, such as stainlesssteel, are used. In the past decade, some titaniasupports also have become available [18, 19] dueto their extra-high corrosion stability and highbiocompatibility.
Extrusion can also be used to make tubes withsmall diameters: capillaries [20]. The term capillaryis normally used for tubes with a diameter between0.5 and 5 mm. Tubes with a inner diameter smaller
than 0.5 mm are commonly called hollow fibers.However, both terms (hollow fibers and capillaries)are not always used as consequently as describedhere. With their small dimensions, the small-diametertubular designs are also extra valuable for membranes,since they give the potential of high packingdensities, or, in other words, they lead to very highsurface-to-volume ratios (>1000 m2 m�3) of mem-brane installations, which is also the reason for thehigh success of capillary and hollow fiber polymermembranes. Capillaries can also be made by usingsuspension-spinning techniques, which are exten-sively used in polymer membrane synthesis as well.This technique is described briefly in Section 1.11.4.6,and the difference with the extrusion technique is alsoexplained.
1.11.4.5 Tape Casting
Tape casting, also known as the doctor bladingtechnique, has been advanced since the end ofWorld War II as the best way to form thin, flat,large-area ceramic or metallic articles. Tape casting
(a)
(b)
Figure 3 Overview of some of the different tubular
designs for inorganic supports, in use today. (a) The tubular
designs as produced by HITK e.v. (b) The tubular designs as
produced by Tami Industries.
Basic Aspects in Inorganic Membrane Preparation 225

is a well-established practice for making ceramicsubstrates in microelectronics [21]. The possible
thicknesses are in the range of 0.01 to a few milli-
meters. Such parts can impossibly be obtained by
pressing or extruding. It is a wet-shaping technique
that uses a tape cast suspension with mostly pseudo-plastic properties. The suspension is constituted from
the inorganic powder chosen, several organic addi-
tives, and a liquid medium.A typical tape casting process is depicted in
Figure 4. The heart of the process is the so-called
doctor blade that acts as a knife, spreading out thetape cast suspension over a moving carrier film. After
spreading over the carrier film, a drying installation
is foreseen. The drying rate can be crucial to the
success of making a crack-free membrane. In the
process, two major forces act upon the suspension.First, there is gravity-inducing pressure flow: the
height of the liquid column in the reservoir behind
the doctor blade forces the suspension to flow from
the gap underneath the blade. This flow is also
known as pressure flow. Second, and more impor-tantly, the moving carrier film leads to drag flow. In
typical conditions of tape casting, this force exceeds
the pressure flow by one order of magnitude.
Therefore, next to the suspension properties, the
gap height under the doctor blade and the speed ofthe carrier relative to the doctor blade are important
variables in a tape cast process.Tape casting can be used not only to make self-
supported thin shapes, but also to coat on top of a
previously formed support. Again, both porous and
dense supports and layers can be fabricated. Forinstance, tape casting is typically used to make both
the dense electrolyte layer, and the porous anode for
solid oxide fuel cells [22].In the past decade, much effort has been made on
developing water-based tape casting using water andnatural products as alternatives for the frequently
toxic solvents and binders, driven by environmental
concerns. However, from the viewpoint of processcontrol, solvent-based tape casting is often consideredto be a better choice over water-based tape casting.
1.11.4.6 Suspension Techniques Coupledto Phase Inversion
As described in Section 1.11.4.4, tubes with a smalldiameter (<5 mm), commonly called capillaries andhollow fibers, can be fabricated by extrusion.However, there is another versatile technique tomake these small-diameter tubes, that is, suspensionspinning coupled to phase inversion. This method isa variant of the commonly used method to makepolymer hollow fiber and capillary membranes (seeChapter 1.05). It has the potential of making tubeswith much smaller diameter than extrusion: hollowfibers with outer diameters <0.5 mm can be easilyproduced. For making ceramic membranes, thismethod is useful for making porous membranes[23]. In order to make dense membranes, thetechnique was first used by our institute (FlemishInstitute for Technological Research (VITO)), pri-marily to make high Tc superconducting wire [24],and, a few years later, to make ionic-conductingdense membranes [25, 26]. Currently, the method isused in many laboratories.
In spinning, a viscous suspension of the inorganicpowder and organic additives (and not a stiff plasticpasted) as used for extrusion is shaped into a capillaryor hollow fiber. Analogous to extrusion, the suspensionis forced through a die, typically a tube-in-orificecalled spinneret. Figure 5 shows a scheme of a typicalspinning apparatus, and a schematic representation ofthe spinning head. The spinning rate of the suspensionis controlled by nitrogen pressure or a gear pump,commonly extra adjustable by a valve. Due to therelatively low viscosity of the suspension used, thegreen fiber after the shaping is very fragile and theshape is only properly consolidated in a nonsolvent
Figure 4 Schematic representation of a typical tape casting process.
226 Basic Aspects of Polymeric and Inorganic Membrane Preparation

coagulation bath by a phase-inversion process. This isin contrast to the standard extrusion process where thegreen extruded tape has substantial physical integrityby itself. Due to the inadequate strength of the greentubular shape, it is also necessary to run a liquidthrough the inside opening of the spinneret (boreliquid) while the small-diameter tubes are formed, inorder to create a hydrostatic pressure on the inside ofthe tube and to prevent collapse of the tube. Usually, acoagulating liquid is used as bore liquid.
Because of the necessity of the phase-inversionprocess, the spinning suspension contains specific cou-ples of polymer and solvents giving rise to a phase-inversion process in a specific nonsolvent. During thephase-inversion process, a solid polymer-rich phaseforms the membrane structure and a liquid polymer-poor phase forms the pores. These are the typicalpolymer/solvent/nonsolvent trios used in polymersynthesis, which are used for producing inorganic
membranes. One such very useful trio is the combina-tion polysulfone/N-methyl-pyrrolidone/water. Fromthis, it is clear that the organic additives typicallyused in extrusion are very different from the organicadditives used in suspension spinning.
Another difference between suspension spinningand extrusion products is their morphology. Thegreen shapes made by the extrusion process possess ahomogeneous structure over the cross section of thehollow fiber or capillary. In contrast, the green shapes ofthe spinning process can show both a homogeneousstructure or a very asymmetric structure containinglarge finger-shaped pores on the one side, and a thindense layer on the other side, as can be seen in Figure 6.The exact microstructure depends on the details of thespinning process. The asymmetric structures are typicalfor the spinning process and are also commonly seen inpolymeric hollow fibers. The possibility of producingasymmetric structures in one step can be a great advan-tage for membrane preparation. Indeed, in this manner,a multilayer structure is prepared in one step. Of course,for commercially interesting membranes, mechanicalstability is also important, and the finger-shaped porescan be undesirable, in which case a more homogeneousstructure will be preferred.
All aspects important in suspension spinning ofinorganic membranes, that is, the preparation ofgood spinning suspension, the parameters importantfor the spinning process and the phase-inversionprocess, and possible pore structures of the finalproducts, are extensively explained in Chapter 1.12.
This same method can also be used to make flatmembranes [25, 26]. In this case, a doctor-blade shap-ing technique, as in tape casting (see Section 1.11.4.5), isused in combination with phase inversion in a coagu-lating bath. The same technique is also extensively
Coagulation bath
Nonsolvent
Air
Pump
Suspension
SuspensionLumen liquid
Spinning head
Rinsing bath
Figure 5 Scheme representing a typical spinning
apparatus to make hollow fibers and capillaries using a
phase-inversion technique.
(a) (b)
10 μm 100 μm
Figure 6 Scanning electron microscopy (SEM) pictures of inorganic hollow fibers made by suspension spinning coupled to
phase inversion. (a) A microstructure with finger-shaped pores; (b) a homogeneous microstructure.
Basic Aspects in Inorganic Membrane Preparation 227

used to make flat polymer membranes on a commercial
scale. The suspension is similar as for the shaping of
hollow fibers and capillaries. This suspension is again
different from the paste that is normally used for tape
casting. The differences are similar to the differences
between an extrusion paste and a spinning suspension,
as previously described in this section.
1.11.4.7 Foam Techniques
Foams are very open porous structures with pores
typically in the range of a few hundred micrometers
up to a few millimeters. Foams can also be made
of inorganic materials as ceramics. They are
lightweight materials which can be described as a
three-dimensional (3D) network of struts made of a
ceramic material and hollow polygons with or with-
out windows. Such a network of cellular structures is
characterized by a number of parameters, such as cell
size and morphology, strut thickness and length, and
porosity and type of porosity (open vs. closed). As
such, these materials combine properties related to
their cellular structure and the ceramic material
making up the struts. By choosing the proper ceramic
materials and processing methods, the ceramic foams
can combine their very high porosity with a relative
high mechanical strength, and, being ceramics, have
the additional advantage of chemical inertness and
high-temperature resistance. Moreover, due to their
low density, low thermal conductivity, thermal shock
behavior, and large surface area, such materials are
highly desirable for a wide range of other engineering
applications next to membranes [27, 28].Ceramic foams are rather recent membrane
types. They have specific potential for filter appli-
cations in molten metals to filter out inclusions, as
particle (e.g., soot) filter trapping the particles in the
depth of the whole porous structure, and as support
of catalysts with high and easily available specific
surface [29–32].As for other inorganic membranes, the synthesis of
ceramic foams, in general, comprises three process
steps: the appropriate powder preparation, shaping of
a powder suspension, and temperature treatment. A
wide range of specialized shaping routes has been
developed. Basically, two main techniques are used
with a series of variations on the basic theme: the
replication of a polymeric template and direct foam-
ing of a ceramic slurry. Some less spread techniques
are summarized under Section 1.11.4.7.3.
1.11.4.7.1 The replication of a polymeric
template
The replica technique (or polymeric sponge method)
[33–36] consists of the immersion of a polymeric
sponge in a ceramic or metallic suspension with a
solid content usually between 50 and 70 wt.%. The
impregnated polymer support is removed from the
slurry and the excess material is squeezed out by
means of a rolling mill. After drying and a thermal
treatment that will burn out the polymer and other
organic substances (at about 500 �C), the particles are
sintered and the ceramic skeleton is obtained. The
skeleton thus obtained will be a close replica of the
polymeric template, considering the shrinkage linked
to the firing step. A reticulated polyurethane (PU)
foam is mostly used; however, other polymers, such
as polyvinylchloride, polystyrene, and cellulose, can
be used as well. Figure 7 shows an example of a foam
structure produced with this technique.The main benefit of the PU replica technique is
the wide variety in structural parameters of the cera-
mic foam, with pore-size distributions that vary
between about 300 mm and up to several millimeters,
as well as structural uniformity. Nevertheless, the
relatively low mechanical strength of foams manu-
factured with the replication method is caused by the
formation of hollow struts after calcinations of the
polymeric substrate, and the presence of residual
cracks. In order to overcome this intrinsic disadvan-
tage, some strategies have been developed [37–39]:
the use of a stronger ceramic material (e.g., reaction-
bonded aluminum oxide (RBAO)), repeated coating,
and infiltration of the struts with liquid metal.
Figure 7 Picture of a typical ceramic foam prepared bythe replication technique of a reticulated polyurethane.
Reproduced with permission from Snijkers, F., Mullens, S.,
Buekenhoudt, A., Vandermeulen, W., Luyten, J., Materials
Science Forum 2005, 492–493, 299–304.
228 Basic Aspects of Polymeric and Inorganic Membrane Preparation

A variation on the replication process is thepyrolysis and CVD coating of the polymer foam. In
this technique, a resin-impregnated thermosetting
foam is pyrolyzed to obtain a carbon skeleton. This
reticulated carbon skeleton is then coated by a CVD
process with the specific ceramic layer. In addition, the
cellular structure of wood can, after pyrolysis, be used
as a template to produce ceramic foams. Different
types of porous ceramics can then be obtained by
liquid or gas infiltration of the open biocarbon
template [40].An example of another template method is the
so-called hollow beads method [41]. The basic idea
is to prepare structures that are built up by ceramic
hollow building blocks which are in the second
stage of the procedure, connected together. The
ceramic hollow beads are produced using a sacrifi-
cial coating technique. As cores, materials widely
varying in origin and shape can be used, including
styrene granules, seeds, peas, and nuts. After the
beads are packed in a mold, they are joined together
using a second slurry coating, then calcined and
sintered. In this manner, lightweight materials,
with densities as low as 10% of the theoretical
density, can be obtained. Figure 8 gives some
examples of components processed by the hollow
beads method.
1.11.4.7.2 Direct foaming of a ceramic
slurry
This technique relies on the foaming of a stable cera-
mic slurry by mechanical agitation, injection, or in situ
evolution of gases [42–46]. A surfactant is required to
reduce the surface tension of the gas–liquid interface,
and, further, a mechanism is required for the long-
term stabilization (solidifying) of the foam, for exam-
ple, gelling of the foamed suspension. This approach
probably yields the widest range of cellular structures
and, hence, properties; however, they are generally
less open than the replicated foams.Gel casting is one of the frequently used solidifi-
cation processes. When heavily stirred, the
suspension transforms into a foam structure and can
be poured into a mold. The following step includes
the gelling of the (liquid) foam, resulting in the crea-
tion of gel-like foam. Different gelling agents have
been used: chemical monomers (mostly based on
acrylamides) and several environment-friendly
hydrocolloids (gelatin, agarose, etc.). Again, calcining
and firing result in the final ceramic porous material.Compared to the replica technique, gel casting
produces foam structures with solid struts, greatly
augmenting the mechanical strength. In addition, by
using this method, it is feasible to obtain foams with
smaller average cell sizes (<300 mm), which are more
(a) (c)
(b)
Figure 8 Some examples of ceramic foams processed by the hollow beads method. (a) Shows tubes, (b) elongated
spheres, and (c) consecutive layers made from different spheres. Reproduced from Luyten, J., Mullens, S., Cooymans, J., De
Wilde, A., Thijs, I. Adv. Eng. Mater. 2003, 5, 715–718.
Basic Aspects in Inorganic Membrane Preparation 229

difficult to produce by the replica technique. Thedensity ranges from 10% up to more than 50% ofthe theoretical density. These foams are mechani-cally stronger due to the dense struts, but are lessflexible in the variation of the cell sizes. Figure 9shows the hollow struts of a foam manufactured bythe replica technique and the dense ones of a foamproduced by the gel-cast method [48].
1.11.4.7.3 Miscellaneous techniques
Another technique for the synthesis of ceramic foamsuses the incorporation of pore formers or large grains[47]. This technique relies on the incorporation ofsacrificial additives in the form of beads or relatedmaterials. Depending on the quantity added, thefoams can be predominantly open or closed in nature.The structures produced by this method have limitedpore-size distributions and porosity values. Anotherway to produce macroporous ceramic materials is towork with large grains, which are sintered togetherwith a small fraction (5–10%) of fine, sinter-activepowder. Again, there are limits for the porosity andpore sizes which can be obtained.
3D periodic porous structures as ceramic foamscan also be manufactured by rapid prototyping meth-ods that are currently developed, such as 3D printing,fused deposition, stereo lithography, robocasting, andlaser sintering [48–51]. 3D fiber deposition (3DFD) isone of the very versatile rapid prototyping technol-ogies that offers the ability to design and rapidlyfabricate ceramic materials with complex 3D struc-tures. The technique involves materials assemblythrough a layer-by-layer deposition of highly viscousceramic pastes. The almost-unlimited freedom in
design, the highly structural uniformity, the moldlessmanufacture, and the possibility to create gradedfunctionality make this an emerging and promisingtopic in ceramic shaping technology.
1.11.4.8 Leaching Techniques
Besides ceramics and metals, glass is another mate-rial interesting for membranes. Two well-knownglasses are Pyrex and Vycor, both containing SiO2,B2O3, and Na2O. In the ternary phase diagram ofthese three oxides, various miscibility gaps can beobserved. When a homogeneous melt at high tem-perature (1300–1500 �C) is cooled down, phaseseparation occurs at certain compositions. One ofthese compositions, consisting of 70 wt.% SiO2,23 wt.% B2O3, and 7 wt.% Na2O, is located inwhat is called the Vycor glass region. During cool-ing (at temperatures between 500 and 750 �C),demixing occurs into two phases: one phase consistsmainly of SiO2 and is not soluble in mineral acids;and the other phase is richer in B2O3 and can beleached out of the structure by a strong acid, result-ing in a porous matrix with pores in themicrometer-to-nanometer range [52]. A carefulcontrol of the conditions used in the phase-separa-tion process can reduce the pore size toapproximately 0.5 nm [53, 54]. A disadvantage ofthese glass membranes is their poor mechanicalstability and chemical resistance. The chemicalinstability is due to the very active silanol groupson the surface, which are very susceptible to reac-tions with different components that can be presentin the feed solution, especially at high temperature.
(a) (b)
Figure 9 Picture comparing the hollow struts of a foam manufactured by the replica technique (a), and the dense struts of afoam produced by the gel-cast method (b). Reproduced with permission from Luyten, J., Cooymans, J., De Wilde, A., Thijs, I.,
Key Eng. Mater. 2002, 206–213, 1937–1940.
230 Basic Aspects of Polymeric and Inorganic Membrane Preparation
This has been overcome partially by surface treat-ment (e.g., by means of chemical agents) of theinternal pore structure which makes the surfacehydrophobic. These easy modification possibilitiesof the glass membrane surface can also be used forother functionalization of the membrane (seeSection 1.11.7). The advantage of glass membranesis that capillaries and hollow fibers can be easilyformed. Hollow glass fiber technology is wellestablished.
In a similar manner of heat treatment followed byleaching with a strong acid, base, or hydrogen per-oxide, porous metal membranes can be synthesized.
1.11.4.9 Techniques for Making StraightPores
To complete this section, two methods are describedto produce membranes with straight pores: the track-etch technique and anodic oxidation. Membraneswith nearly straight pores have been attractive tomany researchers as a model system for fundamentaltransport studies. However, these membranes haveremained merely a laboratory curiosity and havebeen of no commercial interest.
Pores with a very regular, linear shape can be pro-duced by the track-etch method. Here, a thin layer of amaterial is bombarded with highly energetic particlesfrom a radioactive source. The track left behind in thematerial is much more sensitive to an etchant in thedirection of the track axis than perpendicular to it.Therefore, etching the material results in straightpores of uniform shape and size, with pore diametersranging between 6 and 1200 nm. To avoid overlap ofpores, only 2–5% of the surface can be occupied by thepores. This process has been applied on polymers andon some inorganic systems such as mica.
Pores with a linear form can also be produced bythe so-called anodic oxidation process. Here, oneside of a thin high-purity aluminum foil is anodicallyoxidized in an acid electrolyte. A regular pattern ofpores is formed. The pore size is determined by thevoltage used and by the type of acid. The processmust be stopped before the foil is oxidized comple-tely and also to avoid closure of pores. Theunaffected part of the metal foil is subsequentlyetched away with a strong acid. The membranes soobtained consist of amorphous alumina and are notstable under long exposure to water, and are suscep-tible to acid and base attack. The stability can beimproved by hydrothermal treatment in hot wateror in a base, or by turning them into polycrystalline
alumina by a careful calcination at temperaturesabove 850 �C. Alumina membranes with very narrowpore-size distributions in sheet and tubular form havebeen produced by this process. Pore diameters in the10–250-nm range, pore densities between 1012 and1015 m�2, and membrane thickness up to 100mmhave been obtained.
1.11.5 Temperature Treatment
1.11.5.1 Drying
Drying is, in most cases, an important first step inthe temperature treatment of the green membraneshapes or the membrane layers. The drying tem-perature is mostly below 100 �C, and is often onlyroom temperature. Since the organic additives usedto shape the membranes have a much higherdecomposition temperature, only water is elimi-nated during the drying stage. The first stepcorresponds to the elimination of interstitial waterfilling up the space between the particles. This leadsto a first shrinkage of the green membrane. Thisshrinkage can be up to 10–20%, and is coupled to aweight loss of the same order of magnitude. Thesecond step involves the removal of adsorbed watermolecules (bonded via van der Waals forces). Thishappens without shrinkage but affects the porestructure. In the first step of the drying, whenshrinkage occurs, the drying rate must be suffi-ciently low in order to avoid the formation ofcracks and other defects, and enough time has tobe reserved. Conversely, drying should be fastenough to prevent particles from settling out and,consequently, segregating in the green product.When the shrinkage is completed the drying ratecan be increased without damaging the ceramic. Inorder to manufacture membranes reproducibly, thedrying step should be carefully controlled.
In many cases, green membrane shapes are driedin normal air at room temperature.
1.11.5.2 Calcination
Calcining is, after drying of the wet membrane shape,the thermal treatment in which the organic constitu-ents of the green product, such as binders,plasticizers, and dispersants, are combusted. The pro-cess is also called thermolysis. Calcining is mostlyperformed in air to make complete combustion of theorganics possible, and to minimize the presence ofresidual carbon in the final product. In such cases,
Basic Aspects in Inorganic Membrane Preparation 231

complete combustion of organics is supported bycalcining in pure oxygen.
Combustion of the organic additives typically takesplace in the lower-temperature region situatedbetween room temperature and 600 �C. In this region,commonly used binders are completely burned. Inorder to define the appropriate calcinations tempera-tures, investigation using thermogravimetric analysis(TGA) or differential thermal analysis (DTA) in athermobalance, in most cases, combined with differ-ential scanning calorimetry (DSC), delivers valuableinformation. Required calcination temperature andconsequent weight loss of the sample can be deducedfrom these measurements.
Thermal analysis studies have shown that duringthe lower temperatures of the calcinations theremaining part of moisture, which was not removedduring the drying step, will be removed. Thisremaining water includes water chemically bondedon the particle surface, and/or crystallization waterin the formed inorganic phases. This highly bondedwater may persist in the membrane up to a tempera-ture exceeding 200 �C.
Calcination must be done sufficiently slowly, andwith low heating rates, in order to remove theremaining moisture and the gases from the decom-position of the organic additives, without crackformation and damaging of the final product. Inaddition, this is the more important factor; thefiner the inorganic particles, the higher the organiccontent in the green membrane shape. In the firstcase, this is due to the lower permeation rate for theformed gases out of the shape. In the second case,this is due to the higher amount of gases formedduring calcination.
In the case of silicon or aluminum nitride andcarbide ceramics, calcination is done in an inertatmosphere such as nitrogen. Due to the absence ofoxygen, some residual carbon can be expected. Thisresidual carbon usually removes the oxygen adsorbedon the surfaces of the inorganic particles and serves asa sintering aid in carbide and nitride ceramics.
Calcination is mostly carried out in a separatecalcination furnace. Only if the amount of organicsto be burned off is small, calcination is done as thefirst part of the temperature profile of a combinedcalcining–sintering treatment.
1.11.5.3 Sintering
Typical processing of inorganics includes a step dur-ing which the green shape can develop a stable
microstructure and sufficient mechanical strength.
This step involves heating at high temperatures and
is characterized by firing or sintering. Sintering pro-
cesses have been studied for longtime in order to
understand the important changes that occur in the
material during the process. These changes are due
to the serious mass transport that is caused by the
high-temperature treatment. This mass transport
first leads to neck formation between neighboring
particles. In the later steps of the sintering, grain
growth occurs followed by real densification. The
mass-transport phenomena that contribute are
solid-state diffusion (i.e., surface, grain boundary,
and bulk diffusion), viscous flow, plastic flow, and
evaporation coupled to recondensation. In all cases,
the driving force for these sintering phenomena is a
decrease of the surface energy (Gibbs free energy) of
the system with mass transport moving from areas
with relatively high energy, that is, large convex
curvature, to areas with relatively small energy, that
is, small concave curvature.In the first step of the sintering process (also
called presintering), at relatively low temperatures,
the surface of the particles in the calcined particle
compact smoothens, grain boundaries are formed,
and necks grow between the particles. This is
mainly due to surface and grain boundary diffusion.
In this process, a strong interconnected porous
microstructure forms with enhanced mechanical
stability.At sufficiently high temperatures, grain growth
will occur. In the grain-growth process, the larger
grains will grow at the expense of the smaller grains:
the smaller grains will be consumed by the bigger
ones. This results in an increasing mean pore size, but
a decreasing porosity since particle centers will
approach each other. The temperatures required for
grain growth are below, but close to the melting point
of the metals or ceramics used (0.5–0.9� the melting
temperature). Consequently, they vary with the
materials involved. However, the required tempera-
tures also depend on the inorganic particle size. The
smaller the particle size, the higher the driving
forces for mass transport, and, therefore, the higher
the sinter activity and sintering rate. The same
effects are then visible at lower temperatures.
This is the case when sintering fine-porous top
layers. As a result, it is also possible to make
dense top layers while leaving the supports suffi-
ciently open-porous, even if they consist of the
same inorganic material.
232 Basic Aspects of Polymeric and Inorganic Membrane Preparation

When the sintering is done at sufficiently hightemperature and for sufficiently long duration, thegrain growth continues, up to complete densificationof the inorganic material. Only a small amount ofclosed porosity remains, of the order of a few percent.Dense ceramic membranes or dense membranelayers are thus produced.
It is clear from the above description that sinteringdetermines the final pore structure of the membrane,and the sintering process is definitely important tomake good, dense membranes. However, in commer-cially interesting porous membranes, where a highflux and, therefore, a high porosity are also impor-tant, serious grain growth and the related clearporosity decrease are avoided. In these porous mem-branes, the pores are mainly determined by theparticle size of the inorganic powders used, or bythe size of the inorganic structures used in the fine-porous layer deposition, and less by the sinteringprocess.
Finally, the membrane system must be cooleddown from the sintering temperature to room tem-perature. In the case of sintering of a multilayersystem, this can result in stresses due to eventualmismatch of the thermal expansion coefficientsbetween the layer(s) and the support. This enhancesthe risk of cracking or even delamination of thelayer.
1.11.5.4 Thermal Stability of Membranes
Thermal treatment is the final step during the pre-paration of inorganic membranes. This affects thethermal stability of the final membranes. As men-tioned above, calcination and sintering lead to aspecific grain size and related pore size of the finalmembrane. When the material is kept long enough atthe last thermal treatment temperature, it can beassumed that the material approaches an equilibriumstructure. Therefore, the structure of the membranewill not vary when it is exposed to temperatures of100–150 �C below its calcination/sintering tempera-ture, since the reaction rates and driving forces forthe sintering process will be too low at this point.However, when the material is heated to highertemperatures, it acts similar to any other inorganicmaterial, indicating that sintering and grain-growthprocesses start afresh, leading to a new equilibrium.Therefore, in order to prevent the membrane fromchanging its pore structure during application, sinter-ing has to be avoided or suppressed.
The thermal treatment process not only affectsthe pore size of the final membranes but also deter-mines the final phase composition of the inorganicmaterial. Indeed, for some materials, phase transi-tions occur during the heating up to the sinteringtemperature. These phase transformations areaccompanied by an increase of the sintering activity,causing an extra-enhanced pore growth. For thethermal stability of an inorganic membrane, it istherefore very important that the material is in athermodynamically stable phase and does not showany phase transformations below its working tem-perature. Here, it is important to state that phasetransition temperatures depend on the exact prepara-tion procedures of the inorganic powders orstructures (in case of top-layer material) used. Forgranular material with sufficient grain size, the tem-peratures of the phase transitions are fixed. However,for fine-granular powders with grain sizes on thenanometer scale, transition temperatures generallydecrease [55].
The thermal stability of the membrane and how toenhance this by specific doping of the inorganicmembrane materials (e.g., La in �-alumina or titania)are well described in Reference 56.
1.11.5.5 Thermal Treatment of Layers
The intermediate layers and top layers on top of thesupport also require a similar cycle of thermal treat-ments. In order to obtain the final microstructure,drying, calcination, and sintering are done. Thesame phenomena occur as for the thermal treatmentof the support, as described in the previous subsec-tions. However, in some cases, specific commentsrelated to the thermal treatment of layers are impor-tant. They are compiled in this section.
After their formation, layers are first dried. Thisprocess should be controlled even more carefullythan in the case of bulk green shapes. During thedrying process, water is removed form the wetlayer. The presence of the coarse-porous support orthe porous asymmetric composition below the layercauses capillary forces. As a consequence, stressesoccur due to shrinkage along the depth of the layer,which have to be released in some way. If a criticalstress is exceeded, cracks are formed in the supportedmembranes. This occurs at a critical thickness. Theexact value of the critical thickness depends on thesupport, the forming conditions of the layer, and onthe morphology of the inorganic particles used.While shrinkage and, therefore, stresses are higher
Basic Aspects in Inorganic Membrane Preparation 233

for layers with smaller pore size, the critical thick-nesses for these layers are relatively low; for instance,the critical thickness for sol–gel layers (Section1.11.6.3) is typically on the order of 1–10 mm.Experiments have shown that the production of rela-tively thick defect-free membranes is easier for plate-shaped particles than for spheres, that is, their criticalthickness is higher [57]. This explains the wide use ofsol–gel �-alumina intermediate layers (although itschemical stability is low), instead of sol–gel titania orzirconia intermediate layers, especially in the case offine-porous or dense membranes.
The support has an important effect on the sinter-ing process of a layer. It acts as a constraint anddecreases the diffusion rate of the membrane-layermaterial and, therefore, retards the sintering process.As such, the support has a negative effect on thedensification rate of the layer. This is consistentwith the lower pore size of supported membranelayers compared to unsupported membrane layers(flakes made in the same manner as the membranelayer) [58]. For thick layers, the sintering stresses arerelatively high (as the drying stresses), inducing ten-sile stresses in the film, which can result in cracks andeven delamination of the layer from the support.When the membrane layers are thin enough, thesetensile stresses lead to a decrease in the sintering rate.
Consideration should also be given to the calcina-tion or sintering temperature when the layer materialdiffers from the support material: the sintering tem-perature of the support should be higher than that ofthe layer. Moreover, it is essential that the thermalexpansion coefficients of the layer and the supportmaterials are closely matched in order to avoid dela-mination and cracking of the multilayer systemduring the fabrication, as well as during theapplication.
The support not only retards the sintering but canalso increase the temperature of the phase transitions[58]. As the support clearly reduces the rate of sinter-ing, and increases the temperature of the eventualphase transitions of the membrane material, it defi-nitely increases the thermal stability for sufficientlythin layers.
1.11.6 Layer Deposition
1.11.6.1 The Multilayer Architecture
To make both porous and dense membranes suitablefor real applications, all commercial and commer-cially interesting membranes always consist of an
asymmetric multilayer configuration. A picture ofsuch a multilayer membrane structure can be seenin Figure 1. The multilayer composition provides aconvenient way to combine a high flux and highselectivity in the final membrane.
In the multilayer structure, a good support shows ahigh pore size and porosity, and, at the same time, canprovide the necessary mechanical strength. The highporosity causes a negligible fluid resistance over themembrane support. Pore sizes of currently commer-cially used membrane supports are on the order of afew micrometers. In the early steps of membranedevelopment, flat laboratory-made supports, generallyprepared by slip-casting, are used. These supportshave pores on the order of 50–100 nm. These supportshave a much higher fluid resistance, but show a muchlower surface roughness and a smaller amount ofdefects. Commonly used materials for the supportare porous stainless steel, carbon, or ceramics.
The porous or dense top layers in the multilayerstructure are responsible for the separation. Theycontain the desired pore size for the necessaryseparation and are of high quality (e.g., a minimumamount of defects and preferably none) in order toprovide the desired selectivity. Good top layers arealso sufficiently thin to provide a permeability that isas high as possible. The main challenge for high-quality top layers is to avoid defects in the layer.Indeed, these defects will decrease the final selectiv-ity. It is obvious that this requirement is morestringent for microporous and dense membranes,than for more open-porous membranes.
One or more intermediate layers between thesupport and the top layer(s) take into account agradual decrease of the pore size in the multilayercomposition. Multiple interlayers are normally used,especially when a pore-size difference of micrometerto nanometer (or even no open pores) has to bebridged. The intermediate layers are also useful in agradual reduction of the surface roughness of themembrane. Inevitable large surface irregularitiesand defects in the supports can be properly coveredby the successive intermediate layers. Intermediatelayers should be as thin as possible to maximize theflux of the final membrane, but, at the same time,sufficiently thick to smoothen the membrane surfaceenough for defect-free top-layer coating. The thick-ness of each layer is typically about 100–1000 timesthe pore diameter of the layer. The porosity of theintermediate layer is in many cases also designed soas to prevent any appreciable penetration of the finerparticles or structures of the following intermediate
234 Basic Aspects of Polymeric and Inorganic Membrane Preparation

or top layer into the pores of the underlying supportlayer. In this manner, the fluid flux through themembrane will be maximal. It has recently beenshown that making an intermediate layer by coatingseveral identical thin layers on top of each other,instead of coating one thick intermediate layer,gives a significant improvement in the defect qualityof the intermediate layer, and thus of the totalmembrane system [59].
Good supports are produced by the wet synthesismethods described in Section 1.11.4, followed byappropriate thermal treatments as described inSection 1.11.5. The intermediate layers and the fine-porous or dense top layers coated on the porous sup-ports are produced using other specific techniques.These will be explained in this section. Layers withmacropores or big mesopores can be produced from(colloidal) powder suspensions. Layers with meso- andmicropores are produced by sol–gel techniques orCVD. Particular techniques exist for microporouscarbon and zeolite layers. The dense or fine-porousmembrane layers also require a temperature treatmentsimilar to that of the coarse-porous supports, toconsolidate their microstructure.
1.11.6.2 Powder Suspension Layers
1.11.6.2.1 Introduction
As mentioned in Section 1.11.4.2, the formation of adense or porous layer on a support can be obtainedby simply pressing a sufficiently fine powder on topof a precompacted green support, and cosintering thecomposition. However, the formation of layers fromsuspensions containing appropriate powders allowsmore freedom, since a variety of techniques becomepossible for layer formation. Moreover, powder sus-pension layers are more appropriate for large-scaleproduction.
The use of powder suspensions is most appropri-ate for the first porous inorganic layers on a poroussupport. This technique is suitable to obtain (inter-mediate or top) layers with pore sizes of a few tens ofmicrometers. The wet suspension layer on the sup-port will be further dried and treated thermally inorder to consolidate its microstructure. The porosityof the formed layer depends primarily on the shapeand particle size of the powder particles in the sus-pension. The pore size in the final layer is typicallyone-third of the particle size, and is therefore limitedto a minimum of about 100 nm.
Powder suspensions generally contain more thanone polymeric compound used as surfactant, binder,
and plasticizer, as is the case in slips or pastes used forshaping of the support (see Section 1.11.4). The inter-action between all these components determines thesuspension behavior and the microstructural devel-opment during coating, drying, and heat treatment.Sufficient mixing, deaeration, and deagglomeration(e.g., chemically or by ultrasonification) of the sus-pension are important for the formation of high-quality layers (the same aspects that are alsoimportant for good slip or paste preparation in theshaping process, see Section 1.11.4).
1.11.6.2.2 Dip and spin coating
Different methods are available for applying thelayer from the suspension onto the support. Themost-applied methods are dip or spin coating. Inboth cases, some mechanical means (such as pumpingand/or spinning) are provided to bring the suspen-sion in direct contact with the support in a uniformmanner. For example, the inner cavity of a poroussupport tube is filled with the suspension by dippingor pumping for a few seconds to a few minutes beforebeing emptied. In spin coating, the suspension isspread over the support by a rotating head movingwith a specific rotational speed. Rotation speeds up toabout 1500 rotations per minute are commonly used.Centrifugal forces determine the distribution of thesuspension over the support. Dip and spin coatingcan be applied to a broad range of materials, andare extensively used not only for metal oxides, butalso for silicon carbide, silicon nitride, and glasscompositions.
Dip coating is the dipping and subsequent with-drawal of the support from the powder suspension.When a porous support is withdrawn from a powdersuspension, capillary forces cause the infiltration ofthe suspension liquid into the support pores. Thisdrives the powder particles to the interface. If thesupport is not permeable for the particle, that is, if theparticles are sufficiently large compared to the sup-port pores, the particles concentrate at the surfaceand a compact layer is formed. However, in addition,drag forces exerted by the support during withdrawalfrom the suspension can be important. The relativeimportance of both capillary forces and drag forcesdepends on the contact time, the withdrawal speed,and the particle loading in the suspension. It deter-mines the thickness of the formed layer (typically20–100 mm). Moreover, the rheological properties ofthe powder suspension, determined by interactions ofall particles in the suspension (e.g., van der Waals,electrostatic, and polymer–particle interactions),
Basic Aspects in Inorganic Membrane Preparation 235

play an important role in the dip-coating process.This is particularly true when the size of the particlesinvolved is on the order of 1 mm or less. Powdersuspensions are also called colloidal suspensions orsols, and colloid science comes into play. Stable sus-pensions give rise to more homogeneous and moredensely packed layers. Although it has been studiedextensively, the whole dip-coating process is not yetfully understood.
Normal dip coating is done with an empty mem-brane to provide for the necessary capillary forces, inwhich case, the capillary forces are dominant in thelayer-formation process. However, in some cases, thecapillary forces are reduced by filling the pores of thesupport with a liquid, with a small difference in sur-face tension compared to that of the used powdersuspension. In other cases, the pores of the supportare even rendered completely nonwettable for thesuspension liquid. This can be obtained by forming ahydrophobic pore-wall surface on the support in thecase of an aqueous coating suspension. The supportsurface is treated with, for example, organic silanes(see also Section 1.11.7). In this case, layer formationis dominated by the drag forces of the support in thewithdrawal process, and layers can be made fromsuspensions with particles smaller than the pores ofthe support. The disadvantage of a decreased capil-lary action in the formation of a layer is thediminished adherence of the support and the layer.
1.11.6.2.3 Alternative coating methods
As an alternative for the dip-coating method, the firstporous layers on an inorganic support can also beformed by filtration of the powder suspension, usingthe support as a filter. This can be done using anexternal pressure on top of the layer. Alternatively, arough vacuum underneath the support can be used.This is called vacuum suspension (or alternativelyslip or slurry) coating (or alternatively casting) [22].
Next to dip and spin coating and filtration of thesuspension over the support, some other less-popularmethods can be used to make the first layers on thesupport. A low-viscosity suspension can also besprayed on a support through a nozzle from a pres-surized container. Controlled movement of the spraygun enables the formation of a homogeneous powderlayer. This is called spray coating or wet-powderspraying. Suspended particles with positive ornegative charged surfaces can be deposited by elec-trophoretic deposition on either the anode or cathodeby application of an electric field between the twoelectrodes. Electrically conducting materials are
required for this method. Yet, powder particles canalso be deposited on an electrical insulating materialby positioning the insulator in between the electri-cally conducting electrodes. Screen-printingtechniques require that the particles be dispersed ina highly viscous paste with a viscosity that is typicallysituated between 50 and 2000 Pa s. A paste is trans-ferred to a screen and spread out by a metal blade orrubber squeegee. Screen printing is used abundantlyin the preparation of the porous anode and cathodelayers in the fuel cell technology [22].
1.11.6.3 Sol–Gel Layers
1.11.6.3.1 Colloidal and polymeric sols
In order to produce membrane layers with pore sizessmaller than 100 nm, suspension techniques are inap-propriate and other methods need to be used. One ofthe most important methods used today in ceramicmembrane preparation is the sol–gel process. One ofthe most used references in this respect is the bookSol–Gel Science – The Physics and Chemistry of Sol–Gel
Processing [60]. Basically, sol–gel is a general processwhich converts a colloidal or polymeric solutioncalled sol to a gelatinous substance called gel. Itinvolves the hydrolysis and condensation of alkoxideor salt precursors in an organic solvent with anappropriate amount of water. Fine-porous membranelayers have been prepared by the sol–gel processwith a variety of metal oxides and composite oxides.There are two main routes in the sol–gel preparationof membrane layers: the colloidal route and thepolymeric route (see Figure 10).
In the colloidal sol–gel route, the alkoxide precur-sors are hydrolyzed and condensed (or peptized) in anexcess of water. The water causes a fast hydrolysisand condensation. The rapid condensation causes theformation of medium-sized nanoparticles of the orderof 20–100 nm in solution, that is, the colloidal sol.Reproducible and stable colloidal or particulate solscan be obtained by the precise control of the hydro-lysis and condensation reaction conditions and/or byadding acids or bases as hydrolysis catalysts and/or asstabilizers. In order to form high-quality membranelayers, the colloidal sol is commonly mixed withtypical binder materials such as polyvinyl alcohol orhydroxypropyl cellulose. The sol is subsequently dip-or spin-coated (see Section 1.11.6.2.2) on the already-formed multilayer structure with top layer pores inthe order of the sol particles. It is the porosity of thesupport that leads to the removal of the sol solventand to the gelling of the sol, similar to the forming of
236 Basic Aspects of Polymeric and Inorganic Membrane Preparation
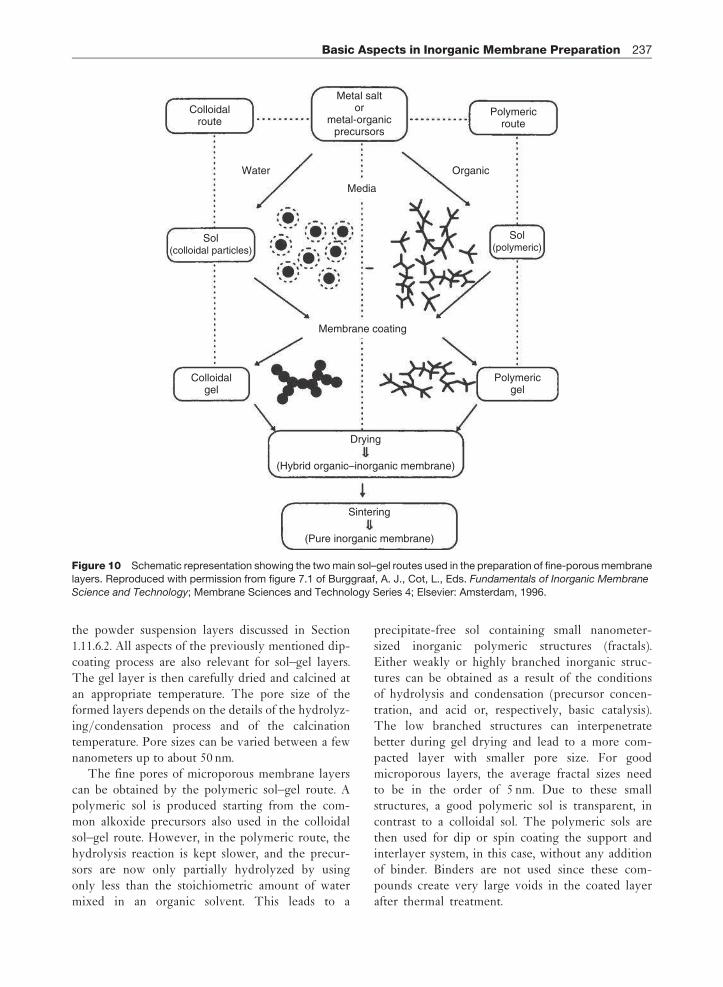
the powder suspension layers discussed in Section1.11.6.2. All aspects of the previously mentioned dip-coating process are also relevant for sol–gel layers.The gel layer is then carefully dried and calcined atan appropriate temperature. The pore size of theformed layers depends on the details of the hydrolyz-ing/condensation process and of the calcinationtemperature. Pore sizes can be varied between a fewnanometers up to about 50 nm.
The fine pores of microporous membrane layerscan be obtained by the polymeric sol–gel route. Apolymeric sol is produced starting from the com-mon alkoxide precursors also used in the colloidalsol–gel route. However, in the polymeric route, thehydrolysis reaction is kept slower, and the precur-sors are now only partially hydrolyzed by usingonly less than the stoichiometric amount of watermixed in an organic solvent. This leads to a
precipitate-free sol containing small nanometer-sized inorganic polymeric structures (fractals).Either weakly or highly branched inorganic struc-tures can be obtained as a result of the conditionsof hydrolysis and condensation (precursor concen-tration, and acid or, respectively, basic catalysis).The low branched structures can interpenetratebetter during gel drying and lead to a more com-pacted layer with smaller pore size. For goodmicroporous layers, the average fractal sizes needto be in the order of 5 nm. Due to these smallstructures, a good polymeric sol is transparent, incontrast to a colloidal sol. The polymeric sols arethen used for dip or spin coating the support andinterlayer system, in this case, without any additionof binder. Binders are not used since these com-pounds create very large voids in the coated layerafter thermal treatment.
Colloidalroute
Colloidalgel
Polymericgel
Water Organic
Media
Membrane coating
Drying
(Hybrid organic–inorganic membrane)
Sintering
(Pure inorganic membrane)
Polymericroute
Sol(colloidal particles)
Sol(polymeric)
Metal saltor
metal-organicprecursors
Figure 10 Schematic representation showing the two main sol–gel routes used in the preparation of fine-porous membrane
layers. Reproduced with permission from figure 7.1 of Burggraaf, A. J., Cot, L., Eds. Fundamentals of Inorganic Membrane
Science and Technology; Membrane Sciences and Technology Series 4; Elsevier: Amsterdam, 1996.
Basic Aspects in Inorganic Membrane Preparation 237

1.11.6.3.2 Drying and heat treatments
The gel layer formed during the spin or dip coating issubsequently carefully dried and heat treated. Inorder to avoid crack formation in this process, thelayers need to be sufficiently thin, that is, belowthe critical thickness (see Section 1.11.5.5). In addi-tion, the heat-treatment temperature is important.For microporous membranes, the heat-treatmenttemperature needs to be low enough, in order toavoid pore growth. Pore sizes between 0.5 and 2 nmare feasible. The heat-treatment temperature deter-mines not only the final pore size of the top layer, butalso the structural phase of the top layer material. Forexample, for temperatures as low as 200 �C, titania isin an amorphous state with very small pores in theorder of 1 nm, whereas from 300 �C onward titania isin an anatase phase having somewhat larger pores inthe order of 2.5 nm [61]. This has also a great influ-ence on the chemical stability of the top layer: anamorphous phase is more easily attacked by corrosiveliquids, and shows a lower acid and base stability thanthe crystalline phase [56].
The humidity control during coating and dryingof sol–gel layers is also important and is essential forthe quality of formed microporous layers. This isbecause it influences the hydrolysis and condensationof the gel network. For example, at a humidity higherthan 50%, the hydrolysis in a polymeric titania gel isfaster than the condensation, resulting in the forma-tion of titania particles and finally, mesoporousinterparticle pores [62]. To enhance the quality offinal microporous membrane layers further, the dip-or spin-coating process is also often performed in aclean room [2, 63, 67].
1.11.6.3.3 Silica and other metal oxides
Since sols of very small particles or structures areprepared through hydrolysis and condensation oftheir corresponding alkoxides, the partial charges ofthe metal in the alkoxides influence the hydrolysisbehavior. Transition metals such as Ti or Zr in thealkoxides carry much higher partial charges than Siin, for example, tetraethylorthosilicate (commonlycalled TEOS). Therefore, transition metal alkoxideshydrolyze much faster than Si alkoxides. In addition,the properties of the type of R ligands in the alkoxide,the degree of oligomerization of the starting alkoxide,the possibility of a coordination expansion of themetal during the hydrolysis, and the pH of thesolution all influence the hydrolysis behavior.
In order to better control the hydrolysis, espe-cially in the polymeric sol–gel route for nonsilica
materials, chelating agents have been used to blockthe functional groups of the alkoxide. Typically usedchelating agents are acetylacetone, alcohol amines, orcarboxylic acids [64–67].
Mixed-oxide layers can also be prepared by thesol–gel process. The mixed-oxide sols are made bymixing of the individual sols, or by cohydrolysis andcocondensation of the respective alkoxide precursormixtures.
The formation of microporous top layers of metaloxides or mixed metal oxides by the polymericsol–gel route has made serious progress in the pastdecade. Previously, only high-quality microporouslayers from amorphous silica were reported, mainlydue to the relatively easy sol–gel process of thismaterial [68–72]. Some of these silica membraneshave been introduced in the market about a decadeago. A significant drawback of silica is, however, itslimited hydrothermal stability, and its limited stabi-lity in alkaline pH’s. In order to improve the stability,silica membranes with zirconia [73–76] or titania [77]added as a second component have been developed.Recently, however, also high-quality titania micro-porous membranes for nanofiltration have beenprepared [2, 66, 78] and some have become commer-cially available [2]. The same quality of membraneshas also been achieved on capillaries [20]. Recentefforts have been concentrated on zirconia or mixedzirconia/titania membranes [67, 79]. Microporouszirconia membranes are, however, not yet commer-cially available. Energy Research Centre of theNetherlands (ECN) has adapted another strategy toenhance the hydrothermal stability of silica: recently,they developed a new hybrid organic–inorganicmembrane replacing the Si–O–Si bonds by themore stable Si–CH2–CH2–Si links [80].
Applications envisaged for all microporousmaterials are nanofiltration, pervaporation, and,eventually, gas separation also.
1.11.6.4 Template-Mediated Layers
1.11.6.4.1 IntroductionA more recent approach to prepare tailor-made por-ous ceramic layers is based on the incorporation oforganic template agents in gel structures. These tem-plate agents can be organic groups chemically linkedto the inorganic gel network (also called surfactantsor amphiphilic molecules), or isolated molecules orclusters trapped in the inorganic gel matrix. The roleof the organic template is to generate a uniformresidual porosity after they are burned out by the
238 Basic Aspects of Polymeric and Inorganic Membrane Preparation

heat treatments: pores with a size based on the size ofthe organic template molecule are created. This por-osity and pore size can be tailored by the nature andthe size of the templates. Often, the pore structure ofthe template-mediated layers, as that of the relatedpowder material, consists of two types of pores: thepores formed by the self-assembled templates (vari-able from micro- to macroporous) and the poresformed by the inorganic gel interacting with thetemplate (usually microporous). The templatemethod has, however, a limited ability to controlthe template pore alignment to the substrate surface.
1.11.6.4.2 Sharp pore-size distribution
The simplest way for forming a templated layer isbased on the insertion in the gel matrix of passivetemplate agents such as chemically fixed organic orinorganic entities or physically trapped polymer par-ticles. In this case, the elimination of the templatesleads to the formation of a porous structure in whichthe pore size and the dimension of the incorporatedtemplate is directly related, as shown in Figure 11[81, 82]. This method can be used for colloidal aswell as for polymeric sols, and can lead to macro-,meso-, as well as microporosity. The resulting pore-size distribution is very sharp.
Another way obtaining narrow pore-size distribu-tions in the micropore range makes use of the effectof nonionic surfactants. This has most extensivelybeen studied for silica sols [83, 84]. Nonionic surfac-tants are susceptible to interacting with silicaoligomers derived from TEOS by van der Waalsforces or by interaction with OH groups. Due tothese interactions, in the absence of polar solventssuch as water, an organic shell made of surfactantmolecules is formed around the inorganic structures(reversed micelle method). The resulting steric hin-drance limits further condensation of the inorganicstructures in the sol. After heat treatment, includingthe elimination of the surfactant shells, a homoge-neous microporous membrane layer consisting ofnanometric distinct silica particles is formed. Themembrane with such a top layer shows strictly micro-porosity and gas-separation characteristics. The poresize can be varied by using surfactants with longerchain lengths, although the pore-size distributionthen becomes wider.
1.11.6.4.3 Ordered porosity
Another efficient way of obtaining monodispersity ofthe pore-size distribution and control of the pore size isto develop materials with an ordered or textured
Polymeric gel Colloidal gel
Polymerparticle
Macropore
Organic or inorganicentity
Meso- ormicropore
ΔT ΔT
Figure 11 Schematic representation of the formation of a membrane layer using passive organic templates in a polymeric
gel (left) and in a colloidal gel (right). Reproduced with permission from figure 7.13 of Burggraaf, A. J., Cot, L., Eds.
Fundamentals of Inorganic Membrane Science and Technology; Membrane Sciences and Technology Series 4; Elsevier:Amsterdam, 1996.
Basic Aspects in Inorganic Membrane Preparation 239

porosity. This can be done by using mesoscopic tem-plates such as lyotropic liquid-crystal mesophases asstructure-directing agents. These ordered mesophasesresult from the self-assembly of surfactants or amphi-philic molecules. A successful process requires that bothliquid crystal and inorganic network can form simulta-neously in the sol and that the liquid-crystal mesophasemust be carefully eliminated without the collapse of thesolid part of the gel. The main lyotropic liquid-crystalmesophases are lamellar (surfactant bilayers separatedby aqueous layers), hexagonal (hexagonal arrangementof cylindrical micelles), and cubic structures. Figure 12shows the example of a hexagonal packing of micellarcylinders surrounded by the inorganic polymers grow-ing in the liquid phase near the surfactant head groups.The sols are initially very fluid and easy to deposit: thechemical composition of the sols corresponds to anisotropic region in the water-surfactant binary diagram.The ordered mesostructure develops only during the
gelation process, and is induced by the formation of
inorganic oligomers near the polar head of the surfac-
tants [85]. After a careful thermal or chemical treatment
to remove the surfactant, a stable ordered mesoporous
texture can be formed.Pioneering work on this subject was done on
aluminosilicates using cationic surfactants as
alkyltrimethylammonium halides in hydrothermal
synthesis. Depending on the catalysts (base and,
respectively, acid) and templates used, ordered
mesoporous materials of the mobil catalytic material
(MCM) or santa barbara acids (SBA) type can be
formed [86, 87]. Recently, membrane layers of the
MCM-48 type have been synthesized in a similar
manner [88]. The layers clearly show that the meso-
porosity of the mesophase and the separation
characteristics are due to the ordered mesopores.The group at the University of Montpellier,
France, has done much work on mesophase tem-
plated silica. Cationic surfactants with relatively
low hydrocarbon chains have been used to make
hexagonal ordered structures [89, 90]. The specific
surface area, pore volume, and porosity of the formed
structures are very large and essentially microporous.
The pore size depends on the length of the alkyl
chain of the used templates (and is approximately
half of the chain length). Supported membrane layers
have been formed in this manner [91]. It has also
been shown that the deposited layers are formed of
submicron-size ordered domains [92].The same group has also successfully synthesized
2D and 3D hexagonal mesoporous silica membrane
layers using longer alkyltrimethylammonium
bromide surfactants [93]. In the 2D mesoporous
membrane layers, gas-separation measurements
revealed that the mesopores are oriented parallel to
the membrane surface, and that the different meso-
pores are only connected through the micropores in
the inorganic walls. Seeding with amorphous silica
nanoparticles promoted a more heterogeneous
nucleation of the templating mesophase, giving rise
to a more random orientation of the mesopore
domains, with some domains nonparallel to the
membrane surface. This leads to an increased assis-
tance of the mesopores in the gas permeability,
raising the permeability by about a factor 10. As a
consequence, the separative properties of the
membrane layers are determined only by the micro-
porosity in the unseeded synthesis, and both by the
templated mesoporosity and by the microporosity in
the seeded synthesis.
(a)
(b)
Self-organizedsilica gel
Hexagonal phase
Silica matrix
Pore
d
rh
ΔT
Figure 12 Schematic representation of the formation of a
membrane layer using a hexagonal liquid-crystal phase astemplate. (a) The situation in the wet gel. (b) The pore
formation in the heat-treated gel. Reproduced with
permission from figure 7.11 of Burggraaf, A. J., Cot, L., Eds.
Fundamentals of Inorganic Membrane Science andTechnology; Membrane Sciences and Technology Series 4;
Elsevier: Amsterdam, 1996.
240 Basic Aspects of Polymeric and Inorganic Membrane Preparation

Defect-free ordered mesostructured silica mem-brane layers were also formed using nonionic blockcopolymers as surfactants [94]. The formed mem-branes show Knudsen gas permeability due to theordered mesopore structure. Block copolymers havealso been used to produce mesostructured titaniamembrane layers [95–97]. The mesostructures areof 2D hexagonal and cubic types, and are clearlyevidenced from transmission electron microscopy,as shown in Figure 13. The cutoff curves of thesemembranes show transport pores of about 1.5 nm,defined by the microporosity in the titania wallsbetween the templated mesopores.
1.11.6.5 Chemical Vapor Deposition
CVD is a gas-phase layer deposition technique. Inthis process, a mixture of a carrier gas with reactivegases is brought into contact with the support in areaction chamber at high temperature in order toform the desired membrane layer on the support bythermal decomposition, oxidation, hydrolysis, orreduction. For metal-oxide layers, one reactant isthe metal source (e.g., organometallic compoundssuch as chlorosilanes) and the other is the oxidizingor reducing agent (e.g., oxygen, air, or hydrogen,carbon monoxide). The reactants are introduced inthe reaction chamber on the same side of the support,
or, more novel, on opposite sides (chemical vaporinfiltration). The last technique has the advantagethat the deposition location can be varied from thesurface to the inside of the substrate. Once a pore isplugged, the vapor deposition process stops in thatpore. If, however, the deposited material is oxygenpermeable, such as yttria-stabilized zirconia, anothertype of deposition, electrochemical vapor deposition,starts: the oxygen source permeates through the poreplug and reacts with the organometallic vapor tocontinue deposition. In this manner, high-qualitysolid oxide electrolyte layers can be formed on aporous support. Deposition with both reactants intro-duced at the same side of the support, however,yields thinner and more permeable dense mem-branes, even though deposition always starts bypartially plugging the pores with the deposit, beforethe deposition grows into an integral layer coveringthe surface of the support.
The CVD technique has the advantage of eliminat-ing the need for drying and calcination required in theliquid-phase methods. In addition, the membranesproduced in this manner are usually denser thanthose prepared by liquid-phase processes. The processoffers the promise of being able to fine-tune thecomposition, growth, and uniformity of the depositedlayers. Variations of the CVD process have yieldedmembranes with different morphologies.
(a) 40 nm 20 nm
25 nm
(b)
(c)
Figure 13 Transmission electron microscopy (TEM) images of mesostructured titania layers formed by using blockcopolymer templates. (a) The cylindrical pores of a two-dimensional (2D) hexagonally ordered pore structure along the axis of
the pores. (b) The cross section of the same pore structure. (c) A cubic network of spherical pores. Reproduced with permission
from Bosc, F., Ayral, A., Guizard, C. J. Membr. Sci. 2005, 265, 13–19.
Basic Aspects in Inorganic Membrane Preparation 241

With this technique, high-quality dense andmicroporous amorphous silica layers have been pro-duced on different support types (e.g., Vycor glassand porous alumina with �-alumina intermediatelayer). The formed membranes show very highpermselectivities combined with high permeabilitiesin gas separation, and are therefore interesting, forexample, for H2 separation. The method has alsobeen used to narrow the pores of a microporoussol–gel silica membrane.
The CVD technique can also be used to formcomplex mixed metal-oxide membranes by usinga mixture of their organometallic compounds asreaction gas.
1.11.6.6 Carbon Layers
The oldest microporous membranes were carbonmembranes. The first carbon membranes in the1960s were prepared by compressing high-surface-area microporous carbon powders at very high pres-sures. Nowadays, carbon membranes are made bypyrolysis of a polymer precursor. Typical precursorsare thermosetting polymers as polyimide, polyviny-lidene chloride, cellulose, polyacrylonitrile, andphenolic resin. The pyrolysis takes place in theabsence of oxygen at high temperature typically inthe range from 500 to 800 �C. The process is not onlyused to make the carbon layers, but also to makecarbon supports. Depending on the degree of pyro-lysis, the membrane material can be weaklyhydrophilic (low temperature) or more hydrophobic(high temperature). The hydrophobic carbon isweaker and more brittle.
On top of the support, polymeric films are depos-ited (e.g., by dipping or spinning) using a solution of acommon polymer precursor in an organic solution,followed by in situ polymerization and subsequentcontrolled pyrolysis to the desired pore shape. Themembranes formed in this manner (sometimesmultiple layer deposition is necessary) show clearmolecular sieve properties. Depending on the polymerprecursor, type and degree of pyrolysis, membranesurface properties (hydrophilicity or phobicity), poresize, and morphology can be adjusted. The samemethods can also be used to make carbon layers on ametal-oxide support or a stainless steel support.
The pyrolysis process is also equipped to producecarbon hollow fibers by simply starting from theappropriate polymer hollow fiber membranes.
In the past decade, increasing interest has beenshown in phenolic resins as polymer precursors. This
reflects not only their ease of use and high carbonyield but also the well-defined pore structure thatcan be achieved [98]. Good carbon supports can bemade from phenolic resin by controlled polymeriza-tion, milling to an appropriate pore size, andsubsequent extrusion. Fine-porous membrane layerscan be made as described above, directly on the driedextruded support, by using again phenolic resin asthe polymer precursor. The complete resin mem-brane (supportþ layers) can then be pyrolyzed inone single step. The main drawback of this produc-tion route is that a significant top layer thickness(�10 mm) is required to generate a defect-free layeron the relatively coarse-porous support (�15 mm). Inorder to remediate this problem, phenolic-resin-based carbon membranes were also made on commonalumina supports with an intermediate layer of about100 nm [99]. A high-quality molecular sieving carbontop layer of about 1 mm could be produced directlyon the two-layer support structure, without furtherintermediate layer deposition.
The carbon microporous membranes are morestable than the metal-oxide membranes, since theymaintain their pore structure to about 1000 �C.However, these membranes are limited by reactivityto oxidizing gases such as steam (temperatures above� 650 �C), carbon dioxide (up to � 750 �C), and oxy-gen. In the case of oxygen, excessive oxidation willoccur at around 300 �C, while at lower temperatures,chemisorption of oxygen on the carbon surface canmodify the adsorption and transport properties evenat room temperature.
More details on the synthesis and membraneproperties of carbon membranes can be found inChapter 1.13.
1.11.6.7 Zeolite Layers
Zeolite membranes form the most recent branch ofinorganic membranes. Zeolites are porous crystallinesilicates with a complex crystallographic structuregiving rise to specific molecule-sized pores. Theycan have a wide variety of compositions with someof the silicon atoms replaced by other cations. Thecations are also responsible for the catalytic proper-ties of these materials.
Zeolites are typically prepared by a hydrothermaltreatment of a caustic synthesis solution containing asilica source and an appropriate structure-directingagent as tetrapropylammonium (TPA) ions [100]. Acalcination step is required to burn out the TPA, andfree the zeolite pores. Zeolite layers can be made
242 Basic Aspects of Polymeric and Inorganic Membrane Preparation

similarly, by immersing a multilayered support in azeolite synthesis solution in an autoclave and treatingthe whole hydrothermally. Subsequent calcinationopens the zeolite pores. This processing leads tozeolite crystal formation and growth on the supportsurface, and is therefore called in situ direct crystal-lization. An alternative and more recent approach is atwo-step process named seeding and secondarygrowth. First, some zeolite crystal seeds are depositedon the support system, and the whole is subsequentlytreated similarly as in the direct crystallization case.In both cases, the formed zeolite membrane layersare always polycrystalline, giving rise to intercrystal-line pores that are generally somewhat bigger thanthe intracrystalline zeolite pores. Multiple layerdeposition is generally required to reach high-qualitymembranes with molecular sieving properties. In thedirect crystallization route, the zeolite layer is infil-trated in the support; in the seeding and secondarygrowth route, the zeolite layer is a thin top layer ontop of the support. In the last case, the permeability ofthe final membrane is higher, and specific orienta-tions of the zeolite crystals can be obtained. A recentpromising new path in zeolite membrane synthesis isthe use of microwave heating in the seeding andsecondary growth process [101].
Multilayer alumina supports are frequently usedfor zeolite membrane synthesis. However, chemicalleaching of the alumina occurs in the caustic mediagenerally used for zeolite synthesis. As a conse-quence, the mechanical properties of the supportalter, as well as the composition of the final mem-brane. Stainless-steel supports have also beensuccessfully coated with zeolite layers.
To date, MFI (both silicalite and ZSM-5) andzeolite A (also called Na A or LTA) have beenreported to be successfully manufactured, and arealso currently commercially available. In the labora-tory, however, membranes have been made of a widevariety of zeolite types [101].
Much more details on the synthesis, membraneproperties, and recent progress of zeolite membranescan be found in the excellent recent review article ofCaro and Noack [102].
1.11.6.8 Metal Layers
1.11.6.8.1 Introduction
Metals such as Pd or Pd alloys are interesting becauseof their high hydrogen permeation capacity. Defect-free dense Pd or Pd alloy membranes are thereforeexcellent hydrogen-selective membranes, with ideal
infinite selectivity. They have great potential as ahydrogen-selective membrane in a membrane reactor(as a steam reformer or coal gasification reactor) forsustainable energy production [103]. In order to becommercially viable, the dense metallic layer shouldbe as thin as possible (preferably <10mm), and depos-ited on an appropriate multilayer support system.
Dense metallic layers can be prepared by anumber of processes: casting and rolling, vapordeposition, electroplating, and electroless plating. Inthe first process, a metal cast undergoes a sequence ofalternate rolling and annealing steps to reach therequired thickness. Dense metal layers can also beformed by physical (PVD) or chemical vapor deposi-tion (CVD) (physical vapor deposition is also calledsputtering). In electroplating, a support is coated witha metal or its alloy in a plating bath with the supportas cathode. The bath is maintained at a constanttemperature during plating. Electroless platinginvolves the autocatalyzed decomposition or reduc-tion of a few selected metastable metallic saltcomplexes on a support surface. The reaction shouldbe carefully controlled to avoid potential decomposi-tion of the as-formed layer and to control the layerthickness. All techniques have their advantages anddrawbacks [103]. However, in all cases, small thick-nesses in the order of 10–20 mm are feasible (therolling techniques leads obviously to the thickestmembranes) and, with some creativity, Pd alloyscan also be prepared.
1.11.6.8.2 Foil preparation and wrapping
Commercially interesting Pd or Pd alloy membranescan be made by mechanically assembling (by settingor wrapping) a thin metal film on a porous flat ortubular support. For instance, metal foils can beassembled with stainless-steel grids or nickel perfo-rated sheets by pressing and subsequent heating inorder to allow diffusion to occur at the contact points[104]. Tubes can also be made from this compositestructure by wrapping it around an alumina bar andwelding the seam line. The mechanical stability ofthe composite structure is, however, rather low. Analternative approach is the electrochemical thinningof rolled foils (e.g., by chemical or anodical etching)down to 10 mm [105]. The thinned foils can be madepinhole free, and are currently being commercializedas self-standing foils by mounting them between flatflanges.
Recently, another approach has been developed inorder to make metal foil – support assemblies. First, athin metal layer is formed (by sputtering or by
Basic Aspects in Inorganic Membrane Preparation 243

electrodeposition) on a high-quality smooth anddense support. This film is subsequently removedfrom that support, and wrapped around the appro-priate porous support for the final membrane. In thismanner, membranes were prepared with a 5-mm-thick Pd alloy layer on top of a perforated stainlesssteel sheet [106]. Very thin Pd alloy films with athickness of 0.8–5 mm were prepared by Bredesenand Klette [107] by sputtering on a silicon wafer.The films, carefully removed from the wafer, werewrapped around porous stainless-steel tubes to formcomposite metallic membranes.
During the recent years, very thin (0.5–0.8 mm)composite Pd membranes have also been fabricatedby microfabrication techniques [108, 109]. Thesemembranes are very expensive and can hold onlyabout 5 bar; however, due to their extremely highhydrogen fluxes they may have potential for portableapplications.
1.11.6.8.3 Electroless plating
Electroless plating has been widely used for Pd mem-brane synthesis. A good overview of the current stateof development and relevant references can be foundin Reference 102. The fact that electroless depositionis so popular is due to the low cost, easy procedures,and simplicity of the required equipment. Supportsdo not have to be conductive and very complexshapes can be covered uniformly. The deposition ofmetal alloys, however, represents a challenge. Ingeneral, when a Pd alloy is desired, the two metalsare deposited sequentially and heat treated at hightemperatures to obtain the alloy. Prior to electrolessdeposition, supports need to be activated by sequen-tial immersion in SnCl2 and PdCl2 solutions todeposit active Pd seeds on the surface.
Different supports have been used to form metalmembranes by electroless plating. The most com-monly used ones are glass, alumina, and porousmetals supports. Metal supports are very suitable,since other supports give rise to easier delaminationof the metal layer. Possible candidates are, for exam-ple, porous stainless steel, porous nickel, porousHastelloy, and porous Inconel. A diffusion layer is,however, required in order to avoid the diffusion ofthe metallic elements of the support into the Pd layer.Mostly oxides (including thin ceramic layers) havebeen used as intermetallic diffusion barriers. Thepassive oxide film that naturally forms on mostmetals is usually too thin (about 50 nm) in order toprotect against intermetallic diffusion at high tem-peratures. Therefore, a treatment of the metal
support is necessary before Pd deposition. This
treatment can consist of a high-temperature treat-
ment, giving rise to a thick oxide protection layer of
5–7 mm. The �-alumina sol–gel layers are also widely
used as an intermetallic diffusion barrier. Other dif-
fusion barriers used are TiN sputtered layers [110],
or, more recently, porous PdAg layers prepared by
electroless deposition [111]. Figure 14 shows an
SEM picture of a typical Pd membrane manufac-
tured by electroless plating on a porous stainless
steel support with a 0.5-mm grade and a metal-
oxide diffusion layer prepared by a high-temperature
treatment [112].The maximum pore size on the surface of porous
metal supports may be the most crucial parameter for
preparing defect-free thin Pd films. The Pd thickness
needed to obtain a leak-tight membrane was shown
to be approximately 3 times the diameter of the
largest pore of the support [113]. Therefore, in
order to reach Pd membranes thinner than 10 mm, it
is necessary to first narrow the pore-size distribution
at the surface of the support. This can be done by
shot peening with Fe particles, intermediate layer
deposition, or grading with preactivated alumina
powder [103].In general, composite Pd membranes are pre-
pared at temperatures and pressures that are
different from the ones that will be used in the
application. For instance, the electroless deposition
temperature is typically about 60 �C, while the
Figure 14 Scanning electron microscopy (SEM) picture of
the surface of a Pd membrane manufactured by electrolessplating on a porous stainless-steel support with a 0.5-mm
grade and a metal-oxide diffusion layer prepared by a high-
temperature treatment. Reproduced with permission from
She, Y., Han, J., Ma, Y. H. Catal. Today 2001, 67, 43–53.
244 Basic Aspects of Polymeric and Inorganic Membrane Preparation

temperature of a steam reforming reactor is about500 �C. Therefore, in use, composite Pd membranesundergo a series of structural transformations thatlead to several problems such as permeance andselectivity loss over time. It has been shown thatleak developments start only at about 500 �C [114].This issue clearly needs more attention in futuredevelopments.
1.11.7 Functionalization
1.11.7.1 Hydrophobization
By surface modification of hydrophilic membranes, itis possible to obtain hydrophobic inorganic mem-branes. The objectives for this surface modificationcan be twofold. First, this modification changes theaffinity of the pore surface of the membrane. This canbe useful, for example, to obtain inorganic mem-branes appropriate for membrane distillation, or toobtain nanofiltration membranes that show highpermeability for nonpolar solvents. Second, the mod-ification allows a tailored decrease of the pore size ofthe membrane. The modification can be done bybonding specific organic compounds with varyinghydrophobic tail lengths to the surface of a mem-brane. The most frequently used technique is a silanecoupling treatment on the reactive OH groups ofceramic or glass materials (Figure 15). The techni-que is based on state-of-the-art modificationprocesses used for silica in order to produce appro-priate chromatography columns.
The silane-coupling method was first applied onmacroporous and mesoporous membranes. Thisresulted in modified membranes with either adecreased pore size down to the micropore range[115, 116] or a modified hydrophilic/hydrophobic
character [117]. The modification can be performed
either in the liquid phase or in the vapor phase [118].Modification of tight mesoporous membranes in
order to enhance their performance in apolar sol-
vents was first studied [119–121]. Tsuru et al. [119]
modified mixed silica/zirconia membranes with the
small trimethylchlorosilane in the gas phase. Van
Gestel et al. modified a �-alumina/anatase–TiO2
multilayer membrane using bi-functional chlorosi-
lanes, with two reactive chlorine groups, having a
higher reactivity with the membrane surface [120].
However, these multifunctional chlorosilanes may
also result in pore blocking due to polymerization
reactions (hydrolysis and condensation between the
silane molecules), having a negative influence on the
solvent fluxes. That is the reason why Voigt et al.
[121] worked with silanes with only one reactive
group. All groups showed that in order to modify
the complete specific surface of the membrane, the
pore size has to be large enough for the specific silane
to enter. In all the studies mentioned, hydrophobiza-
tion of the inner membrane surface by the
organochlorosilane reaction was clearly shown, that
is, by permeation measurements of polar and apolar
solvents.However, the precise interaction between the
chlorosilanes and the membrane surface is very com-
plex and there is, in many cases, no evidence that it
involves a chemical reaction rather than an adsorption
reaction. It is shown that a chemical reaction of alkyl-
trichlorosilanes with a silica surface is not possible
below 300 �C [123, 124]. At room temperature, the
chlorosilane reacts only with water present in the
solvent, or is adsorbed at the membrane surface. A
polymeric chain is then formed that can adsorb or
attach to the OH groups of the membrane surface by
hydrogen bonding, without direct reaction with the
OCl
Cl
Cl
Si
Si
CH3
CH3
Cl
R
R
+
+
HCl (Monobonding)
(Dibonding)
+Membranesurface
Membranesurface
Membranesurface
OH
OH
OH
Membranesurface
Si
CH3
Cl
R
2 HCl+Si
CH3
RO
O
Figure 15 Schematic representation of the possible reactions between the OH groups on an inorganic membrane surface
and a silane coupling reagent. Reproduced with permission from Van Gestel, T., Van der Bruggen, B., Buekenhoudt, A.,
Dotremont, C., Luyten, J., Vandecasteele, C., Maes, G. J. Membr. Sci. 2003, 224, 3–10.
Basic Aspects in Inorganic Membrane Preparation 245

membrane surface. However, a direct reaction withthe membrane surface at room temperature is possibleusing a two-step procedure, involving an extra chemi-cal agent as catalyst. In the first step, a strong base,such as triethylamine, is bound to hydroxyl groups onthe surface. This creates a strongly nucleophilic oxy-gen atom on the hydroxyl site, which can react withthe chlorosilane and then form a chemical bond.
It is also clear from the previous studies that thepretreatment temperature, determining the amountof reactive hydroxyl sites, and a curing process afterthe silanation can largely influence the final modifiedsurface [123]. The nature of the metal oxide is alsoimportant for the reactivity and the success of themodification. It is clear from previous studies [125]and from our own recent work that silica is the easiestmaterial to modify [126].
Besides chloroalkylsilanes, it is also possible to usephosphonic acids or fluoroalkylsilanes for the mod-ification. Phosphonic acids were up to now only usedto change ultrafiltration membranes to gas-separa-tion membranes [125, 127]. Caro et al. [125] showedthat there is a clear reaction between the �-aluminasurface and the phosphonic acids. Picard et al. [128]used fluoroalkylsilanes in order to make open zirco-nia ultrafiltration membranes more hydrophobic.Using proton nuclear magnetic resonance (NMR),they proved that for the fluoroalkylsilanes too,there is a real reaction between fluoroalkylsilanesand the membrane surface. These reagents werealso successfully used by Voigt et al. [121] in orderto make hydrophobic nanofiltration membranes,which are currently being commercialized.
Due to the lack of a real chemical reactionbetween organochlorosilanes and the membranesurface, the stability of the modification with thesereactants is probably limited. Our own recentmeasurements [129] show that each exposure ofthe hydrophobic membrane to water systematicallydecreases the hydrophobicity of the membrane. Thisis most probably caused by a rehydroxylation of thesurface. The stability of the modifications withphosphonic acids and fluoroalkylsilanes is expectedto be better, thanks to the existing chemical bondbetween the membrane surface and the modifyingagent.
1.11.7.2 Catalytic Functionalization
Membranes can have an extra advantage when themembrane surface is also catalytically active. Thisadditional function is especially interesting in the
field of membrane reactors [5, 130]. In a membranereactor, a reaction is combined with a separation,in the same unit. This combination often createssynergy. For instance, the yield of equilibrium-limited reactions as dehydrogenation reactions canbe enhanced by shifting the reaction equilibrium tothe product by removing hydrogen from the reactorby the membrane. This has a direct consequence onthe economics of such a membrane reactor: down-stream separation of the product from hydrogen canbe avoided, and the operating costs can be lowered,thanks to the decreased temperatures required forthe reaction due to the yield enhancement. Extrasynergy can be created in case the separative mem-brane contains also catalytic activity for the reaction.A typical example is a dense Pd or Pd alloy mem-brane. These membranes are not only hydrogenselective, but they act also as catalysts in the caseof, for example, hydrogenation reactions. This hasbeen shown to offer some interesting opportunities:when feeding the hydrogen to the reactor throughthe Pd membrane, it was demonstrated that thehydrogen, which permeates through the membrane,is a much more surface-active species (prior to re-combination of the atoms to form H2) than hydro-gen that is adsorbed on a palladium-supportedcatalyst. Another possible function of a catalyticmembrane in a membrane reactor is to improvethe contact between the reactants and the catalyst.In this case, the membrane does not need to bepermselective, but only catalytically active, with athickness and a porous texture adapted to the reac-tion kinetics. Particularly, inorganic membraneshave potential in membrane reactors, due to theirhigher-temperature resistance, compatible with thehigher temperatures required for most reactions.
As mentioned above, inorganic membrane materialssuch as Pd or Pd alloys show catalytic activity bythemselves. Other examples are zeolites, �-alumina,LaOCl, and photocatalytic titania. Membrane layersof all these materials can be made by methods describedin the previous section. Other membranes can be madecatalytically active by incorporating catalytic particles,such as MgO, Ag, V, Pt, or Pd, in their porous structure.The method that is the most widely used for thisincorporation is impregnation. The impregnation isdone with an appropriate solution containing precur-sors for the desired catalyst. Some examples of thismethod are discussed in the following.
MgO and Ag loading of porous membranes has beendone by impregnation with an aqueous mixture of themetal salt and urea [131]. Heating of the impregnated
246 Basic Aspects of Polymeric and Inorganic Membrane Preparation

membrane at about 100 �C decomposes the urea,
resulting in the formation of ammonia. This reacts
with water and hydrolyzes the metal component. The
so-formed metal hydroxide precipitates in the mem-
brane pores. In a next step, the hydroxide is converted
to the oxide form by a high-temperature treatment at
350–450 �C. When, after impregnation, the membrane
is first dried in a controlled way, the solution can be
concentrated in the top layer (the solvent is removed
from the coarse-porous support and by capillary action
concentrated in the fine-porous top layer), and the
loading of the top layer with the metal or metal oxide
can be greatly enhanced [132]. Using this procedure, it
has been shown that the MgO and Ag particles formed
are in the order of 10 nm and are homogeneously
distributed across the thickness of the top layer.Vanadia-modified membranes were synthesized
by impregnation with a vanadium acetylacetonate
(AcAc) solution [133]. The vanadium acetylaceto-
nate reacts with the OH group of the membrane
material to form a surface group –O–V–O (AcAc).
After calcination at 450 �C, a surface vanadium oxide
group is formed, which is structurally related to the
catalytically active V2O5.Dispersing Pt in a top layer can be done using
impregnation of a precursor solution of hexachloropla-
tinic acid (H2PtCl6). The membranes are first saturated
with deionized water by immersion accompanied by
stirring. Then they are immersed in the Pt precursor
solution, and dried in ambient air. Finally, the impreg-
nated membranes are reduced under hydrogen at about
200 �C in order to form small Pt particles (5–10 nm)
[134]. Figure 16 shows a TEM picture of the disper-
sion of Pt particles in the membrane top layer.An alternative for the impregnation process per-
formed on the formed top layer is incorporation of
catalyst particles during the preparation of the top
layer. Particularly the sol–gel process offers good
opportunities for this purpose. In this route, the active
metal is incorporated in the sol used to make the top
layer. This method has been used to make, for exam-
ple, RuO2–TiO2 or RuO2–SiO2 membranes [135].
References
[1] Charpin, J., Rigny, P. Proceedings of the 1st InternationalConference on Inorganic Membranes, Montpellier, France,3–6 July 1989; Cot, L., Ed.; 1989.
[2] Puhlfurss, P., Voigt, A., Weber, R., Morbe, M. J. Membr. Sci.2000, 174, 123–133.
[3] Hsieh, H. P., Ed. Inorganic Membranes for Separation andReaction; Membrane Science and Technology Series 3;Elsevier: Amsterdam, 1996.
[4] Bhave, R. R., Ed. Inorganic Membranes: Synthesis,Characterization, and Applications; Van Nostrand Reinhold:New York, 1991.
[5] Burggraaf, A. J., Cot, L., Eds. Fundamentals of InorganicMembrane Science and Technology; Membrane Sciencesand Technology Series 4. Elsevier: Amsterdam, 1996.
[6] Rahaman, M. N. Ceramic Processing and Sintering, 2ndedn.; CRC Press: Boca Raton, FL, 2003.
[7] Avvakumov, E., Senna, M., Kosova, N. SoftMechanochemical Synthesis: A Basis for New ChemicalTechnologies; Kluwer: Boston, MA, 2002.
[8] Moulson, A. J., Herbert, J. M. Electroceramics: Materials,Properties, Applications, 2nd edn.; Wiley: Baltimore, MD,2003.
[9] Masters, K. Spray Drying Handbook; Longman Scientificand Technical: New York, 1991.
0.2 μm 10 nm
Figure 16 Transmission electron microscopy (TEM) picture revealing the dispersion of Pt nanoparticles in a mesoporous
titania top layer, as obtained by impregnation. The dark spots are the catalyst particles. Reproduced with permission fromReader, H., Bredesen, R., Crehan, G., et al. Sep. Purif. Technol. 2003, 32, 349–355.
Basic Aspects in Inorganic Membrane Preparation 247

[10] Messing, G. L., Shang, S. C., Jayanthi, G. V. J. Am. Ceram.Soc. 1993, 76, 2707–2726.
[11] Schnettler, F. J., Monforte, F. R., Rhodes, W. H. Science ofCeramics; Stewart, G. H., Ed.; The British Ceramic Society:Stoke-on-Trent, 1968.
[12] Sumitomo Electric Industries. Method and Device forIncinerating Refuse. Jpn. Pat. 48,007,190, 1973.
[13] Kingery, W. D., Ed. Introduction to Ceramics; Wiley: NewYork, 1960.
[14] Brewin, P. R., Coube, O., Doremus, P., Tweed, J. H.Modeling of Powder Die Compaction; Springer: London,2008.
[15] Kovalevsky, A. V., Kharton, V. V., Snijker, F. M. M.,Cooymans, J. F. C., Luyten, J., Frade, J. R. Solid State Ion.2008, 179, 61–65.
[16] Nijmeijer, A., Huiskes, C., Sibelt, N. G. M., Kruidhof, H.,Verweij, H. Amer. Ceram. Soc. Bull. 1998, 77, 95–98.
[17] Steenkamp, G. C. Centrifugal Casting and Coating ofTubular Ceramic Membrane Supports. PhD Thesis,Potchefstroom University for Christian Higher Education,South Africa, 2000.
[18] Voigt, I., Fisher, G., Puhlfurss, P., Seifert, D. Proceedings ofthe Fifth International Conference on InorganicMembranes, Nagoya, Japan, 22–26 July 1998; pp 42–45.
[19] Leschoche, P., Bergel, J.-Y. Proceedings of the 8thInternational Conference on Inorganic Membranes,Cincinnati, OH, USA, 18–22 July 2004; pp 430–433.
[20] Voigt, I., Fischer, G., Puhlfurss, P., Schleifenheimer, M.,Stahn, M. Sep. Purif. Technol. 2003, 32, 87–91.
[21] Mistler, R. E., Twiname, E. R. Tape Casting, Theory andPractice; The American Ceramic Society: Westerville, OH,2000.
[22] Tietz, F., Buchkremer, H. P., Stover, D. Solid State Ion.2002, 152–153, 373–381.
[23] Okubo T., Haruta, K., Kuksakabe, K., Morooka, S.,Anzai, H., Akiyama, S. J. Membr. Sci. 1991, 59, 73–80.
[24] Weyten, H., Adriansens, W., Buekenhoudt, A., Leysen, R.,Cornelis, R. J. Alloys Compd. 1993, 195, 31–34.
[25] Luyten, J., Buekenhoudt, A., Weyten, H., Adriansens, W.,Cooymans, J., Leysen, R. Proceedings of the FifthInternational Conference on Inorganic Membranes,Nagoya, Japan, 22–26 June 1998; pp 96–99.
[26] Gas-Separating Dense Ceramic Membrane. Eur. Pat. EP0900587 B1, date of filing 1998.
[27] Colombo, P. Key Eng. Mater. 2002, 206–213, 1927–1930.[28] Luyten, J., Mullens, S., Cooymans, J., De Wilde, A., Thijs, I.
Adv. Eng. Mater. 2003, 5, 715–718.[29] Le Brun, P., Krautlein, C., Rombach, G., Pouly, P., De
Vries, P., Luyten, J. Light Metals 2007, 657.[30] Gauckler, L. J., Waeber, M. M., Conti, C., Jacob-
Duliere, M. Light Metals 1985, 1261–1283.[31] Addler, J. Int. J. Appl. Ceram. Technol. 2005, 2, 429–439.[32] Fino, D., Saracco, G. Gas Filtration, Cellular Ceramics. In
Cellular Ceramics: Structure, Manufacturing; Scheffler, M.,Colombo, P., Eds.; Wiley-VCH: Weinheim, 2005; Chapter5.2, pp 416–438.
[33] Schwartzwalder, K., Somers, H., Somers, A. V. Method ofMaking Porous Ceramic Articles. US Pat. 3,090,094, May1963.
[34] Saggio-Woyanski, J., Scott, C., Winnaer, W. P. Am.Ceram. Soc. Bull. 1992, 71, 1674–1682.
[35] Will, J. Porous Support Structures and Sintered Thin FilmElectrolytes for Solid Oxide Fuel Cells. PhD Thesis, ETHZurich, Switzerland, 1998.
[36] Luyten, J., Thijs, I., Vandermeulen, W., Mullens, S.,Wallaeys, B., Mortelmans, R. Adv. Appl. Ceram. 2005, 104,4–8.
[37] Luyten, J., Cooymans, J., De Wilde, A. Adv. Eng. Mater.2002, 4, 925–927.
[38] Yoshihisa, K., Masashi, F. Ceramic Foam. Br. Pat.2168337, 1986.
[39] Ortona, A., Molinary, M., Romelli, L. Open Cell FoamCeramic Material. Eur. Pat. 1382590, 2004.
[40] Sieber, H., Kaindl, A., Greil, P. Adv. Eng. Mater. 2002, 2,105–109.
[41] Thijs, I., Luyten, J., Mullens, S. J. Am. Ceram. Soc. 2003,87, 170–172.
[42] Sepulveda, P. Am. Ceram. Soc. Bull. 1997, 76, 61–65.[43] Binner, J. K., Sepulveda, P., Smith, R. Ceram. Proc. Sci.,
Ceram. Trans. 1998, 83, 273.[44] Mullens, S., Cooymans, J., De Wilde, A., Beyens, F.,
Uytterhoeven, J., Luyten, J. Proceedings of Shaping II,Gent, Belgium, 24–26 October 2002; Luyten, J., Erauw, J.P., Eds.; pp 57–62.
[45] Janney, M., Omatete, O., Walls, C. J. Am. Ceram. Soc.1998, 81, 581–591.
[46] Millan, A. J., Moreno, R., Nieto, M. I. J. Eur. Cer. Soc. 2000,20, 2527–2533.
[47] Luyten, J., Buekenhoudt, A., de Barquin, F., Joiret, J. F.Proceedings of Shaping II, Gent, Belgium, 24–26 October2002; Luyten, J., Erauw, J. P., Eds.; pp 219–224.
[48] Lewis, J. A. J. Am. Ceram. Soc. 2000, 83, 2341–2359.[49] Gomes de Sousa, C., Evans, J. R. G. J. Am. Ceram. Soc.
2003, 86, 517–519.[50] Chartier, T., Chaput, C., Doreau, F., Loiseau, M. J. Mater.
Sci. 2002, 27, 1–7.[51] Ping, J., Wijns, J. R., Van Blitterswijk, C. A., de Groot, K.
Biomaterials 2006, 27, 1223–1235.[52] Elmer, T. H. Porous and Reconstructed Glasses. In
Engineered Materials Handbooks, Vol. 4: Ceramics andGlasses; Schneider, S. J., Ed.; ASM International: MetalsPark, OH, 1992; p 427.
[53] Shelekhin, A. B., Dixon, A. G., Ma, Y. H. AIChE J. 1995, 41,58–67.
[54] Kuraoka, K., Amakawa, R., Matsumoto, K., Yazawa, T. J.Membr. Sci. 2000, 175, 215–223.
[55] Hofman-Zuter, J. M. Chemical and Thermal Stability ofMesoporous Ceramic Membranes. PhD Thesis, Universityof Twente, Enschede, The Netherlands, 1995.
[56] Buekenhoudt, A., Stability of Porous Ceramic Membranes.In Inorganic Membranes: Synthesis, Characterization andApplications; Mallada, R., Menendez, M. Eds.; MembraneScience and Technology Series 13; Elsevier: New York,2008.
[57] Van Praag, W., Zaspalis, V., Keizer, K., Van Ommen,J. G., Ross, J. R., Burggraaf, A. J. Proceedingsof the 1st International Conference of InorganicMembranes, Montpellier, France, 2–6 July 1989;pp 397–400.
[58] Kumar, K. N. P., Keizer, K., Burggraaf, A. J., Okubo, T.,Nagamoto, H. J. Mater. Chem. 1993, 3, 1151–1159.
[59] Bonekamp, B. C., Horssen, A., Correia, L. A., Vente, J. F.,Haije, W. G. J. Membr. Sci. 2006, 278, 349–356.
[60] Brinker, C. J., Scherer, G. W. Sol–Gel Science – ThePhysics and Chemistry of Sol–Gel Processing; AcademicPress: New York, 1990.
[61] Van Gestel, T., Vandecasteele, C., Buekenhoudt, A., et al.J. Membr. Sci. 2002, 207, 73–89.
[62] Puhlfurss, P., Voigt, A., Weber, R., Morbe, M. J. Membr.Sci. 2000, 174, 123–133.
[63] De Vos, R. M., Verweij, H. Science 1998, 279, 1710–1711.[64] Sanchez, C., Livage, J. New J. Chem. 1990, 14, 513–521.[65] Vacassy, R., Guizard, C., Thoraval, V., Cot, L. J. Membr.
Sci. 1997, 132, 109–118.[66] Benfer, S., Popp, U., Richter, H., Siewert, C., Tomandl, G.
Sep. Purif. Technol. 2001, 22/23, 231–237.[67] Van Gestel, T., Kruidhof, H., Blank, D. H. A.,
Bouwmeester, H. J. M. J. Membr. Sci. 2006, 284, 128–136.
248 Basic Aspects of Polymeric and Inorganic Membrane Preparation

[68] Brinker, C. J., Ward, T. L., Sehgal, R., et al. J. Membr. Sci.1993, 77, 165–179.
[69] Uhlhorn, R. J. R., Keizer, K., Burggraaf, A. J. J. Membr. Sci.1992, 66, 271–287.
[70] de Lange, R. S. A., Hekkink, J. H. A., Keizer, K.,Burggraaf, A. J. J. Membr. Sci. 1995, 99, 57–75.
[71] van Gemert, R. W., Cuperus, F. P. J. Membr. Sci. 1995,105, 287–291.
[72] Van Veen, H. M., Van Delft, Y. C., Engelen, C. W. R. Sep.Purif. Technol. 2001, 22/23, 361–366.
[73] Yazawa, T., Tanaka, H., Nakamichi, H., Yokoyama, T. J.Membr. Sci. 1991, 60, 307–317.
[74] Tsuru, T., Wada, S., Izumi, S., Asaeda, M. J. Membr. Sci.1998, 149, 127–135.
[75] Tsuru, T., Izumi, S., Yoshioka, T., Asaeda, M. AICHE J.2000, 46, 565–574.
[76] Asaeda, M., Sakou, Y., Yang, J., Shimasaki, K. J. Membr.Sci. 2002, 209, 163–175.
[77] Sekulic, J., Luiten, W. J., ten Elshof, J. E., Benes, N. E.,Keizer, K. Desalination 2005, 148, 1138–1156.
[78] Tsuru, T., Hironaka, D., Yoshioka, T., Asaeda, M. Sep.Purif. Technol. 2001, 25, 307–314.
[79] Van Gestel, T., Sebold, D., Kruidhof, H.,Bouwmeester, H. J. M. J. Membr. Sci. 2008, 318, 413–421.
[80] Castricum, H. L., Sah, A., Kreiter, R., Blank, D. H. A.,Vente, J. F., ten Elshof, J. E. Chem. Commun. 2008, 9,1103–1105.
[81] Roger, C., Schaefer, D. W., Beaucage, G. B., Hampden-Smith, M. J. J. Sol–Gel Sci. Technol. 1994, 2, 67.
[82] Ayral, A., Guizard, C., Cot, L. J. Mater. Sci. Lett. 1994, 13,1538–1539.
[83] Yamaki, T., Maeda, H., Kusakabe, K., Morooka, S. J.Membr. Sci. 1993, 85, 167.
[84] Julbe, A., Balzer, C., Barthez, J. M., Guizard, C., Cot, L. J.Sol–Gel Sci. Technol. 1995, 4, 89–97.
[85] Brinker, C. J., Lu, Y., Sellinger, A., Fan, A. Adv. Mater.1999, 11, 579.
[86] Kresge, C. T., Leonowicz, M. E., Roth, W. J., Vartuli, J. C.,Beck, J. S. Nature 1992, 359, 710–712.
[87] Soler-Illia, G. J. A. A., Sanchez, C., Lebeau, B., Patarin, J.Chem. Rev. 2002, 102, 4093.
[88] Kumar, P., Ida, J., Kim, S., Guliants, V. V., Lin, J. Y. S. J.Membr. Sci. 2006, 279, 539–547.
[89] Dabadie, T., Ayral, A., Guizard, C., et al. Mater. Sci. Forum1994, 152–153, 267.
[90] Dabadie, T., Ayral, A., Guizard, C., Cot, L. Mater. Res. Soc.Symp. Proc. 1994, 346, 849.
[91] Dabadie, T., Ayral, A., Guizard, C., Cot, L., Robert J. C.,Poncelet, O. Proceedings of the Third InternationalConference on Inorganic Membranes, Worcester, MA,USA,1994; p. 411.
[92] Klotz, M., Ayral, A., Guizard, C., Cot, L. J. Mater. Chem.2000, 10, 663–669.
[93] Klotz, M., Ayral, A., Guizard, C., Cot, L. Sep. Purif. Technol.2001, 25, 71–78.
[94] Higgens, S., Kennard, R., Hill, N., DiCarlo, J.,DeSisto, W. J. J. Membr. Sci. 2006, 279, 669–674.
[95] Bosc, F., Ayral, A., Albouy, P. A., Guizard, C. Chem. Mater.2003, 15, 2463–2468.
[96] Bosc, F., Ayral, A., Albouy, P. A., Datas, L., Guizard, C.Chem. Mater. 2004, 16, 2208–2214.
[97] Bosc, F., Ayral, A., Guizard, C. J. Membr. Sci. 2005, 265,13–19.
[98] Lenghaus, K., Qiao, G. H., Solomon, D. H., et al. Carbon2002, 40, 743–749.
[99] Tennison, S., Arnott, K., Richter, H. Ann. Chim. Sci. Mat.2007, 32, 159–177.
[100] van Bekkum, H., Flanigan, E. M., Jansen, J. C.Introduction to Zeolite Science and Practice. Studies inSurface Science and Catalysis; Elsevier: Amsterdam,1991; Vol. 58.
[101] Julbe, A., Ayral, A. Ann. Chim. Sci. Mat. 2007, 32,213–229.
[102] Caro, J., Noack, M. Microporous and Mesoporons Mater.2008, 115, 215–233.
[103] Ma, Y. H. Guazzone, F. Ann. Chim. Sci. Mat. 2007, 32,179–195.
[104] Tosti, S. Int. J. Hydrogen Energy 2003, 28, 1445–1454.[105] Judas, W., Krueger, C. W., Bombard, R. T. Method of
Fabricating Thinned Free-Standing Metallic Hydrogen-Selective Palladium-Bearing Membranes and Novel Pin-Hole-Free Membranes Formed Thereby. US Pat.6,103,028, 2000.
[106] Thornthon, P. H. Supported Membrane for HydrogenSeparation. US Pat. Appl. 20,020,078,827, 2002.
[107] Klette, H., Bredesen, R. Membr. Technol. 2005, 5, 7–9.[108] Tong, H. D., Gielens, F. C., Gardeniers, J. G. E., et al. Ind.
Eng. Chem. Res. 2004, 43, 4182–4187.[109] Keurentjes, J. T. F., Gielens, F. C., Tong, H. D., van
Rijn, C. J. M., Vorstman, M. A. G. Ind. Eng. Chem. Res.2004, 43, 4768–4772.
[110] Shu, J., Adnot, A., Granjean, B. P. A., Kaliaguine, S. ThinSolid Films 1996, 286, 72–79.
[111] Ma, H. M., Mardilovich, I. P., Engwall, E. E. CompositeGas Separation Modules Having Intermediate PorousMetal Layers. US Pat. Appl. 20,040,237,779, 2004.
[112] She, Y., Han, J., Ma, Y. H. Catal. Today 2001, 67, 43–53.[113] Ma, H. M., Mardilovich, I. P., Mardilovich, P. P. Div. Pet.
Chem. 2001, 46, 154–156.[114] Guazzone, F., Speakman, A. S., Payzant, E. A., Ma, Y. H.
Ind. Eng. Chem. Res. 2006, 45, 8145–8153.[115] Leger, C., De Lira, H., Paterson, R. J. Membr. Sci. 1996,
120, 187–195.[116] Javaid, A., Hughey, M. P., Varutbangkul, V., Ford, D. M. J.
Membr. Sci. 2001, 187, 141–150.[117] Picard, C., Larbot, A., Guida-Pietrasanta, F., Boutevin, B.,
Ratsimihety, A. Sep. Purif. Technol. 2001, 25, 65–69.[118] Miller, J. R., Koros, W. J. Sep. Sci. Technol. 1990, 25,
1257–1280.[119] Tsuru, T., Miyawaki, M., Kondo, H., Yoshioka, T.,
Asaeda, M. Sep. Purif. Technol. 2003, 32, 105–109.[120] Van Gestel, T., Van der Bruggen, B., Buekenhoudt, A.,
et al. J. Membr. Sci. 2003, 224, 3–10.[121] Voigt, I., Phulfurss, P., Holborn, T. Proceedings of the
Aachener Membrane Colloquium, Aachen, Germany,2003.
[122] Sah, A., Casricum, H. L., Bliek, A., Blank, D. H. A., tenElshof, J. E. J. Membr. Sci. 2004, 243, 125–132.
[123] Impens, N. R. E. N., Van der Voort, P., Vansant, E. F.Microporous Mesoporous Mater. 1999, 28, 217–232.
[124] Hair, M. L., Tripp, C. P. Colloids Surf. A: Physicochem.Eng. Aspects 1995, 105, 95–103.
[125] Caro, J., Noack, M., Kolsch, P. Micorporous MesoporousMater. 1998, 22, 321–332.
[126] Ozen, M., Meynen, V., Buekenhoudt, A., Cool, P.Innovations on Sustainable Production i-SUP 2008;Proceedings of the International Conference, Brugge,Belgium, 22–25 April 2008.
[127] Randon, J., Paterson, R. J. Membr. Sci. 1997, 134,219–223.
[128] Picard, C. Larbot, A., Tronel-Peyroz, E., Berjoan, R. SolidState Sci. 2004, 6, 605–612.
[129] Verrecht, B., Leysen, R., Buekenhoudt, A., Vandecasteele,C., Van der Bruggen, B. Proceedings of the Ninth
Basic Aspects in Inorganic Membrane Preparation 249

International Conference on Inorganic Membranes,Lillehammer, Norway, 25–29 June 2006; pp 135–138.
[130] Dalmon, J. A. Firoir-Fendler, A., Mirodatos, C.Mozzanega, H., Eds. Special Issue: Catalysis inMembrane Reactors. Catal. Today 1995, 25.
[131] Burggraaf, A. J., Keizer, K., van Hassel, B. A. Solid StateIon. 1989, 32/33, 771–782.
[132] Burggraaf, A. J. Modified Membrane. Eur. Pat. 0,395,184,1990.
[133] van Praag, W., Zqpalis, V., Keizer, K., van Ommen, J. G.,Ross, J. R., Burggraaf, A. J. Proceedings of the 1st
International Conference on Inorganic Membranes,Montpellier, France, 3–6 July 1989; pp 397–400.
[134] Reader, H., Bredesen, R., Crehan, G., et al. Sep. Purif.Technol. 2003, 32, 349–355.
[135] Parvulescu, V., Parvulescu, V. I., Popescu, G., Julbe, A.,Guizard, C., Cot, L. Catal. Today 1995, 25, 385–389.
[136] Snijkers, F., Mullens, S., Buekenhoudt, A.,Vandermeulen, W., Luyten, J. Materials Science Forum2005, 492–493, 299–304.
[137] Luyten, J., Cooymans, J., De Wilde, A., Thijs, I. Key Eng.Mater. 2002, 206–213, 1937–1940.
250 Basic Aspects of Polymeric and Inorganic Membrane Preparation

Biographical Sketches
Anita Buekenhoudt was born in Duffel, Belgium, in 1961. She studied physics at the University of Antwerp,
Belgium, and graduated in 1983. In 1990, she obtained her PhD in solid-state physics at the Catholic University
of Leuven. For 2 years, she worked at the K.U. Leuven as postdoc on nuclear magnetic resonance (NMR)
studies in high-Tc superconductors. Since 1992 she has been working at the Flemish Institute for Technological
Research in Mol, Belgium, as a project leader. Subsequently, her interest has shifted from high-Tc super-
conductors to ceramic ion-conducting materials for sensors. Since about 10 years, her work has involved the
development and application studies of ceramic membranes for nanofiltration, pervaporation, and gas separa-
tion. Strong emphasis is also placed on the implementation of these and alternative membranes in industrial
applications. She has authored or coauthored more than 50 papers and a few patents.
Andrei Vladislavovich Kovalevsky was awarded PhD in physical chemistry in 2002 by the Research Institute
for Physical Chemical Problems, Belarusian State University, Minsk. In 1997, he received a BS degree in
physical chemistry and, in 1998, an MS degree in chemistry from the Belarusian State University. A.V.
Kovalevsky was employed as an engineer (1997–2001), junior researcher (2001–03), and executive chief of
the Laboratory of Physical Chemistry of Solids (2003–04) at the Research Institute of Physical Chemical
Problems, Belarusian State University. Between 2004 and the beginning of 2008, he had been a postdoctoral
researcher at the University of Aveiro, supported by grants from Fundacao para a Ciencia ea Tecnologia (FCT,
Portugal) and Centre for Research in Ceramics and Composite Materials (CICECO, University of Aveiro,
Portugal). A.V. From the beginning of 2008 to the beginning of 2010 Kovalevsky was employed as a researcher
in the Materials Department of Flemish Institute for Technological Research (VITO), Belgium. Currently his
works again at the University of Aveiro Portugal. His scientific activities deal with physical chemistry of solids
and high-temperature electrochemistry, being mainly focused on oxygen mixed-conducting membranes and
solid oxide fuel cells. He has coauthored more than 60 papers that are published in international Science
Citation Index (SCI) journals and various scientific volumes.
Basic Aspects in Inorganic Membrane Preparation 251

Jan Luyten was born in Diest, Belgium, in 1951. He received his master’s degree in metallurgical engineering atthe Catholic University of Leuven, Belgium. In 1979, he obtained his PhD in applied science at the sameuniversity. He stayed there for 1 year as a postdoctoral researcher. After 1 year of research and development atUnion Miniere, he was a teacher at the Technical High School of Industrial Engineers in Leuven, Belgium(1982–87). During 1988–92, he worked as a project leader at the Nuclear Research Center (SCK) in Mol,Belgium. Since 1992 he has been working as a project leader at the Flemish Institute for TechnologicalResearch (VITO) in Mol, Belgium. He has about 30 years of experience in processing and characterizationof metals and ceramics, and especially of ceramic membranes and sensors. His current research interests includeceramic foams. He is currently a member of several scientific committees on ceramic materials, including theBelgian and American Ceramic Society. He has authored or coauthored more than 150 articles and severalpatents.
Frans Snijkers was born in Kessenich, Belgium, in 1963. He studied chemistry at the University of Hasselt (theformer Limburgs Universitair Centrum) and analytical and inorganic chemistry at the Catholic University ofLeuven, where he obtained his MSc in 1985. For 5 years he worked at the Philips Research Laboratories inEindhoven, the Netherlands, on the subject of thermionic cathodes for cathode ray tubes. In 1991, he joined theInnovation and Technology Center of Philips Display Components, NV Philips Electronics in Eindhoven, theNetherlands, as a project manager, dealing with product and process development in the area of thermioniccathodes and screen processing technology. Since 2001, he has been working at the Flemish Institute forTechnological Research (VITO nv) in Mol, Belgium, as project manager. The projects involve research anddevelopment of ceramic components and processing of ceramic materials, including ceramic ion-conductingmembranes for gas separation. He is currently a member of the Belgian, European, and American CeramicSociety. He has authored or coauthored more than 25 papers and over 10 patents.
252 Basic Aspects of Polymeric and Inorganic Membrane Preparation

1.12 Ceramic Hollow Fiber Membranes and TheirApplicationsK Li, Imperial College London, London, UK
ª 2010 Elsevier B.V. All rights reserved.
1.12.1 Introduction 253
1.12.2 Preparation of Spinning Suspension 254
1.12.2.1 Particles and Packing of Particles 254
1.12.2.2 Dispersion of Particles 255
1.12.2.3 Summarized Preparation Procedure 256
1.12.3 Spinning of Ceramic Hollow Fiber Precursors 257
1.12.3.1 Rheology and Spinnability 257
1.12.3.2 Phase Inversion 258
1.12.4 Sintering 259
1.12.4.1 Presintering 259
1.12.4.2 Thermolysis 259
1.12.4.3 Final Sintering 259
1.12.4.4 Grain Growth 260
1.12.5 Examples: Preparation of Ceramic Hollow Fiber Membranes 261
1.12.5.1 Morphology 261
1.12.5.2 Permeation Characteristics 264
1.12.5.3 Mechanical Strength 266
1.12.5.4 Conclusion 266
1.12.6 Possible Applications 267
1.12.6.1 LSCF for Oxygen Separation 267
1.12.6.2 LSCF for Oxidative Coupling of Methane 267
1.12.6.3 SCYb for Non-OCM 268
1.12.6.4 Solvent Distillation 269
1.12.6.5 Solid Oxide Fuel Cells 270
1.12.7 Conclusions 271
References 271
1.12.1 Introduction
The combination of high chemical, thermal, and
mechanical resistance has made ceramic membranes
an attractive alternative to polymeric membranes
[1, 2]. Due to the high surface area/volume ratios
achieved by hollow fiber geometries, the compact-
ness of the membrane systems made from ceramic
hollow fiber membranes may greatly exceed that of
other membrane systems. The ability to operate at
high temperatures and pressures, and in corrosive
environments, allows ceramic membranes to be
used in a variety of applications including filtration
for corrosive fluids [3], high-temperature membrane
reactors [4–6], solid oxide fuel cells (SOFCs) [7], and
membrane contactors [8, 9] besides robust membrane
supports [10]. Although some attempts have been
made in fabricating a silica glass hollow fiber mem-
brane for gas separation [11], the membrane was too
fragile to be used in large industrial scales. Recently,
Tan et al. [12] and Liu and coworkers [13–16] suc-
cessfully produced hollow fiber ceramic membranes
using materials such as Al2O3 and perovskites by
employing a phase inversion method which is a
three-step process, including (1) preparation of a
spinning suspension; (2) spinning of ceramic hollow
fiber precursors; and (3) final sintering.Preparation of ceramic hollow fiber membranes
using the phase inversion method is a quite complex
process. Many factors may affect the final membrane
performance. Therefore, in the following sections, a
detailed discussion on the preparation of ceramic
253

hollow fiber membrane is given first following thesequence of the three steps mentioned above.Subsequently, an example on fabrication of yittria-stabilized zirconia (YSZ) hollow fiber membraneswill be given. Finally, potential applications of var-ious ceramic hollow fiber membranes in separationand reaction are discussed.
1.12.2 Preparation of SpinningSuspension
Preparation of a spinning suspension may consist of aseveral steps in sequence: (1) mixing a dispersant anda solvent of choice; (2) adding preconditioned parti-cles for deflocculant and dispersion; (3) addingpolymer binders and plasticizers; and (4) degassingthe suspension prior to the spinning of the membraneprecursor. The deflocculation is a very importantstep, as soft agglomerates of the particles in the spin-ning suspension would have an effect on pore sizeand permeability of the final membrane product [17].A more detailed preparation procedure will be givenat the end of this section.
The main ingredients in the spinning suspensionfor the fabrication of hollow fiber ceramic mem-branes are the ceramic powders, additives, andsolvents. In selection of the ceramic powders, one ofthe important factors is the particle sizes and itsdistribution as well as the shape of the particles.They effect the porosity, pore size, and pore-sizedistribution of the final membrane product [17].
Additives such as deflocculants/dispersants, bin-ders, plasticizers, antifoaming agents, and poreformers are used to provide the spinning suspensionwith the required property. In preparing the ceramichollow fiber membrane using the phase inversiontechnique, the requirement of the organic binders isthat they should not only be invertible, but also mustbe burnt out without leaving ash and tar during thecalcinations. The quantity of organic binders shouldbe as low as possible, but without affecting the inver-sion capability.
The solvent(s) must dissolve the additives usedand must show a high exchange rate with nonsolvent(coagulants). The rates of solvent outflow and coa-gulant inflow have an effect on the cross-sectionalstructures of the membrane precursor, hence thestructures of the final membrane products [18].
As preparation of the spinning suspension is stillin the development stage, the following few general
rules are, so far, considered to be useful in the pre-paration of the spinning suspension:
1. The amount of dispersant must be maintained toensure the stability of the suspension.
2. The amount of solvent must be fixed at a mini-mum to maintain a homogeneous suspension.
3. The ratio between organic components and cera-mic powders must be as low as possible.
4. The plasticizer to binder ratio must be adjusted tomake the membrane precursor flexible, resistant,and easy to release.
1.12.2.1 Particles and Packing of Particles
In ceramic membrane fabrication processes, the mostimportant component in the spinning suspension isthe ceramic powders. After binder removal and finalsintering, the ceramic powders are the only compo-nent left and will determine the properties of theceramic membrane produced. The other componentsin the spinning suspension such as solvents, plastici-zers, binders, and dispersant are used simply topredesign the membrane morphology (i.e., pore size,pore-size distribution, porosity, cross-sectional struc-tures, etc.) and to facilitate the spinning and phaseinversion which is, in general, a process in obtainingand holding the powder particles in the hollow fiberconfiguration.
During the phase inversion (shape forming pro-cess), the particles in the spinning suspensionundergo a process of particle packing. It is, therefore,possible to adjust the particles to attain high packingdensities or to attain specific compact properties.The most widely used parameters of the particlepacking are the packing density (or bulk density)and the coordination number. The bulk density(defined as weight of the particle bed/volume ofthe bed) is directly proportional to the density ofthe individual particles, and a high bulk densitymay be obtained simply because the particles havea high density rather than because the particles areclosely packed. In order to avoid this difficulty anexpression involving the ratio of the volume of par-ticles composing the bed (Vp) to the volume of thebed (Vb) may be adopted. This ratio, that is, packingfraction (defined as bulk density/particle density), isusually referred to as the packing fraction or thefractional solids content. The fractional voidage("¼ 1 – Vp/Vb), expressed as a percentage, is oftenknown as the volumetric porosity. The packing den-sity can be improved by introducing smaller-sized
254 Basic Aspects of Polymeric and Inorganic Membrane Preparation

particles. Small particles are introduced into a pack-ing of large particles, to fill its voids withoutincreasing the overall volume of the bed. Severalstudies have been conducted to view the two-dimensional structure using disks and spheres[19–21]. Two dominant factors are the size ratioand composition of the mixture.
When two sizes of spheres are mixed, the smallerparticles fill the unoccupied voids among the largeparticles. So as long as the proportion of the smallersphere is sufficiently great, the proportion of largespheres could reach the stage at which they willtouch each other. The resulting packing is optimal.When the quantity of small particles becomes toogreat since all of the voids are filled, further additionwill force the large particles apart and no longerimprove the packing density. The basic behavior forrandom dense packing is shown in Figure 1, whichshows that the packing volume, termed the specificvolume (volume to mass ratio), is a function of thecomposition for a mixture composed of large andsmall spheres. There is a composition of maximumpacking density [22]. The relative improvement inpacking density depends on the particle size ratio ofthe large and small particles. Detailed discussion onthe packing of different particle sizes was given byRahaman [23].
1.12.2.2 Dispersion of Particles
As mentioned above, in preparation of ceramic mem-branes, one of the problems to be tackled is thedispersion of each individual ceramic particle in asolvent. When individual primary particles are inproximity, they often have a tendency to form
loosely bound groups usually known as soft agglom-erates. In a fluid suspension of particles, particularlywhen the powder has little affinity for wetting, thesoft agglomerates can form to lower the free energyof the suspension by reducing the solid–liquid inter-face area. There are many types of surface forcesacting between particles: electrostatic forces, vander Waals forces, and steric forces are the mostimportant ones. Descriptions of these three forcescan be found elsewhere [23].
In order to deflocculate the soft agglomerate aswell as to disperse the primary particles in a solvent,addition of a dispersant is usually required. Thepurpose of the dispersant is to disperse the primaryparticles and to hold them in a homogeneous suspen-sion. As the dispersant separates primary particlesand holds them in suspension, which allows the sol-vent to form a separating layer between particles, thesuspension usually shows a lower viscosity due to theparticle mobility offered by the solvent in the inter-particle layer. There are basically two differentmechanisms, that is, ionic repulsion and steric hin-drance, in describing the deflocculation anddispersion. The term ‘ionic repulsion’ is used todescribe the charging of particle surfaces so thatthey magnetically repel each other. In aqueous sys-tems, this can be achieved by changing the pH. Thesurface charge of the particles can also be accom-plished by introducing polyelectrolyte solutions,which coat the particle surfaces and provide the sur-face charge. The steric hindrance term is used todescribe the separation of particles by coating alayer on one particle that would physically prohibitanother particle to be in contact with it. Organicpolymers are often used in both aqueous and non-aqueous systems to accomplish this particle–particleseparation.
There are several reasons for a spinning suspen-sion to be fully dispersed. First, the ceramicpowders being added into the spinning suspensionare usually in the form of soft agglomeratesbecause they are normally produced through asol/gel process and are high surface area powders.The soft agglomerates tend to trap air in theinterstitial space between the primary particles. Ifthe soft agglomerates are not broken up, thetrapped air would produce bubbles in the mem-brane precursor, resulting in pinholes andunwanted surface porosity in the final sinteredmembranes. Second, when the polymeric binder isintroduced, it will envelop the soft agglomeratesinstead of the individual (primary) particles. This
Large
Specificvolume
Optimal packing Small
Figure 1 The reduction in specific volume for mixed largeand small spheres, showing the condition of optimal
packing where the small spheres fill all voids in the large
sphere packing.
Ceramic Hollow Fiber Membranes and Their Applications 255

will make the soft agglomerates as a permanentgroup throughout the rest of the process, whichproduces less density membrane precursors, lead-ing to high shrinkage during the final consolidationprocess.
The dispersion of particles in a solvent takes placein several stages. When the powder is first put inproximity to the solvent, the particle surfaces (oragglomerates) get coated with the solvent.Therefore, the stage 1 of suspension is the wettingof the particle surface. After the particle surface iswetted, soft agglomerates held together by electro-static forces or by the van der Waals forces need to beseparated, that is, the stage 2 of suspension is themechanical separation of primary particles. Afterthe completion of the stage 2, the particles are evenlydistributed throughout the solvent. The final stage ofsuspension consists of protecting and stabilizing whathas been accomplished, that is, prohibiting softagglomerates from reforming in the spinningsuspension.
Dispersion mechanisms have been fairly well studiedin nonaqueous solvent systems, primarily with oxides.Although the main particle separation mechanism hasbeen found to be steric hindrance, Lee and Rives [24]concluded that both steric and ionic mechanisms areactive in the organic solvent-based suspension. Theionic repulsion dispersion mechanism may comeinto organic solvent systems with certain additives.However, since the spinning suspension generally con-tains a high solid loading and the particles are in closeproximity to each other, the steric hindrance is still animportant stabilization method [25].
One of the measurable effects of using a dispersantis a higher packed-bed density. This phenomenonhas been used to determine the proper dispersantlevel. The level or extent of dispersion can bemeasured by a number of techniques such as micro-electrophoresis, optical microscopy, and laser scat-tering. Targeted variables of these tests include zetapotential, isoelectric point, and equivalent sphericaldiameter. A settling experiment is perhaps anothermeans for the characterization of the spinning sus-pension, as one of the main reasons for dispersing thesolution is to form a densely packed bed of particles.It follows that a screening experiment should beperformed with the densest packed bed as the goal.Therefore, an experiment in which different concen-trations of dispersant are used to disperse identicalsuspensions of powder and solvent can be carried out.After a proper screening, the extent of dispersion inpowder suspensions can be observed.
1.12.2.3 Summarized PreparationProcedure
Based on the each individual discussion discussedabove, a general procedure in preparation of thespinning suspension can now be drawn. The firststep is the dispersion of particles in the presence ofa dispersant in the solvent(s). The usual procedurewould be to dissolve a predetermined amount ofdispersant in term of weight or volume by stirringor rolling. The powder(s) are then added.
Percentage of the solids loading during dispersionis dependent on the powder density, particle size, anddispersant effectiveness. It is beneficial to optimizethe solids loading during this step, since any excesssolvent will have to be removed during the phaseinversion (shape forming step). The solid loading isoften adjusted with experience, because the solventvolume also affects the final viscosity after the poly-mer binder and/or plasticizer(s) are added to themixture. The viscosity of the dispersion is not aprimary concern, as long as deagglomeration occurs.Viscosity of the dispersions at this stage is extremelylow, but will increase when the binder is added.
The purpose of the dispersion procedure is toaccomplish three goals: (1) to break apart any softagglomerates, (2) to coat the primary particles with adispersant, which (3) keeps the particles apart bysteric effects, electrostatic effects, or both.
After the dispersion process is complete, the plas-ticizers (if any) are poured onto the top of themixture, and followed by the weighed binder, eitherin powder form or dissolved in a solvent.
Once the plasticizer and binder are added, themixture is stirred or rolled to make sure that thebinder is not in large clumps. Usually, a few hoursare required for the complete dissolution of thebinder.
Usually, the suspension becomes more viscouswith the addition of a long-chain polymeric binder.The only time that this does not occur is when thebinder is a more powerful dispersant and replaces oroverrides the chosen dispersant. This is also a goodreason to use the suspension in the phase inversionprocess as soon as possible after the binder is mixedinto the suspension. Rheological properties of thesuspension can change with time. Once the plastici-zer(s) and binder(s) have been mixed into thesuspension formulation, it is ready for prespinningconditioning and characterization.
The next step is to de-gas the suspension toremove any air that may have been entrained during
256 Basic Aspects of Polymeric and Inorganic Membrane Preparation

the mixing process. Air bubbles cause defects in themembrane precursor. Pinholes (small holes left by airbubbles) are the most common defect, and these canlead to cracking which radiates from the pinholeduring the sintering (consolidation step). It is there-fore essential that entrained air be removed beforethe spinning. Several techniques are used for thede-gassing process. The simplest technique is thepartial vacuum accompanied by gentle stirring oragitation. Once the spinning suspension is properlyde-gassed, it is ready to be spun into hollow fiberprecursors and this is discussed below.
1.12.3 Spinning of Ceramic HollowFiber Precursors
Spinning of ceramic hollow fiber precursors can becarried out in a spinning apparatus as shown inFigure 2. The hollow fiber precursors are spunthrough a tube-in-orifice spinneret as shown in theinset of the figure, typically with orifice diameter/inner diameter of the tube of 3.0/1.2 mm. The
extrusion rate of the spinning suspension is con-trolled by the nitrogen pressure and an adjustingvalve. The nonsolvent, usually water, is used atroom temperature as the internal and external coa-gulants. The spinneret is arranged such that thenascent fiber precursor can be extruded verticallydownward into the coagulation bath. After coagula-tion (immersion-induced phase inversion), the fiberprecursor is guided through the wash bath, and thendried. Figure 3 shows a typical fiber precursor spunfrom a suspension containing La1–xSrxCo1–yFeyO3–�
(LSCF) ceramic powders. It can be seen that theprecursors are very flexible because of polymericbinders. In spinning of ceramic hollow fiber precur-sors, there are two important parameters, that is,spinnability and invertability of the powder suspen-sion, which are discussed below.
1.12.3.1 Rheology and Spinnability
In any polymer solutions or particle suspensions, therheological properties play a key role in controllingthe shape-forming behavior [26]. A general observed
Internal coagulantPowder suspension
Hollow fiber precursor
1. Mechanical stirrer 2. Mixing tank 3. Solution tank 4. Fitter 5. Grace pump 6. Internal coagulant tank 7. Mass flow controller 8. Spinneret 9. Coagulation bath10. Working bath11. Motor guide12. Storage tank13. Valve
9
6
6
8
4
213
S
I
1011
12
Figure 2 Hollow fiber ceramic membrane spinning apparatus (inset: photograph of a spinneret).
Ceramic Hollow Fiber Membranes and Their Applications 257

phenomenon is that the viscosity increases with theincrease of polymer contents in polymer solutionsand increases with volume fraction of solids andfinally ceases to flow at some critical maximumvolume fraction of solids in particle suspensions.The rheological behavior of a concentrated suspen-sion of ceramic particles is affected by a number offactors including the particle size distribution, parti-cle shape, volume fraction of solids, and the rangeand magnitude of the interparticle forces [27–29].
When the viscosity reaches about 10 poise for apolymer solution, the solution becomes spinnable andfibers can be drawn through an orifice [30, 31]. For asuspension containing spherical particles, the relationbetween the reduced viscosity �sp/c and the particlesconcentration c, where �sp is the specific viscosity, canbe examined. In principle, solutions containing sphe-rical particles follow Einstein’s formula [30]:
�sp=c ¼ k=� ð1Þ
where k is the constant and � the density of theparticles.
For a concentrated particle suspension, the bestspinnability should be observed when the viscositybehavior is highly shear-thinning but not thixotropic.A very high viscosity suspension is necessary to pre-vent the drawn fiber from breaking up into droplets.High viscosity is required for a stable fiber formation,which can generally be achieved by increasing theconcentration of the suspension or adding someadditives.
1.12.3.2 Phase Inversion
The immersion-induced phase inversion techniquehas been applied in production of polymeric mem-branes for many years and was first introduced by
Loeb and Sourirajan [32]. The membranes produced
by them [32] show an asymmetric structure: a dense
and thin skin layer (�25 mm) integrated on a porous
support of the same material. The dense skin layer
shows a permselective property for separation of salt
from sea water and is also thin enough for a high
water flux. The porous substrate provides the
mechanical stability for the membrane. Since then,
this method has been one of the most common meth-
ods in the fabrication of polymeric membranes.
Conceptually, membrane formation by phase inver-
sion can be described in terms of a three-component
system: nonsolvent, solvent, and polymer. After
immersing a polymeric solution into a nonsolvent
bath, the solvent diffuses out of the polymer solution,
while nonsolvent diffuses into the solution. This
exchange of solvent and nonsolvent, in general,
leads to a change in the polymer solution from a
thermodynamically stable state to a metastable or
unstable state. Then, liquid–liquid demixing takes
place in the solution. When a polymer solution is in
contact with a nonsolvent, the solvent in the polymer
solution will diffuse out, resulting in the increase of
the polymer concentration at the surface. The highly
concentrated polymer layer at the surface reduces
the exchange speed of the solvent and nonsolvent.
Hence, the polymer concentration in the sublayer is
lower than the polymer concentration in the surface
layer. The further replacement of solvent by nonsol-
vent results in solidification of the polymer rich
phase, and the asymmetric structure of the mem-
brane is thus obtained. For a suspension system
containing ceramic particles and polymer binders,
the situation may be different. When a high viscous
suspension is in contact with a low viscous
hydrophilic nonsolvent (normally water), hydrody-
namically unstable viscous fingering takes place,
resulting in finger-like structures of the membrane
substrate. Due to the hydrophilic nature of particles
with different sizes, it is logical to postulate that the
smaller particles move faster than the larger particles
toward the surface during the phase inversion when
water is used as a coagulant and the ceramic mem-
branes with a graded structure can be formed using
the phase inversion technique as long as the particles
with different sizes are used. A similar phenomenon
has been observed by Chung et al. [33] when prepar-
ing mixed-matrix membranes. It, thus, follows that a
good control of the ratio of small and large particles
in the suspension and the exchange rate of the sol-
vent and nonsolvent may tailor the membrane
LSCF hollowfiber precursor
Figure 3 Ceramic hollow fiber precursors (prepared from
LSCF).
258 Basic Aspects of Polymeric and Inorganic Membrane Preparation

structure, which can only be prepared by multiplesteps if conventional techniques are used.
1.12.4 Sintering
Sintering processes have been studied for long timeand considerable breakthrough in understanding thefundamental aspects of the basic mechanism of sinter-ing of ceramics has been achieved [34, 35]. Insintering the hollow fiber membrane precursorsmentioned above, three main steps including presin-tering, thermolysis, and final sintering are requiredand are described separately in the following sections.
1.12.4.1 Presintering
Sintering does not commonly begin until the tem-perature exceeds one-half to two-thirds of themelting temperature of the material. This tempera-ture will be sufficient to cause a significant atomicdiffusion for solid-state sintering or a significant dif-fusion and viscous flow when a liquid phase is presentor produced by a chemical reaction. In presinteringprocess, the material changes due to heating prior tosintering mainly include vaporization of chemicallycombined water from the surface of particles orformed within inorganic phases containing water ofcrystallization. Therefore, care must be taken to pre-vent the precursor from cracks or fractures because ofthe stresses from the pressure of the vapor evolved orfrom differential thermal expansion of phases. Theinitial heating may remove any liquid remaining afterforming and drying the membrane precursor and anymoisture adsorbed from the atmosphere duringtransporting and setting. The adsorbed moisturemay persist in the membrane precursor up to a tem-perature exceeding 200 �C.
1.12.4.2 Thermolysis
Thermolysis is a process of burning out the organiccomponents such as binder and dispersant. It is animportant step prior to the densification on sintering.Incomplete binder removal and uncontrolled thermo-lysis may introduce membrane defects. These defectsmay impair the performance of the membrane. With theproper choice of binders for the membrane and con-trolled heating in an appropriate atmosphere, themembrane precursors should survive thermolysis with-out deformation, distortion, formation of cracks, orexpanded pores. Binder burn-out is very dependent
on the composition of the binder material and thecomposition and flow of the gas surrounding the pre-cursor. It is also highly dependent on the microstructureof the organic, powder, and porosity phases, anddynamic changes in the microstructure as the binderare eliminated. The thermochemistry of the binder andadditives, binder concentration, precursor dimension,precursor’s configuration, heating rate, and furnaceatmosphere may influence the thermolysis behavior.Precursors containing low amounts of a binder willopen pore channels sufficiently to allow the transportof vapors and gases between the reaction zone and themembrane surface. The time for thermolysis is con-trolled by the diffusion length of vapor-phasetransport rather than the characteristic dimension ofthe binder phase. Decomposition and vaporization ofthe organics will cause an internal gas pressure, whichdepends on the gas evolution rate, gas permeability, andthe precursor size. The gas permeation rate is muchlower in dense precursors of very fine particles. Inprecursors containing a higher organic content, theweight loss is much higher and the time for thermolysiswithout bubbling is relatively long. Thermolysis of anorganic binder in an inert atmosphere such as nitrogen,as it is used when calcining silicon nitride and alumi-num nitride ceramics, proceeds differently. Someresidual carbon may be expected in the absence ofoxygen. The residual carbon commonly removesadsorbed oxygen from surfaces of particles and servesas a sintering aid in carbide nitride ceramics.
1.12.4.3 Final Sintering
Sintering is normally thought to occur in three stages:(1) the initial stage, (2) the intermediate stage, and(3) the final stage [36]. The movements of particleshave different features at each stage and attributed tofull density, grain coarsening, and pores closing. Thetemperature program of sintering process would bedifferent for different materials. Rapid densificationwith limited grain growth occurs at lower tempera-ture followed by rapid grain growth with littledensification at higher temperature as shown inFigure 4.
There are at least six different mechanisms formass transport during sintering as listed in Table 1.All of these will lead to growth of necks betweenparticles. As shown in Figure 5, the neck growthproduces bonding between the particles, so thestrength of the consolidated powders increases dur-ing sintering. Only certain mechanisms, however,lead to shrinkage and densification. Surface diffusion
Ceramic Hollow Fiber Membranes and Their Applications 259

is a general transport mechanism that can produce
surface smoothing, particle joining, and pore round-
ing, but it does not produce volume shrinkage. In
materials where the vapor pressure is relatively
high, sublimation and vapor transport to surfaces of
lower vapor pressure also produce these effects.
Diffusion along the grain boundaries and diffusion
through the lattice of the grains produce both neck
growth and volume shrinkage. The mechanisms of
bulk viscous flow and plastic deformation may be
effective when a wetting liquid is present and when
a mechanical pressure is applied, respectively.
1.12.4.4 Grain Growth
The properties of ceramic membrane are strongly
dependent on its microstructure. The important
microstructural features are the size and shape of
the grains, the porosity, the pore size, and the dis-
tribution of the pores in the structure. In order to
achieve the desired properties during the fabrication
of ceramic membranes, the microstructural features
must be controlled. For most applications, micro-
structural control usually means the achievement of
maximum possible high density, smallest grain size,
and as homogeneous microstructure as possible.
There are a few factors that should be understood
such as how the grains grow, the interaction between
the pores and the moving grain boundaries, and the
coarsening process.Grain growth is the term used to describe the
increase in the grain size of a single-phase solid or
in the matrix grain size of a solid containing
second-phase particles at a sufficiently high tem-
perature. For the conservation of matter, the sum
of the individual grain sizes must remain constant;
therefore, the increase in the average size of the
grains is always accompanied by the disappearance
of some grains, usually the smaller ones. In porous
solids, both the grains and the pores normally
increase in size while decreasing in number.
Frequently, the term ‘coarsening’ is used to
describe the progress by which grains and pores
grow. The driving force for grain growth is the
decrease in grain boundary energy that results
from a decrease on the grain boundary area.
Grain growth in ceramic membranes is generally
divided into two types: normal and abnormal. In
the normal grain growth, the grain sizes and shapes
fall within a fairly narrow range and the distribu-
tion in grain sizes at a later time is fairly similar to
that at an early time. In abnormal grain growth, a
few large grains develop and grow fairly rapidly at
the expense of the smaller ones. The grain size
distribution may change significantly.For stable structures, the grain boundary energy
of all grain boundaries should be the same. The edges
must meet at an angle of 120� . Taking N as the
number of edges, when N¼ 6, grain boundaries are
straight. Gains with N > 6 have concave boundaries,
and those with N < 6 have convex boundaries. Since
the boundaries migrate toward their center of curva-
ture, grains with N > 6 tend to grow while those with
N < 6 tend to shrink.
800
(I) (II) (III)
1100Temperature (°C)
1400 1700
Gra
in s
ize
Den
sity
or
shrin
kage
(%
)
Figure 4 Density or shrinkage and grain size of powder
compact as a function of the sintering temperature.
(a) (b) (c)
Figure 5 A two-sphere sintering model for a qualitative
mechanism for grain growth in porous powder compacts:(a) particles of slightly different size in contact; (b) neck growth
by surface diffusion between particles; and (c) grain growth.
Table 1 Mass transport mechanisms in sintering
Mechanism Densification
Surface diffusion NoEvaporation–condensation No
Grain boundary diffusion Yes
Lattice diffusion Yes
Viscous flow YesPlastic flow Yes
260 Basic Aspects of Polymeric and Inorganic Membrane Preparation

Following the above description of the graingrowth, pore changing in the sintering should be
discussed, because it is the direct reflection of mem-
brane performance. For the case of a grain
surrounded by other grains, a pore is surrounded by
N number of grains. The N is normally called the
pore coordination number. The pore has straight
sides if N¼ 6, convex sides for N < 6, and concave
sides for N > 6 as shown in Figure 6. Since the sur-
face of the pore moves toward its center of curvature,
the pore with N < 6 will shrink, whereas the one with
N > 6 will grow. The pore is metastable for N¼ 6,
and this number is called the critical pore coordina-
tion number Nc. For making a dense membrane, the
shrinkable pores are favorable. This pore can be
obtained by careful control of the particle packing
and the grain growth in the sintering process.
1.12.5 Examples: Preparation ofCeramic Hollow Fiber Membranes
Both dense (nonporous) and porous (ultrafiltration-
type) ceramic hollow fiber membranes can be pre-
pared using the method mentioned above. The dense
membranes have been prepared using membrane
materials of La1 –xSrxCo1 –yFeyO3 –� (LSCF),
SrCe0.95Yb0.05O3–� (SCYb), and YSZ [37–41], while
the porous membranes have been prepared using
Al2O3 [12] and YSZ [42]. Detailed studies in devel-
opment of these ceramic hollow fiber membranes can
be found in literature [37–41], while following exam-ple is focused on the YSZ only.
Materials used in the preparation of YSZ hollowfiber membranes were obtained commercially. Thepowders of 8 mol.% YSZ with particle diameters(d50) of 0.1 and 0.02 mm were purchased fromNexTech Materials Ltd., Ohio. Polyethersulfone(PESf) (Radel A300, Ameco Performance, USA)and 1-methyl-2-pyrrolidinone (NMP) (HPLCgrade, Sigma-Aldrich) were used as the polymerbinder and solvent, respectively. Polyvinyl pyrroli-done (PVP) (Acros Organics) and/or Solsperse 3000(Noveon Inc., Ohio) were used as the additives. Tapwater was used as external coagulant and deionizedwater was used as internal coagulant. The composi-tions of the suspensions for the preparation of theYSZ hollow fiber precursors are given in Table 2.
1.12.5.1 Morphology
Figure 7 shows the scanning electron microscopy(SEM) photographs of the asymmetric structure ofthe YSZ hollow fiber membranes prepared fromstarting suspension S1. As can been seen fromFigures 7(a) and 7(A), the outer and inner diameters(OD/ID) of the hollow fiber precursor and sinteredfiber were measured to be 2.0/1.2 mm and 1.3/0.8 mm, respectively. Figures 7(b) and 7(B), 7(c)and 7(C), and 7(d) and 7(D) show the cross-sectionalstructures, inner surfaces, and outer surfaces of pre-cursor and sintered fiber, respectively. As can beseen, a finger-like structure is formed in the inner
(a) (b) (c)
Figure 6 Pore stability in two dimensions for a dihedral of 120�: (a) pore shrinks; (b) metastable; and (c) pore grows.
Table 2 Composition of YSZ starting suspensions for spinning precursors
Composition (wt.%)
Starting suspension YSZ (0.1mm) YSZ (20nm) NMP PESf Additive
S1 55 38.5 6.0 0.5
S2 45 10 38.5 6.0 0.5
S3 45 47.1 7.3 0.6
Ceramic Hollow Fiber Membranes and Their Applications 261

surface and is then gradually transformed to a denser
sponge-like structure toward outer surface. Such a
structure was formed due to the several factors such
as viscous fingering phenomenon and movement of
particles. During the spinning of the ceramic mem-
brane precursors, pure water was used as the internal
coagulant and was immediately in contact with the
high viscous suspension. Therefore, the hydrodyna-
mically unstable viscous fingering takes place,
resulting in finger-like structures in the inner surface
as long as the rate of viscous fingering is greater than
that of phase inversion. Figure 7 also illustrates that
the finger-like structure in outer surface of the hol-
low fiber is much suppressed. This is because during
the spinning of the fiber precursors, an air gap longer
than 15 cm was used so that the external surface of
the nascent fiber experienced solvent evaporation
and absorption of water moisture from air, both of
which would induce the phase inversion of the poly-
mer binder. Therefore, the viscous fingering may not
be possible to establish, as solidification of the outer
surface takes place before immersing the nascent
fiber into the external coagulation bath.Figure 7 further illustrates that the asymmetric
structure is generally maintained after high tempera-
ture sintering. Compared to the inner porous surface
of the fiber as shown in Figure 7(C), Figure 7(D)
depicts the outer surface of the sintered fiber, which
is dense and smooth and consists of tightly connected
grains with clear boundaries formed during sintering.
The size of grains is in the range between 1 and 3 mm,
which is grown compared to the initial particle size
used in the starting suspension.The effect of sintering conditions on the mem-
brane surface morphology was further investigated.
Figure 8 illustrates evolution of the surface morphol-
ogies at different sintering temperatures between
1000 and 1500 �C, with the sintering time of 4 and
8 h, respectively. It can be seen that porosities of the
membrane surface are reduced greatly when the sin-tering temperature is increased for both the sintering
time of 4 and 8 h. At the sintering temperature of
1000 �C, the membrane surface almost remains
unchanged as the original morphology formed by
the raw particles as shown in Figure 8(A). Obvious
changes in the surface morphology take place at
about 1200 �C, and the interconnected pores are
observed from the membrane surface as shown in
Figures 8(b) and 8(B) for both the sintering time of
4 and 8 h. At sintering temperature of 1300 �C, the
interconnected pores are still observed from themembrane surface as shown in Figures 8(c) and
8(C), although their porosities are much reduced
compared to those sintered at 1200 �C. When the
sintering temperature is increased to 1400 �C, the
membrane surface becomes almost fully dense as
shown in Figures 8(d) and 8(D). On further increas-
ing the sintering temperature up to 1500 �C, no
obvious pores can be observed; the grain size is
increased considerably as shown in Figures 8(e)
and 8(E). Compared to the membrane surfaces sin-
tered at temperatures of 1200 and 1300 �C for 4 h (asshown in Figures 8(b) and 8(c)), the porosity of the
membrane surfaces sintered at the same temperatures
for 8 h is much smaller (as shown in Figures 8(B) and
8(C)). The above observation indicates that both
sintering temperature and sintering duration play
important roles for pore elimination of the YSZ hol-
low fiber membranes. The SEM photographs shown
above provide useful information on the sintering
behavior of the prepared YSZ hollow fiber
membranes.Based on the particle packing principle, the voids
(pores) formed between the particles can be reduced
by filling the voids with smaller particles [23]. The
effect of smaller particles on the surface morphology
(a) (b) (c) (d)
(A) (B) (C) (D)
Figure 7 Structures of YSZ hollow fiber membranes prepared using starting suspension of S1: (a–d) before sintering, (A–D)after sintering at 1500 �C for 4 h; (a, A) whole fiber; (b, B) cross section; (c, C) inter surface; and (d, D) outer surface.
262 Basic Aspects of Polymeric and Inorganic Membrane Preparation

of the membranes was investigated using the startingsuspension of S2 where 10% of 0.1 mm was replacedby 20 nm particles. SEM observation of the resultantmembrane is given in Figure 9 together with theSEM of the membrane prepared from S3 at theidentical sintering condition for comparison purpose.It can be seen that the membrane surface obtainedusing low powder contents of S3 (45% of 0.1 mmpowders) and sintered at 1200 �C is still very porous(Figure 9(a)). However, the porosity of the YSZhollow fiber membrane is considerably reduced if a
10% of 20 nm particles is added in the starting sus-pension as shown in Figure 9(b). It follows thataddition of smaller particles would enhance thedensification of the membrane, which would be par-ticularly important if the prepared YSZ membrane isused as a membrane electrolyte for SOFCs.
Figure 10 shows the atomic force microscopy(AFM) images of the outer surface of the preparedYSZ hollow fiber membranes, which are presented in(5 mm� 5 mm) scanning area. It can be seen that thesurface of the membranes is not smooth but consists
(A)
(b)
(c)
(d)
(e)
(B)
(C)
(D)
(E)
Figure 8 Surface morphology of the YSZ membranes prepared using S1 and sintered at different temperatures for 4 (b–e)and 8 (A–E) h, respectively; (A) 1000 �C, (b, B) 1200 �C, (c, C) 1300 �C, (d, D) 1400 �C, and (e, E) 1500 �C.
Ceramic Hollow Fiber Membranes and Their Applications 263

of a mass of peaks (bright region) and valleys (dark
region). Roughness of the membranes (in terms of the
mean roughness, Ra) and the root mean square
roughness, Rq, are obtained from the AFM images
and are summarized in Table 3. Obviously, the
membrane’s roughness may reflect the surface por-
osity of the membrane because the valleys may
probably be the membrane’s pores on the surface.
1.12.5.2 Permeation Characteristics
A gas permeation test using purified nitrogen as atest gas was carried out to determine the permea-tion characteristics of the YSZ hollow fibermembrane prepared [42]. Since the membranes pre-pared using the staring suspension of S3 are veryporous and showed remarkable high gas permeance,only the effect of sintering temperature on the gaspermeance for the membranes prepared using star-ing suspensions of S1 and S2 was studied and theresults are illustrated in Figure 11. As can be seen,the gas permeance for both membranes decreases assintering temperature is increased. The gas-tightproperty for the membrane prepared using S1could be achieved at sintering temperature of1400 �C, whereas the membrane prepared using S2still showed a nitrogen permeance of10.6� 10�7 mol m�2 Pa�1 s�1 at same sintering con-dition and could not be gas-tight unlessthe sintering temperature is increased to 1500 �C.It should be noted that the gas-tight property forthe membrane of S1 was further determined using amethod developed by Tan et al. [43]. The obtainednitrogen permeance is less than 2.0� 10�10molm�2Pa�1s�1, further confirming that the mem-brane is nonporous and is gas tight.
(a) (b)
Figure 9 Surface morphology of the YSZ membranes sintered at 1200 �C and prepared from (a) S3 and (b) S2.
12
3
(a)
(b)
4
x 1 000 µm/d1vz 500 000 nm/d5v
µm
12
34
x 1 000 µm/d1vz 500 000 nm/d5v
µm
Figure 10 AFM images of the YSZ membranes. S1sintered at: (a) 1200 �C and (b) 1300 �C.
Table 3 Surface roughness data
Roughness (scansize¼5 mm� 5 mm)
Membranes ofS1 sintered at: �C
Ra(nm)
Rq(nm)
1200 42.41 54.40
1300 34.06 41.88
264 Basic Aspects of Polymeric and Inorganic Membrane Preparation

It should be noted that although similar result tothe above was also obtained by Tan et al. [12], it is
contrary to the analysis conducted by Lu [44] who
showed theoretically that the porosity (hence per-
meance) of a ceramic powder compact reduces when
smaller particles are used alone for the preparation of
the powder compact. In general, addition of smaller
particles would enhance the densification, that is,
reduce the volumetric pores. However, it may not
be true for the surface pores (through pores for per-
meation). In this study, an immersion-induced phase-
inversion process was employed for spinning of the
hollow fiber. As pore formers were added into the
spinning suspension, asymmetric structure and sur-
face pores of the fiber precursor were formed during
the coagulation process and were altered after the
sintering. In view of the complicity of the combined
spinning and sintering processes, the relationship
between the particle size and the structure of the
final resultant membrane remains unclear and needs
to be further explored. The presence of the 20 nm
particles, however, enhances significantly the
mechanical strength of the hollow fibers as shown
in Section 1.12.5.3.Based on the gas permeation data plotted in
Figure 11, the membranes sintered at temperature
less than 1400 �C are porous. Thus, the data were
used to calculate the pore-size distribution of the
membranes using a method developed by Kong and
Li [45]. The purpose of this analysis is obviously to
investigate the behavior of surface porosity in the
membranes, as it is impossible to obtain membranes
with absolutely uniform pore size using the method
described above. In fact, the membrane pore size
varies according to a pore-size distribution function.
Comparison between S1 and S2 at sintering tem-
peratures of 1200 and 1400 �C for 4 h was carried
out. The behaviors of the pore-size distribution are
shown in Figure 12 where the x-axis represents the
membrane pore radius, r (mm), and the y-axis repre-
sents the log–normal distribution function, g(r), as
follows [45]:
gðrÞ ¼ 1ffiffiffiffiffiffiffiffi2�rp ½lnð1þ �2Þ� – 0:5
� exp –ðlnðr=rmÞð1þ �2Þ0:5Þ2
2 lnð1þ �2Þ
" #ð2Þ
where rm is the mean pore radius and s is the dimen-sionless standard deviation of the membrane pore
11000
20
40
60
80
100N
itrog
en p
erm
eatio
n ra
te(m
ol m
2 s–1
Pa
–1 ×
107 )
1200 1300 1400Temperature (°C)
1500
S1S2
1600
Figure 11 Gas permeance of the YSZ hollow fiber
membranes prepared using starting suspensions of S1 andS2 at different sintering temperatures for 8 h.
12S1 sintered at 1200 °C
10
8
6
4
2
0
12
S2 sintered at 1200 °C10
8
6
4
2
0
12
Dis
trib
utio
n fu
nctio
n va
lue,
g(r
)
S2 sintered at 1400 °C10
8
6
4
2
00 0.1 0.2 0.3
Pore radius, r (µm)0.4
Figure 12 Pore-size distributions of S1 and S2 (sintering
time: 4 h).
Ceramic Hollow Fiber Membranes and Their Applications 265

size. It can be seen that at sintering temperature of1200 �C, both S1 and S2 show similar distributionprofiles with the mean pore radius of 0.07 and0.03 mm, respectively. When the sintering tempera-ture was increased to 1400 �C, the membrane fromS1 achieved gas-tight, suggesting that surfacepores were eliminated at this temperature as shownin Figure 11, while the membrane prepared fromS2 still showed a nitrogen permeance of10.6� 10�7 mol m�2 Pa�1 s�1 with a narrow distribu-tion as shown in Figure 12 compared to that sinteredat 1200 �C, although the mean pore size remainedunchanged at 0.03 mm. It should be noted that theresults on the narrow distribution with increasedsintering temperature are uncommon, as the reduc-tion in porosity should normally be at the expense ofsmaller pores. The reason for such contrary resultsmay be due to the fact that the pores measured usingthe gas permeation technique are through pores only.Large pores growing due to the increase of sinteringtemperatures may be dead-end pores and cannot bedetected by the gas permeation technique.
The above gas-permeation analysis suggests thatboth porous and nonporous YSZ hollow fiber mem-branes can be prepared, depending on the sinteringconditions. Pore sizes of the YSZ membrane pre-pared fall into the pore-size range of untrafiltrationmembranes. However, the surface porosities of themembranes prepared from S2 and sintered at 1200and 1400 �C are around 5000 and 300 m�1, respec-tively. The former is comparable to the polymericPVDF membranes, whereas the latter is an order ofmagnitude smaller [46].
1.12.5.3 Mechanical Strength
The effects of particle size on the mechanicalstrength of YSZ hollow fiber membranes werestudied using the suspension containing uniform-
sized particles (S1 and S3) and mixed-sized parti-
cles (S2). The bending strength of YSZ hollow fiber
membranes is plotted against the various sintering
temperatures (from 1200 to 1500 �C) and sintering
duration (30 min, 4 h, and 8 h). The effects of sin-
tering temperature on the fiber mechanical
strength are illustrated in Figure 13. A mild
improvement in the membrane mechanical
strength was observed for the membrane prepared
using uniform-sized particle following a short
sintering time of 0.5 h (S1 and S3) (Figure 13(a)).
With increase in the sintering duration, two dis-
tinctive membrane strength profiles were unveiled,
as shown in Figures 13(b) and 13(c). Mechanical
strength for membrane prepared using the starting
suspension of S3 showed little variation despite the
increase in sintering duration (Figures 13(b) and
13(c)). On the other hand, the membrane prepared
using starting solution S1 exhibited a maximum
bending strength at midway sintering temperature
for 4 and 8 h sintering duration. An improved
mechanical strength was noted for the membrane
prepared using mixed-sized particles (S2) following
the increase in sintering temperatures for all of the
sintering duration studied (Figures 13(a)–13(c)).
1.12.5.4 Conclusion
The above experimental results and analyses suggest
that both porous and nonporous asymmetric YSZ
hollow fiber membranes can be prepared depending
on phase inversion parameters and the sintering con-
ditions. A well-designed phase inversion/sintering
process coupled with an optimal condition of a start-
ing suspension is the key in obtaining asymmetric
hollow fiber membranes with desired permeation
characteristics as well as excellent mechanical
strength.
500(a) (b) (c)
400
300
200
100
01100 1200 1300 1400 1500 1600
Temperature (°C)
S1S2S3
Ben
ding
stre
ngth
(M
Pa)
500
600
400
300
200
100
01100 1200 1300 1400 1500 1600
Temperature (°C)
S1S2S3
Ben
ding
str
engt
h(M
Pa)
500
400
300
200
100
01100 1200 1300 1400 1500 1600
Temperature (°C)
S1S2S3
Ben
ding
str
engt
h(M
Pa)
Figure 13 Mechanical strength of the YSZ hollow fiber membranes prepared using different starting suspensions for: (a)0.5 h; (b) 4 h; and (c) 8 h.
266 Basic Aspects of Polymeric and Inorganic Membrane Preparation
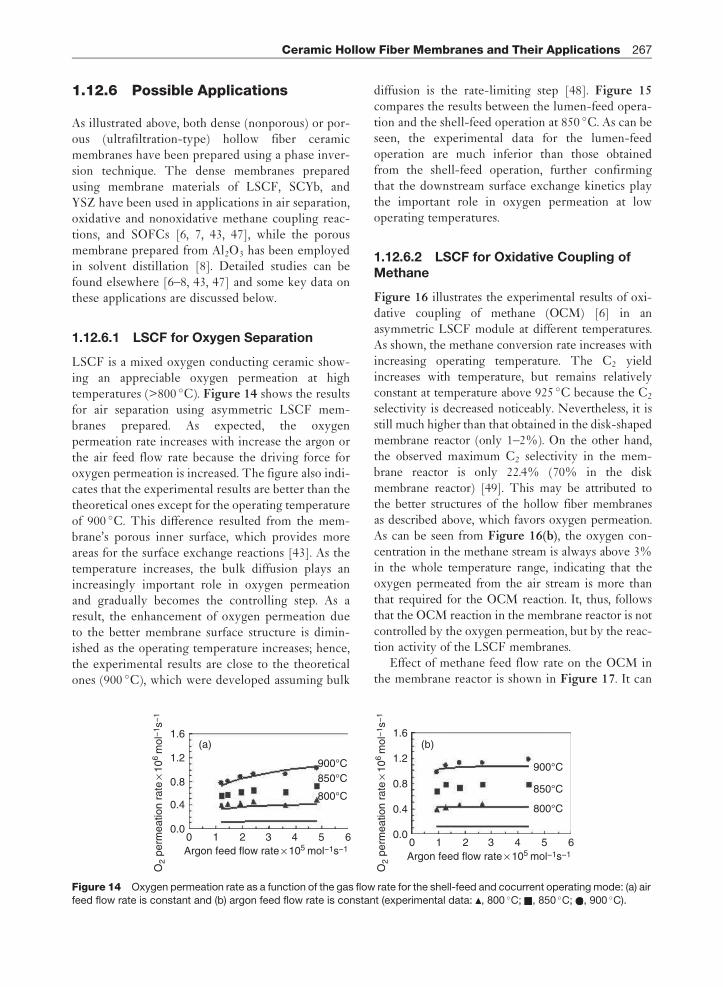
1.12.6 Possible Applications
As illustrated above, both dense (nonporous) or por-ous (ultrafiltration-type) hollow fiber ceramicmembranes have been prepared using a phase inver-sion technique. The dense membranes preparedusing membrane materials of LSCF, SCYb, andYSZ have been used in applications in air separation,oxidative and nonoxidative methane coupling reac-tions, and SOFCs [6, 7, 43, 47], while the porousmembrane prepared from Al2O3 has been employedin solvent distillation [8]. Detailed studies can befound elsewhere [6–8, 43, 47] and some key data onthese applications are discussed below.
1.12.6.1 LSCF for Oxygen Separation
LSCF is a mixed oxygen conducting ceramic show-ing an appreciable oxygen permeation at hightemperatures (>800 �C). Figure 14 shows the resultsfor air separation using asymmetric LSCF mem-branes prepared. As expected, the oxygenpermeation rate increases with increase the argon orthe air feed flow rate because the driving force foroxygen permeation is increased. The figure also indi-cates that the experimental results are better than thetheoretical ones except for the operating temperatureof 900 �C. This difference resulted from the mem-brane’s porous inner surface, which provides moreareas for the surface exchange reactions [43]. As thetemperature increases, the bulk diffusion plays anincreasingly important role in oxygen permeationand gradually becomes the controlling step. As aresult, the enhancement of oxygen permeation dueto the better membrane surface structure is dimin-ished as the operating temperature increases; hence,the experimental results are close to the theoreticalones (900 �C), which were developed assuming bulk
diffusion is the rate-limiting step [48]. Figure 15compares the results between the lumen-feed opera-tion and the shell-feed operation at 850 �C. As can beseen, the experimental data for the lumen-feedoperation are much inferior than those obtainedfrom the shell-feed operation, further confirmingthat the downstream surface exchange kinetics playthe important role in oxygen permeation at lowoperating temperatures.
1.12.6.2 LSCF for Oxidative Coupling ofMethane
Figure 16 illustrates the experimental results of oxi-dative coupling of methane (OCM) [6] in anasymmetric LSCF module at different temperatures.As shown, the methane conversion rate increases withincreasing operating temperature. The C2 yieldincreases with temperature, but remains relativelyconstant at temperature above 925 �C because the C2
selectivity is decreased noticeably. Nevertheless, it isstill much higher than that obtained in the disk-shapedmembrane reactor (only 1–2%). On the other hand,the observed maximum C2 selectivity in the mem-brane reactor is only 22.4% (70% in the diskmembrane reactor) [49]. This may be attributed tothe better structures of the hollow fiber membranesas described above, which favors oxygen permeation.As can be seen from Figure 16(b), the oxygen con-centration in the methane stream is always above 3%in the whole temperature range, indicating that theoxygen permeated from the air stream is more thanthat required for the OCM reaction. It, thus, followsthat the OCM reaction in the membrane reactor is notcontrolled by the oxygen permeation, but by the reac-tion activity of the LSCF membranes.
Effect of methane feed flow rate on the OCM inthe membrane reactor is shown in Figure 17. It can
1.6
1.2
0.8
0.4
O2
perm
eatio
n ra
te ×
106
mol
−1 s
−1
0.00 1 2
900°C
(a) (b)
850°C
800°C
900°C
850°C
800°C
3Argon feed flow rate × 105 mol−1s−1
4 5 6
1.6
1.2
0.8
0.4
O2
perm
eatio
n ra
te ×
106
mol
−1 s
−1
0.00 1 2 3Argon feed flow rate × 105 mol−1s−1
4 5 6
Figure 14 Oxygen permeation rate as a function of the gas flow rate for the shell-feed and cocurrent operating mode: (a) air
feed flow rate is constant and (b) argon feed flow rate is constant (experimental data: , 800 �C; , 850 �C; , 900 �C).
Ceramic Hollow Fiber Membranes and Their Applications 267

be seen that both the methane and oxygen conver-sions decrease with increasing the methane feed flowrate. This suggests that more oxygen reacts withmethane into C2 instead of carbon oxides as theflow rate of CH4–Ar is increased. The C2 selectivityincreases with the methane feed flow rate due to thedecrease in the local oxygen concentration. Themaximum C2 yield in the membrane reactor canreach 15.3%, which is much higher than the fixedbed reactor and the disk-shaped membrane reactor.
1.12.6.3 SCYb for Non-OCM
SCYb is a proton-hole conducting ceramics and itsasymmetric hollow fiber membranes prepared can beused for nonoxidative methane coupling reactions
[47]. The results from the SCYb membrane reactor
are shown in Figure 18. As shown, the methane
conversion increases with increasing temperature
until it reaches 82.7% at 1000 �C. However, the C2
selectivity is gradually decreased as the temperature
increases, the maximum of which is only about 60%
at 750 �C. This value is much less than that expected
for no oxygen taking part in the methane compart-
ment. The reasons for this include the further
conversion of C2 products into higher hydrocarbons,
as shown in Figure 19. Furthermore, SCYb also
exhibits some oxygen ion conduction at a very high
temperature, leading to oxygen permeation into the
methane side that reduces the C2 selectivity. As a
result, only 15.3% of the C2 selectivity is achieved at
20
16
12
8
4
0
In air
In methane
0.2
Oxy
gen
perm
eatio
n flu
x,cm
3 (S
TP
)/cm
2 m
in
0.1
0.3
0.0750 810 870 930
Temperature (°C)990 1050
6
12
C2
sele
ctiv
ity o
r yi
eld
(%)
O2
conc
entr
atio
n (%
)M
etha
ne c
onve
rsio
n (%
)
18
24
0
30(a)
(b)
SC2
YC2
X CH4
0
20
40
60
80
100
Figure 16 Effect of temperature on OCM in the LSCF (Air
feed¼ 22.96 and methane feed ¼17.2 cm3(STP)min�1).
50
20
40
60
20Con
vers
ion
(%)
C2
sele
ctiv
ity (
%)
40
60
80
10
YC2
SC2
15
Oxygen
Methane
20Feed flow rate of methane (cm3 min–1)
25 30
Figure 17 Effect of methane feed flow rate on OCM in theLSCF (air feed¼ 32.9 cm3(STP) min�1, T¼ 950 �C.
7000
20
Met
hane
con
vers
ion
or C
2 se
lect
ivity
(%
)
C2
yiel
d (%
)
C2 yield
40
60
80
100
800 900
Methane conversion
10000
4
8
12
16
Temperature (°C)
C2 selectivity
Figure 18 Methane coupling in the SCYb.
0
Lumen-feedShell-feed
0.0
0.2
0.4
0.6
0.8
1.0
1.2
1 2 3 4Argon feed flow rate × 105 mol−1s−1
5 6
O2
perm
eatio
n ra
te×
106
mol
−1 s
−1
Figure 15 Comparison between lumen- and shell-feedmodes.
268 Basic Aspects of Polymeric and Inorganic Membrane Preparation

the temperature of 1000 �C. Nevertheless, the C2
yield still increases from 3.6% to 13.4% as the tem-perature increases from 750 to 950 �C, but then isdecreased with further increasing temperature.Although the obtained C2 yield is still much lowerthan the desired industrially expected value, whichwas usually considered to be above 30%, it is muchhigher than most literature values obtained in disk-shaped membranes.
1.12.6.4 Solvent Distillation
Distillation is considered as a workhorse in petro-chemical industries for decades [8]. The processconsumes a large amount of energy and is one ofthe major costs in oil production [50]. Distillation isusually carried out in conventional tray columns,whereas the use of packed columns has been increas-ing recently because they hold many advantages,such as lower pressure drop, lower liquid hold-up,and higher efficiency. [51]. The improvement of thedistillation column efficiency largely resulted fromcontinuous development in column packings. So far,the fourth generation of random packings and theimproved structured packings are considered to bethe state-of-the-art ones, giving a height of transferunit (HTU) as low as 0.3 m [52].
Recently, a new concept of column packings hasbeen proposed by Zhang and Cussler [53] who firstexplored the feasibility of distillation using a hollowfibers membrane contactor. Such a device is verysimilar to a conventional packed column but theonly difference is that the column is packed with a
large number of hollow fibers. In the operation, thevapor flows on the shell side of the hollow fibers,whereas the liquid flows on the tube side. The masstransfer then takes place through the membraneswithout any mixing of the two phases, driven by theconcentration gradient of the components. Sincethere is no direct contact between vapor and liquid,almost all hydrodynamic problems, normally foundin conventional devices, such as flooding, loading,weeping, and foaming, are eliminated. In addition,one of the most important advantages is the largesurface area per unit volume, provided by smalldiameter hollow fibers, which can improve the effi-ciency of the column. Many more advantages ofhollow fiber membrane contactors have been elabo-rated in details by Gabelman and Hwang [54].
A few binary solvent pairs have been used in thestudies of distillation by a hollow fiber membranecontactor. Zhang and Cussler [53] employed acontactor packed with polyether membranescoated with polydimethylsiloxane to distil the mix-ture of isopropanol and water. The module wasable to operate above the flooding limit of conven-tional columns with the HTU as low as 11 cm. Asimilar work to separate methanol from deionizedwater was carried out by Zhang et al. [55] whoshowed even a smaller HTU of 8 cm, implyingthe high efficiency of the system. The distillationof methanol and ethanol was studied by Chunget al. [56] using different types of coated and porousmembranes. The results showed no significant dif-ference in the separation by different membranesused. This new distillation concept was alsoapplied to the olefin/paraffin separation, operatedat room temperature. High capacity and excellentmass transfer efficiency were reported [57].
Although the above studies [53–57] have beencarried out to prove the concept of distillation inhollow fiber-packed columns, the investigators haverealized that this new type of packing is still far frompractical applications. The main problem is the lim-ited stability of the polymeric membranes whichobviously cannot withstand high temperature andharsh chemical conditions usually found in industrialdistillation. So, the distillation columns developedare limited to the operation at low temperature andto separate weak solvents only. Koonaphapdeelertet al. [8] recently attempted in developing hollowfiber membranes from alumina, which is the samematerial used to produce commercial random pack-ings for the solvent distillation. It is expected thatthe novel ceramic hollow fiber can provide better
7000.00
0.01
0.02
0.03
0.04
0.05
C3
C4C5
800 900Temperature (°C)
For
mat
ion
rate
of C
3–C
5 (µ
mol
min
–1)
1000
Figure 19 C3–C5 formation rates as a function of
temperature (feed flow rate of methane stream¼4.3 cm3
(STP) min�1, methane feed concentration¼ 9.22%, air feedflow rate¼40 cm3 (STP) min�1).
Ceramic Hollow Fiber Membranes and Their Applications 269

thermal and chemical stability compared to thepolymeric ones and, thus, has been tested in dis-tillation of a strong solvent pair of the benzene–toluene system. The distillation experiment wasconducted in an apparatus shown in Figure 20.The experimental results indicated that the systemhas high capacity which allows the distillation tobe operated many times above the flooding limit ofconventional equipments. This feature is the func-tion of the hollow fiber membranes that separatethe vapor from the liquid phases. Therefore, thereis no hydrodynamic problem such as flooding andloading, commonly found in conventional distilla-tion columns. Moreover, the efficiency ofseparation, measured by the HTU, is very highcompared to conventional equipments. The lowestHTU found is as small as 10.1 cm. This means themembrane contactor is not only more productive,but also more efficient [8].
1.12.6.5 Solid Oxide Fuel Cells
SOFCs, known for their high (up to 80%) chemicalto electrical conversion efficiencies, their versatilityin fuel intake (hydrogen, natural gas, methanol andother petroleum products, etc.), and their relativelyenvironmentally benign operation, have a high
market potential, but are not yet mass produced,because of outstanding technological and economicissues. Wei and Li [7] addressed these problems byestablishing the feasibility of, and developing, anovel design of SOFC, fabricated using hollowfibers, thereby increasing the specific surface areaof electrodes, increasing the power output per unitvolume/mass, facilitating sealing at high tempera-tures, and decreasing costs. The electrolyte in thehollow fiber configuration was fabricated primarilyby a combined phase inversion/sintering technique;it consists of a thin dense layer, with integratedporous sublayers on one side. The porous sublayerswere deposited with anode and cathode materials, toproduce a single hollow fiber SOFC, bundles ofwhich can be assembled subsequently into anSOFC stack.
Figure 21 shows a SEM and a digital photo of asingle hollow fiber SOFC based on YSZ electrolytemembrane [7]. The porous inner surface provides ahigher surface area for Ni loading and the denselayer at outer wall provides good ionic conductivity.The YSZ hollow fiber electrolyte membrane dis-played a good mechanical strength and excellentgas-tight property. After coating with cathode(LSCF/YSZ) and anode (Ni) as shown inFigure 21(b), the hollow fiber SOFC was testedfor its electrochemical performance and the resultsare given in Figure 22. As can be seen, in most tests,the relation between power densities and currentdensities tends to be parabolic, but these densitiestake different time to reach their maximum value.The maximum power density was about0.018 W cm�2 at 800 �C with an effective operatinglength of 4 cm (constant temperature zone of thefurnace). The power densities of electrolyte sup-ported SOFCs are relatively lower than othertypes of supported SOFCs. Although the thickerelectrolyte would provide good mechanical strength,one of the disadvantages of the electrolyte-sup-ported SOFCs is the higher electrolyte ohmic losswhich causes a lower power density. Therefore, it isimportant to minimize the thickness of electrolyteand, at the same time, to maintain sufficientmechanical strength. Apart from minimizing theohmic loss, Hatchwell et al. [58] demonstrated thatimprovement of interconnection between electrodeand electrolyte could also enhance power densities.It is, therefore, envisaged that the power density canbe considerably improved once the structure of theelectrolyte supported is optimally designed.
Refluxreservoir Reflux
pump
Condenser
Distillatereservoir
Hollow fibermodule
Valve
Voltagecontroller
Heating mantle
Reboiler
Figure 20 Schematic setup of a hollow fiber membranecontactor of solvent distillation.
270 Basic Aspects of Polymeric and Inorganic Membrane Preparation

1.12.7 Conclusions
The recent development on ceramic hollow fiber
membranes and its applications in separations and
catalytic chemical reactions have been presented.
These membranes have shown promising applications
in oxygen separation, methane coupling reation,
solvent distillation, and solid oxide fuel cells.
Although some progresses have been achieved,
there is still a long way to go before the successful
applications of these ceramic hollow fiber mem-
branes in separation and reaction can be achieved
in industrial scales. Significant achievements in this
new research area would become feasible if joint
efforts were established from both material scientists
and chemical engineers.
References
[1] Guizard, C., Ayral, A., Julbe, A. Desalination 2002,147(1–3), 275–280.
[2] Lee, S., Cho, J. Desalination 2004, 160(3), 223–232.[3] Weber, R., Chmiel, H., Mavrov, V. Desalination 2003,
157(1–3), 113–125.[4] Terry, P. A., Anderson, M., Tejedor, I. J. Porous Mater.
1999, 6(4), 267–274.[5] Takehira, K., Sakai, N., Shimomura, J., et al. Appl. Catal.
A: Gen. 2004, 277(1–2), 209–217.[6] Tan, X. Y., Li, K. Ind. Eng. Chem. Res. 2006, 45(1),
142–149.[7] Wei, C. C., Li, K. Ind. Eng. Chem. Res. 2008, 47(5),
1506–1512.
(b)
(a)
Figure 21 Overall views: (a) SEM image of hollow fiber SOFC and (b) digital picture of hollow fiber SOFC.
0.00
0
Vol
tage
(V
)
1
2
0.01 0.02 0.03
Current density (A cm–2)
Pow
er d
ensi
ty (
W c
m–2
)
0.04 0.05 0.06 0.070.000
0.002
0.004
0.006
0.008
0.010
0.012
0.014
0.016
0.018
0.020
800 °C
700 °C
600 °C
Figure 22 The performance of hollow fiber solid oxidefuel cell showing voltage and power density as function of
current density and temperature. The cell consisted of air,
(LSCFþYSZ)/YSZ/Ni, H2 at a constant gas flow rate of
20 cm3 (STP) min�1.
Ceramic Hollow Fiber Membranes and Their Applications 271

[8] Koonaphapdeelert, S., Tan, X., Wu, Z., Li, K. J. Membr.Sci. 2008, 314(1–2), 58–66.
[9] Koonaphapdeelert, S., Li, K. Desalination 2006, 200(1–3),581–583.
[10] Julbe, A., Farrusseng, D., Guizard, C. J. Membr. Sci.2001, 181(1), 3–20.
[11] Way, J. D., Roberts, D. L. Sep. Sci. Technol. 1992, 27(1),29–41.
[12] Tan, X., Liu, S., Li, K. J. Membr. Sci. 2001, 188(1), 87–95.[13] Liu, S. M., Li, K., Hughes, R. Mater. Res. Bull. 2004, 39(1),
119–133.[14] Liu, S. M., Li, K., Hughes, R. Ceram. Int. 2003, 29(8),
875–881.[15] Liu, S. M., Li, K. J. Membr. Sci. 2003, 218(1–2), 269–277.[16] Liu, S. M., Tan, X. Y., Li, K., Hughes, R. J. Membr. Sci.
2001, 193(2), 249–260.[17] Hsieh, H. P. Inorganic Membranes for Separation and
Reaction; Elsevier: Amsterdam, 1996; pp 23–86.[18] Tan, X. Y., Liu, S. M., Li, K. J. Membr. Sci. 2001, 188(1),
87–95.[19] Bideau, D., Troadec, J. P. J. Phys. C: Solid State Phys.
1984, 17(28), L731–L735.[20] Visscher, W. M., Bolsterl, M. Nature 1972, 239(5374),
504–507.[21] Kausch, H. H., Fesko, D. G., Tschoegl, N. W. J. Colloid
Interface Sci. 1971, 37(3), 603–611.[22] Starr, T. L. Am. Ceram. Soc. Bull. 1986, 65(9), 1293–1296.[23] Rahaman, M. N. Ceramic Processing and Sintering;
Marcel Dekker: New York, 1995; pp 265–279.[24] Lee, B. I., Rives, J. P. Colloids Surf. 1991, 56, 25–43.[25] Mikeska, K. R., Cannon, W. R. Dispersants for Tape
Casting Barium Titanate. In Advances in Ceramics;Mangels, J. A., Messing, G. L. Eds.; The AmericanCeramic Society: Westerville, 1984; pp 164–183.
[26] Bergstrom, L. J. Am. Ceram. Soc. 1996, 79(12),3033–3040.
[27] Bergstrom, L. Rheology of Concentrated Suspensions. InSurface and Colloid Chemistry in Advanced CeramicsProcessing; Pugh, R. J., Bergstorm, L., Eds.; MarcelDekker: New York, 1994; pp 193–244.
[28] Bergstrom, L. Surface and Colloid Chemistry. InAdvanced Ceramic Processing; Pugh, P. J.,Bergstrom, L., Eds.; Marcel Dekker: New York, 1994;pp 193–224.
[29] Kitano, T., Kataoka, T., Shirota, T. Rheol. Acta 1981,20(2), 207–209.
[30] Sakka, S. Rheology of Sols in Sol–Gel Processing. In Sol–Gel Science and Technology; Aegerter, M. A.,Jafelicci, M., Souza, D. F., Zanotto, E. D.; Eds.; WorldScientific Publisher: Singapore, 1989; pp 76–103.
[31] Deshmukh, S. P., Li, K. J. Membr. Sci. 1998, 150(1),75–85.
[32] Loeb, S., Sourirajan, S. Sea Water Demineralization byMeans of an Osmotic Membrane. In Saline Water
Conversion – II, Advances in Chemistry; Gould, R. F., Ed.;American Chemical Society: Washington, DC, 1963;pp 117–132.
[33] Chung, T. S., Jiang, L. Y., Li, Y., Tin, P. S.,Kulprathipanja, S. NAMS 2006, 2006; Chicago, IL,USA.
[34] Richardson, D. W. Morden Ceramic Engineering; MarcelDekker: New York, 1992.
[35] Binner, J. G. P. Advanced Ceramic Processing andTechnology; Noyes Publications: Park Ridge, NJ, 1990.
[36] Reed, J. S. Principles of Ceramic Processing, 2nd edn.;Wiley: New York, 1995.
[37] Tan, X. Y., Liu, Y. T., Li, K. Ind. Eng. Chem. Res. 2005,44(1), 61–66.
[38] Liu, L. H., Tan, X. Y., Liu, S. M. J. Am. Ceram. Soc. 2006,89(3), 1156–1159.
[39] Liu, Y., Tan, X., Li, K. J. Membr. Sci. 2006, 283(1–2),380–385.
[40] Liu, Y. T., Tan, X. Y., Li, K. AIChE J. 2006, 52(4),1577–1585.
[41] Liu, Y., Chen, O. Y., Wei, C. C., Li, K. Desalination 2006,199(1–3), 360–362.
[42] Wei, C. C., Chen, O. Y., Liu, Y., Li, K. J. Membr. Sci. 2008,320(1–2), 191–197.
[43] Tan, X., Liu, Y., Li, K. AIChE J. 2005, 51(7), 1991–2000.[44] Lu, G. Q. M. J. Mater. Process. Technol. 1996, 59(4),
297–302.[45] Kong, J., Li, K. J. Membr. Sci. 2001, 182(1–2), 271–281.[46] Li, K., Kong, J., Tan, X. Chem. Eng. Sci. 2000, 55(23),
5579–5588.[47] Liu, Y. T., Tan, X. Y., Li, K. Ind. Eng. Chem. Res. 2006,
45(11), 3782–3790.[48] Xu, S. J., Thomson, W. J. Chem. Eng. Sci. 1999, 54(17),
3839–3850.[49] ten Elshof, J. E., Bouwmeester, H. J. M., Verweij, H. Appl.
Catal. A: Gen. 1995, 130, 195–212.[50] Mix, T. W., Dweck, J. S., Weinberg, M., Armstrong, R. C.
Chem. Eng. Prog. 1978, 74(4), 49–55.[51] Sinnott, R. K. Coulson & Richardson’s Chemical
Engineering; Pergamon: Oxford, 1993.[52] Schultes, M. Trans. IChemE A 2003, 81(A1), 48–57.[53] Zhang, G., Cussler, E. L. AIChE J. 2003, 49(9),
2344–2351.[54] Gabelman, A., Hwang, S.-T. J. Membr. Sci. 1999,
159(1–2), 61–106.[55] Zhang, G., Lin, L., Meng, Q., Xu, Y. Sep. Purif. Technol.
2007, 56(2), 143–149.[56] Chung, J. B., DeRocher, J. P., Cussler, E. L. J. Membr.
Sci. 2005, 257(1–2), 3–10.[57] Yang, D., Barbero, R. S., Devlin, D. J., Cussler, E. L.,
Colling, C. W., Carrera, M. E. J. Membr. Sci. 2006,279(1–2), 61–69.
[58] Hatchwell, C. E., Sammes, N. M., Kendall, K. J. PowerSource 1998, 70(1), 85–90.
272 Basic Aspects of Polymeric and Inorganic Membrane Preparation

Biographical Sketch
Kang Li is currently a professor of chemical engineering at Imperial College London. His present researchinterests are in preparation and characterization of polymeric and inorganic hollow fiber membranes, fluidseparations using membranes, and membrane reactors for energy application and CO2 capture. Professor Liserves as an editor of Thermopedia for the Separation Technologies Subject Area and as an editorial boardmember of Advances in Environmental Research and Development (AERD). He is a chartered engineer and afellow of the Institution of Chemical Engineers and is a council member of European Membrane Society.
Ceramic Hollow Fiber Membranes and Their Applications 273

This page intentionally left blank

1.13 Preparation of Carbon Membranes for Gas SeparationA F Ismail, Universiti Teknologi Malaysia, Johor, Malaysia
ª 2010 Elsevier B.V. All rights reserved.
1.13.1 Introduction 275
1.13.2 Preparation and Characterization of Carbon Membrane 276
1.13.2.1 Selection of Precursors 277
1.13.2.2 Pretreatment of Precursor Membranes 278
1.13.2.3 Pyrolysis of Carbon Membrane 278
1.13.2.4 Posttreatment of Carbon Membrane 280
1.13.3 Preparation of Self-Supported Carbon Membrane 280
1.13.3.1 Flat-Sheet Membrane 280
1.13.3.2 Hollow Fiber Membrane 281
1.13.4 Preparation of Supported Membrane 282
1.13.4.1 Fabrication of Membrane Module 283
1.13.5 Gas Transport and Separation through Carbon Membrane 284
1.13.6 Aging Phenomenon of Membrane 287
1.13.7 Conclusion and Future Direction in Carbon Membrane Research 288
References 288
Glossary
Membrane physical aging Change in the
transport properties of a membrane over a period
of time due to physical–chemical–structural
alterations.
Membrane posttreatment Process carried out on
a membrane after its essential structure has been
formed but prior to its exposure to an actual feed
stream.
Membrane pretreatment Process carried out on
a membrane after the completion of its preparation
and prior to its use in a separation application.
Precursor A substance from which another
substance is formed.
Pyrolisis The chemical decomposition or
transformation of a compound caused by heat that
occurs spontaneously at high enough
temperatures.
Sintering A method where the material is heated in
a sintering furnace below its melting point until
particles adhere to each other.
Thermosetting polymer Polymer material that
irreversibly cures.
Turbostratic structure Structure consisting of
sheets of carbon atoms that are haphazardly folded
or crumpled together.
1.13.1 Introduction
Polymeric membrane materials were recognized as a
promising tool for gas separation. However, these
polymer membranes are deficient to meet the
requirements of membrane technology, especially
operation at high temperature and harsh environ-
ment. In the recent decades, membrane materials
based on carbon material have served as an alterna-
tive candidate for various types of gas separations.
Carbon membrane is an inorganic membrane, which
can be fabricated by using thermosetting polymer.
The concept of carbon membrane or film for gas
separation can be traced back to the early 1970s.
These membranes were prepared by compressed
nonporous graphited carbon into a plug (hence the
name ‘carbon membrane’) [1]. Carbon membranes
have excellent thermal and chemical stability, com-
pared to polymeric membranes commercially
available in the industry. Besides, they can also attain
275

high selectivity without losing the productivity andthus surpass the upper bound limit of polymericmembranes [2–5]. At present, carbon membranematerials have become more important in the newera of membrane technology for gas separation andliquid–liquid phase separation due to their higherselectivity and permeability, stability and high-temperature operations, and well-defined stable porestructure. In addition, unlike polymeric membranes,carbon membranes are usually durable and capable ofwithstanding adverse and rigorous environmentbecause of their high thermal and chemicalresistance.
Carbon membranes demonstrate attractive char-acteristics among molecular sieving materials such asexcellent shape selectivity for planar molecule andhigh hydrophobicity. It is, however, more feasible toform carbon molecular sieve membranes (CMSMs)[6–8]. These characteristics have stimulated interestamong researchers in the early 1980s to furtherinvestigate the separation characteristics of thesemembranes. Recently, carbon membranes have alsobeen found to be very useful materials in the pre-paration of nanofiltration [9], pervaporation [10], andmicrofiltration membrane [11]. This chapteraddresses the important aspects of carbon membranefabrication in view of preparing a good-quality car-bon membrane for gas separation processes.
1.13.2 Preparation andCharacterization of Carbon Membrane
As shown in Figure 1, carbon membranes can begenerally classified into two groups: unsupportedmembrane (flat, hollow fiber, and capillary tube)and supported membrane (flat and tubular).However, it has proved to be difficult to prepare
these membranes in a defect-free, continuous form.The preparation of carbon membranes is not an easy
task because it involves a number of important stepsthat must be carefully controlled and optimized. The
success of preparing carbon membranes depends onthe experience and knowledge during, in particular,
the preparation of polymeric precursor or mem-branes, because good-quality membranes in turn
ensure good-quality carbon membranes. The pre-paration of carbon membranes can be divided into
five steps: precursor material selection, polymericmembrane preparation, pretreatment of the precur-sor, pyrolysis process, and posttreatment of
pyrolyzed membranes. The understanding andmanipulation of the preparation conditions and vari-
ables will provide an opportunity to further enhancethe performance of carbon membranes. In this sec-
tion, the general steps for carbon membranepreparation are outlined and some guidelines in the
preparation of high-performance carbon membraneare discussed in detail. The typical characterization
of the carbon membrane for gas separation, includinggas permeation measurement, structural and mor-
phological characterization using Fourier transforminfrared spectroscopy (FTIR), X-ray diffraction
(XRD), and scanning electron microscopy (SEM), isalso addressed briefly.
The synthesis of a membrane should be cheap andsimple in order to establish an economically viableseparation unit. Another demand is that the mem-
brane should have a long-time stable flux, that is, nosignificant aging. Furthermore, it should have suffi-
cient mechanical strength to overcome fabrication aswell as oscillating process conditions, such as varia-
tions in pressure and temperature. Figure 2 showsthe flow diagram of the general carbon membranefabrication process. Discussion of the individual steps
is given in the following section.
Carbon membrane
Self-supported carbon membrane Supported carbon membrane
Flat
Hollow fiber Capillary tube Flat Tubular
Figure 1 Classification and configuration of carbon membrane [12].
276 Basic Aspects of Polymeric and Inorganic Membrane Preparation
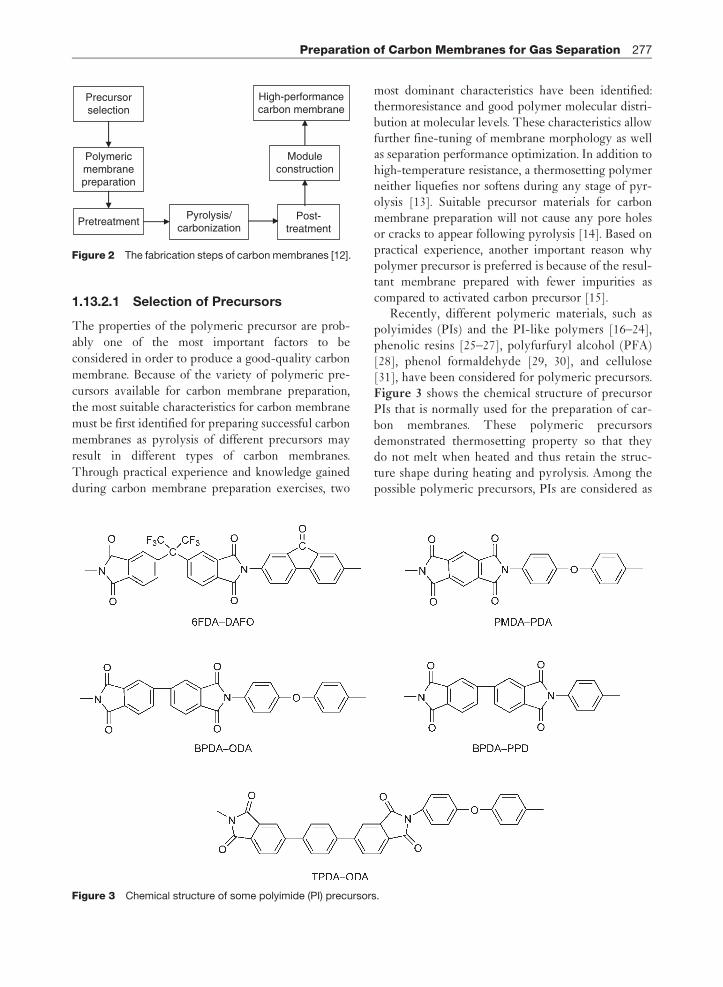
1.13.2.1 Selection of Precursors
The properties of the polymeric precursor are prob-
ably one of the most important factors to be
considered in order to produce a good-quality carbon
membrane. Because of the variety of polymeric pre-
cursors available for carbon membrane preparation,
the most suitable characteristics for carbon membrane
must be first identified for preparing successful carbon
membranes as pyrolysis of different precursors may
result in different types of carbon membranes.
Through practical experience and knowledge gained
during carbon membrane preparation exercises, two
most dominant characteristics have been identified:thermoresistance and good polymer molecular distri-bution at molecular levels. These characteristics allowfurther fine-tuning of membrane morphology as wellas separation performance optimization. In addition tohigh-temperature resistance, a thermosetting polymerneither liquefies nor softens during any stage of pyr-olysis [13]. Suitable precursor materials for carbonmembrane preparation will not cause any pore holesor cracks to appear following pyrolysis [14]. Based onpractical experience, another important reason whypolymer precursor is preferred is because of the resul-tant membrane prepared with fewer impurities ascompared to activated carbon precursor [15].
Recently, different polymeric materials, such aspolyimides (PIs) and the PI-like polymers [16–24],phenolic resins [25–27], polyfurfuryl alcohol (PFA)[28], phenol formaldehyde [29, 30], and cellulose[31], have been considered for polymeric precursors.Figure 3 shows the chemical structure of precursorPIs that is normally used for the preparation of car-bon membranes. These polymeric precursorsdemonstrated thermosetting property so that theydo not melt when heated and thus retain the struc-ture shape during heating and pyrolysis. Among thepossible polymeric precursors, PIs are considered as
Figure 3 Chemical structure of some polyimide (PI) precursors.
Precursorselection
Polymericmembranepreparation
PretreatmentPyrolysis/
carbonizationPost-
treatment
Moduleconstruction
High-performancecarbon membrane
Figure 2 The fabrication steps of carbon membranes [12].
Preparation of Carbon Membranes for Gas Separation 277

one of the most intensive precursors that have beenstudied for carbon membranes, due to their excellentphysical properties and the tunable chemical compo-sition utilizing different molecular structurescomposed of dianhydride and diamine monomers.The most common commercial PI used for preparingcarbon membrane is Kapton (DuPontTM) PI. Carbonmolecular sieve (CMS) film with homogeneous finepores and without cracks or large pores normally canbe achieved by carbonizing Kapton film at 800 �C[32] Kapton PI was also carbonized in the form of acapillary membrane which can retain high gas selec-tivity even at high temperatures [33]. The membraneexhibited a selectivity of 2000 for He/N2 at 0 �C and170 at 250 �C. Recently obtained Kapton-PI-basedcarbon membranes have shown that the selectivityfor O2/N2, CO2/CH4, and CO2/N2 is 4, 16, and 9,respectively, at 25 �C [34].
1.13.2.2 Pretreatment of PrecursorMembranes
Prior to the pyrolysis, the polymeric membranes areoften subjected to pretreatments in order to ensurethe stability and the preservation of the precursorstructure during pyrolysis. In fact, carbon membraneof good quality, in terms of stability and separationperformance, can be produced using specific pre-treatments. In general, pretreatment methods aredivided into physical and chemical methods.Physical pretreatment consists of stretching of theprecursor, whereas chemical pretreatments involvethe treatment of the polymeric precursor with somechemical reagents. Sometimes, the precursor is sub-jected to more than one pretreatment method toachieve desired properties in a carbon membrane.
Oxidation is considered very important as it hassubstantial influence on the performance of the result-ing carbon membrane. Oxidation pretreatment can beapplied at very different ranges of thermal soak times,depending largely on the precursor uses. In all cases,the treatment contributes to the stabilization of theasymmetric structure of the precursor and providessufficient dimensional stability to withstand the hightemperatures of the pyrolysis steps. Stretching is apretreatment that is usually applied to the hollowfiber precursor. This technique is adapted from thefabrication of carbon fiber and is sometimes referred toas post-spinning. An ideal post-spinning modificationscheme would allow the removal of surface defects,attenuation of variations in filament diameter, and an
enhanced retention of molecular orientation prior tothe heat treatment [32].
Pretreatment of the membrane with certain chemi-cals can provide enhanced uniformity of the poresystem formed during pyrolysis. Hydrazine, dimethyl-formamide (DMF), hydrochloric acid, and ammoniumchloride are commonly used for chemical pretreat-ment [2]. During the chemical pretreatment, themembrane is fully immersed in the appropriate solu-tion and followed by washing and drying before it issubjected to heat treatment. In certain cases, it has alsobeen proved that it may be advantageous to evacuatethe pores of the membrane by applying a low airpressure, and subsequently fill them with nitrogengas at normal pressure prior to pretreatment with achemical reagent. In this manner, the membranes withhigher carbon content can be obtained [33].
1.13.2.3 Pyrolysis of Carbon Membrane
One of the distinctive features of CMSMs is thepyrolysis conditions of a polymeric precursor.When a given precursor and its pyrolysis conditionsare properly selected, a desirable micropore size andshape can be tailored. Tailoring of correct pore size isimportant for the fabrication of high-performancecarbon membranes with optimal balance betweenselectivity and permeability that is suitable for var-ious gas separations. It demands a goodunderstanding of the optimum production conduc-tion with respect to the pyrolysis condition. Throughthe rigorous control of the pyrolysis conditions, suchas temperature, heating rate, atmosphere and thermalsoaking time, gas flow rate, pressure and concentra-tion, and pre/posttreatment conditions, the poreaperture can be nearly continuously tuned, so that amembrane module can be specifically designed forgas separation and reaction [34].
Carbon membranes are prepared by the pyrolysisof polymeric precursors. Pyrolysis is usually carriedout at temperatures of 500–1000 �C under vacuum orinert atmosphere. This process removes most of theheteroatoms originally present in the polymericmacromolecules, leaving behind a stiff and cross-linked carbon matrix with an amorphous porousstructure created by the evolution of gaseous pro-ducts and the rearrangement of the molecularstructure of the starting polymeric precursor duringthe pyrolysis. Figures 4 and 5 show the typicalhollow fiber membranes with the substructure andskin layer morphology produced under different pyr-olysis temperatures.
278 Basic Aspects of Polymeric and Inorganic Membrane Preparation

The transport properties of the carbon membraneare dependent on its porous structure and pore-size
distribution [16]. During pyrolysis, amorphous car-
bon material is created and exhibits a distribution of
micropore dimensions with only a short-range order
of specific pore sizes and also pores larger than the
ultramicropores. These larger pores that connect the
ultramicropores are required to exhibit molecular
sieving properties and therefore allow high gas
separation productivities. The pore system of carbon
(a) (b)
(c) (d)
Figure 4 Structural change of the typical hollow fiber membrane substructure at different pyrolysis temperatures:(a) polyacrylonitrile (PAN) membrane; (b) Tpyrolysis¼ 500 �C; (c) Tpyrolysis¼600 �C; and (d) Tpyrolysis¼800 �C [35].
(a) (b)
(c) (d)
Figure 5 Structural changes of the typical hollow fiber membrane skin layer at different pyrolysis temperatures:
(a) polyacrylonitrile (PAN) membrane; (b) Tpyrolysis¼500 �C; (c) Tpyrolysis¼600 �C; and (d) Tpyrolysis¼800 �C [35].
Preparation of Carbon Membranes for Gas Separation 279

membranes is generally nonhomogeneous, as it iscomprised of relatively wide openings with a fewconstrictions [36]. The pores may vary in size,shape, and degree of connectivity, strongly depend-ing on the nature of the polymeric precursor and theconditions of pyrolysis. Figure 6 depicts an idealizedstructure of a pore in a carbon material. The poremouth d often referred as an ultramicropore (<10 A)that allows molecular sieving of the penetratingmolecules, meanwhile the larger micropores, D ofthe material (6–20 A), may allow the diffusion of gasmolecules to occur through the carbon material [18,25, 35, 37]. Therefore, it is believed that a properlyprepared carbon material is able to simultaneouslydemonstrate the ability to perform molecular sievingand also allow a considerably high flux of the pene-trating molecules through the material [38].
Pyrolysis temperature has a remarkable influenceon the carbon membrane properties in terms of themembrane structure, separation performance (per-meability and selectivity), and the transportmechanism for gas separation [23]. The increase inpyrolysis temperature will normally lead to a carbonmembrane with higher compactness, a more turbos-tratic structure, higher crystallinity and density, andsmaller average interplanar spacing between the gra-phite layers of the carbon [39]. In general, an increase inthe pyrolysis temperature will give rise to a decrease ingas permeability and an increase in selectivity.
1.13.2.4 Posttreatment of CarbonMembrane
Upon pyrolysis, polymeric membranes are trans-formed into carbon membranes with varyingdegrees of porosity, structure, and separation proper-ties that depend to an extent on the pyrolysis
conditions. In some cases, it is found to be an advan-tage that the pore dimensions and distribution in acarbon membrane can be finely adjusted by a simplethermochemical treatment to meet different separa-tion needs and objectives [3]. Therefore, variousposttreatment methods have been applied to meetthe desired pore structure and separation propertiesof carbon membranes, and, at the same time, repairthe defects and cracks that exist in the carbonmembrane.
Post-oxidation or activation is one of the com-monly used posttreatments to alter the porestructure of carbon membranes. Typically, when amembrane is exposed to an oxidizing atmosphereafter the pyrolysis, the pore size and microporevolume are increased [13, 33, 40, 41], but the pore-size distribution is not broadened. Different activa-tion temperatures and residence times have beenapplied to obtain desired pore structures in differentmaterials [14, 42, 47].
The selectivity of a carbon membrane may beincreased through the introduction of organic speciesinto the pore system of the carbon membrane andtheir pyrolytic decomposition, that is, chemical vapordeposition (CVD) [40, 41, 48, 49]. In general, tomanufacture CMSs, the inherent pore structure ofthe carbonaceous precursor is initially tailored into asuitable pore size range by controlling the thermalpretreatment, followed by a final adjustment of thepore apertures by CVD. Commonly, the CVD ofcarbon onto a carbon membrane may bring aboutthree distinct results: homogeneous deposition,adlayer deposition, and in-layer deposition.
Aside from CVD, post-pyrolysis is another treat-ment that can be used to decrease membrane poresize. Typically, post-pyrolysis is applied after post-oxidation in order to recover from an excessive poreenlargement. Sometimes post-oxidation and post-pyrolysis are repeated several times until the desiredpore size distribution is achieved. However, thistreatment is rarely used, because the first pyrolysisstep at high temperature produces small pores effi-ciently due to the shrinkage of the carbon structure.
1.13.3 Preparation of Self-SupportedCarbon Membrane
1.13.3.1 Flat-Sheet Membrane
In general, the properties of porous carbon structuresand the gas permeation properties of CMS mem-branes based on aromatic PI depend upon the
d1 d2 d3D1 D2 D3
Figure 6 Idealized structure of a pore in a carbon material
[37]. Reproduced with permission from Ismail, A. F., Li, K.
From Polymeric Precursors to Hollow Fiber Carbon and
Ceramic Membranes. In Inorganic Membranes: Synthesis,Characterization and Applications; Mallada, R., Menendez,
M., Eds.; Membrane Science and Technology Series;
Elsevier: Amsterdam, 2008; Vol. 13, pp 81–119.
280 Basic Aspects of Polymeric and Inorganic Membrane Preparation
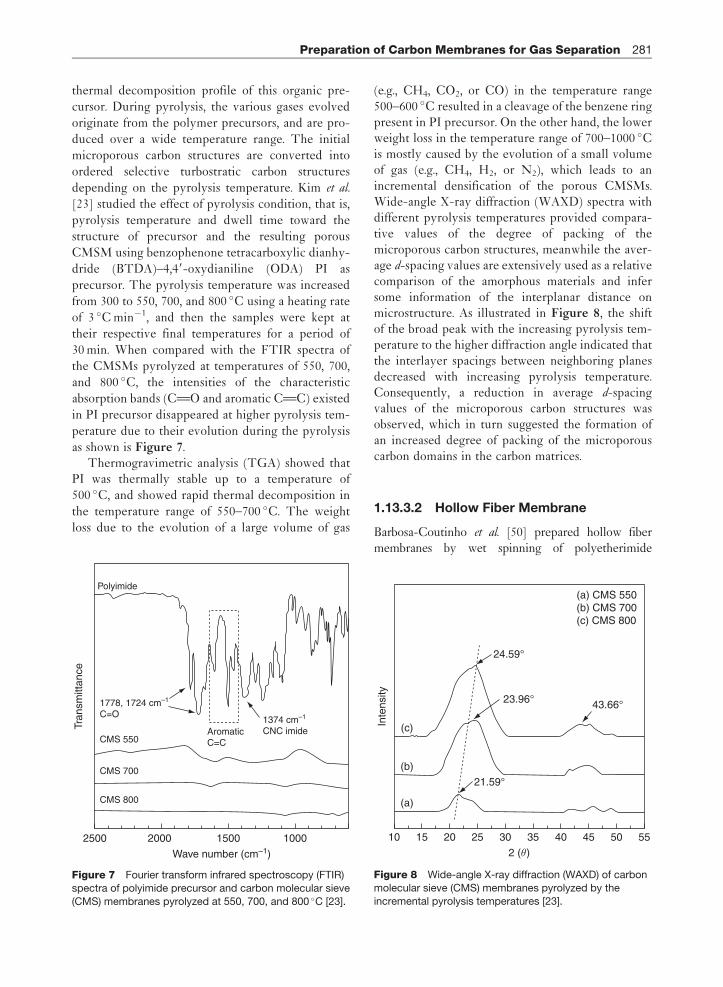
thermal decomposition profile of this organic pre-
cursor. During pyrolysis, the various gases evolved
originate from the polymer precursors, and are pro-
duced over a wide temperature range. The initial
microporous carbon structures are converted into
ordered selective turbostratic carbon structures
depending on the pyrolysis temperature. Kim et al.
[23] studied the effect of pyrolysis condition, that is,
pyrolysis temperature and dwell time toward the
structure of precursor and the resulting porous
CMSM using benzophenone tetracarboxylic dianhy-
dride (BTDA)–4,49-oxydianiline (ODA) PI as
precursor. The pyrolysis temperature was increased
from 300 to 550, 700, and 800 �C using a heating rate
of 3 �C min�1, and then the samples were kept at
their respective final temperatures for a period of
30 min. When compared with the FTIR spectra of
the CMSMs pyrolyzed at temperatures of 550, 700,
and 800 �C, the intensities of the characteristic
absorption bands (CTO and aromatic CTC) existed
in PI precursor disappeared at higher pyrolysis tem-
perature due to their evolution during the pyrolysis
as shown is Figure 7.Thermogravimetric analysis (TGA) showed that
PI was thermally stable up to a temperature of
500 �C, and showed rapid thermal decomposition in
the temperature range of 550–700 �C. The weight
loss due to the evolution of a large volume of gas
(e.g., CH4, CO2, or CO) in the temperature range500–600 �C resulted in a cleavage of the benzene ringpresent in PI precursor. On the other hand, the lowerweight loss in the temperature range of 700–1000 �Cis mostly caused by the evolution of a small volumeof gas (e.g., CH4, H2, or N2), which leads to anincremental densification of the porous CMSMs.Wide-angle X-ray diffraction (WAXD) spectra withdifferent pyrolysis temperatures provided compara-tive values of the degree of packing of themicroporous carbon structures, meanwhile the aver-age d-spacing values are extensively used as a relativecomparison of the amorphous materials and infersome information of the interplanar distance onmicrostructure. As illustrated in Figure 8, the shiftof the broad peak with the increasing pyrolysis tem-perature to the higher diffraction angle indicated thatthe interlayer spacings between neighboring planesdecreased with increasing pyrolysis temperature.Consequently, a reduction in average d-spacingvalues of the microporous carbon structures wasobserved, which in turn suggested the formation ofan increased degree of packing of the microporouscarbon domains in the carbon matrices.
1.13.3.2 Hollow Fiber Membrane
Barbosa-Coutinho et al. [50] prepared hollow fibermembranes by wet spinning of polyetherimide
2000
CMS 800
CMS 700
CMS 550
1778, 1724 cm–1
C=O
Polyimide
AromaticC=C
1374 cm–1
CNC imide
1500
Wave number (cm–1)
Tran
smitt
ance
10002500
Figure 7 Fourier transform infrared spectroscopy (FTIR)
spectra of polyimide precursor and carbon molecular sieve
(CMS) membranes pyrolyzed at 550, 700, and 800 �C [23].
25 30 35
2 (θ)
40 45 50 5520
Inte
nsity
15
(a)
(a) CMS 550(b) CMS 700(c) CMS 800
24.59°
23.96° 43.66°
21.59°
(b)
(c)
10
Figure 8 Wide-angle X-ray diffraction (WAXD) of carbon
molecular sieve (CMS) membranes pyrolyzed by the
incremental pyrolysis temperatures [23].
Preparation of Carbon Membranes for Gas Separation 281

(PEI) and polyvinylpyrrolidone (PVP) solution inN-methyl-2-pyrrolidone (NMP) solution. Prior to thepyrolysis under inert atmosphere, the polymeric mem-brane is first subjected to treatment at mild temperatureunder an oxidizing atmosphere forming chemicalgroups, such as hydroxyl and carbonyl that promotestabilization of the membrane for further high-tem-perature treatment. During this thermostabilizationprocess, oxygenated groups are incorporated in thepolymeric chain. Therefore, the overall weight changeduring stabilization is small due to the introduction ofthese groups. During stabilization up to 400 �C, fewvolatile compounds were observed, mainly CO2 andH2O, which indicated the degradation of polymer andoxidation of the polymer chain. The investigation ofpyrolysis conditions pointed to a notable influenceexerted by the oxidation with an optimum temperature(400 �C) where the oxidation is more effective, asobserved by less deformation and irregularities of thefibers. An extended oxidation period with a heating rateof 3 �C min�1 or lower contributed to the completionof the oxidation reaction and it was more effective inobtaining stabilized fibers. However, the prolongedpyrolysis reduced the mechanical stability of the hollowfibers, evidenced by the morphology analysis. Duringpyrolysis at a temperature above 400 �C, there waslarge volatile evolution. First, CO, CO2, and H2Owere released, between 420 and 680 �C, evidencingcross-linking reactions and some degradation reactions.At higher temperatures (450–800 �C), hydrogen exitwas detected, indicating the forming of a graphite-likestructure.
The pyrolysis atmosphere has a strong influence onthe carbon membrane properties and must be properlytailored in order to prevent undesired burn-off andchemical damage of the membrane precursor duringpyrolysis. In a recent research, Favvas et al. [51]
reported the effects of the pyrolysis atmosphere onthe structure and properties of the membranes pro-duced in both inert and reactive conditions by usingcarbon hollow fiber membranes based on commer-cially available Matrimid 5218 precursor. Pyrolysiswas carried out in three different gas atmospheres toproduce three different types of carbon fibers: in N2, inN2 saturated with H2O, and in CO2 as pyrolysismedia. Upon heating up to 650 �C, higher mass losswas observed for the membranes pyrolyzed in reactiveatmosphere (water saturated N2 and CO2) within thepyrolysis oven compared to that in the inert atmo-sphere. The results suggested that higher degree ofpolymer decomposition and subsequent carbon oxida-tion have taken place. After the pyrolysis process, anumber of macrovoids can still be observed on thefiber wall, which can be attributed to the effect of thepyrolysis procedure on the polymeric hollow fiberprecursor. Conversely, the nitrogen adsorption prop-erties of the membranes implied that the environmentof the pyrolysis process is important to the microporevolume. It is noticed that oxidized agents reduce theresistance of the skin surface to thermal degradation,resulting in an increase in micropore volume. Carbondioxide is a more effective oxidizing agent than water,possibly due to the increased hydrophobicity of thecarbon surface during the high-temperature treat-ment. Figure 9 demonstrates the SEM micrographsof the polymer precursor and the resulting hollowfiber structure pyrolyzed under CO2 atmosphere.
1.13.4 Preparation of SupportedMembrane
Supported carbon membranes for gas separation arecommonly prepared by coating a suitable polymeric
800 µm400 µm
(a) (b)
Figure 9 Scanning electron microscopy (SEM) micrographs of (a) polymer precursor and (b) the resulting hollow fiber
structure pyrolyzed under CO2 atmosphere [51].
282 Basic Aspects of Polymeric and Inorganic Membrane Preparation

solution on porous carbon, ceramic, or metal sup-ports and subsequent carbonization undercontrolled conditions. Supported membranes areknown to be suitable for large-scale industrial appli-cation. One limit to incorporating carbonmembranes into actual application is the prepara-tion process. In order to obtain a defect-free carbonmembrane, the coating–pyrolysis cycle must berepeated several times, which needs time andspecial care.
In a very recent study, Lee et al. [52] studiedthe effect of the post-oxidation conditions, such asoxidation temperature and time, on the gas permea-tion properties of poly(2,6-dimethyl-1,4-phenyleneoxide) (PPO)-derived carbon membranes. The car-bon membranes were prepared by coating a thinfilm on a macroporous tubular ceramic support.The supported membrane was pyrolyzed at 700 �Cin argon atmosphere and then followed by the airoxidation of carbon membranes at different oxida-tion conditions. In the weight loss of the airoxidation of the pyrolyzed carbon membrane, thetotal weight loss measured to 4% even when thetemperature increased up to 400 �C during the airoxidation of the pyrolyzed carbon material. Thesmall weight loss indicates that this supported pyr-olyzed PPO carbon membrane has a good thermalstability even in the air oxidation. Characterizationof the pore properties in the nitrogen adsorptionmeasurement showed that the pore characteristicvalues (Table 1), such as pore size, pore volume,and surface area, were increased by the post-oxidation, and hence contributed to the enhancementof gas separation performance, particularly for gasspecies with a large molecular size.
For selection of membrane support, criteria suchas the cost, flexibility for large-scale applications,and adherence between the substrate and the topmembrane layer need to be considered. In order toprepare a low-cost supported membrane that showshigh gas separation performance, coal-based carbontubes can serve as a suitable candidate [28]. C/CMScomposite membranes from PFA were prepared, in
which porous coal-based carbon tubes were used as
support. The pyrolysis temperature has substantial
effect on the gas separation performance of C/CMS
composite membranes. It has been identified that
higher final pyrolysis temperature leads to carbon
membranes having an amorphous carbon structure
with ultramicropores. These are more compact and
more selective and also show a decreased d-spacing
of the interlayers of graphitic carbon planes as
observed in XRD patterns. These structural changes
in turn reduce the permeability but at the
same time greatly enhance the selectivity of gas
molecules.
1.13.4.1 Fabrication of Membrane Module
To ensure the efficiency of a membrane process in a
given application, the geometry of the membrane and
the manner it is installed in a suitable device are
important [53]. The selection of a membrane module
is mainly determined by economic considerations.
However, the cheapest configuration is not always
the best choice because the type of application, and
thus the functionality of a module, is also an impor-
tant factor to be taken into account [54]. Many
researchers have proposed a wide variety of modules
for carbon membrane production. The most challen-
ging task that must be considered while fabricating
these modules is the poor mechanical stability of
carbon membranes [55].For commercial applications of membranes, it is
preferable to fabricate a module with an asymmetric
structure and capillary or hollow fiber configurations
in order to increase the rate of permeation of the
products [55]. As summarized in Table 2, the char-
acteristics of modules, in terms of production, cost,
maintenance, and efficiency, must be considered in
all system designs [53, 57, 58]. Figures 10 and 11
illustrate the modules for hollow fiber configuration
fabricated by Ismail and David [59, 60] and Koros
and coworkers [61], respectively.
Table 1 Pore properties of carbon materials based on the nitrogen adsorption
Carbon materialPore volume (BET)(cm3 g�1)
Surface area (BET)(m2 g�1)
Representative pore diameter(HK method)(nm)
M700 26.82 116.8 0.43
M700-MOx-400 80.35 349.7 0.54
Reproduced with permission from Lee, H. J., Suda, H., Haraya, K. Sep. Purif. Technol. 2008, 59, 190–196.
Preparation of Carbon Membranes for Gas Separation 283

1.13.5 Gas Transport and Separationthrough Carbon Membrane
As gas separation applications become commercially
attractive, there is a need for novel membranes that
can withstand high operating temperatures and harsh
environments, and could at the same time boost the
viability of processes such as natural gas purification.
In general, the gas transport properties of a carbon
membrane strongly depend on the pyrolysis tem-
perature. The pyrolysis temperature around 800 �Cleads to the formation and the enlargement of pore
Table 2 Important considerations for the preparation of membrane module
Category Characteristic
Production High surface area (i.e., packing density – the ability of a material to form stable membranes)
The ease of formation of a given configuration and structure
Nature of polymer/membrane
Cost Low operating cost
Low investment cost Low fouling tendency
MaintenanceEase to
clean
Membrane replacement is possible
Efficiency The extent of use
The nature of the desired separation
Structural strength
Reproduced with permission from Saufi, S. M., Ismail, A. F. Carbon 2004, 42, 241–259.
Carbon hallowfiber membrane
Aluminumcap
3/4" stainlesssteel housing
Feed
Permeate
Retentate
5/8" stainlesssteel tube
Valve
FemaleNPT thread
Figure 10 Module constructed by Ismail and David [50]. Reproduced with permission from David, L. I. B., Ismail, A. F. J.Membr. Sci. 2003, 213, 285–291.
MaleNPT
Stycast®
Epoxy
Stycast® Epoxy extrudes outthrough tuming of male NPT
Tygon®
tubing
Carbon hollow fiber membrane
Figure 11 Module constructed by Koros and coworkers. Reproduced with permission from Vu, D. Q., Koros, W. J., Miller,S. J. Ind. Eng. Chem. Res. 2002, 41, 367–380.
284 Basic Aspects of Polymeric and Inorganic Membrane Preparation

structure; meanwhile, higher temperatures cause
pore shrinkage and destruction of the pore system
[62]. The heating rate may also affect the gas separa-
tion performance of the membrane. In addition, the
choice of pyrolysis atmosphere may also influence
the changes in pore size and geometry or even the
nature of the surface by sintering (pore closure) or
activation (pore opening by removal of surface
groups or by burn-off) effects, which in turn give
rise to different gas transport properties [24].For gas separation through a porous membrane,
four separation mechanisms of transport are consid-
ered: Knudsen diffusion, surface diffusion, capillary
condensation, and molecular sieving. The contribu-
tion of these four mechanisms to the total transport
strongly depends on the experimental conditions [8,
45]. The transport mechanism owned by most of the
carbon membrane is molecular sieving mechanism as
shown in Figure 12. The carbon membranes contain
constrictions in the carbon matrix, which approach
the molecular dimensions of the absorbing species
[8]. In this manner, they are able to effectively sepa-
rate the gas molecules with similar size. According to
this mechanism, the separation is caused by the pas-
sage of smaller molecules of a gas mixture through
the pores while the larger molecules are retained.In the study of gas transport, permeability is con-
sidered as a function of the diffusivity of solutes
within the membrane material and it is often
expressed in Barrer, while selectivity is defined as
the ratio of single gas permeabilities. It is known that
the permeability and selectivity of the different
components of a multicomponent gas mixture arethe result of a complex equilibrium governed byfactors such as the concentration of the differentspecies, their potential of adsorption, and interactionsbetween species [63]. There is a general relationshipreported in the literature that as the permeability of arespective gas increases, its selectivity decreases.
One of the key factors that affects gas diffusivity isthe changes of the amount of free volume in themembrane matrixes. The diffusivity can be enhancedby creating a channeling effect and facilitating thediffusion of the gas molecules through the membrane.For the binary gaseous mixtures of high industrialinterest, such as CO2/CH4, the increase in selectivityvalues is very crucial for natural gas purification. Thepermeation measurements can be carried out forsingle gases as well as for the gas mixtures. Previousresearch done by Peterson et al. [54] using carbonmembrane showed that each component in gas mix-tures exhibited nearly identical permeation behaviorwith that of the single gas. The selectivity of themixed gas consisting of light and heavy componentsdid not show the decrease caused by sorption effectsof the heavy components. Therefore, using data ofsingle gas experiments, the selectivity of these carbonmembranes can be approximately estimated.
Table 3 shows a comparison of the gas separationperformances among various configurations of car-bon membranes produced by the previous researches.As expected, in most of the cases, the increase in thepermeability of the gases has led to a decrease inselectivity between those gases. For instance, Zhanget al. [31] have reported that the gas permeability ofthe composite carbon membranes decreases alongwith the selectivity increasing when the pyrolysistemperature is elevated from 650 to 800 �C. At highertemperature, both the permeability and selectivityfor the composite carbon membranes decrease exceptfor CO2/N2 selectivity. The reduction of gas perme-ability is due to the rearrangement of turbostraticcarbon structure at high pyrolysis temperature,while the decrease of selectivity is probably ascribedto the enlargement of interfacial gap additive and thecarbon matrix.
However, this general inversely proportional rela-tionship between selectivity and permeability of thedesired gases can be minimized by proper formula-tion of the membrane dope, which may enable theproduction of much better performing carbonmembranes.
Figure 12 Typical molecular sieving transport mechanism.
Reproduced with permission from Ismail, A. F., David, L. I. B.
J. Membr. Sci. 2001, 193, 1–18.
Preparation of Carbon Membranes for Gas Separation 285

Table 3 The gas transport and separation properties of the carbon membranes produced by the researchers
Permeability(barrer) Selectivity
ConfigurationTest temp.(�C)
Test pressure(atm) N2 O2 H2 CO2 CH4 O2/N2 H2/N2 CO2/N2 CO2/CH4 Ref
Tube/PPO 150 - 16 - - 219 7 - - 13.69 31.29 [52]
Flat/MMM 30 1.5 1.08 6.52 - - - 6.04 - - - [64]Flat/CZ650 30 1 19.4 199.7 758.1 791.5 - 10.29 39.08 40.80 - [65]
Flat/MMM- - 0.23 1.23 - 5.19 0.28 5.35 - 22.57 18.54 [66]
Flat/compositemembrane25
0.7 4.3 - - 123 - - - 28.60 - [67]
Hollow fiber/CMSM 25 1 12.5 125 - 529 5.19 10.00 - 42.32 101.93 [68]
Flat/MMM 35 4 14.42 36.57 79.62 190.67 34.16 2.54 5.52 13.22 5.58 [17]
Flat/CMSM 30 2 4.2 54 9400 1900 4.6 12.86 2238.1 452.38 413.04 [31]Flat/CMSM 35 6.8 2.1 24 - 94 0.77 11.43 - 44.76 122.08 [18]
Flat/CMSM 25 - 0.6 19.3 - 26 - 32.17 - 43.33 - [19]
Flat/CMSM 35 10 17 168 - 465 6 9.88 - 27.35 77.50 [20]
Flat/CMSM 25 - 83 707 - 2863 - 8.52 - 34.49 - [69]Flat/CMSM 35 10 15.8 138 - 423 4.8 8.73 - 26.77 88.13 [70]
Flat/Na-CMSM 25 0.3 1.1 5.3 - - - 4.82 - - - [71]
Flat/Ag-CMSM - - 19.9 170 - 619 - 8.54 - 31.11 - [43]Flat/CMSM 35 - 0.18 1.3 - 9.0 0.27 7.22 - 50.00 33.33 [63]

1.13.6 Aging Phenomenon ofMembrane
The main challenge faced by current membrane
technology is to achieve the high separation proper-
ties, such as high permeability and high selectivity
Therefore, a better understanding of the sorption and
transport of gases in these membranes enables the
choice of materials and preparation of membranes for
the enhanced separation properties.Recently, the study of membrane aging has been
the area of interest due to its effects toward the
structure, as well as the gas separation properties of
the identified membrane. However, at present, the
effects of membrane aging toward the membrane
performance have been scarcely discussed in the
open literature. Basically, aging of membrane can be
defined in two ways: the physical aging, which is
commonly suffered by polymeric membrane [72,
73], and carbon aging, which can be normally found
in carbon membrane [74, 75].Physical aging is the observed change in properties
of the polymer as a function of storage time, at con-
stant temperature, at zero stress, and under no
influence from any other external condition [72].
Conversely, carbon aging takes place along with the
formation of surface oxygen groups with the active
sites on the carbon surfaces as a consequence of the
oxygen–carbon interaction when the carbon materials
are exposed to air, even at room temperature. These
chemisorbed oxygen species will eventually reduce
the open porosity toward gas transport, resulting in
the additional restriction in diffusion [74].Physical aging of polymeric membranes is usually
defined in terms of free volume, the main structural
feature involved in the diffusion mechanism.
Previous studies of Hu et al. [73] performed on
various types of membranes demonstrated that this
physical aging reduced the permeation rate of
the polymers, as a result of the decrease in free
volume [73]. They observed that the permeability
of poly(methyl methacrylate) (PMMA) membrane
decreased with the aging time which can be attribu-
ted to the first-stage collapse of the membrane, which
in turn gives rise to the decrease in diffusion coeffi-
cients. Besides, they also suggested that the decrease
of free volume affects the permeability coefficient of
larger gas molecules more significantly than that of
the smaller ones [73].Lagorsse et al. [74] and Menendez and Fuertes
[75] studied the aging behavior of carbon membrane
under different atmospheres. When CMSM was
exposed to both humid and dry air, a rapid loss of
permeability was observed. In other words, pro-
longed storage of carbon membrane in air caused
serious damage to the membrane’s separation capa-
city. The effect is more notable for penetrants with
critical dimensions close to the critical pore size. At
room temperature, exposure to air increases the
number of constrictions of the pore structure, hence
resulting in the diffusion restriction through the
microporous space. Menendez and Fuertes [75]
00.0
0.2
0.4
0.6
0.8
1.0
HeCO2
CH4
N2O2
1.2(a) (b)
2 4 6Time (days)
(P/P
o)
(α/α
o)
56 106 156 206 00
1
2
3
4
5
2 4 6Time (days)
56 106 156 206
O2/N2CO2/N2
CO2/CH4
He2/N2
Figure 13 Modification with time of (a) the normalized permeability (P/P0) and (b) the normalized selectivity (�/�0) of a
carbon membrane stored under ambient conditions. Reproduced with permission from Menendez, I., Fuertes, A. B. Carbon2001, 39, 733–740.
Preparation of Carbon Membranes for Gas Separation 287

compared the transport properties of the fresh andthe aged carbon membrane. They observed that theexcellent gas separation properties of fresh mem-brane toward the separation of gas pair such as O2/N2 demonstrated rapid loss after storage under ambi-ent conditions. As illustrated in Figure 13, the O2
permeability of 136� 10�10 mol m�2 s�1 Pa�1 andN2 permeability of 15� 10�10 mol m�2 s�1 Pa�1
decreased to 2.5� 10�10 mol m�2 s�1 Pa�1 and0.31� 10�10 mol m�2 s�1 Pa�1, respectively.Surprisingly, the selectivity increased with theincreasing storage time for all the systems tested,but the reason for this phenomenon was unexplained.However, it was observed that both permeability andselectivity reach a constant value after long storageduration.
The gas transport and separation properties of theaged carbon membrane can be recovered through theremoval of the water molecule that previouslyadsorbed onto the membrane during the aging period[74]. Upon heating up to 600 �C under vacuum, theproperties of the membrane can be partially regen-erated. Under such conditions, the stability of thesurface could be increased; however, the left surface,containing reactive carbon sites, is still capable ofreadsorbing oxygen at room temperature. In orderto completely eliminate the surface-attached groups,high-temperature heating is required. However, thesevere heat treatment could change the microporos-ity of the membranes through either annealing orcarbon gasification.
Lie and Hagg [76] carried out the electrothermalprocess to regenerate the aged carbon membrane. Atlow voltage, operating direct current is applied on aniron-doped carbon, and the permeation rate of theregenerated membrane can be enhanced. This simple,energy-effective, rapid regeneration method is cap-able of fully restoring the initial permeability of thecarbon membrane. Besides, it can be used not only forbatchwise regeneration, but also in a continuous way.
1.13.7 Conclusion and FutureDirection in Carbon MembraneResearch
Carbon membranes provide potentially higher selec-tivity as well as thermal and chemical stabilities whencompared to conventional polymeric membranes.These membranes can normally surpass upper-
bound curves in the tradeoff relationship betweenthe permeability and selectivity. Carbon membranesoffer the best candidates for the development of newmembrane technologies, because of their stabilityand molecular sieving capabilities.
The most popular precursor currently used formanufacturing carbon membranes is PI. AlthoughPI offers the best separation potential for carbonmembranes, its cost is too high and its commercialavailability is sometimes very limited. Therefore, inorder to reduce the overall cost and production timeduring carbon membrane fabrication, an alternativepolymer must be selected or synthesized.Optimization of fabrication parameters during thepyrolysis process is arguably the best way to fabri-cate carbon membranes that achieve a superiorperformance in order to compensate for their highercost. Pyrolysis condition as well as the pretreat-ments and posttreatments during the membranefabrication process should also be extensively exam-ined as these steps provide a great opportunity fortailoring the separation properties of a given carbonmembrane.
Once a carbon membrane of high performance isproduced, the effect of membrane aging must beconsidered. The humidity found in the ambientatmosphere has an adverse effect on carbon mem-brane performance, which greatly decreases thepermeability of the gases. Therefore, the study ofstorage conditions or the regeneration of aged carbonmembranes is an important consideration for carbonmembrane research in the future.
References
[1] Ash, R., Barrer, R. M., Lowson, R. T. J. Chem. Soc.,Faraday Trans. I 1973, 69, 2166.
[2] Itoh, N., Haraya, K. Catal. Today 2000, 56, 103–111.[3] Liang, C., Sha, G., Guo, S. Carbon 1999, 37, 1391–1397.[4] Koros, W. J., Mahajan, R. J. Membr. Sci. 2000, 17,
181–196.[5] Park, H. B., Lee, Y. M. J. Membr. Sci. 2003, 213, 263–272.[6] Hayashi, J., Mizuta, H., Yamamoto, M., Kusakabe, K.,
Morooka, S. J. Membr. Sci. 1997, 124, 243–251.[7] Kyotani, T. Carbon 2000, 38, 269–286.[8] Jones, C. W., Koros, W. J. Ind. Eng. Chem. Res. 1995, 34,
158–163.[9] Kishore, N., Sachan, S., Rai, K. N., Kumar, A. Carbon
2003, 41(15), 2961–2972.[10] Sakata, Y. Muto, A., Uddin, M. A., Suga, H. Sep. Purif.
Technol. 1999, 17(2), 97–100.[11] Song, C., Wang, T., Pan, Y., Qiu, J. Sep. Purif. Technol.
2006, 51(1), 80–84.[12] Ismail, A. F., David, L. I. B. J. Membr. Sci. 2001, 193,
1–18.
288 Basic Aspects of Polymeric and Inorganic Membrane Preparation

[13] Morthon-Jones, D. H. Polymer Processing; Chapman andHall: London, 1989.
[14] Soffer, A., Rosen, D., Saguee, S., Koresh, J. CarbonMembrane. GB Pat. 2,207,666, 1989.
[15] Laszlo, K., Bota, A., Nagy, L. G. Carbon 2000, 38,1965–1976.
[16] Lua, A. C., Su, J. Carbon 2006, 44, 2964–2972.[17] Kim, S., Pechar, T. W., Marand, E. Desalination 2006, 192,
330–339.[18] Steel, K. M., Koros, W. J. Carbon 2005, 43, 1843–1856.[19] Park, H. B., Lee, S. Y., Lee, Y. M. J. Mol. Struct. 2005,
739, 179–190.[20] Shao, L., Chung, T. S., Wensley, G., Goh, S. H.,
Pramodac, K. P. J. Membr. Sci. 2004, 244, 77–87.[21] Park, H. B., Jung, C. H., Kim, Y. K., Nam, S. Y., Lee, S. Y.,
Lee, Y. M. J. Membr. Sci. 2004, 235, 87–98.[22] Kim, Y. K., Park, H. B., Lee, Y. M. J. Membr. Sci. 2005,
251, 159–167.[23] Kim, Y. K., Park, H. B., Lee, Y. M. J. Membr. Sci. 2005,
255, 265–273.[24] Centeno, T. A., Fuertes, A. B. J. Membr. Sci. 1999, 160,
201–211.[25] Centeno, T. A., Fuertes, A. B. Sep. Purif. Technol. 2001,
25, 379–384.[26] Fuertes, A. B., Menendez, I. Sep. Purif. Technol. 2002, 28,
29–41.[27] Wei, W., Hua, H., You, L., Chen, G. Carbon 2002, 40,
445–467.[28] Song, C., Wang, T., Wang, X., Qiu, J., Cao, Y. Sep. Purif.
Technol. 2008, 58, 412–418.[29] Zhang, X., Hua, H., Zhua, Y., Zhua, S. J. Membr. Sci.
2007, 289, 86–91.[30] Wei, W., Qin, G., Hu, H., You, L., Chen, G. J. Membr. Sci.
2007, 303, 80–85.[31] Lie, J. A., Hagg, M. B. Carbon 2005, 43, 2600–2607.[32] Chen, J. C. Modification of Polyacrylonitrile (PAN) Precursor
Fiber via Post-Spinning Plasticization and Stretching. PhDThesis, The Pennsylvania State University, 1998.
[33] Schindler, E., Maier, F. Manufacture of Porous CarbonMembranes. US Pat. 4,919,860, 1990.
[34] Lagorsse, S., Magalhaes, F. D., Mendes, A. J. Membr.Sci. 2007, 301, 29–38.
[35] Ismail, A. F., Li, K. From Polymeric Precursors to HollowFiber Carbon and Ceramic Membranes. In InorganicMembranes: Synthesis, Characterization andApplications; Mallada, R., Menendez, M., Eds.;Membrane Science and Technology Series; Elsevier:Amsterdam, 2008; Vol. 13, pp 81–119.
[36] Koresh, J. E., Soffer, A. J. Chem. Soc., Faraday Trans. I1980, 76, 2457–2471.
[37] Donnet, J. B., Bansal, R. C. Carbon Fibre. Marcel Dekker:New York, 1984.
[38] Steel, K. M. Carbon Membranes for Challenging GasSeparations. PhD Thesis, University of Texas, 2000.
[39] Tanihara, N., Shimazaki, H., Hirayama, Y., Nakanishi, S.,Yoshinaga, T., Kusuki, Y. J. Membr. Sci. 1999, 160,179–186.
[40] Soffer, A., Azariah, A., Amar, A., et al. Method ofImproving the Selectivity of Carbon Membranes byChemical Vapor Deposition. US Pat. 5,695,818, 1997.
[41] Soffer, A., Koresh, J., Saggy, S. Separation Device. USPat. 4,685,940, 1987.
[42] Katsaros, F. K., Steriotis, T. A., Stefanopoulos, K. L., et al.,Physica B 2000, 276–278, 901–902.
[43] Wang, S., Zeng, M., Wang, Z. J. Membr. Sci. 1996, 109,267–270.
[44] Steriotis, T. H., Beltsios, K., Mitropoulos, A. Ch., et al. J.Appl. Polym. Sci. 1997, 64, 2323–2345.
[45] Fuertes, A. B. Carbon 2001, 39, 697–706.[46] Kusakabe, K., Yamamoto, M., Morooka, S. J. Membr.
Sci. 1998, 149, 59–67.[47] Yoshinaga, T., Shimazaki, H., Kusuki, Y., Sumiyama, Y.
Asymmetric Hollow Filamentary Carbon Membrane andProcess for Producing the Same. EP Pat. 0,459,623,1991.
[48] Yamamoto, M., Kusakabe, K., Hayashi, J., Morooka, S. J.Membr. Sci. 1997, 133, 195–205.
[49] Cabrera, A. L., Zehner, J. E., Coe, C. G., Gaffney, T. R.,Farris, T. S. Carbon 1993, 31, 969–976.
[50] Barbosa-Coutinho, E., Salim, V. M. M., Borges. C. P.Carbon 2003, 41, 1707–1714.
[51] Favvas, E. P., Kapantaidakis, G. C., Nolan, J. W.,Mitropoulos, A. Ch., Kanellopoulos, N. K. J. Mater.Process. Technol. 2007, 186, 102–110.
[52] Lee, H. J., Suda, H., Haraya, K. Sep. Purif. Technol. 2008,59, 190–196.
[53] Strathmann, H. Membr. Technol. 1999, 113, 9–11.[54] Yoneyama, H., Nishihara, Y. Carbon Based Porous
Hollow Fiber Membrane and Method for Producing Same.US Pat. 5,089,135, 1992.
[55] Saufi, S. M., Ismail, A. F. Carbon 2004, 42, 241–259.[56] Petersen, J., Matsuda, M., Haraya, K. J. Membr. Sci.
1997, 131, 85–94.[57] Smith, S. P. J., Linkov, V. M., Sanderson, R. D., Petrik, L. F.,
O’Connor, C. T., Keiser, K. Micro. Mat. 1995, 4, 385–390.[58] Baker, R. Membr. Technol. 2001, 138, 5–10.[59] David, L. I. B., Ismail, A. F. J. Membr. Sci. 2003, 213,
285–291.[60] David, L. I. B. Development of Asymmetric Polyacrylonitrile
Carbon Hollow Fiber Membrane for Oxygen/Nitrogen GasSeparation. MSc Thesis, Universiti Teknologi Malaysia,2001.
[61] Vu, D. Q., Koros, W. J., Miller, S. J. Ind. Eng. Chem. Res.2002, 41, 367–380.
[62] Katsaros, F. K., Steriotis, Th. A., Romanos, G. E.,Konstantakou, M., Stubos, A. K., Kanellopoulus, N. K.Microporous Mesoporous Mater. 2007, 99, 181–189.
[63] Fuertes, A. B. J. Membr. Sci. 2000, 177, 9–16.[64] Rafizah, W. A. W., Ismail, A. F. J. Membr. Sci. 2008, 307,
53–61.[65] Zhang, B., Wang, T., Wu, Y., et al. Sep. Purif. Technol.
2008, 60, 259–263.[66] Kim, S., Chen, L., Johnson, J. K., Marand, E. J. Membr.
Sci. 2007, 294, 147–158.[67] Cong, H., Zhang, J., Radosz, M., Shen, Y. J. Membr. Sci.
2007, 294, 178–185.[68] Yoshimune, M., Fujiwara, I., Haraya, K. Carbon 2007, 45,
553–560.[69] Kim, Y. K., Lee, J. M., Park, H. B., Lee, Y. M. J. Membr.
Sci. 2004, 235, 139–146.[70] Tin, P. S., Chung, T. S., Kawi, S., Guiver, M. D.
Microporous Mesoporous Mater. 2004, 73, 151–160.[71] Suda, H., Haraya, K. J. Phys. Chem. B 1997, 10,
3988–3994.[72] Kim, J. H., Koros, W. J., Paul, D. R. Polymer 2006, 47,
3094–3101.[73] Hu, C. C., Fu, Y. J., Hsiao, S. W., Lee, K. R., Lai, J. Y. J.
Membr. Sci. 2007, 303, 29–36.[74] Lagorsse, S., Magalhaes, F. D., Mendes, A. J. Membr.
Sci. 2008, 310, 494–502.[75] Menendez, I., Fuertes, A. B. Carbon 2001, 39, 733–740.[76] Lie, J. A., Hagg, M. B. J. Membr. Sci. 2006, 284, 79–86.
Preparation of Carbon Membranes for Gas Separation 289

Biographical Sketch
Born in 1966, Ahmad Fauzi Ismail obtained his bachelor’s degree in petroleum engineering and his master’sdegree in chemical engineering from Universiti Teknologi Malaysia (UTM). In 1994, he was awarded anAssociation of Commonwealth University Scholarship to continue his doctoral studies and, in 1997, he wasawarded a PhD for a dissertation which proposed and confirmed that molecular orientation in a syntheticpolymeric membrane is the factor to be considered for super-selective hollow fiber membranes in gasseparation. As a result, a US and European patent were granted to him for his groundbreaking findings. He iscurrently a professor of membrane technology in the Faculty of Chemical and Natural Resources Engineeringat UTM, Malaysia, and Director of Advanced Membrane Technology Research Center (AMTEC), UTM. Heis particularly interested in gas separation processes, especially CO2 removal from natural gas, O2/N2 separa-tion, N2CH4 separation, H2 recovery, H2/N2 separation using polymer and inorganic materials, as well ashybrid or composite materials. In addition, he also has special interest in developing reverse osmosis, andnanofiltration and ultrafiltration membrane for water and wastewater treatment and for biotechnology applica-tions. Recently, he has developed an interest in the preparation of composite materials from carbon fibers andcarbon nanotube for energy storage.
290 Basic Aspects of Polymeric and Inorganic Membrane Preparation

1.14 Carbon Nanotube Membranes: A New Frontier inMembrane ScienceM Majumder, Monash University, Clayton, VIC, Australia
P M Ajayan, Rice University, Houston, TX, USA
ª 2010 Elsevier B.V. All rights reserved.
1.14.1 Introduction 291
1.14.2 CNT Membranes 292
1.14.2.1 Template-Synthesized CNT Membrane 292
1.14.2.2 Dense-Array Outer-Wall CNT Membrane 294
1.14.2.3 Open-Ended CNT Membrane 295
1.14.2.4 Mixed-Matrix CNT Membranes 296
1.14.3 Properties and Application of CNT Membranes 297
1.14.3.1 Functionalization of CNT Membranes 297
1.14.3.2 CNT Membranes for Gas/Vapor Transport Applications 297
1.14.3.3 CNT Membranes for Stimuli-Responsive Applications 299
1.14.3.4 CNT Membrane in Liquid Transport Applications 300
1.14.4 Directions of Future Research 305
References 307
1.14.1 Introduction
Iijima, in 1991, [1] reported the first detailed trans-
mission electron microscope images of arc-grown
multiwalled carbon nanotube (MWCNT). The
single-walled carbon nanotubes (SWCNTs) were
reported later on [2]. There have been other reports,
predating these, for the observation of filamentous
forms of carbon, some of them resembling the well-
formed tubular structures of nanotubes [3]. However,
the proper characterization of the real structure of
nanotubes has kindled the imagination of the
nanoscience community and impacted the field in
many ways. Research efforts over the past 17 years
have been focused on the electrical, optical, and
mechanical properties of this material [4–6].
Although several early experiments [7–10] had
shown the ability to open up carbon nanotubes
(CNTs) to serve as nanoscale containers, it is in the
past 4–5 years that experimental molecular transport
through CNTs, or the interstice between vertically
oriented CNTs, has become a subject of intense
interest. This interest has been generated by the
discovery of the fascinating mass-transport proper-
ties of this nanoscale material. For example, the
transport rate of water is almost four to five orders
of magnitude higher than that of other porous mate-
rials of comparable size, and is very close to that of
biological membrane channels, such as aquaporin
[11]. An artist’s rendition of this novel phenomenon
is shown in Figure 1, while transport properties of
liquids through the inner core of �7-nm-diameter
nanotubes are shown in Table 1. Although molecular
dynamic (MD) simulation studies indicate extremely
fast mass transport of gases and liquids through the
inner core of CNTs [12, 13], membranes fabricated
from crystalline as-formed CNTs have experimen-
tally verified these enticing mass-transport
predictions through the smooth, hydrophobic, and
crystalline interior of the nanotubes. Owing to this
significant advantage, there has been a major interest
in nanotube membranes as a technological alterna-
tive even to mature processes such as reverse osmosis
for desalination [14]. Therefore, a review showcasing
the major milestones in CNT membrane research
and their application is pertinent.While the CNTs are grown by bottom-up
approaches, such as chemical vapor deposition
(CVD), fabrication of macroscopically useful mem-
branes from these nanoscale materials is often a
combination of several top-down components, such
as electrochemical anodization of a metal film, poly-
mer processing, chemical etching, and plasma
etching. We discuss the state-of-the-art approaches
for processing the CNT membranes and critically
evaluate the advantages and/or drawbacks of these
291

approaches. The potential of these novel membrane
materials for liquid separation, gas/vapor separa-
tions, and membrane reactor applications is
elaborated. Membranes have traditionally been used
for large-scale applications. However, there is con-
siderable interest in integrating nanoporous
membranes to microfluidic devices as they can inte-
grate multiple functionalities in a device [15] – how
nanotube membranes could be seamlessly integrated
with microfluidic devices is also discussed. Apart
from the extremely fast mass-transport properties,
additional benefits of membranes based on CNTs
are their ability to be functionalized – allowing
them to be chemically tuned to suit applications.
Furthermore, CNTs have inherent properties, such
as super-compressibility and electrical conductivity,
which can be exploited for designing active mem-
brane structures. Finally, the chapter touches upon
the future directions in CNT membrane researchfrom a technology-enabling point of view.
1.14.2 CNT Membranes
Primarily, there are four approaches to the synthesisof membranes based on CNTs:
1. deposition of carbonaceous materials inside pre-existing ordered porous membranes, such asanodized alumina, also known as the template-synthesized CNT membranes [16];
2. membranes based on the interstice between nano-tubes in a vertical array of CNTs, subsequentlyreferred to as the dense-array outer-wall CNTmembrane [17];
3. encapsulation of as-grown vertically alignedCNTs by a space-filling inert polymer or ceramicmatrix followed by opening up the CNT tipsusing plasma chemistry, or the open-ended CNTmembrane [18, 19]; and
4. membranes composed of nanotubes as fillers in apolymer matrix, also known as mixed-matrixmembranes.
1.14.2.1 Template-Synthesized CNTMembrane
In the template synthesis approach, a preexistingordered porous membrane serves as a template fordeposition of carbonaceous materials, usually usingCVD [16, 20] at elevated temperatures, resultingin pore structure with reduced dimensions. Thetemplate is usually a ceramic membrane formedby the electrochemical anodization of metal films.The anodized membranes have extremely small
Figure 1 Artist’s rendition of water molecules zipping
through the inner core of carbon nanotube (CNT). Courtesy ofMark Denomme from the University of Kentucky. This chapter
examines the state of the art in membranes based on CNTs.
Table 1 Summary of pressure driven liquid flow measurements in CNT membranes. The permeable pore density is
estimated from salt diffusion experiments
LiquidPermeable pore density(# per m2)
Membranethickness(m)
Flow velocitynormalized at 1 bar(ms�1)
Viscosity(cP)
Enhancementfactor
Hexane 3.4� 1013 126� 10�6 5.6�10�2 0.3 1.09�104
Decane 3.4� 1013 126� 10�6 0.67�10�2 0.9 3.9� 104
Water 1-3.4�1013 34-126� 10�6 26.1 (�17.2)�10�2 1.0 6 (�1.6)�104
EtOH 3.4� 1013 126� 10�6 4.5�10�2 1.1 3.2� 104
IPA 3.4� 1013 126� 10�6 1.12�10�2 2 1.4� 104
Note that the enhancement factor, that is, the ratio of the observed flow velocity to the Hagen–Poiseuille flow velocity for �7-nm pipes,is �10 000–100 000, suggesting strong deviation from no-slip hydrodynamic flow. Adapted with permission from Majumder, M., Chopra,N., Andrews, R., Hinds, B.J. Nature 2005, 438, 44.
292 Basic Aspects of Polymeric and Inorganic Membrane Preparation

(<10%) porosity, are mechanically very brittle, and
fabrication of anodized membranes with small pore
size (<5 nm) is often irreproducible. However, ano-
dization of metals is an interesting approach to
synthesize ordered membrane structures with con-
trolled pore-size distribution and small tortuosity.
Although these membranes have found applications
in size-based separations [21] and as catalytic
membrane reactors [22], further modification by
carbonaceous material deposition provides many
possibilities.The synthesis and characterization of template-
synthesized membranes have been pioneered by
Charles Martin’s group at the University of
Florida. A schematic and scanning electron micro-
scopy (SEM) image of the template-synthesized
CNT membrane is shown in Figure 2(a). In
the schematic, the dark-gray intrusions are the
(a)
100 nm
3 KV ×5000 6.00 µm
(c) (d)
(b)
1 µm
1 µm
Figure 2 Different approaches to carbon nanotube (CNT) membrane synthesis. (a) Template synthesis approach-
carbonaceous material deposited inside anodized alumina template; (below) scanning electron micrograph (SEM) micrograph
of the nanotubes after dissolution of the template. (b) Dense-array outer-wall CNT membrane; SEM image demonstrating the
dense array of CNTs. The fluid transport is through the interstice between the nanotubes, although some transport can occurthrough some open-ended tubes [17]. (c) Open-ended CNT membrane; (below) SEM image showing the cross section of the
membrane with aligned CNTs in an impervious polymer matrix; transport in this membrane structure occurs through the inner
core of the CNT [18]. Image taken with permission from Majumder, M., Zhan, X., Andrews, R., Hinds, B. J. Langmuir 2007, 23,
8624–8631. (d) Mixed-matrix membrane composed of CNTs in a polymer matrix; (below) SEM image of the composite-membrane structure. Image taken with permission from Geng, H.-Z., Kim, K. So, K., Lee, Y., Chang, Y., Lee, Y. J. Am. Chem.
Soc. 2007, 129, 7758–7759.
Carbon Nanotube Membranes: A New Frontier in Membrane Science 293

carbonaceous material deposited inside the light-
gray (anodized alumina) template. The deposition
of carbonaceous materials inside template mem-
branes by CVD of ethylene can reduce the pore
size from �300 to �200 nm, but further reduction
was not observed [23]. It is likely that faster kinetics
of this deposition process is less controllable for
obtaining smaller dimension of pores, and is the
reason for much of Martin’s later work devoted to
the use of a more-controlled solution-based electro-
less deposition technique for steric separation of
small molecules [24]. This conjecture is further
supported by the work of Alsyouri et al. [20], in
which CVD, using trimethyl ammonium and water,
resulted in the reduction of porosity of �20-nm
templates and not their pore size. The CNT mem-
branes synthesized by this method also contain
amorphous or partially graphitized CNTs and are
chemically different from the membranes based on
the highly ordered graphitic CNTs. They can, how-
ever, be graphitized by heat treatment at higher
temperature. This was shown in template-synthe-
sized partially graphitic nanotubes, which can be
annealed at a higher temperature (>2000 �C) to
form graphitic nanotubes, as evidenced by electrical
conductivity, transmission electron microscopy, and
contact angle measurements [25]. It should, there-
fore, be possible to convert template CNT
membranes to partially graphitized CNT mem-
branes by heat treatment, although such treatments
are likely to increase the cost of the membranes.In this vein, it is worthwhile to point readers to
the fabrication of well-controllable, hierarchically
branched, and crystallized CNT architectures by
Ajayan and coworkers [26] using this template
approach. The well-branched porous architecture
has smaller pore dimensions at one end and larger
pore structure at the other end – similar to the
asymmetric membranes commonly used for filtra-
tion purposes [26]. Fluid flow or permeability of
these novel nanoscale architectures will verify its
applicability in nanofluidic applications. A major
advantage of the template synthesis approach is
that the modular components of thin-film deposi-
tion, electrochemical treatment, and CVD can be
integrated to microfluidic device fabrication plat-
forms. However, other approaches using as-formed
graphitic CNTs seem to be more realistic for pro-
ducing CNT membrane for large-scale
applications. In the subsequent sections, we discuss
membranes based on as-formed CNTs.
1.14.2.2 Dense-Array Outer-Wall CNTMembrane
Aligned arrays of CNTs can be used as membranes,where transport occurs primarily through the inter-stice between the CNTs, although some of thenanotubes might be open – as shown schematicallyin Figure 2(b). The CNTs, in this membrane struc-ture, are held together by van der Waals bondingbetween tubes and carbonaceous materials formedduring the CVD process. The pore size of this mem-brane is usually in the range of 40–100 nm – suitablefor ultrafiltration applications.
In some cases of CNT synthesis, such as by high-pressure CO conversion (HiPco) or laser oven pro-cesses, the nanotubes are produced as an entangledmesh held together by van der Waals forces [27].Alignment of CNTs, from such an entangled mesh,can be achieved by the application of some externallyapplied forces. Partial alignment of CNTs (�50%)inside a polymer matrix can be attained by mechanicalstretching during extrusion of a polymer–nanotubecomposite melt [28, 29] – although the degree ofalignment would be limited by the high viscosity ofthe melt, especially for samples with large volumefraction of CNTs. Researchers at Rice Universitywere able to align purified SWCNT bundles, inplane, using a magnetic field (�7 T) during filtrationof a nanotube suspension [30, 31], which is contrary toout-of-plane alignment requirements for filtrationapplication. Therefore, a particular emphasis in thefabrication of CNT membranes is formation of macro-structures with CNTs aligned perpendicular to thesubstrate. CVD from carbon-containing source and ametal catalyst can readily produce aligned CNTarrays over a substrate, such as Si and SiO2.
In the early 1990s, primarily after the discovery offullerene, research efforts were directed to synthesizecarbon nanostructures in large-scale capabilities.There was also a concerted effort to produce controllednanostructures composed of aligned CNTs, with thegoal of investigating the anisotropic properties ofCNTs applicable in field-emission devices. The ear-liest report of aligned MWCNT films was by deHeeret al. in 1995 [32] using the arc evaporation process.Subsequently, other methods, such as CVD, a scalableand industrially viable process, became popular [33].Aligned MWCNTs were also grown on nickel-coatedglass substrates by plasma-enhanced hot-filamentCVD from a mixture of acetylene and ammoniabelow 666 �C [34]; however, the CNTs produced bythis method had significant bamboo-type structures
294 Basic Aspects of Polymeric and Inorganic Membrane Preparation

making them unsuitable for flow-through applications.Among others, efforts at the Center for Applied EnergyResearch (CAER) at the University of Kentucky werefocused on perfecting and scaling up production ofMWCNT arrays from a continuous source of ferro-cene and xylene at �650 �C [35].
The overall geometry of the aligned CNT struc-ture depends on the shape of the substrate on whichthe CNTs are deposited. Srivastava and coworkerssucceeded in materializing this concept and formedhollow cylinders of aligned MWCNT (up to fewcentimeters long) along the walls of a tubular quartzreactor. The cylinders are composed of radiallyoriented MWCNTs of about 300–500-mm lengthand have been utilized for liquid and gas filtrationapplication [17]. More importantly, the mechanicalstrength of the CNT filter is high enough to allowliquid filtration by tangential cross flow, which iswidely used in industrial membrane filtration.Molecular transport in these membranes occurred,primarily, through the interface between nanotubes,although transport through the inner core of the opennanotubes cannot be overruled. Inter-nanotube dis-tance in the MWCNT arrays is in the range of 40–100 nm, which sets the pore size of the membranes. Apotential drawback of this membrane structure is theconsiderable variation in the size distribution of thefiltration pores – although these dimensions could betuned with closer packing of nanotubes or with nano-tubes of smaller outer diameter [36].
1.14.2.3 Open-Ended CNT Membrane
A contemporary approach in CNT membraneresearch is the use of open-ended CNT channels asconduits for molecular transport. A composite film issynthesized from an aligned array of the CNT by aspace-filling polymer [18] or ceramic matrix [19];however, maintaining the alignment of the CNTsduring this processing step is critical. Subsequently,the tips of the CNTs are oxidized by plasma chem-istry to form open-ended and conducting CNTchannels. A schematic and SEM image of a typicalnanotube membrane fabricated by such a process isdepicted in Figure 2(c).
The open-ended CNT membranes, with space-filling polymers, have been primarily based onpoly(styrene) [18]. The choice of poly(styrene) inthis work is dictated by its high wettability [37]with CNTs allowing easy penetration into theMWCNT array (�1010 tubes cm�2) by a simplefilm fabrication process. However, other
mechanically robust polymers and conformaldeposition techniques can substitute polystyrene.The CNT–polymer film is released from thequartz substrate, on which the CNTs grow, byhydrofluoric acid (HF) etch. The verticallyoriented CNTs in the polymer matrix often havea graphitic end cap (which have larger concentra-tion of defects and are easily oxidized compared tothe side walls) or a catalyst metal particle sealingthe graphitic interiors, which are etched awayusing mild plasma oxidation without destroyingthe mechanical structure of the CNTs [38].High-temperature oxidative [39] or acidic oxida-tion treatments can compromise the mechanicalintegrity of the membrane and are not suitablefor the membrane fabrication process. The ele-gance of the plasma-oxidation process stems fromits controllable oxidation kinetics, and the ability tofabricate a macroscopic CNT array device. Thisplasma-oxidation process, inherent to the mem-brane fabrication process, performs three veryimportant functions:
1. It removes excess polymers by oxidative trim-ming, since the oxidation kinetics of the polymer(CNT) is faster than that of the CNTs. Thisresults in the exposure of the CNTs out of thepolymer matrix, making the membrane electri-cally conducting.
2. The plasma-oxidation process also removes amor-phous carbon and Fe impurities, aided by HCltreatment. Note that the permeable pore densities(�109 cm�2) of membranes in Table 1, estimatedfrom salt-diffusion experiments, are almost a mag-nitude smaller than the density of the CNTs in thearrays (�1010 cm�2) estimated from microscopyexperiments. This is attributed to the incompleteremoval of the iron nanocrystals from the interiorsof the CNTs.
3. The plasma-oxidation process introduces func-tional groups (mainly –COOH) at the CNT tips,which makes the tips amenable to facile functio-nalization-chemistry approaches.
The CNT membrane structure after the plasma-oxidation process showed a pore-size distributionof �6� 2 nm, which is consistent with TEMobservations of the inner core of �7 nm.
In a similar work, aligned CNTs (with sub-2-nmdiameter) were grown on a Si chip patterned withmetal catalyst using a CVD process. A conformaldeposition of a ceramic material, Si3N4, filled upthe space between the nanotubes. Standard etching
Carbon Nanotube Membranes: A New Frontier in Membrane Science 295

procedures were adopted to create openings on the Si
chip; subsequently, excess Si3N4 and catalyst nano-
particles were removed by Ar-ion milling, while the
CNTs were uncapped by reactive ion etching [19].
In both these works, the production of the CNT
membranes relied on standard lithography tools
commonly associated with microelectronic industry.More traditional inorganic membrane fabrication
research groups have focused on making robust and
cost-efficient CNT membranes by using macropor-
ous membrane support layer and avoiding the use of
lithographic tools. In this effort, aligned CNT arrays
were grown over macroporous alumina supports and
the interstitial space between the CNTs was filled by
poly(styrene); however, the viscosity of the polymer
was high enough to preclude its entry into the macro-
porous alumina support. Mechanical polishing and
acid treatment were adopted to remove the polymer
overlayer and to open up the CNTs [40].The methodologies for fabrication of the first-
generation CNT membranes were aimed at under-
standing the fundamental transport behavior. They
suffer from several drawbacks, for example, the por-
osity of these membranes and the overall
permeability is uncertain, due to the presence of
considerable amount of Fe nanocrystals from the
vapor deposition process and the overall yield is
painstakingly small. The research approaches dis-
cussed earlier [18, 19, 40] have utilized as-formed
aligned CNTs for the fabrication of membranes; an
alternative route is to adapt colloidal processing
approaches. In this regard, Kim et al. [41] claim to
have developed a scalable process for the fabrication
of open-ended nanotube membranes by filtering a
CNT suspension through a hydrophobic porous
polytetrafluoroethylene (PTFE, 0.2-mm pore
diameter). Quite surprisingly, a substantial number
(�1010 cm�2) of CNTs were observed to stick out of
the filter surface, most likely due to the hydropho-
bic–hydrophobic interaction between the nanotubes
and the filter surface. A thin polymer binder filled up
the interstice between the nanotubes, leading to the
formation of the membrane. The key advantage of
this approach lies in the ability to use purified nano-
tubes (lower amount of Fe catalyst) with larger
through porosity and to use diameter-sorted CNT
suspensions. Scalability and the overall simplicity of
the colloidal approach have the potential to lower the
cost of CNT membrane fabrication.In sum, the fabrication of the open-ended CNT
membranes is complex, but it offers tighter control
over pore size as the transport occurs through theinner core of CNTs.
1.14.2.4 Mixed-Matrix CNT Membranes
Polymeric membrane materials are intrinsically lim-ited by a tradeoff between their permeability andtheir selectivity, yet they have been the basis forhigh-performance gas-separation applications.Virtually, all gas separations in polymeric membranesare limited by an upper boundary in a log–log plot ofgas selectivity and permeability [42]. One approachto increase the selectivity is to include dispersions ofinorganic nanoparticles, such as zeolites, carbonmolecular sieves, or CNTs, into the polymeric mem-branes – these membranes are classified as mixed-matrix membranes. In these membranes, the choice ofboth these components is a problem of materialsselection, and also involves several fundamentalissues, such as polymer-chain rigidity, free volume,and the altered interface – all of which influencetransport through the membrane [43]. Severalresearch groups are investigating the effects of incor-poration of CNTs to develop mixed-matrixmembranes. Schematic and SEM image of mixed-matrix CNT membranes are shown in Figure 2(d).In the dense-array or open-ended CNT membranes,transport is through the pores of CNTs and inter-particle pores in CNT array – a mechanism quitesimilar to porous ultrafiltration or nanofiltrationmembranes, whereas transport through the mixed-matrix membranes is predominantly by a solution–diffusion mechanism. Eva Marand and coworkershave incorporated open-ended and amine-functiona-lized CNTs (with �13.6-A pore diameter) intopoly(sulfone) [44] and poly(imide-siloxane) copoly-mer [45]. Incorporation of CNTs increases thepermeability of most gases by up to 60%, but theselectivity does not improve compared to thepolymeric membranes. However, appropriate manip-ulation of the interface can significantly improve theseparation performance. Considering the plethora ofpolymeric materials at the disposal, the combinatorialselection of components for membrane formulationmay pose a problem of plenty. Therefore, modelingand simulations are needed for predicting the trans-port properties of the mixed-matrix membranesa priori. Further, rational design of experiments foroptimization of materials processing and propertyrelationships can pave the way for the developmentof high-performance CNT-based mixed-matrixmembranes.
296 Basic Aspects of Polymeric and Inorganic Membrane Preparation

1.14.3 Properties and Applicationof CNT Membranes
In this section, we discuss the properties of the CNTmembrane with particular emphasis on their poten-tial applications.
1.14.3.1 Functionalization of CNTMembranes
Selective chemical transport through porous mem-branes can be affected by steric, electrostatic, orchemical interactions – often a combination of thesemechanisms results in the desired selectivity. Forexample, membranes can be engineered with poly-electrolytes containing charged amino and carboxylgroups to achieve separation of ions by electrostaticadsorption [46], or proteins by an affinity-basedseparation [47]. CNTs are composed of rolled-upgrapheme sheets consisting of sp2-hybridized carbon;however, liquid-phase (acid) and gas-phase (air andplasma) treatments introduce surface functionalgroups. Experimental results indicate that liquid-phase treatments tend to introduce carboxylic acidgroups, whereas gas-phase treatments introduce less-oxidized groups such as hydroxyl and carbonyl [48].Water plasma treatment for opening the CNTs ismost likely to introduce the carboxyl groups on thetips of the CNT membrane, because the high reac-tivity of the plasma precludes its entrance deep intothe pores, limiting the functionalization to the sur-face[49]. These functional groups, particularlycarboxylic acids can then be further modified bycovalently attaching molecules of interest to theseanchor points, using carbodiimide-mediated cou-pling of the carboxylic acid groups with aminegroups of the desired molecule. Modulation of ionictransport through the CNT membrane, by selectivechemical functionalization at the CNT tips, has beendemonstrated [50]. Transport through the membraneof two different-sized, but equally charged, mole-cules (ruthenium–bipyridine ½Ru�ðbipyÞ3 2þ � andmethyl viologen [MV2þ]) was quantified to under-stand the effect of the functionalization chemistry.The selectivity of the permeating molecules variedfrom 1.7 to 3.6 and a hindered diffusion model toexplain the observed selectivity was consistent with ageometry of functionalization concentrated at theCNT tip and not along the length of the CNTcore. Furthermore, it is possible to increase the den-sity of functional molecules by using electrochemical
approaches, such as diazonium grafting chemistry.Such chemistries enhanced the electrostatic interac-tions between the membrane and the permeatingspecies [51]. Molecular transport through mem-branes can also be driven by an electric field. Thisprocess, known as electro-osmosis, arises from thedrag exerted by counterions on solvent moleculesand provides a means to manipulate liquids by anelectric field, particularly in microfluidic devices.The direction of overall molecular transport is inthe direction of counterion migration, and is directlyrelated to the bound surface charge. Researchershave shown that template-synthesized CNT mem-brane functionalized with charged groupsdemonstrate controlled electro-osmotic transport[16]. In general, readers should be aware that awide range of literature for electrochemical (or che-mical) functionalization of the CNTs exists [52];however, selection of appropriate chemistry compa-tible with the mechanical integrity of the CNTmembranes and pertinent application is critical.Nevertheless, these experiments (Figure 3) indicatethe feasibility of functionalizing CNT membranesand should offer avenues for imparting antifouling,biocompatible, molecular recognition or selectiveadsorption properties, whenever desired.
1.14.3.2 CNT Membranes for Gas/VaporTransport Applications
Gas transport through the hollow interiors of CNTshas been the fancy of many scientists. Preliminaryanswers to how gaseous molecules are transportedthrough these nanoscale and highly smooth conduitscame through MD simulations. Several researchgroups in the US and UK studied the transport prop-erties of CNTs. Prominent among them are DavidSholl and Karl Johnson at the Carnegie MellonUniversity. They investigated the transport of smallgas molecules, such as N2, Ar, and CH4, throughnanoporous materials, including CNTs, with theoverarching goal of screening inorganic materialsfor potential gas-separation applications. In 2003,they reported that the transport diffusivities of Arthrough CNTs were almost three to four orders ofmagnitude larger than through zeolitic pores of com-parable dimensions [13]. Arguments based onspecular reflection of the gases along the smoothand frictionless graphitic interface were forwarded.Some work on MD simulations on gas transport wasalso conducted by the Susan Sinnot group atthe University of Kentucky and their simulations
Carbon Nanotube Membranes: A New Frontier in Membrane Science 297

also predicted extremely fast transport of gasesthrough CNTs [53]. Nick Quirke’s group atImperial College investigated hydrodynamics oflow-Knudsen-number fluid flow through graphiticpores. Their simulation results indicated the pre-sence of large slip lengths for such flows [54]. In2002, they proposed for the first time the presenceof slip-boundary conditions in Poiseuille flow offluids, such as CH4 on smooth CNT surfaces [55].In summary, several research groups computation-ally predicted the extremely fast mass-transportcharacteristics through the inner core of the hydro-phobic, and smooth CNTs.
From an experimentalist’s viewpoint, gas trans-port through mesoporous materials is generally acombination of (1) viscous or Poiseuille flow, (2)Knudsen diffusion, and (3) surface diffusion [56, 57].While the Poiseuille permeation scales inverselywith the viscosity, the characteristics of Knudsen-type transport are an inverse scaling with the squareroot of molecular weight of the gases – parallelingarguments for the kinetic theory of gases. Knudsendiffusion becomes prominent when the mean freepath of the diffusing species is larger than the porediameter. In some cases of porous membranes, a sur-face-adsorption-based preferential diffusion maylead to highly selective transport, especially in car-bon membranes with extremely small poredimensions (<1 nm) [58, 59].
Careful control experiments, such as retention ofAu nanoparticles and size-dependent separation ofmolecules, have validated the membrane structureconsisting of open-ended CNTs inserted inside animpermeable polymer matrix [11, 19]. Pore density(number of pores/m2) in these membranes can beestimated with reasonable accuracy by direct visua-lization using SEM or by diffusive transportmeasurements. Often, a large number of CNTs,which are visible by electron microscopy, can havetheir cores blocked by the catalyst particles (espe-cially in the case of membranes composed of large-diameter MWCNTs), so the microscopy experi-ments can provide a higher estimate to the numberof open-ended nanotubes. Nonetheless, this estima-tion is crucial for understanding the moleculartransport properties through the CNT membranes,as it allows the macroscopic transport measurementsto be converted to that for single nanotubes. It is alsoworthwhile to recollect that the mean free path forgases (�600 A for air) is significantly larger than thepore diameter of the CNT membrane (�12–70 A) –therefore, Knudsen diffusion is the likely gas-trans-port mechanism. For gas transport through smoothpores, such as CNTs, it is worth commenting thatKnudsen diffusivity can exceed the diffusivities pre-dicted from the kinetic theory of gases because ofspecular reflection along the CNT walls [60].Indications that such behavior can be true is provided
NH2
NH2
SO3H
SO3H
NNNNNN
HO
HO3S
NH2
SO3H
NHO
NH
H4
(a)
(b)
(c)
(d)
(e)
Figure 3 Functionalization of the CNT membrane via coupling chemistry between amine groups (in blue circle) of the
functional molecule and the carboxylic acid (in red) with (a) short (C9)-chain amine, (b) long (C22)-chain amine, (c) charged dyemolecule with SO3
2� groups, and (d) long-chain polypeptide resulted in change of transport properties through the CNT
membrane (e) Figures (a) through (e) adapted with permission from Majumder, M., Chopra, N., Hinds, B. J. J. Am. Chem. Soc.
2005, 127, 9062–9070. These experiments indicate the feasibility of functionalizing CNT membranes and should offeravenues for imparting antifouling, biocompatible, molecular recognition or selective adsorption properties, whenever desired.
298 Basic Aspects of Polymeric and Inorganic Membrane Preparation

by gas-transport measurements in a template-synthe-sized CNT membrane (�20–30 nm thick and 200-nm pore diameter) – the authors concluded that�50% of the gas collisions were specular [61].However, for more comprehensive assessments, gas-transport measurements through the open-endedCNTs are critical. Indeed, the observed permeabilityof gases in these CNT membranes scales inverselywith the molecular weight by an exponent �0.4 (forideal Knudsen diffusion this is 0.5); however, thediffusivities are around one to two orders of magni-tude larger than Knudsen diffusivity predictions [19,62]. Thus, a Knudsen-type diffusive transport, butwith a highly specular reflection along the CNTwalls, is the dominant gas-transport mechanism foropen-ended CNT membranes. The next obviousquestion is how can we utilize these amazing mass-transport properties for real-life gas-separationapplications. We must recognize that in such appli-cations one is interested not only in the throughput,but also in the selectivity; here is the caveat. Thesmoothness of the graphitic interiors, which is thereason for fast transport, is actually responsible forthe lack of selectivity – the selectivity will be limitedby the Knudsen-type selectivity. For all practicalapplications, it would, therefore, be necessary toimpart selectivities based on either functional mole-cules or surface adsorption–diffusion in CNTs withmuch smaller diameter (<1 nm) [63].
A school of thought is to include these nanoscalematerials in conventional membranes to augmentvapor/gas-transport efficiencies. For example, let usconsider membrane distillation, a thermal-membraneprocess for desalination of seawater. In this process,water vapor is preferentially transported through thehydrophobic pores of membranes over saline waterto affect the separation. The advantage of themembranes, here, is to lower the thermal require-ments due to convective mass-transport effects.Open-ended CNTs, where the kinetics of gas trans-port is much larger than Knudsen-type diffusion,could be a potentially interesting additive to theconventional microporous and hydrophobic mem-branes. Indication about the validity of suchconcepts comes from pervaporative separation ofbenzene/cyclohexane using membranes based onpolyvinyl alcohol–CNT–chitosan mixed-matrixmembranes [64]. Pervaporation is a process bywhich a component in a liquid mixture is preferen-tially vaporized through the membranes. It wasobserved that the incorporation of CNTs increasednot only the permeability of benzene but also its
selectivity compared to similar membranes withoutthe CNTs.
Let us now address, from the perspective of gasseparations, where membranes based on CNTs stand.Zeolites have been the basis of the chemical industryfrom selective adsorptive separations for several dec-ades. However, synthesis of defect-free zeolitemembranes is yet to reach commercial success,mainly because their irregular grain and pore struc-ture is incompatible to large-area synthesis ofmembranes. If CNTs, with their crystalline poreand small pore dimensions (<1 nm), could achievethe selectivity of zeolites, the recent developments inthe synthesis of defect-free CNT membranes wouldbe important in several gas-separation applications.However, the smallest dimensions (1–2 nm) of theCNT membranes made till date are not suitable forsuch sieving purposes and the gas-separation proper-ties of open-ended CNT membranes are, at best,modest. Mixed-matrix CNT membranes seem to bepotentially more attractive toward gas-separationapplications [65].
1.14.3.3 CNT Membranes for Stimuli-Responsive Applications
CNTs have several unique properties, including highelectrical conductivity and elasticity, which havebeen exploited in creating stimuli-responsive mem-branes. An account of such demonstrations and howit might influence some technologies is presented inthis section.
Researchers have demonstrated that superhydro-phobic CNT arrays can be rendered hydrophilic byapplication of an electric potential. These mem-branes are analogous to dense outer-wallmembranes, but are superhydrophobic; water trans-port through the CNT arrays can be controlled bythe application of an electrical bias to the membrane(see Figures 4(a) and 4(b)) [66]. Although thispotential-dependent wicking behavior through theCNT membrane is analogous to the well-knownphenomenon of electrowetting, the ability to controlwater transport through a membrane structure by anexternal stimulus can be useful in applications wherecontrolled transport of water droplets is necessary,for example, in lab-in-a-chip devices.
Another example of controlled molecular trans-port through CNT membranes is an effort to mimicthe complex functionality of biological voltage-gatedmembrane channels in artificial systems. In simpli-fied terms, biologists have shown that charged
Carbon Nanotube Membranes: A New Frontier in Membrane Science 299

protein segments in the membrane channels inducepaddle-like conformational changes, in response toan external stimuli, such as voltage, thereby changingthe transport through the channel [67]. Moleculesattached to the walls and entrances of CNT mem-branes can be actuated electrostatically, therebyselectively occluding the pores and altering transportof molecules through the pores [68]. In these experi-ments, the electrically conducting CNT membraneis the electrode in a three-electrode electrochemicalcell, and demonstrates the ability of these membranesto mimic voltage-gated channels found in nature (seeFigure 4(c)). Such electrostatically actuated molecu-lar transport is being considered as the enablingprinciple in transdermal drug delivery devices.
From voltage-controlled transport properties tomechanically regulated transport, CNT membranescan exhibit them all. Membranes that change poresize in response to compressive forces are found inthe kidney. Li et al. [69] have utilized the super-compressible property of CNTs to mimic such beha-vior. Super-compressibility is a spring-like property
of vertically oriented CNTs in which the arrays canbe compressed to a zigzag configuration, but retaintheir original texture when the force is released [70].Application of compressive force to the verticallyoriented dense outer-wall membrane flattens thenanotubes and decreases the pore size betweenthem, resulting in the concomitant increase in stericselectivity and decrease in water permeability (seeFigure 5).
The concept of stimuli-responsive membranes ispertinent to biological membrane channels andmimicking them in artificial systems to create func-tional membranes can be fundamentally elegant, aswell as useful in practical applications, such as inmicrofluidics and lab-on-a-chip devices.
1.14.3.4 CNT Membrane in LiquidTransport Applications
There had been several early experiments demon-strating the ability of the tubular interior of theCNTs to be used as nanoscale containers or conduits
016014012010080
Time (s)
0 V
Si substrate
Droplet
MWCNT membrane
Pt wire100 µm
IV
1.8 V2.6 V3.6 V4.5 V
Con
tact
ang
le (
degr
ee)
6040200–20
0
20
40
60
80
100
120
140
160
180
2468
1012141618
–200Voltage (mv)
Sep
arat
ion
fact
or
CNT-FG
CNT-plasma only
(b) (c)
–150 –100 –50 0 50 100 150 200
(a)
Figure 4 Voltage-controlled transport through carbon nanotube (CNT) membranes. (a) Contact angle measurements on
dense-array outer-wall CNT membrane as a function of applied electrical potential. (b) Variation of contact angle with applied
potential. Change of contact angle allows control of transport of water droplets for drop-in-demand-type applications.Figures (a) and (b) used with permission Wang, Z. K., Ci, L. J., Chen, L., Nayak, S., Ajayan, P. M., Koratkar, N. Nano Lett. 2007,
7, 697–702. (c) Voltage-gated membrane channels, in which large macromolecules tethered to the conducting pores of CNTs
can be actuated to selectively occlude the pores. Figure used with permission from Majumder, M., Zhan, X., Andrews, R.,Hinds, B. J. Langmuir 2007, 23, 8624–8631. This results in a voltage-controlled transport, mimicking biological membranes,
for transdermal drug delivery-type applications.
300 Basic Aspects of Polymeric and Inorganic Membrane Preparation

for mass transport. The earliest experiments demon-
strating the feasibility of infiltration of liquid molten
metal, such as lead, inside the inner cores of CNTs
were conducted by Ajayan and Ijima in 1993 [7]. In a
subsequent publication in the same year, the group
reported that inorganic materials, such as lead oxide,
were more difficult to incorporate inside open-ended
CNTs than molten metals [8]. Dujardin et al. [9, 10]
also studied the wetting behavior of CNTs by infil-
tration of molten metals in bulk MWCNT samples
with diameters of 2–20 nm. It was concluded that
liquids with surface tension less than �80 mN m�1
will wet the MWCNTs. Hence, liquids such as water
(�80 mN m�1 at 20 �C) and organics (e.g., ethanol
has a surface tension of �20 mN m�1 at 20 �C),
which have significantly less surface tension, could
(a) (b)
Pressure (kPa)
Flu
x (c
m m
in–1
)
(c)
Increasing compression
Holder
CNM
PTFE
Piston
Outlet
0.004
0.003
0.002
0.001
0.000
Per
mea
bilit
y (c
m m
in–1
kP
a–1)
0 20 40 60
Compression (%)
80 100
1000.0
0.5
1.0
1.5
2.0
2.5
3.0
200 300 400 500 600
Inlet
Figure 5 Compression-modulated transport through carbon nanotube (CNT) membrane. (a) The experimental apparatusfor water transport studies in the dense-array outer-wall CNT membrane, simultaneously with applied compressive force (b).
SEM images showing that the compressive force causes the membranes to shrink the inter-nanotube distance with a
concomitant decrease in liquid permeability (c). This is yet another demonstration that transport through membranescomposed of CNTs can be tuned by an external stimuli such as pressure. All pictures obtained with permission from Li, X.,
Zhu, G,. Dordick, J. S., Ajayan, P. M. Small 2007, 3, 595–599.
Carbon Nanotube Membranes: A New Frontier in Membrane Science 301

easily wet MWCNTs. Nevertheless, the importantconclusion from these early reports was the feasibil-ity of opening the CNTs using gas-phase oxidationsuch that the CNTs would act as nanoscale contain-ers for host materials [71].
However, the initial foray into the transport beha-vior of liquids, such as water, through the CNTs, asin the case of gases, was through computer simula-tions. At the National Institutes of Health inMaryland, Gerard Hummer’s interest in water trans-port through CNTs was primarily derived from theirhydrophobic nature and similarity to protein chan-nels. CNTs perhaps provided the possibility of amuch simpler model for MD simulations comparedto complex protein channels. Their seminal publica-tion in 2001 suggested that hydrophobic CNTchannels, aided by the frictionless and smooth gra-phitic walls along with a cooperative behavior of asingle-file hydrogen-bonded network, allow water tobe transported at extraordinary speed [12]. Kalra et al.[72] studied the osmotically driven transport of waterthrough CNTs, and the simulated water-flow velo-cities were very close to those found in natural waterchannels such as aquaporin. More esoterically, KlausSchulten’s group at the University of Illinois Urbana-Champaign studied water and proton transport beha-vior through CNTs. In their simulations, the waterdipoles were found to be aligned unidirectionally inpristine nanotubes, but somewhat disturbed in CNTscontaining charged groups, indicating a structuralchange in the water structure inside defectiveCNTs [73]. Nick Quirke’s group at ImperialCollege reported extremely rapid wicking kineticsof oil in CNTs and that the kinetics were notexplainable by the conventional Washburn equation[74]. Overall, the simulation studies by all thesescientists indicated that the physics of the interactionof liquids, particularly water, with CNTs is some-thing special and needs efforts from theirexperimental counterparts.
Yuri Gogotsi and coworkers of Drexel Universityhave experimentally studied the behavior of waterinside hydrothermally synthesized CNTs by in situ
microscopy techniques. In 2002 [75], the groupreported that the flow velocities of water is�0.5� 10�6 m s�1 in 50-nm inner-diameter nano-tubes. Although this study conclusively proved thepresence of water in equilibrium with a gas inside theCNTs, uncertainty remained as to the driving forceof this transport measurement. In a subsequent work,MWCNTs were hydrothermally filled with water,
frozen at –80 �C, and examined by high-resolutiontransmission electron microscopy and electron emis-
sion loss spectrometry [76]. Two key observationsemerged from this study. The first one indicated that
the CNTs with larger pore diameter (20–100 nm)had water segments interspersed with intermittent
air pockets, while a rather continuous cylinder ofwater existed in CNTs with smaller pore diameter
in the range of 5–10 nm. In the other case, an air gapof�4 A between the graphitic walls and frozen water
was also observed, especially in the case of smoothergraphitic nanotubes [77]. This observation of an airgap between the graphitic surface and the proximal
layer of water is remarkable and can be explained bydrying transitions of water in nanoscale hydrophobic
objects [78].The earliest experimental mass-transport mea-
surements through CNTs were undertaken onsingle-pore CNT membranes of �120-nm pore dia-
meter by the Crooks group, formerly at Texas A&MUniversity [79]. The large-diameter single-porenanotubes did not exhibit any unusual transport
properties and were suited as Coulter countingdevices. A Coulter counter is a device that can
count biological cells or colloidal particles based onthe measurement of ion current through the pores
[80]. Based on this approach, there is potential for thedevelopment of single-pore membranes of (1–2-nm
diameter) for stochastic ion-channel sensing ofDNA/RNA translocation [81].
For more macroscopic measurements, flow velo-city of liquids (J) through porous membranes can bepredicted using the Hagen–Poiseuille equation and is
given by
J ¼ "p:�:r2:�P
8:�:�:L
where "p is the relative porosity, r0 the pore radius, P
the applied pressure, � the dynamic viscosity, � thetortuosity, and L the pore length. The basic assump-tions behind this equation are laminar flow and noslip at the boundary layer (i.e., the velocity of thefluid at the CNT wall is zero) and is available in anystandard fluid mechanics text.
Pressure-induced transport of a variety of liquids,including water, ethanol, isopropyl alcohol, hexane, and
decane, was studied through the inner core of open-ended CNT membrane structure. Enhancement factors
for different liquids, shown in Table 1, are calculatedfrom the equation
302 Basic Aspects of Polymeric and Inorganic Membrane Preparation

Enhancement factor
¼ Experimentally observed flow velocity
Hagen�Poiseuille flow velocity
The flow velocities were found to exceed predictionsof liquid flow with no-slip boundary condition by10 000–100 000-fold, suggesting frictionless flowthrough the CNT cores [11]. The observed flowvelocities were consistent with MD simulation pre-dictions by Hummer et al., and have also beenconfirmed in sub-2-nm CNTs by another indepen-dent research group [19]. Interestingly, progressivefunctionalization of the CNT tips and cores by bulkmacromolecules slowed down the flow of liquidsthrough the membrane, confirming the hypothesisthat the enhanced flow velocities are due to thenoninteracting nature of the graphitic cores [62].However, the mechanism of fast water transportthrough CNTs is still unclear. Hummer’s MD simu-lations [12] were obtained for very small nanotubes(�0.8 nm) and suggested a hydrogen-bonded single-file transport of water molecules. It is possible thatthese simulation results are not applicable to largernanotubes, such as those in the recent experimentalobservations in nanotubes with �1.6- or �7-nm dia-meters. More applicable for these dimensions ofnanotubes is the concept of slip boundary conditions.Theoretically, the existence of micron-scale sliplengths has been explained by the presence of agas–liquid or a depletion interface, which providesa nonzero velocity at the walls [82, 83]. Recent MDsimulations have attempted to understand the waterstructure at the depletion region of a smooth nano-tube interface and relate it to the water-transportproperties [84]. Although water transport in tubularnanoscale channels made from, for example, boronnitride, Si, or CNTs with rough surfaces behaved in ausual manner, the enhancement factors on 1.6-nm-diameter CNT showed excellent agreement withprior experimental data. These simulations underlinethe direct relationship between the noninteractinggraphitic interface and their unique mass-transportproperties. Despite these developments, there remainseveral unresolved questions regarding the structureand properties of liquids in the hydrophobic cores ofCNTs. It is likely that the experimental scaffoldsmade from CNTs, using methods as discussed ear-lier, can shed light on some of these nanoscaletransport phenomena.
Transiting to the more worldly applications ofthese membranes–liquid filtration studies on dense
outer-wall membranes made from CNTs can
separate bacteria such as Escherichia coli andStaphylococcus aureus and even polio virus in the sizerange of �25–30 nm. A competitive advantage ofthese membranes over polymeric counterparts isthe ability to use autoclave processes at �121 �C forsteam cleaning [17]. These membranes could be analternative to commercial ultrafiltration membranesfor separation of bacteria, virus, and proteins. Onemust also recognize another unique advantage ofthese membranes – the high electrical conductivitycan enable several flux regeneration strategies usingprinciples of electrochemistry.
The concept of membrane reactors, which com-bine reaction and separation to increase efficiencybased on laws of mass action, is well established[85]. The development of electrochemical mem-brane reactors has been stymied by the lack ofelectrical conductivity of the membrane materialsused to date. As discussed earlier, the high electricalconductivity, chemical inertness of the dense-arrayouter-wall CNT membranes make them a candidatefor simultaneous electrochemical reaction andseparation, particularly for destruction of hazardousorganic compounds [86]. The concept of such amembrane reactor is shown in Figure 6, whichcould possibly oxidize phenol to benign compoundssuch as carbon dioxide, water, and aliphatic com-pounds such as oxalic acid, along with CO2 andH2O [87].
The fast water transport through the inner core ofCNTs along with the steric and electrostatic selec-tivity offered by the pores of the nanotubes will havecompetitive advantage over traditional liquid filtra-tion membranes. In this vein, researchers areconsidering the use of CNT membranes for devel-oping compact and energy-efficient desalinationsystems – all stemming from the exceptional mass-transport properties of the CNTs. The inspiration forCNT-membrane-based desalination comes frombiological protein channels known as aquaporin,which can transport water at extraordinary speedand selectivity [88] (see Figure 7).
Although the ability of CNTs to transport waterat speeds close to that of aquaporin has been shownby several research groups, rejection of monovalentions (in the range of 80–90%) by nanotubes has notbeen demonstrated. The book-chapter was written inlate 2008. However, recently, Donnan-type exclusionhas been realized in CNT membranes. Please see thearticle by Fornasiero et al. for more details.Therefore, it remains one of the grand challenges inCNT membrane research – the possibilities being
Carbon Nanotube Membranes: A New Frontier in Membrane Science 303
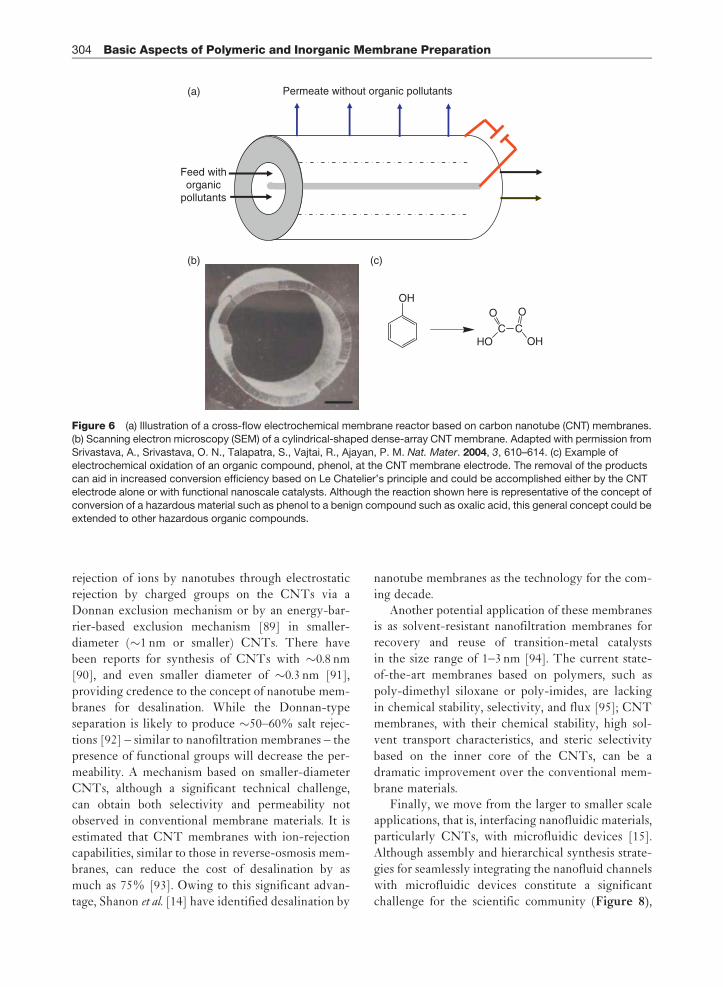
rejection of ions by nanotubes through electrostaticrejection by charged groups on the CNTs via aDonnan exclusion mechanism or by an energy-bar-
rier-based exclusion mechanism [89] in smaller-diameter (�1 nm or smaller) CNTs. There have
been reports for synthesis of CNTs with �0.8 nm[90], and even smaller diameter of �0.3 nm [91],
providing credence to the concept of nanotube mem-branes for desalination. While the Donnan-type
separation is likely to produce �50–60% salt rejec-tions [92] – similar to nanofiltration membranes – thepresence of functional groups will decrease the per-
meability. A mechanism based on smaller-diameterCNTs, although a significant technical challenge,
can obtain both selectivity and permeability notobserved in conventional membrane materials. It is
estimated that CNT membranes with ion-rejectioncapabilities, similar to those in reverse-osmosis mem-branes, can reduce the cost of desalination by as
much as 75% [93]. Owing to this significant advan-tage, Shanon et al. [14] have identified desalination by
nanotube membranes as the technology for the com-
ing decade.Another potential application of these membranes
is as solvent-resistant nanofiltration membranes for
recovery and reuse of transition-metal catalysts
in the size range of 1–3 nm [94]. The current state-
of-the-art membranes based on polymers, such as
poly-dimethyl siloxane or poly-imides, are lacking
in chemical stability, selectivity, and flux [95]; CNT
membranes, with their chemical stability, high sol-
vent transport characteristics, and steric selectivity
based on the inner core of the CNTs, can be a
dramatic improvement over the conventional mem-
brane materials.Finally, we move from the larger to smaller scale
applications, that is, interfacing nanofluidic materials,
particularly CNTs, with microfluidic devices [15].
Although assembly and hierarchical synthesis strate-
gies for seamlessly integrating the nanofluid channels
with microfluidic devices constitute a significant
challenge for the scientific community (Figure 8),
Feed withorganic
pollutants
Permeate without organic pollutants
OH
C C
OO
HO OH
(a)
(b) (c)
Figure 6 (a) Illustration of a cross-flow electrochemical membrane reactor based on carbon nanotube (CNT) membranes.
(b) Scanning electron microscopy (SEM) of a cylindrical-shaped dense-array CNT membrane. Adapted with permission from
Srivastava, A., Srivastava, O. N., Talapatra, S., Vajtai, R., Ajayan, P. M. Nat. Mater. 2004, 3, 610–614. (c) Example ofelectrochemical oxidation of an organic compound, phenol, at the CNT membrane electrode. The removal of the products
can aid in increased conversion efficiency based on Le Chatelier’s principle and could be accomplished either by the CNT
electrode alone or with functional nanoscale catalysts. Although the reaction shown here is representative of the concept of
conversion of a hazardous material such as phenol to a benign compound such as oxalic acid, this general concept could beextended to other hazardous organic compounds.
304 Basic Aspects of Polymeric and Inorganic Membrane Preparation

CNTs can provide multifunctional properties, suchas frictionless flow, voltage-controlled transport, andelectrokinetic mixing at the nanoscale. Therefore,such themes are emerging areas of research in CNTmembranes.
1.14.4 Directions of Future Research
CNT membranes represent an emerging branch ofmembrane science with myriad opportunities inmaterials science and engineering, which can spawnapplications in diverse areas concerning our environ-ment and energy. Researchers may be inspired by the
fact that a concerted effort in the United States,
presently, is considering CNT membranes as alter-
natives to mature materials, such as thin-film
composite membranes, for desalination of seawater.
At this point, it may be worthwhile to reiterate that
this novel class of membranes can provide several
competitive advantages, such as:
1. very fast liquid- and gas-transport properties;2. tighter control over the pore-size distribution;3. chemically tuned mass-transport properties;4. stimuli-responsive behavior; and5. well-defined nanofluidic scaffolds for understand-
ing molecular transport at the nanoscale.
(c)
H2O
(d)
24(a)
(b)
(5,5)
(6,6)
(7,7)
(8,8)
(5,5)
(7,7)
(6,6)(8,8)
H2O
Na+
20
16
12
8
4
0
1.2
0.8
0.4
PM
F (
kcal
mol
–1)
PM
F (
kcal
mol
–1)
0.0
–0.40 4 8
Axial position (Å)12
Figure 7 Molecular dynamic studies of ion (a) and water (b) permeation through an open-ended carbon nanotube (CNT)membrane composed of (5,5), (6,6), (7,7), and (8,8) CNTs. Potential of mean force (PMF) is the force for pulling an ion (a) or
water molecule (b) from the bulk solution (z¼14) to the center of the pore (z¼ 0). Note the considerably large energy barrier for
penetration of Naþ for small-diameter nanotubes. Figures (a) and (b) used with permission from Corry, B. J. Phys. Chem. B
2007, 112, 1427–1434. The recent enthusiasm of CNTs for salt removal is inspired by protein channels such as aquaporin (c),which can transport water very selectively and with extraordinary speed. Figure used with permission Nielsen, S., Frokiar, J.,
Marples, D., Kwon, T.-H., Agre, P., Knepper, M. A. Physiol. Rev. 2002, 82, 205–244. This forms the inspiration for developing
CNT membranes (d) for desalination. Figure (d) used with permission from Majumder, M., Zhan, X., Andrews, R., Hinds, B. J.Langmuir 2007, 23, 8624–8631.
Carbon Nanotube Membranes: A New Frontier in Membrane Science 305

It is not surprising that a wide range of applica-tions in controlled-release devices, sensors,membrane reactors, and nanoscale fluidic inter-connects in microfluidic devices along withtraditional membrane separations (which we willdiscuss later) can be easily conjured. Such a widerange of properties, not obvious with traditionalmembrane material, is why CNT-based mem-branes are a new frontier in membrane science.In this chapter, we have discussed differentapproaches for the fabrication of these membranesand showcased their novel transport properties.To further aid our readers, a summary of thedemonstrated and future applications (as thought
by the authors) of membranes based on CNTs ispresented in Table 2. For example, the dense-array outer-wall CNT membranes are potentiallyattractive for ultrafiltration applications such asprotein separations. Their electrical conductivitycould be useful for flux regeneration andenvironmental remediation applications as elec-trochemical membrane reactors. Open-endedCNT membranes are being considered fordesalination applications, while mixed-matrixmembranes could provide materials with noveltransport properties for conventional membraneprocesses, such as membrane distillation, perva-poration, or gas separation.
Table 2 Current status and future applications of CNT membrane
Type of CNT membrane Pore size Applications demonstrated Future applications
Template-synthesized 20 nm [20] Water-vapor/oxygen separation [20] Nanofluidic interconnects
in microfluidic platformsCNT membrane 200 nm [23] Electro-osmotic transport [23]
Dense-array outer-wall
CNT membrane
20–100 nm [17] Heavy hydrocarbon (liquid) separation
[17]
Ultra filtration membranes
Bacteria separation [17] Electrochemicalmembrane reactors
Voltage-controlled transport [66]
Protein separation [69]Compression-modulated transport [69]
Open-ended CNT
membrane
1–2 nm [19] Nanoparticle separation [50] Desalination [14]
�7 nm [18] Small-molecule separation [50] Recovery of homogenous
catalysts
Voltage-gated transport for transdermaldrug delivery [68]
DialysisStochastic sensing [81]
Mixed-matrix CNT
membranes
Nonporous Gas separation [44] Gas separation
Pervaporation [64] Pervaporation
Figure 8 Illustration of carbon nanotubes (CNTs) as an interface between two microfluidic channels. The CNTs could act as
filtration channels, control transport of molecules through external stimuli, such as voltage, or aid in mixing via electrokineticphenomena at the nanoscale. While some of these application potentials have been demonstrated in voltage-controlled
transport experiments in macroscopic membranes [66, 68], the template synthesis allows seamless integration of these
nanoscale transport channels into microfluidic platforms.
306 Basic Aspects of Polymeric and Inorganic Membrane Preparation

Despite this euphoria, challenges remain tosynthesize these membranes reproducibly, cost effec-tively, and with minimum spread of diameters overlarge areas. For example, desalination membranes for>95% salt rejection (a very modest number for desa-lination purposes) would require less than 1 in 100tubes above 1-nm diameter [89]. These approaches
could be controlled at the formation stage, that is,understanding and fine-tuning the growth of nano-tubes. An array of SWCNT (with inner diameter�3 nm) grown by hot-filament CVD technique atRice University is shown in Figure 9.
The alternative approach would require utiliza-tion of diameter-controlled sorting of CNTs fromSWCNT suspensions [96], followed by alignmentof CNTs based on self/electric-field-based assembly.To sum, research on CNT membranes is at its nas-cent stage of evolution – several real-life applicationscan emerge in the near future – however, several
fundamental and engineering questions still remainunaddressed. Therefore, this highly rewarding andcrosscutting multidisciplinary research area needssynergistic contributions from nanoscale materialsscience, composite materials engineering, and trans-port phenomena to bring paradigms to severalconventional technologies.
References
[1] Iijima, S. Nature 1991, 354, 56–58.[2] Iijima, S., Ichihashi, T. Nature 1993, 363, 603–605.[3] Monthioux, M., Kuznetsov, V. L. Carbon 2006, 44,
1621–1623.[4] Fischer, J. E., Dai, H., Thess, A., et al. Phys. Rev. B 1997,
55, R4921.[5] Frank, S., Poncharal, P., Wang, Z. L., Heer, W. A. Science
1998, 280, 1744–1746.[6] Dai, H., Wong, E. W., Lieber, C. M. Science 1996, 272,
523–526.[7] Ajayan, P. M., Iijima, S. Nature 1993, 361, 333–334.[8] Ajayan, P. M., Ebbesen, T. W., Ichihashi, T., Iijima, S.,
Tanigaki, K., Hiura, H. Nature 1993, 362, 522–525.[9] Dujardin, E., Ebbesen, T. W., Hiura, H., Tanigaki, K.
Science 1994, 265, 1850–1852.[10] Dujardin, E., Ebbesen, T. W., Krishnan, A., Treacy, M. M. J.
Adv. Mater. 1998, 10, 1472–1475.[11] Majumder, M., Chopra, N., Andrews, R., Hinds, B. J.
Nature 2005, 438, 44.[12] Hummer, G., Rasaiah, J. C., Noworyta, J. P. Nature 2001,
414, 188–190.[13] Ackerman, D. M., Skoulidas, A. I., Sholl, D. S.,
Johnson, J. K. Mol. Simul. 2003, 29, 677–684.[14] Shannon, M. A., Bohn, P. W., Elimelech, M.,
Georgiadis, J. G., Marinas, B. J., Mayes, A. M. Nature2008, 452, 301–310.
[15] Whitby, M., Quirke, N. Nat. Nanotechnol. 2007, 2,87–94.
[16] Miller, S. A., Young, V. Y., Martin, C. R. J. Am. Chem. Soc.2001, 123, 12335–12342.
[17] Srivastava, A., Srivastava, O. N., Talapatra, S., Vajtai, R.,Ajayan, P. M. Nat. Mater. 2004, 3, 610–614.
Figure 9 Future research has to be focused on tuning the growth of CNTs with closer packing, finer (1–2 nm) pores, and less
spread in pore sizes. Several critical applications, such as desalination and separation of homogenous catalysts, require
uniformity of the dimensions of the nanotube in large areas. Shown here is a scanning electron microscopy (SEM) image of an
array of SWCNT, in which the theoretical inner diameter can be as small as 0.4 nm. Courtesy of Dr. Robert Hauge, Chemistry,Rice University.
Carbon Nanotube Membranes: A New Frontier in Membrane Science 307

[18] Hinds, B. J., Chopra, N., Rantell, T., Andrews, R.,Gavalas, V., Bachas, L. G. Science 2004, 303, 62–65.
[19] Holt, J. K., Park, H. G., Wang, Y., et al. Science 2006, 312,1034–1037.
[20] Alsyouri, H. M., Langheinrich, C., Lin, Y. S., Ye, Z., Zhu, S.Langmuir 2003, 19, 7307–7314.
[21] Sano, T., Iguchi, N., Iida, K., Sakamoto, T., Baba, M.,Kawaura, H. Appl. Phys. Lett. 2003, 83, 4438–4440.
[22] Cho, S.-H., Walther, N. D., Nguyen, S. T., Hupp, J. T.Chem. Commun. 2005 5331–5333.
[23] Miller, S. A., Young, V. Y., Martin, C. R. J. Am. Chem. Soc.2001, 123, 12335–12342.
[24] Jirage, K. B., Hulteen, J. C., Martin, C. R. Science 1997,278, 655–658.
[25] Mattia, D., Rossi, M. P., Kim, B. M., Korneva, G.,Bau, H. H., Gogotsi, Y. J. Phys. Chem. B 2006, 110,9850–9855.
[26] Meng, G., Jung, Y. J., Cao, A., Vajtai, R., Ajayan, P. M.Proc. Natl. Acad. Sci. U.S.A. 2005, 102, 7074–7078.
[27] Bronikowski, M. J., Willis, P. A., Colbert, D. T., Smith, K. A.,Smalley, R. E. Vacuum, Thin Films, Surfaces/Interfaces,and Processing NAN06. In The 47th InternationalSymposium, Boston, MA, 2001; pp 1800–1805.
[28] Jin, L., Bower, C., Zhou, O. Appl. Phys. Lett. 1998, 73,1197–1199.
[29] Thostenson, E. T., Chou, T.-W. J. Phys. D: Appl. Phys.2002, 35, L77–L80.
[30] Smith, B. W., Benes, Z., Luzzi, D. E., et al. Appl. Phys. Lett.2000, 77, 663–665.
[31] Casavant, M. J., Walters, D. A., Schmidt, J. J.,Smalley, R. E. J. Appl. Phys. 2003, 93, 2153–2156.
[32] deHeer, W. A., Bacsa, W. S., Chatelain, A., et al. Science1995, 268, 845–847.
[33] Li, W. Z., Xie, S. S., Qian, L. X., et al. Science 1996, 274,1701–1703.
[34] Ren, Z. F., Huang, Z. P., Xu, J. W., et al. Science 1998, 282,1105–1107.
[35] Andrews, R., Jacques, D., Rao, A. M., et al. Chem. Phys.Lett. 1999, 303, 467–474.
[36] Raravikar, N. R., Schadler, L. S., Vijayaraghavan, A.,Zhao, Y., Wei, B., Ajayan, P. M. Chem. Mater. 2005, 17,974–983.
[37] Safadi, B., Andrews, R., Grulke, E. A. J. Appl. Polym. Sci.2002, 84, 2660–2669.
[38] Huang, S., Dai, L. J. Phys. Chem. B 2002, 106, 3543–3545.[39] Chiang, I. W., Brinson, B. E., Smalley, R. E.,
Margrave, J. L., Hauge, R. H. J. Phys. Chem. B 2001, 105,1157–1161.
[40] Mi, W. L., Lin, Y. S., Li, Y. D. J. Membr. Sci. 2007, 304, 1–7.[41] Kim, S., Jinschek, J. R., Chen, H., Sholl, D. S., Marand, E.
Nano Lett. 2007, 7, 2806–2811.[42] Robeson, L. M. J. Membr. Sci. 1991, 62, 165–185.[43] Mahajan, R., Koros, W. J. Ind. Eng. Chem. Res. 2000, 39,
2692–2696.[44] Geng, H.-Z., Kim, K. So, K., Lee, Y., Chang, Y., Lee, Y. J.
Am. Chem. Soc. 2007, 129, 7758–7759.[45] Kim, S., Pechar, T. W., Marand, E. Desalination 2006, 192,
330–339.[46] Hollman, A. M., Bhattacharyya, D. Langmuir 2004, 20,
5418–5424.[47] Hollman, A. M., Christian, D. A., Ray, P. D., et al.
Biotechnol. Prog. 2005, 21, 451–459.[48] Ago, H., Kugler, T., Cacialli, F., et al. J. Phys. Chem. B
1999, 103, 8116–8121.[49] Domingo-Garcia, M., Lopez-Garzon, F. J., Perez-
Mendoza, M. J. Colloid Interface Sci. 2000, 222,233–240.
[50] Majumder, M., Chopra, N., Hinds, B. J. J. Am. Chem. Soc.2005, 127, 9062–9070.
[51] Majumder, M., Keis, K., Zhan, X., Meadows, C., Cole, J.,Hinds, B. J. J. Membr. Sci. 2008, 316, 89–96.
[52] Alison, J. D. Electroanalysis 2000, 12, 1085–1096.[53] Mao, Z., Sinnott, S. B. J. Phys. Chem. B 2000, 104,
4618–4624.[54] Sokhan, V. P., Nicholson, D., Quirke, N. J. Chem. Phys.
2001, 115, 3878–3887.[55] Sokhan, V. P., Nicholson, D., Quirke, N. J. Chem. Phys.
2002, 117, 8531–8539.[56] de Lange, R. S. A., Keizer, K., Burggraaf, A. J. J. Membr.
Sci. 1995, 104, 81–100.[57] Cussler, E. L. Diffusion: Mass Transfer in Fluid
Systems, 2nd edn.; Cambridge University Press:London, 2003.
[58] Rao, M. B., Sircar, S. J. Membr. Sci. 1993, 85, 253–264.[59] Fuertes, A. B. J. Membr. Sci. 2000, 177, 9–16.[60] Arya, G., Chang, H.-C., Maginn, E. J. Phys. Rev. Lett. 2003,
91, 026102.[61] Cooper, S. M., Cruden, B. A., Meyyappan, M., Raju, R.,
Roy, S. Nano Lett. 2004, 4, 377–381.[62] Majumder, M. PhD Dissertation, University of Kentucky,
2007, 43–66.[63] Wei, B.-Y., Hsu, M.-C., Yang, Y.-S., Chien, S.-H.,
Lin, H.-M. Mater. Chem. Phys. 2003, 81, 126–133.[64] Peng, F., Pan, F., Sun, H., Lu, L., Jiang, Z. J. Membr. Sci.
2007, 300, 13–19.[65] Cong, H., Zhang, J., Radosz, M., Shen, Y. J. Membr. Sci.
2007, 294, 178–185.[66] Wang, Z. K., Ci, L. J., Chen, L., Nayak, S., Ajayan, P. M.,
Koratkar, N. Nano Lett. 2007, 7, 697–702.[67] Jiang, Y., Lee, A., Chen, J., et al. Nature 2003, 423, 33–41.[68] Majumder, M., Zhan, X., Andrews, R., Hinds, B. J.
Langmuir 2007, 23, 8624–8631.[69] Li, X., Zhu, G,. Dordick, J. S., Ajayan, P. M. Small 2007, 3,
595–599.[70] Cao, A., Dickrell, P. L., Sawyer, W. G., Ghasemi-
Nejhad, M. N., Ajayan, P. M. Science 2005, 310,1307–1310.
[71] Ajayan, P. M., Stephan, O., Redlich, P., Colliex, C. Nature1995, 375, 564–567.
[72] Kalra, A., Garde, S., Hummer, G., Proc. Natl. Acad. Sci.U.S.A. 2003, 100, 10175–1080.
[73] Zhu, F., Schulten, K. Biophys. J. 2003, 85, 236–244.[74] Supple, S., Quirke, N. Phys. Rev. Lett. 2003, 90, 214501.[75] Megaridis, C. M., Yazicioglu, A. G., Libera, J. A.,
Gogotsi, Y. Phys. Fluids 2002, 14, L5–L8.[76] Rossi, M. P., Ye, H. H., Gogotsi, Y., Babu, S., Ndungu, P.,
Bradley, J. C. Nano Lett. 2004, 4, 989–993.[77] Naguib, N., Ye, H. H., Gogotsi, Y., Yazicioglu, A. G.,
Megaridis, C. M., Yoshimura, M. Nano Lett. 2004, 4,2237–2243.
[78] Lum, K., Chandler, D., Weeks, J. D. J. Phys. Chem. B 1999,103, 4570–4577.
[79] Sun, L., Crooks, R. M. J. Am. Chem. Soc. 2000, 122,12340–12345.
[80] Ito, T., Sun, L., Crooks, R. M. Anal. Chem. 2003, 75,2399–2406.
[81] Bayley, H., Cremer, P. S. Nature 2001, 413, 226–230.[82] Lauga, E., Brenner, M. P. Phys. Rev. E (Stat., Nonlinear,
Soft Mat. Phys.) 2004, 70, 026311-1–026311-7.[83] de Gennes, P. G. Langmuir 2002, 18, 3413–3414.[84] Joseph, S., Aluru, N. R. Nano Lett. 2008, 8, 452–458.[85] Denbigh, K. G., Turner, J. C. R. Chemical Reactor Theory:
An Introduction, 3rd edn.; Cambridge University Press:London, 1984.
[86] Martinez-Huitle, C. A., Ferro, S. Chem. Soc. Rev. 2006, 35,1324–1340.
[87] Maluleke, M. A., Linkov, V. M. Sep. Purif. Technol. 2003,32, 377–385.
308 Basic Aspects of Polymeric and Inorganic Membrane Preparation

[88] Nielsen, S., Frokiar, J., Marples, D., Kwon, T.-H., Agre, P.,Knepper, M. A. Physiol. Rev. 2002, 82, 205–244.
[89] Corry, B. J. Phys. Chem. B 2007, 112, 1427–1434.[90] Marn, C., Serrano, M. D., Yao, N., Ostrogorsky, A. G.
Nanotechnology 2002, 13, 218–220.[91] Zhao, X., Liu, Y., Inoue, S., Suzuki, T., Jones, R. O.,
Ando, Y. Phys. Rev. Lett. 2004, 92, 125502.[92] Fornasiero, F., Park, H. G., Holt, J. K., et al. Proc. Natl.
Acad. Sci. U.S.A. 2008, 105, 17250–17255.
[93] Lamont, A. Some Results Bearing on the Value ofImprovements of Membranes for Reverse Osmosis;UCRL-TR-219746, Lawrence Livermore NationalLaboratory, 2006.
[94] Cole-Hamilton, D. J. Science 2003, 299, 1702–1706.[95] Wong, H.-T., See-Toh, Y. H., Ferreira, F. C., Crook, R.,
Livingston, A. G. Chem. Commun. 2006, 2063–2065.[96] Arnold, M. S., Green, A. A., Hulvat, J. F., Stupp, S. I.,
Hersam, M. C. Nat. Nano. 2006, 1, 60–65.
Carbon Nanotube Membranes: A New Frontier in Membrane Science 309

Biographical Sketches
Dr. Mainak Majumder received his undergraduate degree from the Calcutta University in 1999 and a master’sdegree from the Banaras Hindu University in 2001. He then served as a staff scientist for 2 years at the CentralGlass and Ceramic Research Institute (CGCRI), a national laboratory in India, with a focus on membranetechnologies for water purification. He received his PhD from the University of Kentucky in 2007, where hestudied the molecular transport properties through carbon nanotube membranes. At present, he is pursuingresearch at Rice University on colloidal processing of carbon nanotubes. His research focus is the interface ofmaterials science and chemical engineering, particularly how nanoscale materials can be applied to developnovel materials for energy and environmental applications. Presently he is an academic staff member at theDepartment of Mechanical and Aerospace Engineering, Monash University, Australia.
Professor Pulickel M. Ajayan received his undergraduate degree from the Banaras Hindu University in 1985,and doctoral degree from Northwestern University in 1989. A pioneer in the area of carbon nanotubes, Prof.Ajayan has been one of the key figures in the development of carbon nanotube technologies. After 10 years atthe Rensselaer Polytechnic Institute (RPI), including as director of the RPI Interconnect Focus Center, NewYork, he joined Rice University as the Benjamin M. and Mary Greenwood Anderson Professor of Engineeringin Mechanical Engineering and Materials Science Department. His research goals are oriented toward devel-oping multifunctional nanostructures and hybrid platforms that would have applications in diverse fields, suchas alternative energy storage, structural composites, sensors, electronic devices, and biomedical applications.Prof. Ajayan has authored or coauthored about 320 publications, two books, and his work has received morethan 25 000 citations and h-index of 72. He has won several awards such as the MRS medal and the Burtonmedal from the Microscopy Society of America. He was selected as one of 2006 Scientific American 50 by theScientific American Magazine and has also been selected as Nano50TM Innovator by Nanotech Briefs (2007).
310 Basic Aspects of Polymeric and Inorganic Membrane Preparation

1.15 Characterization of Filtration MembranesC Causserand and P Aimar, Universite de Toulouse, Toulouse, France, CNRS, Toulouse, France
ª 2010 Elsevier B.V. All rights reserved.
1.15.1 Introduction 311
1.15.2 Structural Characteristics 312
1.15.2.1 Microscopy Techniques 312
1.15.2.1.1 Electron microscopy 312
1.15.2.1.2 Near Field Microscopy 313
1.15.2.1.3 X-ray synchrotron micro-tomography 316
1.15.2.1.4 General remarks on microscopic methods 318
1.15.2.2 Displacement Techniques 318
1.15.2.2.1 Bubble point 318
1.15.2.2.2 Mercury intrusion 318
1.15.2.2.3 Liquid–liquid porometry 318
1.15.2.3 Water Permeability 319
1.15.2.4 Tracer Retention Techniques 319
1.15.2.4.1 Choice of tracers 320
1.15.2.4.2 Obtaining the selectivity curve and molecular weight cutoff 321
1.15.2.4.3 Conversion into pore-size distribution 323
1.15.2.4.4 Microbiological tracers 323
1.15.3 Characterization of Membrane Charge 324
1.15.3.1 Definitions 324
1.15.3.2 Relation between Streaming Potential and Zeta Potential 325
1.15.3.3 Examples of Results 325
1.15.4 Determination of Hydrophilic/Hydrophobic Nature of Membranes 326
1.15.4.1 Contact Angle Measurement by Drop Profile Analysis 326
1.15.4.1.1 Sessile drop method 326
1.15.4.1.2 Captive bubble method 327
1.15.4.2 Capillary Elevation Balance 327
1.15.5 Analysis of Chemical Composition 328
1.15.5.1 Fourier Transform Infrared – Attenuated Total Reflectance Spectroscopy 328
1.15.5.2 Secondary Ion Mass Spectrometry 331
1.15.5.3 XPS or ESCA 331
1.15.6 Mechanical Characterization 332
1.15.6.1 Failure Envelopes 334
References 334
I often say that when you can measure what you are
speaking about, and express it in numbers, you know
something about it; but when you cannot express it
in numbers, your knowledge is of a meagre and
unsatisfactory kind; it may be the beginning of
knowledge, but you have scarcely, in your thoughts,
advanced to the stage of Science, whatever the
matter may be.
Lord Kelvin
1.15.1 Introduction
The characterization of membrane properties helps
not only to choose the right membrane for a given
application but also to gain a better understanding of
their preparation methods and on the selectivity and
fouling mechanisms. The methods used give access
to macroscopic or microscopic quantities, character-
istic of the membrane structure and the chemistry of
311

the material. Some of these techniques are proper tomembrane or separation processes, others are drawnfrom polymer science or are much more general.
The structural and transfer characteristics(hydraulic permeability and selectivity curve) arethe most important for the choice of a membrane asthey provide information on how the membrane willperform in the intended separation process: thepermeate flow that can be expected and the size ofmolecules likely to be rejected by the membrane.
Also involved in the choice of a membrane are itssurface physicochemical and chemical properties(charge, hydrophilic–hydrophobic nature, and chemi-cal composition), which allow fouling and interactionsamong the different types of molecules at the mem-brane surface to be predicted to some extent. Theymay also play a role in the transport mechanisms.
In this chapter we focus on two categories ofcharacterization methods: those which characterizethe chemical and structural properties of the mem-brane, and those which characterize the functionalproperties, such as selectivity or permeability. Itshould be mentioned that some of these methodsmight be useful as well for membranes designed forpurposes other than filtration, as, for example, for gasseparation or for contactors.
1.15.2 Structural Characteristics
A variety of characterization methods have beendeveloped for obtaining information on the structureof membranes, in particular on the pore size. Theycan be divided into three types: microscopy techni-ques, liquid intrusion or displacement techniques,and techniques that measure tracer molecule reten-tion, although the latter provide information on thestructural properties of the membrane via assump-tions on the shapes of pores and mass transportphenomena through such porous media.
1.15.2.1 Microscopy Techniques
These techniques provide information on surfacetopology, roughness, and pore size. Several micro-scopic observation methods are used, which differ bytheir implementation and their resolution.
1.15.2.1.1 Electron microscopy
The first generation of microscopic techniques usedscanning electron microscopy (SEM) and transmis-sion electron microscopy (TEM), with resolutions of
the order of 10 and 5 nm, respectively (for a mem-brane sample and in ideal experimental conditionsfor the instrument).
Electron microscopy is based on interactionsbetween electrons and a sample of material. A verythin monochromatic beam of electrons is producedby focusing (using magnetic lenses) the electronsproduced by sources such as a tungsten filament in
a deep vacuum. The beam scans the surface of thespecimen causing interactions that lead to the emis-sion of waves. Two microscopic analyses are thenpossible, one by transmission and the other by reflec-tion also named ‘scanning electron microscope’(Figure 1).
Transmission electron microscopy. In the TEM, theincident electrons coming from the source are eithercompletely stopped or deviated and slowed down or
transmitted by the specimen. An objective diaphragmeliminates the deviated electrons. The image is pro-duced by a fluorescent screen and consists of darkzones corresponding to electrons that are stoppedand light zones where the electrons are transmitted.Specimen must be very thin layers to allow the beam
through. The resolution is a few tens of nanometers,and the magnification can be up to 600 000.
Scanning electron microscopy. In SEM, the incidentelectrons excite the surface layer of the sample, caus-ing the emission of secondary and backscatteredelectrons.
The secondary electrons are emitted by the atomsfrom the specimen surface. These electrons, whichproduce bright zones on the image, are more fre-quently emitted by the upper parts of the sample,making the hollows appear darker. An image of thespecimen surface is thus built up, in which the con-trast is determined by the morphology of the zone
analyzed.
SAMPLE
Incident electron beam
Transmitted and scatteredelectrons:
transmission electronmicroscope
(TEM)
Back-scattered electrons(conducting samples):
scanning electron microscope(SEM)
Figure 1 Principles of electronic microscopes.
312 Membrane Characterization

The backscattered electrons are primary electronsthat are reflected by the atoms in the sample. Theimage contrast is determined by the atomic numberof the elements making up the specimen. However,the quality of the images obtained using backscat-tered electrons is not as good as the quality obtainedwith secondary electrons. SEM microscopy is there-fore mainly carried out using secondary electrons. Ifthe sample does not emit enough secondary electronsand/or is not a conductor (the case for polymer), it isnecessary to consider sputtering a thin layer of metalsuch as gold. The magnification obtained is the ratioof the dimensions scanned on the specimen to thedimensions on the screen. It can reach 400 000 inrecent instruments and its resolution is a fewnanometers.
Constraints. Electrons are slowed down by the gasmolecules they encounter, which explains the needfor a high vacuum in the microscope column. Thisvacuum in the instrument makes it impossible toobserve hydrated objects at room temperature.Therefore, electron microscopy imposes specifictechniques of sample preparation, notably whenpolymer membranes are to be observed. Theseinclude:
1. dehydration of the specimens or immobilization oftheir water by freezing and preparation of ultra-fine sections of the frozen material;
2. metallization of the membrane surface (afterdehydration) in the case of SEM, such that thesecondary electrons can be emitted and thecharges can drain away. Gold, platinum, palla-dium, or their alloys are used for this purpose,
3. inclusion of resins in the case of TEM so thatultrafine sections, 50–100 nm thick, can be cut.
One of the limitations of any imaging techniquewhen analyzing the porous structure of materials isthat any single information provides a 2D informa-tion, whereas the porous structure is 3D in nature.Therefore, and except if series of micro-cuts areobtained using a micro-knife, the informationobtained from such images does not discriminatebetween through pores and superficial cavities,neither they inform on the shape of the channels [55].
Some attempts at using image analysis routineshelp at offering a more quantitative and statisticallymeaningful picture of the membrane pore-size distri-bution, as exemplified by Torras and Garcia Vals [45].
Applications of SEM. SEM is often used to study themorphology of membranes (Figure 2). It is proved tobe an effective method for:
1. characterizing flat membranes;2. assessing the effect of preparation conditions on
the structure of hollow fiber membranes [31];3. observing the evolution of membrane morphology
after contact with washing solutions; works haveconcerned the analysis of cellulose acetate (Qin andWong, 2002) and polyvinylpyrrolidone-modifiedpolysulfone (Qin et al., 2003) membranes aftertreatment with sodium hypochlorite; and
4. measuring the thickness of deposits (0.2–0.4 mm)formed during membrane fouling [39].
A few studies have been published in this field [17, 28]but many authors agree that, although scanning electronmicroscopy is a very powerful tool for analyzing thestructure of membranes, it is not suitable for measuringthe sizes of membrane pores, particularly in ultrafiltra-tion membranes. In this case, where the pores havediameters between 1 and 30 nm, the resolution of SEMproves to be insufficient. The fact that the specimen hasto be dried and metallized reduces the interest of thistechnique for observing membrane pores as a change inthe apparent characteristics of the pores may beexpected as a consequence of the sample preparation.
Environmental low-pressure SEM is a techniquethat can be envisaged. It has the advantage of requir-ing much less vacuum (c. 20 kPa) than conventionalSEM, and the electronic conductivity of the speci-men surface is not a requirement as in conventionalSEM. This is an interesting alternative for mem-branes as they can be characterized in a naturalworking environment. However, the resolutionobtained is not as good as in traditional SEM.
1.15.2.1.2 Near Field MicroscopyAnother generation of microscopic methods wasushered in by near field microscopes such as thescanning electron tunneling microscopy (STM,applicable only to conducting surfaces) and theatomic force microscopy (AFM, for observing alltypes of surfaces, even insulating ones). The latterhas the advantage of requiring no specimen prepara-tion and being usable in an aqueous medium. Also, itgives 3D information on the surface of the mem-brane. These microscopes have high potential forobserving ultrafiltration membranes where the porediameters are between 1 and 30 nm. Nevertheless,great caution is to be exercised when interpretingthe images as the topographical readings obtaineddepend not only on the shape of the objects observedbut also on the size and shape of the microscopeprobes used.
Characterization of Filtration Membranes 313

Scanning tunneling microscopy. The operatingprinciple of a tunneling microscope is based on mea-
suring a current of electrons crossing an insulating
zone by the tunneling effect. The key elements of the
device are the two electrodes between which the
tunnel current is measured. One electrode is com-
posed of a tip, assumed to be monoatomic, of a probe
that can move in the three spatial directions (piezo-
electric ceramic system). The surface to be analyzed
constitutes the other electrode. The tip and the sur-
face are a distance d apart (Figure 3).The tunnel current measured depends on both the
probe–surface distance and the electronic structure
of the specimen surface. This type of microscope thus
reveals the topography (Figure 4) and the electronic
structure of a material at the same time.One of the limitations of tunneling microscopy,
however, is the need to deposit a thin conducting
film on nonconducting samples. This enables the
surface topography to be observed but lowers the
resolution.Atomic force microscopy. The main feature of this
type of microscopy is a very thin, and therefore
very flexible, cantilever with a monoatomic tip at
the end. When the atoms of the tip are sufficiently
close to the surface to be analyzed, inter-atomic
forces (of between 10�6 and 10�9 N) come into
play and the cantilever is bent slightly according to
the topology as it scans the surface. The deflections
of the cantilever are monitored using a laser beam
shed on its upper face. The beam is reflected by a
mirror and falls on photodetectors that record the
light signal. Transcribing the movements of the can-
tilever thus traces the topography of the sample even
if it is an insulator.The images obtained by AFM depend mainly on
the specimen’s topography [23], whereas those
obtained by STM also reflect its conductivity
Figure 2 Example of an image of a polysulfone hollow fiber membrane (MWCO: 40 kDa) obtained by scanning electron
microscopy (SEM).
314 Membrane Characterization

B
(a)
(b)
A
B
0 50Horizontal distance (nm) 13.45
Horizontal distance (nm) 21.95
100
0 50 100
5
10
15
20
5
10
15
20
A
Figure 4 (a) Image of a 100 kDa polysulfone membrane obtained by scanning tunneling microscopy (STM); (b) Cross
sections corresponding to the lines drawn in the picture 5 (middle-bottom). From Bessieres, A., Meireles, M., Coratger, R.,
Beauvillain, J., Sanchez, V. J. Membr. Sci. 1996, 109, 271–284.
Electrode 2
Tip (atomic scale)
Solid surface(atomic scale)
Electrode 1
Tunnel electronsd
Surface
Tip
Y piezoX piezo
Z piezo
Figure 3 Schematic description of a scanning tunneling microscope (STM).
Characterization of Filtration Membranes 315

variations. It is impossible to observe thick, noncon-
ducting specimens by STM while this poses no
problem with AFM.AFM has been used to determine the sizes of
membrane pores (Figure 5). Some authors have
shown that, for microfiltration [7] and ultrafiltration
membranes, the measured dimensions of the pores
are in agreement with those provided by the manu-
facturer or calculated from hydraulic permeability.
By contrast, analyses performed on hollow, dialysis
fibers [26] or nanofiltration membranes [8] overesti-
mate the pore sizes for the former and underestimate
them for the latter.The uncertainty of the AFM measurements of
pore sizes may be due to:
1. the fact that the tip (5–10 nm in size) could notprobe the depth of the smallest pores and thus did
not detect the outline accurately;2. convolution between the tip and the pore walls;
and3. the fact that some pores can have their maximum
opening at the membrane surface.
Another application of the AFM is to capture the
surface roughness (Figure 6). For instance, the
roughness of new, clean membranes can be studied
together with the variations in the surface structure
after membrane fouling.
An example of data collected by imaging variousmembranes by STM and AFM was exploited toproduce the results presented in Table 1.
1.15.2.1.3 X-ray synchrotron micro-
tomography
The use of synchrotron X-ray radiation source pro-vides new possibilities to characterize membranemorphology. Since their discovery, X-rays havebeen used to image the bulk of materials that arenot transparent for visible light by taking advantageof their inhomogeneous absorption. From the many2D images (radiographs) recorded at various angularpositions of the objects and via appropriate algo-rithms (described, for instance, by Baruchel et al.[2]) and the derived software, 3D data volume, pro-jections, or perspective renditions of the objects canbe obtained at will. Micro-tomography with spatialresolution better than 20 mm has recently emergedwith bench scale X-ray tomographic instruments.X-ray micro-tomography allows then reconstruc-tions of the 3D internal structure of objectsnondestructively without any prior preparation(cutting, coating, or vacuum treatment).
Remigy et al. [36] report the new possibilitiesassociated with the availability of third-generationsources of synchrotron radiation to characterize the3D morphology of a polyvinylidene fluoride (PVDF)
(a) (b)
0
075
150
nm
0
200
1000 2000 3000
50
100
150
200
400 600 800
200
400
600
800
(c)
Figure 5 (a) Example of an image of a tracked etched polycarbonate membrane (Nuclepore) – nominal pore size : 0.2 mm;
(b) same sample – blow-up (1000�1000) nm2; and (c) cross section along the line drawn in picture (a).
316 Membrane Characterization

hollow fiber microfiltration membrane prepared by
phase inversion (Figure 7). The membrane actually
appears as a complex 3D bi-continuum of intercon-
nected pores. An interesting feature of this kind of
characterization method is that it provides a 3D
numerical mesh of the membranes which can be
further used for flow simulation, for example, using
a Boltzmann lattice method. The lower limit of the
resolution of such a technique is today at the micro-
meter range.
A
A
(b)
(a)
B
B
0 200Horizontal distance (nm) 60.47
400
0 200Horizontal distance (nm) 113.50
400
20
40
60
20
40
60
Figure 6 (a) Image by atomic force microscopy (AFM) of the surface of a sulfonated polysulfone membrane, and (b) cross
sections along the lines drawn in picture 5 (midlle-bottom row). From Bessieres, A., Meireles, M., Coratger, R., Beauvillain, J.,Sanchez, V. J. Membr. Sci. 1996, 109, 271–284.
Table 1 Membrane characteristics derived from STM and AFM images
100 kDa PSS 200 kDa PSS 0.1 mm PVDF
STM AFM STM AFM STM AFM
dp (nm) 16 31 28 38 82 96
Dp (nm) 31 69 94 114 170 185�pore (pores/m2) 1.23� 1014 7� 1013 1.4�1013 2� 1013 1.4�1013 7� 1013
" (%) 4.8 11.8 2.9 6.8 1.5 9.8
dp: smallest pore dimension (or clack width) (nm); Dp: largest pore dimension (or crack length) (nm).From Bessieres, A., Meireles, M., Coratger, R., Beauvillain, J., Sanchez, V. J. Membr. Sci. 1996, 109, 271–284.
Characterization of Filtration Membranes 317

1.15.2.1.4 General remarks on
microscopic methods
The resolution of microscopic techniques has beenmuch improved over the last decade. Equipmentmaintenance and sample have been simplified andthis allows quite an extensive use of these techniquesto visualize the internal and external structure ofmembranes. This is definitely of great help for asses-sing the membrane preparation procedures, forexample, for an evaluation of fouling conditions.Quantitative analysis of these images should be con-sidered carefully when the sample preparation canmodify the sample. One should also make sure thatthe information taken from very small samples, suchthose accessible by AFM, are statistically significant.
1.15.2.2 Displacement Techniques
These methods (bubble point, liquid/gas displace-ment, and liquid–liquid porometry) consist ofwetting the membrane with a wetting agent (phase 1)of known surface tension, �, and contact angle, �,
with the membrane, then expelling it from the mem-brane pores by displacing it with a second phase(phase 2), which is generally air or an immiscibleliquid. The pressure difference �P across the mem-brane is gradually increased from zero and the valuefrom which phase 2 forms drops extruded out of themembrane is measured. This value can then be linkedthrough physical laws to the maximum pore radius ofthe membrane, the mean pore radius, or a pore-sizedistribution based on the technique used.
1.15.2.2.1 Bubble pointIn the bubble point method, the pores of the mem-brane are completely wet with a liquid (phase 1)which is then displaced with air (phase 2). TheYoung–Laplace equation allows the maximum poreradius rp,max (m) to be calculated from the value ofthe transmembrane pressure �P (Pa) measured whenthe first bubbles are detected in the permeatecompartment:
�P ¼ 4�L cos�
2rp;maxð1Þ
where �L is the surface tension of liquid (N m�1) and� the contact angle between liquid and membranesurface (�).
1.15.2.2.2 Mercury intrusion
Mercury intrusion is a variant of the bubble pointmethod, in which phase 1 is air and phase 2 ismercury that is gradually forced into the membranepores. Mercury has a very small contact angle withmost materials and a surface tension of6.48 J m�2 cm�1 at 25 �C.
Both the methods discussed above have the draw-back: they require very high pressures (from 1 toseveral kilobars) to analyze pores of the order of10 nm like those found in ultrafiltration membranes.
1.15.2.2.3 Liquid–liquid porometry
This method consists of wetting the membrane with awetting liquid (phase 1) then expelling the liquidfrom the membrane pores by displacing it withanother liquid (phase 2) that is immiscible with theformer. The pressure that has to be applied dependsdirectly on the interfacial tension between the twoliquids. Thus, by a appropriate choice of the liquid1–liquid 2 pair (based on a water–isobutanol–methanolcombination), the pressures to be applied for the ana-lysis of small-radius pores need not exceed 10 bar or so.
Figure 7 Three-dimensional (3D) reconstruction volume
of a part of polyvinylidine fluoride (PVDF) hollow fibber
microfiltration membrane from SRmCT. Dimensions of theobserved volume (i.e., the box) are 595�456�268 voxels
or 420mm�320mM �190mm. From Remigy, J.C., Meireles,
M., Thibault, X. J. Membr. Sci. 2007, 305, 27–35.
318 Membrane Characterization

When samples having a distribution of pore sizesare to be analyzed, the pressure is step wisely incre-mented from the value of �P that is sufficient to wetthe pores having the largest radius. The flow corre-sponding to each transmembrane pressure is recordeduntil all pores are wetted (flux is then proportional tothe applied pressure difference). A pore radius distri-bution can then be deduced from these measurements(Figure 8).
1.15.2.3 Water Permeability
In the presence of a pure solvent, any increase intransmembrane pressure leads to a proportionalincrease in the permeate volume flux density whichallows the membrane to be considered as an idealporous medium. The coefficient of proportionality,Lp (assuming � constant), is called the hydraulicpermeability of the membrane and depends on itsintrinsic characteristics: porosity, pore-size distribu-tion, thickness, and hydrophilic nature. Thisparameter (Lp) thus represents the volume of solventthat passes through the membrane per unit of pres-sure, filtering area, and time.
From tests with pure water, the permeability ofthe membrane can be determined by means ofDarcy’s law, which links the flux with the transmem-brane pressure:
J ¼ Q
A¼ Lp
�:�P ¼ �P
�:Rmð2Þ
with J being the flux density (m s�1), Q the puresolvent filtration rate (m3 s�1), A the filtering
surface area (m2), Lp the hydraulic permeabilityof membrane (m), � the dynamic viscosity ofpure solvent (Pa s), �P the transmembrane pres-sure (Pa), and Rm the hydraulic resistance ofmembrane (m�1).
The determination of the membrane permeabilitycoefficient or of the membrane resistance requiresthat the flux density for pure solvent is measuredover a range of pressure differences which corre-spond to the specifications of the membranemanufacturer. The plot of this measured flux versusthe applied pressure must be a straight line, and itsextrapolation to a zero pressure must meet the fluxorigin. If these two conditions are not respected, anyvalue of the slope of this curve does not correspondto a Darcy permeability or to a membrane resistance.Deviations from linearity may arise from the com-pressibility of the membrane, or from the retention ofsome impurities remaining in the retentatecompartment.
From this law, one can deduce the hydraulic per-meability and the resistance of the membrane (theresistance of the membrane is defined as the recipro-cal of the hydraulic permeability).
Because the viscosity varies with temperature, ithas to be measured throughout the experiment. Inthe case of water, the viscosity can be calculatedusing the following equation:
�ðTÞ ¼ 1:73e�0:0268T ð3Þ
where T is the temperature (�C). This equation isvalid for 0 �C < T� 30 �C.
Monitoring the permeability allows membranefouling to be quantified in terms of additionalresistance (e.g., Reference 52). Conversely, the per-meability can be used to evaluate the efficiency ofchemical or mechanical cleaning [25, 33].
1.15.2.4 Tracer Retention Techniques
The information collected by microscopy or by dis-placement techniques does not give a directindication of the selectivity that can be expected fora membrane used in normal conditions (hydration,swelling of the polymer in an aqueous medium). Yetfor the user, one of the main aims of characterizing amembrane is to know its efficiency for a chosenseparation operation.
Tracer retention techniques measure the transferof macromolecules (ultrafiltration) or calibrated
0
0.5
1
1.5
2
2.5
0 10 20 30 40 50 60 70 80 90 100Pore diameter (nm)
Per
mea
bilit
y di
strib
utio
n (%
)
Figure 8 Example of a bi-modal pore-size distribution
obtained on an ultrafiltration membrane by bi-liquidporometry (liquid mixture: methanol, isobutanol, butanol 1
and water; interfacial tension between organic phase and
aqueous phase: 0.35 mN�1m).
Characterization of Filtration Membranes 319

particles called tracers, and these measurements arethen compared with a transport model. The principleis to measure the retention of a series of tracers ofdifferent sizes so as to obtain a curve of selectivityversus molar mass (or size) of the molecules. For this,an initial phase is necessary to define the choice oftracers and the operating conditions required toobtain the data. In a second phase, a model linkingthe selectivity to the sizes of the tracer and the porescan be used to convert the selectivity curve into apore-size distribution.
1.15.2.4.1 Choice of tracers
The tracers used must fulfill several criteria:
1. have few specific interactions with the membranematerial or the macromolecules that may beabsorbed on to the membrane to account for itsintrinsic characteristics;
2. have molar masses (or sizes) that cover the broad-est retention range possible, especially in theregion close to 100%; and
3. be detectable even at very low concentrations inthe collected permeate.
From the first criterion, the use of proteins (Table 2)or bio-colloids as tracers may make it difficult tointerpret the results since most of them have stronginteractions with membrane materials. This leads tofouling and thus modifies the medium under study.The information collected, although very dependenton the molecules used in this case, may neverthelessbe of interest to users in a particular applicationsector as the extrapolation of characterization datato the filtration of real fluids will be easier in thisdomain.
Certain manufacturers and users often use syn-thetic soluble polymers (Table 2) such as dextran,polyethylene glycol, or polyvinylpyrrolidone, which,
although not totally inert with respect to the mem-brane materials, still have far fewer interactions thanbio-colloids and perturb the measurements to a lesserextent. These molecules are often available in a vari-ety of molar mass (or size) ranges, which allowsselectivity curves to be plotted for a given family oftracers. This method, very suitable for ultrafiltrationmembranes, is difficult to extend to microfiltrationmembranes, for which there are few standardmolecules of sufficient size (poly(ethylene oxide),high-molecular-weight dextrans). For this type ofmembrane, the most widely used method remainsbubble point measurement, described above for theevaluation of maximum pore radius and the retentionof bacteria (Escherichia coli, Pseudominas diminuta),which will be dealt with later in this chapter. Thelatter method involves checking whether the pores ofthe membrane have a nominal radius smaller than thedimensions of the bacterium being filtered. Bubblepoint measurement and bacterial retention techni-ques can enable the integrity of modules, or even acomplete plant, to be tested.
On the other hand, tracer retention measurementis applicable to nanofiltration membranes, for whichthe tracer molecules can be small poly(ethylene gly-col)s, sugars (glucose, sucrose, dextrose), or inorganicsalts. However, in nanofiltration, steric effects are notthe only phenomena responsible for retention by themembrane and it is necessary to complete the char-acterization by measuring the retention of ions invarious physicochemical conditions so as to evaluatethe effects of charges. In particular, the comparison ofthe retention of mono-valent and divalent cationsand anions is an interesting information as nanofil-tration membranes are popular for their selectivitywith regard to multivalent ions.
For reverse osmosis, the most widely used traceris sodium chloride NaCl. Reverse osmosis
Table 2 Proteins and polymers frequently used as tracers for the characterization of membrane
sieving properties
Molar mass(kDa) Polydispersity
Stokes radius(nm)
Hydrodynamic radius(nm)
�-Lactalbumin 14 000 – 2.1 2.5
�-Lactoglobulin 35 000 – 2.7 4.0
Serum albumin 67 000 – 3.6 4.8PEG 10 000 – 2.6 4.6
35 000 – 4.5 9.2
100 000 – 7.1 16.4
Dextranes T10 9 300 1.94 2.3 3.3T40 37200 1.34 4.3 6.7
T70 66 300 1.97 5.6 8.5
320 Membrane Characterization
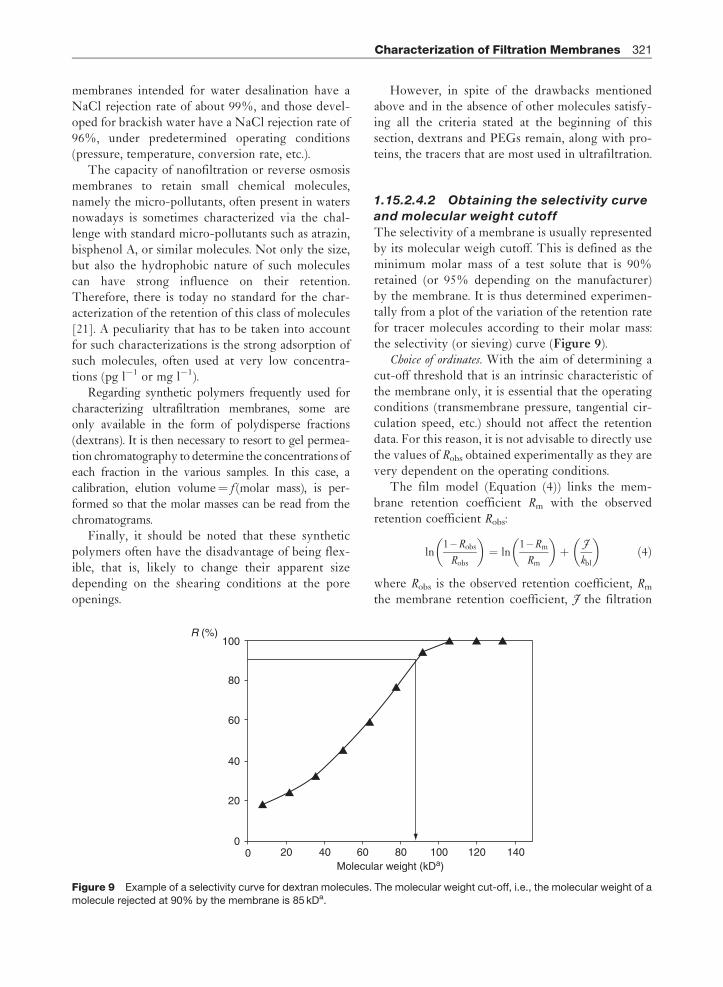
membranes intended for water desalination have aNaCl rejection rate of about 99%, and those devel-oped for brackish water have a NaCl rejection rate of96%, under predetermined operating conditions(pressure, temperature, conversion rate, etc.).
The capacity of nanofiltration or reverse osmosismembranes to retain small chemical molecules,namely the micro-pollutants, often present in watersnowadays is sometimes characterized via the chal-lenge with standard micro-pollutants such as atrazin,bisphenol A, or similar molecules. Not only the size,but also the hydrophobic nature of such moleculescan have strong influence on their retention.Therefore, there is today no standard for the char-acterization of the retention of this class of molecules[21]. A peculiarity that has to be taken into accountfor such characterizations is the strong adsorption ofsuch molecules, often used at very low concentra-tions (pg l�1 or mg l�1).
Regarding synthetic polymers frequently used forcharacterizing ultrafiltration membranes, some areonly available in the form of polydisperse fractions(dextrans). It is then necessary to resort to gel permea-tion chromatography to determine the concentrations ofeach fraction in the various samples. In this case, acalibration, elution volume¼ f (molar mass), is per-formed so that the molar masses can be read from thechromatograms.
Finally, it should be noted that these syntheticpolymers often have the disadvantage of being flex-ible, that is, likely to change their apparent sizedepending on the shearing conditions at the poreopenings.
However, in spite of the drawbacks mentionedabove and in the absence of other molecules satisfy-ing all the criteria stated at the beginning of thissection, dextrans and PEGs remain, along with pro-teins, the tracers that are most used in ultrafiltration.
1.15.2.4.2 Obtaining the selectivity curve
and molecular weight cutoff
The selectivity of a membrane is usually representedby its molecular weigh cutoff. This is defined as theminimum molar mass of a test solute that is 90%retained (or 95% depending on the manufacturer)by the membrane. It is thus determined experimen-tally from a plot of the variation of the retention ratefor tracer molecules according to their molar mass:the selectivity (or sieving) curve (Figure 9).
Choice of ordinates. With the aim of determining acut-off threshold that is an intrinsic characteristic ofthe membrane only, it is essential that the operatingconditions (transmembrane pressure, tangential cir-culation speed, etc.) should not affect the retentiondata. For this reason, it is not advisable to directly usethe values of Robs obtained experimentally as they arevery dependent on the operating conditions.
The film model (Equation (4)) links the mem-brane retention coefficient Rm with the observedretention coefficient Robs:
ln1 – Robs
Robs
� �¼ ln
1 –Rm
Rm
� �þ J
kbl
� �ð4Þ
where Robs is the observed retention coefficient, Rm
the membrane retention coefficient, J the filtration
00
20
40
60
80
100R (%)
20 40 60 80Molecular weight (kDa)
100 120 140
Figure 9 Example of a selectivity curve for dextran molecules. The molecular weight cut-off, i.e., the molecular weight of amolecule rejected at 90% by the membrane is 85 kDa.
Characterization of Filtration Membranes 321

flux density (m s�1), and kbl the transfer coefficient inthe boundary layer (m s�1).
This equation shows that it is possible, for eachmolecule, to graphically determine Rm, the membraneretention rate, and kbl, the mass transfer coefficient forthe solute in the boundary layer, from the experimen-tal data (Robs and J) in conditions where a straight lineis obtained for the plot (Figure 10) of
ln1 – Robs
Robs
� �¼ f ðJÞ ð5Þ
This method thus frees retention measurements fromthe effects of concentration polarization. It should benoted that the retention rate Rm thus obtainedremains dependent on the operating conditionsthrough the concentration at the membrane Cm.
A more advanced level of description of the trans-fer mechanisms enables the observed retention rateRobs to be expressed as a function of the transfer ofsolute not only in the boundary layer but also via theporous structure:
Robs ¼1
1þ 1 – Rinfð Þ exp Peblð ÞRinf 1 – exp – Peporeð Þð Þ
� � ð6Þ
with
Pebl ¼J
kclð7Þ
Pepore ¼J
kporeð8Þ
and
kbl ¼D
�ð9Þ
kpore ¼ D1"
L
Kd
Kcð10Þ
where Pebl is the Peclet number in the boundarylayer, Kpore the mass transfer coefficient in the pore
(m s�1), Pepore the Peclet number relating to the pore,D1 the diffusion coefficient at infinite dilution(m2 s�1), D the mean diffusion coefficient of thesolute in the boundary layer (m2 s�1) (often takenequal to the coefficient of diffusion at infinite dilutionD1), the membrane porosity, L the length of pores(m) (often taken to be equal to the thickness of themembrane skin), Kc the steric factor reducing transferby convection [12], and Kd the steric factor reducingtransfer by diffusion [12].
The use of Equation (6) gives access to morepertinent values of the transfer coefficients andretention rates through Rinf, a value independent ofthe operating conditions, to which the membraneretention rate Rm tends when the Peclet numberrelating to the pore Pepore increases [10]. Thisapproach however requires quite an intensive experi-mental work, and for a purpose of comparison
between membranes or for a same membranebetween various operating conditions, one may pre-fer to compare values of Robs, obtained in conditionsfor which J/kbl is constant (cf. Equation (4)).
Choice of abscissae. Some works have shown that,when different types of tracers are used, a selectivitycurve R = f (molar mass) is obtained per family ofstandard molecules. However, if the selectivity curveis not expressed as a function of the molar mass of thesolute but rather as a function of its radius, a single
curve R = f (radius) is obtained whatever the type oftracer used [30]. For this, it is advisable to use thehydrodynamic radius of the molecule, which gives agood description of the volume actually occupied bythe molecule crossing the pore by convection.
The hydrodynamic radius rhyd of a molecule ofknown molar mass can be calculated by means of thefollowing equation [30]:
rhyd ¼3:�:MM
4 �N
� �13
ð11Þ
where rhyd is the hydrodynamic radius of the molecule(m), � the intrinsic viscosity of the solution (m3 g�1),MM the molar mass (g mol�1), (�MM) the hydrody-namic volume (m3 mol�1), � the constant ofproportionality between the radius of the equivalentsphere and the radius of gyration of the molecule ofsolute, and N the Avogadro’s number (mol�1).
The following equations can be used to calculate� [30]:For dextrans
� ¼ 2:43� 10 – 7 �MM0:42 ð12Þ
ln(1–Robs/Robs)
ln(1–Rm/Rm)J
1/kCL
Figure 10 Plot of Equation (4). Rm and the mass transfer
coefficient can be calculated from the intercept at origin and
from the slope of the line.
322 Membrane Characterization

For PEG
� ¼ 4:9� 10 – 8 �MM0:672 ð13Þ
1.15.2.4.3 Conversion into pore-size
distributionUsing (R, rhyd) pairs with an appropriate transfer lawgives access to the pore-size distribution of the mem-brane under study. It is possible to consider either thatthe membrane is homoporous (all the pores have thesame size and shape) or that there is a pore-size andshape distribution. The most frequently chosen hypoth-esis is a log normal distribution with a dissymmetrytoward larger-sized pores. The experimental data canthen also be used to evaluate the mean pore radius andthe width of the pore-size distribution at mid-height[29]. In the absence of any assumption on the shape ofthe pore-size distribution requires more sophisticatedapproaches. Baltus [1] applies the moment theory toderive a pore-size distribution out of the sieving curves.Zhao et al. [56] describe a method for the determinationof the pore-size distribution out of sieving curves. Intheir method, the friction of tracer molecules throughthe pores is experimentally measured via chromatogra-phy experiments, according to an approach initiallydeveloped by Matsuura and Sourirajan.
1.15.2.4.4 Microbiological tracersMicrobiological tracers have been used to character-ize filters from the early times of membranetechnology. The obvious reason for this is that,
from the beginning, membranes have been consid-
ered as potential screens against microbiological
contamination of waters or air.Bacteria. The ground of this work has been estab-
lished in the 1960s for the discrimination between
filters rated 0.2 and 0.45 mm, by using Brenvenuta
diminuta. Since then, this bacteria has been used as a
tracer to qualify filters, microfiltration, and ultrafil-
tration membranes. In Table 3 the characteristics of
some of the bacteria which can be used for membrane
characterization are provided.Lebleu et al. [22] show, using tracked etched mem-
branes, that for a given pore size and given operating
conditions, the retention of microorganisms depends
on their Gram character, and in particular that
Gram-negative bacteria have a flexible envelope
which can deform and help the transfer of such
bacteria, when filtered through pores that are smaller
than their smallest dimension.In general, filtration reduces the content in micro-
organisms, but does not guarantee their complete
elimination. The reduction in microorganisms is often
measured by the log removal value (LRV), defined as
LRV ¼ logCb
Cp
� �ð14Þ
with
LRV ¼ log1
1 – Robs
� �ð15Þ
Table 3
Name Shape SizeAdhesion to hexadecane(%)a
Potential(mV)
Gramþ/�
E. coli Rod 2� 1mm 13 �16.2 �C. xerosis Rod 2� 1mm 100 �16.5 þP. aeruginosa Rod 1.5�1 mm 58 �17.4 �M. luteus Sphere 1 mm 8 �32.9 þS. aureus Sphere 0.8 mm 75 �21.5 þB. diminuta Rod 0.4�0.8 mm 81 �3.8 �
a Bellon-Fontaine, M.-N., Rault, J., Van Oss, C. J. Colloids Surf. B 1996, 7(1–2), 47–53.
–25
–20
–15
–10
–5
0
5
0 0.1 0.2 0.3 0.4 0.5 0.6
ΔP (bar)
slope ⇒ ζ
ΔE (mV)
Figure 11 Example of a plot of Equation (16). The zeta potential is derived from the slope.
Characterization of Filtration Membranes 323

The retentate and permeate concentration are in gen-eral measured by counting the colony forming units(cfu) grown on agarose gels. The maximum LRV thatcan be claimed depends on the concentration of bacteriain the challenging suspension. For example, if the con-centration is 106 cfu ml�1 in the retentate and zero in thepermeate, one counts 1 cfu ml�1 in the latter and theLRV is then 6. On the other hand, increasing the con-centration in bacteria in the retentate increases the riskof membrane fouling: membrane fouling has in general apositive effect on retention, but from the point of view ofmembrane characterization, this masks the plain mem-brane capacity, and therefore should be avoided. Atradeoff has then to be found for the bulk concentration,which has to be high enough to allow enough sensitivity,and not too high to avoid membrane fouling and particleaggregation during the test: in general, concentrationsbetween 106 and 108 cfu ml�1 have been found to be agood compromise.
For instance, the US Environment ProtectionAgency recommends that membranes used for theproduction of drinking water show a minimum LRVof 4 for Cryptosporidium.
Viruses. The characterization of membrane reten-tion with respect to viruses, although in the bio-contaminants area, differs from the one of bacteria.As a matter of facts, most viruses are two orders ofmagnitude smaller than bacteria: this difference has itsimportance regarding their diffusivity, and the role ofsurface interactions in their behavior. In particular,viruses have a strong tendency to adsorb onto surfaceswhether on the equipment walls (tanks, pipes, glass-ware, etc.) or on particles which may be present in thetests or process solutions. For this reason, the apparentretention of viruses by membranes may be muchhigher than the actual filter capacity and this has tobe considered with great care, in the perspective of thetrue membrane characterization.
The main objective of membrane characterizationwith respect to the retention of viruses is to run theexperimentation in the worst-case conditions, condi-tions that the viruses have the highest chances to passthrough the membranes: this will guarantee thatwhen in operation, the membrane will show eitherthe same or a better retention of the viruses. Recentworks help define the conditions for which virusessuch a MS2 and Q-b are stable in a suspension, whichtype of materials should be used for the test rigs so asto avoid adsorption [24].
Given the small size of the viruses, not only themembrane but also the systems should be tested forintegrity, since micro-leaks through potting, gaskets,
and fittings may allow the contamination of the perme-ate, even though the membrane itself offers an efficientbarrier.
Surrogates. The characterization of membranemodules may require large volumes of suspension,as well as of rinsing solutions afterward, so as toeliminate any trace of the microorganisms used forthe test. For this reason, researchers have thought ofdeveloping surrogates of the microorganisms, whichwould mimic their behavior and allow simpler andfaster membrane characterization. Latex or silica par-ticles, and gold sols have therefore been used. Thusfar, two major drawbacks have been pointed out:
• the much lower sensitivity of the particle detec-tion methods, which limitates the range of LRVthat can be explored and
• the difference in surface properties (charge, stiffness,hydrophilic character, etc..) between such surrogatesand bioparticles, which induces a difference inretention, as, for example, by charge exclusion, byadsorption on or in the membrane material.
Recently Guo et al. [16] have proposed to use ferro-magnetic nanoparticles, to be used as surrogates.They report quite a high sensitivity to the breakageof fibers in a hollow fiber ultrafiltration module.Although the behavior of such surrogates has notbeen compared to that of a virus, they offer veryinteresting perspectives in terms of integrity testingof membranes and modules.
1.15.3 Characterizationof Membrane Charge
Most porous membrane carries charges; electrostaticinteractions also play a part in the transfer and selec-tivity both in ultrafiltration (e.g., Reference 13) and ofcourse in nanofiltration [40]. More and moreresearchers and industrialists therefore feel the needto characterize properties other than the pore-sizedistribution, such as the zeta potential, which is thesubject of this section.
1.15.3.1 Definitions
The presence of charged groups on the membranesurface partly conditions the level of fouling reachedduring a filtration operation. From another point ofview, if we wish to analyze the transfer of a solutethrough a porous membrane, the charges of the mate-rial that need to be taken into consideration are those
324 Membrane Characterization

present along the walls of the pores through whichthe molecules move.
The measuring methods must thus be adaptedaccording to whether the charges to be accountedfor on the surface or inside the pores. In the lattercase, it is also necessary to take the membrane spe-cificities into account, in particular for ultrafiltrationmembranes in which the pore radius (�10 nm) andthe mean flux are small.
The techniques used are electrokinetic and con-sist of measuring:
1. electro-osmotic fluxes for microfiltration mem-branes: flux of solvent through the membranepores as a result of the application of an electricalpotential difference; and
2. streaming potentials for ultrafiltration or microfil-tration membranes: because of the formation of adouble electric layer, when an electrolyte solutionis set in motion with respect to the membrane orpore surface, a flux of ions is created, giving rise tothe streaming potential [43, 44].
Each of the methods mentioned above can lead to thedetermination of the same quantity, known as thezeta potential (�). This purely experimental potentialcan be theoretically defined as the potential on thehydrodynamic shearing surface at which the fluidphase moves relative to the layer of ions immobilizedin the vicinity of the charged surface.
1.15.3.2 Relation between StreamingPotential and Zeta Potential
When the chosen technique is the measurement ofthe streaming potential, plotting the curve�E = f (�P) leads to a straight line (Figure 12), the
slope of which allows the zeta potential to be calcu-lated using the Helmholtz–Smoluchowski equation:
�E
�P¼ "0 "r �
� ð16Þ
where �P the transmembrane pressure if the mea-surement is made inside the pores, charge loss in thestreaming channel if the measurement is made at themembrane surface (Pa), �E the streaming potential(V), "0 the vacuum permittivity (C2 J�1 m�1), "r thedielectric constant relative to solvent (�), " the zetapotential (V), � the dynamic viscosity of electrolytesolution (Pa s), and the conductivity of electrolytesolution (S m�1).
It is theoretically possible to connect the values ofthe zeta potential with the charge density on thesurface under study. For this calculation, it is neces-sary to know the exact number of ions present in theelectrolyte solution. However, the determination ofthis value becomes approximate when there is achange of pH, making the charge density calculationimprecise.
1.15.3.3 Examples of Results
Zeta potential measurements indicate the variation ofcharge on the membrane surface due to the presenceof a fouling agent.
Figure 12 reports the results obtained with a cellmeasuring the streaming potential across the pores ofa 100 kDa sulfonated polysulfone membrane. Theobjective here is to compare the zeta potential valuesobtained before and after the membrane is put incontact with a bovine serum albumin (BSA) solutionhaving an isoelectric point of about 4.8.
The results lead to the conclusion that the mem-brane pores that allow protein access have their wallsat least partially covered by adsorption of these pro-teins. Some of the amphoteric properties of serumalbumin are thus transferred to the membrane [9].
The difference in the isoelectric point pI beforeand after fouling has also been observed for inorganiczircon microfiltration membranes fouled by silica(pI of new membrane¼ 8, pI of fouled membrane¼ 5.2) [18].
In the second example presented in Table 4, astudy was made on the effects of various cleaningsolutions, acid, base, or detergent, on the electricalproperties of the surface of a sulfonated polysulfonemembrane. In membrane processes, industrial formu-lations are used for cleaning (Ultrasil�). They arecomposed of soda, surfactants, phosphates, and
–30
–25
–20
–15
–10
–5
0
5
10
2 3 4 5 6 7 8 pH
(mV)ζ
Virgin membrane
Membrane after adsorption
BSA in solution
Figure 12 pH influence on the zeta potential measured at
the surface of an ultrafiltration membrane before and after
adsorption of bovine serum albumin (BSA).
Characterization of Filtration Membranes 325

carbonates, and successfully clean membranes fouledby proteins. Acids are used to solubilize the foulinglayers containing mineral salts. HNO3 also has anoxidizing action on proteins. The soda saponifiesgrease and hydrolyzes the proteins.
The solutions indicated in Table 4 were filteredone after the other through a new membrane in twocycles. The results show that, to preserve and/orrestore the electrical properties of the membranesurface, the washing cycle needs to be chosenjudiciously.
1.15.4 Determination of Hydrophilic/Hydrophobic Nature of Membranes
The hydrophilic nature of a material is a very impor-tant parameter as it conditions the solute–membraneand solvent–membrane interactions. In many appli-cations, hydrophilic membranes are more efficientthan hydrophobic ones, the latter being confrontedwith more serious fouling whenever hydrophobicmolecules or particles (proteins, colloids, etc.) arepresent in the fluid to be filtered [11]. The same istrue for surfactants, the adsorption of which is morepronounced on hydrophobic materials [19].
Also, the energy of interaction between hydro-phobic molecules and a hydrophilic surface is lowerthan for a hydrophobic–hydrophobic system, so it iseasier to regenerate the surface by washing in theformer case [34].
The hydrophilic/hydrophobic nature of a mem-brane is determined by measuring the contact angleor by using the capillary elevation balance. Theliquid normally used for this purpose is water.
1.15.4.1 Contact Angle Measurement byDrop Profile Analysis
1.15.4.1.1 Sessile drop method
This method consists of placing a drop of liquid(generally water) on the surface of the membrane.The wettability of the surface is then characterized
by the contact angle � between the solid surface and
the tangent to the liquid surface at the contact point.
By convention, this angle is measured inside the
liquid (Figure 13) [53].The volume of the drop placed on the surface
must be such that wetting effects predominate over
gravitational effects. In other words, the radius re
corresponding to the volume of the sessile drop
must be such that
re0
ffiffiffiffiffiffiffiffiffi�L
�L?g
rð17Þ
where re is the radius of the liquid drop (m), �L thesurface tension of the liquid (N m�1), �L the densityof the liquid (kg m�3), and g the acceleration due togravity (m s�2).
For example, a 2-�l drop of water has a radius of0.8 mm (assuming the drop to be spherical), which
should be compared with
ffiffiffiffiffiffiffiffiffi�L
�L?g
rffi 2:7mm ð18Þ
These conditions thus satisfy the above-mentionedcriterion.
The contact angle is directly obtained from a videoimage of the drop sitting on the solid. Measuring the
geometrical parameters of the drop – h (height of the
drop at the apex) and re (radius of the drop) – enables
the cosine of the angle � to be found from the
following relationship:
cos � ¼1 – h
re
� �2
1þ hre
� �2 ð19Þ
Liquid (water) drop
θ
re
hMembrane
Figure 13 Diagram of the sessile drop method to
measure the contact angle.
Table 4 Example of the changes in zeta potential along with two different cleaning protocols: Sulfonated
polysulfone membrane
1st cycle 2nd cycle
Cleaning procedure Packing then ultrasil cleaning NaOH HNO3 Ultrasil HNO3 NaOH Ultrasil
� (en mV) �14 �15 �3 �14 �3 �8 �12
326 Membrane Characterization

where h is the height of the drop at the apex (m) and �the contact angle formed by the membrane surfaceand the tangent to the liquid surface at the contactpoint (�).
The solid is considered to be perfectly wettable bythe liquid (hydrophilic if the liquid is water) if �¼ 0,
more or less wettable if �</2, and more or less not
wettable (hydrophobic if the liquid is water) if �>/2.This method requires the sample to be dried
beforehand as the presence of water in the structure
modifies the value of the contact angle. This precon-
ditioning can have the disadvantage of inducing
changes in the surface properties of the membrane
which may affect the angle measured.A distinction is also made between the advancing
contact angle, which corresponds to the angle formed
between a dry material and water, and the receding
contact angle, which corresponds to the angle
obtained after wetting with water. The difference
between the advancing and receding angle is a hys-
teresis, which is enhanced on rough surfaces. In
general, model equations, such as Equation (16), con-
sider the advancing angle.
1.15.4.1.2 Captive bubble method
When membrane properties do not allow the contact
angle to be measured by placing a drop on the surface
(surface too porous or too hydrophilic) or if it is
undesirable to dry the sample, the captive bubble
method may be used (Zhang et al., 1990).As shown in Figure 14, the membrane is
immersed in water with the surface to be analyzed
facing downward. A micro-syringe is then used to
trap an air bubble on the lower surface of the mem-
brane. As before, the contact angle is calculated by
determining the geometrical parameters of the air
bubble.
The captive bubble method does not require thesample to be preconditioned (no membrane drying).Nevertheless, the method remains sensitive to theroughness, porosity, and heterogeneity of the surface.
According to the literature, it is possible to find aclassification [53] established using this method(captive air bubble in an aqueous medium) givingadvancing contact angles in decreasing order (1stvalue, followed by the receding contact angle):polyolefin (83�–54�) > polysulphone (73��42�) > cel-lulose acetate (60��47�) > sulfonated polysulfone(54��16�) > polyacrylonitrile (53��34�).
1.15.4.2 Capillary Elevation Balance
The two methods presented above are suitable foranalyzing plane surfaces at sample scale. For mem-branes with nonplanar geometry, such as hollowfibers, another method can be envisaged. It consistsof measuring the weight gained by a material placedin contact with a liquid as a function of time. Thespeed at which a given liquid spontaneously pene-trates a porous solid by capillarity depends directlyon the porous structure of the material and the affi-nity of the liquid for the material. In Washburn’sdifferential equation, the weight gain (m) is given asa function of time (t) by
dm
dt¼ 1
m?�L:R:�
2L?cos �
4:�
� �ð20Þ
where �L is the surface tension of the liquid (N m�1),�L the density of the liquid (kg m�3),� the viscosityof the liquid (Pa s), � the advancing contact anglebetween the liquid and the solid (�), and R the geo-metrical parameter characteristic of the porousstructure of the material.
By integration, we obtain
m2 ¼ �L:R:�2L:cos �
2:�:t ð21Þ
This method is theoretically applicable only if�< 90�, that is, if the liquid wets the solid.
The plot of
2:m2:�
t :�2L
¼ f ð�LÞ ð22Þ
allows cos � to be found and hence the contact anglethe liquid makes with the surface of the membrane.This method has been used by some authors [46] todetermine the surface tension of membranes madeof poly(tetrafluoroethylene), poly(ethylene), and
Analyzedsurface
Air injection Liquid(water)
CellMembrane
Airbubble
θ
Figure 14 Diagram showing the captive bubble method
to measure the contact angle between a liquid (water) and a
membrane.
Characterization of Filtration Membranes 327

poly(propylene) using several organic liquids(hexane, toluene, cyclohexane, to mention but afew). The results obtained are in agreement withthe values obtained from other methods.
It should be stressed here that the values obtainedfor contact angles depend on the measuring techni-que used. Moreover, they also depend on manyfactors connected with how the sample is preparedand the characteristics of the zone analyzed (localroughness, porosity, heterogeneity in the surfacechemical composition, etc.). It has been shown thatthe more porous a membrane is, the more hydrophi-lic it appears to be. It also seems necessary tocorrelate the membrane surface charge with thevalues measured for the contact angles. Bearing thisin mind, it is preferable to use these methods toestablish a comparative classification of membranes,all other things being equal.
As for the zeta potential, a change in contact anglecan have many origins. Hence, it is an interestingparameter for monitoring well-controlled modifica-tions, achieved in lab conditions. On the other hand,finding the cause of a change in contact angle, for amembrane used in field conditions, is often a needlein a haystack type of problem.
1.15.5 Analysis of ChemicalComposition
Various techniques are available for determining thechemical functions present at the surfaces of mem-branes: infrared attenuated total reflectance (IR-ATR) spectroscopy, secondary ion mass spectrome-try (SIMS), and X-ray photoelectron spectroscopy(XPS), also known as electron spectroscopy for che-mical analysis (ESCA). Some of these techniques canalso serve for in-depth chemical analysis.
1.15.5.1 Fourier Transform Infrared –Attenuated Total Reflectance Spectroscopy
Fourier transform infrared spectroscopy (FTIR) is apowerful analysis tool for characterizing and identi-fying organic molecules. It is the spectroscopictechnique that is the most widely used for determin-ing the characteristics of new membranes. Inattenuated total reflectance mode, this type of spec-troscopy enables functional groups present over adepth of about 1 mm to be identified.
During ATR analysis, the sample is kept in con-tact with a crystal allowing total internal reflection.
An infrared ray arrives at the crystal where the mate-rial under study has been placed. The internalreflection of the ray in the crystal gives rise to anevanescent wave which, at each reflection, continuesbeyond the surface of the crystal and penetrates thesample over about 1mm. The penetration depthdepends on the wavelength, the angle of incidence ofthe beam on the crystal, and the nature of the crystal.
Spectra are thus obtained (curves of absorbancevs. wavelength) that have absorption peaks charac-teristic of the functions present at the membranesurface.
FTIR-ATR is a sensitive, nondestructive methodthat can be used qualitatively and quantitatively.However, it requires prior drying of the membranesample.
One of the applications of FTIR-ATR is the char-acterization of modified surfaces. In this case, thespectra show bands characteristic of the basic mem-brane with, in most cases, bands characteristic of thenew functional groups related to the modification.FTIR-ATR also enables the efficiency of membranecleaning to be assessed [57].
This method can also be used to analyze theadsorption of macromolecules at the membrane surface[27] and to check whether the conformation of theadsorbed compounds (e.g., proteins) has been modifiedby comparing the spectra of the adsorbed product withthose of the same product in solution [4]. When thedeposits are very small, however, it is difficult todetermine the presence of fouling agents; this necessi-tates the use of elaborate data-processing methods thateliminate the contributions of the membrane and waterfrom the raw spectra [3, 35]. Figures 15–17 show a fewexamples of spectra obtained for new or fouled poly-ethersulfone membranes.
A first analysis performed on the PES membraneis shown in Figure 15. The contribution of water tothe raw spectrum of a PES membrane has beeneliminated and it is possible to identify the mainadsorption bands of polyethersulfone (Table 5), forwhich the structural formula is
O S
O
O
The same PES membrane was analyzed by FTIR-ATR after fouling by skimmed milk.
328 Membrane Characterization

The raw spectrum obtained for the fouled mem-brane (Figure 16) was processed by double difference,
which consists of firstly removing the water contribution
(difference 1), and secondly removing the contribution
of the PES membrane (difference 2). The new spectrum
thus obtained (Figure 17(a)) was comparable to the
difference 1 spectrum of the fouling agent in solution,
skimmed milk in this case (Figure 17(b)).
4000
0
0.1
0.2
0.3
A
0.4
0.5
0.6
0.7
3000 2000 1500
1663
1576
1484
13201071
871
835
717
700
1010621410
1296
1240
11471105
cm–11000 600
Figure 15 Infra-red spectrum of a polyethersulfone membrane (after removal of the residual water signal). From Begoin, L.
Analyse de modules spirales industriels d’ultrafiltration de fluides laitiers. Physico-chimie du nettoyage de membranes en
polyethersulfone d’ultrafiltration de lait ecreme. PhD Thesis, University of Rennes I, 2004.
4000
0
–0.5
1
2
3A
Virgin membrane
Membrane fouled with skimmed milk
4
5
6
6.6
3000 2000 1500
cm–1
1240 cm–1
1000 700
Figure 16 Infra Red spectra of a clean and a fouled with skimmed milk ultrafiltration membrane (polyethersulfone). From
Begoin, L. Analyse de modules spirales industriels d’ultrafiltration de fluides laitiers. Physico-chimie du nettoyage de
membranes en polyethersulfone d’ultrafiltration de lait ecreme. PhD Thesis, University of Rennes I, 2004.
Characterization of Filtration Membranes 329

4000–0.10
0.2
0.4
0.6
0.8
1.0
A
1.2
1.4
1.6
1.75(a)
(b)
3000
2879
1639
1559
1374
10651040
2000 1500
cm–1
1000 700
4000–0.040
–0.02
0.00
0.02
0.04
0.062915 2847
1734
16381545
1150
994
1116
1074 1040
0.08
A
0.10
0.12
0.150
3000 2000 1500
cm–1
1000 700
Figure 17 Comparison of the IR spectra of a membrane fouled with skimmed milk (a), and of skimmed milk (b). From
Rabiller-Baudry, M., Le Maux, M., Chaufer, B., Begoin, L. Desalination 2002, 146, 123–128.
Table 5 Some IR adsorption bands and their connection to chemical
functions
Wave number(cm�1) Intensity Vibration Chemical group
1576 Strong C¼C Benzene ring1484 Strong Aromatic ring
1320 Moyenne O¼S¼O Sulfonic group
1296 Moyenne Antisymetric stretching1240 Strong C–O–C stretching Ether group
1147 Strong Symetric stretching Sulfonic group
1105 Strong Aromatic ring vibration
330 Membrane Characterization

1.15.5.2 Secondary Ion Mass Spectrometry
SIMS enables the identification of elements, andpossibly other chemical species, present in a material,not only on the surface but also in the thickness of thesample.
Primary ions (Arþ, O2þ, Csþ, Gaþ) with incident
kinetic energies of a few keV (0.1�50 keV) penetratethe target solid, where a series of collisions occur.Some of the particles emitted by the target areionized. SIMS analyzes the secondary ions by massspectrometry. The emission of secondary ions by thesurface of a solid excited by an ion beam providesinformation on the molecular and isotopic composi-tion of the solid, and concentration profiles across thesample can be established [41].
It should, however, be noted that this technique isdestructive. Moreover, obtaining the true concentra-tions in a material from the secondary ion emissionsignals is generally one of the weak points of themethod because of the complexity of the processesinvolved, in particular, the variations in the ioniza-tion yield of the species depending on the chemicalnature of the phases where they occur.
This method is widely used because of its greatsensitivity for all elements, from hydrogen to uranium.It can detect an impurity in a sample (detection limitbelow 0.1 ppb), and allows the adsorption, adhesion,corrosion, contamination, and biocompatibility of mate-rials to be studied. SIMS is thus used for studying thegrafting of polymers on to the surfaces of various mem-branes or for comparing different samples having thesame reference state (e.g., in studies of membrane aging).
An example of analysis is presented in Figure 18for the case of a polyvinylpyrrolidone (PVP)-modifiedpolysulfone membrane. To overcome the problems of
quantification, a comparative study was made of thevarious samples by following the analyzed elementcontent relative to a reference element. In the casepresented here, the reference chosen was sulfur as it isthe main element present in the main polymer, poly-sulfone. Figure 18 shows the variation of the nitrogencontent (element specific to PVP) over an analyzeddepth of 60mm, on both the selective skin side of thenative membrane and the support side. While PVPwas not detected on the support side, the resultsrevealed the presence of PVP on the skin side, at aconcentration becoming weaker with deeper penetra-tion into the structure. These results are in agreementwith the protocol used in the manufacture of themembrane, which leads to a greater modification byPVP on the surface of the skin.
1.15.5.3 XPS or ESCA
This technique allows the chemical composition tobe determined on the surface and down to a depth of�1 nm for various materials.
The sample is irradiated with X-rays in order toexcite its atoms which emit electrons from differentatomic levels. The electrons emitted generally havelow energies and are strongly absorbed. Those thatarrive at the surface with sufficient energy thus comefrom a layer having a depth of the order of the meanfree path [37].
The electrons are collected, analyzed, and classi-fied according to their identity. The importantinformation they contain is the bond energy, theenergy they had before they left the atom. The spec-trum of the binding energy of the photoelectrons isspecific to an atom, which can be identified and itsamount in a given compound determined. The ana-lyzer counts the electrons according to their bondenergy, and spectra like the one shown in Figure 19are built up.
ESCA, often considered as the easiest techniqueto carry out and interpret, can be adapted for a widevariety of surfaces and (unlike SIMS) provides aquantitative analysis of the chemical information.
The atomic composition of the surface of a graftedmembrane [20] and a membrane treated by plasma[42] can be determined by ESCA.
This method is complementary to SIMS andFTIR-ATR. Some authors have performed studieswith the three techniques in parallel in order toconfirm their conclusions [14]. In addition, theseauthors note that ESCA, with its short analysistimes, damages the samples to a small extent.
0
2.5 × 10⁻²
2.0 × 10⁻²
1.5 × 10⁻²
1.0 × 10⁻²
0.5 × 10⁻²
0 20 40 60
SkinSupport
N/S
Depth (μm)
Figure 18 Example of a nitrogen concentration profile
(normalized by the sulfur concentration) through the skinand through the support obtained by secondary ion mass
spectrometry (SIMS), in a PVP/PS membrane. PVP,
polyvinylpyrrolidone.
Characterization of Filtration Membranes 331

1.15.6 Mechanical Characterization
Local movements of polymers underlie the elemen-
tary processes of many physical (glass transition andsecondary transitions, diffusion and flow) and
mechanical (viscoelasticity, plastic deformation,
etc.) phenomena. These movements are very
closely connected with the chemical structure of
the polymers, and their storage or utilization
conditions.
8000
6000
(a)
(b)
(c)
4000
2000
2800Sulfur
General1
Nitrogen
2600
6800
6400
6000
5600
5200
4800
2400
2200
1800
2000
1600
1400
170 172 174 176 178 180 182 184
00 100 200 300 400 500
Binding energy (eV)
Binding energy (eV)
400 402 404 406 408 410 412 414Binding energy (eV)
Cou
nts
Cou
nts
Cou
nts
600 700 800 900 1000
Zoom (c)
Zoom (b)
Figure 19 ESCA spectra of a PS/PVP membrane: (a) general spectrum, (b) zoom on the sulfur band, and (c) zoom on the
nitrogen band (PVP specific). PVP, polyvinylpyrrolidone.
332 Membrane Characterization

A study of the mechanical properties can thus beused to characterize the structure of a polymer mem-
brane and, in particular, to follow its evolution with
time as discussed in more detail below. Polymers can
be classified in three families according to the strain
they show (e.g., elongation) when stressed (e.g., ten-
sile stress): elastomers, flexible plastics, and rigid
plastics.An example of a tensile test (stress-strain curve) is
given in Figure 20.Curves of stress versus deformation are obtained
in tension (or compression) tests, in which the sample
is drawn out at constant speed until it breaks
(Figure 21). Knowing the pulling speed, the initial
distance between the grips, and the geometrical char-
acteristics of the sample, we have access to various
mechanical characteristics:
• the force, extension, and stress at break (Fb, Ar
and sr);
• the force, elongation, and elastic stress (Fe, Ae, andse); and
• the Young’s modulus (E in Pa).
Figure 21 shows how these various parameters aredetermined graphically.
A tensile force F applied at the end of a cylinder ofcross-sectional area S induces a stress s in the cylin-
der, which leads to the following relationship:
� ¼ F
Sð23Þ
with F being the force (N), S the cross-sectional area(m2), and s the stress (N m�2).
The modulus of elasticity, or Young’s modulus, E,is the elastic constant which, for a uniform, isotropic
material, links the stress with the strain and thus
characterizes the stiffness of the material or the resis-
tance to elastic strain [15]. For a given stress, a
material having a high modulus of elasticity will be
deformed less than a material with a low modulus of
elasticity, as depicted by Equation (24):
� ¼ �A
AE ð24Þ
where�A
Ais the deformation (–).
The rheological properties of polymers depend onthe temperature and also on the deformation speed.
The faster the deformation takes place, the greater
the mechanical resistance of the polymer will be,
Elongation (m)
Stress (N m–2)1
FailureFailure
2
3
Figure 20 Mechanical characteristic curves obtained with polymers: case�1 : rigid plastic polymer: it can undergo small
compressions for high stresses; case�2 : flexible plastic polymer: small strains for high stresses up to a plateau, after which
rupture occurs; and case�3 : elastomer: large strains for small stresses.
Ar
Fr
Fe
Ae Elongation (%)
Force (N)
Figure 21 Elongation curve for a flexible plastic polymer
(see Figure 22).
Characterization of Filtration Membranes 333

even at high temperatures. Moreover, for the samechemical type, the molecular mass of the polymerunder consideration has a marked influence on therheological properties. High molecular masses favorthe elongation of the product.
The possible variation of the mechanical proper-ties of polymers during aging provides us withinformation on the damage of membranes. The beha-vior at low strains (modulus of elasticity and flowthreshold) should be little affected by aging, whichessentially acts on the rupture properties.
1.15.6.1 Failure Envelopes
Mechanical tests enable failure envelopes to beplotted (Nitta et al., 2004). By definition, these con-cern the time variation of the stress–strain behavior.
In the case of aged materials, these envelopescomprise the tension curve of the reference material(not aged) on which is superimposed the variation ofthe breaking stress versus the elongation at rupturefor samples with different aging times (Figure 22).These envelopes allow us to know whether a mate-rial has been damaged or not and, if it has, whetherthere is one aging mechanism or several.
In the case of damage in the material properties, ifthe data points tend toward low stresses at breakalong the tension curve of the reference material,the damage is due to a single, polymer-chain-break-ing mechanism.
The technique of studying mechanical propertieshas been used to characterize the epoxidation of poly-urethane-based membranes [51] and has shown thatthe longer the epoxidation time, the higher the break-ing force and the smaller the elongation. Xu et al. [49]used the mechanical properties of membranes to
characterize the action of a hypochlorite treatment onpolyvinylpyrrolidone-modified polyetherimide mem-branes. They show that, after 2 days of immersion in a4000-ppm sodium hypochlorite solution, the Young’smoduli were the same as those of membranes that hadnot received post-treatment with sodium hypochlorite.
Rouaix et al. (2006) show that a long exposure ofhollow fiber polysulfone membranes to sodiumhypochlorite produces polysulfone chain rupturewhich is closely related to changes in the mechanicalproperties of the membrane. A few chain scissionshave a very high impact on elongation and tensilestrength at break point of the membrane (loss of 80%in elongation at break point for a percentage of chainscissions lower than 2.8%).
References
[1] Baltus, R. E. J. Membr. Sci. 1997, 130 (1–2), 157–172.[2] Baruchel, J., Buffiere, J. Y., Maire, E., Merle, P., Peix, G.
X-Ray Tomography; Hermes Science Publications: Paris,2000.
[3] Begoin, L. Analyse de modules spirales industrielsd’ultrafiltration de fluides laitiers. Physico-chimie dunettoyage de membranes en polyethersulfoned’ultrafiltration de lait ecreme. PhD Thesis, University ofRennes I, 2004.
[4] Belfer, S., Fainchtain, R., Purinson, Y., Kedem, O. J.Membr. Sci. 2000, 172, 113–124.
[5] Bellon-Fontaine, M.-N., Rault, J., Van Oss, C. J. ColloidsSurf. B 1996, 7 (1–2), 47–53.
[6] Bessieres, A., Meireles, M., Coratger, R., Beauvillain, J.,Sanchez, V. J. Membr. Sci. 1996, 109, 271–284.
[7] Bowen, R. W., Hilal, N., Lovitt, R. W., Williams, P. M. J.Membr. Sci. 1996, 110, 233–238.
[8] Bowen, W. R., Mohammad, A. W., Hilal, N. J. Membr. Sci.1997, 126, 91–105.
[9] Causserand, C., Nystrom, M., Aimar, P. J. Membr. Sci.1994, 88, 211–222.
[10] Causserand, C., Rouaix, S., Akbari, A., Aimar, P. J.Membr. Sci. 2004, 238, 177–190.
[11] Choo, K. H., Lee, C. H. J. Colloid Interface Sci. 2000, 226,367–370.
[12] Deen, W. M., Bohrer, M. P., Epstein, N. B. AIChE J. 1981,27(6), 952–959.
[13] Ebersold, M. F., Zydney, A. L. Biotechnol. Bioeng. 2004,85(2), 166–176.
[14] Flosch, D., Lehmann, H.-D., Reichl, R., Inacker, O.,Gopel, W. J. Membr. Sci. 1992, 70, 53–63.
[15] Gijsbertsen-Abrahamse, A. J., Cornelissen, E. R.,Hofman, J. A. M. H. Desalination 2006, 194 (1–3),251–258.
[16] Guo, H., Wyart, Y., Perot, J., Nauleau, F., Moulin, P. J.Membr. Sci. 2010 (in press).
[17] Huisman, I. H., Pradanos, P., Hernandez, A. J. Membr.Sci. 2000, 179, 79–90.
[18] Huisman, I. H., Tragardh, G., Tragardh, C., Pihlajamaki, A.J. Membr. Sci. 1998, 147, 187–194.
[19] Jonsson, A. S. E., Jonsson, B. J. Membr. Sci. 1991, 56,49–76.
[20] Kim, J. H., Ha, S. Y., Nam, S. Y., Rhim, J. W., Baek, K. H.,Lee, Y. M. J. Membr. Sci. 2001, 186, 97–107.
Force (N)
Elongation (%)
Figure 22 Rupture envelopes of various materials: ( ):
not degraded; ( ): slightly degraded; (&): seriously
degraded; (^): tension curve of reference material).
334 Membrane Characterization

[21] Kiso, Y., Sugiura, Y., Kitao, T., Nishimura, K. J. Membr.Sci. 2001, 192(1–2), 1–10.
[22] Lebleu, N., Roques, C., Aimar, P., Causserand, C. J.Membr. Sci. 2009, 326(1), 178–185.
[23] Koyuncu, I., Brant, J., Luttge, A., Wiesner, M. R. J.Membr. Sci. 2006, 278(1–2), 410–417.
[24] Langlet, J., Ogorzaly, L., Schrotter, J. C., et al. J. Membr.Sci. 2009, 326(1), 111–116.
[25] Liikanen, R., Yli-Kuivila, J., Laukkanen, R. J. Membr. Sci.2002, 195, 265–276.
[26] Lindau, J., Jonsson, A. S., Wimmerstedt, R. J. Membr.Sci. 1995, 106, 9–16.
[27] Maruyama, T., Katoh, S., Nakajima, M., et al. J. Membr.Sci. 2001, 192, 201–207.
[28] Masselin, I., Durand-Bourlier, L., Laine, J.-M., Sizaret, P.-Y.,Chasseray, X., Lemordant, D. J. Membr. Sci. 2001, 186,85–96.
[29] Meireles, M., Aimar, P., Sanchez, V. J. Membr. Sci. 1991,56, 13–28.
[30] Meireles, M., Bessieres, A., Rogissart, I., Aimar, P.,Sanchez, V. J. Membr. Sci. 1995, 103, 105–115.
[31] Mok, S., Worsfold, D. J., Fouda, A. E., Matsuura, T.,Wang, S., Chan, K. J. Membr. Sci. 1995, 100, 183–192.
[32] Nitta, K.-H., Ishiburo, T. Macromol. Symp. 2004, 214,251–259.
[33] Nystrom, M., Zhu, H. J. Membr. Sci. 1997, 131, 195–205.[34] Pasmore, M., Todd, P., Smith, S., et al. J. Membr. Sci.
2001, 194, 15–32.[35] Rabiller-Baudry, M., Le Maux, M., Chaufer, B., Begoin, L.
Desalination 2002, 146, 123–128.[36] Remigy, J. C., Meireles, M., Thibault, X. J. Membr. Sci.
2007, 305, 27–35.[37] Robinson, J. W. Practical Handbook of Spectroscopy;
CRC Press: Boca-Raton, FL, 1991.[38] Rouaix, S., Causserand, C., Aimar, P. J. Membr. Sci.
1996, 114, 93–104.[39] Sayed Razavi, S. K., Harris, J. L., Sherkat, F. J. Membr.
Sci. 1996, 114, 93–104.
[40] Schaep, J., Vandecasteele, C. J. Membr. Sci. 2001, 188 (1),129–136.
[41] Skoog, D. A., Holler, F. J., Nieman, T. A. Principles ofInstrumental Analysis, Vth edn.; Harcourt BracePublishers: Philadelphia, PA, 1998.
[42] Steen, M. L., Hymas, L., Havey, E. D., Capps, N. E.,Castner, D. G., Fisher, E. R. J. Membr. Sci. 2001, 188,97–114.
[43] Szymczyk, A., Fatin-Rouge, N., Fievet, P. J. ColloidInterface Sci. 2007, 309 (2), 245–252.
[44] Sung, J. H., Chun, M.-S., Choi, H. J. J. Colloid InterfaceSci. 2003, 264 (1), 195–202.
[45] Torras, C., Garcia-Valls, R. J. Membr. Sci. 2004, 233(1–2),119–127.
[46] Troger, J., Lunkwitz, K., Grundke, K., Burger, W. ColloidSurf. A 1998, 134, 299–304.
[47] Weast, R. Handbook of Chemistry and Physics, 58th edn.;CRC Press: Boca Raton, FL, 1977–1978.
[48] Wienk, I. M., Meuleman, E. E. B., Borneman, Z., Van denBoomgaard, Th., Smolders, C. A. J. Polym. Sci., Part A:Polym. Chem. 1995, 33, 49–54.
[49] Xu, Z.-L., Chung, T.-S., Huang, Y. J. Appl. Polym. Sci.1999, 74, 2220–2233.
[50] Xu, J., Xu, Z. L. J. Membr. Sci. 2002, V208, 203–212.[51] Yang, J. M., Lai, W. C., Lin, H. T. J. Membr. Sci. 2001,
183, 37–47.[52] Yeh, H. M., Wu, H. P., Dong, J. F. J. Membr. Sci. 2003,
213, 33–44.[53] Zhang, W., Wahlgren, M., Sivik, B. Desalination 1989, 72,
263–273.[54] Zhang, W. Hallstrom, B. Desalination 1990, 79 (1),
1–12.[55] Ziel, R., Haus, A., Tulke, A. J. Membr. Sci. 2008, 323 (2),
241–246.[56] Zhao, C., Zhou, X., Yue, Y. Desalination 2000, 129 (2),
107–123.[57] Zhu, H. Nystrom, M. Colloid Surf. A 1998, 138,
309–321.
Characterization of Filtration Membranes 335

This page intentionally left blank

1.16 The Use of Atomic Force Microscopy in MembraneCharacterizationN Hilal and D Johnson, Swansea University, Swansea, UK
ª 2010 Elsevier B.V. All rights reserved.
1.16.1 Introduction 338
1.16.2 Principles of AFM 338
1.16.2.1 Imaging Modes 339
1.16.2.1.1 Contact mode imaging 339
1.16.2.1.2 Intermittent contact (tapping) mode 340
1.16.2.1.3 Noncontact mode 340
1.16.2.2 The AFM as a Force Sensor 341
1.16.2.3 Colloid Probes 342
1.16.3 Visualization of Membrane Surfaces 343
1.16.4 Imaging of Membrane Surfaces in Liquid 347
1.16.5 Measurement of Adhesion of Colloidal Articles and Cells to Membrane Surfaces 349
1.16.5.1 Interactions Forces between Unmodified PES Membranes and BSA-Coated Colloid
probes 349
1.16.5.1.1 Effect of pH on measured adhesion 349
1.16.5.1.2 Effect of ionic strength on adhesion forces 350
1.16.5.2 Interaction Forces between PES Membranes Modified with qDMAEMA and
BSA-Coated Colloid Probes 350
1.16.5.2.1 Effect of pH 350
1.16.5.2.2 Effect of ionic strength 351
1.16.5.2.3 Comparison of (bio)adhesion force measurements between unmodified membranes
and membranes modified with qDMAEMA 351
References 352
Glossary
Colloid probe An AFM probe where the sharp
imaging tip has been replaced with a colloidal
particle. This allows the measurement of
interactions between particles and surfaces. This is
useful for measuring colloid–membrane
interactions, of interest when considering the
fouling of membranes by particulates.
Contact mode AFM imaging mode where the
probe maintains constant contact with the sample
surface. A feedback mechanism is employed to
maintain a constant deflection of the cantilever
allowing the topography of the sample to be
recorded. This is the most basic mode of operation
of the AFM.
Degree of modification (DM) The extent to which
a membrane surface has been chemically modified
to improve its surface properties. This is commonly
expressed as mass of modifying chemical divided
by unit surface area (e.g., mg cm�1).
Hooke’s law This law relates the deflection of the
cantilever to the forces applied by the probe tip via
the stiffness of the lever.
Intermittent contact (tapping) mode Mode of
AFM imaging where the cantilever is allowed to
oscillate, causing the probe tip to intermittently
come into contact with the sample surface. This
reduces artifacts due to lateral or frictional forces
and can achieve better image results than with
contact mode, especially for soft sample surfaces.
Noncontact mode In this AFM mode the probe tip
does not make hard contact with the sample
surface, but instead probes repulsive forces close
to the surface. The minimal forces applied to the
sample cause little deformation of the sample and
thus very high resolution images are obtainable. In
practice, however, true noncontact imaging is
difficult to achieve under many conditions.
337

Rq (rms roughness) A common measure of the
roughness of a surface. Essentially, it is the
standard deviation of the heights of all the pixels in
a topographic image from the mean height.
Quaternary 2-dimethyl-aminoethylmethacrylate
(qDMAEMA) Chemical used in the studies
described here to improve the fouling properties of
various membranes.
1.16.1 Introduction
Over the past two decades, atomic force microscopy(AFM) has proven itself to be a powerful and versa-tile tool for the physical characterization of surfaces.As an imaging technique, it is capable of resolvingfeatures from a few micrometers down to the sub-nanometer scale. Unlike many other high-resolutionimaging techniques, it can image both conductingand nonconducting surfaces, it does not require hardvacuum to function, and is capable of visualizingsamples in air as well as in liquids. This is of greatuse to researchers interested in studying membranesand other surfaces, which are routinely exposed toaqueous solutions as it means that they may beimaged in their operational media. The basic opera-tion of the AFM uses a probe with a sharp tip tophysically feel the surface of interest, generating athree-dimensional (3-D) topography, allowingquantification of physical properties, such as rough-ness, step heights, and pore sizes. This mechanicalnature of the AFM also allows it to be used as adirect force sensor. Replacing the sharp tip with aparticle of colloidal size or single cell allows the
characterization of adhesive and long-range surfaceforces in different environmental conditions. Thiscan provide insight into the fouling properties ofmembranes, without recourse to using full-scalemembrane filtration rigs.
In this chapter, we outline the operation of theAFM, giving specific examples of the use of the AFMto characterize a range of properties of filtrationmembranes.
1.16.2 Principles of AFM
In Figure 1, the basic setup of a typical AFM isshown. A cantilever, which may commonly be eitherV-shaped, as shown, or a rectangular diving-board-shaped cantilever, attached to a chip, has mountedclose to its free end a sharp tip which acts as theprobe of interaction forces. The probe is brought intoand out of contact with the sample surface by the useof a piezocrystal, upon which either the cantileverchip or the surface itself is mounted, depending uponthe particular system being used. Movement in thisdirection is conventionally referred to as the z-axis. A
Laser diode
Light path
Cantilever
Sample
Probe
Photodetector
A B
C D
Figure 1 Basic setup of the atomic force microscopy (AFM). A probe is mounted at the apex of a flexible Si or Si3N4
cantilever. The tip of the probe is moved in relation to the sample surface by the use of piezo crystals. Deflection of
the cantilever is monitored by the change in the path of a beam of laser light deflected from the upper side of the end
of the cantilever by a photodetector. As the tip is brought into contact with the sample surface, by movement of the
piezo, its deflection is monitored. This deflection can then be used to calculate interaction forces between probe andsample.
338 Membrane Characterization

laser beam is reflected from the reverse (uppermost)side of the cantilever onto a position-sensitive photo-detector. Any deflection of the cantilever willproduce a change in the position of the laser spoton the photodetector, allowing changes to thedeflection to be monitored. The most common con-figuration for the photodetector is that of a quadrantphotodiode divided into four parts with a horizontaland a vertical dividing line. If each section of thedetector is labeled A–D as shown in Figure 1, thenthe deflection signal is calculated by the difference insignal detected by the AþB versus CþD quadrants.Comparison of the signal strength detected by AþCversus BþD will allow detection of lateral ortorsional bending of the lever. Once the probe is incontact with the surface, it can then be raster-scannedacross the surface to build up relative height infor-mation of topographic features of the sample.
Scanners are available in different configurations,depending upon the particular AFM employed, orthe purpose for which it is required. Tube scannersconsist of a hollow tube made of piezoceramic mate-rial. Depending on how electrical current is applied,the tube may extend in the z-direction, or be causedto flex in either the x- or y-direction to facilitatescanning. Alternatively, scanners may consist ofseparate piezo crystals for each movement direction.Such a configuration removes certain nonlinearityproblems which may occur in the simpler tubescanners. In many commercially available AFMs,especially in older models, the movement in the x-
and y-direction may be achieved by the movementof the sample rather than by the movement of theprobe.
1.16.2.1 Imaging Modes
There are many different imaging modes availablefor the AFM, providing a range of different informa-tion about the sample surfaces being examined.However, for simplicity the most common modesare considered here. In Figure 2, the force regimesunder which the main imaging modes occur are illu-strated schematically. In the figure, the interactionforces are sketched as the probe approaches andcontacts the surface, with separation distance increas-ing to the right. At large separations, there are no netforces acting between the probe and the sample sur-face. As the probe and surface approach each other,attractive van der Waals interactions begin to pullthe probe toward the surface. As contact is made, thenet interaction becomes repulsive as electron shells
in atoms in the opposing surfaces repel each other. InFigure 2, the repulsive forces are shown as being
positive and attractive forces negative.
1.16.2.1.1 Contact mode imaging
Contact mode imaging is so called because the probe
remains in contact with the sample at all times. As aresult, the probe–sample interaction occurs in the
repulsive regime as illustrated in Figure 2. This isthe simplest mode of AFM operation and was that
originally used to scan surfaces in early instruments.
There are two variations in this technique: constantforce and variable force. With constant force mode, a
feedback mechanism is utilized to keep the deflec-tion, and hence force, of the cantilever constant. As
the cantilever is deflected, the z height is altered tocause a return to the original deflection or set point.
The change in z-position is monitored and this infor-mation as a function of the x,y position is used to
create a topographical image of the sample surface.For variable force imaging, the feedback mechanisms
are switched off so that z height remains constant and
the deflection is monitored to produce a topographicimage. This mode can be only used on samples which
are relatively smooth with low-lying surface features,but for surfaces where it is applicable it can provide
images with a sharper resolution than constant forcemode.
For
ce
Distance
Contact mode
Noncontact mode
Attraction
Intermittentcontact mode Repulsion
Figure 2 Diagram illustrating the force regimes under
which each of the three most common atomic forcemicroscopy (AFM) imaging modes operate. Contact
mode operation is in the repulsive force regime, where
the probe is pressed against the sample surface,
causing an upward deflection of the cantilever.Noncontact mode interrogates the long-range forces
experienced prior to actual contact with the surface.
With intermittent contact, or tapping mode, the probe isoscillated close to the surface where it repeatedly comes
into and out of contact with the surface.
The Use of Atomic Force Microscopy in Membrane Characterization 339

Contact mode is often the mode of choice whenimaging a hard and relatively flat surface due to itsrelative simplicity of operation. However, there areseveral drawbacks. Lateral forces can occur when theprobe traverses steep edges on the sample, whichmay cause damage to the probe or the sample, oralso result from adhesive or frictional forces betweenthe probe and the sample. This can also lead to adecrease in the resolution of images due to the stick-slip movement of the probe tip over the surface. Inaddition, the relatively high forces with which theprobe interacts with the sample can cause not only adeformation of the sample, leading to an underesti-mation of the height of surface features, but also anincrease in the area of contact between the probe andthe surface. The area of contact between the probeand the surface sets a limit to the resolution whichcan be achieved. Where a soft, and therefore easilydeformable and easily damaged, sample is to beimaged, dynamic modes of imaging, such as inter-mittent contact or noncontact modes, are usuallypreferable.
1.16.2.1.2 Intermittent contact (tapping)
mode
In order to overcome the limitations of contact modeimaging as mentioned above, the intermittent, ortapping, mode of imaging was developed [1–3].Here, the cantilever is allowed to oscillate at avalue close to its resonant frequency. When theoscillations occur close to a sample surface, theprobe will repeatedly engage and disengage withthe surface, restricting the amplitude of oscillation.As the surface is scanned, the oscillatory amplitude ofthe cantilever will change as it encounters differingtopography. By using a feedback mechanism to alterthe z height of the piezo and maintain constantamplitude, an image of the surface topography maybe obtained in a similar manner as with contact modeimaging. In this manner, lateral forces, as the probe isscanned across the surface, are greatly reduced, com-pared with the contact mode.
When using tapping mode in air, capillary forcesdue to thin layers of adsorbed water on surfaces,particularly with very hydrophilic surfaces, have tobe overcome, as well as any other adhesive forceswhich may be present. If the restoring force of thecantilever due to its deflection is insufficient to over-come adhesion between the probe and the surface,then the probe will be dragged along the surface in aninadvertent contact mode. As a result, for this modein air, the spring constants of AFM cantilevers are by
necessity several orders of magnitude greater than
those used for either tapping mode in liquid or con-
tact mode (typically in the range of 0.01–2 N m�1 for
contact mode to 20–75 N m�1 for tapping in air).As surfaces with different mechanical and adhe-
sive properties are scanned, the frequency of
oscillation will change causing a shift in the phase
signal between the drive frequency and the fre-
quency with which the cantilever is actually
oscillating [4, 5]. This phenomenon has been used
to produce phase images alongside topographic
images, which are able to show changes in the mate-
rial properties of the surfaces being investigated.
However, while the qualitative data this provides
are useful, it is difficult to extract quantitative infor-
mation from the phase images due to the
phenomenon being a complex result of a number of
parameters, including adhesion, scan speed, load
force, topography, and the material, especially elas-
tic, properties of the sample and probe [5, 6].
1.16.2.1.3 Noncontact mode
In noncontact mode, imaging the cantilever is again
oscillated, as in intermittent contact mode, but at
much smaller amplitude. As the probe approaches
the sample surface, long-range interactions, such as
van der Waals and electrostatic forces, occur between
atoms in the probe and the sample. This causes a
detectable shift in the frequency of the cantilever
oscillations. Detection of the shift in phase between
the driving and oscillating frequencies allows the z
positioning of the cantilever to be adjusted to allow
the cantilever to remain out of contact with the sur-
face by the operation of a feedback loop [7]. As the
probe does not contact the surface in the repulsive
regime, the area of interaction between the tip and
the surface is minimized, allowing potentially for
greater surface resolution. As a result, it is imaging
in this mode which is best able to achieve true atomic
resolution, when examining a suitable surface under
suitable conditions with a tip of requisite asperity.
However, in practice, obtaining high-quality images
is a more daunting prospect than for intermittent
contact mode. When imaging in air, all but the most
hydrophobic of surfaces will have a significant water
layer, which may be thicker than the range of the van
der Waals forces being probed. This combined with
the low oscillation amplitude will mean that the
probe will be unable to detach from the water layer
easily, degrading imaging resolution.
340 Membrane Characterization

1.16.2.2 The AFM as a Force Sensor
One of the major applications of the AFM is in thequantitative measurement of interaction forcesbetween either the probe tip, or an attached particlereplacing the tip, and a sample surface. This techniquehas been employed to examine a wide variety ofsystems, including the mechanical properties of mate-rials on the micro- and nanoscale [8–13], of interest forcharacterizing nanoengineered materials; adhesionbetween surfaces [13–18]; attractive and repulsive sur-face forces, such as van der Waals and electrostatic
double-layer forces [19–22], both of interest when
studying the properties of colloidal particles; and to
probe the mechanical properties and kinetics of bond
strength of biomolecules [23–26].As the tip of the cantilever is brought into and out of
contact with a surface, a force curve is generated,
describing the cantilever deflection (or force) as a
function of distance. A typical force curve is illustrated
in Figure 3. Raw data are plotted as displacement of
the z piezo on the abscissa, while cantilever deflection
is plotted as the signal on the photodetector
–10
–5
0
5
10
15
20
25
30
35
–100 –50 0 50 100 150 200 250 300
z-piezo translation (nm)
Def
lect
ion
(nA
)
–30
–20
–10
0
10
20
30
40
50
60
0 50 100 150 200 250 300 350 400
Distance (nm)
For
ce (
nN)
(b)
(a)
1.
2.
3.
Figure 3 An example force curve. Raw data are shown in (a) plotted as displacement of the z-piezo vs. deflection as
measured on the photosensitive detector. Calculation of the cantilever stiffness and sensitivity of the optical lever setupallows the raw data to be converted into probe–sample separation distance vs. the force, with converted force curve shown in
(b). By convention, for atomic force microscopy (AFM) force curves attractive forces are portrayed as negative and repulsive
forces as positive.
The Use of Atomic Force Microscopy in Membrane Characterization 341

(commonly either as voltage, V, or also sometimes ascurrent, A) on the ordinate. As the cantilever begins itsapproach (described by the red trace), it is away fromthe surface and hence there is no change in forcedetected (point 1 in Figure 3) – the cantilever is saidto be at its free level, that is, at this point there are nonet forces acting on it (assuming that the probe is nottraveling fast enough for hydrodynamic drag forces tohave a significant effect). As the probe comes into closeproximity with the cantilever, long-range forces maybegin to interact between the probe and the objectivesurface. Repulsive forces will cause the lever to deflectupward and away from the surface, while attractiveforces will deflect the lever downward, toward thesurface. If the gradient of attractive forces is less thanthe stiffness of the lever, then the probe will remain atits free level due to the restoring force stored in thelever. If the probe reaches a point where the gradient ofattractive forces exceeds the stiffness of the cantilever,then the cantilever will be rapidly deflected downwardallowing the probe to touch the surface in a snap-in orjump-to-contact. In the absence of attractive surfaceforces, this jump-to-contact will not be seen. When thecantilever makes hard contact with the surface, it isdeflected upward due to repulsion between electronshells of atoms in the opposing material surfaces and apositive force is observed (point 2). The cantilever isthen retracted (blue trace) and initially follows the pathof the approach trace in the contact region. The canti-lever often remains attached to the surface by adhesiveforces which results in a downward deflection of thecantilever as the probe retracts away from the surface,causing a hysteresis between the trace and retrace.Eventually, the separation force becomes sufficient toovercome the adhesion between the probe tip and thesurface and the cantilever snaps back to its initial free-level position (point 3).
This behavior results in a curve of deflection(measured as raw signal) versus the displacement ofthe piezo in the z direction. When the surface beingpressed against is hard and does not undergo signifi-cant deformation, the z movement will be equal tothe deflection of the cantilever. As a consequence, theslope obtained from contact with an unyielding sur-face provides the sensitivity of the optical leversystem. By dividing the raw deflection data by thissensitivity value, it can be converted into an actualdeflection distance. This sensitivity value is essentialfor the calculation of force values from raw deflectiondata. This deflection value (distance) can also then besubtracted from the z piezo displacement to give theactual distance traveled by the probe. An alternative
method of finding the optical lever sensitivity with-out requiring to make hard contact with the surfacewas suggested by Higgins et al. [27].
Within operational limits the AFM cantileverbehaves as a linear, or Hookean, spring. As a result,the magnitude of the deflection of the cantilever canbe used to calculate the force being exerted on thecantilever using Hooke’s law:
F ¼ – kx ð1Þ
where F is force (N), x is the deflection of the canti-lever (m), and k is the spring (or force) constant of thecantilever (N m�1), which essentially represents thestiffness of the cantilever.
1.16.2.3 Colloid Probes
By attaching a microsphere to the end of a tiplesscantilever, the geometry of interactions between theprobe and the surface can be greatly simplified, allow-ing the AFM to be used to probe surface forces, muchakin to the surface force apparatus (SFA).Microparticles can also be used as probes that allowparticle-to-particle adhesion forces to be measured. Anexample of a colloid probe is illustrated in Figure 4.Here, a scanning electron microscope (SEM) imageshows a 5-mm-diameter silica bead attached with glueclose to the apex of a standard AFM microcantilever.
The first reported use of an AFM as a colloidalprobe was by Ducker and coworkers [28, 29] whoattached a 3.5-mm silica sphere to an AFM cantilever
Figure 4 A colloid probe prepared by attaching a glassmicrosphere to the apex of an atomic force microscopy
(AFM) cantilever.
342 Membrane Characterization

and used it to measure forces between the sphere and asilica surface as a function of electrolyte concentrationand pH. Since then this technique has been used toprobe the interaction forces between a variety of mate-rials and surfaces, including silicates and other inorganicmaterials [13, 16, 29, 30]; protein and polymer-coatedbeads and surfaces [31–34]; membrane-fouling materi-als and membranes [35]; biological cells and surfaces[36, 37]; between drug particles, important in powderformulations [14, 17, 20]; and for probing the rheologicalproperties of liquids [38, 39].
1.16.3 Visualization of MembraneSurfaces
The primary use of AFM for the characterization offiltration membranes is the 3-D imaging of surfacetopography, which can yield quantitative parameterssuch as the surface roughness and the pore-size dis-tribution. As the images obtained are actually arraysof height information, the roughness parameters areeasy to extract. The most commonly used roughnessparameter is the root mean squared (rms) roughness(Rq), essentially the standard deviation of the heightsof all the image pixels from the mean height:
Rq ¼
ffiffiffiffiffiffiffiffiffiffiffiffiffiffiffiffiffiffiffiffiffiffiffiffiffiffiffiPðZi –ZaveÞ2
N
sð2Þ
where Zi is the height information contained in eachpixel, Zave is the mean height, and N is the totalnumber of pixels in the image.
If a suitable number of pores are clearly obtainedon an image, the pore-size distribution and average
pore-size parameters can be obtained. Figure 5shows a Cyclopore microfiltration membrane whichhas been imaged using an AFM in air under ambientconditions [40]. Here, the membrane surface is pre-sented in a 3-D view, which allows the eye to become
drawn to the undulations in the surface, as well asmaking the locations of the pores appear clearer. Byconvention, the images are shaded so that higherareas appear light, with the lowest areas appearingdarker. This allows the pores to be seen as localizeddark patches. A number of pores are visible in theimage with approximately 200 nm in diameter.Instrument software on commercial AFMs routinely
allows the measurement of surface features in the x-
and y-direction, allowing the measurement of the sizeof each pore in at least two dimensions, and with asufficient number of pores measured in this way thedistribution of pore sizes can be ascertained.Occasionally, features of interest may be serendipi-tously recorded on the membrane surface; Figure 6shows a 0.3-mm colloidal particle blocking an
entrance of a pore on the surface of a microfiltrationmembrane. This image shows a membrane in theearly stages of being fouled by particulate matter,inhibiting flow through the membrane.
For the example shown above, the pores are rela-tively large and thus easily imaged. The imaging ofmembrane pores much smaller in size, such as thosefound in nanofiltration membranes, is much morechallenging. Figure 7 shows an image of a singlepore from a XP117 membrane (PCI Membranes)alongside the pore-size distribution for this particularmembrane [41]. As can be seen, the mean pore size is
�1 nm in diameter, which is typical for this type ofnanofiltration membrane. It must be noted here that
Pore size (μm)0.10 0.15 0.20 0.25 0.30 0.35
Por
es (
%)
0
5
10
32
10
0
1
2μm
μm
3
0.00
0.10
0.20μm
15
20
25
Figure 5 Atomic force microscopy (AFM) image of a Cyclopore microfiltration membrane and pore-size distribution [40].
The Use of Atomic Force Microscopy in Membrane Characterization 343

when imaging features of this scale, the operatormust be very careful to ensure that pores are actuallybeing imaged, and that the images do not containother artifacts which may be mistaken for pores.
For the purposes of modifying the fouling beha-vior of filtration membranes, much interest iscurrently being placed on the chemical modifica-tion of membrane surfaces. In such cases, it can beuseful to quantify the changes in physical charac-teristics of a treated membrane. Figure 8 shows aseries of topographies of a polyethersulfone (PES)membrane, both unmodified and treated with dif-ferent degrees of modification (DM) of quaternary2-dimethyl-aminoethylmethacrylate (qDMAEMA).
Pore size and pore-size distribution of each mem-brane were determined from surface topography.The lognormal distribution was chosen to representthe pore-size data for each of the membranes. Thiswas found to give a good fit to the pore-size distribu-tion. All these distributions were fitted to lognormaldistributions given by frequencies (%f ):
%f ¼ %fmax exp –1
2�2In
dp
X0
� �2" #
ð3Þ
where dp is the measured pore size, s is the standarddeviation of the measurements, %fmax is the maxi-mum frequency, and X0 is the modal value of dp.
Pore size (nm)0.0
1612
Å
Å
Å
84
00
4
8
12
16
0.001.002.00
0.5 1.0 1.5 2.0
Por
es (
%)
0
5
10
15
20
25
30
35
40
Figure 7 Image of a single pore from an XP117 nanofiltration membrane alongside the pore-size distribution for this membrane.
3500 nm
1750 nm
1750 nm
3500 nm0 nm153.68 nm307.36 nm
0 nm 0 nm
Figure 6 Biocolloid of 0.3 mm blocking membrane pore.
344 Membrane Characterization

Mean pore sizes and pore-size distributions ofinitial membranes determined from AFM images are
shown in Figure 9 and Table 1. The table shows that
with a mean pore size of 0.535� 0.082mm, the poly-
vinylidene fluoride (PVDF) membrane has slightly
larger pores than the PES membrane (mean pore
size 0.470� 0.188mm). Pore-size distributions are
detailed in Figure 9, along with fits described by
Equation (3). The measured pore sizes are larger
than the nominal pore size of 0.22mm as specified by
the manufacturers. The AFM data confirm that the
pore sizes of studied membranes are of approximately
the same size. The topographical images give a clear
perception of a notable difference in the surface mor-
phology of the membranes used for the modification.
A quantification of the surface parameters (see
Table 1) provides an insight into morphological fea-
tures of the membrane which influence both
separating properties of the membrane and the process
of modification by graft copolymerization.According to Figure 9(a), the initial PES membrane
has a very wide postsynaptic density (PSD) with a
s value of 0.56mm. However, grafting of poly-
qDMAEMA resulted in narrowing PSD and shifting
the whole curve toward smaller pore sizes. As a result,
the mean pore size gradually decreased with the
increase in the amount of poly-qDMAEMA grafted to
the membrane surface. Significant improvement of the
PSD was observed even for the modified PES mem-
branes with the smallest degree of modification.Narrowing of the PSD occurred mostly due to the
disappearance of large pores (greater in diameter than
0.6mm). Taking into consideration that substantial nar-
rowing of large pores demands higher quantities of
grafted polymer compared to smaller pores, it can be
assumed that higher rates of polymer growth were
initiated at the walls of the larger pores. At the entrance
of narrower pores, a higher density of free radicals
results in chain termination and, consequently, a lower
rate of polymer grafting. With time, when the PSD
becomes more uniform, free radicals are eventually
distributed across the membrane surface. This leads to
a gradual decrease of all surface pores with the PSD
shifting to smaller sizes. With DM > 202mm cm�2, a
slight fluctuation in the width of PSD (s) was observed.Using the topography data, surface analysis was car-
ried out to obtain the surface roughness parameters, as
shown in Table 2. The formation of a graft polymer layer
(a)
(b)
(c)
(d)
25 μm
12.5 μm
0 μm
25 μm
12.5 μm
0 μm
Z scale = 720 nm
25 μm
12.5 μm
0 μm Z scale = 720 nm
25 μm
12.5 μm
0 μm Z scale = 720 nmZ scale = 720 nm
Figure 8 Atomic force microscopy (AFM) images of polyethersulfone (PES) membranes: (a) unmodified; (b–d) modified withquaternary 2-dimethyl-aminoethylmethacrylate (qDMAEMA) with respective degrees of modification (DM) of 202, 367, and
510mg cm�2.
The Use of Atomic Force Microscopy in Membrane Characterization 345

Pore size (μm)0.0 0.1 0.2 0.3 0.4 0.5 0.6 0.0 0.1 0.2 0.3 0.4 0.5 0.60.7
0.0 0.1 0.2 0.3 0.4 0.5 0.6 0.7 0.02 0.04 0.06 0.08 0.10 0.12 0.14 0.16
0.8 0.9 1.0
Por
e de
nsity
(%
)
0
5
10
15
20
25
AFM dataFitted data
Pore size (μm)
Por
e de
nsity
(%
)
0
10
20
30
40
(a)
(b)
Pore size (μm)
Por
e de
nsity
(%
)
0
10
20
30
40
50
Pore size (μm)
Por
e de
nsity
(%
)
0
5
10
15
20
25
30(d)
(c)
AFM dataFitted data
AFM dataFitted data
AFM dataFitted data
Figure 9 Pore-size distributions obtained from surface topography for unmodified (a) and modified with (b) 202 mg cm�2,(c) 367mg cm�2, and (d) 510mg cm�2 of quaternary 2-dimethyl-aminoethylmethacrylate (qDMAEMA).
Table 1 AFM measurements of mean pore size and pore-size distribution for PES
membranes modified with qDMAEMA
PSD parameters
DM(mg cm�2)
Mean pore size(mm)
X0
(mm) %fmax s
0 0.470�0.188 0.353� 0.028 19.8� 2.2 0.56�0.08
202 0.337�0.098 0.278� 0.010 41.4� 4.4 0.32�0.04367 0.293�0.072 0.281� 0.003 51.3� 2.0 0.26�0.01
510 0.100�0.083 0.075� 0.004 26.9� 2.9 0.40�0.05
Table 2 AFM measurements of membrane surface
morphology for membranes modified with qDMAEMA
DM(mg cm�2)
Ra(nm)
Rq(nm)
Mean height(nm)
Max range(nm)
0 27.93 36.43 161.77 275.46
202 32.26 42.91 250.09 378.4367 67.37 85.28 329.46 537.27
510 81.64 103.82 357.5 3000.5
346 Membrane Characterization

on the membrane surface resulted in significant changesin the surface morphology. Structural modificationsbecame more pronounced with increasing DM [42].
A slight increase in the membrane roughness,compared with the unmodified membrane, wasobserved for membranes modified with the lowestdegree of grafted polymer (202 mg cm�2). At such adegree of modification, grafted chains would mostlikely be able to be accommodated within the pores.Further increases in DM led to a significant increasein surface roughness with a layer of grafted polymerforming its own porous structure.
1.16.4 Imaging of MembraneSurfaces in Liquid
In aqueous solution, membrane surfaces commonlycarry electrical charge, with the sign and magnitudeof the charge dependent upon the state of the sur-rounding solvent, with the pH and ionic strengthbeing especially important. On approach of an AFMprobe tip to a membrane surface, the long-rangeforces experienced will be a combination of electricaldouble-layer forces and van der Waals forces. Thenet forces experienced by the probe tip may be eitherrepulsive or attractive, depending upon the particu-lar interaction being observed. In addition, whenimaging in the noncontact mode, the finest resolutionmay be achieved when the forces between the probe
tip and the membrane are repulsive. This allows the
interactions between the apex of the probe tip and
the membrane to be minimized, leading to the max-
imum possible resolution.Figure 10 shows force measurements taken
between a silicon nitride AFM tip and a Cyclopore
membrane at various concentrations of NaCl [43].
All the measurements shown are the forces measured
as the tip first approaches the membrane. As can be
seen at all concentrations of salt, the tip–surface
interactions are repulsive at all separation distances.
For these measurements, the pH was maintained at a
constant value (6.5). As the ionic strength is
increased, the range of the repulsive forces decreases,
as would be expected from conventional Derjaguin–
Landau–Verwey–Overbeek (DLVO) theory, from a
maximum of approximately 35 nm down to about
2–3 nm. This suggests that the electrical double-
layer interaction between the tip and the surface is
dominant in all cases. Under these conditions, both
the probe tip and the membrane would be expected
to carry a negative charge.With information such as that shown in
Figure 10, it is now possible to image at a specified
imaging force corresponding to any point on the
force curves using noncontact mode imaging.
Figure 11 shows two series of images obtained: first
with varying imaging force at a constant solution
ionic strength and second at a constant force at var-
ious ionic strengths, along with the pore-size
Distance (nm)0
For
ce (
nN)
0
10
20
30
40
50
NaCl 10–1 MNaCl 10–2 MNaCl 10–3 MNaCl 10–4 M
3530252015105
Figure 10 Force vs. distance curves for the approach of an atomic force microscopy (AFM) tip to a Cyclopore
microfiltration membrane in NaCl solutions of various ionic strengths.
The Use of Atomic Force Microscopy in Membrane Characterization 347

distributions obtained from the same images [43]. As
the imaging force or ionic strength is increased, the
image quality is improved. In addition, the pore-size
distributions also vary, with a greater mean pore
diameter being obtained at the higher force and
ionic strengths. This does illustrate a limitation of
the values for pore sizes obtained from AFM images:
the accuracy of the sizes obtained is in part depen-
dent upon the quality of the images obtained.
Whenever imaging any surface, using AFM is of
great importance to obtain as sharp an image as is
possible.
(a) (b) (c)
(d) (e) (f)
IF = 33.8 nN
2
Imaging force = 33.2 nNNaCI 10–2
Imaging force = 33.1 nNNaCI 10–3
Imaging force = 33 nNNaCI 10–1
Imaging force = 33.8 nNNaCI 10–1
Imaging force = 12.9 nNNaCI 10–1
Imaging force = 4.35 nNNaCI 10–1
1.5
1
0.5
00 0.5 1
1.5
μm
μm
2
2
1.5
1
0.5
00 0.5 1 1.5
μm
μm
μm
μm
2
2
1.5
1
0.5
00 0.5 1 1.5
μm
μm
2
21
00
1
2
μm
μm
21
00
1
2
μm
μm
21
00
1
2
IF =12.9 nNIF = 4.4 nN10–1M
10–4M 10–3M 10–2M
10–1M 10–1M
Pore size (μm)
(a′)
0.05
%
0
10
20
30
40
50
IF = 33.2 nNIF = 33.1 nNIF = 33.0 nN
0.150.10Pore size (μm)
(b′)
0.05
%
0
10
20
30
40
50
0.150.10Pore size (μm)
(c′)
0.05
%
0
10
20
30
40
50
0.150.10
Pore size (μm)
(f′)
0.05
%
0
10
20
30
40
50
0.150.10Pore size (μm)
(e′)
0.05
%
0
10
20
30
40
50
0.150.10Pore size (μm)
(d′)
0.05
%
0
10
20
30
40
50
0.200.150.10
Figure 11 Atomic force microscopy (AFM) images of a Cyclopore membrane in electrolyte solutions. (a–c) and (a9–c9) at
various forces in 10�1 M NaCl solution; (c, c9), (d–f), and (d9–f9) at approximately constant force at various ionic strengths. All
data at pH 6.5. IF, imaging force.
348 Membrane Characterization

1.16.5 Measurement of Adhesion ofColloidal Articles and Cells toMembrane Surfaces
Using a colloidal probe mounted on an AFM can-
tilever, it is possible to measure the adhesion
between a range of materials and membranes
under a number of different conditions. These
adhesive forces are important determinants in the
fouling properties of any membrane. The process
testing of new membranes to determine their foul-
ing properties can be costly in terms of both
money and time. Development of use of the
AFM to directly quantify the adhesion of particu-
lates of different types to membranes has a great
potential role in predicting and optimizing the
fouling properties of filtration membranes. In this
section, we describe a series of measurements to
measure the changes in adhesion between a model
biocolloid and PES membranes under different
environmental conditions. This was then repeated
with the same membrane, but grafted with a poly-
mer (qDMAEM) to hopefully decrease its
tendency to become fouled. As a probe, silica
spheres were coated with a layer of the globular
protein bovine serum albumin (BSA). BSA is a
protein which has been utilized in a number of
applications due to its high degree of nonspecific
binding [44].Examples of retraction curves measured at three
different loading forces for a BSA-modified micro-
sphere interacting with PES membrane grafted with
qDMAEMA, shown in Figure 12, demonstrate that
the adhesion force (pull-off force) increased with the
force applied by the colloid [44]. Similar findings
have been observed in previous studies [45–49].The increase in the adhesion force is most likely
to result from an increase in the number of chemical
bonds formed between the biopolymers when the
surfaces are forced into closer contact using higher
loading forces [49]. In addition, the deformation of
the membrane surface at high loading forces may
increase the area of contact between the probe and
the membrane surfaces. In order to exclude the influ-
ence of loading force in comparison of interactions
force, the experimental results will be presented by
plotting the adhesion force versus the loading force.
For purposes of comparison, the adhesion force at
loading force equal to 80 mN m�1 was measured,
interpolated or extrapolated from the obtained
experimental data.
1.16.5.1 Interactions Forces betweenUnmodified PES Membranes andBSA-Coated Colloid probes
1.16.5.1.1 Effect of pH on measured
adhesion
Figure 13 shows the normalized adhesion force mea-
surements against the normalized loading force
applied to the cantilever between a BSA-modified
probe and initial PES membrane at different pH
values [44]. It can be seen that the adhesive force is
highest at pH 5, followed by moderate values at pH 3,
and the lowest at pH 7.At pH 7, both the BSA and the membrane surface
are negatively charged [49], which provoke increases
in the repulsive electrostatic interaction leading to a
reduction in adhesion. BSA is more hydrophobic at
pH 5 than at 7, which would be expected to increase
adhesion. Second, the protein has a more expanded
structure at pH values away from its isoelectric point
(pI). Thus, a steric repulsive interaction between the
interacting surfaces will be higher at pH 3 than at pH
5, leading to reduced adhesion at pH 3. Finally, PES
possesses a slight positive charge at pH 3 [49], pro-
voking an electrostatic repulsive force between the
membrane and colloidal probe.
Loading force(mN m–1)
55
52
61
For
ce (
nN m
–1)
Separation (nm)
Figure 12 Representative force curves (approach¼blue,retract¼ red) showing interactions between a bovine serum
albumin (BSA)-coated silica probe and quaternary
2-dimethyl-aminoethylmethacrylate (qDMAEMA)-modified
polyethersulfone (PES) membrane at different loading forces.
The Use of Atomic Force Microscopy in Membrane Characterization 349

1.16.5.1.2 Effect of ionic strength onadhesion forces
The effect of the solution ionic strength on the mea-
sured adhesion force is shown in Figure 14 [44].
Increased NaCl concentration leads to an increase
in the adhesion force between the BSA probe and the
PES membrane surface. The adhesion of the BSA
probe to initial unmodified PES increased by a factor
of �2.4 across the concentration range 1–100 mM
NaCl. This behavior is qualitatively consistent with
the DLVO theory [50], as increasing the ionic
strength compresses the thickness of the electrostatic
double layer and should therefore reduce the repul-
sion force between the two surfaces resulting in an
increase in measured adhesion force.
1.16.5.2 Interaction Forces between PESMembranes Modified with qDMAEMA andBSA-Coated Colloid Probes
1.16.5.2.1 Effect of pH
The effect of solution pH on adhesion force for PES
membranes modified with qDMAEMA is shown in
Figure 15. An increase in adhesion force with
increasing pH is observed for modified membranes
with three different DMs and is approximately three-
fold at a loading force of 80 mN m�1 [44].The dominant contribution in the increase in
adhesion force with increasing pH can be attributed
to the electrostatic force between the positively
charged modified membranes and the BSA probe.
At pH 3, both surfaces (membrane and BSA probe)
possess a positive charge resulting in greater repul-
sion at this pH and, hence, a lower adhesion than
seen at other pH values. At pH 7, the modified
PES membranes remain positively charged, while
BSA carries a negative charge. This change in the
nature of the electrostatic interaction leads to a
greater observed adhesive force at pH 7.Taking into consideration the amphoteric beha-
vior of BSA, which leads to a change in protein
charge with changing pH, the BSA possesses a posi-
tive charge at pH below the pI and negative charge at
pH above the isoelectric point. This fact explains the
high adhesion at pH 7 where both the BSA and the
membrane surface are oppositely charged. Thus, an
attractive electrostatic force between the interacting
surfaces results in higher adhesion.
Loading force (mN m–1)60
Adh
esio
n fo
rce
(mN
m–1
)
0
5
10
15
20
25
1 mM NaCl 10 mM NaCl 100 mM NaCl
12010080
Figure 14 Dependency of adhesion force on loading force
for interactions between a bovine serum albumin (BSA)-
coated silica probe and unmodified polyethersulfone (PES)
membrane measured in solutions of increasing ionic strength.
Loading force (mN m–1)20
Adh
esio
n fo
rce
(mN
m–1
)
1
2
3
4
5
6
7
8
pH=3pH=5pH=7
140120100806040
Figure 15 Measured adhesion force vs. loading force
between a bovine serum albumin (BSA)-coated probe and a
quaternary 2-dimethyl-aminoethylmethacrylate(qDMAEMA)-modified polyethersulfone (PES) membrane
(DM¼510mg cm�2).
Loading force (mN m–1)40
Adh
esio
n fo
rce
(mN
m–1
)
0
2
4
6
8
10
12
pH=3pH=5pH=7
1401201008060
Figure 13 Relationship between the loading force andadhesion measured for unmodified polyethersulfone (PES)
membrane at a range of pH values.
350 Membrane Characterization

Steric interaction could be another factor whichplays a role in reducing the adhesion force observedwith both membranes at pH 3. The overlap of theexpanded protein layer and the modification polymerchain of qDMAEMA, which is fully dissociated at thispH, enhance the repulsive interactions between thecolloid probe and the surface of the modified mem-brane. In addition, at pH 5, there is practically noelectrostatic interaction because this pH is close tothe isoelectric point of the protein (the net charge isaround zero) and, therefore, the electrostatic repulsionis negligible. As at pH 5 the protein has no net chargeso the structure of the protein is more compact and ithas hydrophobic properties, such interaction may belead to high adhesion at pH 5 than at pH 3.
1.16.5.2.2 Effect of ionic strength
Normalized adhesion forces versus normalized load-ing forces for interactions involving the modifiedPES membrane are shown in Figure 16 at differentsolution ionic strengths. An increase in adhesionforce with increased ionic strength is evident.
1.16.5.2.3 Comparison of (bio)adhesionforce measurements between unmodified
membranes and membranes modified with
qDMAEMA
The normalized adhesion forces at the same loadingforce (loading force¼ 80 mN m�1) for initial and mod-ified PES membranes with qDMAEMA are shown in
Figure 17. It is clear that the unmodified membrane hasa higher adhesion force than the modified membranesat pH 3 and pH 5, while the lowest adhesion wasobserved at pH 7. In addition, at pH 3, modified mem-brane with the lowest DM exhibits the lowest adhesion.At pH 5, modified membrane with DM of 510mg cm�2
showed the lowest adhesion force, while both mem-branes show almost the same adhesion at pH 7 [44].
The BSA-functionalized probe and both modifiedand unmodified membranes all possess a positivesurface charge at pH 3. However, the qDMAEMA-functionalized membrane possesses a markedlygreater charge than the unmodified PES membrane.The resulting greater electrostatic repulsionaccounts for the greater adhesive forces observedwith the initial unmodified PES membrane thanwith the modified membrane. When the surroundingsolution is at pH 7, both the initial PES membraneand BSA possess negative surface charges, with theqDMAEMA membrane still carrying a positivecharge. This accounts for the modified membranehaving a greater adhesive force with the BSA-coatedprobe than the unmodified membrane.
The adhesion force measured between BSA-coated colloid and modified PES membranes isshown in Figure 18. The adhesion force for all theinvestigated membranes was found to increase withincreasing solution ionic strength.
The modified membrane with DM 367 mg cm�2
demonstrated the lowest adhesion force followed by
Loading force (mN m–1)
0 20 40 60 80 100 120
Adh
esio
n fo
rce
(mN
m–1
)
0
2
4
6
8
10
1 mM NaCl10 mM NaCl100 mM NaCl
Figure 16 Adhesion and loading forces between bovine serum albumin (BSA)-coated silica probe and quaternary
2-dimethyl-aminoethylmethacrylate (qDMAEMA)-modified PES membrane in solutions of differing ionic strengths.
The Use of Atomic Force Microscopy in Membrane Characterization 351

the initial membrane which shows an increase in
adhesion force compared to modified membrane
with medium DM.
References
[1] Hansma, H. G., Sinsheimer, R. L., Groppe, J., et al.Scanning 1993, 15(5), 296–299.
[2] Hansma, H. G., Cleveland, J. P., Radmacher, M., et al.Appl. Phys. Lett. 1994, 64(13), 1738–1740.
[3] Zhong, Q., Inniss, D., Kjoller, K., Elings, V. Surf. Sci. Lett.1993, 290(1–2), L688–L692.
[4] Schmitz, I., Schreiner, M., Friedbacher, G.,Grasserbauer, M. Appl. Surf. Sci. 1997, 115, 190–198.
[5] McLean, R. S., Sauer, B. B. Macromolecules 1997, 30,8314–8317.
[6] Loos, J. Adv. Mater. 2005, 17, 1821–1833.[7] Luthi, R., Meyer, E., Howald, L., et al. J. Vac. Sci. Technol.
B 1994, 12(3), 1673–1676.[8] Kaliapan, S. K., Capella, B. Polymer 2005, 46,
11416–11423.[9] Domke, J., Radmach, M. Langmuir 1998, 14,
3320–3325.
Ionic strength (mM)
0.1 1 10 100
Adh
esio
n fo
rce
(mN
m–1
)
0
10
20
30
40
50
60Initial PESModified PES DM = 202 µg cm–2
Modified PES DM = 367 µg cm–2
Modified PES DM = 510 µg cm–2
Figure 18 Comparison of adhesion forces measured between a bovine serum albumin (BSA)-coated silicon probe and
modified and unmodified membrane surfaces as a function of ionic strength.
pH
1 2 3 4 5 6 7 8 9
Adh
esio
n fo
rce
(mN
m–1
)
0
2
4
6
8
10
12Initial PESModified PES DM = 202 μg cm–2
Modified PES DM = 367 μg cm–2
Modified PES DM = 510 μg cm–2
Figure 17 Comparison of measured adhesion forces of bovine serum albumin (BSA)-modified silica probes to unmodified
and modified membranes at different environmental pH values.
352 Membrane Characterization

[10] Plassard, C., Lesniewska, E., Pochard, I., Nonat, A.Ultramicroscopy 2004, 100, 331–338.
[11] Vinckier, A., Heyvaert, I., D’Hoore, A., et al.Ultramicroscopy 1995, 57, 337–343.
[12] Dulinska, I., Targosz, M., Strojny, W., et al. J. Biochem.Biophys. Methods 2006, 66, 1–11.
[13] Weisenhorn, A. L., Maivald, P., Butt, H.-J., Hansma, P. K.Phys. Rev. B 1992, 45(19), 11226–11233.
[14] Roberts, C. J. Eur. J. Pharm. Sci. 2005, 24, 153–157.[15] Kapple, M., Butt, H.-J. Part. Part. Syst. Charact. 2002, 19,
129–143.[16] Bowen, W. R., Hilal, N., Lovitt, R. W., Wright, C. J. Colloids
Surf. A 1999, 157, 117–125.[17] Eve, J. K., Patel, N., Luk, S. Y., Ebbens, S. J.,
Roberts, C. J. Int. J. Pharm. 2002, 238, 17–27.[18] Xu, L., Logan, B. E. Langmuir 2004, 20, 8817–8822.[19] Burnham, N. A., Dominguez, D. D., Mowery, R. L.,
Colton, R. J. Phys. Rev. Lett. 1990, 64(16), 1931–1934.[20] Davies, M., Brindley, A., Chen, X., et al. Pharm. Res. 2005,
22(7), 1158–1166.[21] Gillies, G., Kapple, M., Butt, H.-J. Langmuir 2005, 21,
5882–5886.[22] Hartley, P. G., Grieser, F., Mulvaney, P., Stevens, G. W.
Langmuir 1999, 15, 7282–7289.[23] Allen, S., Chen, X., Davies, J., et al. Biochemistry 1997,
36, 7457–7463.[24] Best, R. B., Brockwell, D. J., Toca-Herrerra, J. L., et al.
Anal. Chim. Acta 2003, 479, 87–105.[25] Clarke, J., Williams, P. M. Unfolding Induced by
Mechanical Force. In Protein Folding Handbook. Part 1;Buchner, J., Kiefhaber, T., Eds.; Wiley-VCH: Weinheim,2005; pp 1111–1142.
[26] Rief, M., Gautel, M., Oesterhelt, F., Fernandez, J. M.,Gaub, H. E. Science 1997, 276, 1109–1113.
[27] Higgins, M. J., Proksch, R., Sader, J. E., et al. Rev. Sci.Inst. 2006, 77, 013701.
[28] Ducker, W. A., Senden, T. J., Pashley, R. M. Nature 1991,353, 239–241.
[29] Ducker, W. A., Senden, T. J. Langmuir 1992, 8(7),1831–1836.
[30] Gotzinger, M., Peukert, W. Powder Technol. 2003, 130,102–103.
[31] Li-Chong, X., Logan, B. E. Environ. Sci. Technol. 2005, 39,3592–3600.
[32] Gillies, G., Prestidge, C. A. Langmuir 2005, 21,12342–12347.
[33] Reitsma, M., Craig, V., Biggs, S. Int. J. Adhes. Adhes.2000, 20, 445–448.
[34] Castro, L. B. R., Kapple, M., Petri, D. F. S. Langmuir 2006,22, 3757–3762.
[35] Hilal, N., Bowen, W. R. Desalination 2002, 150, 289–295.[36] Bowen, W. R., Hilal, N., Lovitt, R. W., Wright, C. J. Colloids
Surf. A 1998, 136, 231–234.[37] Li, X., Logan, B. E. Langmuir 2004, 20, 8817–8822.[38] Barrow, M. S., Bowen, W. S., Hilal, N., et al. Proc. R. Soc.
Lond. Ser. A 2003, 459, 2885–2908.[39] Notley, S. M., Biggs, S., Craig, V. S. J. Rev. Sci. Inst. 2003,
74(9), 4026–4032.[40] Bowen, W. R., Hilal, N., Lovitt, R. W., Williams, P. M. J.
Membr. Sci. 1996, 110, 233–238.[41] Bowen, W. R., Hilal, N., Lovitt, R. W., Williams, P. M. J.
Membr. Sci. 1996, 110(2), 229–232.[42] Hilal, N., Al-Khatib, L., Al-Zoubi, H., Nigmatullin, R.
Desalination 2005, 185, 1025–1035.[43] Bowen, W. R., Hilal, N., Lovitt, R. W., Sharif, A. O.,
Williams, P. M. Atomic Force Microscope Studies of MF,UF and NF Membranes: Force Measurement andImaging in Electrolyte Solutions. In Euromembrane 97:Progress in Membrane Science and Technology;Kemperman, A. J. B., Koops, G. H., Eds.; University ofTwente: Enschede, The Netherlands, 1997, p 281.
[44] Al-Khatib, L. Development of (Bio)Fouling ResistantMembranes for Water Treatment Applications. PhDThesis, School of Chemical, Environmental and MiningEngineering, University of Nottingham, UK, 2006.
[45] Toikka, G., Hayes, R. A., Ralston, J. J. Colloid InterfaceSci. 1996, 180, 239–248.
[46] Bowen, W. R., Hilal, N., Lovitt, R. W., Wright, C. J. J.Membr. Sci. 1998, 139(2), 269–274.
[47] Bowen, W. R., Hilal, N., Lovitt, R. W., Wright, C. J. ColloidsSurf. A 1998, 136(1–2), 231–234.
[48] Xu, L.-C., Vadillo-Rodriguez, V., Logan, B. E. Langmuir2005, 21, 7491–7500.
[49] Kuzmenko, D., Arkhangelsky, E., Belfer, S., Freger, V.,Gitis, V. Desalination 2005, 179(1–3), 323–333.
[50] Brant, J. A. Environ. Eng. Sci. 2002, 19(6), 413–427.
The Use of Atomic Force Microscopy in Membrane Characterization 353

Biographical Sketches
Professor Nidal Hilal is currently the director of the Centre for Clean Water Technologies at the University ofNottingham in the United Kingdom. He obtained his PhD in chemical engineering from the University ofWales in 1988. In addition to 3 years of industrial experience, he has worked continuously in academia sincegraduation in 1981. Over the years, he has made a major contribution becoming an internationally leadingexpert in the application of atomic force microscopy to chemical and process engineering, particularly inmembrane separation. In recognition of this, he has been awarded a DSc degree from the University of Wales in2005. The world-leading reputation for research that Professor Hilal has earned in the fields of membranetechnology and water treatment has been formally recognized by the award of the Kuwait Prize of AppliedScience for Water Resources Development in the Arab World for the year 2005. He is also a member of theeditorial board for desalination and desalination and water treatment journals, on the advisory board of LifeboatFoundation, a member of the project advisory board of the Middle East Desalination Centre, on the panel ofreferees for the research councils in the UK, Canada, Finland, and Norway and has published articles in morethan 59 international journals. Professor Hilal has authored over 300 refereed publications, 4 textbooks, and 11invited chapters in international handbooks. He is a registered European Engineer – Paris, a chartered engineerin the United Kingdom, and fellow of the Institution of Chemical Engineers – London.
Dr. Daniel Johnson is currently a postdoctoral researcher at the Centre for Clean Water Technologies at theUniversity of Nottingham. He studied for his PhD in the Laboratory of Biophysics and Surface Analysis in theSchool of Pharmacy at the University of Nottingham. He currently undertakes research into interaction forcesbetween colloidal particles and surfaces and in the characterization of water treatment membranes using atomicforce microscopy.
354 Membrane Characterization

Index to Volume 1
The index is in letter-by-letter order, whereby hyphens and spaces within index headings are ignored in thealphabetization, and it is arranged in set-out style, with a maximum of four levels of heading. Page numberssuffixed by f or t refer to figures or tables respectively.
3DFD see three dimensional fiber deposition
A
acidic fuel cells, plasma membranes, 183acrylic acid
plasma grafting on PAN membranes, 176f, 175–176plasma polymerization versus plasma grafting on PSU
membranes, 177f, 177vapor plasma membrane treatment, 169f, 177f, 169
activated carbon, precursors for carbon membrane preparation, 277activated diffusion, gas transport mechanisms, 33f, 35active transport, biological membranes, 6f, 6addition polymerization, 131addition polynorbornenes (APNBs), 140f, 138, 143f, 132,
132f, 143, 139t, 141tadhesion to membrane surfaces, colloids, atomic force microscopy,
349, 349f, 350f, 350, 350f, 351f, 352f, 351, 352fadsorbents, functionalized membranes, 14, 15AFCs see alkaline fuel cellsAFM see atomic force microscopyaging of membranes
addition polynorbornenes, 141carbon membranes, 287f, 287, 275mechanical characterization, failure envelopes, 334f, 334
alkaline fuel cells (AFCs)plasma membranes, 188see also solid alkaline membrane fuel cells
amine group coupling, functionalized carbon nanotube membranes,298f, 297
amorphous perfluoropolymer membranes, 147–158advantages, 147applications, 148hydrophilic, 152, 148hydrophobic, 148
amorphous polymerssorption of gases and vapors, 79f, 80f, 78, 79see also glassy polymers; rubbery polymers
amorphous silica films, plasma deposition, 165f, 166f, 168famphipathic molecules, biological membranes, 3anion-exchange membranes, 93–94, 110
annealing, atomic scale simulation, 65anodic oxidation process, inorganic membrane preparation, 231antibiotics, loaded membranes, supercritical-induced phase
separation, 211f, 212f, 211antifouling strategies
nanofiltration membranes, 116see also quaternary 2-dimethyl-aminoethylmethacrylate
APNBs see addition polynorbornenesaquaporins, 1
biological membranes, 5f, 5–6biomimetic artificial membranes, 8–9
aqueous solutions, atomic force microscopy of membranes, 347f,348f, 347
aromatic polyamide membranes, solvent resistance, reverse osmosis,113–114
artificial membranesproperties compared to biological membranes, 1see also bioartificial synthetic membranes; biomimetic artificial
membranesasymmetric membranes, 92
inorganic, 227f, 227preparation, 100f, 99
composite structures, 107f, 108f, 95, 103, 107, 100–101diffusion-induced phase separation process, 101phase-inversion techniques, 101, 100–101temperature-induced phase separation process, 102
atomic force microscopy (AFM), 337–354advantages, 338colloid adhesion, 349, 349f, 349, 350f, 350, 351f, 352f, 351colloid probes, 342f, 342, 349contact mode imaging, 339, 337force sensors, 341f, 341imaging modes, 339f, 339intermittent contact mode, 340, 337membranes in liquid, 347f, 347, 348fmembrane surface visualization, 346t, 343f, 344f, 345f, 346f,
343, 348fnoncontact mode, 340, 337principles, 338f, 338, 339fstructural characterization methods, 317t, 316f, 317f, 313, 314
atomic scale simulations, 71f, 64, 70–71
355

atomistic reconstruction, inorganic membrane materials, 64attenuated total reflectance (ATR), Fourier transform infrared
spectroscopy, 330t, 329f, 330f, 328average pore radius, atomic force microscopy, 346t, 343
B
bacteriacarbon nanotube membrane separation, 303filtration membranes, 323tracer retention measurement, 323t, 323
batteries, plasma membranes, 178, 180fbicyclo[2.2.1]hept-2-ene see norbornene polymersbi-liquid (liquid–liquid) porometry technique, membrane
characterization, 319f, 318bimetallic nanoparticles, functionalized membranes catalytic
applications, 24f, 23binary systems, Fick’s law, 76binodal curves, 205f, 200, 206f, 204–205, 208, 199bioadhesion to membrane surfaces, atomic force microscopy, 349,
349f, 349, 350f, 350, 351f, 352f, 351, 352fbioartificial synthetic membranes, 1biocatalytic membranes, biomimetic artificial membranes, 9f, 9–10biocompatibility, inorganic membranes, 219biological membranes, 1–12, 1
active transport, 6f, 6bulk transport, 7f, 6functions, 5passive transport, 5f, 5plant defense mechanisms, 7, 8fproperties, 1structure and function, 2f, 2
biomimetic artificial membranes, 1–12, 8, 2aquaporin water channels, 9carbon nanotube membranes, 300f, 299–300immobilized enzymes, 9f, 9–10
biomimetic membrane systems, 8, 1block copolymers
gas separation membranes, 118next generation membranes, pressure driven
processes, 120f, 120, 121template-mediated layers, inorganic membrane preparation,
241f, 241BM see Brownian motionBondi method, free volume estimation, norbornene polymers, 140bovine serum albumin (BSA), membrane adhesion measurement,
atomic force microscopy, 349, 349f, 350f, 350, 351f, 352f, 351Brownian motion (BM), porous material modeling, 48f, 47BSA see bovine serum albuminbubble point method, pore characterization, 318bulk diffusion, gas transport mechanisms, 33f, 34
C
CA see cellulose acetatecalcination, inorganic membrane preparation, 220, 231, 223, 218CAP see competitive ablation and polymerizationcapillary elevation balance, hydrophilicity assessment, 327capillary flow, gas transport mechanisms, 33f, 36capillary membranes, preparation, 100fcapillary and spherical chamber network structure, pore modeling,
42–43capillary tubes, inorganic membrane preparation, 227f, 225, 226captive bubble method, contact angle measurement, hydrophilicity
assessment, 327f, 327capture of materials, functionalized membranes, 15, 14carbohydrates, biological membranes, 4carbon aging, carbon membranes, 288
carbon dioxidecapture, gas separation membranes, 117production, membrane versus traditional separation techniques,
147–148see also supercritical carbon dioxide
carbon dioxide plasma treatment, filtration membranes, 172f, 173f,171–172
carbon fillers, polymeric membranes, pressure driven processes, 121carbon layers, inorganic membrane preparation, 242carbon membranes, 275–290
advantages over polymer membranes, 275–276aging phenomenon, 287, 287f, 287classification, 276f, 276fabrication of membrane module, 284t, 284f, 283flat-sheet, 280gas separation, 286t, 284, 285fhollow fiber, 279f, 281pore structure, 280fpore structure/size distribution, 279–280preparation, 276, 277fself-supported, 280supported, 282
carbon molecular sieves (CMSs)membrane preparation, 276, 281fpressure driven processes, 119–120, 121–122, 122
carbon nanotube (CNT) membranes, 291–310advantages, 305–306applications, 306t, 297dense-array outer-wall, 293f, 292, 294functionalized, 298f, 297future directions, 306t, 307f, 305gas/vapor transport, 297liquid transport applications, 300mixed-matrix, 293f, 292, 296open-ended, 293f, 292, 295preparation, 292, 291–292pressure driven processes, 122stimuli-responsive applications, 299template-synthesized, 293f, 292
casting procedurescomposite membrane preparation, 107inorganic membrane shaping, 226f, 230f, 224, 225, 229
catalysts, recovery of transition metals, carbon nanotubemembranes, 304
catalytic functionalizationinorganic membrane preparation, 247f, 246membrane applications, 14, 23
catalytic membranes, see also biocatalytic membranescation-exchange membranes
polymeric membranes, 93–94, 110redox-flow batteries, plasma membranes, 180f, 179
cell membranes see biological membranescellulose, precursors for carbon membrane preparation, 277–278cellulose acetate (CA) membranes
reverse osmosis, 113–114silicalite combination, 118
ceramic foams, inorganic membrane preparation, 228f, 229f,230f, 228
ceramic membraneshollow fiber, 253–273
applications, 267examples, 261mechanical strength, 266f, 266morphology, 264t, 262f, 263f, 264f, 261particles and packing, 254permeation characteristics, 265f, 264precursor spinning, 257f, 258f, 257preparation, 255f, 253–254, 256sintering, 259
356 Index to Volume 1

ceramic powdersmembrane preparation
particle dispersion, 255, 256particle packing, 255f, 254spinning suspension preparation, 254
ceramic slurrydirect foaming method, inorganic membrane preparation, 229hollow beads coating method, inorganic membrane preparation,
229characterization methods, 311–335
atomic force microscopy, 337–354charge characteristics, 326t, 323f, 325f, 324chemical characteristics, 330t, 329f, 330f, 331f, 332f, 328hydrophobic/hydrophilic characteristics, 326f, 327f, 326mechanical characteristics, 333f, 334f, 332structural characteristics, 317t, 312f, 312, 314f, 315f, 316f, 317f,
318f, 319fcharge assessment
definitions, 324membrane characterization, 326t, 323f, 325f, 324
chemical composition, membrane characterization methods, 330t,329f, 330f, 331f, 332f, 328
chemical degradation of membranes, 334see also aging of membranes; solvent resistance
chemical powder preparation, inorganic membrane synthesis, 222chemical stability, inorganic membranes, 219chemical vapor deposition (CVD)
conventional/plasma comparison, 164inorganic membrane preparation, 241, 229posttreatment for carbon membrane preparation, 280see also plasma-enhanced chemical vapor deposition
chloro-organics, dechlorinations, membrane-immobilizednanoparticles, 23, 25f
CIP see cold isostatic pressingclassification see membrane classificationsclean industrial processes, gas separation membranes, 117cleaning protocols, membrane charge (zeta potential) effects, 326t,
325–326CMSs see carbon molecular sievesCNT see carbon nanotubeCobb test, 159cold isostatic pressing (CIP), inorganic membrane shaping, 224colloidal gels, template-mediated layers, inorganic membrane
preparation, 239f, 239colloidal particles, blocking membrane pores, atomic force
microscopy, 344f, 343colloidal sols, sol–gel method, inorganic membrane preparation,
237f, 236colloid probes
atomic force microscopy, 342f, 342, 349, 337BSA adhesion to membranes, 349, 349f, 349, 350f, 350, 351f,
352f, 351, 349, 351column packings, solvent distillation, ceramic hollow fiber
membranes, 269comb copolymers
nanofiltration membranes, antifouling characteristics, 117f,116–117
next generation membranes, 119, 121commercially available membranes
nanofiltration, 116phase-inversion preparation, 104treverse osmosis, 114–115
compartmentalization, plant defense mechanisms, 7competitive ablation and polymerization (CAP), plasma-enhanced
chemical vapor deposition, 162–163composite membranes, asymmetric, preparation, 107f, 108f, 95, 103,
107, 100–101compression-modulated transport, carbon nanotube membranes,
301f, 300
computer-aided reconstructions, pore structures, 31computer technology, modeling and simulations, 31–32condensation
gas transport mechanisms, 33f, 36two-phase lattice-Boltzmann model, 62f, 61
conditioning of glassy polymers, sorption characteristics, 80configurational diffusion, gas transport mechanisms, 33f, 35configurations, synthetic membranes, 92f, 91–92contact angles
capillary elevation balance, hydrophilicity assessment, 327drop profile analysis, hydrophilicity assessment, 326f, 327f, 326influencing factors, 328to hexadecane, amorphous perfluoropolymer membranes,
151t, 151to water, amorphous perfluoropolymer membranes, 151t, 151
contact mode imaging, atomic force microscopy, 339, 337controlled molecular transport, carbon nanotube membranes,
300f, 299conventional chemical vapor deposition, plasma-enhanced
chemical vapor deposition comparison, 164copolymers see block copolymers; comb copolymerscorona discharge, 159course-graining techniques, modeling different scales, 31–32, 70–71critical pore coordination number, ceramic hollow fiber
membranes, 261f, 261critical thickness, inorganic membrane preparation, 218crystallizable polymers, membrane preparation, supercritical
fluids, 206CVD see chemical vapor depositionCyclopore membranes, atomic force microscopy, 343f, 347f, 348f,
343, 347Cytop�, amorphous perfluoropolymers, 147, 149
D
Darcy’s law, water permeability determination, 319Debye length, 159dechlorinations, chloro-organics, membrane-immobilized
nanoparticles, 23, 25fDEFCs see direct ethanol fuel cellsdegradation of membranes
chemical action, 334see also aging of membranes; solvent resistance
degree of modification (DM), membrane surface, atomic forcemicroscopy, 344, 337
demixingsolvent-induced phase separation, 200supercritical-induced phase separation, 206, 208
dense-array outer-wall carbon nanotube membranes, 293f,292, 294
dense membranesceramic hollow fiber, 261structure and function, 93transport mechanisms, 38see also non-porous membranes
density, ceramic hollow fiber sintering, 260f, 259depressurization rate effects, supercritical-induced phase
separation, 209–210desalination
carbon nanotube membranes, 305f, 303reverse osmosis membranes, 113–114
DesalTM five, nanofiltration membranes, 116dicarboximide moieties, metathesis polynorbornenes, 137t, 138t,
138diffusion
binary systems, 76Fick’s law, 76gas transport mechanisms, 33f, 33, 34, 35molecular dynamic simulation, 67
Index to Volume 1 357

diffusion (continued )polymer membranes, 76ternary systems, 77
diffusion coefficientsFick’s law, 76norbornene polymer membranes, 133t, 132–133, 142t, 138,
141, 131diffusion-induced phase separation process, asymmetric membrane
preparation, 101diffusivity see diffusion coefficients; effective diffusivitiesdigitized structure models, porous membranes, 48f, 45dip coating, inorganic membrane preparation, 235, 236–237direct ethanol fuel cells (DEFCs), plasma processes, 182–183direct methanol fuel cells (DMFCs), plasma processes, 182–183direct simulation Monte Carlo (DSMC) method, mesoscopic
transport simulation, 52f, 51dispersants, ceramic membrane preparation, 254, 255, 256dispersion simulations
particle-tracking method, 57f, 58f, 56pore-scale, 54
displacement techniques, structural characterizationmethods, 318, 319f
distillation, ceramic hollow fiber membranes, 270f, 269DM see degree of modificationDMFCs see direct methanol fuel cellsdoctor blading techniques, inorganic membrane shaping, 226f,
225, 227–228Donnan exclusion, carbon nanotube membranes, 303–304Dow Water Solutions, commercial membrane for pressure-driven
processes, 114–115, 116droplet coalescence, lattice-Boltzmann simulation, 63f, 63drop profile analysis, contact angle measurement, hydrophilicity
assessment, 326f, 327f, 326drug-delivery applications, carbon nanotube
membranes, 300f, 299–300drying, inorganic membrane preparation, 231, 238DSMC see direct simulation Monte Carlodusty-gas equations, flux relations modeling, 39–40duty cycle, 159
E
effective diffusivities, trajectory modeling approach, 49felasticity modulus, mechanical characterization of membranes, 333elastomeric polymers, mechanical characterization of membranes,
333f, 333electrical potential
carbon nanotube membranes, 300f, 299see also voltage. . .
electric charge effects, atomic force microscopy of membranes inaqueous solutions, 347f, 347
electric-responsive membranes, pressure driven processes, 125f, 125electrochemically responsive membranes, pressure driven
processes, 125electrochemical membrane reactors, carbon nanotube membranes,
304f, 303electrodialysis, membrane selectivity enhancement by plasma
processes, 178electrokinetic techniques, membrane charge characterization, 325electroless plating, metal layered inorganic membrane preparation,
244f, 244, 218electron cyclotron resonance, 160–161, 159–160electron microscopy, structural characterization methods, 312f, 312electron spectroscopy for chemical analysis (ESCA), membrane
characterization, 332f, 331electro-osmotic flux measurement, membrane charge
characterization, 325electrophoretic deposition, inorganic membrane preparation, 236electrothermal regeneration, aged carbon membranes, 288
elongation curves, mechanical characterization of membranes,333f, 333
emulsification see membrane emulsificationemulsion liquid membranes (ELMs), preparation, 109f, 109energy consumption, membrane versus traditional separation
techniques, 147–148energy production devices see batteries; fuel cellsenzyme immobilization, polymeric membranes, biomimetic
artificial membranes, 9f, 9–10EO see ethylene oxideepoxidation, mechanical characterization of degraded
membranes, 334ESCA see electron spectroscopy for chemical analysisethoxylated nonionic surfactants, capture by PAA functionalized
membranes, 16f, 15, 17fethylene oxide (EO), carbon dioxide permeability characteristics,
gas separation membranes, 118evaporation, two-phase lattice-Boltzmann model, 62f, 61evolution, biological membranes, 1–2exo-polybicyclopentadiene (exo-PBCPD), addition
polynorbornene comparison, 142t, 142expanded ethanol with supercritical CO2, polyvinyl alcohol
membrane preparation, 211f, 210extrusion, inorganic membranes, 225f, 225, 218
F
fabricationcarbon membranes, 284t, 284f, 283inorganic membranes, 223see also nanofabrication methods; preparation
facilitated transport, liquid membranes, 94, 109failure envelopes, mechanical characterization of membranes,
334f, 334Faraday cage, 160fBM see fractional Brownian motionFFV see fractional free volumefiber models, porous membranes, 45fibers, see also hollow fiber . . .Fick’s laws, polymer membranes, 76FilmTec FT-30, reverse osmosis membrane, 114–115FILMTEC NF55/NF70/NF90, nanofiltration membranes, 116filtration coating method, inorganic membrane preparation, 236filtration membranes
characterization methods, 311–335plasma modifications
hydrophilic nature enhancement, 171, 170–171hydrophobic nature enhancement, 177, 170–171
finger-type structuresasymmetric membranes, 100f, 99–100inorganic membranes, 227f, 227
fixed carrier membranes, 94flat membranes
inorganic membrane preparation, 227–228self-supported carbon membranes, 280supercritical fluid-induced phase separation, 204, 211f
flexible plastic polymers, mechanical characterization ofmembranes, 333f, 333
Flory–Huggins thermodynamic model, polymer sorption of gasesand vapors, 79f, 78
flow simulationDSMC method, 52fKnudsen transport modeling, 33lattice-Boltzmann method, 54f, 53
fluid separationdistillation, ceramic hollow fiber membranes, 270f, 269see also gas separation; liquids
fluid–solid separation, transport mechanism modeling, 37
358 Index to Volume 1

fluid transport mechanismsmodeling, 37see also gas transport
fluorocarbon plasma polymers, 163fluoropolymers
semicrystalline versus amorphous, 149, 152see also amorphous perfluoropolymer membranes
flux relations, transport phenomenology modeling, 39foam techniques, inorganic membrane preparation, 228f, 229f,
228, 218foils, metal layered inorganic membrane preparation, 243force sensors, atomic force microscopy, 341f, 341fossil fuels, clean industrial processes, gas separation membranes, 117Fourier transform infrared–attenuated total reflectance
(FTIR-ATR) spectroscopy, membrane chemical analysis, 330t,329f, 330f, 328
fractional Brownian motion (fBM), porous material modeling,48f, 47
fractional free volume (FFV), 131polynorbornene membranes, 134–135, 140
free volume, 160addition polynorbornenes, 138metathesis polynorbornenes, 134plasma polymers, 166theory, polymer membranes, 70
free volume elements (FVEs), addition polynorbornenes, 140f, 139,140
FT-30 membrane, 114–115FTIR-ATR see Fourier transform infrared–attenuated total
reflectancefuel cells
plasma membranes, 182, 183f, 188fsolid oxides, ceramic hollow fiber membranes, 271f, 270
fullerenes, next generation membranes, pressure drivenprocesses, 122
functionalized membranes, 13–28applications, 14f, 13, 14carbon nanotubes, 298f, 297catalytic applications, 14, 23classification, 14inorganic membranes, 220, 245f, 247f, 245material capture, 15f, 15, 14mixed matrix membranes, 118multiple layer, 23t, 22, 22fpolyelectrolytes, 20, 19f, 22, 19preparation, 13separations, 14, 19, 15single layer, 20
FVEs see free volume elements
G
Galden�, amorphous perfluoropolymers, 149t, 147, 149gas adsorption see gas sorptiongas condensation/evaporation, granular medium, lattice-Boltzmann
simulation, 62fgas modeling, ideal gases, flux relations modeling, 39–40gas permeability, amorphous perfluoropolymer membranes, 150t,
151t, 150gas permeances, amorphous perfluoropolymer membranes,
150t, 150gas permeation
ceramic hollow fiber membranes, 265f, 267f, 264plasma polymers, 167polymer membranes, 81
gas-phase deposition, composite membrane preparation, 107gas sensors, plasma membranes, 190f, 191f, 190gas separation (GS)
amorphous perfluoropolymer membranes, 150
carbon membranes, 275–290aging phenomenon, 287, 287f, 287transport properties, 286t, 285f, 284–285
ceramic hollow fiber membranes, 267f, 268f, 267conventional membranes, 117hydrogen production, 147–148membrane preparation, 103–104next generation mixed-matrix membranes, 119–120norbornene polymer membranes, 131–146
gas sorptiongranular medium, lattice-Boltzmann simulation, 62fmetathesis polynorbornenes, 135f, 136f, 134polymer membranes, 78
gas transport propertiescarbon membranes, 286t, 285f, 284–285carbon nanotube membranes, 297fluid transport mechanisms, 33f, 33modeling, 33f, 33
gel casting, inorganic membrane preparation, 230f, 229gel matrix, template-mediated layers, inorganic membrane
preparation, 239f, 239gel transitions, solvent-induced phase separation, 200GE-Osmonics (GE Water Technologies), DesalTM five
nanofiltration membranes, 116glass membranes, preparation, 230–231glass transition temperature (Tg)
amorphous perfluoropolymers, 149, 153, 149tglassy polymers, sorption, 80rubbery polymers, 78substituted metathesis polynorbornenes, 133t, 132
glassy polymerspermeation, gases and vapors, 83f, 83sorption, gases and vapors, 79f, 80f, 79
�-glucoside/�-glucosidase compartmentalization, plantmembranes, 8f, 7
GP see graft polymerizationgraded pore structures, asymmetric membranes, 100f, 99–100grafting, nanofiltration membrane antifouling surface treatment,
116–117graft polymerization (GP)
versus plasma polymerization, 178t, 177f, 177see also plasma-induced graft polymerization
grain growthceramic hollow fiber membranes
preparation, 260f, 260sintering, 260f, 259
grain models, porous membranes, 43granular medium, lattice-Boltzmann simulation, 62f, 63fgreenhouse gases
carbon dioxide capture, gas separation membranes, 117carbon dioxide production, membrane versus traditional
separation techniques, 147–148green product forming, inorganic membrane preparation, 220, 223,
225, 218green technology, clean industrial processes, gas separation
membranes, 117groundwater remediation, membrane-immobilized nanoparticle
dechlorination, 23GS see gas separation
H
hazardous organic material treatment, carbon nanotube membranes,304f, 303
heat treatmentsaged carbon membranes, 288inorganic membrane preparation, 220, 231, 233, 238
heavy metalsion capture, functionalized membranes, 15
Index to Volume 1 359
heavy metals (continued )ionic solute rejections, functionalized membranes, 20
helix–coil transitions, polyelectrolyte functionalization, 20f, 19–20Henry’s law, polymer sorption of gases and vapors, 79, 80hexmethyldisiloxane (HMDSO), plasma polymers, 165f, 166f, 168f,
165–166HMDSO see hexmethyldisiloxanehollow bead method, inorganic membrane preparation, 229f, 229hollow fiber membranes
ceramic, 253–273applications, 267examples, 261morphology, 264t, 262f, 263f, 264f, 261precursor spinning, 257f, 258f, 257preparation, 225, 226, 230–231, 255f, 253–254, 256sintering, 259
contactors, solvent distillation, 270f, 269glass, 230–231inorganic membrane preparation, 227f, 225, 226, 230–231self-supported carbon membranes, 279f, 281, 282fsupported liquid membrane preparation, 109f
homogeneous dense membranes, structure and function, 93homogeneous ion-exchange membranes, preparation, 110homogeneous polymer layers, composite membranes, 103–104homogeneous solid membranes, preparation, 108homogeneous structure, inorganic membranes, 227f, 227Hooke’s law, atomic force microscopy, 342, 337hybrid membranes, functionalized, 14hydraulic permeability determination, membrane
characterization, 319hydrophilicity enhancement, filtration membranes, plasma
processes, 171hydrophilic membranes, amorphous perfluoropolymers, 152, 148hydrophobicity enhancement
filtration membranes, plasma processes, 177inorganic membrane preparation, 245f, 245
hydrophobicity/hydrophilicitydetermination, 326f, 327f, 326electric bias change, carbon nanotube membranes, 299
hydrophobic membranes, amorphous perfluoropolymermembranes, 148
Hyflon� AD, hydrophobic amorphous perfluoropolymers, 152f,147, 148
Hyflon� ion, hydrophilic amorphous perfluoropolymers, 152f,147, 153
hypochlorite treatment, mechanical characterization of degradedmembranes, 334
I
ICIMs see International Conference on Inorganic Membranesideal gases, flux relations modeling, 39–40idealistic membranes, modeling and manufacture, 41–42infrared absorption
membrane chemical analysis, 330tsee also Fourier transform infrared. . .
inorganic membranes, 94advantages over polymers, 219applications, 219atomistic reconstruction of materials, 64organically modified, 121preparation, 217–252, 221f
calcination, 231functionalization, 245layer deposition, 234principles, 221f, 219shaping, 223sintering, 232starting powders, 221
temperature treatments, 231pressure driven processes, 121structure, 220f, 227f, 220, 241f, 234, 227
integral asymmetric membranespreparation, 101, 100–101
see also phase-inversion processintegral proteins, biological membranes, 2f, 5f, 4, 6, 1interaction force sensors, atomic force microscopy, 341f, 341,
349, 350interaction parameters, 200, 208, 199interfacial polymerization, composite membrane preparation, 108f,
107, 107–108intermittent contact (tapping) mode imaging, atomic force
microscopy, 337International Conference on Inorganic Membranes (ICIMs), 219in vivo membrane systems
in vitro simulations, 8plant defense mechanisms, 7
ion-conductive plasma membranes, fuel cells, 186ion-exchange membranes, 93
polyelectrolytes, 19f, 19preparation, 110
ion-exchange resins, 110ionic conducting membranes, dense membrane transport
mechanisms, 38ionic solute rejections, single layer polyelectrolyte functionalized
membranes, 21t, 20ionic strength effects, atomic force microscopy, 347f, 348f, 350, 350f,
350, 347ionization degree, 160ion pumps, biological membranes, 6f, 6ion rejection, carbon nanotube membranes, 305f, 303–304ion-sensitive sensors, plasma membranes, 189
K
Kn see Knudsen numberKnudsen diffusion, carbon nanotube membrane comparison, 298,
299Knudsen number (Kn), gas transport modeling, 33, 54Knudsen transport, gas transport modeling, 33f, 33
L
Langmuir sorption mode, polymer membranes, 80f, 80lattice-Boltzmann simulation
flow in porous membranes, 54f, 53, 55, 56two-phase flow with phase change, 60f, 62f, 63f, 59
lattice gas model, 53, 59–60layer-by-layer (LbL) assembly technique, polyelectrolyte
functionalized membranes, 22, 22flayer deposition, inorganic membrane preparation, 234LbL see layer-by-layerLCST see lower critical solution temperatureleaching techniques
inorganic membrane preparation, 230polymer membrane preparation, 96, 98
Li-ion batteries see lithium ion batterieslipid bilayer, biological membranes, 3lipids, biological membranes, 2, 3liquid crystals, template-mediated layers, inorganic membrane
preparation, 240f, 239–240liquid–liquid (bi-liquid) porometry technique, membrane
characterization, 319f, 318liquid–liquid (L–L) demixing gap, phase separation, 200, 204–205,
208liquid membranes, 94
preparation, 109f, 109
360 Index to Volume 1

liquidsmembrane surface imaging, atomic force microscopy, 347f, 347,
348fpermeation through polymer membranes, 84pervaporation, polymer membranes, 85reverse osmosis, polymer membranes, 85f, 85separation, plasma modification of filtration membranes, 170, 171transport, carbon nanotube membranes, 292f, 292t, 291, 300
liquid solvent effectssupercritical-induced phase separation, 209f, 208see also solvent-induced phase separation
lithium ion (Li-ion) batteries, plasma membranes, 181L–L see liquid–liquidloaded membranes, supercritical fluid-induced phase separation,
211f, 211, 212flog removal value (LRV), microorganism filtration membrane
characterization, 323lower critical solution temperature (LCST), thermal-responsive
membranes, 124f, 123–124low frequency discharge, plasmas, 160–161LRV see log removal valueLSCF (La1-xSrxCo1-yFeyO3-�), ceramic hollow fiber membranes,
267f, 267, 261
M
macroscopic scale modeling, 31–32, 71f, 70–71magnetrons, 160–161, 160mass transfer
carbon nanotubes, 292f, 291, 300–302sintering, ceramic hollow fiber membrane preparation, 260t,
259–260mass transfer coefficients, tracer retention determination
techniques, 322f, 322material capture applications, functionalized membranes, 15f, 15, 14Maxwell–Stefan equations, polymer membranes, 77MD see molecular dynamicmean free path, 160mean residence time (MRT), molecular dynamic simulation, 68mean-square displacement method, trajectory modeling approach,
50–51mechanically regulated transport, carbon nanotube membranes,
301f, 300mechanical properties
atomic force microscopy, 341f, 341biological versus artificial membranes, 1ceramic hollow fiber membranes, 266f, 266inorganic membranes, 219membrane characterization methods, 333f, 334f, 332membrane structure, 96
membrane classifications, 92f, 91, 93fcarbon membranes, 276f, 276functionalized membranes, 14
membrane cleaning protocols, 326t, 325–326membrane contactors (MCs)
hollow fiber/tubular membranes, solvent distillation, 270f, 269solvent distillation, hollow fiber membranes, 270f, 269
membrane emulsification (ME), lattice-Boltzmann simulation, 62f,61–62
membrane foulingasymmetric versus symmetric membranes, 100atomic force microscopy, 338, 344f, 343, 344cleaning protocols, 326t, 325–326membrane charge (zeta potential) effects, 325f, 325nanofiltration membranes, 116plasma modified polysulfone protein filtration membranes, 175fpore-scale simulation, 58resistance determination, 319
membrane-immobilized enzymes, biomimetic artificial membranes,9f, 9–10
membrane-immobilized nanoparticles, chloro-organicdechlorinations, 23, 24f, 25f
membrane module fabrication, gas separation carbon membranes,284t, 284f, 283
membrane posttreatment, 275carbon membranes, 280, 275
membrane precursors, 275carbon membranes, 277, 276ceramic hollow fibers, 257f, 258f, 257
membrane preparation see preparationmembrane pretreatment, 275membrane process classification, 93fmembrane properties
characterization methods, 311–335materials and structures, 95
membrane reactors, carbon nanotube membranes, 304f, 303membrane regeneration, electrochemistry, carbon nanotube
membranes, 303mercury intrusion method, pore characterization, 318mercury ion capture, functionalized membranes, 17–18mesoscopic transport simulation, 48mesostructured titania layers, copolymer template-mediated,
inorganic membrane preparation, 241f, 241metal catalyst recovery, carbon nanotube membranes, 304metal ion capture, functionalized membranes, 15metal layered inorganic membrane preparation, 244f, 243metal membranes
homogeneous solid membranes, 108leaching preparation method, 231
metal nanoparticles, functionalized membranes, 23, 24f, 23metal-organic frameworks (MOFs), gas separation, 119–120metal oxides, sol–gel layers, inorganic membrane preparation,
238, 236metal toxins, ionic solute rejections, functionalized membranes, 20metathesis, see also ring opening metathesis polymerizationmetathesis polynorbornenes (MPNBs), 133t, 135f, 136f, 132, 140f,
132, 143f, 132f, 143methane coupling, ceramic hollow fiber membranes, 268f, 267, 268microcavities
addition polynorbornenes, 139metathesis polynorbornenes, 134–135see also free volume elements
microfiltration membranes, atomic force microscopy, 343f, 344f, 343microfluidic devices, carbon nanotube interfaces, 306f, 304–305micro-organisms
carbon nanotube membrane separation, 303filtration membranes, 323tracer retention measurement, 323t, 323
microscopystructural characterization methods, 312, 318see also atomic force microscopy; electron microscopy; near field
microscopymicrostructure, ceramic hollow fiber membranes, 260microwave frequency discharge, plasmas, 160–161milling, powder preparation for inorganic membranes, 221mixed-matrix membranes
carbon fillers, 122carbon nanotube membranes, 293f, 292, 296functionalized membranes, 14, 17f, 18fgas separation, 118next generation, 119
mixed polymer membranes, supercritical-induced phaseseparation, 210
modeling, 29–74approaches, 39fluid–solid separations, 37functionalized membranes, 18, 19f, 25f, 24
Index to Volume 1 361

modeling (continued )gas transport mechanisms, 33f, 33
MOFs see metal-organic frameworksmolecular diffusion see diffusionmolecular dynamic (MD) simulations
carbon nanotube membranes, 291, 305f, 297–298, 302diffusion, 67
molecular imprinted membranes, pressure driven processes, 120molecular sieving
carbon membrane mechanisms, 285f, 285gas transport mechanisms, 33f, 36mixed matrix membranes, 118properties, tracer retention techniques, 320t, 323t, 321f, 322f, 319see also carbon molecular sieves
molecular simulations, 31diffusion, 67inorganic membranes, 64polymers, 69
molecular weight cut-off (MWCO), tracer retention techniques,321f, 321
monomer fragmentation, plasma-enhanced chemical vapordeposition, 163f, 163
monovalent cation permselectivity, plasma membranes, redox-flowbatteries, 180f, 179
Monte Carlo methodmesoscopic transport simulation, 52f, 51sorption simulation, 65
MPNBs see metathesis polynorbornenesMRT see mean residence timemultiple layers
functionalized membranes, 23t, 22, 22finorganic membranes, 220f, 220, 234, 227
multiscale approaches, modeling and simulation, 31–32, 71f, 70, 39multiwalled carbon nanotube (MWCNT), 291, 300–302, 302MWCNT see multiwalled carbon nanotube
N
Nafion�sulfonic perfluorinated polymer, 147, 152surface modification by plasma processes, 184
nanofabrication methods, next generation membranes, pressuredriven processes, 125–126
nanofiltration (NF) membranesatomic force microscopy, 344f, 343–344pressure driven processes, 115
nanofluidics, carbon nanotube membranes, 291nanomaterials, multiscale modeling, 70–71nanometer thick films, plasma polymers, 164f, 164nanoparticles
functionalized membranes catalysts, 23, 24f, 25f, 23grain packing, membrane modeling, 44–45membrane-immobilized, chloro-organic dechlorinations, 23,
24f, 25fnanoporous membranes, addition polynorbornenes, 140–141nanotubes see carbon nanotube membranesnear field microscopy, structural characterization methods, 317t,
315f, 316f, 313, 317fneutral molecules, multilayer polyelectrolyte functionalized
membranes, 22next generation membranes, pressure driven processes, 119NF see nanofiltrationNi–Cd batteries see nickel–cadmium batteriesnickel–cadmium (Ni–Cd) batteries, plasma membranes, 178noncontact mode imaging, atomic force microscopy, 337nonideal fluids, lattice-Boltzmann simulation, 61nonideal gas mixtures, flux relations modeling, 40nonionic surfactants, capture by PAA functionalized membranes,
16f, 17f, 15
non-oxidative coupling of methane (non-OCM), SCYb hollow fibermembranes, 268f, 269f, 268
non-porous membranes, 93ceramic hollow fiber dense membranes, 261composite membrane homogeneous polymer layers, 103–104homologous solid membrane preparation, 108polymer characteristics, 95structure and function, 93ftransport mechanisms, 38
norbornadiene polymers, norbornene polymer comparison, 133t, 133norbornene polymers
addition type, 140f, 138, 143f, 132, 132f, 143, 139t, 141tgas separation membranes, 131–146membrane properties, 143f, 143metathesis type, 135f, 136f, 132, 140f, 132, 143f, 132f, 143
O
OCM see oxidative coupling of methaneopen-ended carbon nanotube membranes, 293f, 292, 295ordered porosity, template-mediated layers, inorganic membrane
preparation, 240f, 241f, 239ordinary diffusion, gas transport mechanisms, 33f, 34organic additives, inorganic membrane preparation, 223, 236organically modified inorganic membranes, pressure driven
processes, 121organic–inorganic membranes
mixed matrix membranes, 118pressure-driven processes, 113–129self assembly, 121
organic templates, inorganic membrane preparation, 228f, 230f,239f, 228, 239
organochlorine see chloro-organicsosmotic. . ., see also reverse osmosisosmotic power plants, 115f, 115overlapping pores, modeling, 42oxidation
posttreatment for carbon membranes, 280precursor pretreatment for carbon membrane preparation, 278
oxidative coupling of methane (OCM), LSCF hollow fibermembranes, 268f, 267
oxygen permeation, amorphous perfluoropolymer membranes,151t, 151
oxygen separation, LSCF hollow fiber membranes, 267f, 268f, 267
P
P see permeability coefficientPAA see poly(acrylic acid)P-AA see poly(amino acid)palladium/alloy layers, inorganic membrane preparation, 244f, 243PALS see positron annihilation lifetime spectroscopyPAN see polyacrylonitrileparallel pores, modeling, 41–42, 42particle-tracking method, dispersion simulation, 57f, 58f, 56passive transport, biological membranes, 5f, 5paste preparation, inorganic membrane shaping, 223PBCPD see polybicyclopentadienePDMS see polydimethylsiloxanePECVD see plasma-enhanced chemical vapor depositionPEMFCs see proton exchange membrane fuel cellsperfluorinated amorphous glassy polymers, 147, 148f, 148–149, 149perfluoropolymer membranes see amorphous perfluoropolymer
membranespermeability
addition polynorbornenes, 141t, 142t, 141carbon membranes, 285, 287–288membrane preparation, 95metathesis polynorbornenes, 133t, 137t, 132–133, 133–134
362 Index to Volume 1

mixed-matrix membranes, gas separation, 118–119permeability coefficient (P), 133t, 132–133, 131permeation
gases through polymer membranes, 81glassy polymers, 83f, 83rubbery polymers, 82f, 81semi-crystalline polymers, 81
liquids through polymer membranes, 84pervaporation, 85reverse osmosis, 85f, 85
permselectivity, membrane preparation, 95perovskite membranes, 94pervaporation membranes
composite membrane preparation, 103–104plasma polymers, 169f, 170f, 171f, 169polymer membranes, 85
PES see polyethersulfonepetrochemical industry, solvent distillation, ceramic hollow fiber
membranes, 270f, 269PFA see polyfurfuryl alcoholpharmaceuticals
antibiotic loaded membranes, 211f, 212f, 211transdermal drug-delivery applications, carbon nanotube
membranes, 300f, 299–300phase change, two-phase flow, lattice-Boltzmann simulation, 60f,
62f, 63f, 59phase diagrams
polymer phase separation, 205f, 200, 204–205supercritical-induced phase separation, 206f
phase-inversion processasymmetric membrane preparation, 104t, 101, 100–101, 103ceramic hollow fiber membrane preparation, 253–254, 258,
254–255inorganic membrane preparation, 218microporous membrane preparation, 103fphenomenological description, 102porous polymeric membranes for pressure-driven processes,
113rationalization, 102suspension-spinning combination, 227f, 226symmetric porous membrane preparation, 104t, 99f, 98, 103
phase separation processesasymmetric membrane preparation, 101, 102diffusion-induced, 101inorganic membrane preparation, 230–231polymer membrane preparation, 200solvent-induced, 200supercritical-induced, 200temperature-induced, 102
pH effectsatomic force microscopy, 349, 350f, 350, 347membrane charge characterization, 325f, 325plasma modified polysulfone filtration membranes, 172f
phenol formaldehyde, precursors for carbon membrane preparation,277–278
phenolic resins, precursors for carbon membrane preparation,277–278
phenomenology, flux relations modeling, 39phospholipids, biological membranes, 2f, 3photodegradation, polysulfone membranes under plasma
treatments, 176f, 173–174photo-responsive membranes, pressure driven processes, 125f, 125physical aging phenomena, carbon membranes, 287f, 287, 275phytoalexins, 7, 1phytoanticipins, 7, 1PI see polyimidePIMs see polymers of intrinsic microporosityplant defense mechanisms, biological membranes, 7, 8fplasma chemistry, 160
plasma-enhanced chemical vapor deposition (PECVD), 163f, 164f,165f, 162, 161, 192–193
porous plasma membranes, 192f, 190–191, 191sensor membranes, 190
plasma-induced graft polymerization, 178t, 171f, 162, 176f, 177f,169, 175–176, 177
plasma ion-conductive membranes, fuel cells, 186plasma materials, quartz crystal microbalance combination, 191f, 190plasma membranes, 159–197
energy-production devices, 178fuel cells, 182, 183f, 188fnew coupled methods, 191porous membranes, 190porous silica/hybrid membranes, 191rechargeable batteries, 178sensors, 189, 190ftubular membranes, 192f, 193f, 190
plasma polymerizationfiltration membranes
hydrophilicity enhancement, 177hydrophobicity enhancement, 177
plasma-enhanced chemical vapor deposition, 163f, 162, 161plasma polymers (PPs)
applications, 167deposition mechanism, 162gas permeation, 167liquid separation, 170pervaporation, 169f, 170f, 169, 171fseparation applications, 167structural properties, 164transport properties, 166versus graft polymerized membranes, 178t, 177f, 177
plasma processes, 160hydrophilicity enhancement of filtration membranes, 171hydrophobicity enhancement of filtration membranes, 177selectivity enhancement of electrodialysis membranes, 178
plasma reactors, 160–161, 172f, 171–172plasma treatments, 162, 163
antifouling surface modification, nanofiltration membranes,116–117
filtration membranes, 170–171, 171–172plasticization, glassy polymers, gas sorption effects, 80–81platinum nanoparticles, catalytic functionalized inorganic
membranes, 247f, 247PLGA see poly-L-glutamic acidPLLa see poly-L-lactic acidPMMA see polymethyl methacrylatePMP see poly(4-methyl-2-pentyne)poly(acrylic acid) (PAA), functionalized membranes, 16f, 15, 19fpolyacrylonitrile (PAN) membranes
nanofiltration membranes, 117f, 116plasma-induced graft polymerization, 176f, 175–176
poly(amino acid) (P-AA), functionalized membranes, 21f, 20polybicyclopentadiene (PBCPD), addition polynorbornene
comparison, 142t, 142polycarbonate membranes, track etching, 98polydimethylsiloxane (PDMS), plasma polymer HMDSO
comparison, 165f, 166f, 165–166polyelectrolytes, functionalized membranes, 20, 19f, 22, 19polyethersulfone (PES) membranes
qDMAEMA modificationatomic force microscopy, 346t, 345f, 346f, 344
colloid adhesion measurement, 349f, 350f, 350, 351f, 352f,351, 349
unmodified, 345f, 346f, 344colloid adhesion measurement, 350f, 350, 352f, 351, 349, 350
polyfunctional molecules, functionalized membranes, 15f, 15polyfurfuryl alcohol (PFA), precursors for carbon membrane
preparation, 277–278
Index to Volume 1 363

poly-L-glutamic acid (PLGA), functionalized membranes, 15polyimide (PI), precursors for carbon membrane preparation, 277f,
277–278, 281f, 280–281, 288poly-L-lactic acid (PLLA), scaffolding, supercritical fluid-induced
phase separation, 214f, 213polymer concentration effects, supercritical fluid-induced phase
separation, 204f, 205f, 206f, 204polymeric foams, pyrolysis/CVD method, inorganic membrane
preparation, 229polymeric gels, template-mediated layers, inorganic membrane
preparation, 239f, 239polymeric membranes
aging, 287biological membrane comparison, 1carbon fillers, pressure driven processes, 121carbon membrane comparison, 275–276diffusion, 76enzyme immobilization, biomimetic artificial membranes, 9f, 9–10gas separation, 117inorganic membrane comparison, 219inorganic phase, mixed matrix membranes, 118mixed conventional and plasma materials, fuel cells, 185–186nanofiltration, 116permeation of gases and vapors, 81permeation of liquids, 84preparation, 91–111
composite membranes, 107f, 108f, 95, 103, 107, 100–101liquids expanded with supercritical fluids, 211f, 210phase-inversion processes, 99f, 103f, 98, 101, 102, 100–101phase separation, 200solvent-induced phase separation, 200supercritical-induced phase separation, 201f, 200
pressure-driven processes, 113–129reverse osmosis, 113–114solvent resistance, 105tsorption, 78transport phenomena, 75–90water soluble polymers, supercritical-induced phase separation,
210, 211fpolymeric precursors, carbon membranes, 276, 277polymeric sols, sol–gel method, inorganic membrane preparation,
237f, 236polymeric sponge, template replication method, inorganic
membrane preparation, 228f, 230f, 228polymer-like plasma films, applications, 167polymer molecular distribution, precursors for carbon membrane
preparation, 277polymers, molecular simulations, 69polymers of intrinsic microporosity (PIMs), gas separation
membranes, 117polymer types, mechanical characterization of membranes, 333f, 333polymethyl methacrylate (PMMA), membrane preparation,
supercritical fluids, 204f, 209f, 204, 209, 210, 211poly(4-methyl-2-pentyne) (PMP), gas separation membranes, 117polynorbornenes see addition polynorbornenes; metathesis
polynorbornenes; norbornene polymerspolypeptides, functionalized membranes, 19polysulfone (PSU), filtration membranes, plasma modification, 172f,
173f, 174f, 175f, 176f, 170–171, 171–172polytetrafluoroethylene (PTFE), fluorocarbon plasma polymers, 163poly(trimethylsilyl norbornenes) (PTMSNBs), gas permeability,
137t, 136poly(1-trimethylsilyl-1-propyne) (PTMSP), gas separation
membranes, 117polyurethane (PU) foams, replication method, inorganic membrane
preparation, 228f, 228polyvinyl alcohol (PVA)-based membranes
plasma pervaporation, 170f, 169preparation, supercritical fluids, 204f, 211f, 204, 210
polyvinylidene fluoride (PVDF), membrane preparation,supercritical fluids, 207f, 206, 210
pore characterization, displacement techniques, 319f, 318pore network flow simulation, 54f, 53–54pore properties, carbon membranes, 283tpore-scale modeling, 41
dispersion in porous membranes, 54membrane fouling, 58
pore sizecontrol
inorganic membrane preparation, 220, 223next generation membranes, pressure driven processes, 119
distributionassessment
atomic force microscopy, 346t, 343f, 344f, 346f, 343displacement techniques, 318tracer retention techniques, 323
carbon membranes, 279–280plasma modified polysulfone filtration membranes, 173ftemplate-mediated layers, inorganic membranes, 239
radius assessment, displacement techniques, 318pore stability, ceramic hollow fiber membranes, 261f, 261pore structures
carbon membranes, 280f, 279–280modeling, 31, 41
pore wall charge, membrane characterization, 324–325porosity, contact angle measurement effects, 328porous membranes
ceramic hollow fiber, 261polymer characteristics, 95preparation, 96t, 96
leaching, 96, 98phase-inversion techniques, 99f, 98sintering, 97t, 97f, 96track etching, 97f, 98f, 96, 98
silica/hybrid plasma membranes, 191structure and function, 96t, 93f, 92transport mechanisms, modeling, 33f, 33
positron annihilation lifetime spectroscopy (PALS), 131addition polynorbornenes, 139t, 138, 139metathesis polynorbornenes, 134, 136
postreatment of membranes, 275carbon membranes, 280, 275
powdered precursors, grain packing, membrane modeling, 43–44powder preparation, inorganic membrane preparation, 221powder suspension layers, inorganic membrane preparation, 235PPs see plasma polymersprecursors, 275
carbon membranes, 277, 276ceramic hollow fibers, 257f, 258f, 257
preparation of membranesamorphous perfluoropolymer membranes, 149t, 148, 149, 152carbon membranes, 277f, 276, 284t, 284f, 283carbon nanotube membranes, 292, 291–292, 293ffunctionalized membranes, 13inorganic membranes, 217–252, 221fpolymeric membranes, 95solvent-induced phase separation, 200supercritical fluids, 199–216supercritical-induced phase separation, 200
presintering, ceramic hollow fiber membrane preparation, 259pressing, inorganic membrane shaping, 224pressure-driven processes, 113–129
antifouling strategies, 116block copolymer membranes, 120carbon filler membranes, 121conventional membranes, 113gas separation membranes, 117mixed-matrix membranes, 118, 119
364 Index to Volume 1

molecular imprinted membranes, 120nanofiltration membranes, 115next generation membranes, 119organically modified inorganic membranes, 121organic–inorganic membranes, 113–129organic–inorganic self-assembly membranes, 121polymeric membranes, 113–129responsive membranes, 123reverse osmosis membranes, 113
pressure resistance, inorganic membranes, 219pressure retarded osmosis power plants, 115f, 115pretreatment, 275
precursors for carbon membrane preparation, 278production properties, biological versus artificial membranes, 1proteins
biological membranes, 5f, 2, 4, 5biomimetic artificial membranes, 9f, 8–9separation
carbon nanotube membranes, 303filtration membranes, 170–171, 171–172
proton exchange membrane fuel cells (PEMFCs), plasma processes,183f, 182–183
proton exchange membranes (PEMs), dense membrane transportmechanisms, 38
PSU see polysulfonePTFE see polytetrafluoroethylenePTMSNBs see poly(trimethylsilyl norbornenes)PTMSP see poly(1-trimethylsilyl-1-propyne)PU see polyurethanePVA see polyvinyl alcoholPVDF see polyvinylidene fluoridePyrex glass membranes, preparation, 230–231pyrolysis, 275
carbon membranes, 278, 281f, 280–281polymer foams, inorganic membrane preparation, 229
Q
QCM see quartz crystal microbalanceqDMAEMA see quaternary 2-dimethyl-aminoethylmethacrylatequartz crystal microbalance (QCM), plasma materials combination,
191f, 190quaternary 2-dimethyl-aminoethylmethacrylate (qDMAEMA), 338
modification of PES membranesatomic force microscopy
effects on colloid adhesion, 349f, 350f, 350, 351f, 352f, 351, 349effects on pores, 346t, 345f, 346f, 344
R
radio frequency (RF) discharge, plasmas, 160–161, 163rapid prototyping methods, inorganic membrane preparation, 230rarefied gas flow, gas transport mechanisms, 33f, 35rechargeable batteries, plasma membranes, 178recognition properties, biological versus artificial membranes, 1redox-flow batteries, plasma membranes, 179, 180fregeneration, aged carbon membranes, 288replica technique, inorganic membrane preparation, 228f, 230f,
228, 218resistance determination, water permeability measurement, 319resistive-type sensors, plasma membranes, 190f, 191f, 190resistor network approach, pore modeling, 43response properties, biological versus artificial membranes, 1responsive membranes, pressure driven processes, 123retention rate determination, tracer retention techniques, 322reverse osmosis (RO) membranes, 113, 115f
modification for nanofiltration, 116plasma modification, 170–171polymeric, 85f, 85
preparation, 100f, 103–104thin film composites, 114f, 113–114
RF see radio frequencyrheological behavior, ceramic hollow fiber precursor spinning, 257rigid plastic polymers, mechanical characterization of membranes,
333f, 333ring opening metathesis polymerization (ROMP), norbornene
polymer production, 132, 131rms see root mean squaredRO see reverse osmosisRobeson diagrams, norbornene polymers, 143f, 143–144, 131ROMP see ring opening metathesis polymerizationroot mean squared (rms) roughness parameter, atomic force
microscopy, 343, 338roughness parameters, atomic force microscopy, 343rubbery polymers
permeation, gases and vapors, 82f, 81sorption, gases and vapors, 79f, 78
rupture envelopes, mechanical characterization of membranes,334f, 334
S
S see solubility coefficientsacrificial beads, inorganic membrane preparation, 229, 230SAMFCs see solid alkaline membrane fuel cellsscaffolding applications, supercritical fluid-induced phase
separation, 212, 214fscaling up, molecular simulations to macroscopic processes, 31–32,
71f, 70–71scanning electron microscopy (SEM), structural characterization
methods, 312f, 314f, 312scanning tunneling microscopy (STM), structural characterization
methods, 317t, 315f, 313, 314–316SC-CO2 see supercritical carbon dioxideSC-IPS see supercritical-induced phase separationscreen printing, inorganic membrane preparation, 236SCYb (SrCe0.95Yb0.05O3-�), ceramic hollow fiber membranes, 268f,
269f, 268secondary ion mass spectrometry (SIMS), membrane chemical
analysis, 331f, 331selectivity
biological versus artificial membranes, 1carbon membranes, 285, 287–288curves, tracer retention techniques, 321f, 321electrodialysis membranes, plasma processes for enhancement, 178fixed carrier membranes, 94functionalized membranes, 14membrane preparation, 95metathesis polynorbornenes, 133t, 132–133mixed-matrix membranes, gas separation, 118–119plasma polymer membranes for gas separation, 168f
self assembly membranes, organic–inorganic, 121, 119self-diffusion coefficient, molecular dynamic simulation, 67self-supported membranes, gas separation carbon membranes,
276, 280SEM see scanning electron microscopysemi-crystalline polymers
amorphous comparison, fluoropolymers, 149, 152permeation, gases and vapors, 84sorption, gases and vapors, 81
sensors, plasma membranes, 190f, 189separations
amorphous perfluoropolymer membranes, 153functionalized membranes, 14, 19, 15metathesis polynorbornenes, 135t, 138t
sessile drop method, contact angle measurement, hydrophilicityassessment, 326f, 326
SFVEs see sulfonyl fluoride vinyl ethers
Index to Volume 1 365

shaping, inorganic membrane synthesis, 223, 218sharp pore size distribution, template-mediated layers, inorganic
membranes, 239side groups, metathesis polynorbornenes, 133t, 132sieving see molecular sievingsilica, sol–gel layers, inorganic membrane preparation, 238silicalite, mixed matrix membranes, 118silica membranes
amorphous silica films, plasma deposition, 165f, 166f, 168fglass homogeneous solid membranes, 108porous silica/hybrid plasma membranes, 191
silica–polymer composite membranes, thiol functionalization, silvercapture, 17f, 18f, 17–18
silver ionscapture by functionalized membranes, 17transport through functionalized membranes, 18, 19f
SIMS see secondary ion mass spectrometrysimulations, 29–74
see also modeling; molecular simulationsingle layer polyelectrolyte functionalized membranes, ionic solute
rejections, 21t, 20single-walled carbon nanotube (SWCNT), 291, 307f, 307sintering, 275
carbon membranes, 285ceramic hollow fiber membrane preparation, 260t, 260f, 259granular medium, lattice-Boltzmann simulation, 63f, 63–64inorganic membrane preparation, 220, 232, 218symmetric porous membrane preparation, 97t, 97f, 96
SIPS see solvent-induced phase separationskin layers, asymmetric membranes, 92, 99–100slip casting, inorganic membrane shaping, 224, 218slip preparation, inorganic membrane shaping, 223SOFCs see solid oxide fuel cellssoft agglomerates, ceramic particle dispersion, 255sol–gel process, inorganic membrane preparation, 237f, 236, 218solid alkaline membrane fuel cells (SAMFCs), 183f, 182–183,
188–189solid membranes see dense membranes; homogeneous solid
membranes; non-porous membranessolid oxide fuel cells (SOFCs), ceramic hollow fiber membranes,
271f, 270solid oxides, dense membrane transport mechanisms, 38solid polymer fuel cells (SPFCs), plasma processes, 182–183solid-state reactions, inorganic membrane powder preparation,
222, 218solubility coefficient (S), norborene polymer membranes, 133t,
132–133, 143t, 131solute rejection, single layer polyelectrolyte functionalized
membranes, 21t, 20solution–diffusion-type membranes, 93Solvay Solexis, short side chain monomer synthesis, amorphous
perfluoropolymer membranes, 152f, 152solvent distillation, ceramic hollow fiber membranes, 270f, 269solvent-induced phase separation (SIPS), polymer membrane
preparation, 200, 199–200solvent resistance
inorganic membranes, 219nanofiltration membranes, 116polymeric membranes, 105treverse osmosis membranes, 113–114
sorptionatomic scale simulation, 66f, 65functionalized membranes, 14, 15metathesis polynorbornenes, 135f, 136f, 134molecular dynamic simulation, 69polymer membranes, 78
gas/vapor mixtures, 81glassy polymers, 79f, 80f, 79rubbery polymers, 79f, 78
semi-crystalline polymers, 81SPFCs see solid polymer fuel cellsspherical chambers, capillary network structure, pore modeling, 42–43spin coating, inorganic membrane preparation, 235spinning
ceramic hollow fiber precursors, 257f, 257suspension preparation, ceramic hollow fiber membranes, 254,
255–256spinodal curves, 205f, 200, 206f, 204–205, 205, 199spray coating, inorganic membrane preparation, 236sputtering, 160
plasma polymerization, 160, 163stability
biological versus artificial membranes, 1inorganic membranes, 219, 233membrane structure, 95pores, ceramic hollow fiber membranes, 261f, 261thermal
Hyflon� polymers, 153inorganic membranes, 219, 233
see also aging of membranes; solvent resistanceStefan Maxwell equations, flux relations modeling, 39–40stimuli-responsive applications, carbon nanotube membranes, 299STM see scanning tunneling microscopystorage conditions, carbon membranes, 287–288straight pores, inorganic membrane preparation, 231streaming potentials, membrane charge characterization, 323f, 325stress–strain curves, mechanical characterization of membranes,
333f, 333stretching semicrystalline films, polymer membrane preparation,
97f, 97–98structural features
addition polynorbornenes, 138characterization methods, 312f, 317t, 314f, 312, 315f, 316f, 317f,
318f, 319fsynthetic membranes, 92f, 91
sulfonic perfluorinated polymers, hydrophilic amorphousmembranes, 152
sulfonyl fluoride vinyl ethers (SFVEs), hydrophilic amorphousperfluoropolymer membranes, 152
supercritical carbon dioxide (SC-CO2)expanded liquids for water soluble polymer membrane
preparation, 211f, 210phase separation, 206f, 208f, 200, 207
supercritical fluidsdefinition, 200density effects in phase separation, 208f, 207membrane preparation, 199–216
supercritical-induced phase separation (SC-IPS)polymer membrane preparation, 200
experimental results, 202t, 204f, 203t, 201flat membranes, 204loaded membranes, 211f, 211, 212foperative parameter effects, 204scaffolding applications, 212, 214ftechniques, 201f, 201water soluble polymers, 210, 211f
superhydrophobic carbon nanotube arrays, electric bias hydrophilicchange, 300f, 299
supported carbon membranes, gas separation, 276, 282supported liquid membranes, preparation, 109f, 109support layers, asymmetric membranes, 92, 99–100surface charge
contact angle measurement effects, 328membrane characterization, 324–325
surface depositionsee also chemical vapor deposition; plasma-enhanced chemical
vapor depositionsurface diffusion, gas transport mechanisms, 33f, 35
366 Index to Volume 1

surface modificationantifouling, nanofiltration membranescoating techniques, composite membrane preparation, 107functionalized membranes, 23t, 13–14inorganic membrane preparation, 235, 236, 230–231plasma processes, 162, 161, 163
Nafion�, fuel cells, 184surface roughness
atomic force microscopy, 343f, 343ceramic hollow fiber membranes, 264t, 263–264
surface visualization of membranes, atomic force microscopy, 343f,344f, 345f, 343, 347f, 347, 348f
surfactants, capture by PAA functionalized membranes, 16f, 17f, 15surrogates, microorganism filtration membrane characterization, 324suspended particles, transport mechanisms, 37suspension-spinning with phase inversion technique, inorganic
membrane preparation, 227f, 226suspension techniques, inorganic membrane shaping, 226SWCNT see single-walled carbon nanotubesymmetric membranes, 92
inorganic, 227f, 227preparation, 96, 98
leaching, 96, 98phase-inversion techniques, 99f, 98sintering, 97t, 97f, 96track etching, 97f, 98f, 96, 98
synthetic membranesmaterials and structures, 92f, 91, 93fmixed conventional and plasma materials, fuel cells, 185–186preparation, 95
T
tape casting, inorganic membrane shaping, 226f, 225, 218tapping (intermittent contact) mode imaging, atomic force
microscopy, 337Teflon� AF, amorphous perfluoropolymers, 147, 149TEM see transmission electron microscopytemperature effects
non-OCM reactions, ceramic hollow fiber membranepreparation, 268–269
OCM reactions, ceramic hollow fiber membrane preparation,268f, 269f, 267, 268–269
plasma-polymerized membranes, 193f, 190–191polymer sorption of gases and vapors, 81fresponsive membranes, pressure driven processes, 124f, 123sintering, ceramic hollow fiber membrane preparation, 260f, 265f,
266f, 259, 265–266, 266see also heat treatments; thermal. . .
temperature-induced phase separation process, asymmetricmembrane preparation, 102
templatescarbon nanotube membranes, 293f, 292layers, inorganic membrane preparation, 239f, 238leaching, polymer membrane preparation, 98replication, inorganic membrane preparation, 228f, 230f, 228
tensile stress testing, mechanical characterization of membranes,333f, 333
ternary systems, Maxwell–Stefan equations, 77tetrafluoroethylene (TFE), amorphous perfluoropolymer
membranes, 148–149, 149, 152TFCs see thin film compositesTFE see tetrafluoroethyleneTg see glass transition temperaturethermally-induced phase separation (TIPS), polymer membrane
preparation, 199–200thermal-responsive membranes, pressure driven
processes, 124f, 123
thermal stabilityHyflon� polymers, 153inorganic membranes, 219, 233
thermal treatment of layers, inorganic membranepreparation, 233
thermodynamic properties, addition polynorbornenes, 141thermolysis, ceramic hollow fiber membrane preparation, 259thermoresistance, polymeric precursors for carbon membrane
preparation, 277thermosetting polymers, 275
carbon membrane preparation, 275–276, 277thin-film composites (TFCs), reverse osmosis membranes, 114f,
113–114thin films, plasma polymers, 164f, 164thiol functionalized silica–polymer composite membranes, silver
capture, 17f, 18f, 17–18three dimensional fiber deposition (3DFD), inorganic membrane
preparation, 230TIPS see thermally-induced phase separationtissue engineering, scaffolding, supercritical fluid-induced phase
separation, 212, 214ftitania nanofiltration membranes, structure, 220f, 241ftoxic substances
hazardous organic material treatment, carbon nanotubemembranes, 304f, 303
heavy metalsion capture, functionalized membranes, 15ionic solute rejection, functionalized membranes, 20
tracer retention techniquesmembrane characterization, 320t, 323t, 321f, 322f, 319
microbiological tracers, 323tracer choice, 320
track etchinginorganic membrane preparation, 231symmetric porous membrane preparation, 97f, 98f, 96, 98
traditional chemical vapor deposition, plasma-enhanced chemicalvapor deposition comparison, 164
trajectory techniques, mesoscopic transport simulation, 49f, 49transdermal drug-delivery applications, carbon nanotube
membranes, 300f, 299–300transfer coefficient determination, tracer retention techniques, 322f, 322transition-metal catalyst recovery, carbon nanotube membranes, 304transition state theory (TST), polymer membranes, 70transmission electron microscopy (TEM), structural
characterization methods, 312f, 312transmission probability method, trajectory modeling
approach, 49transport phenomena
fluid flow, 33ffluid–solid separation, 37flux relations modeling, 39gases, 33f, 33modeling, 32polymer membranes, 75–90
transport propertiesaddition polynorbornenes, 141, 143, 141t, 142tcarbon membranes, gas separation, 286t, 285f, 284–285metathesis polynorbornenes, 133t, 134t, 137t, 143
2,2,4-trifluoro-5-trifluoromethoxy-1,3-dioxile (TTD), hydrophobicamorphous perfluoropolymer membranes, 148–149
TST see transition state theoryTTD see 2,2,4-trifluoro-5-trifluoromethoxy-1,3-dioxiletubular membranes
inorganic extrusion, 225fplasma membranes, 192f, 193f, 190see also capillary membranes; hollow fiber membranes
turbostratic structures, carbon membranes, 280, 281, 285, 275two-phase flow with phase change, lattice-Boltzmann simulation,
60f, 62f, 63f, 59
Index to Volume 1 367

U
ultrafiltrationcarbon nanotube membranes, 303ceramic hollow fiber membranes, 261
unsupported membranescarbon membranes, 276liquid membranes, 109f, 109–110see also self-supported membranes
V
vapor deposition see chemical vapor deposition; plasma-enhancedchemical vapor deposition
vapor permeation (VP), polymer membranes, 81vapor sorption, polymer membranes, 78vapor transport, carbon nanotube membranes, 297viral separation
carbon nanotube membranes, 303filtration membrane retention, 324
viscous flow, gas transport mechanisms, 33f, 35visualization of membrane surfaces, atomic force microscopy, 343f,
344f, 345f, 343, 348fvoltage-controlled transport, carbon nanotube membranes, 300f,
299–300voltage-gated channels, biological membrane mimicry, carbon
nanotube membranes, 300f, 299–300Vycor glass membranes, preparation, 230–231
W
washing cycles, membrane charge (zeta potential) effects, 326t,325–326
wastewater treatment, reverse osmosis membranes, 113–114water permeability
amorphous fluoropolymer membranes, 153
carbon nanotube membranes, 292f, 291, 300–302, 303hydraulic permeability/resistance determination, 319
water soluble polymers, supercritical-induced phase separation,211f, 210
WAXD see wide angle X-ray scatteringwet powder preparation, inorganic membrane
preparation, 222wet shaping techniques, inorganic membrane
preparation, 223, 224W/FM parameter, plasma polymerization, 164f, 163, 165–166wide angle X-ray scattering (WAXD), addition polynorbornenes,
139t, 138, 138–139, 142
X
XP117 nanofiltration membranes, atomic force microscopy, 344f,343–344
X-ray photoelectron spectroscopy (XPS), membrane chemicalanalysis, 331
X-ray synchrotron micro-tomography, 316, 318f
Y
Yasuda parameter, plasma polymers, 165–166yittria-stabilized zirconia (YSZ), ceramic hollow fiber membranes,
253–254, 261t, 262f, 263f, 264f, 261Young’s modulus, mechanical characterization of membranes, 333YSZ see yittria-stabilized zirconia
Z
zeolite layers, inorganic membrane preparation, 242zeolite membranes, 94zeolites, polymer hybrids, mixed matrix membranes, 118zeta potential, membrane charge characterization, 326t, 323f, 325f,
325, 324, 325
368 Index to Volume 1