comprehensive functional annotation of 77 prostate cancer
TRANSCRIPT
Comprehensive Functional Annotation of 77 ProstateCancer Risk LociDennis J. Hazelett1*, Suhn Kyong Rhie1, Malaina Gaddis2, Chunli Yan1, Daniel L. Lakeland3,
Simon G. Coetzee4, Ellipse/GAME-ON consortium5", Practical consortium6", Brian E. Henderson5,
Houtan Noushmehr4, Wendy Cozen7, Zsofia Kote-Jarai6, Rosalind A. Eeles6,8, Douglas F. Easton9,
Christopher A. Haiman5, Wange Lu10, Peggy J. Farnham2, Gerhard A. Coetzee1*
1 Departments of Urology and Preventive Medicine, Norris Cancer Center, University of Southern California Keck School of Medicine, Los Angeles, California, United States
of America, 2 Department of Biochemistry and Molecular Biology, Keck School of Medicine, University of Southern California, Los Angeles, California, United States of
America, 3 Sonny Astani Department of Civil and Environmental Engineering, University of Southern California, Los Angeles, California, United States of America,
4 Department of Genetics, University of Sao Paulo, Ribeirao Preto, Brazil, 5 Department of Preventive Medicine, Norris Cancer Center, University of Southern California
Keck School of Medicine, Los Angeles, California, United States of America, 6 The Institute of Cancer Research, Sutton, United Kingdom, 7 USC Keck School of Medicine,
Norris Comprehensive Cancer Center, University of Southern California, Los Angeles, California, United States of America, 8 Royal Marsden National Health Service (NHS)
Foundation Trust, London and Sutton, United Kingdom, 9 Centre for Cancer Genetic Epidemiology, Department of Oncology, University of Cambridge, Cambridge, United
Kingdom, 10 Eli and Edythe Broad Center for Regenerative Medicine and Stem Cell Research, Department of Biochemistry and Molecular Biology, Keck School of Medicine,
University of Southern California, Los Angeles, California, United States of America
Abstract
Genome-wide association studies (GWAS) have revolutionized the field of cancer genetics, but the causal links betweenincreased genetic risk and onset/progression of disease processes remain to be identified. Here we report the first step insuch an endeavor for prostate cancer. We provide a comprehensive annotation of the 77 known risk loci, based upon highlycorrelated variants in biologically relevant chromatin annotations— we identified 727 such potentially functional SNPs. Wealso provide a detailed account of possible protein disruption, microRNA target sequence disruption and regulatoryresponse element disruption of all correlated SNPs at r2
§0:5. 88% of the 727 SNPs fall within putative enhancers, and manyalter critical residues in the response elements of transcription factors known to be involved in prostate biology. We defineas risk enhancers those regions with enhancer chromatin biofeatures in prostate-derived cell lines with prostate-cancercorrelated SNPs. To aid the identification of these enhancers, we performed genomewide ChIP-seq for H3K27-acetylation, amark of actively engaged enhancers, as well as the transcription factor TCF7L2. We analyzed in depth three variants in riskenhancers, two of which show significantly altered androgen sensitivity in LNCaP cells. This includes rs4907792, that is in
linkage disequilibrium (r2~0:91) with an eQTL for NUDT11 (on the X chromosome) in prostate tissue, and rs10486567, theindex SNP in intron 3 of the JAZF1 gene on chromosome 7. Rs4907792 is within a critical residue of a strong consensusandrogen response element that is interrupted in the protective allele, resulting in a 56% decrease in its androgensensitivity, whereas rs10486567 affects both NKX3-1 and FOXA-AR motifs where the risk allele results in a 39% increase inbasal activity and a 28% fold-increase in androgen stimulated enhancer activity. Identification of such enhancer variants andtheir potential target genes represents a preliminary step in connecting risk to disease process.
Citation: Hazelett DJ, Rhie SK, Gaddis M, Yan C, Lakeland DL, et al. (2014) Comprehensive Functional Annotation of 77 Prostate Cancer Risk Loci. PLoS Genet 10(1):e1004102. doi:10.1371/journal.pgen.1004102
Editor: Vivian G. Cheung, University of Michigan, United States of America
Received October 1, 2013; Accepted November 14, 2013; Published January 30, 2014
Copyright: � 2014 Hazelett et al. This is an open-access article distributed under the terms of the Creative Commons Attribution License, which permitsunrestricted use, distribution, and reproduction in any medium, provided the original author and source are credited.
Funding: The work reported here was funded by the National Institutes of Health (NIH) [CA109147, U19CA148537 and U19CA148107 to GAC; 5T32CA009320-27to HN and NIDH/NHGRI U54HG006996 to PJF] and David Mazzone Awards Program (GAC) and 5T32GM067587 for MG. The scientific development and funding ofthis project were in part supported by the Genetic Associations and Mechanisms in Oncology (GAME-ON): a NCI Cancer Post-GWAS Initiative. The funders had norole in study design, data collection and analysis, decision to publish, or preparation of the manuscript.
Competing Interests: The authors have declared that no competing interests exist.
* E-mail: [email protected] (DJH); [email protected] (GAC)
" Membership of the Ellipse/GAME-ON consortium and the Practical consortium is provided in the Acknowledgments.
Introduction
The basic goal of research into human genetics is to connect
variation at the genetic level with variation in organismal and
cellular phenotype. Until recently, inferences about such connec-
tions have been limited to the kind associated with heritable
disorders and developmental syndromes. Such variations often
turn out to be the result of disruptions to protein coding sequences
of critical enzymes for an affected pathway. Recent advances in
genomics and medicine have begun to illuminate a sea of variation
of a more subtle variety, not always the result of mutation of
protein coding sequences. In particular, genome-wide association
studies (GWAS) have identified thousands of variants associated
with hundreds of disease traits [1]. These variants, typically
encoded by single nucleotide polymorphisms (SNPs), are given
landmark status and called ‘index-SNPs’ (they are also frequently
referred to in the literature as ‘tag-SNPs’) as the reference for
disease or phenotype association in that region. The vast majority
PLOS Genetics | www.plosgenetics.org 1 January 2014 | Volume 10 | Issue 1 | e1004102
of these variants reside within intergenic or intronic regions [2],
prompting at least two new avenues of inquiry: 1) What is the
nature and scope of risk encoded at these ‘non-coding’ loci?, and 2)
What are the target genes, and how do these alterations account
for increased risk in a disease?
At present, little is known regarding the functional mechanisms
of the common variant susceptibility loci in non-coding regions.
For one, there are many genetically correlated variants that—to
varying degrees—may account for the risk associated with each
index-SNP. It is unclear whether more than one variant carries
functional consequences relevant to the risk that was reported.
In addition, we are only beginning to understand the nature
of non-coding regions as revealed by histone modifications and
other chemical signatures on chromatin. Efforts to fill this void are
underway, notably by the ENCODE consortium [3], whose goal
it is to catalog all the major chromatin biofeatures, including
histone modifications, accessible chromatin and transcription
factor bound regions in the form of digital footprinting and
ChIP-seq for transcription factors, among others. Currently, a
mosaic of annotations for all the known histone modifications and
119 different transcription factors has been released for 147 cell
types, including an androgen-sensitive prostate adenocarcinoma
cell line isolated from lymph-node metastasis, called Lymph Node
Cancer of the Prostate (LNCaP) [4–6]. Insights into cancer biology
of the prostate have already begun to emerge from this work.
For example, risk polymorphisms for the 8q24 locus have been
extensively characterized in our lab and others [7,8].
We propose that by identifying all the variants that are in
linkage disequilibrium with GWAS SNPs and subsequently
filtering down to those present within genome-wide functional
annotations we will identify the most likely causal susceptibility
variants within regulatory elements that can be tested for their
functional significance. We previously developed the R-Biocon-
ductor package Funci–SNP} [2] which performs these operations,
including the linkage disequilibrium calculations, based on data
from the 1,000 genomes project (www.1000genomes.org [9])
automatically. With the advent of Funci–SNP} and similar tools
such as RegulomeDB [10], performing annotations of this type
becomes possible, and indeed essential to understanding the
candidate variations that may underlie risk for disease.
Post-GWAS analyses of breast cancer [11] for example
identified putative functional variants using Funci{SNP} and
genome-wide chromatin biofeature data for breast epithelia-
derived cell lines as described above, but this level of detail is
lacking for prostate cancer. In that study, we catalogued and
assessed the correlated functional variants at 72 breast cancer risk
loci and performed preliminary enrichment analysis of motifs. We
identified over 1,000 putative functional SNPs, most of which were
in putative enhancers. We provide here a similar analysis for
prostate cancer, extending the previous work and introducing
some improvements to the downstream analyses. We also present
some new ChIP-seq datasets to add to ENCODE.
Results
Classification of variants associated with prostate cancerIn order to identify variants that are in linkage disequilibrium
with 77 prostate cancer risk loci (defined as all significant GWAS,
replication study and post-GWAS identified variants, see Table 1
for references), that are also relevant to the biology of prostate
epithelia, we employed our bioinformatics tool, Funci{SNP} [2] to
integrate biofeatures with 1000 genomes data [9] (see Methods for
a detailed list of biofeatures). For the LNCaP cell line, genome-
wide data are generally available both with and without androgen
treatment. Since the androgen receptor is a driver of prostate
cancer [12], we included both conditions where possible. We also
considered protein coding exons, 50
and 30
untranslated regions
with miRcode target sequences. Importantly, we also included the
index-SNPs in our analysis.
We note that some critical datasets were not available when
we initiated our studies. For example, ChIP-seq data for the
histone modification H3K27Ac was not available for LNCaP cells.
This is a mark of active enhancers, which are extremely cell-type
specific. Although other marks, such as DNase I hypersensitivity
or H3K4me1, can reveal regions of open chromatin, they do
not identify active enhancers. Therefore, we performed ChIP-seq
for H3K27Ac in LNCaP cells, after a period of incubation in
charcoal-stripped serum (i.e. androgen depleted) followed by
exposure to vehicle control or physiological levels of the androgen
dihydrotestosterone (10 nM DHT). For LNCaP treated with vehicle
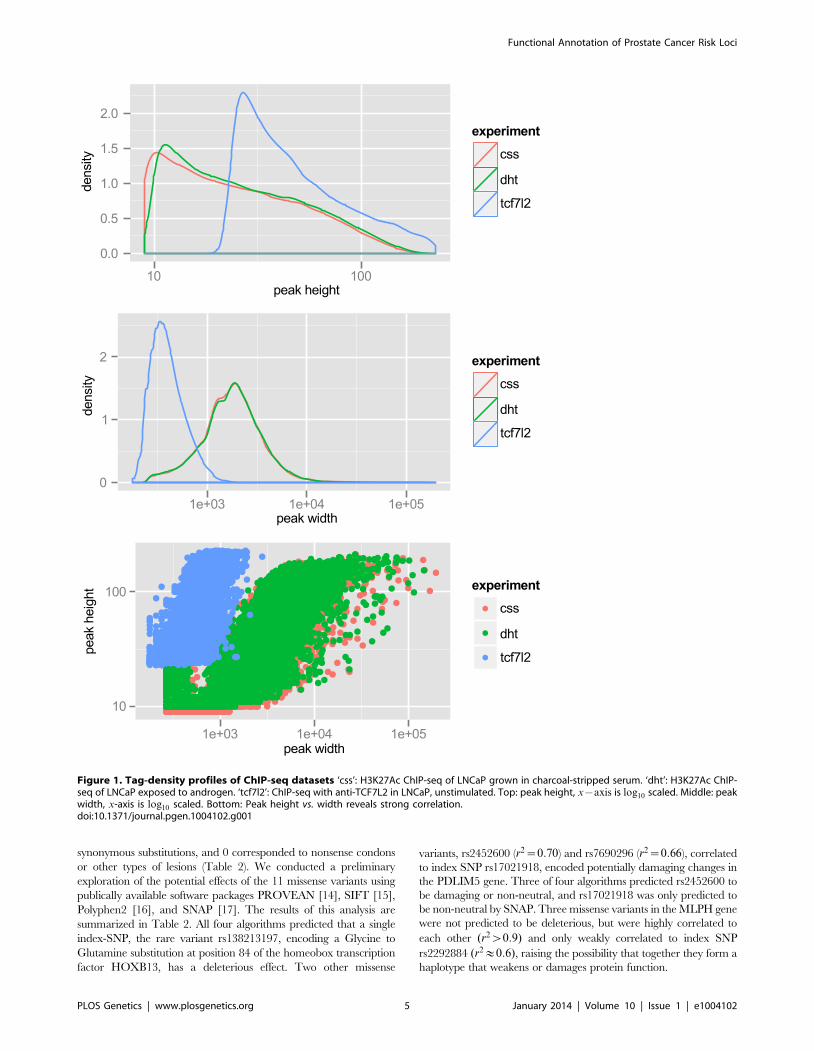
(minus DHT) we observed 57,623 peaks, with an average peak
height of 32 tags and median height of 22 tags, and a range of 9 to
212 tags. The average peak width was 2,233 bp. For LNCaP post-
androgen stimulation, we observed 60,752 peaks, with an average
peak width of 2,267 bp. Overall the relative tag density and peak
width distribution was extremely similar between the two conditions
(see Figure 1, top and middle panels). A plot of peak height vs. peak
width reveals a linear relationship in log space (Figure 1, bottom
panel). Because we wanted to limit our studies to robust enhancers,
we chose the top 25,000 peaks, which have a tag density of w29 for
use in Funci{SNP}. This cutoff marks an inflection point where the
number of tags increases geometrically over background (Figure
S1). A comparison of the top 25,000 H3K27Ac peaks detected
before and after induction with DHT revealed an 84% overlap (see
Figure S2), suggesting that only a small percentage of all H3K27Ac
peaks are responsive to hormone treatment.
We also wished to include transcription factor binding data in
our analyses. Although there were data available for ChIP-seq
of androgen receptor (AR), FOXA1 and NKX3-1, data for
TCF7L2— another transcription factor with a proposed role in
prostate- and other cancers [13]— was not available. Therefore
we performed ChIP-seq for TCF7L2 in LNCaP. We chose the top
15,000 peaks, with an average peak height of 57 tags and a range
of 23 to 229 tags and an average peak width of 432 bp. These
properties are also displayed graphically in Figure 1. TCF7L2
binding sites were also highly enriched in the center of TCF7L2
ChIP-seq peaks (Figure S3).
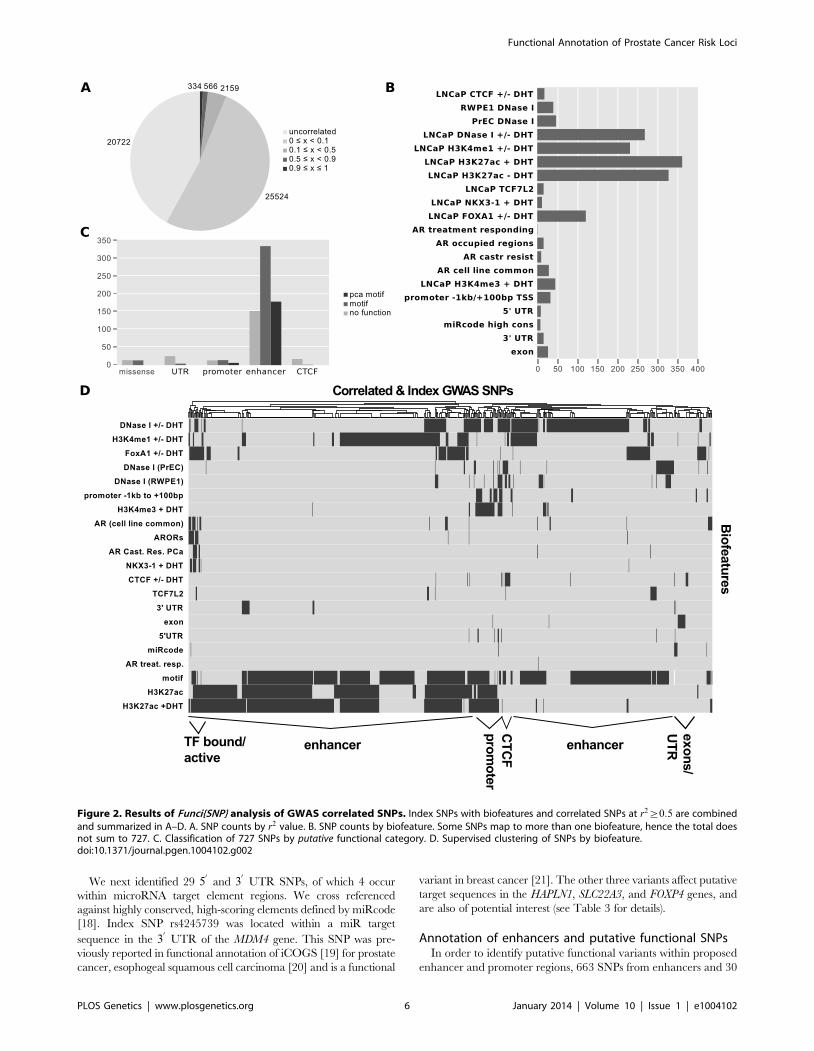
Using Funci{SNP}, we identified 49,305 SNPs that were cor-
related in the population in which the original index SNP was
reported within prostate epithelial chromatin biofeatures, of which
only 727 had an r2 value greater than or equal to 0.5 (Figure 2A).
The most common SNP annotations are associated with H3K27-
acetylation (385 SNPs) and the other enhancer marks H3K4-
monomethylation (231 SNPs) and LNCaP DNaseI hypersensitivity
Author Summary
In the following work we provide a complete summaryannotation of functional hypotheses relating to riskidentified by genome wide association studies of prostatecancer. In addition, we present new genome-wide profilesfor H3K27-acetylation and TCF7L2 binding in LNCaP cells.We also introduce the concept of a risk enhancer, andcharacterize two novel androgen-sensitive enhancerswhose activity is specifically affected by prostate-cancerrisk SNPs. Our findings represent a preliminary approach tosystematic identification of causal variation underlyingcancer risk in the prostate.
Functional Annotation of Prostate Cancer Risk Loci
PLOS Genetics | www.plosgenetics.org 2 January 2014 | Volume 10 | Issue 1 | e1004102
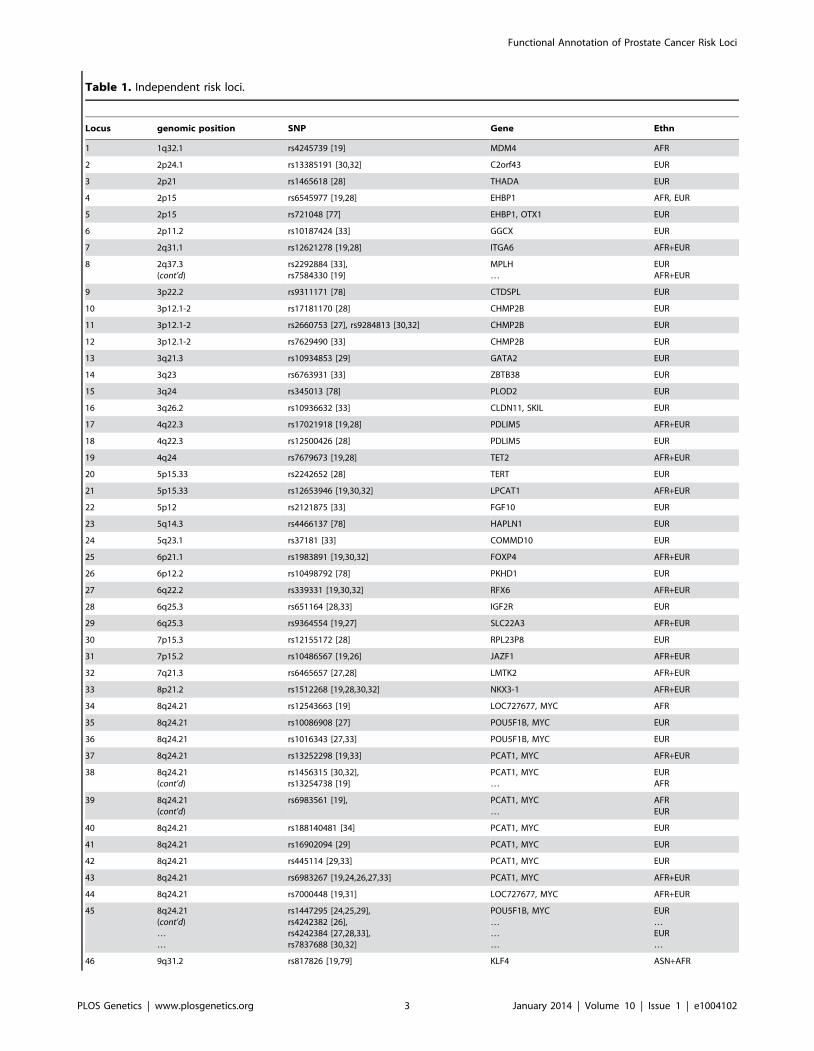
Table 1. Independent risk loci.
Locus genomic position SNP Gene Ethn
1 1q32.1 rs4245739 [19] MDM4 AFR
2 2p24.1 rs13385191 [30,32] C2orf43 EUR
3 2p21 rs1465618 [28] THADA EUR
4 2p15 rs6545977 [19,28] EHBP1 AFR, EUR
5 2p15 rs721048 [77] EHBP1, OTX1 EUR
6 2p11.2 rs10187424 [33] GGCX EUR
7 2q31.1 rs12621278 [19,28] ITGA6 AFR+EUR
8 2q37.3(cont’d)
rs2292884 [33],rs7584330 [19]
MPLH…
EURAFR+EUR
9 3p22.2 rs9311171 [78] CTDSPL EUR
10 3p12.1-2 rs17181170 [28] CHMP2B EUR
11 3p12.1-2 rs2660753 [27], rs9284813 [30,32] CHMP2B EUR
12 3p12.1-2 rs7629490 [33] CHMP2B EUR
13 3q21.3 rs10934853 [29] GATA2 EUR
14 3q23 rs6763931 [33] ZBTB38 EUR
15 3q24 rs345013 [78] PLOD2 EUR
16 3q26.2 rs10936632 [33] CLDN11, SKIL EUR
17 4q22.3 rs17021918 [19,28] PDLIM5 AFR+EUR
18 4q22.3 rs12500426 [28] PDLIM5 EUR
19 4q24 rs7679673 [19,28] TET2 AFR+EUR
20 5p15.33 rs2242652 [28] TERT EUR
21 5p15.33 rs12653946 [19,30,32] LPCAT1 AFR+EUR
22 5p12 rs2121875 [33] FGF10 EUR
23 5q14.3 rs4466137 [78] HAPLN1 EUR
24 5q23.1 rs37181 [33] COMMD10 EUR
25 6p21.1 rs1983891 [19,30,32] FOXP4 AFR+EUR
26 6p12.2 rs10498792 [78] PKHD1 EUR
27 6q22.2 rs339331 [19,30,32] RFX6 AFR+EUR
28 6q25.3 rs651164 [28,33] IGF2R EUR
29 6q25.3 rs9364554 [19,27] SLC22A3 AFR+EUR
30 7p15.3 rs12155172 [28] RPL23P8 EUR
31 7p15.2 rs10486567 [19,26] JAZF1 AFR+EUR
32 7q21.3 rs6465657 [27,28] LMTK2 AFR+EUR
33 8p21.2 rs1512268 [19,28,30,32] NKX3-1 AFR+EUR
34 8q24.21 rs12543663 [19] LOC727677, MYC AFR
35 8q24.21 rs10086908 [27] POU5F1B, MYC EUR
36 8q24.21 rs1016343 [27,33] POU5F1B, MYC EUR
37 8q24.21 rs13252298 [19,33] PCAT1, MYC AFR+EUR
38 8q24.21(cont’d)
rs1456315 [30,32],rs13254738 [19]
PCAT1, MYC…
EURAFR
39 8q24.21(cont’d)
rs6983561 [19], PCAT1, MYC…
AFREUR
40 8q24.21 rs188140481 [34] PCAT1, MYC EUR
41 8q24.21 rs16902094 [29] PCAT1, MYC EUR
42 8q24.21 rs445114 [29,33] PCAT1, MYC EUR
43 8q24.21 rs6983267 [19,24,26,27,33] PCAT1, MYC AFR+EUR
44 8q24.21 rs7000448 [19,31] LOC727677, MYC AFR+EUR
45 8q24.21(cont’d)……
rs1447295 [24,25,29],rs4242382 [26],rs4242384 [27,28,33],rs7837688 [30,32]
POU5F1B, MYC………
EUR…EUR…
46 9q31.2 rs817826 [19,79] KLF4 ASN+AFR
Functional Annotation of Prostate Cancer Risk Loci
PLOS Genetics | www.plosgenetics.org 3 January 2014 | Volume 10 | Issue 1 | e1004102
(268 SNPs, see Figure 2B). A complete visualisation of correlated
SNPs with r2 and all associated biofeatures are available on the
UCSC genome browser; furthermore all custom tracks may be
downloaded in bed format via the table browser therein: http://
genome.ucsc.edu/cgi-bin/hgTracks?hgS_doOtherUser = submit&
hgS_otherUserName = hazelett&hgS_otherUserSessionName =
pca.
After identifying SNPs in primary biofeatures, we grouped
them according to putative functional classes for further analysis.
We identified 30 SNPs in putative promoter regions 21000 bp to
+100 bp relative to transcription start sites, 663 SNPs in putative
enhancer regions, 4 SNPs in microRNA target sequences within
30
or 50
UTRs, and 27 SNPs in coding exons (Figure 2C).
To directly observe the relationships of the annotations to each
SNP across the entire set, we performed unsupervised clustering on
the matrix of biofeatures and SNPs (Figure 2D). The resulting cluster
diagram neatly captures the functional categories, but also reveals
a cluster of SNPs in regions bound by multiple transcri-
ption factors. Perhaps most importantly, Figures 2C and 2D clearly
show that the majority of variation associated with risk for prostate
cancer resides within what we have defined as putative risk enhancers.
Functional annotation of exon variantsWe identified 27 exon SNPs in linkage disequilibrium with
index SNPs for prostate cancer (Figure 2B & 2C). Of these SNPs,
13 encoded missense substitutions in coding exons, 14 encoded
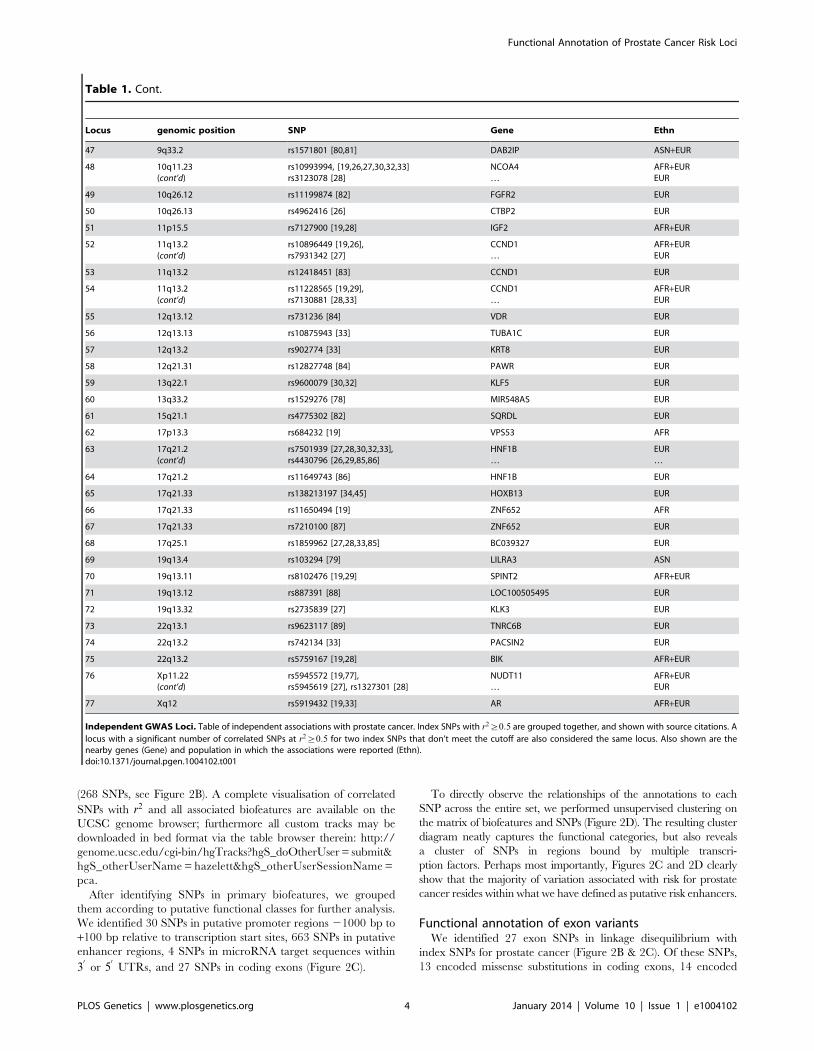
Table 1. Cont.
Locus genomic position SNP Gene Ethn
47 9q33.2 rs1571801 [80,81] DAB2IP ASN+EUR
48 10q11.23(cont’d)
rs10993994, [19,26,27,30,32,33]rs3123078 [28]
NCOA4…
AFR+EUREUR
49 10q26.12 rs11199874 [82] FGFR2 EUR
50 10q26.13 rs4962416 [26] CTBP2 EUR
51 11p15.5 rs7127900 [19,28] IGF2 AFR+EUR
52 11q13.2(cont’d)
rs10896449 [19,26],rs7931342 [27]
CCND1…
AFR+EUREUR
53 11q13.2 rs12418451 [83] CCND1 EUR
54 11q13.2(cont’d)
rs11228565 [19,29],rs7130881 [28,33]
CCND1…
AFR+EUREUR
55 12q13.12 rs731236 [84] VDR EUR
56 12q13.13 rs10875943 [33] TUBA1C EUR
57 12q13.2 rs902774 [33] KRT8 EUR
58 12q21.31 rs12827748 [84] PAWR EUR
59 13q22.1 rs9600079 [30,32] KLF5 EUR
60 13q33.2 rs1529276 [78] MIR548AS EUR
61 15q21.1 rs4775302 [82] SQRDL EUR
62 17p13.3 rs684232 [19] VPS53 AFR
63 17q21.2(cont’d)
rs7501939 [27,28,30,32,33],rs4430796 [26,29,85,86]
HNF1B…
EUR…
64 17q21.2 rs11649743 [86] HNF1B EUR
65 17q21.33 rs138213197 [34,45] HOXB13 EUR
66 17q21.33 rs11650494 [19] ZNF652 AFR
67 17q21.33 rs7210100 [87] ZNF652 EUR
68 17q25.1 rs1859962 [27,28,33,85] BC039327 EUR
69 19q13.4 rs103294 [79] LILRA3 ASN
70 19q13.11 rs8102476 [19,29] SPINT2 AFR+EUR
71 19q13.12 rs887391 [88] LOC100505495 EUR
72 19q13.32 rs2735839 [27] KLK3 EUR
73 22q13.1 rs9623117 [89] TNRC6B EUR
74 22q13.2 rs742134 [33] PACSIN2 EUR
75 22q13.2 rs5759167 [19,28] BIK AFR+EUR
76 Xp11.22(cont’d)
rs5945572 [19,77],rs5945619 [27], rs1327301 [28]
NUDT11…
AFR+EUREUR
77 Xq12 rs5919432 [19,33] AR AFR+EUR
Independent GWAS Loci. Table of independent associations with prostate cancer. Index SNPs with r2§0:5 are grouped together, and shown with source citations. A
locus with a significant number of correlated SNPs at r2§0:5 for two index SNPs that don’t meet the cutoff are also considered the same locus. Also shown are the
nearby genes (Gene) and population in which the associations were reported (Ethn).doi:10.1371/journal.pgen.1004102.t001
Functional Annotation of Prostate Cancer Risk Loci
PLOS Genetics | www.plosgenetics.org 4 January 2014 | Volume 10 | Issue 1 | e1004102
synonymous substitutions, and 0 corresponded to nonsense condons
or other types of lesions (Table 2). We conducted a preliminary
exploration of the potential effects of the 11 missense variants using
publically available software packages PROVEAN [14], SIFT [15],
Polyphen2 [16], and SNAP [17]. The results of this analysis are
summarized in Table 2. All four algorithms predicted that a single
index-SNP, the rare variant rs138213197, encoding a Glycine to
Glutamine substitution at position 84 of the homeobox transcription
factor HOXB13, has a deleterious effect. Two other missense
variants, rs2452600 (r2~0:70) and rs7690296 (r2~0:66), correlated
to index SNP rs17021918, encoded potentially damaging changes in
the PDLIM5 gene. Three of four algorithms predicted rs2452600 to
be damaging or non-neutral, and rs17021918 was only predicted to
be non-neutral by SNAP. Three missense variants in the MLPH gene
were not predicted to be deleterious, but were highly correlated to
each other (r2w0:9) and only weakly correlated to index SNP
rs2292884 (r2&0:6), raising the possibility that together they form a
haplotype that weakens or damages protein function.
Figure 1. Tag-density profiles of ChIP-seq datasets ‘css’: H3K27Ac ChIP-seq of LNCaP grown in charcoal-stripped serum. ‘dht’: H3K27Ac ChIP-seq of LNCaP exposed to androgen. ‘tcf7l2’: ChIP-seq with anti-TCF7L2 in LNCaP, unstimulated. Top: peak height, x{axis is log10 scaled. Middle: peakwidth, x-axis is log10 scaled. Bottom: Peak height vs. width reveals strong correlation.doi:10.1371/journal.pgen.1004102.g001
Functional Annotation of Prostate Cancer Risk Loci
PLOS Genetics | www.plosgenetics.org 5 January 2014 | Volume 10 | Issue 1 | e1004102
We next identified 29 50
and 30
UTR SNPs, of which 4 occur
within microRNA target element regions. We cross referenced
against highly conserved, high-scoring elements defined by miRcode
[18]. Index SNP rs4245739 was located within a miR target
sequence in the 30
UTR of the MDM4 gene. This SNP was pre-
viously reported in functional annotation of iCOGS [19] for prostate
cancer, esophogeal squamous cell carcinoma [20] and is a functional
variant in breast cancer [21]. The other three variants affect putative
target sequences in the HAPLN1, SLC22A3, and FOXP4 genes, and
are also of potential interest (see Table 3 for details).
Annotation of enhancers and putative functional SNPsIn order to identify putative functional variants within proposed
enhancer and promoter regions, 663 SNPs from enhancers and 30
Figure 2. Results of Funci{SNP} analysis of GWAS correlated SNPs. Index SNPs with biofeatures and correlated SNPs at r2§0:5 are combined
and summarized in A–D. A. SNP counts by r2 value. B. SNP counts by biofeature. Some SNPs map to more than one biofeature, hence the total doesnot sum to 727. C. Classification of 727 SNPs by putative functional category. D. Supervised clustering of SNPs by biofeature.doi:10.1371/journal.pgen.1004102.g002
Functional Annotation of Prostate Cancer Risk Loci
PLOS Genetics | www.plosgenetics.org 6 January 2014 | Volume 10 | Issue 1 | e1004102
SNPs from promoters were queried against 87 positional weight
matrices (PWM) compiled from Factorbook [22] (see Methods).
Factorbook includes response element definition for the FOXA
family of transcription factors, TCF7L2, MYC, and GATA1 and -
3 among others. In addition we used PWMs from Homer [23] for
FOXA1, the androgen receptor (AR) and NKX3-1. We identified
a subset of 509 variants in putative enhancers and 20 variants in
promoter regions that disrupt response elements (see UCSC
genome-browser http://genome.ucsc.edu/cgi-bin/hgTracks?hgS_
doOtherUser = submit&hgS_otherUserName = hazelett&hgS_
otherUserSessionName = pca). For both promoters and enhanc-
ers we also identified a subset of disruptive variants that target
response elements for factors of special interest to prostate
cancer, namely AR, FOXA1, NKX3-1, TCF7L2, MYC,
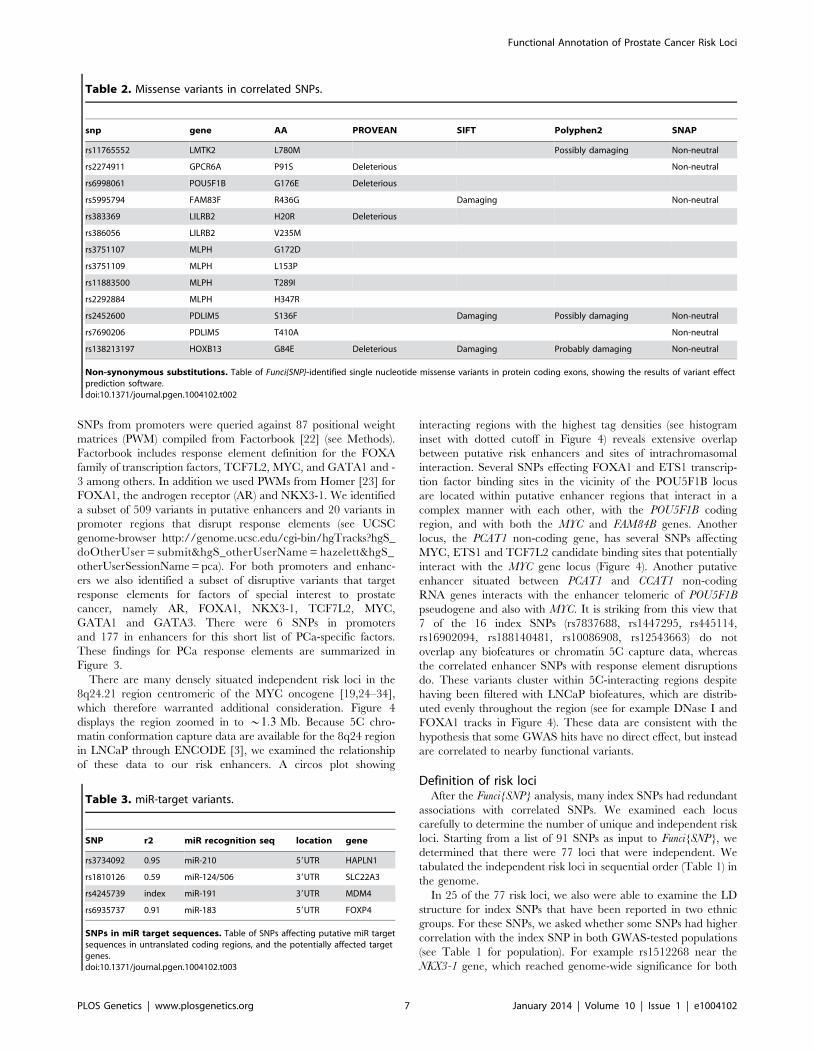
GATA1 and GATA3. There were 6 SNPs in promoters
and 177 in enhancers for this short list of PCa-specific factors.
These findings for PCa response elements are summarized in
Figure 3.
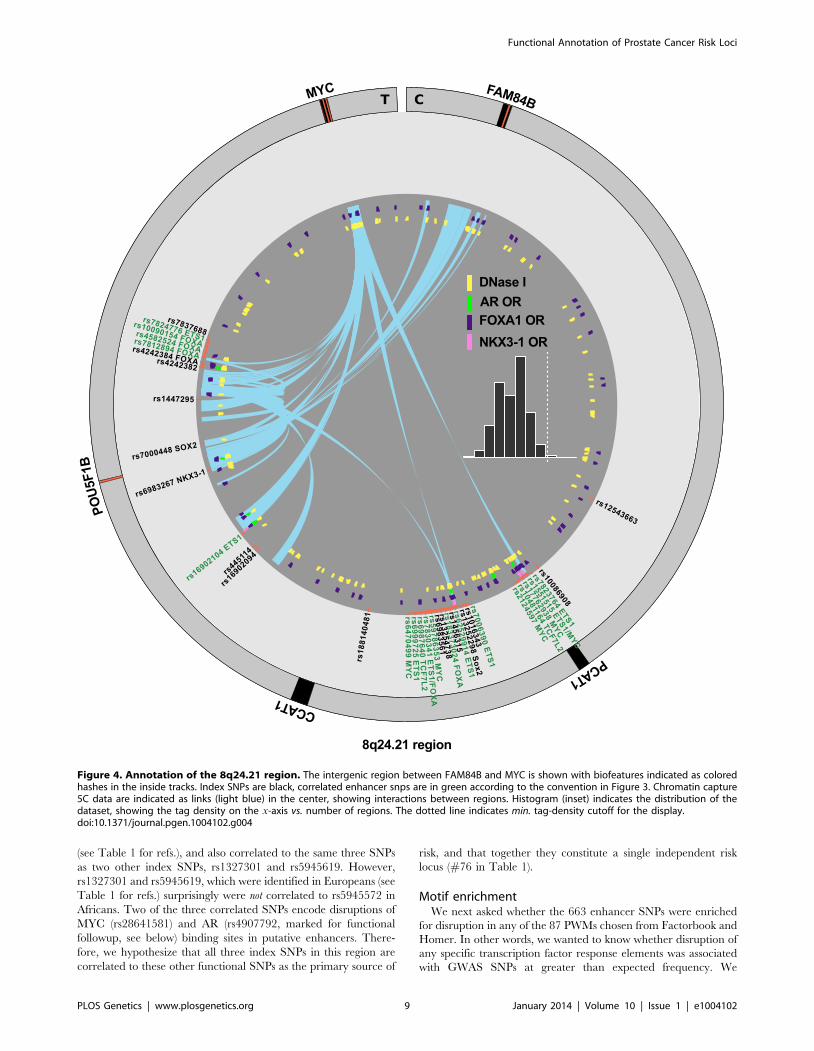
There are many densely situated independent risk loci in the
8q24.21 region centromeric of the MYC oncogene [19,24–34],
which therefore warranted additional consideration. Figure 4
displays the region zoomed in to *1:3 Mb. Because 5C chro-
matin conformation capture data are available for the 8q24 region
in LNCaP through ENCODE [3], we examined the relationship
of these data to our risk enhancers. A circos plot showing
interacting regions with the highest tag densities (see histogram
inset with dotted cutoff in Figure 4) reveals extensive overlap
between putative risk enhancers and sites of intrachromasomal
interaction. Several SNPs effecting FOXA1 and ETS1 transcrip-
tion factor binding sites in the vicinity of the POU5F1B locus
are located within putative enhancer regions that interact in a
complex manner with each other, with the POU5F1B coding
region, and with both the MYC and FAM84B genes. Another
locus, the PCAT1 non-coding gene, has several SNPs affecting
MYC, ETS1 and TCF7L2 candidate binding sites that potentially
interact with the MYC gene locus (Figure 4). Another putative
enhancer situated between PCAT1 and CCAT1 non-coding
RNA genes interacts with the enhancer telomeric of POU5F1B
pseudogene and also with MYC. It is striking from this view that
7 of the 16 index SNPs (rs7837688, rs1447295, rs445114,
rs16902094, rs188140481, rs10086908, rs12543663) do not
overlap any biofeatures or chromatin 5C capture data, whereas
the correlated enhancer SNPs with response element disruptions
do. These variants cluster within 5C-interacting regions despite
having been filtered with LNCaP biofeatures, which are distrib-
uted evenly throughout the region (see for example DNase I and
FOXA1 tracks in Figure 4). These data are consistent with the
hypothesis that some GWAS hits have no direct effect, but instead
are correlated to nearby functional variants.
Definition of risk lociAfter the Funci{SNP} analysis, many index SNPs had redundant
associations with correlated SNPs. We examined each locus
carefully to determine the number of unique and independent risk
loci. Starting from a list of 91 SNPs as input to Funci{SNP}, we
determined that there were 77 loci that were independent. We
tabulated the independent risk loci in sequential order (Table 1) in
the genome.
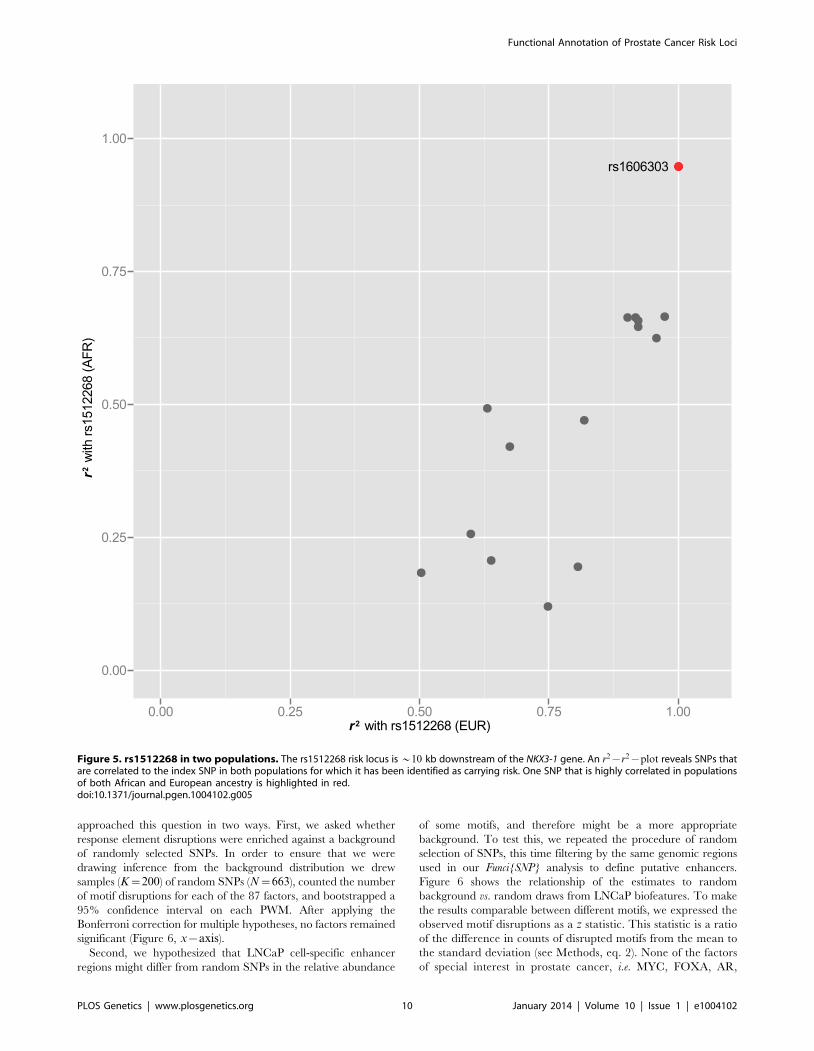
In 25 of the 77 risk loci, we also were able to examine the LD
structure for index SNPs that have been reported in two ethnic
groups. For these SNPs, we asked whether some SNPs had higher
correlation with the index SNP in both GWAS-tested populations
(see Table 1 for population). For example rs1512268 near the
NKX3-1 gene, which reached genome-wide significance for both
Table 2. Missense variants in correlated SNPs.
snp gene AA PROVEAN SIFT Polyphen2 SNAP
rs11765552 LMTK2 L780M Possibly damaging Non-neutral
rs2274911 GPCR6A P91S Deleterious Non-neutral
rs6998061 POU5F1B G176E Deleterious
rs5995794 FAM83F R436G Damaging Non-neutral
rs383369 LILRB2 H20R Deleterious
rs386056 LILRB2 V235M
rs3751107 MLPH G172D
rs3751109 MLPH L153P
rs11883500 MLPH T289I
rs2292884 MLPH H347R
rs2452600 PDLIM5 S136F Damaging Possibly damaging Non-neutral
rs7690206 PDLIM5 T410A Non-neutral
rs138213197 HOXB13 G84E Deleterious Damaging Probably damaging Non-neutral
Non-synonymous substitutions. Table of Funci{SNP}-identified single nucleotide missense variants in protein coding exons, showing the results of variant effectprediction software.doi:10.1371/journal.pgen.1004102.t002
Table 3. miR-target variants.
SNP r2 miR recognition seq location gene
rs3734092 0.95 miR-210 59UTR HAPLN1
rs1810126 0.59 miR-124/506 39UTR SLC22A3
rs4245739 index miR-191 39UTR MDM4
rs6935737 0.91 miR-183 59UTR FOXP4
SNPs in miR target sequences. Table of SNPs affecting putative miR targetsequences in untranslated coding regions, and the potentially affected targetgenes.doi:10.1371/journal.pgen.1004102.t003
Functional Annotation of Prostate Cancer Risk Loci
PLOS Genetics | www.plosgenetics.org 7 January 2014 | Volume 10 | Issue 1 | e1004102
African and European populations (see Table 1 for references),
was correlated to 15 other SNPs at r2§0:5, but a single SNP,
rs1606303 was highly correlated at r2§0:9 in populations
with both African and European ancestry (Figure 5). Thus, we
have also identified subsets of SNPs in the supplementary materials
for rs12621278 (Figure S4), rs7584330 (Figure S5), rs17021918
(Figure S6), rs7679673 (Figure S7), rs12653946 (Figure S8),
rs1983891 (Figure S9), rs339331 (Figure S10), rs9364554
(Figure S11), rs10486567 (Figure S12), rs6983267 (Figure S13),
rs7127900 (Figure S14), rs10896449 (Figure S15), rs11228565
(Figure S16) and rs8102476 (Figure S17) present in different ethnic
groups.
Nine other loci, at rs2710647, rs6465657, rs13252298,
rs7000448, rs817826, rs1571801, rs10993994, rs5759167 and
rs5919432 did not have any SNPs at r2§0:5 in both populations.
It is possible that the likeliest functional SNP in these cases is
the index SNP. One remaining SNP, rs5945572 in the NUDT11
region, was identified in African and European populations
Figure 3. Genome-wide summary of functional annotations. Detailed map of the locations and annotations associated with risk for prostatecancer throughout the human genome. Each ring shows, successive from center, the names and locations of proximal genes, the tag- or index-SNPs,and the correlated (r2
§0:5) SNPs. The links in the center highlight known biochemical interactors (e.g. receptor-ligand pairs). Index and correlatedSNPs are color-coded by putative functional category (see Legend, center). Potentially disrupted response elements are also indicated for thecorrelated SNPs. The outermost ring shows the numbered chromosomes to scale with cytological banding patterns. The genome is displayedclockwise from top, with p displayed as the left arm of each chromosome and q as the right arm.doi:10.1371/journal.pgen.1004102.g003
Functional Annotation of Prostate Cancer Risk Loci
PLOS Genetics | www.plosgenetics.org 8 January 2014 | Volume 10 | Issue 1 | e1004102
(see Table 1 for refs.), and also correlated to the same three SNPs
as two other index SNPs, rs1327301 and rs5945619. However,
rs1327301 and rs5945619, which were identified in Europeans (see
Table 1 for refs.) surprisingly were not correlated to rs5945572 in
Africans. Two of the three correlated SNPs encode disruptions of
MYC (rs28641581) and AR (rs4907792, marked for functional
followup, see below) binding sites in putative enhancers. There-
fore, we hypothesize that all three index SNPs in this region are
correlated to these other functional SNPs as the primary source of
risk, and that together they constitute a single independent risk
locus (#76 in Table 1).
Motif enrichmentWe next asked whether the 663 enhancer SNPs were enriched
for disruption in any of the 87 PWMs chosen from Factorbook and
Homer. In other words, we wanted to know whether disruption of
any specific transcription factor response elements was associated
with GWAS SNPs at greater than expected frequency. We
Figure 4. Annotation of the 8q24.21 region. The intergenic region between FAM84B and MYC is shown with biofeatures indicated as coloredhashes in the inside tracks. Index SNPs are black, correlated enhancer snps are in green according to the convention in Figure 3. Chromatin capture5C data are indicated as links (light blue) in the center, showing interactions between regions. Histogram (inset) indicates the distribution of thedataset, showing the tag density on the x-axis vs. number of regions. The dotted line indicates min. tag-density cutoff for the display.doi:10.1371/journal.pgen.1004102.g004
Functional Annotation of Prostate Cancer Risk Loci
PLOS Genetics | www.plosgenetics.org 9 January 2014 | Volume 10 | Issue 1 | e1004102
approached this question in two ways. First, we asked whether
response element disruptions were enriched against a background
of randomly selected SNPs. In order to ensure that we were
drawing inference from the background distribution we drew
samples (K~200) of random SNPs (N~663), counted the number
of motif disruptions for each of the 87 factors, and bootstrapped a
95% confidence interval on each PWM. After applying the
Bonferroni correction for multiple hypotheses, no factors remained
significant (Figure 6, x{axis).
Second, we hypothesized that LNCaP cell-specific enhancer
regions might differ from random SNPs in the relative abundance
of some motifs, and therefore might be a more appropriate
background. To test this, we repeated the procedure of random
selection of SNPs, this time filtering by the same genomic regions
used in our Funci{SNP} analysis to define putative enhancers.
Figure 6 shows the relationship of the estimates to random
background vs. random draws from LNCaP biofeatures. To make
the results comparable between different motifs, we expressed the
observed motif disruptions as a z statistic. This statistic is a ratio
of the difference in counts of disrupted motifs from the mean to
the standard deviation (see Methods, eq. 2). None of the factors
of special interest in prostate cancer, i.e. MYC, FOXA, AR,
Figure 5. rs1512268 in two populations. The rs1512268 risk locus is *10 kb downstream of the NKX3-1 gene. An r2{r2{plot reveals SNPs thatare correlated to the index SNP in both populations for which it has been identified as carrying risk. One SNP that is highly correlated in populationsof both African and European ancestry is highlighted in red.doi:10.1371/journal.pgen.1004102.g005
Functional Annotation of Prostate Cancer Risk Loci
PLOS Genetics | www.plosgenetics.org 10 January 2014 | Volume 10 | Issue 1 | e1004102
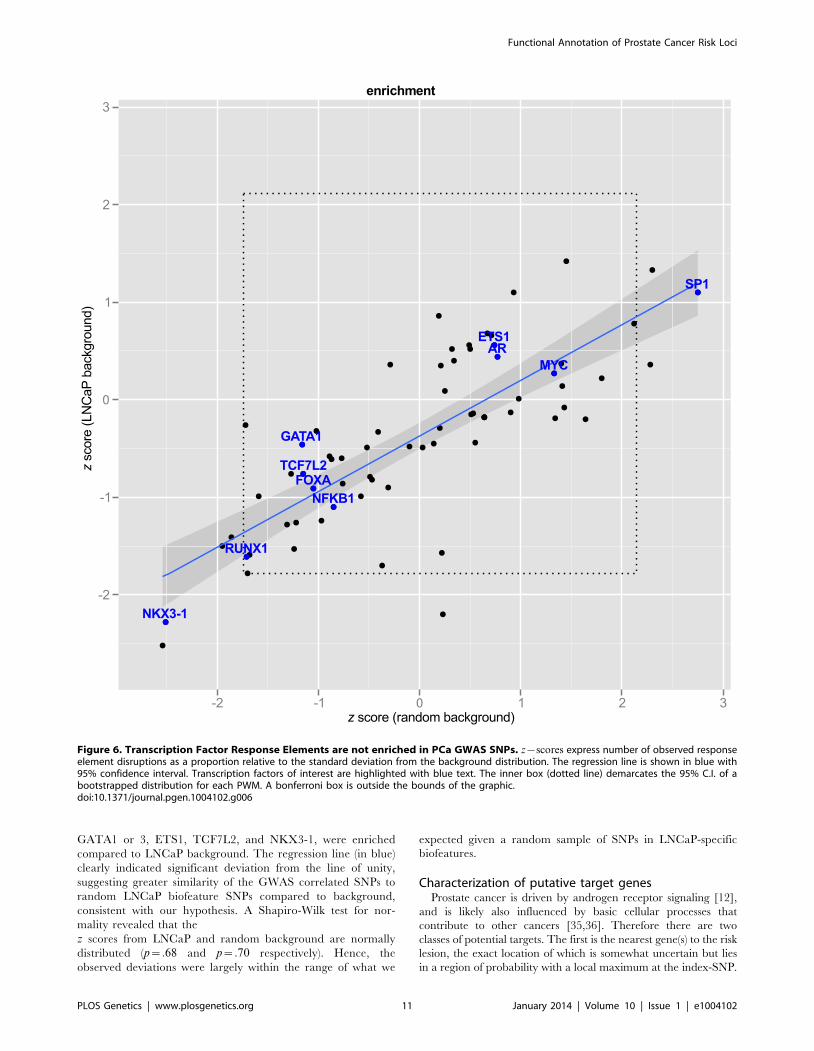
GATA1 or 3, ETS1, TCF7L2, and NKX3-1, were enriched
compared to LNCaP background. The regression line (in blue)
clearly indicated significant deviation from the line of unity,
suggesting greater similarity of the GWAS correlated SNPs to
random LNCaP biofeature SNPs compared to background,
consistent with our hypothesis. A Shapiro-Wilk test for nor-
mality revealed that the
z scores from LNCaP and random background are normally
distributed (p~:68 and p~:70 respectively). Hence, the
observed deviations were largely within the range of what we
expected given a random sample of SNPs in LNCaP-specific
biofeatures.
Characterization of putative target genesProstate cancer is driven by androgen receptor signaling [12],
and is likely also influenced by basic cellular processes that
contribute to other cancers [35,36]. Therefore there are two
classes of potential targets. The first is the nearest gene(s) to the risk
lesion, the exact location of which is somewhat uncertain but lies
in a region of probability with a local maximum at the index-SNP.
Figure 6. Transcription Factor Response Elements are not enriched in PCa GWAS SNPs. z{scores express number of observed responseelement disruptions as a proportion relative to the standard deviation from the background distribution. The regression line is shown in blue with95% confidence interval. Transcription factors of interest are highlighted with blue text. The inner box (dotted line) demarcates the 95% C.I. of abootstrapped distribution for each PWM. A bonferroni box is outside the bounds of the graphic.doi:10.1371/journal.pgen.1004102.g006
Functional Annotation of Prostate Cancer Risk Loci
PLOS Genetics | www.plosgenetics.org 11 January 2014 | Volume 10 | Issue 1 | e1004102
In this category there are known oncogenes and tumor suppres-
sors. The second class, which does not exclude the first, comprises
genes that are known targets of regulation by the androgen
receptor.
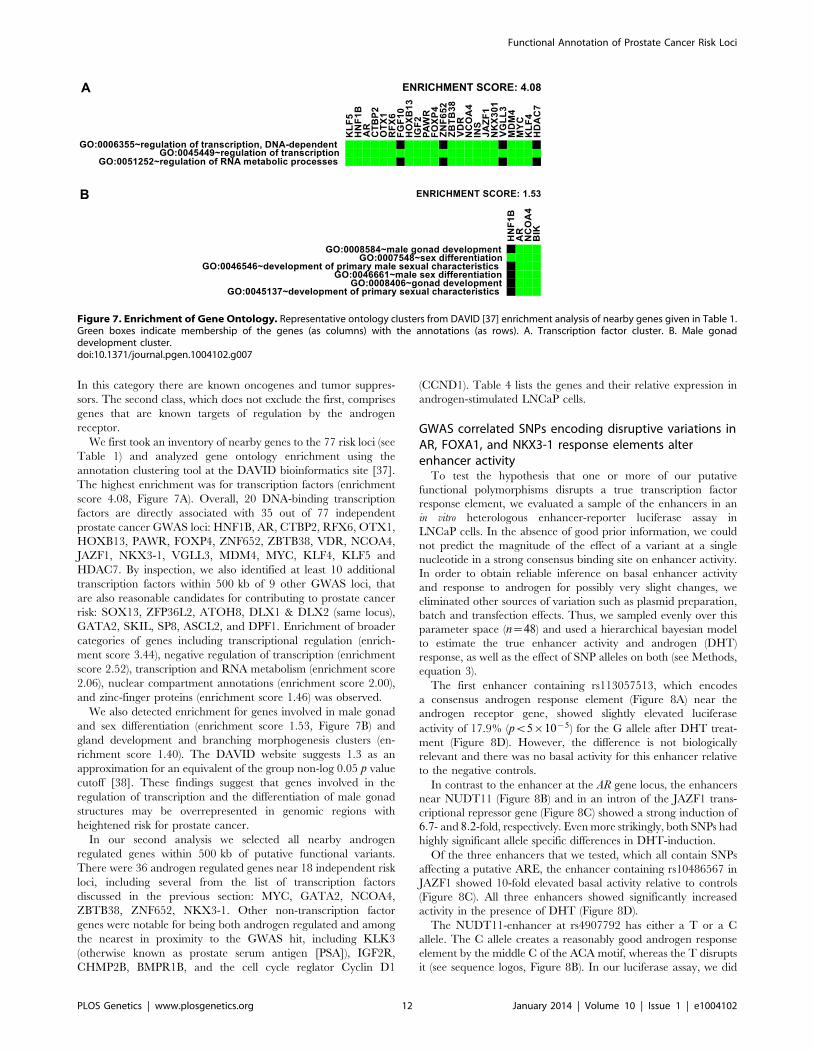
We first took an inventory of nearby genes to the 77 risk loci (see
Table 1) and analyzed gene ontology enrichment using the
annotation clustering tool at the DAVID bioinformatics site [37].
The highest enrichment was for transcription factors (enrichment
score 4.08, Figure 7A). Overall, 20 DNA-binding transcription
factors are directly associated with 35 out of 77 independent
prostate cancer GWAS loci: HNF1B, AR, CTBP2, RFX6, OTX1,
HOXB13, PAWR, FOXP4, ZNF652, ZBTB38, VDR, NCOA4,
JAZF1, NKX3-1, VGLL3, MDM4, MYC, KLF4, KLF5 and
HDAC7. By inspection, we also identified at least 10 additional
transcription factors within 500 kb of 9 other GWAS loci, that
are also reasonable candidates for contributing to prostate cancer
risk: SOX13, ZFP36L2, ATOH8, DLX1 & DLX2 (same locus),
GATA2, SKIL, SP8, ASCL2, and DPF1. Enrichment of broader
categories of genes including transcriptional regulation (enrich-
ment score 3.44), negative regulation of transcription (enrichment
score 2.52), transcription and RNA metabolism (enrichment score
2.06), nuclear compartment annotations (enrichment score 2.00),
and zinc-finger proteins (enrichment score 1.46) was observed.
We also detected enrichment for genes involved in male gonad
and sex differentiation (enrichment score 1.53, Figure 7B) and
gland development and branching morphogenesis clusters (en-
richment score 1.40). The DAVID website suggests 1.3 as an
approximation for an equivalent of the group non-log 0.05 p value
cutoff [38]. These findings suggest that genes involved in the
regulation of transcription and the differentiation of male gonad
structures may be overrepresented in genomic regions with
heightened risk for prostate cancer.
In our second analysis we selected all nearby androgen
regulated genes within 500 kb of putative functional variants.
There were 36 androgen regulated genes near 18 independent risk
loci, including several from the list of transcription factors
discussed in the previous section: MYC, GATA2, NCOA4,
ZBTB38, ZNF652, NKX3-1. Other non-transcription factor
genes were notable for being both androgen regulated and among
the nearest in proximity to the GWAS hit, including KLK3
(otherwise known as prostate serum antigen [PSA]), IGF2R,
CHMP2B, BMPR1B, and the cell cycle reglator Cyclin D1
(CCND1). Table 4 lists the genes and their relative expression in
androgen-stimulated LNCaP cells.
GWAS correlated SNPs encoding disruptive variations inAR, FOXA1, and NKX3-1 response elements alterenhancer activity
To test the hypothesis that one or more of our putative
functional polymorphisms disrupts a true transcription factor
response element, we evaluated a sample of the enhancers in an
in vitro heterologous enhancer-reporter luciferase assay in
LNCaP cells. In the absence of good prior information, we could
not predict the magnitude of the effect of a variant at a single
nucleotide in a strong consensus binding site on enhancer activity.
In order to obtain reliable inference on basal enhancer activity
and response to androgen for possibly very slight changes, we
eliminated other sources of variation such as plasmid preparation,
batch and transfection effects. Thus, we sampled evenly over this
parameter space (n~48) and used a hierarchical bayesian model
to estimate the true enhancer activity and androgen (DHT)
response, as well as the effect of SNP alleles on both (see Methods,
equation 3).
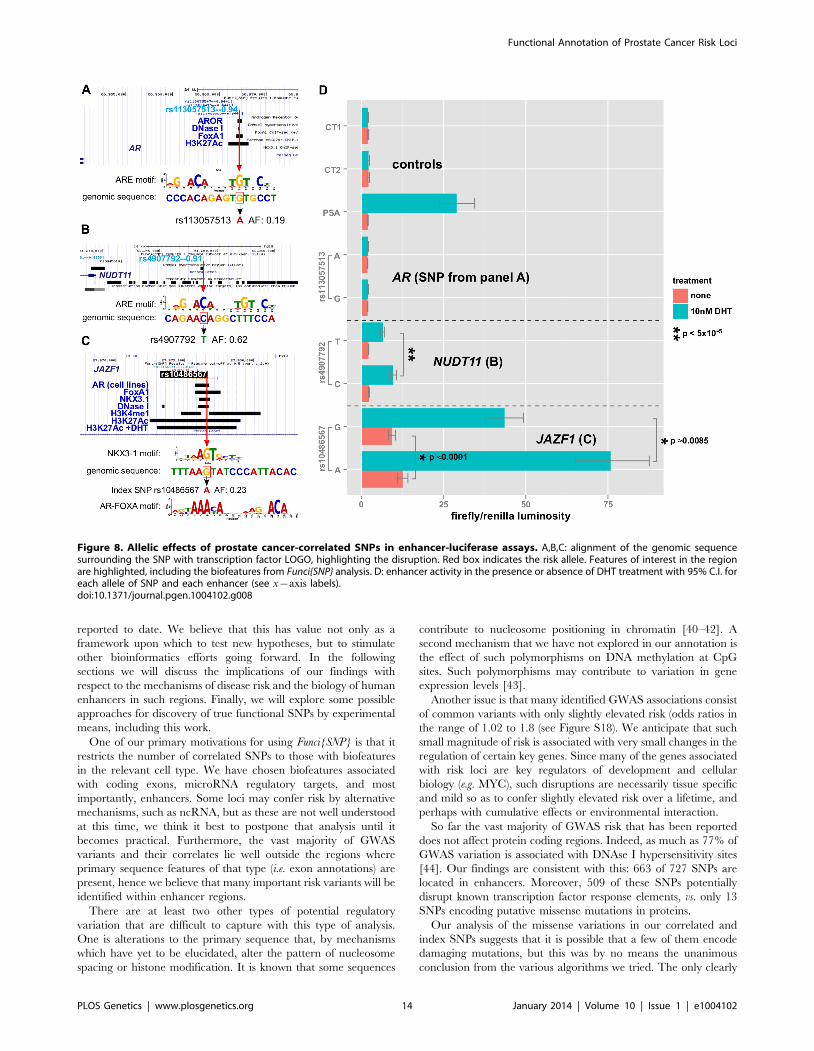
The first enhancer containing rs113057513, which encodes
a consensus androgen response element (Figure 8A) near the
androgen receptor gene, showed slightly elevated luciferase
activity of 17.9% (pv5|10{5) for the G allele after DHT treat-
ment (Figure 8D). However, the difference is not biologically
relevant and there was no basal activity for this enhancer relative
to the negative controls.
In contrast to the enhancer at the AR gene locus, the enhancers
near NUDT11 (Figure 8B) and in an intron of the JAZF1 trans-
criptional repressor gene (Figure 8C) showed a strong induction of
6:7- and 8:2-fold, respectively. Even more strikingly, both SNPs had
highly significant allele specific differences in DHT-induction.
Of the three enhancers that we tested, which all contain SNPs
affecting a putative ARE, the enhancer containing rs10486567 in
JAZF1 showed 10-fold elevated basal activity relative to controls
(Figure 8C). All three enhancers showed significantly increased
activity in the presence of DHT (Figure 8D).
The NUDT11-enhancer at rs4907792 has either a T or a C
allele. The C allele creates a reasonably good androgen response
element by the middle C of the ACA motif, whereas the T disrupts
it (see sequence logos, Figure 8B). In our luciferase assay, we did
Figure 7. Enrichment of Gene Ontology. Representative ontology clusters from DAVID [37] enrichment analysis of nearby genes given in Table 1.Green boxes indicate membership of the genes (as columns) with the annotations (as rows). A. Transcription factor cluster. B. Male gonaddevelopment cluster.doi:10.1371/journal.pgen.1004102.g007
Functional Annotation of Prostate Cancer Risk Loci
PLOS Genetics | www.plosgenetics.org 12 January 2014 | Volume 10 | Issue 1 | e1004102
not detect a difference between alleles in basal activity, however
the T allele is weaker by an estimated 1.8-fold relative to the C
allele after induction with DHT. This 80% difference in the
activity of the two alleles suggests that rs4907792 is critically
important to the androgen sensitivity of this enhancer, and that the
C allele of rs4907702 has more activity than the T allele.
For the JAZF1 enhancer, we detected a very significant difference
of 1.39-fold (95% credible range of differences 1.21–1.61) in basal
activity between the G and the A allele (Figure 8C, salmon bars). This
particular locus is bound by the tumor suppressor NKX3-1 and the
oncogene FOXA1 in LNCaP cells (Figure 8C, gbrowse view) and the
SNP itself affects a critical residue in the response elements of both
factors (see logos in Figure 8C). Thus, one version of rs10486567,
encoding a G, creates a strong consensus NKX3-1 response element
at this position. The alternate version of the SNP, encoding an A,
destroys the NKX3-1 site in favor of an equally strong FOXA1 site.
Androgen Receptor also binds to the locus (Figure 8C) in LNCaP
cells, and it is flanked by H3K4-monomethyl and H3K27-
acetylation signals, providing additional evidence for this locus as
a true enhancer. Consistent with a role for androgen signaling at this
enhancer, we observed a 6.7-fold induction for the A allele after
DHT treatment. We also detected significant allele-specific differ-
ences in DHT induction of 1.28-fold between A and G (95%
credible range of differences 1.09–1.47), with the A allele being the
strongest. Thus, there is an estimated mean difference of 28% in the
magnitude of the androgen effect between the A and G alleles of
rs10486567.
Therefore, the risk associated with the C allele of rs4907792 creates
a stronger androgen response element and increased NUDT11 ex-
pression by eQTL analysis [39]. Interestingly, the risk associated with
the G allele of rs10486567 in the JAZF1 intron creates an NKX3-1
binding site while destroying a FOXA1 binding site in line with the
DHT-dependent decrease in enhancer activity; we would hypothesize
that JAZF1 is likely a tumor suppressor influenced by this enhancer.
Discussion
Funci{SNP}We have presented here the most comprehensive account and
annotation of GWAS risk loci for prostate cancer that have been
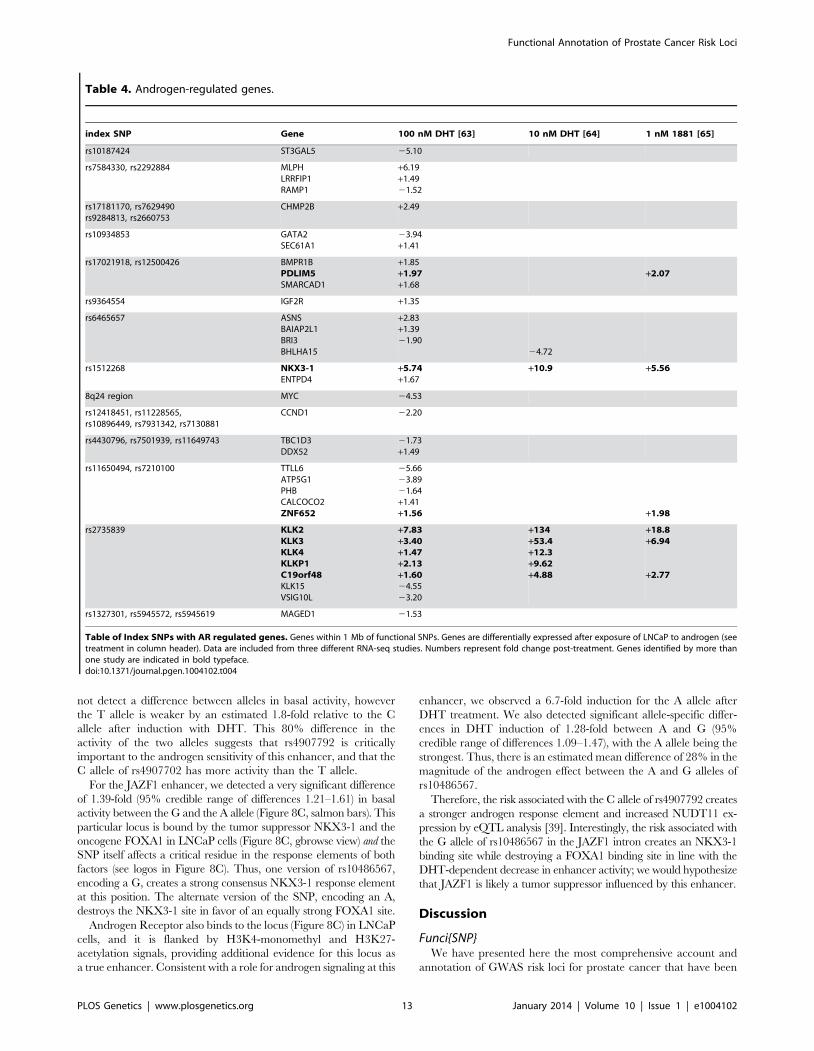
Table 4. Androgen-regulated genes.
index SNP Gene 100 nM DHT [63] 10 nM DHT [64] 1 nM 1881 [65]
rs10187424 ST3GAL5 25.10
rs7584330, rs2292884 MLPHLRRFIP1RAMP1
+6.19+1.4921.52
rs17181170, rs7629490rs9284813, rs2660753
CHMP2B +2.49
rs10934853 GATA2SEC61A1
23.94+1.41
rs17021918, rs12500426 BMPR1BPDLIM5SMARCAD1
+1.85+1.97+1.68
+2.07
rs9364554 IGF2R +1.35
rs6465657 ASNSBAIAP2L1BRI3BHLHA15
+2.83+1.3921.90
24.72
rs1512268 NKX3-1ENTPD4
+5.74+1.67
+10.9 +5.56
8q24 region MYC 24.53
rs12418451, rs11228565,rs10896449, rs7931342, rs7130881
CCND1 22.20
rs4430796, rs7501939, rs11649743 TBC1D3DDX52
21.73+1.49
rs11650494, rs7210100 TTLL6ATP5G1PHBCALCOCO2ZNF652
25.6623.8921.64+1.41+1.56 +1.98
rs2735839 KLK2KLK3KLK4KLKP1C19orf48KLK15VSIG10L
+7.83+3.40+1.47+2.13+1.6024.5523.20
+134+53.4+12.3+9.62+4.88
+18.8+6.94
+2.77
rs1327301, rs5945572, rs5945619 MAGED1 21.53
Table of Index SNPs with AR regulated genes. Genes within 1 Mb of functional SNPs. Genes are differentially expressed after exposure of LNCaP to androgen (seetreatment in column header). Data are included from three different RNA-seq studies. Numbers represent fold change post-treatment. Genes identified by more thanone study are indicated in bold typeface.doi:10.1371/journal.pgen.1004102.t004
Functional Annotation of Prostate Cancer Risk Loci
PLOS Genetics | www.plosgenetics.org 13 January 2014 | Volume 10 | Issue 1 | e1004102
reported to date. We believe that this has value not only as a
framework upon which to test new hypotheses, but to stimulate
other bioinformatics efforts going forward. In the following
sections we will discuss the implications of our findings with
respect to the mechanisms of disease risk and the biology of human
enhancers in such regions. Finally, we will explore some possible
approaches for discovery of true functional SNPs by experimental
means, including this work.
One of our primary motivations for using Funci{SNP} is that it
restricts the number of correlated SNPs to those with biofeatures
in the relevant cell type. We have chosen biofeatures associated
with coding exons, microRNA regulatory targets, and most
importantly, enhancers. Some loci may confer risk by alternative
mechanisms, such as ncRNA, but as these are not well understood
at this time, we think it best to postpone that analysis until it
becomes practical. Furthermore, the vast majority of GWAS
variants and their correlates lie well outside the regions where
primary sequence features of that type (i.e. exon annotations) are
present, hence we believe that many important risk variants will be
identified within enhancer regions.
There are at least two other types of potential regulatory
variation that are difficult to capture with this type of analysis.
One is alterations to the primary sequence that, by mechanisms
which have yet to be elucidated, alter the pattern of nucleosome
spacing or histone modification. It is known that some sequences
contribute to nucleosome positioning in chromatin [40–42]. A
second mechanism that we have not explored in our annotation is
the effect of such polymorphisms on DNA methylation at CpG
sites. Such polymorphisms may contribute to variation in gene
expression levels [43].
Another issue is that many identified GWAS associations consist
of common variants with only slightly elevated risk (odds ratios in
the range of 1.02 to 1.8 (see Figure S18). We anticipate that such
small magnitude of risk is associated with very small changes in the
regulation of certain key genes. Since many of the genes associated
with risk loci are key regulators of development and cellular
biology (e.g. MYC), such disruptions are necessarily tissue specific
and mild so as to confer slightly elevated risk over a lifetime, and
perhaps with cumulative effects or environmental interaction.
So far the vast majority of GWAS risk that has been reported
does not affect protein coding regions. Indeed, as much as 77% of
GWAS variation is associated with DNAse I hypersensitivity sites
[44]. Our findings are consistent with this: 663 of 727 SNPs are
located in enhancers. Moreover, 509 of these SNPs potentially
disrupt known transcription factor response elements, vs. only 13
SNPs encoding putative missense mutations in proteins.
Our analysis of the missense variations in our correlated and
index SNPs suggests that it is possible that a few of them encode
damaging mutations, but this was by no means the unanimous
conclusion from the various algorithms we tried. The only clearly
Figure 8. Allelic effects of prostate cancer-correlated SNPs in enhancer-luciferase assays. A,B,C: alignment of the genomic sequencesurrounding the SNP with transcription factor LOGO, highlighting the disruption. Red box indicates the risk allele. Features of interest in the regionare highlighted, including the biofeatures from Funci{SNP} analysis. D: enhancer activity in the presence or absence of DHT treatment with 95% C.I. foreach allele of SNP and each enhancer (see x{axis labels).doi:10.1371/journal.pgen.1004102.g008
Functional Annotation of Prostate Cancer Risk Loci
PLOS Genetics | www.plosgenetics.org 14 January 2014 | Volume 10 | Issue 1 | e1004102
damaging variant was rs138213197, which encodes a change from
Glycine to Glutamate in the HOXB13 gene, and was previously
reported to be associated with a high risk of prostate cancer
[45]. This result was also recently confirmed in a GWAS [46].
Expression of HOXB13 is critical for mammalian prostate
development [47], and likely involved in carcinogenesis of the
prostate as a tumor suppressor [48,49]. The allele frequency of this
variant is very low (0:119%), possibly suggesting lower fitness in
utero. Furthermore the risk allele has an odds ratio of 4.42 [46] and
individual carriers are likely to contract prostate cancer at an
earlier age [45]. Nonetheless, it remains possible that even milder
variants in one of the other proteins that we have catalogued in
Table 2 also contribute to risk. It will be necessary to do follow-up
allele replacement experiments either in cell lines or in other
model systems, e.g. mouse to determine the contribution to cellular
or disease phenotype, if any.
In order to zero in on which SNPs are likely to be functional
and causal, we need to know which of the putative enhancer
regions are most likely to be true enhancers. This information will
come from a variety of sources including computational models
using ENCODE data. In addition, chromatin conformation
capture experiments that elucidate the intrachromosomal looping,
which brings transcription factors into association with the PolII
complex at promoters and thereby promotes gene transcription
will be vital to this effort. ENCODE has provided some limited 5C
chromatin interaction data for the MYC region, which we have
superimposed on our Funci{SNP} results in Figure 4. These data
show a clear relationship between the Funci{SNP} results and
regions of chromatin that interact with both MYC and other genes
in the region. Despite the fact that chromatin biofeatures are
scattered evenly throughout the region, the correlated SNPs
appear to fall only within these special regions where intramolec-
ular chromatin interactions are apparent. It is also notable that the
specialist transcription factors AR and NKX3-1 are restricted to
these regions. One of the most striking examples of the power of
the Funci{SNP} approach is the potentially significant information
obtained for the rs188140481 index SNP, which as we have
previously pointed out does not coincide with LNCaP biofeatures
[50]. It resides *90 kb distant from one highly correlated SNP,
rs183373024, that encodes a lesion in a strong consensus FOXA1
binding motif. Rs183373024 also resides in DNAse I and FOXA1
ChIP-seq peaks [50], as well as highly significant 5C interaction
with the MYC locus (Figure 4).
Yet another clue about likely causality may be supplied by our
observation that at loci where GWAS identified the same suscepti-
bility in two or more populations, there are a subset of SNPs with
greater correlation to the index in both populations. Indeed, it has
been previously reported that disease associations that fail to repli-
cate between European and East Asian populations map to regions
where LD structure differs significantly [51]. Thus, the underlying
LD structure has potential to inform the search for functional SNPs.
Because of the importance of this point (illustrated in Figure 5), we
included plots, annotated with multiethnic-significant corrSNPs, of
LD structure for each region where risk was identified in more than
one ethnic group in the supplementary materials. These plots should
serve as a resource for followup studies being conducted on each
individual region. It makes sense in our view to prioritize these SNPs
over others when running empirical tests for functionality. This
finding also highlights the intrinsic value of identifying the same
associations in more than one ethnic group.
On enrichment of targetsA natural question about the prostate cancer GWA studies is
whether they point to specific mechanisms of risk, and whether
they shed any light on the mechanisms of development of prostate
cancer or cancer generally. We decided to look at the GWAS
data through the lens of human genetics and to treat the set of
observations the way one might approach a genetic screen in a
model organism.
Since a significant fraction of the risk occurs within enhancer
regions, it is a reasonable hypothesis that variations in transcrip-
tion factor response elements are responsible for the majority of
the functionality associated with such risk. Furthermore, if there
are one or more factors whose regulatory activity in the risk
regions is more important than the others, we might be able to
detect enrichment in its binding site disruptions. Key to our
analysis is the focus on significant disruptions, i.e. functional SNPs,
and exclusion of SNPs that merely fall within likely binding sites.
We did not find any strong evidence for enrichment of any motifs,
including MYC.
An association was reported for GWAS loci LD-blocks and
genome-wide androgen receptor bound regions [52]. Of course,
such associations imply but do not necessitate direct involvement
of the androgen receptor per se. We have attempted to address the
association specifically with AR by selecting variants with response
element disruptions. Although we did not see enrichment, we
reported two SNPs that exhibit clear effects on androgen sensitive
enhancer activity. However only one of the SNPs disrupts an
androgen receptor response element directly. One explanation to
reconcile our lack of enrichment with the previous study is that
GWAS loci are indeed enriched in androgen sensitive enhancers
(i.e. androgen bound), but the causal variants aren’t biased toward
disruption of a particular factor. Thus, any factor that disrupts
the activity of a particular androgen-sensitive enhancer might be
suspect. Biologically this makes some sense, since we expect the
target gene to be more important than components of the
regulatory network. It has long been known that transcription
factor motifs cluster in regulatory regions [53–55], and it was
reported recently that transcription factors cluster tightly in DNase
accessible regions in a cohesin-dependent fashion [56]. This
arrangement of transcription factors on enhancers in vivo is
consistent with this latter observation. Finally, we note that even
enrichment for androgen-bound mechanisms does not preclude a
subset of loci having androgen-independent risk.
It is worth mentioning the reasons we did not see enrichment and
implications of this for the risk mechanism. A trivial explanation for
lack of enrichment is insufficient sample size (N~663). Typical
disruptions for a given PWM fall somewhere in the range of 0 to
*30 for this sample size, with a median of 6. However, a more
likely scenario is that the signal is lost in the noise. If one or two
SNPs carries the majority of risk (as in Figure 9A), then Funci{SNP}
identifies these SNPs plus a handful of false positives. We would
more likely detect true enrichment if we restricted our analysis to
the set of true causal risk SNPs. On the other hand, it is possible that
clouds of functional variants in correlation with the index (as in
Figure 9B) carry the risk. Indeed, conserved clusters of individual
transcription factor motifs are found near target genes [57]. In that
case, we might have detected enrichment more readily in our
correlated set even if we are capturing only some of the causal
variants. Another possibility that has been proposed is that the
index-SNP is loosely correlated with multiple rare, high-effect
variants (the synthetic hypothesis) [58,59], and our analysis would
be insensitive to such a mechanism.
Which mechanism is most consistent with the aggregate of
PCa GWAS data? We identified several regions with a large
number of associated variants, for example the variants in the
8q24 region and rs7584330 (see also Figure S5). In contrast to
this we also identified many examples with no variants (beside
Functional Annotation of Prostate Cancer Risk Loci
PLOS Genetics | www.plosgenetics.org 15 January 2014 | Volume 10 | Issue 1 | e1004102
the index-SNP), including rs721048, rs1287748, rs1529276,
rs4775302, rs138213197, rs11650494 and rs103294 among
others. The remainder fall somewhere between these extremes.
Thus, a careful review of the 77 loci suggests that a mixture of
mechanisms are in play, and this alone may account for the lack of
enrichment.
It is also worth considering possible underlying causes of risk.
We looked at target enrichment, and found that transcription
factors are enriched in the vicinity of prostate cancer risk regions.
This suggests that risk is heavily influenced by perturbations to
transcriptional networks. We also uncovered evidence for enrich-
ment of factors involved in the development of male gonad and
glandular structures near GWAS risk loci, all consistent with the
biology of the tissue of origin for this cancer. Thus it appears that
dysregulation of these genes may contribute to risk for disease.
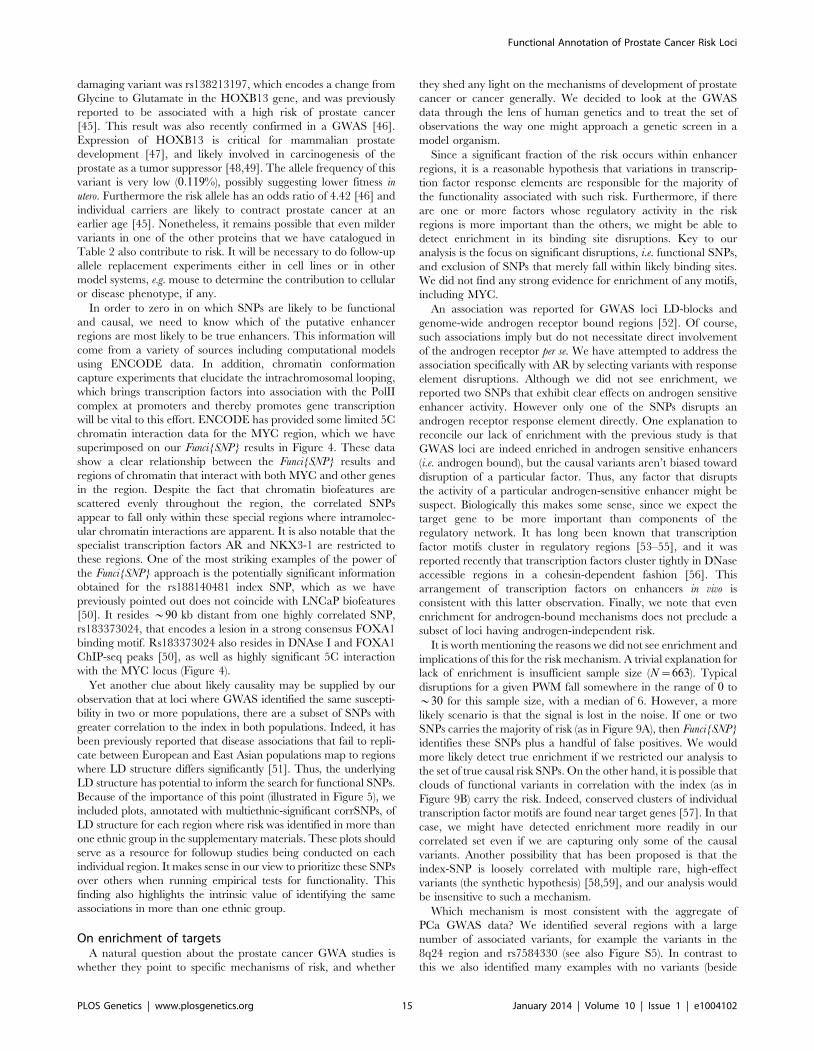
The simplest model for risk effectors is that a causal risk SNP(s)
affect the tissue-specific expression of a single key effector gene
(as in Figure 9C). There is some recent evidence from GWAS in
hypertension that multiple genes can be targeted [60] consistent
with the model in Figure 9D in which a single GWAS hit affects
multiple genes. Again, we see examples of loci that appear
consistent with either model (multiple- or single-hit risk), and it will
be intriguing in the coming years to uncover the true functional
SNPs and their effector genes.
Mechanisms for the effect of single nucleotidesubstitutions on enhancer activity
We have characterized two SNPs, rs4907792 and rs10486567,
with highly significant effects in a heterologous reporter assay.
These SNPs affect response elements of factors widely thought to
be drivers in the progression of prostate cancer. It is interesting to
compare and contrast the different effects we observed for the SNPs.
Rs4907792, which is located in the enhancer near NUDT11,
directly changes a computationally identified AR response
element. We observed little basal activity for this enhancer, but
a 7.8-fold activation in response to DHT. We detected an 80%
difference in the level of activation between the two alternate
versions of the SNP, consistent with our hypothesis that the SNP
itself affects a critical residue in a true androgen receptor response
element.
The SNP at rs4907792 is in linkage disequilibrium with index
SNPs rs5945572 (r2~0:95) and rs1327301 (r2~0:91), and also
with index SNP rs5945619 (r2~0:91), which is an eQTL with the
NUDT11 gene [39]. The ‘C’ allele of rs4907792, which resulted
in increased expression of reporter, correlates with the risk ‘C’
allele of rs5945619 (‘G’ in [39], referencing the bottom strand)
which is associated with higher expression of NUDT11. Thus,
rs4907792 is potentially the cause of slightly elevated expression
of NUDT11. The eQTLs do not measure androgen sensitivity
directly, and thus potentially underestimate the importance of
this relationship.
In contrast, the JAZF1 enhancer that contains the index
SNP rs10486567, surprisingly affects alternately good NKX3-1 or
FOXA1 binding sites (see sequence logos in Figure 8C). For this
enhancer we detected significant basal activity of 11 times that of
the control enhancers, and also 6.7-fold activation in response to
DHT. We detected an allele-specific difference in this enhancer of
28%, though significantly smaller than the NUDT11 enhancer.
Figure 9. Models for association of risk with effector genes. Red dots indicate the true causal variant position in the genome, as opposed tovariants that may be merely correlated with such functional variants (green dots). In panel I. we consider functionality of such variation within a locus.Causal association with risk for disease may be the result of a single variant (A) or multiple correlated variants (B) disrupting regulatory elements inenhancers (white box). In panel II we consider the effector genes of these causal variants. Arrows show regulatory interaction between enhancer andpromoter as revealed by chromatin conformation capture experiments. Risk may arise from a damaging hit to a regulatory region that affects theexpression of a single key oncogene or tumor suppressor (blue box) (C) or several effector genes that target a disease process or pathway (D).doi:10.1371/journal.pgen.1004102.g009
Functional Annotation of Prostate Cancer Risk Loci
PLOS Genetics | www.plosgenetics.org 16 January 2014 | Volume 10 | Issue 1 | e1004102
These observations are consistent with rs10486567 having a
direct effect on the basal transcription of the JAZF1 enhancer by
altering the stoichiometric balance between FoxA1 binding and
NKX3-1 binding, and an indirect but biologically relevant effect
on androgen sensitivity through the androgen receptor, whose
binding is promoted by FOXA1 [61].
The JAZF1 enhancer is situated in intron 3 of JAZF1, making
JAZF1 the likeliest target. Consistent with our hypothesis that
the index SNP rs10486567 (OR~1:12) is the most significant
functional variant, fine-mapping of the JAZF1 locus suggests that
this index SNP remains the most significant association in the
region [62]. JAZF1 encodes a transcriptional repressor, but its
expression is not regulated by androgens, at least not in LNCaP
[63–65]. It is notable however that LNCaP is homozygous for
the risk-allele ‘G’, which we found to be 39% less active and 28%
less responsive to androgen. Thus, the negative result in androgen
sensitive expression profiling may reflect reduced contribution
of this enhancer within the regulatory milieu of LNCaP cells.
Intriguingly, endometrial stromal sarcomas frequently involve
rearrangements of the JAZF1 locus [66,67]. JAZF1 may encode a
tumor suppressor since loss of expression is associated with
neoplastic development in multiple tumor types involving these
translocations [66], though the mechanism of protective activity is
unknown.
There are also two other nearby androgen regulated genes at
the JAZF1 locus, HIBADH and TAX1BP1. HIBADH encodes a
mitochondrial enzyme, and is negatively regulated by androgen
[63]. However, it is not associated with prostate development
or cancer. TAX1BP1 is a likely essential inhibitor of apoptosis
pathways mediated by NF-kB and JNK signaling [68]. Since the
simplest hypothesis would involve overexpression of this gene, it is
difficult to reconcile the risk allele leading to loss of TAX1BP1.
JAZF1 and TAX1BP1 abut at their 30
ends, so another possibility
is that decreased transcription of the JAZF1 locus alters the rate of
transcription or termination from TAX1BP1, thus increasing its
expression and indirectly promoting the anti-apoptotic pathway.
Conclusion
Our data and subsequent analyses paint a picture of prostate
cancer risk loci in which the majority of variants overlap likely
enhancer regions. But we also find a high degree of heterogeneity
in the arrangement of these loci and the number and types of
functional SNPs associated with them. We provided a complete
summary of the functional variants associated with GWAS risk in
prostate cancer, and analyzed the putative causal variants and
effector genes with respect to biological enrichment. In light of
these various observations, we explored the implications for
mechanisms of risk, and found that our data are consistent
with GWAS risk loci encoding one or more damaging variants in
stage- and tissue-specific enhancers. As a preliminary step toward
characterizing these variants, we cloned 3 enhancers and tested
them in an enhancer-luciferase assay with different versions of
the risk-associated SNPs. Two of the enhancers exhibited
androgen-responsiveness, and also exhibited allele-specific differ-
ences. Therefore, it will be interesting to see whether some of
the *200 enhancers we have characterized are tissue- or stage-
specific, which genes are modulated by their activity, and whether
those genes in turn have an effect on cellular phenotype. Going
forward, it will be necessary to characterize the effect of all the
risk elements and the correlated variants on gene regulation in
LNCaP. It will also be instructive to perform chromatin confor-
mation capture experiments, to further characterize and verify
the interaction of these enhancers with their target genes. As a
practical concern, we have identified a seemingly large number
of putative functional variants in need of testing (509 SNPs in
enhancers and 20 SNPs in promoters). Once the enhancers have
been tested for biological activity in vivo using knockout by TALen
or CRISPR, the number of variants will be further reduced. These
variants should then be prioritized by r2, including multi-ethnic
comparisons where possible, then by response element (e.g. an AR
binding sitewGFI1). This work will pay dividends not only for
understanding the etiology of prostate cancer and similar diseases,
but promises to greatly expand our understanding of the biology of
non-coding sequences in the genome.
Materials and Methods
Genome-wide ChIP-seqLNCaP cells were cultured as described previously [7]. For
H3K27Ac experiments they were first grown with charcoal-
stripped serum and harvested when 80% confluent. LNCaP were
stimulated for 4 hours either with 10 nM DHT or ethanol vehicle
control before collection. LNCaP for TCF7L2 ChIP-seq was
grown in RPMI 1640 supplemented with 5% FBS (not charcoal-
stripped) and collected when 80–90% confluent. Antibodies used
for ChIP-seq were: TCF7L2 (Cell Signaling Technology, Danvers,
MA, USA; C48H11 #2569, lot2), H3K27Ac (Active Motif,
Carlsbad, CA, USA; #39133, Lot#213110044). For the TCF7L2
ChIP-seq assay, 835 mg of chromatin was incubated with 25 mlantibody; for H3K27Ac, 10 mg chromatin was incubated with
6 mg antibody. TCF7L2 and the H3K27Ac ChIP assays were
performed as described [69] using protein A/G magnetic beads to
collect the immunoprecipitates. Enrichment of ChIP targets was
confirmed by qPCR and libraries were created as previously
described [69]. Gel size selection of the 200 to 500 bp fraction was
conducted after an adapter ligation step, followed by 15 amp-
lification cycles. The TCF7L2 library was run on an Illumina
GAIIx and mapped to the UCSC human genome assembly HG19
using Illumina eland pipeline. LNCaP H3K27Ac libraries were
barcoded and sequenced by the University of Southern California
Epigenome Center on an Illumina Hi-seq and aligned to the
UCSC human genome HG19 using Bowtie 2 [70]. Peaks were
called using Sole-search [71] (a~0:00001, FDR 0.0001 and a
blur length set to 1200 for H3K27Ac; a~0:001, FDR 0.001
for TCF7L2). The complete data for a-H3K27Ac ChIP-seq and
a-TCF7L2 ChIP-seq are deposited at GEO accession #GSE51621 (http://www.ncbi.nlm.nih.gov/geo/).
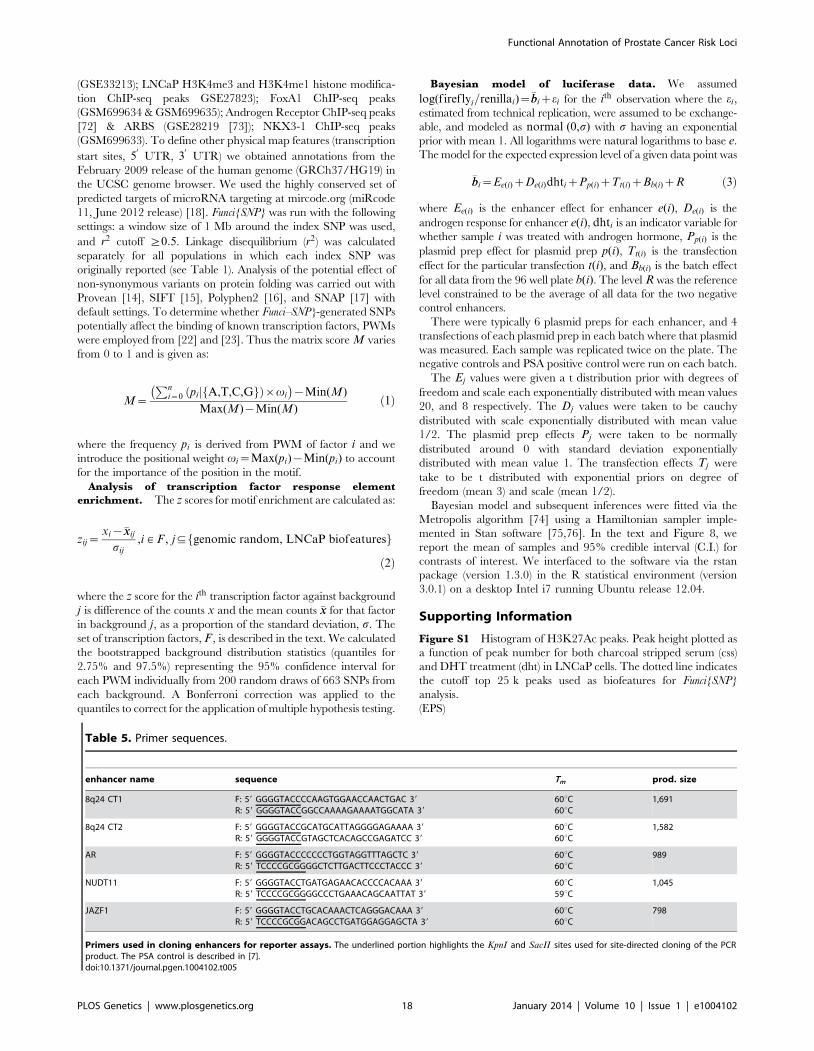
Luciferase enhancer assays and site-directedmutagenesis
Enhancers were amplified by polymerase-chain-reaction using
primers listed in Table 5 from LNCaP genomic DNA and cloned
into TK-luc2 plasmid as previously described [7]. Luciferase
enhancer assays and site-directed mutagenesis were performed
using previously published methods [7].
Models and computationFunci{SNP} analysis and assessment of SNP effects. To
integrate chromatin biofeature annotations with 1,000 ge-
nomes genotyping data, we used in-house developed R package
Funci{SNP}, available at Bioconductor.org [2]. We selected publicly
available datasets that are relevant to the biology of prostate
epithelia and prostate cancer. The following ENCODE datasets
were employed to filter correlated SNPs that lie within putative
enhancer regions with Gene Expression Omnibus (GEO) accession
IDs 1) LNCaP and RWPEI DnaseI HS sites (GSE32970); PrEC
DNaseI HS sites (GSE29692); LNCaP CTCF ChIP-seq peaks
Functional Annotation of Prostate Cancer Risk Loci
PLOS Genetics | www.plosgenetics.org 17 January 2014 | Volume 10 | Issue 1 | e1004102
(GSE33213); LNCaP H3K4me3 and H3K4me1 histone modifica-
tion ChIP-seq peaks GSE27823); FoxA1 ChIP-seq peaks
(GSM699634 & GSM699635); Androgen Receptor ChIP-seq peaks
[72] & ARBS (GSE28219 [73]); NKX3-1 ChIP-seq peaks
(GSM699633). To define other physical map features (transcription
start sites, 50
UTR, 30
UTR) we obtained annotations from the
February 2009 release of the human genome (GRCh37/HG19) in
the UCSC genome browser. We used the highly conserved set of
predicted targets of microRNA targeting at mircode.org (miRcode
11, June 2012 release) [18]. Funci{SNP} was run with the following
settings: a window size of 1 Mb around the index SNP was used,
and r2 cutoff §0:5. Linkage disequilibrium (r2) was calculated
separately for all populations in which each index SNP was
originally reported (see Table 1). Analysis of the potential effect of
non-synonymous variants on protein folding was carried out with
Provean [14], SIFT [15], Polyphen2 [16], and SNAP [17] with
default settings. To determine whether Funci–SNP}-generated SNPs
potentially affect the binding of known transcription factors, PWMs
were employed from [22] and [23]. Thus the matrix score M varies
from 0 to 1 and is given as:
M~
Pni~0 pi fA,T,C,Ggjð Þ|vi
� �{Min(M)
Max(M){Min(M)ð1Þ
where the frequency pi is derived from PWM of factor i and we
introduce the positional weight vi~Max(pi){Min(pi) to account
for the importance of the position in the motif.
Analysis of transcription factor response element
enrichment. The z scores for motif enrichment are calculated as:
zij~xi{�xxij
sij
,i [ F , j(fgenomic random, LNCaP biofeaturesg
ð2Þ
where the z score for the ith transcription factor against background
j is difference of the counts x and the mean counts �xx for that factor
in background j, as a proportion of the standard deviation, s. The
set of transcription factors, F , is described in the text. We calculated
the bootstrapped background distribution statistics (quantiles for
2.75% and 97.5%) representing the 95% confidence interval for
each PWM individually from 200 random draws of 663 SNPs from
each background. A Bonferroni correction was applied to the
quantiles to correct for the application of multiple hypothesis testing.
Bayesian model of luciferase data. We assumed
log(fireflyi=renillai)~�bbizei for the ith observation where the ei,
estimated from technical replication, were assumed to be exchange-
able, and modeled as normal (0,s) with s having an exponential
prior with mean 1. All logarithms were natural logarithms to base e.
The model for the expected expression level of a given data point was
�bbi~Ee(i)zDe(i)dhtizPp(i)zTt(i)zBb(i)zR ð3Þ
where Ee(i) is the enhancer effect for enhancer e(i), De(i) is the
androgen response for enhancer e(i), dhti is an indicator variable for
whether sample i was treated with androgen hormone, Pp(i) is the
plasmid prep effect for plasmid prep p(i), Tt(i) is the transfection
effect for the particular transfection t(i), and Bb(i) is the batch effect
for all data from the 96 well plate b(i). The level R was the reference
level constrained to be the average of all data for the two negative
control enhancers.
There were typically 6 plasmid preps for each enhancer, and 4
transfections of each plasmid prep in each batch where that plasmid
was measured. Each sample was replicated twice on the plate. The
negative controls and PSA positive control were run on each batch.
The Ej values were given a t distribution prior with degrees of
freedom and scale each exponentially distributed with mean values
20, and 8 respectively. The Dj values were taken to be cauchy
distributed with scale exponentially distributed with mean value
1/2. The plasmid prep effects Pj were taken to be normally
distributed around 0 with standard deviation exponentially
distributed with mean value 1. The transfection effects Tj were
take to be t distributed with exponential priors on degree of
freedom (mean 3) and scale (mean 1/2).
Bayesian model and subsequent inferences were fitted via the
Metropolis algorithm [74] using a Hamiltonian sampler imple-
mented in Stan software [75,76]. In the text and Figure 8, we
report the mean of samples and 95% credible interval (C.I.) for
contrasts of interest. We interfaced to the software via the rstan
package (version 1.3.0) in the R statistical environment (version
3.0.1) on a desktop Intel i7 running Ubuntu release 12.04.
Supporting Information
Figure S1 Histogram of H3K27Ac peaks. Peak height plotted as
a function of peak number for both charcoal stripped serum (css)
and DHT treatment (dht) in LNCaP cells. The dotted line indicates
the cutoff top 25 k peaks used as biofeatures for Funci{SNP}
analysis.
(EPS)
Table 5. Primer sequences.
enhancer name sequence Tm prod. size
8q24 CT1 F: 59 GGGGTACCCCAAGTGGAACCAACTGAC 39
R: 59 GGGGTACCGGCCAAAAGAAAATGGCATA 39
60uC60uC
1,691
8q24 CT2 F: 59 GGGGTACCGCATGCATTAGGGGAGAAAA 39
R: 59 GGGGTACCGTAGCTCACAGCCGAGATCC 39
60uC60uC
1,582
AR F: 59 GGGGTACCCCCCCTGGTAGGTTTAGCTC 39
R: 59 TCCCCGCGGGGCTCTTGACTTCCCTACCC 39
60uC60uC
989
NUDT11 F: 59 GGGGTACCTGATGAGAACACCCCACAAA 39
R: 59 TCCCCGCGGGGCCCTGAAACAGCAATTAT 39
60uC59uC
1,045
JAZF1 F: 59 GGGGTACCTGCACAAACTCAGGGACAAA 39
R: 59 TCCCCGCGGACAGCCTGATGGAGGAGCTA 39
60uC60uC
798
Primers used in cloning enhancers for reporter assays. The underlined portion highlights the KpnI and SacII sites used for site-directed cloning of the PCRproduct. The PSA control is described in [7].doi:10.1371/journal.pgen.1004102.t005
Functional Annotation of Prostate Cancer Risk Loci
PLOS Genetics | www.plosgenetics.org 18 January 2014 | Volume 10 | Issue 1 | e1004102
Figure S2 H3K27Ac Overlap of peaks +/2 DHT.
(EPS)
Figure S3 Enrichment of TCF7L2 binding sites within ChIP-seq
peaks. Average number of TCF7L2 motifs as a function of
distance from center of peak. Red line: top 20 k peaks. Blue line:
top 10 k peaks. Green line: top 5 k peaks.
(EPS)
Figure S4 rs12621278 in two populations. r2{r2{plot reveals
SNPs that are correlated to the index SNP in both populations for
which it has been identified as carrying risk. SNPs greater than
r2~0:5 are highlighted in red.
(EPS)
Figure S5 rs7584330 in two populations. r2{r2{plot reveals
SNPs that are correlated to the index SNP in both populations for
which it has been identified as carrying risk. SNPs greater than
r2~0:5 are highlighted in red.
(EPS)
Figure S6 rs17021918 in two populations. r2{r2{plot reveals
SNPs that are correlated to the index SNP in both populations for
which it has been identified as carrying risk. SNPs greater than
r2~0:5 are highlighted in red.
(EPS)
Figure S7 rs7679673 in two populations. r2{r2{plot reveals
SNPs that are correlated to the index SNP in both populations for
which it has been identified as carrying risk. SNPs greater than
r2~0:5 are highlighted in red.
(EPS)
Figure S8 rs12653946 in two populations. r2{r2{plot reveals
SNPs that are correlated to the index SNP in both populations for
which it has been identified as carrying risk. SNPs greater than
r2~0:5 are highlighted in red.
(EPS)
Figure S9 rs1983891 in two populations. r2{r2{plot reveals
SNPs that are correlated to the index SNP in both populations for
which it has been identified as carrying risk. SNPs greater than
r2~0:5 are highlighted in red.
(EPS)
Figure S10 rs339331 in two populations. r2{r2{plot reveals
SNPs that are correlated to the index SNP in both populations for
which it has been identified as carrying risk. SNPs greater than
r2~0:5 are highlighted in red.
(EPS)
Figure S11 rs9364554 in two populations. r2{r2{plot reveals
SNPs that are correlated to the index SNP in both populations for
which it has been identified as carrying risk. SNPs greater than
r2~0:5 are highlighted in red.
(EPS)
Figure S12 rs10486567 in two populations. r2{r2{plotreveals SNPs that are correlated to the index SNP in both
populations for which it has been identified as carrying risk. SNPs
greater than r2~0:5 are highlighted in red.
(EPS)
Figure S13 rs6983267 in two populations. r2{r2{plot reveals
SNPs that are correlated to the index SNP in both populations for
which it has been identified as carrying risk. SNPs greater than
r2~0:5 are highlighted in red.
(EPS)
Figure S14 rs7127900 in two populations. r2{r2{plot reveals
SNPs that are correlated to the index SNP in both populations for
which it has been identified as carrying risk. SNPs greater than
r2~0:5 are highlighted in red.
(EPS)
Figure S15 rs10896449 in two populations. r2{r2{plotreveals SNPs that are correlated to the index SNP in both
populations for which it has been identified as carrying risk. SNPs
greater than r2~0:5 are highlighted in red.
(EPS)
Figure S16 rs11228565 in two populations. r2{r2{plotreveals SNPs that are correlated to the index SNP in both
populations for which it has been identified as carrying risk. SNPs
greater than r2~0:5 are highlighted in red.
(EPS)
Figure S17 rs8102476 in two populations. r2{r2{plot reveals
SNPs that are correlated to the index SNP in both populations for
which it has been identified as carrying risk. SNPs greater than
r2~0:5 are highlighted in red. Note the vertical scale has been
optimized to make the SNP label readable.
(EPS)
Figure S18 Comparison of relative risk in different cancers.
GWAS odds ratios of SNPs reported for various cancers for
comparison with prostate cancer (red).
(EPS)
Acknowledgments
The authors thank Charles Nicolet and the Data Production Facility at the
USC Epigenome Center for library construction and high throughput
sequencing; the Ellipse/GAME-ON (epi.grants.cancer.gov/gameon/) con-
sortium: members Brian Henderson, Stephen Chanock, Douglas Easton,
Rosalind Eeles, Matthew Freedman, Christopher Haiman, Federico
Canzian, Gary Chen, Rudolf Kaaks, Peter Kraft, Timothy Rebbeck, Daniel
Stram, Jiyoung Ahn, Gerhard Coetzee, Greg Crawford, Richard Flavin,
Richard Hayes, Jonathan Melamed, Ian Mills, David Neal, Itshack Pe’er,
Zoltan Szallasi, Frederick Schumacher, Kristine Monroe; Practical [19]
(http://ccge.medschl.cam.ac.uk/consortia/practical/index.html) consor-
tium: members Rosalind Eeles, Douglas Easton, Kenneth Muir, Graham
Giles, Fredrik Wiklund, Henrik Gronberg, Christopher Haiman, Johanna
Schleutker, Maren Weischer, Ruth C. Travis, David Neal, Paul Pharoah,
Kay-Tee Khaw, Janet L. Stanford, William J. Blot, Stephen Thibodeau,
Christiane Maier, Adam S. Kibel, Cezary Cybulski, Lisa Cannon-Albright,
Hermann Brenner, Jong Park, Radka Kaneva, Jyotnsa Batra, Manuel R.
Teixeira, Zsofia Kote-Jarai, Ali Amin Al Olama, Sara Benlloch; and Li Jia
for the kind gift of PSA control plasmid.
Author Contributions
Conceived and designed the experiments: DJH GAC PJF WL. Performed
the experiments: CY MG. Analyzed the data: DJH SKR DLL
Consortia:Ellipse/GAME-ON Practical. Contributed reagents/materials/
analysis tools: BEH CAH ZKJ RAE DFE HN SGC PJF GAC. Wrote the
paper: DJH WC GAC PJF.
References
1. Manolio TA (2010) Genomewide association studies and assessment of the risk
of disease. The New England journal of medicine 363: 166–176.
2. Coetzee SG, Rhie SK, Berman BP, Coetzee GA, Noushmehr H (2012)
FunciSNP: an R/bioconductor tool integrating functional non-coding data sets
with genetic association studies to identify candidate regulatory SNPs. Nucleic
Acids Research 40: e139.
3. Dunham I, Kundaje A, Aldred SF, Collins PJ, Davis CA, et al. (2012) An integrated
encyclopedia of DNA elements in the human genome. Nature 489: 57–74.
Functional Annotation of Prostate Cancer Risk Loci
PLOS Genetics | www.plosgenetics.org 19 January 2014 | Volume 10 | Issue 1 | e1004102
4. Horoszewicz JS, Leong SS, Kawinski E, Karr JP, Rosenthal H, et al. (1983)
LNCaP model of human prostatic carcinoma. Cancer Research 43: 1809–1818.
5. Sobel R, Sadar M (2005) Cell lines used in prostate cancer research: a
compendium of old and new linespart 1. The Journal of Urology 173: 342–359.
6. Sobel R, Sadar M (2005) Cell lines used in prostate cancer research: a
compendium of old and new linespart 2. The Journal of Urology 173: 360–372.
7. Jia L, Landan G, Pomerantz M, Jaschek R, Herman P, et al. (2009) Functional
enhancers at the gene-poor 8q24 cancer-linked locus. PLoS Genetics 5:
e1000597.
8. Pomerantz MM, Ahmadiyeh N, Jia L, Herman P, Verzi MP, et al. (2009) The
8q24 cancer risk variant rs6983267 shows long-range interaction with MYC in
colorectal cancer. Nature genetics 41: 882–884.
9. McVean GA, Altshuler (Co-Chair) DM, Durbin (Co-Chair) RM, Abecasis GR,
Bentley DR, et al. (2012) An integrated map of genetic variation from 1,092
human genomes. Nature 491: 56–65.
10. Boyle AP, Hong EL, Hariharan M, Cheng Y, Schaub MA, et al. (2012)
Annotation of functional variation in personal genomes using RegulomeDB.
Genome Research 22: 1790–1797.
11. Rhie SK, Coetzee SG, Noushmehr H, Yan C, Kim JM, et al. (2013)
Comprehensive functional annotation of seventy-one breast cancer risk loci.
PLoS ONE 8: e63925.
12. Taplin ME (2007) Drug insight: role of the androgen receptor in the
development and progression of prostate cancer. Nature Clinical Practice
Oncology 4: 236–244.
13. Agalliu I, Suuriniemi M, Prokunina-Olsson L, Johanneson B, Collins FS, et al.
(2008) Evaluation of a Variant in the Transcription Factor 7-Like 2 (tcf7l2) Gene
and Prostate Cancer Risk in a Population-Based Study. The Prostate 68: 740–
747.
14. Choi Y, Sims GE, Murphy S, Miller JR, Chan AP (2012) Predicting the
functional effect of amino acid substitutions and indels. PLoS ONE 7: e46688.
15. Kumar P, Henikoff S, Ng PC (2009) Predicting the effects of coding non-
synonymous variants on protein function using the SIFT algorithm. Nature
protocols 4: 1073–1081.
16. Adzhubei IA, Schmidt S, Peshkin L, Ramensky VE, Gerasimova A, et al. (2010)
A method and server for predicting damaging missense mutations. Nature
methods 7: 248–249.
17. Bromberg Y, Rost B (2007) Snap: predict effect of non-synonymous
polymorphisms on function. Nucleic Acids Research 35: 3823–3835.
18. Friedman RC, Farh KKH, Burge CB, Bartel DP (2008) Most mammalian
mRNAs are conserved targets of microRNAs. Genome Research 19: 92–105.
19. Eeles RA, Olama AAA, Benlloch S, Saunders EJ, Leongamornlert DA, et al.
(2013) Identification of 23 new prostate cancer susceptibility loci using the
iCOGS custom genotyping array. Nature Genetics 45: 385–391.
20. Zhou L, Zhang X, Li Z, Zhou C, Li M, et al. (2013) Association of a genetic
variation in a miR-191 binding site in MDM4 with risk of esophageal squamous
cell carcinoma. PLoS ONE 8: e64331.
21. Liu J, Tang X, Li M, Lu C, Shi J, et al. (2013) Functional MDM4 rs4245739
genetic variant, alone and in combination with p53 Arg72Pro polymorphism,
contributes to breast cancer susceptibility. Breast Cancer Research and
Treatment 140: 151–157.
22. Wang J, Zhuang J, Iyer S, Lin X, Whitfield TW, et al. (2012) Sequence features
and chro- matin structure around the genomic regions bound by 119 human
transcription factors. Genome Research 22: 1798–1812.
23. Heinz S, Benner C, Spann N, Bertolino E, Lin YC, et al. (2010) Simple
combinations of lineage-determining transcription factors prime cis-regulatory
elements required for macrophage and b cell identities. Molecular cell 38: 576–
589.
24. Yeager M, Orr N, Hayes RB, Jacobs KB, Kraft P, et al. (2007) Genome-wide
association study of prostate cancer identifies a second risk locus at 8q24. Nature
genetics 39: 645–649.
25. Gudmundsson J, Sulem P, Manolescu A, Amundadottir LT, Gudbjartsson D,
et al. (2007) Genome-wide association study identifies a second prostate cancer
susceptibility variant at 8q24. Nature genetics 39: 631–637.
26. Thomas G, Jacobs KB, Yeager M, Kraft P, Wacholder S, et al. (2008) Multiple
loci identified in a genome-wide association study of prostate cancer. Nature
genetics 40: 310–315.
27. Eeles RA, Kote-Jarai Z, Giles GG, Olama AAA, Guy M, et al. (2008) Multiple
newly identified loci associated with prostate cancer susceptibility. Nature
genetics 40: 316–321.
28. Eeles RA, Kote-Jarai Z, Al Olama AA, Giles GG, Guy M, et al. (2009)
Identification of seven new prostate cancer susceptibility loci through a genome-
wide association study. Nature genetics 41: 1116–1121.
29. Gudmundsson J, Sulem P, Gudbjartsson DF, Blondal T, Gylfason A, et al.
(2009) Genome-wide association and replication studies identify four variants
associated with prostate cancer susceptibility. Nature Genetics 41: 1122–1126.
30. Takata R, Akamatsu S, Kubo M, Takahashi A, Hosono N, et al. (2010)
Genome-wide association study identifies five new susceptibility loci for prostate
cancer in the japanese population. Nature genetics 42: 751–754.
31. Wang Y, Ray AM, Johnson EK, Zuhlke KA, Cooney KA, et al. (2011) Evidence
for an association between prostate cancer and chromosome 8q24 and 10q11
genetic variants in african american men: The int mens health study. The
Prostate 71: 225–231.
32. Schumacher FR, Berndt SI, Siddiq A, Jacobs KB, Wang Z, et al. (2011)Genome-wide association study identifies new prostate cancer susceptibility loci.
Human molecular genetics 20: 3867–3875.
33. Kote-Jarai Z, Olama AAA, Giles GG, Severi G, Schleutker J, et al. (2011) Sevenprostate cancer susceptibility loci identified by a multi-stage genome-wide
association study. Nature Genetics 43: 785–791.
34. Gudmundsson J, Sulem P, Gudbjartsson DF, Masson G, Agnarsson BA, et al.
(2012) A study based on whole-genome sequencing yields a rare variant at 8q24
associated with prostate cancer. Nature Genetics 44: 1326–1329.
35. Porkka KP, Visakorpi T (2004) Molecular mechanisms of prostate cancer.
European urology 45: 683–691.
36. Knudsen BS, Vasioukhin V (2010) Mechanisms of prostate cancer initiation and
pro- gression. In: Advances in Cancer Research, Elsevier, volume 109. pp. 1–50.
URL http://linkinghub.elsevier.com/retrieve/pii/B9780123808905000016.
37. Huang DW, Sherman BT, Lempicki RA (2008) Bioinformatics enrichment
tools: paths toward the comprehensive functional analysis of large gene lists.Nucleic Acids Research 37: 1–13.
38. Huang DW, Sherman BT, Lempicki RA (2008) Systematic and integrative
analysis of large gene lists using DAVID bioinformatics resources. NatureProtocols 4: 44–57.
39. Grisanzio C, Werner L, Takeda D, Awoyemi BC, Pomerantz MM, et al. (2012)
Genetic and functional analyses implicate the NUDT11, HNF1B, andSLC22A3 genes in prostate cancer pathogenesis. Proceedings of the National
Academy of Sciences 109: 11252–11257.
40. Shrader TE, Crothers DM (1989) Artificial nucleosome positioning sequences.
Proceedings of the National Academy of Sciences 86: 7418–7422.
41. Segal E, Fondufe-Mittendorf Y, Chen L, Thstrm A, Field Y, et al. (2006)A genomic code for nucleosome positioning. Nature 442: 772–778.
42. Chung HR, Vingron M (2009) Sequence-dependent nucleosome positioning.Journal of Molecular Biology 386: 1411–1422.
43. Gutierrez-Arcelus M, Lappalainen T, Montgomery SB, Buil A, Ongen H, et al.
(2013) Passive and active DNA methylation and the interplay with geneticvariation in gene regulation. eLife 2: e00523.
44. Maurano MT, Humbert R, Rynes E, Thurman RE, Haugen E, et al. (2012)
Systematic localization of common disease-associated variation in regulatoryDNA. Science 337: 1190–1195.
45. Ewing CM, Ray AM, Lange EM, Zuhlke KA, Robbins CM, et al. (2012)Germline mu- tations in HOXB13 and prostate-cancer risk. The New England
journal of medicine 366: 141–149.
46. International Consortium for Prostate Cancer Genetics, Xu J, Lange EM, Lu L,Zheng SL, et al. (2012) HOXB13 is a susceptibility gene for prostate cancer:
results from the international consortium for prostate cancer genetics (ICPCG).Human Genetics 132: 5–14.
47. Economides KD (2003) Hoxb13 is required for normal differentiation and
secretory function of the ventral prostate. Development 130: 2061–2069.
48. Jung C (2004) HOXB13 induces growth suppression of prostate cancer cells as a
repressor of hormone-activated androgen receptor signaling. Cancer Research64: 9185–9192.
49. Jung C (2004) HOXB13 homeodomain protein suppresses the growth of
prostate cancer cells by the negative regulation of t-cell factor 4. CancerResearch 64: 3046–3051.
50. Hazelett DJ, Coetzee SG, Coetzee GA (2013) A rare variant, which destroysa FoxA1 site at 8q24, is associated with prostate cancer risk. Cell cycle
(Georgetown, Tex) 12: 379–380.
51. Marigorta UM, Navarro A (2013) High Trans-ethnic Replicability of GWASResults Im-plies Common Causal Variants. PLoS Genetics 9: e1003566.
52. Lu Y, Sun J, Kader AK, Kim ST, Kim JW, et al. (2012) Association of prostate
cancer risk with snps in regions containing androgen receptor binding sitescaptured by ChIP-On-chip analyses. The Prostate 72: 376–385.
53. Berman BP (2002) Exploiting transcription factor binding site clustering toidentify cis-regulatory modules involved in pattern formation in the Drosophila
genome. Proceedings of the National Academy of Sciences 99: 757–762.
54. Johansson O, Alkema W, Wasserman WW, Lagergren J (2003) Identification offunctional clusters of transcription factor binding motifs in genome sequences:
the MSCAN algorithm. Bioinformatics 19: i169–i176.
55. Berman BP, Pfeiffer BD, Laverty TR, Salzberg SL, Rubin GM, et al. (2004)
Computational identification of developmental enhancers: conservation and
function of transcription factor binding-site clusters in Drosophila melanogaster andDrosophila pseudoobscura. Genome biology 5: R61.
56. Yan J, Enge M, Whitington T, Dave K, Liu J, et al. (2013) Transcription factorbinding in human cells occurs in dense clusters formed around cohesin anchor
sites. Cell 154: 801–813.
57. Hazelett DJ, Lakeland DL, Weiss JB (2009) Affinity density: a novel genomicapproach to the identification of transcription factor regulatory targets.
Bioinformatics (Oxford, England) 25: 1617–1624.
58. Dickson SP, Wang K, Krantz I, Hakonarson H, Goldstein DB (2010) Rare
variants create synthetic genome-wide associations. PLoS Biology 8: e1000294.
59. Wang K, Dickson SP, Stolle CA, Krantz ID, Goldstein DB, et al. (2010)Interpretation of association signals and identification of causal variants from
genome-wide association studies. The American Journal of Human Genetics 86:730–742.
60. Flister MJ, Tsaih SW, O’Meara CC, Endres B, Hoffman MJ, et al. (2013)
Identifying multiple causative genes at a single GWAS locus. Genome Research23: 1996–2002.
Functional Annotation of Prostate Cancer Risk Loci
PLOS Genetics | www.plosgenetics.org 20 January 2014 | Volume 10 | Issue 1 | e1004102
61. Wang Q, Li W, Zhang Y, Yuan X, Xu K, et al. (2009) Androgen receptor
regulates a distinct transcription program in androgen-independent prostate
cancer. Cell 138: 245–256.
62. Prokunina-Olsson L, Fu YP, Tang W, Jacobs KB, Hayes RB, et al. (2010)
Refining the prostate cancer genetic association within the JAZF1 gene on
chromosome 7p15.2. Cancer Epidemiology Biomarkers & Prevention 19: 1349–
1355.
63. Li H, Lovci MT, Kwon YS, Rosenfeld MG, Fu XD, et al. (2008) Determination
of tag density required for digital transcriptome analysis: Application to an
androgen-sensitive prostate cancer model. Proceedings of the National Academy
of Sciences 105: 20179–20184.
64. Decker KF, Zheng D, He Y, Bowman T, Edwards JR, et al. (2012) Persistent
androgen receptor-mediated transcription in castration-resistant prostate cancer
under androgen-deprived conditions. Nucleic Acids Research 40: 10765–10779.
65. Tewari AK, Yardimci G, Shibata Y, Sheffield NC, Song L, et al. (2012)
Chromatin acces-sibility reveals insights into androgen receptor activation and
transcriptional specificity. Genome Biology 13: R88.
66. Koontz JI, Soreng AL, Nucci M, Kuo FC, Pauwels P, et al. (2001) Frequent
fusion of the JAZF1 and JJAZ1 genes in endometrial stromal tumors.
Proceedings of the National Academy of Sciences 98: 6348–6353.
67. Micci F (2006) Consistent rearrangement of chromosomal band 6p21 with
generation of fusion genes JAZF1/PHF1 and EPC1/PHF1 in endometrial
stromal sarcoma. Cancer Research 66: 107–112.
68. Shembade N, Harhaj NS, Liebl DJ, Harhaj EW (2007) Essential role for
TAX1BP1 in the termination of TNF–a, IL-1- and LPS-mediated NF-kB and
JNK signaling. The EMBO Journal 26: 3910–3922.
69. O’Geen H, Echipare L, Farnham PJ (2011) Using ChIP-Seq technology to
generate high-resolution profiles of histone modifications. Methods in Molecular
Biology 791: 265–286.
70. Langmead B, Salzberg S (2012) Fast gapped-read alignment with bowtie 2.
Nature Methods 9: 357–359.
71. Blahnik KR, Dou L, O’Geen H, McPhillips T, Xu X, et al. (2010) Sole-Search:
an inte-grated analysis program for peak detection and functional annotation
using ChIP-seq data. Nucleic Acids Research 38: e13.
72. Andreu-Vieyra C, Lai J, Berman BP, Frenkel B, Jia L, et al. (2011) Dynamic
nucleosome- depleted regions at androgen receptor enhancers in the absence of
ligand in prostate cancer cells. Molecular and Cellular Biology 31: 4648–4662.
73. Sharma N, Massie C, Ramos-Montoya A, Zecchini V, Scott H, et al. (2013) The
androgen receptor induces a distinct transcriptional program in castration-
resistant prostate cancer in man. Cancer Cell 23: 35–47.
74. Metropolis N, Rosenbluth AW, Rosenbluth MN, Teller AH, Teller E (1953)
Equation of state calculations by fast computing machines. The Journal of
Chemical Physics 21: 1087.
75. Hoffman MD, Gelman A (2012) The no-U-turn sampler: Adaptively setting
path lengths in Hamiltonian Monte Carlo. Journal of Machine LearningResearch: 1–30.
76. Stan Development Team (2013). Stan: A c++ library for probability and
sampling, version 1.3. Available: http://mc-stan.org/.77. Gudmundsson J, Sulem P, Rafnar T, Bergthorsson JT, Manolescu A, et al.
(2008) Common sequence variants on 2p15 and xp11.22 confer susceptibility toprostate cancer. Nature Genetics 40: 281–283.
78. Murabito JM, Rosenberg CL, Finger D, Kreger BE, Levy D, et al. (2007)
A genome-wide association study of breast and prostate cancer in the NHLBI’sframingham heart study. BMC medical genetics 8 Suppl 1: S6.
79. Xu J, Mo Z, Ye D, Wang M, Liu F, et al. (2012) Genome-wide associationstudy in chinese men identifies two new prostate cancer risk loci at 9q31.2 and
19q13.4. Nature Genetics 44: 1231–1235.80. Duggan D, Zheng SL, Knowlton M, Benitez D, Dimitrov L, et al. (2007) Two
genome-wide association studies of aggressive prostate cancer implicate putative
prostate tumor suppressor gene DAB2IP. JNCI Journal of the National CancerInstitute 99: 1836–1844.
81. Yang L, Li Y, Ling X, Liu L, Liu B, et al. (2011) A common genetic variant(97906C.A) of DAB2IP/AIP1 is associated with an increased risk and early
onset of lung cancer in chinese males. PLoS ONE 6: e26944.
82. Nam RK, Zhang W, Siminovitch K, Shlien A, Kattan MW, et al. (2011) Newvariants at 10q26 and 15q21 are associated with aggressive prostate cancer in a
genome-wide association study from a prostate biopsy screening cohort. Cancerbiology & therapy 12: 997–1004.
83. Zheng SL, Stevens VL, Wiklund F, Isaacs SD, Sun J, et al. (2009) Twoindependent prostate cancer risk-associated loci at 11q13. Cancer Epidemiology
Biomarkers & Pre-vention 18: 1815–1820.
84. Bonilla C, Hooker S, Mason T, Bock CH, Kittles RA (2011) Prostate cancersusceptibility loci identified on chromosome 12 in african americans. PLoS ONE
6: e16044.85. Gudmundsson J, Sulem P, Steinthorsdottir V, Bergthorsson JT, Thorleifsson G,
et al. (2007) Two variants on chromosome 17 confer prostate cancer risk, and
the one in TCF2 protects against type 2 diabetes. Nature genetics 39: 977–983.86. Sun J, Zheng SL, Wiklund F, Isaacs SD, Purcell LD, et al. (2008) Evidence for
two independent prostate cancer risk associated loci in the HNF1B gene at17q12. Nature Genetics 40: 1153–1155.
87. Haiman CA, Chen GK, Blot WJ, Strom SS, Berndt SI, et al. (2011) Genome-wide association study of prostate cancer in men of african ancestry identifies a
susceptibility locus at 17q21. Nature genetics 43: 570–573.
88. Hsu FC, Sun J, Wiklund F, Isaacs SD, Wiley KE, et al. (2009) A novel prostatecancer susceptibility locus at 19q13. Cancer Research 69: 2720–2723.
89. Sun J, Zheng SL, Wiklund F, Isaacs SD, Li G, et al. (2009) Sequence variants at22q13 are associated with prostate cancer risk. Cancer Research 69: 10–15.
Functional Annotation of Prostate Cancer Risk Loci
PLOS Genetics | www.plosgenetics.org 21 January 2014 | Volume 10 | Issue 1 | e1004102