comprehensive evaluation of high-steep slope stability and ... · table 2. physico-mechanical...
TRANSCRIPT

International Journal of Minerals, Metallurgy and Materials Volume 22, Number 1, January 2015, Page 1 DOI: 10.1007/s12613-015-1036-8
Corresponding author: Peng-fei Shan E-mail: [email protected] © University of Science and Technology Beijing and Springer-Verlag Berlin Heidelberg 2015
Comprehensive evaluation of high-steep slope stability and optimal high-steep slope design by 3D physical modeling
Xing-ping Lai1), Peng-fei Shan1), Mei-feng Cai2,3), Fen-hua Ren2,3), and Wen-hui Tan2,3)
1) School of Energy Engineering, Xi’an University of Science and Technology, Xi’an 710054, China
2) School of Civil and Environmental Engineering, University of Science and Technology Beijing, Beijing 100083, China
3) Key Laboratory of the Ministry of Education of China for Efficient Mining and Safety of Metal Mines, University of Science and Technology Beijing, Beijing 100083,
China
(Received: 6 June 2014; revised: 12 September 2014; accepted: 15 September 2014)
Abstract: High-steep slope stability and its optimal excavation design in Shuichang open pit iron mine were analyzed based on a large 3D physical simulation technique. An optimal excavation scheme with a relatively steeper slope angle was successfully implemented at the northwest wall between Nos. 4 and 5 exploration lines of Shuichang Iron Mine, taking into account the 3D scale effect. The phys-ico-mechanical properties of rock materials were obtained by laboratory tests conducted on sample cores from exploration drilling directly from the iron mine. A porous rock-like composite material was formed for the model, and the mechanical parameters of the material were assessed experimentally; specifically, the effect of water on the sample was quantitatively determined. We adopted an experimental setup using stiff modular applied static loading to carry out a visual excavation of the slope at a random depth. The setup was equipped with acous-tic emission (AE) sensors, and the experiments were monitored by crack optical acquirement, ground penetrating radar, and close-field pho-togrammetry to investigate the mechanisms of rock-mass destabilization in the high-steep slope. For the complex study area, the model re-sults indicated a clear correlation between the model’s destabilization resulting from slope excavation and the collected monitoring informa-tion. During the model simulation, the overall angle of the slope increased by 1–6 degrees in different sections. Dramatically, the modeled excavation scheme saved over 80 million tons of rock from extraction, generating enormous economic and ecological benefits.
Keywords: slope stability analysis; excavation; design; three-dimensional models; physical simulation
1. Introduction
Many approaches such as engineering-geological analy-sis, the limit equilibrium method and numerical simulation are used to analyze the high-steep slope stability of open pit mines [1–5]. In addition to the simple and fundamental questions that need answering, the theoretical methods used for evaluating cumbersome 3D problems in practical geo-technical engineering need to be improved. The methods are also insufficient to analyze the discontinuous properties of rock masses. In sharp contrast with theoretical analysis, physical modeling is one of the most useful approaches in rock mechanics with unique advantages for the study of high-steep slope stability [6–10]; in particular, a large 3D
physical modeling experiment can accurately provide de-formation and fracture characteristics of rock masses in the slope being prerequisite for the prediction of dynamic desta-bilization and quantitative excavation design of high-steep slopes [11–15].
It is necessary to improve the accuracy of modeling ex-periments in order to gain a better understanding of the me-chanical properties of modeling materials and quantitatively determining the material components [16–17]. We have ob-tained basic geotechnical information from Nos. 4 and 5 ex-ploration lines of Shuichang Iron Mine, where the boundary line of the open pit mine has already moved 1400 m towards the west, and the excavation level of the open pit has fallen dramatically to –440 m compared to the former excavation level of –350 m [18]. Moreover, the similar geometric scale

2 Int. J. Miner. Metall. Mater., Vol. 22, No. 1, Jan. 2015
was 1:400, representing small scale modeling, thus the mo-deling experiment was difficult to perform. Various kinds of modeling materials with different mechanical properties have been successively developed by researchers worldwide and used successfully in actual applications; for example, lead oxide adopted for modeling the basic components of rock masses was developed by Bergamo Institute in Italy [19]. In addition, NIOS, IBSCM and MIB were developed by Zhang et al. [20] and Wang et al. [21], Ma et al. [22], and Han et al. [23], respectively. Surely, all of these models have properties similar to those of field rock masses; how-ever, quantitative studies on modeling materials have sel-dom focused on metamorphic rock masses, which are the host rock masses in the high-steep slopes of Shuichang Iron Mine [24]. To solve the above mentioned problems, we de-veloped new modeling materials that are similar to the rock masses of the high slopes in Shuichang Iron Mine and also built a large-scale simulation model. By equipping the simulation model with acoustic emission (AE) censors and monitoring with crack optical acquirement (COA), ground penetrating radar (GPR), and close-field photogrammetry
(CFP), the destabilization processes of rock mass in the high-steep slope were clearly detected and analyzed. The large-scale model not only includes all of the geological and mechanical complexity of the high-steep slope in the actual open pit iron mine, but also provides a quantitative analysis of the mechanism of high-steep slope destabilization.
2. Geotechnical site characterization
2.1. In-situ geological and mining settings
Shuichang Iron Mine is located in Qianan City of Hebei Province, China (Fig. 1), about 200 km northeast of Beijing, the capital of China. The actual excavated ore value is about 12 million tons per year. The district is adjacent to alluvial deposits of the Luan River. The alluvium includes modern channel deposits and flood plain deposits in the form of low alluvial terraces adjacent to the channel and flood plains. These alluvial deposits are composed of interstratified lenses of sand, gravel, silt sand, and silt. The exploratory holes in-dicated that the thickness of the deposits ranges from 3.0 to 7.0 m, with an average thickness of over 5.0 m.
Fig. 1. Situation of Shuichang open pit iron mine in Qianan city of Hebei province, China.
In the current study, we investigate rock slope stability in a typical engineering experiment using a synthetic 3D-ana-lysis method and a large physical modeling experiment, re-quiring accurate regional geological data. The ore body is sedimentary metamorphic iron ore of the Anshan type. The main strata is metamorphic rock of the three chariot camp group in the Archean Erathem including dark-cloud granu-
lite, shallow particle rock, pyroxene dark-cloud granulite, and magnetite quartzite, which are important components of gneiss with different mixing degrees. Waste mining rock serves as artificial fill with a thickness of 80 m approxi-mately. Particularly during the rainy season, the osmotic pressure derived from the loose structure and strong perme-ability of the fill results in the easy slippage and collapse of

X.P. Lai et al., Comprehensive evaluation of high-steep slope stability and optimal high-steep slope design by 3D … 3
the rock slope. The ore body was controlled by “W” compound syn-
clines composed of Beishan syncline, Nanshan syncline and Jiu Shuichang anticline. At the same time, there are 26 large-scale faults. A couple of preferred planes with dipping angles at SE120°–130° and SE160°–170° are critical causes of landslides. In addition, planes of Jurassic mudstones pos-sessing worse geotechnical conditions develop adverse space relationships with other planes, possibly inducing dy-namic disasters in the rock slope.
2.2. Physico-mechanical properties
Core samples from five holes at the experimental site were classified using the rock quality designation (RQD) system. This designation system provides a quantitative method of categorizing the engineering traits of rock masses based on core hole information. A summary of the RQD re-sults for the five holes is presented in Table 1, which indi-cates that the general RQD of open pit mine rock masses is medium. Locally, broken pelagic-gneiss and pyroxene are present with lower RQD.
The physico-mechanical properties of the main meta-morphic rock masses used in the large physical models were based on the evaluation of exploratory drilling and labora-tory test results. Data utilized in the experiments were ob-
tained from the Key Laboratory of the Ministry of Educa-tion of China for Efficient Mining and Safety of Metal Mines at the School of Civil and Environmenta1 Engineer-ing of the University of Science and Technology Beijing. The physico-mechanical properties used in the model are summarized in Table 2.
Table 1. Rock quality designation of rock masses in Shu-ichang open pit iron mine
Rock type RQD/% RQD rank Integrality description
Moderate weathering
pyroxene 21 Bad Broken
Plagiogneiss
Conglomerate 78 Good Massiveness
Mudstone 70 Medium Relative integrality
Biotite amphogneiss 66 Medium Relative integrality
Dark clouds pyroxenemixed gneiss
57 Medium Relative integrality
Crush mixed granite
Petrofabric
Granite 46 Bad Less integrality
Dark clouds pyroxeneplagioclase gneiss
62 Medium Relative integrality
Pyroxene 56 Medium Relative integrality
Table 2. Physico-mechanical properties of main metamorphic rock masses used for physical modeling
Rock definition Density / (kg·m–3) Moisture / % Bulk modulus / GPa Poisson ratio Compressive strength / MPa Tensile strength / MPa
Gneiss 2620 2.41 4.9 0.231 110 6.3
Granite 2620 0 5.3 0.217 160 6.7
Mudstone 1640 3.24 0.5 0.238 20 2.6
Ore body 3750 0 1.6 0.210 68 4.2
3. Physical modeling of slope excavation
3.1. Physical model simplification
Physical modeling experiments are measureable research techniques where the physico-mechanical properties of ac-tual rock masses are modeled by manufactured materials that are similar to the actual rocks.
The modeling can provide information by the corre-sponding experimental phenomena. The main model pa-rameters should be constrained in a non-rigid fashion as: Cσ = Cr Cl (1) Cδ = Cl Cε (2) Cσ = CE Cε (3) where Cσ is the similar ratio of stress, Cr is the similar ratio of volume weight, Cl is the similar ratio of dimension, Cδ is
the similar ratio of displacement, Cε is the similar ratio of strain, and CE is similar ratio of bulk modulus.
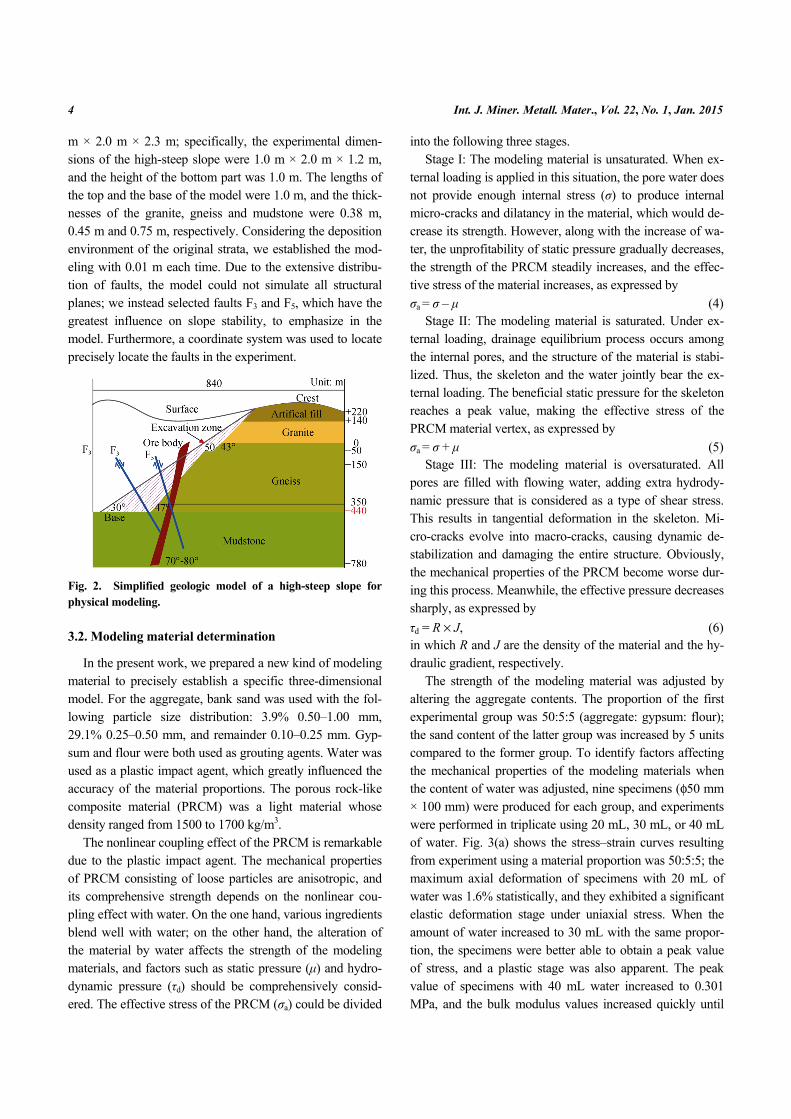
Four kinds of rock masses have been considered in this study: ore body, gneiss, granite and mudstone. Based on the geological section of the slope, we ultimately determined the scope of the simulation to be the slope from No. 4 explora-tion line to No. 5 exploration line (northwest wall of the dis-trict). In the horizontal direction, about 784 m should be taken into account. The excavation level of the open pit mine has already dropped to –440 m, suggesting that simu-lation depth of the slope was 840 m. Simultaneously, the slope angle was altered from 30° to 47° in the simulation experiment (Fig. 2). In order to satisfy all experimental re-quirements, the physical modeling experiment apparatus was constructed with steel and assembled with bolts to en-sure rational geometric sizes. The final model size was 3.6
28 Bad Less integrality
4 Int. J. Miner. Metall. Mater., Vol. 22, No. 1, Jan. 2015
m × 2.0 m × 2.3 m; specifically, the experimental dimen-sions of the high-steep slope were 1.0 m × 2.0 m × 1.2 m, and the height of the bottom part was 1.0 m. The lengths of the top and the base of the model were 1.0 m, and the thick-nesses of the granite, gneiss and mudstone were 0.38 m, 0.45 m and 0.75 m, respectively. Considering the deposition environment of the original strata, we established the mod-eling with 0.01 m each time. Due to the extensive distribu-tion of faults, the model could not simulate all structural planes; we instead selected faults F3 and F5, which have the greatest influence on slope stability, to emphasize in the model. Furthermore, a coordinate system was used to locate precisely locate the faults in the experiment.
Fig. 2. Simplified geologic model of a high-steep slope for physical modeling.
3.2. Modeling material determination
In the present work, we prepared a new kind of modeling material to precisely establish a specific three-dimensional model. For the aggregate, bank sand was used with the fol-lowing particle size distribution: 3.9% 0.50–1.00 mm, 29.1% 0.25–0.50 mm, and remainder 0.10–0.25 mm. Gyp-sum and flour were both used as grouting agents. Water was used as a plastic impact agent, which greatly influenced the accuracy of the material proportions. The porous rock-like composite material (PRCM) was a light material whose density ranged from 1500 to 1700 kg/m3.
The nonlinear coupling effect of the PRCM is remarkable due to the plastic impact agent. The mechanical properties of PRCM consisting of loose particles are anisotropic, and its comprehensive strength depends on the nonlinear cou-pling effect with water. On the one hand, various ingredients blend well with water; on the other hand, the alteration of the material by water affects the strength of the modeling materials, and factors such as static pressure (μ) and hydro-dynamic pressure (τd) should be comprehensively consid-ered. The effective stress of the PRCM (σa) could be divided
into the following three stages. Stage I: The modeling material is unsaturated. When ex-
ternal loading is applied in this situation, the pore water does not provide enough internal stress (σ) to produce internal micro-cracks and dilatancy in the material, which would de-crease its strength. However, along with the increase of wa-ter, the unprofitability of static pressure gradually decreases, the strength of the PRCM steadily increases, and the effec-tive stress of the material increases, as expressed by σa = σ – μ (4)
Stage II: The modeling material is saturated. Under ex-ternal loading, drainage equilibrium process occurs among the internal pores, and the structure of the material is stabi-lized. Thus, the skeleton and the water jointly bear the ex-ternal loading. The beneficial static pressure for the skeleton reaches a peak value, making the effective stress of the PRCM material vertex, as expressed by σa = σ + μ (5)
Stage III: The modeling material is oversaturated. All pores are filled with flowing water, adding extra hydrody-namic pressure that is considered as a type of shear stress. This results in tangential deformation in the skeleton. Mi-cro-cracks evolve into macro-cracks, causing dynamic de-stabilization and damaging the entire structure. Obviously, the mechanical properties of the PRCM become worse dur-ing this process. Meanwhile, the effective pressure decreases sharply, as expressed by
τd = R × J, (6) in which R and J are the density of the material and the hy-draulic gradient, respectively.
The strength of the modeling material was adjusted by altering the aggregate contents. The proportion of the first experimental group was 50:5:5 (aggregate: gypsum: flour); the sand content of the latter group was increased by 5 units compared to the former group. To identify factors affecting the mechanical properties of the modeling materials when the content of water was adjusted, nine specimens (φ50 mm × 100 mm) were produced for each group, and experiments were performed in triplicate using 20 mL, 30 mL, or 40 mL of water. Fig. 3(a) shows the stress–strain curves resulting from experiment using a material proportion was 50:5:5; the maximum axial deformation of specimens with 20 mL of water was 1.6% statistically, and they exhibited a significant elastic deformation stage under uniaxial stress. When the amount of water increased to 30 mL with the same propor-tion, the specimens were better able to obtain a peak value of stress, and a plastic stage was also apparent. The peak value of specimens with 40 mL water increased to 0.301 MPa, and the bulk modulus values increased quickly until

X.P. Lai et al., Comprehensive evaluation of high-steep slope stability and optimal high-steep slope design by 3D … 5
failure. At a proportion of 55:5:5 and a water level of 40 mL, a dramatic peak occurred at peak stress due to energy burst release. Because the sand proportion increased to 60 (Fig. 3(b)), the specimen strength decreased obviously, while the residual strength increased and the peak value was generally small. Fig. 3(c) shows that the strength improved step by
step, reaching a maximum of 0.378 MPa (40 mL). Mean-while, stress concentration occurred before sample fractur-ing with 30 mL water. With the aggregate proportion further increasing to 80 and 85 (Fig. 3(d)), the specimen ductility at any amount of water was more evident than in the other ex-periments.
Fig. 3. Stress–strain curves of specimens with various proportions under uniaxial compressive loading (a–d).
The amount of water affects the mechanical properties of the modeling materials. The coupling effects (Fig. 4(a)) from water, aggregate and grouting agents are a quantitative relationship between material proportion and uniaxial com-pressive stress, and satisfy “dual-saddles” mode with triple maximum values and double minimum ones. Generally speaking, the strength of modeling materials reaches a maximum when the aggregate : gypsum : flour proportion is 70:5:5; in contrast, the strength is the smallest at a propor-tion of 63:5:5. The addition of more water produces greater volatility in the experimental results. On the other hand, Fig. 4(b) shows that external compressive stress also depends on the water amount, with which specimens statistically get su-preme results. Moreover, different proportions are associ-ated with different strain-stress curve shapes; the 60:5:5 and 70:5:5 proportions result in more linear trends, while the 65:5:5 and 85:5:5 proportions produce hyperbolic curves. The other proportions exhibit parabolic trends. The results
indicate that bulk modulus values range from 2.0 to 190.0 MPa, while uniaxial compressive stress lies between 0.118 and 0.378 MPa, depending on the amount of sand. These results are in agreement with the requirement of small-scale metamorphic rock masses experiment. All experimental proportions are listed in Table 3.
4. Modeling excavation and hybrid monitoring
4.1. Main phenomena of physical modeling
Fig. 5(a) shows a schematic of the monitoring technique used during the physical modeling experiments. Throughout the experiments, the model was extracted according to dif-ferent slope angles using an initial angle of 30°. When the slope angle was increased to 33°, macro-cracks first oc-curred at the slope shoulder. These cracks gradually propa-gated and connected, resulting in local collapse. Loose de-formation formed at the left part of the model shoulder

6 Int. J. Miner. Metall. Mater., Vol. 22, No. 1, Jan. 2015
along with obvious creep of the rock masses, resulting in se-rious damage to the excavation plane due to the loosening of the deformation zone (Fig. 5(b)). When the slope angle was increased to 39°, loose deformation affected the bottom of the slope. Inner stress concentration in the rock masses transferred the loading to the slope surface, generating rock mass flow. In addition, the relatively large slope angle in-creased the tensile stress between layers, resulting in the de-formation of rock masses under the action of self-gravity. When the slope angle was increased to 45°, the rate of de-
formation and damage accelerated, and the tensile stresses in the slope surface and shoulder reached maximum values. This induced in crack connection and local landslide forma-tion, which were mainly shear-slip landslides. Increases in slope angle caused the shear stress of the surrounding rock to exceed the shear strength on the structural plane. When the slope angle was increased to 47°, the bottom of the slope was dominated by tensile stress. Cracks were propagated to the surface, and large-scale landslides occurred near the geologic structural planes.
Fig. 4. Mechanical properties of modeling materials influenced by water in various proportions: (a) peak strength curves; (b) trend of peak strength.
Table 3. Experimental results of peak stress, peak strain and residual stress for physical modeling
Proportion Peak stress / MPa Peak strain / % Residual stress / MPa Field rock masses
70:5:5 0.26 0.72 0.06 Granite
77:5:5 0.16 0.42 0.02 Gneiss
92:5:5 0.06 0.37 0.01 Mudstone
103:5:5(:10) 0.12 0.62 0.03 Ore body
Fig. 5. Monitoring schemes of modeling simulation (a) and main experiment phenomena (b).
4.2. In-situ real damage monitoring by crack optical ac-quirement
Crack optical acquirement (COA) was used to quantita-
tively describe the deformation and damage of internal strata from pre-designed boreholes. The observation results showed that after three excavations made the slope steeper, remarkable deformation occurred in rock masses surround-
X.P. Lai et al., Comprehensive evaluation of high-steep slope stability and optimal high-steep slope design by 3D … 7
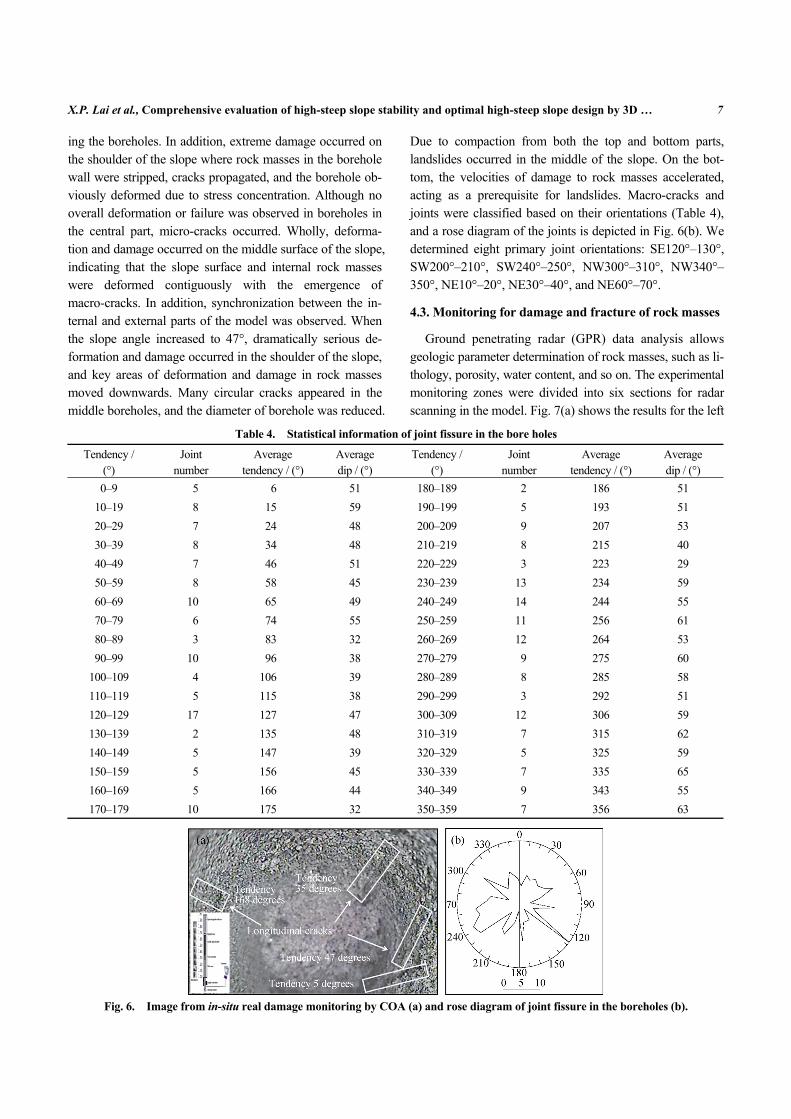
ing the boreholes. In addition, extreme damage occurred on the shoulder of the slope where rock masses in the borehole wall were stripped, cracks propagated, and the borehole ob-viously deformed due to stress concentration. Although no overall deformation or failure was observed in boreholes in the central part, micro-cracks occurred. Wholly, deforma-tion and damage occurred on the middle surface of the slope, indicating that the slope surface and internal rock masses were deformed contiguously with the emergence of macro-cracks. In addition, synchronization between the in-ternal and external parts of the model was observed. When the slope angle increased to 47°, dramatically serious de-formation and damage occurred in the shoulder of the slope, and key areas of deformation and damage in rock masses moved downwards. Many circular cracks appeared in the middle boreholes, and the diameter of borehole was reduced.
Due to compaction from both the top and bottom parts, landslides occurred in the middle of the slope. On the bot-tom, the velocities of damage to rock masses accelerated, acting as a prerequisite for landslides. Macro-cracks and joints were classified based on their orientations (Table 4), and a rose diagram of the joints is depicted in Fig. 6(b). We determined eight primary joint orientations: SE120°–130°, SW200°–210°, SW240°–250°, NW300°–310°, NW340°– 350°, NE10°–20°, NE30°–40°, and NE60°–70°.
4.3. Monitoring for damage and fracture of rock masses
Ground penetrating radar (GPR) data analysis allows geologic parameter determination of rock masses, such as li-thology, porosity, water content, and so on. The experimental monitoring zones were divided into six sections for radar scanning in the model. Fig. 7(a) shows the results for the left
Table 4. Statistical information of joint fissure in the bore holes
Tendency / (°)
Joint number
Average tendency / (°)
Average dip / (°)
Tendency / (°)
Joint number
Average tendency / (°)
Average dip / (°)
0–9 5 6 51 180–189 2 186 51
10–19 8 15 59 190–199 5 193 51
20–29 7 24 48 200–209 9 207 53
30–39 8 34 48 210–219 8 215 40
40–49 7 46 51 220–229 3 223 29
50–59 8 58 45 230–239 13 234 59
60–69 10 65 49 240–249 14 244 55
70–79 6 74 55 250–259 11 256 61
80–89 3 83 32 260–269 12 264 53
90–99 10 96 38 270–279 9 275 60
100–109 4 106 39 280–289 8 285 58
110–119 5 115 38 290–299 3 292 51
120–129 17 127 47 300–309 12 306 59
130–139 2 135 48 310–319 7 315 62
140–149 5 147 39 320–329 5 325 59
150–159 5 156 45 330–339 7 335 65
160–169 5 166 44 340–349 9 343 55
170–179 10 175 32 350–359 7 356 63
Fig. 6. Image from in-situ real damage monitoring by COA (a) and rose diagram of joint fissure in the boreholes (b).
8 Int. J. Miner. Metall. Mater., Vol. 22, No. 1, Jan. 2015
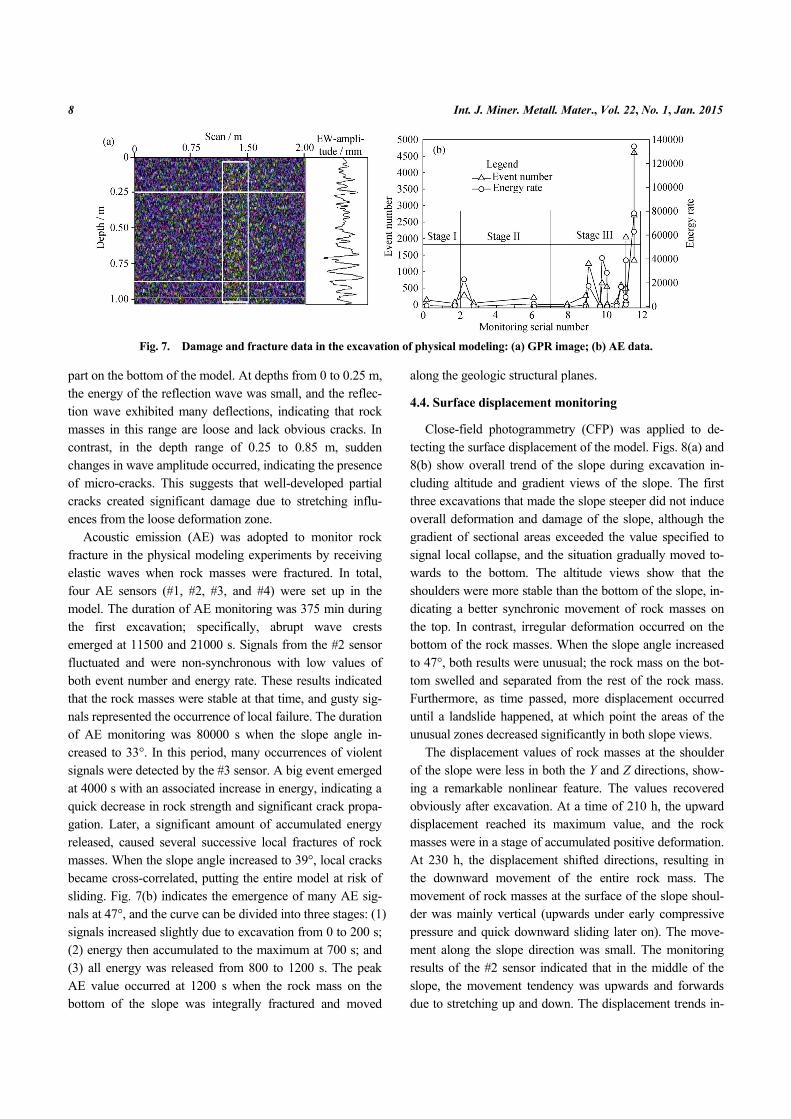
Fig. 7. Damage and fracture data in the excavation of physical modeling: (a) GPR image; (b) AE data.
part on the bottom of the model. At depths from 0 to 0.25 m, the energy of the reflection wave was small, and the reflec-tion wave exhibited many deflections, indicating that rock masses in this range are loose and lack obvious cracks. In contrast, in the depth range of 0.25 to 0.85 m, sudden changes in wave amplitude occurred, indicating the presence of micro-cracks. This suggests that well-developed partial cracks created significant damage due to stretching influ-ences from the loose deformation zone.
Acoustic emission (AE) was adopted to monitor rock fracture in the physical modeling experiments by receiving elastic waves when rock masses were fractured. In total, four AE sensors (#1, #2, #3, and #4) were set up in the model. The duration of AE monitoring was 375 min during the first excavation; specifically, abrupt wave crests emerged at 11500 and 21000 s. Signals from the #2 sensor fluctuated and were non-synchronous with low values of both event number and energy rate. These results indicated that the rock masses were stable at that time, and gusty sig-nals represented the occurrence of local failure. The duration of AE monitoring was 80000 s when the slope angle in-creased to 33°. In this period, many occurrences of violent signals were detected by the #3 sensor. A big event emerged at 4000 s with an associated increase in energy, indicating a quick decrease in rock strength and significant crack propa-gation. Later, a significant amount of accumulated energy released, caused several successive local fractures of rock masses. When the slope angle increased to 39°, local cracks became cross-correlated, putting the entire model at risk of sliding. Fig. 7(b) indicates the emergence of many AE sig-nals at 47°, and the curve can be divided into three stages: (1) signals increased slightly due to excavation from 0 to 200 s; (2) energy then accumulated to the maximum at 700 s; and (3) all energy was released from 800 to 1200 s. The peak AE value occurred at 1200 s when the rock mass on the bottom of the slope was integrally fractured and moved
along the geologic structural planes.
4.4. Surface displacement monitoring
Close-field photogrammetry (CFP) was applied to de-tecting the surface displacement of the model. Figs. 8(a) and 8(b) show overall trend of the slope during excavation in-cluding altitude and gradient views of the slope. The first three excavations that made the slope steeper did not induce overall deformation and damage of the slope, although the gradient of sectional areas exceeded the value specified to signal local collapse, and the situation gradually moved to-wards to the bottom. The altitude views show that the shoulders were more stable than the bottom of the slope, in-dicating a better synchronic movement of rock masses on the top. In contrast, irregular deformation occurred on the bottom of the rock masses. When the slope angle increased to 47°, both results were unusual; the rock mass on the bot-tom swelled and separated from the rest of the rock mass. Furthermore, as time passed, more displacement occurred until a landslide happened, at which point the areas of the unusual zones decreased significantly in both slope views.
The displacement values of rock masses at the shoulder of the slope were less in both the Y and Z directions, show-ing a remarkable nonlinear feature. The values recovered obviously after excavation. At a time of 210 h, the upward displacement reached its maximum value, and the rock masses were in a stage of accumulated positive deformation. At 230 h, the displacement shifted directions, resulting in the downward movement of the entire rock mass. The movement of rock masses at the surface of the slope shoul-der was mainly vertical (upwards under early compressive pressure and quick downward sliding later on). The move-ment along the slope direction was small. The monitoring results of the #2 sensor indicated that in the middle of the slope, the movement tendency was upwards and forwards due to stretching up and down. The displacement trends in-

X.P. Lai et al., Comprehensive evaluation of high-steep slope stability and optimal high-steep slope design by 3D … 9
dicated that the rock masses in the middle part of the slope were repeatedly influenced by excavation. The monitoring results of the #3 sensor showed that on the bottom of the slope, displacement in the Y direction increased sharply for a long time due to sudden energy release. The displacement was positive, indicating that the movement of rock masses on the bottom of the slope was obviously forward. At a time of 220 h, displacement in the Z direction sharply decreased,
which indicated that rock masses on the bottom of the slope had already failed due to sliding along weak structural planes (Fig. 8(c)). In conclusion, the deformation and failure of slope rock masses can be divided into three types: (1) ex-tensive fracturing failure on the top of the model; (2) falling failure in the middle of the slope; and (3) failure caused by sliding of the entire rock mass along weak structural planes on the bottom of the model.
Fig. 8. Displacement analysis of physical modeling from CFP computation (a,b) and specific points monitoring (c).
4.5. Optimal design of slope angle
Based on the above physical modeling results combined with the systematical analysis of numerical modeling of slope stability, the overall slope angles of Shuichang open pit iron mine were increased by 1–6 degrees in different sec-tions [5]. In some sections, the rock mass quality was dif-ferent in the upside and downside of the slope. The down-side rock quality was typically better than that of the upside. Thus, the slope angle for the downside was bigger than for the upside in such sections. The demarcation levels of the up and down sides are shown in Table 5. Due to slope angle optimization, the extraction of over 50 million tons of waste rock was avoided, generating remarkable economic and ecological benefits. The final recommended scheme of op-
timal excavation for Shuichang open pit mine is also shown in Table 5.
5. Conclusions
(1) A comprehensive site investigation involving hydro-geological, engineering geological, and geotechnical char-acterization of rock masses in Shuichang open pit mine was carried out. The investigation results showed that the intense rain and significant osmotic pressure induced structural loosening and strong osmotic filling in the slope rock mass, resulting in slippage and collapse of the slope due to the presence of Jurassic mudstone layers.
(2) Based on the field rock mass material characterization, the physico-mechanical properties of the rock masses, and

10 Int. J. Miner. Metall. Mater., Vol. 22, No. 1, Jan. 2015
the mining excavation design plan, a 3D geologic model of the high-steep slope was built, and a systematic 3D physical modeling experiment was completed. The results showed that the deformation and failure of slope rock masses can be divided into three types: extensive failure at the top of the slope, falling failure at the middle of the slope, and fail-ure caused by sliding of the entire mass along weak struc-
tural planes at the bottom of the slope. The results indicated that the landslide would happen in the middle of the slope due to compaction from both the up and down parts. On the bottom, the rate of damage of the rock masses accelerated, providing the conditions for a landslide. In addition, the slope surface and inside rock mass were synchronously de-formed.
Table 5. Schemes of optimal excavation design at Shuichang open pit mine
Subregion Section Location Optimal angle / (°) Demarcation level / m Former angle / (°)
I I–1 Upside 47 +10 46
I I–1 Downside 50 +10 46
I I–2 Upside 43 +50 41
I I–2 Downside 45 +50 41
I I–3 Upside 43 +10 41
I I–3 Downside 49 +10 41
II II–1 Upside 45 –50 46
II II–1 Downside 47 –50 46
II II–2 Upside 45 –111 46
II II–2 Downside 48 –111 46
II II–3 Upside 48 –112 46
II II–3 Downside 50 –112 46
III III–1 Entirety 48 — 42
IV IV–1 Entirety 41 — 40
IV IV–2 Upside 44 +10 42
IV IV–2 Downside 48 +10 42
IV IV–3 Upside 46 –50 42
IV IV–3 Downside 48 –50 42
V V–1 Entirety 46 — 42
(3) The combination of 3D physical modeling and 3D
numerical modeling experiments provides an effective and suitable method for stability analysis and optimum design of high-steep open pit mines. With the optimized design, the final slope angle of Shuichang open pit mine was increased by 1–6 degrees in different sections. This optimization re-duced the stripping waste rock by more than 80 million tons, creating an enormous economic benefit.
Acknowledgements
The authors gratefully acknowledge the financial support by the National Key Basic Research and Development Pro-gram of China (No. 2015CB251600), the Preliminary Na-tional Key Basic Research and Development Program of China (No. 2014CB260404), the National Key Natural Scien-ce Foundation of China (No. 51034001, No. U13612030) and the Shaanxi Innovation Team Program (No. 2013KCT–16).
References
[1] M.F. Cai, M.W. Xie, and C.L. Li, GIS-based 3D limit equi-librium analysis for design optimization of a 600 m high slope in an open pit mine, J. Univ. Sci. Technol. Beijing, 14(2007), No. 1, p. 1.
[2] M.F. Cai, M.C. He, and D.Y. Liu, Rock Mechanics and En-gineering, The Science Press, Beijing, 2002, p. 6.
[3] T.H. Yang, F.C. Zhang, Q.L. Yu, M.F. Cai, and H.Z. Li, Re-search situation of open-pit mining high and steep slope sta-bility and its developing trend, Rock Soil Mech., 32(2011), No. 5, p. 1437.
[4] J.I. Adachi, E. Detournay, and A.P. Peirce, Analysis of the classical pseudo-3D model for hydraulic fracture with equi-librium height growth across stress barriers, Int. J. Rock Mech. Min. Sci., 47(2010), No. 4, p. 625.
[5] M.F. Cai, L. Qiao, C.H. Li, and J.A. Wang, Stability analysis and design optimization of high and steep slope in Shuichang open-pit mine, J. Univ. Sci. Technol. Beijing, 26(2004), No. 5,

X.P. Lai et al., Comprehensive evaluation of high-steep slope stability and optimal high-steep slope design by 3D … 11
p. 465. [6] Z.Y. Tan and M.F. Cai, Multi-factor sensitivity analysis of
shallow unsaturated clay slope stability, J. Univ. Sci. Technol. Beijing, 12(2005), No. 3, p. 193.
[7] M.F. Cai, H.G. Ji, and J.A. Wang, Study of the time-space-strength relation for mining seismicity at Laohutai coal mine and its prediction, Int. J. Rock Mech. Min. Sci., 42(2005), No. 1, p. 145.
[8] A.H. Lu, X.B. Mao, and H.S. Liu, Physical simulation of rock burst induced by stress waves, J. China Univ. Min. Technol., 18(2008), No. 3, p. 401.
[9] T.B. Li, X.F. Wang, and L.B. Meng, Physical simulation study of similar materials for rockburst, Chin. J. Rock Mech. Eng., 30(2011), Suppl. 1, p. 2610.
[10] K.Z. Wang and Z.K. Li, Study on 3D physical model test of seepage of deep-buried long and large diversion tunnel, Chin. J. Rock Mech. Eng., 28(2009), No. 4, p. 725.
[11] J. Xiao and X.C. Gao, Similar simulation research on stability of open-pit mine slope under complicated geological condi-tions, Chin. J. Rock Mech. Eng., 25(2006), Suppl. 2, p. 3661.
[12] X.P. Lai, Y.P. Wu, J.T. Cao, Y.N. Fan, Y.L. Zhang, and F. Cui, Experiment on rock mass deformation of large scale 3D simulation in complex environment, J. China Coal Soc., 35(2010), No. 1, p. 31.
[13] Y.S. Pan, M.T. Zhang, L.G. Wang, and G.Z. Li, Study on rockburst by equivalent material simulation tests, Chin. J. Geotech. Eng., 19(1997), No. 4, p. 49.
[14] R. Castro, R. Trueman, and A. Halim, A study of isolated draw zones in block caving mines by means of a large 3D physical model, Int. J. Rock Mech. Min. Sci., 44(2007), No. 6, p. 860.
[15] X.P. Lai, P.F. Shan, F.H. Ren, J.T. Cao, S.J. Miao, and T.H.
Zhang, Application of model material PRCM in simulation experiment on slope stability, Met. Mine, 43(2013), No. 3, p. 1.
[16] Y.M. Lin, Lab of Rock Mechanics, The Coal Industry Press, Beijing, 1984, p. 143.
[17] C. Occhiena, M. Pirulli, and C. Scavia, A microseismic-based procedure for the detection of rock slope instabilities, Int. J. Rock Mech. Min. Sci., 69(2014), p. 67.
[18] Geological Institution of Shougang Mining Corporation, Supplement Exploration Report for Revised Design in Shu-ichang Open Pit Iron Mine, Geological Institution of Shou-gang Mining Corporation, Beijing, 2009, p. 58.
[19] X.L. Jiang, J. Chen, S.W. Sun, and N. Li, New material for rock foundation of geomechanical model of Jingping Project, J. Yangtze River Sci. Res. Inst., 26(2009), No. 6, p. 40.
[20] Q.Y. Zhang, S.C. Li, X.H. Guo, Y. Li, and H.P. Wang, Re-search and development of new typed cementitious geotech-nical similar material for iron crystal sand and its application, Rock Soil Mech., 29(2008), No. 8, p. 2126.
[21] H.P. Wang, S.C. Li, Q.Y. Zhang, Y. Li, and X.H. Guo, De-velopment of a new geomechanical similar material, Chin. J. Rock Mech. Eng., 25(2006), No. 9, p. 1842.
[22] F.P. Ma, Z.K. Li, and G.F. Luo, NIOS model material and its use in geo-mechanical similarity model test, J. Hydroelectr. Eng., 23(2004), No. 1, p. 48.
[23] B.L. Han, X.L. Chen, Y.L. Song, and H.M. Li, Research on similar material of rockmass, J. Wuhan Univ. Hydraul. Electr. Eng., 30(1997), No. 2, p. 6.
[24] X.P. Lai, P.F. Shan, F.H. Ren, Q.S. Wang, W.H. Tan, and S.J. Miao, Comparative experiment on strength of multi-media composite similar materials in mine's high and steep Slope, J. Xi’an Univ. Sci. Technol., 32(2012), No. 2, p. 135.