comprehensive annual financial report june 30, 2003colscf.cityofls.net/content/cafrfy03.pdf ·...
TRANSCRIPT

CITY OF LEE’S SUMMIT, MISSOURI
Comprehensive Annual Financial Report
June 30, 2003

CITY OF LEE’S SUMMIT, MISSOURI
COMPREHENSIVE ANNUAL FINANCIAL REPORT
For the fiscal year ended
June 30, 2003
Prepared by:
Department of Finance

CITY OF LEE’S SUMMIT, MISSOURI
Table of Contents
Page
Introductory Section: Principal Officials 3 Organizational Chart 4 Letter of Transmittal 6-13 GFOA Certificate of Achievement 14
Financial Section: Independent Auditors’ Report 18-19
Management’s Discussion and Analysis 20-27
Basic Financial Statements: Government-Wide Statement of Net Assets 29 Statement of Activities 30
Fund Financial Statements Governmental Funds: Balance Sheet 31
Reconciliation of the Governmental Funds Balance Sheet to the Statement of Net Assets 32
Statement of Revenues, Expenditures, and Changes in Fund Balances 33
Reconciliation of the Change in Fund Balances of Governmental Funds to the Statement of Activities 34
Proprietary Funds: Statement of Net Assets 35 Statement of Revenues, Expenses, and Changes in Fund Net Assets 36 Statement of Cash Flows 37
Notes to Basic Financial Statements 38-59
Required Supplementary Information Budgetary Comparison Schedule—General Fund 60 Notes to Budgetary Comparison Schedule—General Fund 61 Schedule of Funding Progress—Retirement Plan 62
Supplementary Information Combining Balance Sheet—Nonmajor Governmental Funds 63 Combining Statement of Revenues, Expenditures, and Changes in
Fund Balances—Nonmajor Governmental Funds 64 Combining Balance Sheet—Nonmajor Special Revenue Funds 67-68

Page
Supplementary Information (continued) Combining Statement of Revenues, Expenditures, and Changes in
Fund Balances—Nonmajor Special Revenue Funds 69-70 Budgetary Comparisons—Special Revenue Funds 71-76 Combining Balance Sheet—Nonmajor Capital Projects Funds 79-80 Combining Statement of Revenues, Expenditures, and Changes in
Fund Balances—Nonmajor Capital Projects Funds 81-82 Budgetary Comparison Schedule—Debt Service Fund 83 Budgetary Comparison Schedule—Park Development Fund 84 Budgetary Comparison Schedule—Road and Bridge Excise/Sales
Tax Fund 85 Combining Balance Sheet—Nonmajor Enterprise Funds 87 Combining Statement of Revenues, Expenses, and Changes in
Retained Earnings—Nonmajor Enterprise Funds 88 Combining Statement of Cash Flows—Nonmajor Enterprise Funds 89 Combining Balance Sheet—Internal Service Funds 91 Combining Statement of Revenues, Expenses, and Changes in
Retained Earnings—Internal Service Funds 92 Combining Statement of Cash Flows—Internal Service Funds 93
Statistical Section (Unaudited): Schedule of Expenditures by Function—All Governmental Fund Types 95 Schedule of Revenues by Source—All Governmental Funds 96 Schedule of General Fund Revenues and Other Financing Sources 97 Schedule of General Fund Expenditures and Other Financing Uses by Function 98 Property Tax Levies and Collections 99 Schedule of Revenue Bond Coverage—Combined Waterworks and
Sewerage System Fund 100 Assessed Value of Taxable Property 101 Property Tax Rates—Direct and Overlapping Governmental Units 102 Schedule of Special Assessments and Collections 103 Schedule of Construction Permits Issued 104 Computation of Legal Debt Margin 105 Computation of Direct and Estimated Overlapping Debt 106 Ratio of Annual Debt Service Expenditures for General Bonded Debt to
Total “General” Expenditures 107 Ratio of Net Bonded Debt to Assessed Value and Net Bonded Debt Per Capita 108 Schedule of Principal Taxpayers 109 Miscellaneous Statistics 110 Schedule of Insurance in Force 111-112

(This page left blank intentionally)

Introductory Section
________________________________________________________________________________

3
THE CITY OF LEE’S SUMMIT
MAYOR
Karen R. Messerli
DISTRICT 1 DISTRICT 3 James Hallam Joseph C. Spallo Christine Bushyhead Ed Cockrell
DISTRICT 2 DISTRICT 4 Randall L. Rhoads James Freeman III Ron Williams Tess Hurley
FINANCE & PERSONNEL COMMITTEE
James Hallam, Chairman Tess Hurley
Joseph C. Spallo Ron Williams
ADMINISTRATION Shelley Temple-Kneuvean, Acting City Administrator
Stephen A. Arbo, Assistant City Administrator Conrad E. Lamb, Finance Director
Darlene Pickett, Asst. Finance Director Thomas Solberg, Fire Chief
Robert Handley, City Attorney Kenneth T. Conlee, Police Chief
J. Thomas Lovell, Parks Administrator Charles Owsley, Public Works Director Mark Schaufler, Water Utilities Director
Robert G. McKay, Community Development Director Gary Bradley, Assistant to the City Administrator
INDEPENDENT CERTIFIED PUBLIC ACCOUNTANTS
KPMG LLP
4
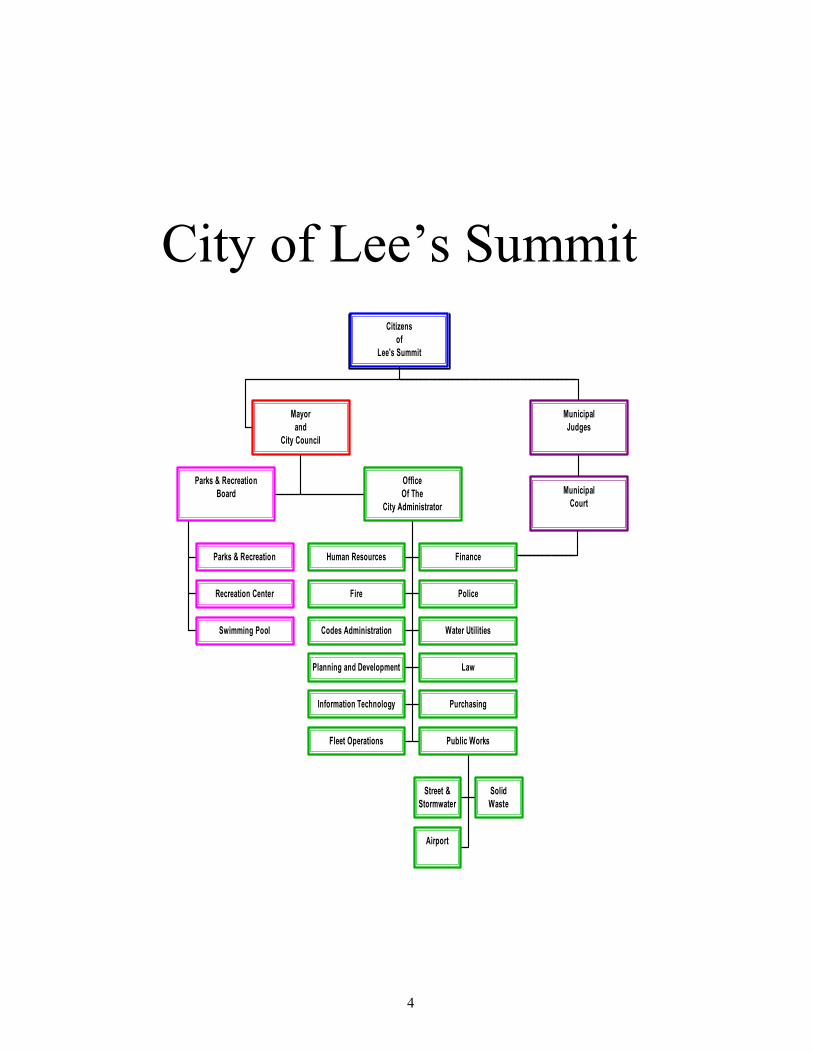
City of Lee’s Summit
Parks & Recreation
Recreation Center
Swimming Pool
Parks & RecreationBoard
Human Resources Finance
Fire Police
Codes Administration Water Utilities
Planning and Development Law
Information Technology Purchasing
Fleet Operations
Street &Stormwater
SolidWaste
Airport
Public Works
OfficeOf The
City Administrator
Mayorand
City Council
MunicipalCourt
MunicipalJudges
Citizensof
Lee's Summit

(This page left blank intentionally)

6 (Continued)
December 1, 2003
The Honorable Mayor and City Councilmembers:
Transmitted herewith is the annual financial report for the City of Lee’s Summit, Missouri (the City) for the fiscal year ended June 30, 2003. The Finance Department prepared this report and responsibility for both the accuracy of the presented data and the completeness and fairness of the presentation, including all disclosures, rests with the City. We believe the data, as presented, is accurate in all material aspects; that it is presented in a manner designed to fairly set forth the financial position and results of operations of the City, as measured by the financial activity of its various funds; and that all disclosures necessary to enable the reader to gain the maximum understanding of the City’s financial affairs have been included.
The comprehensive annual financial report is presented in three sections: introductory, financial, and statistical. The introductory section includes a list of principal officials, the City’s organizational chart, this transmittal letter, and a Certificate of Achievement for Excellence in Financial Reporting. The financial section includes the auditors’ report, management’s discussion and analysis, basic and fund financial statements, notes to the basic financial statements, and required supplementary information. The statistical section includes selected financial and demographic information, generally presented on a multiyear basis.
For purposes of preparing this comprehensive annual financial report, all funds and account groups that are controlled by or dependent on, the City of Lee’s Summit are included. This comprises such services as public safety, public works, parks and recreation, water and sanitary sewerage utility, aviation and sanitary landfill disposal of refuse. Determination as to control by, or dependence on, the City is on the basis of generally accepted accounting principles which includes consideration of budget adoption, taxing authority, outstanding debt secured by revenues or general obligations of the City, or the City’s obligation to fund any deficit that may occur. Based on this criteria, all fund types which apply are included as part of this annual report. In addition, the Lee’s Summit Municipal Building Authority is included in the City’s reporting entity as a blended component unit.
GAAP requires that management provide a narrative introduction, overview, and analysis to accompany the basic financial statements in the form of Management’s Discussion and Analysis (MD&A). This letter of transmittal is designed to complement MD&A and should be read in conjunction with it. The City of Lee's Summit’s MD&A can be found immediately following the report of the independent auditors.
Profile of the Government
The City was organized on December 1, 1868 under the laws of the state of Missouri. The City became a Charter City on April 2, 1996 when voters approved the Home Rule Charter. The charter established a

7 (Continued)
government in which the City Council, consisting of eight members, two per district, elected by their respective district’s citizens, performs the legislative duties of the City. The City Council meets on the first three Thursdays of each month in regular session and has an additional “Work or Study Session” before the regular meeting on the second Thursday of each month. The executive power in the City is vested in the Mayor, who is recognized as the head of the City for all legal and ceremonial purposes. The Mayor is elected at large by the city electorate. The City Administrator is the chief administrative officer of the City. The City Administrator is appointed by the Mayor with the advice and consent of a majority of the City Council.
The City is a suburb encompassing approximately 64 square miles in the southeastern section of the Kansas City, Missouri metropolitan area. The City is well served by several interstate, federal, and state highways. Interstate 470, which rings the southeastern part of the Kansas City metropolitan area, which connects with Interstates 70 and 435, dissects the City of Lee’s Summit. In planning for the future, the City uses as a guide the Interstate 470-corridor study when looking for guidance regarding growth and land use in and along the highway system. These interstates also connect with Interstates 35 and 29, thereby giving Lee’s Summit excellent access to the entire metro area. Two federal highways, U.S. 50 and U.S. 40 and two state highways, M-291 and M-150, also connect Lee’s Summit to Kansas City and the surrounding area. Amtrak and the Missouri Pacific Railroads also serve the City. The Lee’s Summit Municipal Airport has both north/south and crosswind directional runways.
Utility service in the city is mixed between public and private companies. Water and sanitary sewerage utilities are operated by the Water Utilities Department of the City. Water and sewerage rates are established to meet the total revenue requirements of the utilities. Natural gas is supplied by the Missouri Gas Energy Company (MGE), electricity by Missouri Public Service Company (Aquila), and traditional telephone service by Southwestern Bell. There are several companies providing cellular phone service.
The four major commercial television networks, four independent local stations as well as public television and two cable television companies service the City, and a number of AM and FM stations broadcast throughout the area.
In addition to the Kansas City Star daily newspaper and its supplemental Southland Star published on Saturdays, the City is served by the Lee’s Summit Journal. The Lee’s Summit Journal is delivered on Wednesday and Friday afternoons.
Education
The City of Lee’s Summit boundaries overlap several school districts. The Lee’s Summit R-7 School District represents 92% of the total area and is classified AAA (highest rating) by the State Department of Education. The school district’s enrollment has increased from 2,928 pupils in 1960 to 14,838 in 2002. Fall 2003 enrollment saw an increase of 386 students. The school district expects similar growth to continue. The R-7 School District has 15 elementary schools, three middle schools and two high schools. Lee’s Summit West High School, located in southwest Lee’s Summit, is scheduled to open in fall 2004. The district also operates an Early Childhood Center, Parents as Teachers program, an Alternative School, and Summit Technology Academy. Within city limits, the Blue Springs School District also has an elementary school and middle school.
The Longview campus of The Metropolitan Community Colleges is located in the City and is experiencing similar growth in enrollments.
The Mid-Continent Public Library system has two facilities in Lee’s Summit, one in the east central section and one in the west central part of the City.

8 (Continued)
In addition, Lee’s Summit residents have easy access to the Kansas City metropolitan area’s 15 colleges and universities, seven community colleges, 10 technical institutes and five seminaries.
Recreation, Cultural and Religious Facilities
Lee’s Summit has 26 municipal parks covering 1,140 acres of parkland. Recreational facilities at these parks include: athletic fields for youth and adult softball, baseball and soccer, lighted tennis courts, picnic shelters, nature trails, a 50-meter swimming pool, an inline skating rink, handball/racquetball courts, basketball courts, volleyball courts, horseshoe courts, a 22,000-square-foot recreation center, two small community centers and numerous playgrounds.
The Park Board, recognizing the affects of population growth, continues to make significant improvements in the existing parks and recreation facilities. Those projects are being funded through lease purchase financing, user fees, and property taxes. As a part of their “Legacy for Tomorrow” plan, the Parks and Recreation Department was successful with a three-eighths cent sales tax question on the November 1997 ballot to fund the acquisition and construction of a 700-acre city park, neighborhood parks and the 38-mile greenway.
In July 1998, the City purchased approximately 700 acres for a multipurpose city park on the City’s eastern city limits. The park, named Legacy Park, was completed in spring 2003. Facilities at the park include a soccer complex, a boy’s baseball complex, and a girl’s softball complex. Each complex includes restroom/concession facilities, vending, parking, walkways, and landscaping. Also included in construction of this phase is realigned Blackwell Road, 1.5 miles of bikeway, lake development, environmental mitigation measures, and internal roadways.
The next phase of Legacy Park is the Legacy Park Community Center. The 53,000 square foot facility will be located on the east edge of the lake in Legacy Park. Facilities will include leisure indoor pool with slide, play features, and hot tub. Other activity areas include gymnasium, fitness center, racquetball courts, and running track. Locker rooms will include a family changing area as well as conventional locker room facilities. Community areas will include a divisible community room suitable for meetings and receptions for up to 275 people and a catering kitchen. The facility will include office space for center personnel and a baby-sitting area for patrons. The Community Center is scheduled to open in the fall of 2003
The park system is complimented by a professional park and recreation staff that provides planning, maintenance, development, administration, and recreation services. There are many different recreation programs offered throughout the year by the staff as well as through partnerships with local organizations. These opportunities include youth baseball, softball, soccer, football, inline skating, swimming, tennis, gymnastics and basketball; adult (men, women and coed) softball, soccer, basketball and volleyball; senior adult trips and tours, special classes and luncheons; musical festivals; summer day camps, safety town; and numerous instructional programs. A full range of activities for the physically and mentally challenged is made possible through a partnership with Jackson County’s Special Recreation Division.
Lake Jacomo, Longview Lake, Blue Springs Lake, and Prairie Lee Lake are located in county parks within the city limits of Lee’s Summit and offer numerous recreational activities such as boating, fishing, skiing, and swimming. Lee’s Summit residents and the Kansas City metropolitan area enjoy these lakes.
Lee’s Summit has over 50 churches of various denominations.
Commerce, Industry and Employment
The City’s commercial and industrial tax base continues to grow, along with the City’s strong housing numbers. Several commercial projects were started or completed during fiscal year 2003.

9 (Continued)
The City of Lee’s Summit has a broad spectrum of major employers. They include companies that manufacture everything from plastic containers to tools to electronic components. In addition to manufacturing, there are a wide variety of services such as customer service centers for pharmaceuticals and telecommunications firms, data management and processing centers and educational institutions. There are 17 business sites in Lee’s Summit with 200 employees or more, and 8 business sites with over 500 employees.
John Knox Village is a taxpaying retirement village for middle- and upper-income persons and is compromised of approximately 2,000 units. The village is continuously renovating many of its residential units.
The City has seen its retail sales tax base increase significantly in the past two years. The pattern of retail development in Lee’s Summit follows closely with major traffic routes. The new 800,000 square foot Summit Woods Crossing is located adjacent to US 50 Highway, just south of I-470. It includes anchor tenants such as Lowe’s, Kohl’s, Best Buy, Target, and specialty stores such as Eddie Bauer and Borders Books. Smaller centers are scattered throughout the city, generally along Highway M-291 and US 50.
Major Initiatives
The following table sets forth average annual unemployment figures for Lee’s Summit and for the state of Missouri, obtained from the Bureau of Labor Statistics, compared to national figures:
Year
Area Unemployment
Rate
Statewide Unemployment
Rate
United States Unemployment
Rate
2003 3.8% 5.8% 6.4% 2002 3.3% 5.5% 5.9% 2001 2.7% 4.8% 4.6% 2000 1.9% 3.3% 4.0% 1999 2.2% 3.8% 4.3%
The City of Lee’s Summit continues to be an active and growing community. 2,154 building permits were issued in calendar year 2002 (including alternations, additions and demolitions); this places Lee’s Summit as one of the fastest growing cities in the state of Missouri. Assessed valuations have increased an average of 13.2% yearly over the last five years.
The City’s population has grown from 28,416 in 1980, 47,253 in 1990, and to 70,700 in the 2000 census to an estimated population of 76,043 as of December 2002. The population is expected to increase an average of six citizens per day.
Capital projects of just over $40.5 million were constructed during the year using proceeds of General Obligation Bonds, Revenue Bonds, Certificates of Participation, water and sewer connection fees, transportation sales and excise taxes together with grant funds for buildings, landfill expansion, street, airport, water and sewer improvements.
Financial Information
Management of the City is responsible for establishing and maintaining internal control designed to ensure that the assets of the government are protected from loss, theft or misuse and to ensure that adequate accounting data are compiled to allow for the preparation of financial statements in conformity with generally accepted accounting principles (GAAP). The internal control is designed to provide reasonable, but not absolute, assurance that these objectives are met. The concept of reasonable assurance
10 (Continued)
recognizes that (1) the cost of control should not exceed the benefits likely to be derived and (2) the valuation of costs and benefits require estimates and judgments by management.
The accounts of the City are organized on the basis of funds and account groups, each of which is considered to be a separate accounting entity. The operations of each fund are accounted for by providing a separate set of self-balancing accounts, which comprise its assets, liabilities, equities, revenues and expenditures or expenses.
Budgetary control is maintained to ensure compliance with legal provisions embodied in the annual appropriated budget approved by the City Council. Activities of the General Fund, Special Revenue Funds and Debt Service Funds are included in the annual appropriated budget. The level of budgetary control is established at the activity level by the encumbrance of purchase orders with material balances before their release to vendors. Purchase orders that result in an overrun of activity balances are not released until alternative sources of payment are made available.
Single Audit
As a recipient of federal, state and county financial assistance, the City is also responsible for ensuring that adequate internal control is in place to ensure compliance with applicable laws and regulations related to those programs. Internal control is subject to periodic evaluation by the management of the City.
As a part of the City’s single audit, tests are made to determine the adequacy of internal control, including that portion related to federal financial assistance programs, as well as to determine that the government has complied with applicable laws and regulations. The results of the City’s single audit for the fiscal year ended June 30, 2003 provided no instances of material weaknesses in internal control or significant violations of applicable laws and regulations. This report is available in the City of Lee’s Summit’s separately issued Single Audit Report.
Major Revenue Sources
The City’s largest source of revenue is from property taxes.
The road excise tax is in the form of a license tax on building contractors to be paid on all development which requires a building permit and results in additional traffic (vehicle trips). The license tax is paid prior to the building permit issuance. The effective date of the license tax was April 1, 1998 and was imposed at a rate of 50% through December 31, 1998. As of January 1, 1999, this rate was increased to 100%. These revenues are used to construct streets, roads, bridges, and related improvements.
Utility franchise fees is a gross receipts tax levied on all service charges for customers subscribing to natural gas, electricity, telephone, and cable television service within the city’s boundaries. Franchise taxes are directly dependent on the weather conditions and will vary with extreme periods of heat or cold.
The combined local sales and transportation sales tax revenues comprise approximately 20 percent of total governmental revenue. This revenue source has increased each year over the last decade due to strong retail sales growth in the City.
The capital project sales tax is a one-half cent sales tax with a sunset of 10 years as approved by the voters of Lee’s Summit for streets, roads, bridges, and related improvements. The tax became effective beginning April 1, 1998.
The local parks sales tax is a three-eighths cent sales tax with a sunset of 10 years to fund four key elements of the “Legacy for Tomorrow” plan. The tax became effective beginning April 1, 1998.
The state motor vehicle fuel tax is distributed to the City on the city-to-state population ratio. The ratio is based on the U.S. census figures and will fluctuate with statewide consumption and population changes,

11 (Continued)
as they become measurable. The motor vehicle license and sales tax is based on the location where the property is titled and not where the sale takes place.
The City actively applies for many federal and state pass-through grant funds that may be available. Many of these grants are designed to provide start-up funds or are for limited periods of time.
The county urban road system money is collected by Jackson County and is used to fund road and bridge projects that are maintained mutually by the City and county. This money is committed for the City’s share of county improvements to the View High Drive interchange and Colbern Road improvements completed in recent years.
Cash Management
The City pools the cash from all funds and invests these amounts in overnight accounts, certificates of deposit, mortgage-backed securities, and instruments carrying the full faith and guarantee of the federal government. The maturities of the investments range from 30 days to 3 years, with an average maturity of 20 months. The average yield on investments was 3.4 percent. Time deposits are collateralized at 105% of market value with either the City or a third party holding the collateral.
The City has executed Depository Collateral Agreements, which should satisfy the requirements of the Financial Institutions Reform, Recovery, and Enforcement Act of 1989 (FIRREA) regarding deposits in excess of FDIC insurance.
Enterprise Funds
The City operates four Enterprise Funds: the Combined Waterworks and Sewerage System, the Airport, the Solid Waste Management (Sanitary Landfill) and the Recreation Center.
These funds are used to account for operations that are financed and operated in a manner similar to private business enterprises where the stated intent is that the costs (expenses, including depreciation) of providing goods or services to the general public on a continuing basis be financed or recovered primarily through user charges and where periodic determination of revenues earned, expenses incurred and/or net income is deemed appropriate of capital maintenance, public policy, management control, accountability or other purposes.
Combined Waterworks and Sewerage System
The City’s combined Water and Sewer System revenues include water and sewer connection fees intended to fund significant capital improvement projects identified in their respective master plans. The rate structure provides a capital improvement funding mechanism to upgrade and replace existing transmission and collection lines.
The City purchases its water from the City of Independence, Missouri (54.15%) and the City of Kansas City, Missouri Water Department (45.85%). Sewage treatment is provided by the Little Blue Valley Sewer District, which charges member cities on a volume treated basis. The City of Lee's Summit represents approximately 25 percent of the Little Blue Valley metro sewer district.
Airport
The City operates the Lee’s Summit Municipal Airport, which is designated by the Federal Aviation Authority as a reliever airport for the Kansas City metropolitan area. It is designed to reduce congestion at larger air carrier airports by providing general aviation pilots with alternate landing facilities. It is further classified as a general aviation utility airport serving planes with gross weights of less than 12,500 pounds and landing speeds less than 121 knots. The airport is equipped with two runways, each approximately 4,000 feet long, and supports an estimated 103,800 takeoffs and landings of personal and business purposes per year.

12 (Continued)
Solid Waste Management (Sanitary Landfill)
The Solid Waste Management facility (Landfill) remains one of the few municipally operated sites for solid waste disposal in the Kansas City metropolitan area. The expansion of the original area should provide solid waste disposal well into the 21st century. The City provides drop-off recycling services and also is a metropolitan area household hazardous waste drop-off site for the regional program.
Recreation Center
The Recreation Center is a multipurpose recreational facility that is self-supporting for both operations and the debt service on the construction costs. The Center offers summer day camp for children, volleyball, soccer, basketball and tennis leagues and instruction, as well as numerous other activities and programs.
Awards
The Government Finance Officers Association of the United States and Canada (GFOA) awarded a Certificate of Achievement for Excellence in Financial Reporting to the City of Lee’s Summit, Missouri for its comprehensive annual financial report for the fiscal year ended June 30, 2002. This was the 25th consecutive year that the government achieved this prestigious award. In order to be awarded the Certificate of Achievement, a government must publish an easily readable and efficiently organized comprehensive annual financial report. This report must satisfy both generally accepted accounting principles and applicable legal requirements.
A Certificate of Achievement is valid for a period of one year only. We believe our current report continues to meet the Certificate of Achievement Program’s requirements, and we are submitting it to the GFOA to determine its eligibility for another certificate.
In addition, the government also received the GFOA’s Distinguished Budget Presentation Award for its annual budget document beginning July 1, 2002. In order to qualify for the Distinguished Budget Presentation Award, the government’s budget document was judged to be proficient in several categories, including as a policy document, a financial plan, an operations guide, and a communications device.
Risk Management
The City is a member of the Mid-America Regional Council Insurance Trust (MARCIT). MARCIT consists of municipal and county governments located in western and central Missouri. MARCIT is a not-for-profit corporation that addresses the insurance needs for entities in the metropolitan Kansas City area.
MARCIT’s coverage includes a health/dental pool, which was started in July 1984, and a property/casualty pool, which was started in December 1984.
In addition to the insurance coverage provided by MARCIT, the City has established several risk control measures through the City Safety Committee in an effort to minimize accident-related losses.
Independent Audit
City policy requires an annual audit to be made of the financial statements of the various funds and account groups. This audit is performed by an independent certified public accounting firm selected by the City Councilmembers. The City’s auditor is KPMG LLP.

13
Acknowledgments
The preparation of this report was accomplished through the efforts of the staff of the Finance Department in cooperation with the City’s auditors, KPMG LLP. Special recognition should go to Assistant Finance Director, Darlene Pickett, for all of her hard work and coordination in compiling the City’s financial data. Our sincere thanks to all of those who assisted.
Respectfully submitted,
Shelley Temple-Kneuvean Conrad E. Lamb Acting City Administrator Finance Director


(This page left blank intentionally)

Financial Section
____________________________________________________________________________________

(This page left blank intentionally)

18 KPMG LLP, a U.S. limited liability partnership, is the U.S. member firm of KPMG International, a Swiss cooperative.
KPMG LLP 1000 Walnut, Suite 1600 P.O. Box 13127 Kansas City, MO 64106
Independent Auditors’ Report
The Honorable Mayor and Members of the City Council City of Lee’s Summit, Missouri:
We have audited the accompanying financial statements of the governmental activities, the business-type activities, each major fund, and the aggregate remaining fund information of the City of Lee’s Summit, Missouri (the City), as of and for the year ended June 30, 2003, which collectively comprise the City’s basic financial statements as listed in the accompanying table of contents. These financial statements are the responsibility of the City’s management. Our responsibility is to express opinions on these financial statements based on our audit.
We conducted our audit in accordance with auditing standards generally accepted in the United States of America and the standards applicable to financial audits contained in Government Auditing Standards, issued by the Comptroller General of the United States. Those standards require that we plan and perform the audit to obtain reasonable assurance about whether the financial statements are free of material misstatement. An audit includes examining, on a test basis, evidence supporting the amounts and disclosures in the financial statements. An audit also includes assessing the accounting principles used and significant estimates made by management, as well as evaluating the overall financial statement presentation. We believe that our audit provides a reasonable basis for our opinions.
In our opinion, the financial statements referred to above present fairly, in all material respects, the respective financial position of the governmental activities, the business-type activities, each major fund, and the aggregate remaining fund information of the City of Lee’s Summit, Missouri as of June 30, 2003 and the respective changes in financial position and cash flows, where applicable, thereof for the year then ended in conformity with accounting principles generally accepted in the United States of America.
As discussed in note 1 to the basic financial statements, the City adopted the provisions of the Governmental Accounting Standards Board Statement No. 34, Basic Financial Statements—and Management’s Discussion and Analysis—for State and Local Governments; Statement No. 37, Basic Financial Statements—and Management’s Discussion and Analysis—for State and Local Governments: Omnibus; Statement No. 38, Certain Financial Statement Note Disclosures; and Interpretation No. 6, Recognition and Measurement of Certain Liabilities and Expenditures in Governmental Fund Financial Statements, during the year ended June 30, 2003.
In accordance with Government Auditing Standards, we have also issued a report, dated December 1, 2003, on our consideration of the City’s internal control over financial reporting and our tests of its compliance with certain provisions of laws, regulations, contracts, and grants. That report is an integral part of an audit performed in accordance with Government Auditing Standards, and should be read in conjunction with this report in considering the results of our audit.

19
The management’s discussion and analysis, budgetary comparison information and schedule of funding progress on pages 20 through 27 and 60 through 62, respectively, are not a required part of the basic financial statements but are supplementary information required by accounting principles generally accepted in the United States of America. We have applied certain limited procedures, which consisted principally of inquiries of management regarding the methods of measurement and presentation of the required supplementary information. However, we did not audit the information and express no opinion on it.
Our audit was performed for the purpose of forming an opinion on the financial statements that collectively comprise the City of Lee’s Summit’s basic financial statements. The introductory section, supplementary information, and statistical section are presented for purposes of additional analysis and are not a required part of the basic financial statements. The supplementary information has been subjected to the auditing procedures applied in the audit of the basic financial statements and, in our opinion, are fairly stated, in all material respects, in relation to the basic financial statements taken as a whole. The introductory section and statistical section have not been subjected to the auditing procedures applied in the audit of the basic financial statements and, accordingly, we express no opinion on them.
Kansas City, Missouri December 1, 2003
20 (Continued)
CITY OF LEE’S SUMMIT, MISSOURI
Management’s Discussion And Analysis
June 30, 2003
As management of the City of Lee’s Summit, Missouri, we offer readers this narrative overview and analysis of the financial activities of the City of Lee’s Summit, Missouri, for the fiscal year ended June 30, 2003. Since this is the first year of reporting in conformance with the Governmental Accounting Standards Board’s (GASB) Statement No. 34, comparative information for the previous fiscal year is not being provided. We encourage readers to consider the information presented here in conjunction with the transmittal letter at the front of this report and the City’s financial statements, which follow this section.
Financial Highlights
• The assets of the City of Lee’s Summit exceeded its liabilities at the close of the most recent fiscal year by $372,203,856 (net assets). Of this amount, $83,308,837 (unrestricted net assets) may be used to meet the government’s ongoing obligations to citizens and creditors.
• The City’s total net assets increased over $45.9 million. Of this amount, $30.2 million was from the City’s “governmental activities” and the balance was from the “business-type activities.”
• The City’s total debt increased approximately $11.2 million (34.8 percent) during the current fiscal year. The key factor in this increase was the issuance of $13.5 million in revenue bonds for the Combined Waterworks and Sewerage System.
Overview of the Financial Statements
This discussion and analysis is provided as an introduction to the basic financial statements. The basic financial statements consist of three components: government-wide financial statements, fund financial statements, and notes to the financial statements. This report also contains other supplementary information in addition to the basic financial statements.
Government-wide financial statements. The government-wide financial statements are a broad overview of the City’s finances in a manner similar to a private business.
The statement of net assets presents all of the City’s assets and liabilities with the difference between the two reported as net assets. Net assets are an important measure of the City’s overall financial health. The increases and decreases in net assets can be monitored to determine whether the City’s financial position is improving or deteriorating.
The statement of activities presents information showing how the City’s net assets changed during the most recent fiscal year. All changes in net assets are reported as soon as the underlying event giving rise to the change occurs, regardless of the timing of the related cash flows. Thus, revenues and expenses are reported in this statement for some items that will only result in cash flows in future fiscal periods (e.g., uncollected taxes and earned but unused vacation leave).
Both of the government-wide financial statements report functions of the City that are principally supported by taxes and intergovernmental revenues (governmental activities) from other functions that are intended to recover all or a significant portion of their costs through user fees and charges (business-type activities). The governmental activities for the City included general government, public works, public

21 (Continued)
safety, planning and development, and parks and recreation. The business-type activities for the City include the combined waterworks and sewerage system, municipal airport, sanitary landfill, and recreation center.
Fund financial statements. A fund is a grouping of related accounts that is used to maintain control over resources that have been segregated for specific activities or objectives. The City uses fund accounting to ensure compliance with finance-related legal requirements. These funds are divided into two categories: governmental funds and proprietary funds.
Governmental funds. Governmental funds are used to account for essentially the same functions reported as governmental activities in the government-wide financial statements. However, unlike the government-wide financial statements, governmental fund financial statements focus on near-term inflows and outflows of spendable resources, as well as on balances of spendable resources available at the end of the fiscal year. Such information may be useful in evaluating the City’s near-term financing requirements.
Because the focus of governmental funds is narrower than that of the government-wide financial statements, it is useful to compare the information presented for governmental funds with similar information presented for governmental activities in the government-wide financial statements. By doing so, readers may better understand the long-term impact of the government’s near-term financing decisions. Both the governmental fund balance sheet and the governmental fund statement of revenues, expenditures, and changes in fund balances provide a reconciliation to facilitate this comparison between governmental funds and governmental activities.
Proprietary funds. The City uses two different types of proprietary funds. Enterprise funds are used to report the same functions presented as business-type activities in the government-wide financial statements. Internal service funds are an accounting device used to accumulate and allocate costs internally among the City’s various functions. The City uses internal service funds to account for its fleet of vehicles and equipment, management information systems, and self-insurance activities. Because these services predominately benefit governmental rather than business-type functions, they have been included within the governmental activities in the government-wide financial statements.
Notes to the financial statements. The notes provide additional information that is essential to a full understanding of the data provided in the government-wide and fund financial statements.
Other information. In addition to the basic financial statements and accompanying notes, this report also contains certain required supplementary information regarding budgetary and pension information. The combining statements for the nonmajor funds and internal service funds are presented immediately following the required supplementary information on pensions.
Government-wide Financial Analysis
In accordance with GASB Statement No. 34, the City is not required to restate prior periods for the purpose of providing comparative information. However, comparative analysis of government-wide information will be presented in future years when prior year information is available.

22 (Continued)
NET ASSETS
The following table reflects the condensed Schedule of Net Assets as of June 30, 2003:
Governmental Business-typeactivities activities Total
Current and other assets $ 99,823,986 41,121,888 140,945,874Capital assets 188,294,358 164,271,414 352,565,772
Total assets 288,118,344 205,393,302 493,511,646
Long-term liabilities outstanding 35,961,547 39,545,326 75,506,873Other liabilities 33,826,113 11,974,804 45,800,917
Total liabilities 69,787,660 51,520,130 121,307,790
Net assets:Invested in capital assets, net of debt 153,564,358 129,296,414 282,860,772Restricted 6,034,247 — 6,034,247Unrestricted 58,732,079 24,576,758 83,308,837
Total net assets $ 218,330,684 153,873,172 372,203,856
City of Lee’s Summit Net Assets
At the end of the current fiscal year, the City is able to report positive balances in all three categories of net assets, both for the government as a whole, as well as for its separate governmental and business-type activities.
The City’s combined net assets increased to $372.2 million from $326.3 million as a result of the increase in net assets reflected in the next table. The City’s unrestricted net assets for governmental activities were $58.7 million. Total unrestricted net assets were $24.6 million with the business-type activities.
By far the largest portion of the City’s net assets (76 percent) reflects its investment in capital assets (e.g. land, buildings, machinery, and equipment), less any related debt used to acquire those assets that are still outstanding. The City uses these capital assets to provide services to citizens; consequently, these assets are not available for future spending. Although the City’s investment in its capital assets is reported net of related debt, it should be noted that the resources needed to repay this debt must be provided from other sources, since the capital assets themselves cannot be used to liquidate these liabilities.
An additional portion of the City’s net assets (2 percent) represents resources that are subject to external restrictions on how they may be used. The remaining balance of unrestricted net assets ($83.3 million) may be used to meet the government’s ongoing obligations to citizens and creditors.
The City’s net assets increased by $45.9 million during the current fiscal year. Over one half of this increase represents the increase in governmental activities alone.

23 (Continued)
Changes in Net Assets
The following table reflects the revenues and expenses from the City’s activities for the year ended June 30, 2003:
Governmental Business-typeactivities activities Total
Revenues:Program revenues:
Charges for services $ 2,212,944 28,311,806 30,524,750Operating grants and contributions 3,198,388 — 3,198,388Capital grants and contributions — 8,765,475 8,765,475
General revenues: — Property taxes 26,612,349 — 26,612,349Sales and use taxes 24,353,572 — 24,353,572Other revenue 18,736,605 2,506,723 21,243,328
Total revenues 75,113,858 39,584,004 114,697,862
Expenses:Public works 6,055,225 — 6,055,225Public safety 20,683,212 — 20,683,212Parks and recreation 5,282,539 — 5,282,539Planning and development 748,157 — 748,157General government 11,380,283 — 11,380,283Interest on long-term debt 1,872,843 — 1,872,843Combined waterworks and sewerage system — 19,016,233 19,016,233Sanitary landfill — 1,816,037 1,816,037Airport — 1,193,449 1,193,449Recreation Center — 731,802 731,802
Total expenses 46,022,259 22,757,521 68,779,780
Increases in net assets before transfers 29,091,599 16,826,483 45,918,082Transfers 1,129,640 (1,129,640) —
Increase (decrease) in net assets 30,221,239 15,696,843 45,918,082
Net assets, beginning 188,109,445 138,176,329 326,285,774Net assets, ending $ 218,330,684 153,873,172 372,203,856
Governmental Activities
Governmental activities increased the City’s net assets by $30.2 million. Property taxes, the largest governmental category, were $26.6 million or 35.4%. For the fiscal year ended June 30, 2003, revenues totaled $114.6 million (governmental and business-type). Revenues from governmental activities totaled $75.1 million or 65.5% of the total City revenues.

24 (Continued)
Net Cost of City of Lee’s Summit Governmental Activities
Certain revenues are generated that are specific to governmental program activity. These totaled $5,411,332. The following table shows expenses and program revenues of the governmental activities for the year ended June 30, 2003:
Total costs Net costsof services of services
Public works $ 6,055,225 5,135,615Public safety 20,683,212 20,557,853Parks and recreation 5,282,539 5,107,549Planning and development 748,157 (716,444)General government 11,380,283 8,653,511Interest on long-term debt 1,872,843 1,872,843
Total $ 46,022,259 40,610,927
As previously noted, expenses from governmental activities totaled $46.0 million. However, net costs of these services were $40.6 million. The difference represents direct revenues received from charges for services of $2.2 million and operating grants and contributions of $3.2 million. Taxes and other revenues of $69.6 million were collected to cover these net costs.
Business-type Activities
Business-type activities increased the City’s net assets by $15.7 million. Key elements of this increase are as follows:
• The Combined Water and Sewerage system recorded an increase of $14.6 million in net assets for the year, which is attributed to capital contributions of $8.7 million and net revenues of $5.9 million. Charges for services increased almost 12% due to 3% water and 5% sewer rate increases designed to provide additional resources to meet debt service requirements. Revenues also increased as a result of an increase in demand due to population growth and below normal rainfall.
• The Sanitary Landfill fund recorded an increase of $500,000 in net assets for the year, which is attributed to management of costs versus revenues. Landfill operations resulted in a net income amount of $527,715. This amount is net of a transfer out to the General Fund for general and administrative expenses of $177,394 and a transfer to the Landfill Post-Closure Fund of $250,000 to fund future landfill closure costs. The City lowered tipping fees in order to remain competitive with other landfills. Daily tonnage is being closely monitored to ensure that the life of the landfill lasts well into the 21st century. The Landfill continues to fund the debt service on the General Obligation Bonds, which were issued to acquire, develop, and equip the facility. Principal payments for the year totaled $25,000, with the debt being retired in 2003.
Financial Analysis of the City’s Funds
The General Fund is the chief operating fund of the City. The fund balance of the General Fund at June 30, 2003 was $18.3 million or 50% of actual expenditures. This represents an increase of $3.1 million or a 20% increase over the previous year’s balance. The City experienced increases in sales, franchise and property taxes due to new growth. The City recognizes the need for a fund balance that can adequately absorb any downturn in economic events to avoid changes and reductions in service levels. The City Council is firmly committed to maintaining at a minimum, an amount equal to 20% of expenditures in the General Fund balance.

25 (Continued)
The Debt Service Fund ended the year with a balance of $6.0 million, a decrease of $900,000 or 13%. As of June 30, 2003, the City has issued all of the $25.8 million general obligation debt authorized by the electorate in November 1995 and 2000. The City, in accordance with these “No Tax Increase” bond elections, has held the tax levy constant and monitors fluctuations in fund balance for future no tax increase bond issues. On November 5, 2002, the voters approved another “No Tax Increase” bond issue for $37 million in general obligation bonds to provide for the construction of downtown improvements including new streets, streetscape, and a new City Hall. In addition, the bond issue approval provides for construction of a seventh fire station and related equipment, storm warning sirens, a new Animal Control Shelter and road improvements to 3rd Street from View High to Pryor. The City issued $25.5 million of these bonds in August 2003.
General Fund Budgetary Highlights
Differences between the original and the final amended budget can be summarized as follows:
• The total original expenditure budget of $38,524,000 increased to $39,162,000 (an increase of $638,000).
• The total original budget for other financing uses, net of $592,000, decreased to ($1,220,794).
Actual revenues were $2,682,000 more than budgeted. Sales tax revenue was $1,182,000 more than budgeted as a result of the continued success of the new Summit Woods shopping center. Revenue from franchise tax was $828,000 more than anticipated.
The general government budget increased $584,000 and the public works and streets budget increased $54,000. These increases were to be appropriated from the undesignated fund balance. During the year, however, revenues exceeded budgetary estimates and expenditures were less than budgetary estimates, thus eliminating the need to draw upon existing fund balance.
Capital Asset and Debt Administration
Capital Assets
The City’s investment in capital assets for its governmental and business-type activities as of June 30, 2003, amounts to $352,565,772 (net of accumulated depreciation). This investment in capital assets includes land, buildings and systems improvements, collections systems, machinery and equipment, park facilities and infrastructure. Capital assets increased $39 million during the period.
Major capital events during the current fiscal year included the following:
• Continued progress on the Tudor/Scruggs Road project from M-291 to Blackwell Parkway and related M-291 intersection improvements totaling almost $12,700,000.
• Continued progress on the Chipman Road Phase I project totaling over $2,500,000.
• Substantial completion and the opening of Legacy Park in spring 2003 totaling almost $10,175,000.
• Continued progress on the Community Center at Legacy Park totaling almost $2,900,000.
• Various system additions and improvements were completed in the Combined Waterworks and Sewerage Fund at a cost of over $9,154,000.

26 (Continued)
City of Lee’ Summit Capital Assets(amounts expressed in thousands, net of depreciation)
Governmental Business-typeactivities activities Total
2003 2002 2003 2002 2003 2002
Land $ 9,399 9,361 4,600 4,599 13,999 13,960 Construction in progress 18,275 26,734 8,674 18,003 26,949 44,737 Buildings 14,960 10,076 2,308 1,466 17,268 11,542 Improvements 13,655 1,616 147,394 124,951 161,049 126,567 Machinery and equipment 9,701 9,502 1,295 1,430 10,996 10,932 Infrastructure 122,304 105,546 — — 122,304 105,546
Total $ 188,294 162,835 164,271 150,449 352,565 313,284
These capital assets are funded by traditional bond financing, impact fees, and user charges.
Debt Administration
The City, at the end of fiscal 2003, had a total of $72 million of outstanding obligations. This was an increase of $4.6 million or 6.8% from the previous year.
The additional obligations incurred during the fiscal year were not general obligations of the City. The increase in obligations for the business-type activities funds was due to the issuance of $13.5 million in revenue bonds by the combined waterworks and sewerage fund.
City of Lee’ Summit Outstanding Debt(amounts expressed in thousands)
Governmental Business-typeactivities activities Total
2003 2002 2003 2002 2003 2002
General obligation bonds $ 18,170 22,690 — 25 18,170 22,715 Revenue bonds 865 1,050 33,805 22,439 34,670 23,489 Certificates of participation 15,695 17,480 884 914 16,579 18,394 State revolving loan fund — — 2,783 3,035 2,783 3,035
Total $ 34,730 41,220 37,472 26,413 72,202 67,633
As of June 30, 2003, the City’s total issued General Obligation (G.O.) Bonded Debt was $18,170,000 and authorized and unissued debt was $37,000,000. The City has statutory authority to issue debt equal to 20% of the City’s total assessed valuation or $210,998,031. This, less our outstanding debt, authorized and unissued debt, and available cash, leaves a legal debt margin of $160,168,203, which is 75.9% of the City’s total bonding capacity. Bonded debt, net of available debt service funds, amounted to approximately $182 per capita and represented 1.3% of the assessed value of taxable property.
General Obligation Bonds retired in fiscal year 2003 totaled $4,545,000. Of this amount, $25,000 was for landfill acquisition costs and was retired by the City’s Sanitary Landfill Fund.
The City’s most recent General Obligation Bonds have been rated Aa2 by Moody’s Investors Service. Bonds so rated are judged to be of upper grade. Factors contributing to the upgrade include a strong development pattern, favorable financial performance that reflects an expanding local economy, debt position, General Fund balance, and strong voter support.

27
The total revenue bond amount outstanding at June 30, 2003 was $34,945,000, which included $28,310,000 for the Combined Water and Sewer Utility and $5,565,000 of Water Pollution Control. Also included is $865,000 of Building and Equipment Refunding and Improvement Revenue Bonds. These bonds are payable solely from the revenue derived from the operations of the respective funds and are considered to be self-liquidating.
The Combined Water and Sewer Utility Fund retired $2,212,500 of their principal amount outstanding this year. This represents 8.8% of their operating revenues.
The City is participating in the Missouri Leveraged State Water Pollution Control Revolving Fund Program with the issuance of $9,695,000 in December 1990. The bonds are limited obligations of the State Environmental Improvement and Energy Resources Authority, secured by City bonds, and the Reserve Security in an amount equal to fifty percent (50%) of the outstanding principal. The Reserve Security is funded with amounts drawn from federal capitalization grants and state matching funds held in a reserve fund. This provides interest income that can be used to reduce the interest expense that would normally be incurred.
The City’s Combined Water and Sewer Revenue Bonds carry an A1 rating from Moody’s Investors Service.
The City has $16,590,000 in Certificates of Participation outstanding. In July 1998, the City purchased approximately 700 acres for a multipurpose city park on the City’s eastern city limits issuing $2,400,000 in certificates of participation. This debt service is structured as interest only with the principal amount paid in the tenth year. In September 2000, the City issued $955,000 in certificates of participation to acquire, construct, furnish, equip, and install improvements consisting of four airplane hangars and related site improvements at the Lee’s Summit Municipal Airport. In December of 2001, the City issued $15,080,000 in certificates of participation for Legacy Park construction and related road improvements.
Requests for Information
This financial report is designed to provide the reader a general overview of the City’s finances. Questions or requests for more information concerning any of the information provided in this report should be directed to Conrad Lamb, Finance Director, City of Lee’s Summit, PO Box 1600, 207 SW Market Street, Lee’s Summit, MO 64063.

Basic Financial Statements
____________________________________________________________________________________

CITY OF LEE’S SUMMIT, MISSOURI
Statement of Net Assets
June 30, 2003
Primary governmentGovernmental Business-type
Assets activities activities Total
Cash and investments $ 57,724,702 35,626,968 93,351,670 Property taxes receivable 24,838,504 — 24,838,504 Accounts receivable 2,792,068 3,066,406 5,858,474 Accrued interest receivable 780,420 448,756 1,229,176 Internal balances 1,839,279 (1,839,279) — Inventories 67,531 306,298 373,829 Other assets and prepaid expenses 25,481 381,292 406,773 Due from other government agencies 4,341,342 — 4,341,342 Restricted assets:
Cash and cash equivalents 7,414,659 3,131,447 10,546,106 Capital assets:
Nondepreciable 27,673,966 13,273,866 40,947,832 Depreciable, net 160,620,392 150,997,548 311,617,940
Total assets 288,118,344 205,393,302 493,511,646
Liabilities
Accounts payable and other current liabilities 9,360,527 7,530,612 16,891,139 Accrued liabilities 2,139,953 232,161 2,372,114 Deferred revenue 22,325,633 25,906 22,351,539 Liabilities payable from restricted assets
Customer deposits — 323,625 323,625 State revolving loan funds — 270,000 270,000
Long-term liabilities:Due within one year 7,340,000 1,080,000 8,420,000 Due in more than one year 28,621,547 39,545,326 68,166,873 Payable from restricted assets—
State revolving loan fund — 2,512,500 2,512,500
Total liabilities 69,787,660 51,520,130 121,307,790
Net Assets
Invested in capital assets, net of related debt 153,564,358 129,296,414 282,860,772 Restricted for:
Debt service 6,028,041 — 6,028,041 Other 6,206 — 6,206
Unrestricted 58,732,079 24,576,758 83,308,837 Total net assets $ 218,330,684 153,873,172 372,203,856
See accompanying notes to basic financial statements.
29

CITY OF LEE’S SUMMIT, MISSOURI
Statement of Activities
Year ended June 30, 2003
Net (expenses) revenues andProgram revenues changes in net assets
Operating CapitalCharges for grants and grants and Governmental Business-type
Functions/Programs Expenses services contributions contributions activities activities Total
Governmental activities:Public works $ 6,055,225 — 919,610 — (5,135,615) — (5,135,615) Public safety 20,683,212 — 125,359 — (20,557,853) — (20,557,853) Parks and recreation 5,282,539 170,603 4,387 — (5,107,549) — (5,107,549) Planning and development 748,157 — 1,464,601 — 716,444 — 716,444 General government 11,380,283 2,042,341 684,431 — (8,653,511) — (8,653,511) Interest on long-term debt 1,872,843 — — — (1,872,843) — (1,872,843)
Total governmental activities 46,022,259 2,212,944 3,198,388 — (40,610,927) — (40,610,927)
Business-type activities:Waterworks and sewerage
system 19,016,233 24,704,763 — 8,728,294 — 14,416,824 14,416,824 Sanitary landfill 1,816,037 2,533,889 — — — 717,852 717,852 Airport 1,193,449 447,665 — 37,181 — (708,603) (708,603) Recreation center 731,802 625,489 — — — (106,313) (106,313)
Total business-type activities 22,757,521 28,311,806 — 8,765,475 — 14,319,760 14,319,760 Total primary government $ 68,779,780 30,524,750 3,198,388 8,765,475 (40,610,927) 14,319,760 (26,291,167)
General revenues: Property taxes 26,612,349 — 26,612,349 Sales and use taxes 24,353,572 — 24,353,572 Franchise fees 6,853,447 — 6,853,447 License, permits, fines, and forfeitures 3,663,492 — 3,663,492 Revenues from use of money and property 2,874,493 1,606,106 4,480,599 Other revenue 5,345,173 900,617 6,245,790
Transfers 1,129,640 (1,129,640) —
Total general revenues and transfers 70,832,166 1,377,083 72,209,249
Changes in net assets 30,221,239 15,696,843 45,918,082
Net assets—beginning 188,109,445 138,176,329 326,285,774 Net assets—ending $ 218,330,684 153,873,172 372,203,856
See accompanying notes to basic financial statements.
30

CITY OF LEE’S SUMMIT, MISSOURI
Governmental Funds Balance Sheet
June 30, 2003
Road and Nonmajor TotalDebt Park Bridge Excise/ Governmental Governmental
Assets General Service Development Sales Tax Funds Funds
Pooled cash and investments $ 15,359,594 5,342,455 3,563,388 14,313,365 9,882,987 48,461,789 Receivables (net of allowance):
Accounts and other 1,361,300 — — — 1,430,768 2,792,068 Taxes 24,422,969 306,779 — — 108,756 24,838,504 Accrued interest 190,033 73,167 72,229 157,278 194,472 687,179
Due from other funds 1,946,060 — — — 10,000 1,956,060 Due from other governments 513,342 329,190 — 451,346 3,047,464 4,341,342 Inventories 1,023 — — — — 1,023 Prepaid insurance 5,183 — — — — 5,183 Other assets 4,422 — — — 7,603 12,025 Restricted cash and investments 137,690 — 5,112,043 — 2,164,926 7,414,659
Total assets $ 43,941,616 6,051,591 8,747,660 14,921,989 16,846,976 90,509,832
Liabilities and Fund Balances
Liabilities:Accounts and contracts payable $ 1,845,666 — 2,204,925 1,653,169 3,501,661 9,205,421 Salaries and wages payable 1,505,006 — — — 77,221 1,582,227 Accrued interest payable — 23,550 — — 5,288 28,838 Deferred revenue 22,325,633 — — — — 22,325,633 Due to other funds 2,149 — — — 117,100 119,249
Total liabilities 25,678,454 23,550 2,204,925 1,653,169 3,701,270 33,261,368
Fund balances:Reserved for:
Postclosure costs — — — — 1,900,201 1,900,201 Prepaids and inventories 6,206 — — — — 6,206
Unreserved:Designated for debt service — 6,028,041 — — — 6,028,041 Undesignated 18,256,956 — 6,542,735 13,268,820 — 38,068,511
Unreserved, reported in nonmajor funds:Special revenue funds — — — — 2,473,916 2,473,916 Capital projects funds — — — — 8,771,589 8,771,589
Total fund balances 18,263,162 6,028,041 6,542,735 13,268,820 13,145,706 57,248,464 Total liabilities and fund balances $ 43,941,616 6,051,591 8,747,660 14,921,989 16,846,976 90,509,832
See accompanying notes to basic financial statements.
31

CITY OF LEE’S SUMMIT, MISSOURI
Reconciliation of the Governmental Funds Balance Sheetto the Statement of Net Assets
June 30, 2003
Fund balances—total governmental funds $ 57,248,464
Capital assets used in governmental activities are not financialresources and, therefore, are not reported in the funds:
Governmental capital assets $ 213,737,006 Less accumulated depreciation (32,699,972)
181,037,034
Interest on long-term debt is not accrued in governmental funds,but rather is recognized as expenditure when due (488,000)
Internal service funds are used by management to chargethe costs of certain activities to individual funds. The assetsand liabilities of the internal service funds are included in the governmental activities in the statement of net assets 16,475,908
Long-term liabilities, including bonds payable, claims and judgements,and accrued compensated absences, are not due and payable in the current period and, therefore, are not reportedin the funds, net of unamortized premiums/discounts (35,942,722)
Net assets of governmental activities $ 218,330,684
See accompanying notes to basic financial statements.
32

CITY OF LEE’S SUMMIT, MISSOURI
Governmental Funds Statement of Revenues, Expenditures, and Changes in Fund Balances
Year ended June 30, 2003
Road and Nonmajor TotalDebt Park Bridge Excise/ Governmental Governmental
General Service Development Sales Tax Funds FundsRevenues:
Taxes:Property $ 15,072,289 5,143,676 — — 4,808,756 25,024,721 Sales 9,310,409 3,338,963 — 4,654,792 7,049,408 24,353,572 Franchise 6,853,447 — — — — 6,853,447 License tax — — — 1,587,628 — 1,587,628
Intergovernmental 684,431 — 4,387 — 2,509,570 3,198,388 Charges for services 2,042,341 — — — 170,603 2,212,944 Licenses and permits 1,939,017 — — — 177,017 2,116,034 Fines and forfeitures 1,491,763 39,978 — — 15,717 1,547,458 Interest 706,593 246,117 373,561 596,614 597,135 2,520,020 Other 947,391 2,656 89,000 67,712 3,600,414 4,707,173
Total revenues 39,047,681 8,771,390 466,948 6,906,746 18,928,620 74,121,385
Expenditures:Current:
General government 7,456,919 — — — 1,336,674 8,793,593 Public works and streets 6,987,552 — — — — 6,987,552 Public safety 20,882,050 — — — — 20,882,050 Planning and development 748,157 — — — — 748,157 Parks and recreation — — — — 2,411,972 2,411,972
Debt service:Principal retirements — 6,305,000 — — 185,000 6,490,000 Interest and fiscal charges — 1,861,813 1,783 — 97,997 1,961,593
Capital outlay:General government 500,000 — — — 4,422 504,422 Public works and streets — — — 5,804,767 18,028,990 23,833,757 Public safety — — — — 18,510 18,510 Parks and recreation — — 6,389,172 — 5,124 6,394,296
Total expenditures 36,574,678 8,166,813 6,390,955 5,804,767 22,088,689 79,025,902
Excess (deficiency) of revenuesover (under) expenditures 2,473,003 604,577 (5,924,007) 1,101,979 (3,160,069) (4,904,517)
Other financing sources (uses):Transfers in 1,855,345 2,095,216 3,641,835 2,945,114 1,293,419 11,830,929 Transfers out (1,238,794) (3,604,938) (2,095,216) — (4,038,487) (10,977,435)
Total other financing sourcesand uses, net 616,551 (1,509,722) 1,546,619 2,945,114 (2,745,068) 853,494
Net change in fund balances 3,089,554 (905,145) (4,377,388) 4,047,093 (5,905,137) (4,051,023)
Fund balances—beginning 15,173,608 6,933,186 10,920,123 9,221,727 19,050,843 61,299,487 Fund balances—ending $ 18,263,162 6,028,041 6,542,735 13,268,820 13,145,706 57,248,464
See accompanying notes to basic financial statements.
33

CITY OF LEE’S SUMMIT, MISSOURI
Reconciliation of the Change in Fund Balancesof Governmental Funds to the Statement of Activities
June 30, 2003
Net change in fund balances—total governmental funds $ (4,051,023)
Amounts reported for governmental activities in thestatement of activities is different because:
Governmental funds report capital outlays as expenditures. However, inthe statement of activities the cost of those assets is allocated overtheir estimated useful lives and reported as depreciation expense. Thefollowing is the detail of the amount by which capital outlays exceededdepreciation in the current period:
Capital outlay $ 30,750,985 Less: capital outlay not capitalized (182,005)
Capital outlay capitalized 30,568,980
Depreciation (4,334,943)
26,234,037
The issuance of long-term debt (e.g., bonds, loan, leases) provides currentfinancial resources to governmental funds, while the repayment of theprincipal of long-term debt consumes the current financial resourcesof governmental funds. Also, governmental funds report the effect of issuance costs, premiums, discounts, and similar items when debt is first issued, whereas these amounts are deferred and amortized in the statement of activities. In the statement of activities, interest is accruedon outstanding bonds, whereas in the governmental funds, an interestexpenditure is reported when due. The following is the detail of the neteffect of these differences in the treatment of long-term debt andrelated items:
Repayment of principal (bonds, loans, capitalized lease obligations) 6,490,000 Claims and judgments 500,000 Compensated absences (124,095) Interest 88,750
6,954,655
Internal service funds are used by management to charge the costsof various activities internally to individual funds. The net expenseof certain activities of internal service funds is reported withgovernmental activities. 1,083,570
Change in net assets of governmental activities $ 30,221,239
See accompanying notes to basic financial statements.
34
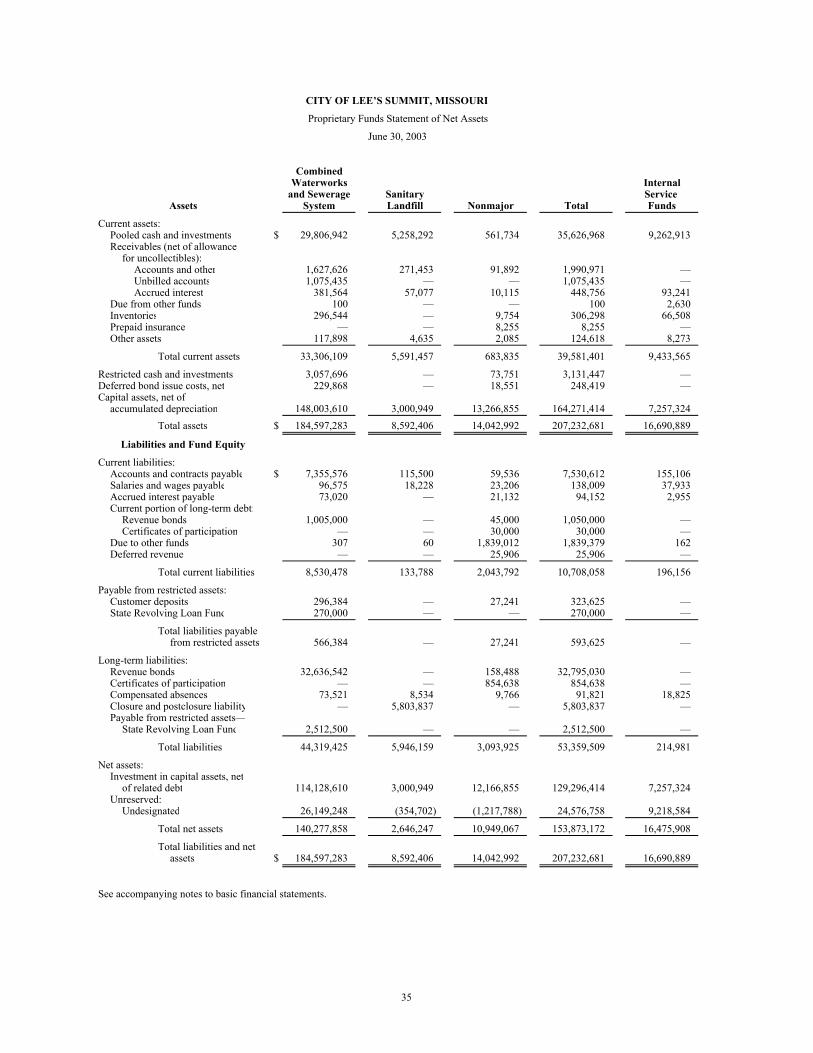
CITY OF LEE’S SUMMIT, MISSOURI
Proprietary Funds Statement of Net Assets
June 30, 2003
CombinedWaterworks Internal
and Sewerage Sanitary Service Assets System Landfill Nonmajor Total Funds
Current assets: Pooled cash and investments $ 29,806,942 5,258,292 561,734 35,626,968 9,262,913
Receivables (net of allowance for uncollectibles):
Accounts and other 1,627,626 271,453 91,892 1,990,971 — Unbilled accounts 1,075,435 — — 1,075,435 — Accrued interest 381,564 57,077 10,115 448,756 93,241
Due from other funds 100 — — 100 2,630 Inventories 296,544 — 9,754 306,298 66,508 Prepaid insurance — — 8,255 8,255 — Other assets 117,898 4,635 2,085 124,618 8,273
Total current assets 33,306,109 5,591,457 683,835 39,581,401 9,433,565
Restricted cash and investments 3,057,696 — 73,751 3,131,447 — Deferred bond issue costs, net 229,868 — 18,551 248,419 — Capital assets, net of
accumulated depreciation 148,003,610 3,000,949 13,266,855 164,271,414 7,257,324 Total assets $ 184,597,283 8,592,406 14,042,992 207,232,681 16,690,889
Liabilities and Fund Equity
Current liabilities:Accounts and contracts payable $ 7,355,576 115,500 59,536 7,530,612 155,106 Salaries and wages payable 96,575 18,228 23,206 138,009 37,933 Accrued interest payable 73,020 — 21,132 94,152 2,955 Current portion of long-term debt:
Revenue bonds 1,005,000 — 45,000 1,050,000 — Certificates of participation — — 30,000 30,000 —
Due to other funds 307 60 1,839,012 1,839,379 162 Deferred revenue — — 25,906 25,906 —
Total current liabilities 8,530,478 133,788 2,043,792 10,708,058 196,156
Payable from restricted assets:Customer deposits 296,384 — 27,241 323,625 — State Revolving Loan Fund 270,000 — — 270,000 —
Total liabilities payablefrom restricted assets 566,384 — 27,241 593,625 —
Long-term liabilities:Revenue bonds 32,636,542 — 158,488 32,795,030 — Certificates of participation — — 854,638 854,638 — Compensated absences 73,521 8,534 9,766 91,821 18,825 Closure and postclosure liability — 5,803,837 — 5,803,837 — Payable from restricted assets—
State Revolving Loan Fund 2,512,500 — — 2,512,500 —
Total liabilities 44,319,425 5,946,159 3,093,925 53,359,509 214,981
Net assets:Investment in capital assets, net
of related debt 114,128,610 3,000,949 12,166,855 129,296,414 7,257,324 Unreserved:
Undesignated 26,149,248 (354,702) (1,217,788) 24,576,758 9,218,584
Total net assets 140,277,858 2,646,247 10,949,067 153,873,172 16,475,908
Total liabilities and netassets $ 184,597,283 8,592,406 14,042,992 207,232,681 16,690,889
See accompanying notes to basic financial statements.
35

CITY OF LEE’S SUMMIT, MISSOURI
Proprietary Funds Statement of Revenues, Expenses, and Changes in Fund Net Assets
Year ended June 30, 2003
CombinedWaterworks Internal
and Sewerage Sanitary Service System Landfill Nonmajor Total Funds
Operating revenues: Charges for services $ 24,704,763 2,533,889 1,073,154 28,311,806 4,386,351 Material sales 163,299 — — 163,299 —
Fuel sales — — 474,695 474,695 — Other 131,988 7,903 122,732 262,623 47,256
Total operating revenues 25,000,050 2,541,792 1,670,581 29,212,423 4,433,607
Operating expenses:Salaries, wages, and employee
benefits 3,141,431 678,266 759,790 4,579,487 1,008,251 Water purchases 4,591,804 — — 4,591,804 — Sewer services 3,530,560 — — 3,530,560 — Maintenance and repairs 375,516 177,362 86,482 639,360 209,603 Utilities 394,466 11,243 49,352 455,061 74,095 Fuels and lubricants 40,879 66,227 347,807 454,913 1,652 Depreciation and amortization 2,912,394 116,960 284,735 3,314,089 2,063,461 Post-closure expense — 277,994 — 277,994 — Other 1,815,483 487,197 305,712 2,608,392 915,709
Total operating expenses 16,802,533 1,815,249 1,833,878 20,451,660 4,272,771
Operating income (loss) 8,197,517 726,543 (163,297) 8,760,763 160,836
Nonoperating revenues (expenses):Interest income 1,354,461 229,354 22,291 1,606,106 354,473 Interest expense (2,205,607) (788) (91,373) (2,297,768) — Gain (loss) on disposal of capital assets (8,093) — — (8,093) 292,115 Grant reimbursements — — 37,181 37,181 —
Total nonoperating revenues (expenses) (859,239) 228,566 (31,901) (662,574) 646,588
Net income (loss) beforetransfers and contributedcapital 7,338,278 955,109 (195,198) 8,098,189 807,424
Contributed capital 8,728,294 — — 8,728,294 — Transfers in — — 830,000 830,000 276,146 Transfers out (1,443,048) (427,394) (89,198) (1,959,640) —
Net income 14,623,524 527,715 545,604 15,696,843 1,083,570
Total net assets—beginning of year 125,654,334 2,118,532 10,403,463 138,176,329 15,392,338 Total net assets—end of year $ 140,277,858 2,646,247 10,949,067 153,873,172 16,475,908
See accompanying notes to basic financial statements.
36

CITY OF LEE’S SUMMIT, MISSOURI
Proprietary Funds Statement of Cash Flows
Year ended June 30, 2003
Enterprise Funds Combined
Waterworks Internaland Sewerage Sanitary Service
System Landfill Nonmajor Total Funds
Cash flows from operating activities:Cash received from customers $ 24,958,373 2,700,444 1,545,500 29,204,317 4,386,351 Cash paid to suppliers (3,139,054) (672,246) (1,201,342) (5,012,642) (1,197,700) Cash paid to employees (5,370,837) (1,006,710) (763,466) (7,141,013) (1,011,171) Other cash paid for nonoperating expenses 131,988 7,903 122,732 262,623 9,777
Net cash provided by (used in) operating activities 16,580,470 1,029,391 (296,576) 17,313,285 2,187,257
Cash flows from noncapital financing activities:Transfers in — — 830,000 830,000 276,146 Transfers out (1,443,048) (427,394) (89,198) (1,959,640) —
Net cash provided by (used in) noncapital financing activities (1,443,048) (427,394) 740,802 (1,129,640) 276,146
Cash flows from capital and related financing activities:Principal payments on long-term debt (2,212,500) (25,000) (75,000) (2,312,500) — Proceeds from issuance of long-term debt 13,500,000 — — 13,500,000 — Interest paid on long-term debt obligations (2,228,008) (1,050) (92,525) (2,321,583) — Additions to capital assets (9,635,959) (696,920) (4,198) (10,337,077) (1,208,443) Increase in payables from restricted assets 79,069 — — 79,069 — Capital contributions 1,833,182 — — 1,833,182 — Proceeds from sale of capital assets — — — — 298,839
Net cash provided by (used in) capital and related financing activities 1,335,784 (722,970) (171,723) 441,091 (909,604)
Cash flows from investing activities:Interest received 1,286,599 228,609 15,310 1,530,518 338,871
Net cash provided by investing activities 1,286,599 228,609 15,310 1,530,518 338,871
Net increase in cash and cash equivalents 17,759,805 107,636 287,813 18,155,254 1,892,670
Cash and cash equivalents, beginning of year 15,104,833 5,150,656 347,672 20,603,161 7,370,243 Cash and cash equivalents, end of year $ 32,864,638 5,258,292 635,485 38,758,415 9,262,913
Reconciliation of operating income (loss) to net cash provided(used) by operating activities:
Operating income (loss) $ 8,197,517 726,543 (163,297) 8,760,763 160,836 Adjustments to reconcile operating income (loss) to net
cash provided by operating activities:Depreciation and amortization 2,912,394 116,960 284,735 3,314,089 2,063,461 Other nonoperating expenses 8,093 — — 8,093 — (Increase) decrease in:
Inventories 2,301 — 52 2,353 (40,139) Accounts receivable (221,580) 51,693 (4,312) (174,199) — Due from other government agencies 322,238 — — 322,238 — Due from other funds 900 — — 900 (13) Unbilled revenue (30,267) — — (30,267) — Prepaid expenses 8,627 (342) (1,044) 7,241 3,764
Increase (decrease) in:Accounts payable 5,377,871 13,313 (7,152) 5,384,032 3,346 Salaries and wages payable (616) 6,020 (3,676) 1,728 (2,920) Customer deposits — — 2,994 2,994 — Due to other funds (1) — (405,283) (405,284) — Accrued landfill closure/postclosure care costs — 113,460 — 113,460 — Estimated liability for incurred but unreported claims — — — — 13 Accrued compensated absences 2,993 1,744 407 5,144 (1,091)
Total adjustments 8,382,953 302,848 (133,279) 8,552,522 2,026,421
Net cash provided by (used in) operating activities $ 16,580,470 1,029,391 (296,576) 17,313,285 2,187,257
See accompanying notes to basic financial statements.
37

CITY OF LEE’S SUMMIT, MISSOURI
Notes to Basic Financial Statements
June 30, 2003
(Continued) 38
(1) Summary of Significant Accounting Policies
(a) Reporting Entity
The City of Lee’s Summit, Missouri (the City) was incorporated in 1868 and covers an area of approximately 64 square miles in Jackson and Cass Counties, Missouri. Lee’s Summit is a charter city operating under an elected Mayor-City Council form of government. The City Administrator is the chief administrative officer of the City. The City provides services to more than 70,000 residents in many areas, including law enforcement, fire protection, water and sewer services, community enrichment and development, and various social services. Educational services are provided by separate governmental entities.
The accounting and reporting policies of the City conform to accounting principles generally accepted in the United States of America (GAAP) applicable to local governments. The following represent the more significant accounting and reporting policies and practices of the City.
The Financial Reporting Entity
The City is governed by an elected eight-member council and a mayor. As required by GAAP, these financial statements present the City of Lee’s Summit (the primary government). The following component unit is included in the City’s reporting entity because of the significance of its operational and financial relationship with the City.
Blended Component Unit
The following legally separate entity is a component unit that is, in substance, a part of the City’s general operations. This component unit provides services almost entirely to the primary government and provides services that almost exclusively benefit the primary government. Data from this unit are combined with data of the primary government for financial reporting purposes.
The Lee’s Summit, Missouri Municipal Building Authority (the Authority) is a not-for-profit corporation incorporated under the laws of the State of Missouri on August 13, 1994. The Authority is governed by a three-member board appointed by the City Council. The Authority was established to promote, acquire, develop, construct, own, and lease facilities within the City that are approved by the City Council for the purpose of promoting the economic, social, industrial, cultural, and commercial growth and for the general benefit of the City and its residents. Administration of its various programs is performed by City employees. Although it is legally separate from the City, the Authority is reported as if it were part of the primary government because its sole purpose is to finance and construct the City’s public buildings. Separate financial statements for the Authority are not prepared.
(b) Government-wide and Fund Financial Statements
The basic financial statements include both the government-wide (the Statement of Net Assets and the Statement of Activities) and fund financial statements.

CITY OF LEE’S SUMMIT, MISSOURI
Notes to Basic Financial Statements
June 30, 2003
(Continued) 39
Government-wide Financial Statements: The government-wide statements display information about the primary government and its component unit. For the most part, the interfund activity has been eliminated from these statements to minimize the duplication of internal activities. Governmental activities, which are supported by taxes and intergovernmental revenues, are reported separately from business-type activities, which rely on fees and charges for services for support.
In the government-wide Statement of Net Assets, both the governmental and business-type activities are each consolidated and presented on the full accrual, economic resources basis of accounting. The consolidated presentation incorporates long-term assets and receivables as well as long-term debt and obligations, and it provides valuable information for greater analysis and comparability.
The government-wide Statement of Activities presents a comparison between direct expenses and program revenues for each function of the City’s governmental and business-type activities. Direct expenses are those that are specifically associated with a program or a function. Program revenues include (a) charges paid by recipients of goods or services offered by the programs and (b) grants and contributions that are restricted to meet operational or capital requirements of a particular program. Revenues that are not classified as program revenues, including all taxes, are presented as general revenues.
Fund Financial Statements: Separate fund financial statements report information on the City’s governmental, and proprietary funds. The emphasis of fund financial statements is on major governmental and enterprise funds, each displayed in a separate column. All remaining funds are aggregated and reported as nonmajor funds in their respective categories.
Governmental fund financial statements use the current financial resources measurement focus and the modified accrual basis of accounting. Consequently, the emphasis on near-term inflows and outflows of resources do not present the long-term impact of transactions. Conversely, the proprietary fund statements incorporate the accrual basis of accounting and focus on the change in total economic resources. This presentation records long-term assets and liabilities, and recognizes revenues and expenses when transactions occur, regardless of their impact on the flow of cash. Since the accounting differs significantly between the governmental funds and the proprietary funds, it is necessary to convert the governmental fund data to arrive at the government-wide financial statements. Therefore, reconciliations have been provided following the Governmental Funds Balance Sheet and the Statement of Revenues, Expenditures, and Changes in Fund Balance identifying categories that required conversion from the fund statements.
The City reports the following major governmental funds:
General Fund—This fund is the City’s primary operating fund. It accounts for all financial resources of the general government, except those required to be accounted for in another fund.
CITY OF LEE’S SUMMIT, MISSOURI
Notes to Basic Financial Statements
June 30, 2003
(Continued) 40
Debt Service—This fund accounts for the accumulation of resources for, and the payment of, principal, interest, and fiscal charges on long-term obligations other than obligations payable from the operations of Proprietary Fund Types.
Park Development—This fund accounts for the construction of new parks.
Road and Bridge Excise/Sales Tax—This fund accounts for road and bridge improvement projects within the City related to a fiscal year 1995 tax levy.
The City reports the following major proprietary funds:
Combined Waterworks and Sewerage System—This fund accounts for the provision of waste and sewer services to the general public. All activities necessary to provide such services are accounted for in this fund, including administration, operations, maintenance, financing and related debt service, and billing and collection.
Sanitary Landfill—This fund accounts for all assets, liabilities, and revenues and expenditures relating to the operation of the City-owned sanitary landfill.
The City reports the following fund types:
Internal Service Funds—These funds account for the costs of the Central Vehicles, Management Information System, and the Self-Insurance Funds.
The City applies all applicable pronouncements of the Financial Accounting Standards Board (FASB) in accounting and reporting for proprietary activities issued on or before November 30, 1989, unless these pronouncements conflict with applicable Governmental Accounting Standards Board (GASB) guidance as prescribed by GASB Statement No. 20. No pronouncements of the FASB issued after November 30, 1989 have been adopted.
As a general rule, the effect of interfund activity has been eliminated from the government-wide financial statements.
Amounts reported as program revenues include (1) charges to customers or applications for goods, services, or privileges provided, (2) operating grants and contributions, and (3) capital grants and contributions, including special assessments. Internally dedicated resources are reported as general revenues rather than as program revenues. Likewise, general revenues include all taxes.
Proprietary funds distinguish operating revenues and expenses from nonoperating items. Operating revenues and expenses generally result from providing services and producing and delivering goods in connection with a proprietary fund’s principal ongoing operations.
When both restricted and unrestricted resources are available for use, it is the government’s policy to use restricted resources first, and the unrestricted resources as they are needed.

CITY OF LEE’S SUMMIT, MISSOURI
Notes to Basic Financial Statements
June 30, 2003
(Continued) 41
(c) Assets, Liabilities, and Net Assets or Equity
(1) Deposits and Investments
The City maintains a cash and investment pool. Investments with an original maturity date of three months or less are considered to be cash equivalents. Interest earned is allocated to individual funds based on their proportionate share of the pool. Missouri state statutes authorize the City to invest in obligations of the U.S. Treasury and U.S. agencies, obligations of state and local government entities, certificates of deposit, and repurchase agreements.
The City’s investments in U.S. Treasury securities and U.S. Government agency obligations are held by the City’s agent in the City’s name. The City’s U.S. Government agency obligations consist of direct investments in Federal Farm Credit Bank, Federal Home Loan Bank, and Federal National Mortgage Association notes and debentures having stated interest rates and maturities; thus, there is no risk of prepayment on these securities when market interest rates decline.
Missouri state statutes authorize the City, with certain restrictions, to deposit funds in open accounts and certificates of deposit. Missouri state statutes also require that collateral pledged must have fair market value equal to 100% of the funds on deposit, less amounts insured by federal deposit insurance. Collateral securities must be held by the City or a disinterested third party and may include U.S. Government and government agency bonds and securities; general obligation bonds of any of the 50 states; general obligation bonds of any Missouri county, certain cities, and special districts; and revenue bonds of certain Missouri agencies. Obligations pledged to secure deposits are delivered to the banks’ joint custody accounts at the custodial bank. Written custodial agreements are required that provide, among other things, that the collateral be held separate from the assets of the custodial bank.
Investments for the City are reported at fair value on quoted market prices.
(2) Receivables and Payables
Activity between funds that is representative of borrowing/lending arrangements outstanding at the end of the fiscal year are referred to as either “due to/due from other funds.” Any residual balances outstanding between the governmental activities and business-type activities are reported in the government-wide financial statements as “internal balances.”
All receivables are shown net of an allowance for doubtful accounts.
(3) Property Tax Revenue Recognition
Property tax revenue is recognized independent of receivable recognition in the fiscal year for which the taxes have been levied (budgeted). Property tax revenue becomes available within the fiscal year of the levy. Delinquent taxes expected to be received

CITY OF LEE’S SUMMIT, MISSOURI
Notes to Basic Financial Statements
June 30, 2003
(Continued) 42
later than 60 days after the close of the fiscal year are classified as unearned revenue within the governmental fund financial statements.
The City’s property taxes are levied each November 1 based on the assessed value as of the prior January 1 for all real property and personal property located within the City. Property taxes are billed immediately following the levy date and considered delinquent after December 31 following the levy date. The City does not file liens, as this is performed by the counties. Assessed values are established by county assessors, subject to review by the counties’ Boards of Equalization.
The City is permitted by Missouri state statutes to levy taxes up to $1.00 per $100 of assessed valuation for general governmental services other than the payment of principal and interest on long-term debt and in unlimited amounts for the payment of principal and interest on long-term debt.
The tax levy, per $100 assessed valuation, for the City during the fiscal year was as follows:
General $ 0.96Park Board 0.17Debt Service 0.48
Total tax levy $ 1.61
(4) Inventories and Prepaid Items
Inventories are stated at cost, which approximates market, using the first-in, first-out (FIFO) method. The costs of governmental fund-type inventories are recorded as expenditures when consumed rather than when purchased.
Prepaid insurance represents the payment of insurance premiums for coverage that benefits more than one fiscal period. The premium amounts are amortized over the policy periods.
(5) Restricted Assets
Certain proceeds of the City’s bonds, as well as certain resources set aside for their repayment, are classified as restricted assets on the applicable balance sheets and statement of net assets because they are maintained in separate bank accounts and their use is limited by applicable bond covenants.
(6) Capital Assets
Capital assets include land, buildings, improvements, equipment, and infrastructure assets (e.g., roads, bridges storm sewers, and similar items) and are included in the applicable governmental or business-type activities columns in the government-wide financial statements. Capital assets, excluding land, are defined by the City as assets with a cost of $5,000 or greater and an estimated useful life of at least one year. All

CITY OF LEE’S SUMMIT, MISSOURI
Notes to Basic Financial Statements
June 30, 2003
(Continued) 43
land purchases are capitalized regardless of cost. All purchased fixed assets are valued at cost where historical records are available and at an estimated historical cost where no historical records exist. Donated fixed assets are valued at their estimated fair market value on the date received. The costs of normal maintenance and repairs that do not add to the value of the asset or materially extend asset lives are not capitalized.
Historically, governmental infrastructure assets have not been capitalized and reported in the financial statements. In conformity with GASB 34, infrastructure, such as streets, intersections, and storm sewers, completed in the current year has been capitalized. Additionally, the City elected to depreciate its infrastructure assets. Infrastructure assets not completed by year-end have been reported as construction in progress. Retroactive reporting of the City’s major infrastructure assets extends only to the assets that were completed in the current year, in which prior year costs for such projects were included. All other retroactive reporting of infrastructure assets will occur by the year ending June 30, 2006.
Major outlays for capital improvements are capitalized as projects are constructed. Interest incurred during the construction phase of capital assets of the business-type activities and proprietary funds is included as part of the capitalized value of the assets constructed. There was no interest capitalized during the year ended June 30, 2003.
Property, plant, equipment, and infrastructure is depreciated using the straight-line method over the following estimated lives:
Years
Primary government:Buildings 20 to 40Improvements other than buildings 5 to 50Sewer plant and collection system 35 to 75Machinery and equipment 3 to 25Infrastructure 15 to 50
(7) Compensated Absences
All vested or accumulated vacation, scheduled holiday leave and vested accumulated sick leave is accrued when incurred in the government-wide and proprietary financial statements. A liability for these amounts is reported in governmental funds only if they have matured, for example, as a result of employee resignations and retirements.
(8) Long-term Obligations
In the government-wide financial statements and proprietary fund financial statements, long-term debt and obligations are reported in the Statements of Net Assets as liabilities in the applicable governmental and business-type categories. Bond premiums and discounts, as well as issuance costs, are deferred and amortized over the life of the bonds using the straight-line method. Bonds payable are reported net of the applicable

CITY OF LEE’S SUMMIT, MISSOURI
Notes to Basic Financial Statements
June 30, 2003
(Continued) 44
bond premium or discount. Bond issuance costs are reported as deferred charges and amortized over the term of the related debt.
In the fund financial statements, governmental fund types recognize bond premiums and discounts, as well as issuance costs, during the current period. The face amount of debt issued is reported as other financing sources. Premiums received on debt issuances are reported as other financing sources, while discounts on debt issuances are reported as other financing uses. Issuance costs, whether or not withheld from the actual debt proceeds received, are reported as debt service expenditures.
(9) Fund Balances
In the fund financial statements, governmental funds report reservations of fund balance for amounts that are not available for appropriation or are legally restricted by outside parties for use for specific purposes. Designation of fund balances represent tentative plans for future use of financial resources that are subject to change.
(10) Unbilled Revenue
Both the City’s Waterworks and Sewerage System bill their customers on a cyclical basis and, therefore, record estimated unbilled revenues at year-end less accounts receivable.
(11) Interfund and Related Party Transactions
Transactions between the City’s various funds are accounted for as revenues and expenditures or expenses in the funds involved if they are similar to transactions with organizations external to City government.
(12) Net Assets
In the government-wide and proprietary fund financial statements, equity is displayed in three components as follows:
Invested in Capital Assets, Net of Related Debt—This consists of capital assets, net of accumulated depreciation, less the outstanding balances of any bonds, notes, or other borrowings, that are attributable to the acquisition, construction, or improvement of those assets.
Restricted—This consists of net assets that are legally restricted by outside parties or by law through constitutional provisions or enabling legislation.
Unrestricted—This consists of net assets that do not meet the definition of “restricted” or “invested in capital assets, net of related debt.”

CITY OF LEE’S SUMMIT, MISSOURI
Notes to Basic Financial Statements
June 30, 2003
(Continued) 45
(13) New Accounting Pronouncements
Effective July 1, 2002, the City adopted the provisions of Governmental Accounting Standards Board Statement No. 34, Basic Financial Statements—and Management’s Discussions and Analysis—for State and Local Governments, and Statement No. 37, Basic Financial Statements and Management’s Discussion and Analysis for State and Local Governments: Omnibus. These Statements establish new financial reporting requirements and significantly change the format and content of the City’s financial statements. They require new information and restructure much of the information that the City has presented in the past.
Effective July 1, 2002, the City adopted the provisions of Governmental Accounting Standards Board Statement No. 38, Certain Financial Statement Note Disclosures. This Statement modifies, establishes, and rescinds certain financial statement note disclosures.
Effective July 1, 2002, the City adopted the provisions of Governmental Accounting Standards Board Interpretation No. 6, Recognition and Measurement of Certain Liabilities and Expenditures in Governmental Fund Financial Statements. This Interpretation clarifies the application of standards for modified accrual recognition of certain liabilities and expenditures in governmental funds. There was no significant impact on the City’s financial statements as a result of adopting this Interpretation.
These statements had a significant effect on the City’s financial reporting model. All statements were retroactively applied to July 1, 2002. Restatement of net assets within the government-wide financial statement is as follows:
General Fund $ 15,173,608Special Revenue Funds 4,285,884Debt Service Fund 6,933,186Capital Projects Funds 34,906,809Enterprise Funds 138,176,329Internal Service Funds 15,392,338
Total fund equity, June 30, 2002 $ 214,868,154
Required GASB 34 adjustments:Capital assets, net of accumulated depreciation $ 154,802,997Long-term and other liabilities (43,385,377)
Total net assets, June 30, 2002 $ 326,285,774

CITY OF LEE’S SUMMIT, MISSOURI
Notes to Basic Financial Statements
June 30, 2003
(Continued) 46
(14) Capital Contributions
Capital contributions represent government grants and other aid used to fund capital projects. Capital contributions are recognized as revenue when the expenditure is made and amounts become subject to claim for reimbursement.
(15) Use of Estimates
The preparation of financial statements in conformity with Generally Accepted Accounting Principles (GAAP) requires management to make estimates and assumptions that affect the reported amounts of assets and liabilities and disclosure of contingent assets and liabilities at the date of the financial statements, and the reported amounts of revenues and expenses during the reporting period. Actual results could differ from those estimates.
(2) Detailed Notes on all Funds
(a) Deposits and Investments
The City maintains a cash and investment pool that is available for use by all funds. The pool is comprised of deposits, repurchase agreements, and other investments with maturities of primarily less than one year. At June 30, 2003, the bank balance of the City’s deposits was $12,836,256, which was covered by federal depository insurance or by collateral held by the City’s agent in the City’s name. A difference exists between bank and book balances due to deposits in transit and other reconciling items.
The City’s investments are categorized into these three categories of credit risk:
(1) Insured or registered, or securities held by the City or its agent in the City’s name.
(2) Uninsured and unregistered, with securities held by the counterparty’s trust department or agent in the City’s name.
(3) Uninsured and unregistered with securities held by the counterparty, or held by its trust department or agent, but not in the City’s name.

CITY OF LEE’S SUMMIT, MISSOURI
Notes to Basic Financial Statements
June 30, 2003
(Continued) 47
The fair values, as determined by quoted market prices, of the City’s investments at June 30, 2003, which are all category 1, are as follows:
Fairvalue
U.S. Treasury securities $ 24,652,847 U.S. Government agency obligations 60,330,096 Book value of cash and deposits 18,914,833
Total deposits and investments $ 103,897,776
Deposits and investments of the City are reflected in the government-wide financial statements as follows:
Government-wide
statement ofnet assets
Pooled cash and investments $ 93,351,670 Restricted assets 10,546,106
Total $ 103,897,776

CITY OF LEE’S SUMMIT, MISSOURI
Notes to Basic Financial Statements
June 30, 2003
(Continued) 48
(b) Capital Assets
Capital asset activity for the year ended June 30, 2003 was as follows:
Governmental ActivitiesBalance Balance
June 30, 2002 Additions Deductions June 30, 2003
Nondepreciable capital assets:Land $ 9,360,688 37,912 — 9,398,600 Construction in progress 26,734,458 20,470,702 (28,929,794) 18,275,366
Total nondepreciable capital assets 36,095,146 20,508,614 (28,929,794) 27,673,966
Depreciable capital assets:Buildings 12,463,701 5,593,032 — 18,056,733 Improvement other than buildings 3,223,493 12,550,464 — 15,773,957 Furniture, fixtures, and equipment 18,993,842 2,627,342 (1,298,891) 20,322,293 Infrastructure 128,791,987 19,552,389 — 148,344,376
Total depreciable capital assets 163,473,023 40,323,227 (1,298,891) 202,497,359
Less accumulated depreciation:Buildings 2,388,449 (708,476) — 3,096,925 Improvement other than buildings 1,606,918 (512,472) — 2,119,390 Furniture, fixtures, and equipment 9,491,621 (2,383,742) 1,254,208 10,621,155 Infrastructure 23,245,782 (2,793,715) — 26,039,497
Total accumulated depreciation 36,732,770 (6,398,405) 1,254,208 41,876,967
Total depreciable capital assets, net 126,740,253 33,924,822 (44,683) 160,620,392
Total governmental activities capital assets $ 162,835,399 54,433,436 (28,974,477) 188,294,358
Depreciation expense was charged to functions as follows:
General government $ 71,628 Public safety 879,190 Public works 2,911,884 Parks and recreation 472,241 Capital assets held by the government’s Internal Service
Funds are charged to the various functions based ontheir usage of the assets 2,063,462
Total depreciation expense—governmental activities $ 6,398,405

CITY OF LEE’S SUMMIT, MISSOURI
Notes to Basic Financial Statements
June 30, 2003
(Continued) 49
Balance BalanceJune 30, 2002 Additions Deductions June 30, 2003
Business-type ActivitiesCombined Waterworks and Sewerage System Fund:
Nondepreciable capital assets:Land $ 313,287 — — 313,287 Construction in progress 15,360,190 9,486,019 (18,145,889) 6,700,320
Total nondepreciable capital assets 15,673,477 9,486,019 (18,145,889) 7,013,607
Depreciable capital assets:Structures and improvements 144,888,634 25,058,957 — 169,947,591 Furniture, fixtures, and equipment 2,849,585 6,751 (8,355) 2,847,981
Total depreciable capital assets 147,738,219 25,065,708 (8,355) 172,795,572
Less accumulated depreciation:Structures and improvements (27,319,084) (2,809,385) — (30,128,469) Furniture, fixtures, and equipment (1,574,308) (103,009) 217 (1,677,100)
Total accumulated depreciation (28,893,392) (2,912,394) 217 (31,805,569)
Total depreciable capital assets, net 118,844,827 22,153,314 (8,138) 140,990,003
Total Waterworks and Sewerage System capital assets 134,518,304 31,639,333 (18,154,027) 148,003,610
Sanitary Landfill Fund:Nondepreciable capital assets:
Land 35,722 — — 35,722 Construction in progress 775,175 696,920 (343,937) 1,128,158
Total nondepreciable capital assets 810,897 696,920 (343,937) 1,163,880
Depreciable capital assets:Structures and improvements 3,607,335 343,937 — 3,951,272 Furniture, fixtures, and equipment 242,726 — — 242,726
Total depreciable capital assets 3,850,061 343,937 — 4,193,998
Less accumulated depreciation:Structures and equipment (2,095,205) (93,365) — (2,188,570) Furniture, fixtures and equipment (144,764) (23,595) — (168,359)
Total accumulated depreciation (2,239,969) (116,960) — (2,356,929)
Total depreciable capital assets, net 1,610,092 226,977 — 1,837,069
Total Sanitary Landfillcapital assets 2,420,989 923,897 (343,937) 3,000,949

CITY OF LEE’S SUMMIT, MISSOURI
Notes to Basic Financial Statements
June 30, 2003
(Continued) 50
Balance BalanceJune 30, 2002 Additions Deductions June 30, 2003
Nonmajor Enterprise Fund:Nondepreciable capital assets:
Land $ 4,250,335 630 — 4,250,965 Construction in progress 1,867,808 41,953 (1,064,347) 845,414
Total nondepreciable capital assets 6,118,143 42,583 (1,064,347) 5,096,379
Depreciable capital assets:Structures and equipment 11,239,911 1,063,717 — 12,303,628 Furniture, fixtures, and equipment 106,713 — — 106,713
Total depreciable capital assets 11,346,624 1,063,717 — 12,410,341
Less accumulated depreciation:Structures and equipment (3,904,721) (278,104) — (4,182,825) Furniture, fixtures, and equipment (50,409) (6,631) — (57,040)
Total accumulated depreciation (3,955,130) (284,735) — (4,239,865)
Total depreciable capital assets, net 7,391,494 778,982 — 8,170,476
Total nonmajor capital assets 13,509,637 821,565 (1,064,347) 13,266,855
Total business-type activities capital assets $ 150,448,931 33,384,794 (19,562,311) 164,271,414
Depreciation expense was charged to functions as follows:
Combined Waterworks and Sewerage System $ 2,912,394 Sanitary Landfill 116,960 Nonmajor Enterprise Funds 284,735
Total depreciation expense—business-type activities $ 3,314,089

CITY OF LEE’S SUMMIT, MISSOURI
Notes to Basic Financial Statements
June 30, 2003
(Continued) 51
(c) Long-term Obligations
The following is a summary of changes in long-term debt of the City for the year ended June 30, 2003:
AmountsBeginning Ending due within
balance Additions Reductions balance one year
Governmental activitiesGeneral obligation bonds $ 22,690,000 — 4,520,000 18,170,000 4,815,000 Revenue bonds 1,050,000 — 185,000 865,000 200,000 Certificates of participation 17,480,000 — 1,785,000 15,695,000 1,825,000 Accrued claims and judgments 1,000,000 — 500,000 500,000 500,000 Accrued compensated absences 588,627 142,920 — 731,547 —
Total governmental activities long-term liabilities $ 42,808,627 142,920 6,990,000 35,961,547 7,340,000
Business-type activitiesCombined Waterworks and Sewerage
System Fund:Revenue bonds $ 22,335,000 13,500,000 1,960,000 33,875,000 1,005,000 Less bond discount (144,137) (108,500) 19,179 (233,458) —
Total revenue bonds 22,190,863 13,391,500 1,979,179 33,641,542 1,005,000
State revolving loan fund 3,035,000 — 252,500 2,782,500 270,000 Compensated absences 70,528 2,993 — 73,521 —
Total waterworks and sewerage fund 25,296,391 13,394,493 2,231,679 36,497,563 1,275,000
Sanitary landfill fund:General obligation bonds $ 25,000 — 25,000 — — Landfill closure/post closure care 5,690,377 113,460 — 5,803,837 — Compensated absences 6,790 1,744 — 8,534 —
Total sanitary sewerage system fund 5,722,167 115,204 25,000 5,812,371 —
Nonmajor enterprise fund:Revenue bonds 250,000 — 45,000 205,000 45,000 Less bond discount (2,097) — 585 (1,512) —
Total revenue bonds 247,903 — 45,585 203,488 45,000
Certifications of participation 925,000 — 30,000 895,000 30,000 Less bond discount (10,935) — 573 (10,362) —
Total certifications of participation 914,065 — 30,573 884,638 30,000
Compensated absences 9,359 407 — 9,766 —
Total other enterprise funds 1,171,327 407 76,158 1,097,892 75,000
Total business-type activities long-term liabilities $ 32,189,885 13,510,104 2,332,837 43,407,826 1,350,000
Internal Service Funds predominantly serve the governmental funds. Accordingly, long-term liabilities for them are includedas part of the above totals for governmental activities. At year end, $18,825 of Internal Service Funds for compensated absences are included in the above amounts.

CITY OF LEE’S SUMMIT, MISSOURI
Notes to Basic Financial Statements
June 30, 2003
(Continued) 52
Debt service requirements on long-term debt at June 30, 2003 are as follows:
Principal Interest Principal Interest Principal Interest
2004 $ 4,815,000 757,731 200,000 51,060 1,825,000 711,0312005 3,110,000 558,645 215,000 37,260 1,875,000 638,0312006 2,900,000 429,047 450,000 22,425 3,735,000 563,0312007 3,075,000 605,759 — — 3,795,000 413,6312008 1,640,000 171,214 — — 2,065,000 252,344
2009 – 2013 2,630,000 168,197 — — 2,400,000 162,000
$ 18,170,000 2,690,593 865,000 110,745 15,695,000 2,740,068
Principal Interest Principal Interest
2004 $ 1,005,000 930,319 270,000 — 2005 2,055,000 1,667,882 290,000 — 2006 2,110,000 1,568,382 310,000 — 2007 2,210,000 1,454,179 332,500 — 2008 2,325,000 1,333,644 355,000 —
2009 – 2013 11,895,000 4,708,338 1,225,000 — 2014 – 2018 8,480,000 1,962,950 — — 2019 – 2023 3,795,000 484,563 — —
$ 33,875,000 14,110,257 2,782,500 —
Principal Interest Principal Interest
2004 $ 45,000 11,145 30,000 44,9652005 50,000 11,040 35,000 43,4752006 110,000 7,590 35,000 41,8562007 — — 35,000 40,2202008 — — 40,000 38,448
2009 – 2013 — — 225,000 161,0222014 – 2018 — — 285,000 96,2112019 – 2023 — — 210,000 17,550
$ 205,000 29,775 895,000 483,747
Certicate of ParticipationGovernmental activities
General obligation bonds Revenue bonds
Enterprise FundCombined Waterworks and Sewerage System
Nonmajor Enterprise FundsRevenue bonds Certicate of Participation
Revenue bonds State revolving loan

CITY OF LEE’S SUMMIT, MISSOURI
Notes to Basic Financial Statements
June 30, 2003
(Continued) 53
Debt payable at June 30, 2003 is composed of the following:
Interest Maturity Balancerates date June 30, 2003
Governmental activities:General obligation bonds:
Improvement bonds—1996 (A) 4.40 – 4.875 4/1/2011 $ 3,135,000Improvement bonds—1997 4.15 – 4.65 4/1/2007 5,525,000Refunding of Waterworks and Sewerage
1989 (C) – 1996 (B) 4.20 – 4.25 4/1/2005 2,470,000Improvement bonds—1999 4.40 – 4.80 4/1/2009 1,960,000Street maintenance/garage facility—2002 3.00 – 4.00 4/1/2009 5,080,000
Total general obligation bonds 18,170,000
Revenue bonds—building and equipmentrefunding and improvement—1991 6.50 – 6.90 2/1/2006 865,000
Certificates of participation:City park—1998 6.75 7/1/2008 2,400,000City park—2001 4.00 – 4.375 7/1/2008 13,295,000
Total certificate of participation 15,695,000
Business-type activities:Combined Waterworks and Sewerage Fund:
Revenue bonds:Water pollution control (SRF)—1990 6.50 – 7.125 12/1/2010 5,565,0002002 Refunding 4.00 – 5.25 7/1/2015 15,265,000Series—2002 (A) 3.00 – 5.00 7/1/2022 13,045,000
Total revenue bonds 33,875,000
State Revolving Loan Fund (1) 2,782,500
Nonmajor business-type funds:Revenue bonds—building and equipment
refunding and improvement—1991 6.50 – 6.90 2/1/2006 205,000Certificates of participation—airport—2000 4.00 – 4.375 7/1/2008 895,000
(1) This loan is offset with the corresponding restricted cash and investments account.
(d) Certificates of Participation
These certificates of participation were used to make park improvements and certain expenses related to the delivery of the certificates.

CITY OF LEE’S SUMMIT, MISSOURI
Notes to Basic Financial Statements
June 30, 2003
(Continued) 54
(e) State Revolving Fund Loan
In conjunction with the issuance of the Water Pollution Control Revenue Bonds in 1990, the City entered into an agreement with the Missouri Department of Natural Resources, whereby the City will receive noninterest-bearing advances up to 50% of the outstanding revenue bonds less original issue discount. As monies are requested from the trustee for Water Pollution Control construction projects, a request is also made to the Missouri Department of Natural Resources for an amount equal to 50% of the amount disbursed by the trustee. This reserve fund serves as collateral on the Water Pollution Control Revenue Bonds in the event of default. During 2003, no monies were advanced from the Missouri Department of Natural Resources. Interest earnings on the reserve account are credited to the City. As the City makes principal payments on the Water Pollution Control Revenue Bonds, an amount equal to 50% of the reserve payment is remitted back to the Department of Natural Resources, reducing the reserve.
(f) General Obligation Debt Margin
The State Constitution permits a city, by vote of two-thirds of the voting electorate, to incur general obligation indebtedness for “city purposes” not to exceed 10% of the assessed value of taxable tangible property and to incur additional general obligation indebtedness not exceeding, in the aggregate, an additional 10% of the assessed value of taxable tangible property for the purpose of acquiring rights-of-way, construction, extending and improving streets and avenue and/or sanitary or storm sewer systems, and purchasing or constructing waterworks, electric, or other light plants, provided that the total general obligation indebtedness of the City does not exceed 20% of the assessed valuation of taxable property.
At January 1, 2003, the constitutionally imposed total general obligation debt limit was $210,998,031, which, after reduction for authorized general obligation bonds net of available resources in the Debt Service Fund, provides a general obligation debt margin of $160,168,203.
(g) Combined Waterworks and Sewerage Revenue Bonds
The Waterworks and Sewerage Revenue Bond ordinance requires that the Combined Waterworks and Sewerage System Fund be accounted for in a separate Enterprise Fund. It also requires that, after sufficient current assets have been set aside to operate the system, all remaining monies held in the Combined Waterworks and Sewerage System Fund be segregated and restricted in separate special reserves and accounts. In accordance with the bond ordinance, these bonds are serviced by the Combined Waterworks and Sewerage System Fund operations and are included as a liability of that fund.
Restricted assets of the principal and interest account are to be used for payment of current principal and interest on bonds. Restricted assets of debt service are available to pay principal and interest in the event of a deficiency in the principal and interest account. Restricted assets of the depreciation and replacement account are available to operate, maintain, or improve the system, call bonds or for payment of debt service in the event of a deficiency in other restricted assets.

CITY OF LEE’S SUMMIT, MISSOURI
Notes to Basic Financial Statements
June 30, 2003
(Continued) 55
(h) Airport Revenue Bonds
The Airport Revenue Bond ordinance requires that operation of the airport be accounted for in a separate Enterprise Fund. It also requires that after sufficient current assets have been set aside to operate the airport, an amount of cash equal to one-twelfth of the next annual principal payment and one-sixth of the next semiannual interest payment be set aside monthly in a restricted account. In accordance with the bond ordinance, Airport Revenue Bonds are serviced by the Airport Fund and are included as a liability of that fund.
(i) Pledged Assets
The City has executed no security agreements under the provisions of the Uniform Commercial Code, and there were no liens or encumbrances on assets at June 30, 2003. All assets to which the City has satisfactory title appear in the balance sheets.
(j) Construction Commitments
A summary of the City’s commitments on uncompleted construction contracts and the amount, which is expected to be funded by federal and state grants, follows:
Contract Amount fundedamount by grants
General $ 3,053,334 — Park Development 3,742,709 — Road and Bridge Excise/Sales Tax 7,196,150 — Nonmajor Governmental 1,101,218 101,712 Combined Waterworks and Sewerage System 3,002,966 — Sanitary Landfill 159,792 — Nonmajor proprietary 7,235 —
Total $ 18,263,404 101,712
Fund

CITY OF LEE’S SUMMIT, MISSOURI
Notes to Basic Financial Statements
June 30, 2003
(Continued) 56
(k) Interfund Receivables, Payables, and Transfers
The composition of interfund balances as of June 30, 2003 is as follows:
Receivable fund
General Fund Nonmajor Governmental $ 107,000 General Fund Nonmajor Enterprise 1,838,986 General Fund Internal Service 74 Internal Service General Fund 2,149 Nonmajor Governmental Nonmajor Governmental 10,000 Combined Waterworks and
Sewerage System Nonmajor Governmental 100 Internal Service Nonmajor Enterprise 26 Internal Service Combined Waterworks and
Sewerage System 307 Internal Service Sanitary Landfill 60 Internal Service Internal Service 88
Total $ 1,958,790
Payable fund
Interfund transfers:
DebtGeneral Service Park R&B Excise Nonmajor Nonmajor Internal Fund Fund Development Sales Tax Governmental Enterprise Service Total
Transfers from:General Fund $ — — — — 182,666 830,000 226,128 1,238,794 Debt Service Fund — — 3,591,835 — 13,103 — — 3,604,938 Park Development — 2,095,216 — — — — — 2,095,216 Nonmajor Governmental 174,538 — 50,000 2,945,114 824,556 — 44,279 4,038,487 Combined Waterworks
and Sewerage System 1,437,309 — — — — — 5,739 1,443,048 Landfill 177,394 — — — 250,000 — — 427,394 Nonmajor Enterprise 66,104 — — — 23,094 — — 89,198
$ 1,855,345 2,095,216 3,641,835 2,945,114 1,293,419 830,000 276,146 12,937,075
Transfers to:
(3) Other Information
(a) Employee Retirement Plans
Plan Description
The City participates in the Missouri Local Government Employees Retirement System (LAGERS), an agent multiple-employer public employee retirement system that acts as a common investment and administrative agent for local government entities in Missouri. LAGERS is a defined benefit pension plan that provides retirement, disability, and death benefits to plan members and beneficiaries. LAGERS was created and is governed by statute, Section RSMo. 70.600 – 70.755. As such, it is the system’s responsibility to administer the law in accordance with the expressed intent of the General Assembly. The plan is qualified under Internal Revenue Code Section 401(a), and it is tax exempt.

CITY OF LEE’S SUMMIT, MISSOURI
Notes to Basic Financial Statements
June 30, 2003
(Continued) 57
LAGERS issues a publicly available financial report that includes financial statements and required supplementary information. That report may be obtained by writing to LAGERS, P.O. Box 1665, Jefferson City, Missouri 65102 or by calling 1-800-447-4334.
Funding Status
The City’s full-time employees do not contribute to the pension plan. The political subdivision is required to contribute at an actuarially determined rate; the current rate is 10.3% (general), 11.6% (police), and 14.3% (fire) of annual covered payroll. The contribution requirements of plan members are determined by the governing body of the political subdivision. The contribution provisions of the political subdivision are established by state statute.
Annual Pension Cost
For 2003, the City’s annual pension cost of $1,970,759 was equal to the required and actual contributions. The required contribution was determined as part of the February 28, 2001 and/or 2002 annual actuarial valuation using the entry age actuarial cost method. The actuarial assumptions included (a) a rate of return on the investment of present and future assets of 7.5% per year, compounded annually, (b) projected salary increases of 4.0% per year, compounded annually, attributable to inflation, (c) additional projected salary increases ranging from 0.0% to 4.2% per year, depending on age, attributable to seniority/merit, (d) preretirement mortality based on the 1983 Group Annuity Mortality table, and (e) postretirement mortality based on the 1971 Group Annuity Mortality table, projected to 2000, set back 1 year for men and 7 years for women. The actuarial value of assets was determined using techniques that smooth the effects of short-term volatility in the market value of investments over a five-year period. The unfunded actuarial accrued liability is being amortized as a level percentage of projected payroll on an open basis. The amortization period at February 28, 2001 was 15 years.
Three–Year Trend Information
Annual Percentage Netpension cost of APC pension
(APC) contributed obligation
Fiscal year ending:June 30, 2001 $ 2,357,003 100 % $ — June 30, 2002 2,498,389 100 — June 30, 2003 1,970,759 100 —
(b) Litigation and Contingent Liabilities
Legal Matters
The City is a party to a number of lawsuits as a result of condemnation proceedings, zoning decisions, personal injury, and certain law enforcement activities. Although potential claims against the City not covered by insurance, if any, resulting from such litigation are not

CITY OF LEE’S SUMMIT, MISSOURI
Notes to Basic Financial Statements
June 30, 2003
(Continued) 58
determinable, it is the opinion of the City’s legal counsel and management that the resolution of these matters will not have a materially adverse effect on the financial position of the City.
Self-insurance
The City is exposed to various risks of loss related to torts; theft of, damage to, and destruction of assets; errors and omissions; injuries to employees; and natural disasters. To protect itself against these risks of loss, the City is a member of the Mid-America Regional Council Insurance Trust (MARCIT), a not-for-profit corporation consisting of governmental entities incorporated in 1984 to acquire insurance for its members. MARCIT operates as a purchasing pool and is not a joint venture activity of the City. The City has no control over budgeting, financing, management selection, or the governing body. MARCIT provides both conventional and self-insurance coverage for its members, including medical, dental, property, casualty, general liability, and workers’ compensation. The City participates in property, casualty, general liability, and workers’ compensation insurance coverages.
MARCIT manages the cash and investment pool, funded by insurance premiums, on behalf of its members. MARCIT’s investment pool consists of interest-bearing deposits, U.S. Treasury strips, U.S. Governmental agency obligations, and collateralized mortgage obligations.
In the event that a deficit occurs with respect to any fiscal year of MARCIT for which the City was a participant at any time during such year, and in the event that MARCIT determines that an assessment is required in order to provide additional funds for the obligations of MARCIT for such year, and further, in the event that the City was covered by the types of benefits requiring the assessment during the time period in which the assessment arose, the City is obligated to pay its pro rata share of any such assessment whether or not the City is a member of MARCIT at the time of such assessment. Management of the City is not aware of any deficit situation in MARCIT that would require an accrual of a liability as of June 30, 2003.
MARCIT’s financial statements are presented in its Comprehensive Annual Financial Report for the year ended June 30, 2003.
There has been no significant change in insurance coverage from the previous fiscal year. Settled claims have not exceeded insurance coverage in any of the past three years.
(c) Closure and Postclosure Care Costs
State and federal laws and regulations require the City to place a final cover on its sanitary landfill site when it stops accepting waste and to perform certain maintenance and monitoring functions at the site for 30 years after closure. Although closure and postclosure care costs will be paid only near or after the date that the landfill stops accepting waste, the City reports a portion of these closure and postclosure care costs as an operating expense in each period based on landfill capacity used as of each balance sheet date. The $5,803,837 reported as landfill closure and postclosure care liability at June 30, 2003 represents the cumulative estimate of closure and postclosure care costs based on the use of approximately 62% of the ultimate capacity of the landfill.

CITY OF LEE’S SUMMIT, MISSOURI
Notes to Basic Financial Statements
June 30, 2003
(Continued) 59
The City will recognize the remaining estimated cost of closure and postclosure care of $3,599,658 as the remaining estimated capacity is filled. These amounts are based on what it would cost to perform all closure and postclosure care valued in 2003 costs. The City expects to close the landfill in the year 2020. Actual cost may be higher due to inflation, changes in technology, or changes in regulations. The City has documented its commitment to pay for closure and postclosure costs through the issuance of contracts of obligation with the Department of Natural Resources. These contracts legally bind the City to pay for closure and postclosure costs. As of June 30, 2003, the City had outstanding contracts of obligation in the amount of $9,645,304. The City expects that all closure and postclosure care costs, as well as future inflation costs, will be paid from available operating revenues, reserves, and interest earnings on cash and short-term investments held in the Sanitary Landfill Fund. However, if these resources are inadequate or additional postclosure care requirements are determined (due to changes in technology or applicable laws or regulations, for example), these costs may need to be recovered through charges to future landfill users.
(d) Subsequent Event
On August 21, 2003, the City issued $25,450,000 in general obligation bonds to provide funds for the purpose of making improvements in the downtown area of the City including improving streets and streetscape, construction, furnishing and equipping a new City Hall and related improvements, acquiring any necessary land, and for acquiring storm sirens.
(e) Deficits
The accumulated deficits in nonmajor funds in the amounts of $5,124 in the Community Center and $15,646 in the Entitlement (Special Revenue) Funds; $6,532 in the Eastport Neighborhood Development; $71 in the Water Quality; $63,370 in the Downtown Improvements Fund; and $6,976 in the Neighborhood Development (Capital Project) Funds will be eliminated by future revenues or transfers.
(f) Reporting Changes—Capital Assets
Effective July 1, 2002, the City raised the capitalization threshold for capital assets from $1,000 to $5,000. Accordingly all existing capital assets that no longer qualify under the new threshold were removed. The cumulative effect on beginning net assets for fiscal year 2002 of the change in policy for capital assets is as follows:
Combined Waterworks and Sanitary NonmajorSewerage System Landfill funds
Net assets June 30, 2002 $ 126,039,268 2,129,650 10,409,494Change in capital asset policy (384,934) (11,118) (6,031)
Net assets June 30, 2002,as restated $ 125,654,334 2,118,532 10,403,463
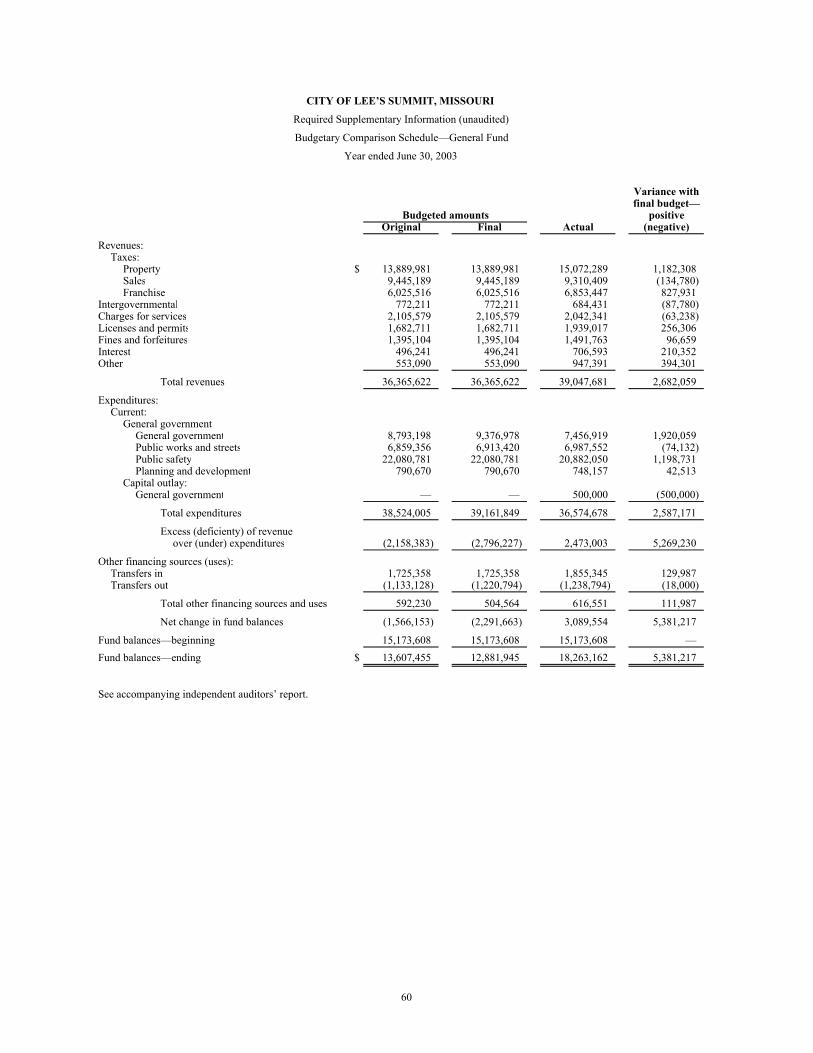
CITY OF LEE’S SUMMIT, MISSOURI
Required Supplementary Information (unaudited)
Budgetary Comparison Schedule—General Fund
Year ended June 30, 2003
Variance withfinal budget—
Budgeted amounts positiveOriginal Final Actual (negative)
Revenues:Taxes:
Property $ 13,889,981 13,889,981 15,072,289 1,182,308 Sales 9,445,189 9,445,189 9,310,409 (134,780) Franchise 6,025,516 6,025,516 6,853,447 827,931
Intergovernmental 772,211 772,211 684,431 (87,780) Charges for services 2,105,579 2,105,579 2,042,341 (63,238) Licenses and permits 1,682,711 1,682,711 1,939,017 256,306 Fines and forfeitures 1,395,104 1,395,104 1,491,763 96,659 Interest 496,241 496,241 706,593 210,352 Other 553,090 553,090 947,391 394,301
Total revenues 36,365,622 36,365,622 39,047,681 2,682,059
Expenditures:Current:
General government:General government 8,793,198 9,376,978 7,456,919 1,920,059 Public works and streets 6,859,356 6,913,420 6,987,552 (74,132) Public safety 22,080,781 22,080,781 20,882,050 1,198,731 Planning and development 790,670 790,670 748,157 42,513
Capital outlay:General government — — 500,000 (500,000)
Total expenditures 38,524,005 39,161,849 36,574,678 2,587,171
Excess (deficienty) of revenue over (under) expenditures (2,158,383) (2,796,227) 2,473,003 5,269,230
Other financing sources (uses):Transfers in 1,725,358 1,725,358 1,855,345 129,987 Transfers out (1,133,128) (1,220,794) (1,238,794) (18,000)
Total other financing sources and uses 592,230 504,564 616,551 111,987
Net change in fund balances (1,566,153) (2,291,663) 3,089,554 5,381,217
Fund balances—beginning 15,173,608 15,173,608 15,173,608 — Fund balances—ending $ 13,607,455 12,881,945 18,263,162 5,381,217
See accompanying independent auditors’ report.
60

CITY OF LEE’S SUMMIT, MISSOURI
Required Supplementary Information (unaudited)
Notes to Budgetary Comparison Schedule—General Fund
Year ended June 30, 2003
61
(1) Budgets and Budgetary Accounting
The reported budgetary data represent the final approved budget after amendments as adopted by the City Council. Amendments to the original budget were not material, and appropriations lapse at year end. The basis of accounting is the same for both budgeting and GAAP reporting purposes. The City Council utilizes the following procedures in establishing the budgetary data reflected in the general purpose financial statements.
(1) Prior to the beginning of the fiscal year, the City Administrator submits to the City Council a proposed operating budget for the fiscal year commencing the following July 1. The operating budget provides a complete financial plan of all funds and activities for the upcoming fiscal year. In no event shall the total proposed expenditures exceed the estimated revenues to be received plus any unencumbered cash reserves estimated to be on hand at the beginning of the budget year.
(2) Public hearings are conducted to obtain taxpayer comments.
(3) Prior to July 1, the budget is legally enacted through passage of an ordinance.
The appropriated budget is prepared by fund, department, and program. Department heads may make transfers of appropriations within their departments. Upon written request by the City Administrator, the City Council may, by ordinance, transfer part or all of any unencumbered appropriation balance from one department to another. The legal level of budgetary control is the department level.
Although the City is legally required to prepare budgets for all funds, there is no legal requirement to report on those budgets.
The majority of Special Revenue Funds have annual appropriated budgets, funds that do not are the Entitlement Fund, Landfill Postclosure Fund, Cemetery Trust Fund, Road and Bridge Escrow Fund, and the Business and Industry Fund.
Capital projects are budgeted on a project basis rather than on an annual fiscal basis; therefore, a comparison of actual to budget for Capital Project Funds would not be meaningful.
(2) Excess of Expenditures Over Appropriations.
For the year ended June 30, 2003, expenditures were $5,124 and $330,426 greater than appropriations in the Community Center Special Revenue Fund and the Debt Service Fund, respectively. General Fund expenditures were $74,132 and $500,000 greater than appropriations for public works and streets and general government capital outlay, respectively.

CITY OF LEE’S SUMMIT, MISSOURI
Required Supplementary Information (unaudited)
Schedule of Funding Progress—Retirement Plan
Year ended June 30, 2003
62
Schedule of Funding Progress
Missouri Local Government Employees Retirement System (LAGERS) City of Lee’s Summit
(b-a) [(b-a)/c)] (a) (b) Unfunded (c) UAL as a
Actuarial Actuarial accrued (a/b) Annual percentage of Actuarial valuation date value of assets accrued liability liability (UAL) Funded ratio covered payroll covered payroll
$ 35,566,154 33,096,429 (2,469,725) 107% $ 18,990,683 (13)% 40,872,582 37,006,548 (3,866,034) 110 20,961,809 (18) 43,719,489 41,311,552 (2,407,937) 106 22,858,796 — 43,719,489 46,845,469 4,125,980 91 22,858,796 18
# after benefit changes
February 28, 2003#
February 28, 2001February 28, 2002February 28, 2003
Note: The above assets and actuarial accrued liability do not include the assets and present value of benefits associated with the Benefit Reserve Fund and the Casualty Reserve Fund.
See independent auditors’ report.

CITY OF LEE’S SUMMIT, MISSOURI
TotalNonmajor
Special Capital GovernmentalRevenue Projects Funds
Assets
Pooled cash and investments $ 4,145,001 5,737,986 9,882,987 Receivables (net of allowance)
Accounts and other 3,577 1,427,191 1,430,768 Taxes 108,756 — 108,756 Accrued interest 91,555 102,917 194,472
Due from other funds 10,000 — 10,000 Due from other governments 131,198 2,916,266 3,047,464 Other assets 7,603 — 7,603 Restricted cash and investments 1,728,677 436,249 2,164,926
Total assets $ 6,226,367 10,620,609 16,846,976
Liabilities and Fund Balances
Liabilities:Accounts and contracts payable $ 1,775,029 1,726,632 3,501,661 Salaries and wages payable 77,221 — 77,221 Accrued interest payable — 5,288 5,288 Due to other funds — 117,100 117,100
Total liabilities 1,852,250 1,849,020 3,701,270
Fund balance:Reserved for postclosure costs 1,900,201 — 1,900,201 Unreserved:
Undesignated 2,473,916 8,771,589 11,245,505
Total fund balances 4,374,117 8,771,589 13,145,706 Total liabilities and fund balances $ 6,226,367 10,620,609 16,846,976
See accompanying independent auditors’ report.
Combining Balance Sheet—Nonmajor Governmental Funds
June 30, 2003
63

CITY OF LEE’S SUMMIT, MISSOURI
Combining Statement of Revenues, Expenditures, and Changesin Fund Balance—Nonmajor Governmental Funds
Year ended June 30, 2003
NonmajorSpecial Capital Governmental
Revenue Projects Funds
Revenues:Taxes:
Property $ 1,987,614 2,821,142 4,808,756 Sales 13,252 7,036,156 7,049,408 Room 305,959 — 305,959
Intergovernmental 622,462 1,887,108 2,509,570 Charges for services 170,603 — 170,603 Licenses and permits 177,017 — 177,017 Fines and forfeitures 15,717 — 15,717 Interest 248,884 348,251 597,135 Other 359,312 2,935,143 3,294,455
Total revenues 3,900,820 15,027,800 18,928,620
Expenditures:Current:
General government 1,336,674 — 1,336,674 Parks and recreation 2,411,972 — 2,411,972
Debt service:Principal retirements — 185,000 185,000 Interest and fiscal charges — 97,997 97,997
Capital outlay:General government — 4,422 4,422 Public works and streets — 18,028,990 18,028,990 Public safety — 18,510 18,510 Parks and recreation 5,124 — 5,124
Total expenditures 3,753,770 18,334,919 22,088,689
Excess (deficiency) of revenuesover (under) expenditures 147,050 (3,307,119) (3,160,069)
Other financing sources (uses):Transfers in 435,760 857,659 1,293,419 Transfers out (494,577) (3,543,910) (4,038,487)
Total other financing uses (58,817) (2,686,251) (2,745,068)
Net change in fund balances 88,233 (5,993,370) (5,905,137)
Fund balances—beginning 4,285,884 14,764,959 19,050,843 Fund balances—ending $ 4,374,117 8,771,589 13,145,706
See accompanying independent auditors’ report.
64

65
(This page left blank intentionally)

66
Nonmajor Governmental Funds
Special Revenue Funds
Special Revenue Funds are used to account for the proceeds of specific revenue sources (other than expendable trust or major capital project) requiring separate accounting because of legal or regulatory provisions or administrative action. The City’s Nonmajor Special Revenue Funds are as follows:
Park Board—Established to account for activities of the Park Board, which administers operations of all City parks.
Swimming Pool—Established to account for the activities of the municipal swimming pool operation.
Violence Against Women Grant—Established to account for the receipt of federal grant monies for the Violence Against Women Grant.
Federal Emergency Measures—Established to account for expenses incurred for emergency management response.
Tuscany Manor Tax Increment Financing—Established to account for improvements related to the historic conservation area known as Tuscany Manor.
Community Center—Established to account for the activities of the Legacy Park Community Center operation.
Entitlement Fund—Established to account for federal funding passed through to other agencies.
Landfill Postclosure Fund—Established to account for reserve set up to cover landfill closure costs the City will incur.
Cemetery Trust Fund—Established to account for plot and monument sales for perpetual care funding.
Road and Bridge Escrow—Established to account for deposits made related to road and bridge improvement projects.
Business and Industry Fund—Established to account for and distribute the proceeds from a 5% tax on certain gross receipts of hotels, motels, and similar places of business.
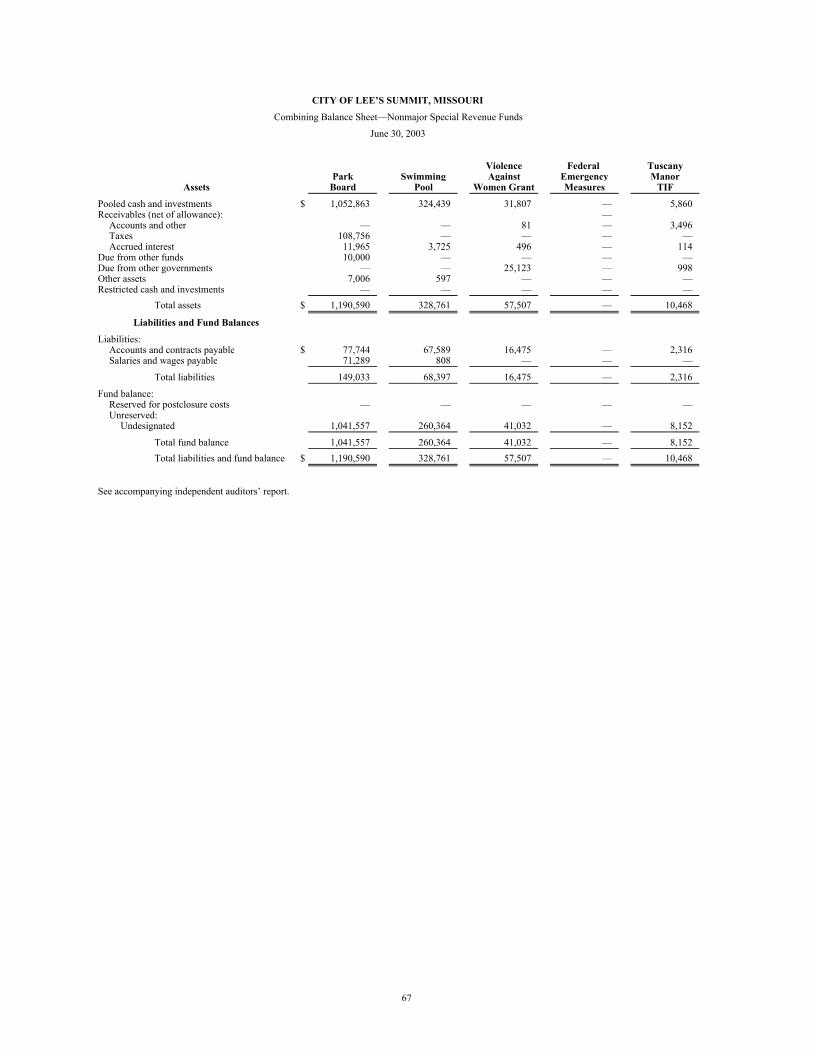
Violence Federal TuscanyPark Swimming Against Emergency Manor
Assets Board Pool Women Grant Measures TIF
Pooled cash and investments $ 1,052,863 324,439 31,807 — 5,860 Receivables (net of allowance): —
Accounts and other — — 81 — 3,496 Taxes 108,756 — — — — Accrued interest 11,965 3,725 496 — 114
Due from other funds 10,000 — — — — Due from other governments — — 25,123 — 998 Other assets 7,006 597 — — — Restricted cash and investments — — — — —
Total assets $ 1,190,590 328,761 57,507 — 10,468
Liabilities and Fund Balances
Liabilities:Accounts and contracts payable $ 77,744 67,589 16,475 — 2,316 Salaries and wages payable 71,289 808 — — —
Total liabilities 149,033 68,397 16,475 — 2,316
Fund balance:Reserved for postclosure costs — — — — — Unreserved:
Undesignated 1,041,557 260,364 41,032 — 8,152
Total fund balance 1,041,557 260,364 41,032 — 8,152 Total liabilities and fund balance $ 1,190,590 328,761 57,507 — 10,468
See accompanying independent auditors’ report.
CITY OF LEE’S SUMMIT, MISSOURI
Combining Balance Sheet—Nonmajor Special Revenue Funds
June 30, 2003
67

Road NonmajorCommunity Landfill Cemetery & Bridge Business Special
Center Entitlement Postclosure Trust Escrow and Industry Revevue
— 13,692 1,880,776 685,557 — 150,007 4,145,001
— — — — — — 3,577 — — — — — — 108,756 — 676 19,425 7,458 19,854 27,842 91,555 — — — — — — 10,000 — 105,077 — — — — 131,198 — — — — — — 7,603 — — — — 1,728,677 — 1,728,677 — 119,445 1,900,201 693,015 1,748,531 177,849 6,226,367
— 135,091 — 36,314 1,439,500 — 1,775,029 5,124 — — — — — 77,221
5,124 135,091 — 36,314 1,439,500 — 1,852,250
— — 1,900,201 — — — 1,900,201
(5,124) (15,646) — 656,701 309,031 177,849 2,473,916
(5,124) (15,646) 1,900,201 656,701 309,031 177,849 4,374,117 — 119,445 1,900,201 693,015 1,748,531 177,849 6,226,367
68

Violence Federal TuscanyPark Swimming Against Emergency Manor
Board Pool Women Grant Measures TIFRevenues:
Taxes:Property $ 1,962,705 — — — 24,909 Sales — — — — 13,252 Room — — — — —
Intergovernmental — — 125,359 (1,255) 7,710 Charges for services 165,457 5,146 — — — Licenses and permits 12,457 164,560 — — — Fines and forfeitures 15,717 — — — — Interest 35,553 15,457 1,778 — 155 Other 77,092 30,410 — — —
Total revenues 2,268,981 215,573 127,137 (1,255) 46,026
Expenditures:Current:
General government — — 126,473 6,047 37,596 Parks and recreation 2,085,765 326,207 — — —
Capital outlay:Parks and recreation — — — — —
Total expenditures 2,085,765 326,207 126,473 6,047 37,596
Excess (deficiency) of revenuesover (under) expenditures 183,216 (110,634) 664 (7,302) 8,430
Other financing sources (uses):Transfers in 23,094 — — 87,666 — Transfers out (94,279) — — — —
Total other financing sourcesand uses (71,185) — — 87,666 —
Net change in fund balances 112,031 (110,634) 664 80,364 8,430
Fund balances—beginning 929,526 370,998 40,368 (80,364) (278) Fund balances—ending $ 1,041,557 260,364 41,032 — 8,152
See accompanying independent auditors’ report.
CITY OF LEE’S SUMMIT, MISSOURI
Governmental Funds Statement of Revenues, Expenditures, and Changes in Fund Balances—Nonmajor Special Revenue Funds
Year ended June 30, 2003
69

Road NonmajorCommunity Landfill Cemetery & Bridge Business Special
Center Entitlement Postclosure Trust Escrow and Industry Revenue
— — — — — — 1,987,614 — — — — — — 13,252 — — — — — 305,959 305,959 — 490,415 — 233 — — 622,462 — — — — — — 170,603 — — — — — — 177,017 — — — — — — 15,717 — 3,147 74,517 26,882 83,358 8,037 248,884 — 79,569 — 167,130 — 5,111 359,312
— 573,131 74,517 194,245 83,358 319,107 3,900,820
— 669,999 — 165,316 998 330,245 1,336,674 — — — — — — 2,411,972
5,124 — — — — — 5,124
5,124 669,999 — 165,316 998 330,245 3,753,770
(5,124) (96,868) 74,517 28,929 82,360 (11,138) 147,050
— — 250,000 75,000 — — 435,760 — (79,067) — — (225,759) (95,472) (494,577)
— (79,067) 250,000 75,000 (225,759) (95,472) (58,817)
(5,124) (175,935) 324,517 103,929 (143,399) (106,610) 88,233
— 160,289 1,575,684 552,772 452,430 284,459 4,285,884 (5,124) (15,646) 1,900,201 656,701 309,031 177,849 4,374,117
70

CITY OF LEE’S SUMMIT, MISSOURI
Budgetary Comparison Schedule—Park Board Special Revenue Fund
Year ended June 30, 2003
Variance withfinal budget—
Original Final positivebudget budget Actual (negative)
Revenues:Taxes:
Property $ 1,818,423 1,818,423 1,962,705 144,282 Charges for services 168,428 168,428 165,457 (2,971) Licenses and permits 19,500 19,500 12,457 (7,043) Fines and forfeitures 11,200 11,200 15,717 4,517 Interest 25,637 25,637 35,553 9,916 Other 32,344 32,344 77,092 44,748
Total revenues 2,075,532 2,075,532 2,268,981 193,449
Expenditures:Current:
Parks and recreation 2,090,915 2,090,915 2,085,765 5,150
Total expenditures 2,090,915 2,090,915 2,085,765 5,150
Excess (deficiency) of revenuesover (under) expenditures (15,383) (15,383) 183,216 198,599
Other financing sources (uses):Transfers in — — 23,094 23,094 Transfers out (94,279) (94,279) (94,279) —
Total other financing sourcesand uses (94,279) (94,279) (71,185) 23,094
Net change in fund balances (109,662) (109,662) 112,031 221,693
Fund balances—beginning 929,526 929,526 929,526 — Fund balances—ending $ 819,864 819,864 1,041,557 221,693
See accompanying independent auditors’ report.
71

CITY OF LEE’S SUMMIT, MISSOURI
Budgetary Comparison Schedule—Swimming Pool Special Revenue Fund
Year ended June 30, 2003
Variance withfinal budget—
Original Final positivebudget budget Actual (negative)
Revenues:Charges for services $ 4,450 4,450 5,146 696 Licenses and permits 204,030 204,030 164,560 (39,470) Interest 7,400 7,400 15,457 8,057 Other 35,125 35,125 30,410 (4,715)
Total revenues 251,005 251,005 215,573 (35,432)
Expenditures:Current:
Parks and recreation 405,862 405,862 326,207 79,655
Total expenditures 405,862 405,862 326,207 79,655
Excess (deficiency) of revenuesover (under) expenditures (154,857) (154,857) (110,634) 44,223
Net change in fund balances (154,857) (154,857) (110,634) 44,223
Fund balances—beginning 370,998 370,998 370,998 — Fund balances—ending $ 216,141 216,141 260,364 44,223
See accompanying independent auditors’ report.
72

CITY OF LEE’S SUMMIT, MISSOURI
Budgetary Comparison Schedule—Violence Against Women Grant Special Revenue Fund
Year ended June 30, 2003
Variance withfinal budget—
Original Final positivebudget budget Actual (negative)
Revenues:Intergovernmental $ 61,500 61,500 125,359 63,859 Interest — — 1,778 1,778
Total revenues 61,500 61,500 127,137 65,637
Expenditures:Current:
General government 61,500 133,078 126,473 6,605
Total expenditures 61,500 133,078 126,473 6,605
Excess (deficiency) of revenuesover (under) expenditures — (71,578) 664 72,242
Net change in fund balances — (71,578) 664 72,242
Fund balances—beginning 40,368 40,368 40,368 — Fund balances—ending $ 40,368 (31,210) 41,032 72,242
See accompanying independent auditors’ report.
73

CITY OF LEE’S SUMMIT, MISSOURI
Budgetary Comparison Schedule—Federal Emergency Measures Special Revenue Fund
Year ended June 30, 2003
Variance withfinal budget—
Original Final positivebudget budget Actual (negative)
Revenues:Intergovernmental $ — — (1,255) (1,255)
Total revenues — — (1,255) (1,255)
Expenditures:Current:
General government — 6,047 6,047 —
Total expenditures — 6,047 6,047 —
Excess (deficiency) of revenuesover (under) expenditures — (6,047) (7,302) (1,255)
Other financing sources:Transfers in — — 87,666 87,666
Total other financing sources — — 87,666 87,666
Net change in fund balances — (6,047) 80,364 86,411
Fund balances—beginning (80,364) (80,364) (80,364) — Fund balances—ending $ (80,364) (86,411) — 86,411
See accompanying independent auditors’ report.
74

CITY OF LEE’S SUMMIT, MISSOURI
Budgetary Comparison Schedule—Tuscany Manor TIF Special Revenue Fund
Year ended June 30, 2003
Variance withfinal budget—
Original Final positivebudget budget Actual (negative)
Revenues:Taxes:
Property $ 22,477 22,477 24,909 2,432 Sales 23,753 23,753 13,252 (10,501) Franchise 2,100 2,100 — (2,100)
Intergovernmental — — 7,710 7,710 Interest — — 155 155
Total revenues 48,330 48,330 46,026 (2,304)
Expenditures:Current:
General government 48,329 48,329 37,596 10,733
Total expenditures 48,329 48,329 37,596 10,733
Excess (deficiency) of revenuesover (under) expenditures 1 1 8,430 8,429
Net change in fund balances 1 1 8,430 8,429
Fund balances—beginning 929,526 929,526 (278) (929,804) Fund balances—ending $ 929,527 929,527 8,152 (921,375)
See accompanying independent auditors’ report.
75

CITY OF LEE’S SUMMIT, MISSOURI
Budgetary Comparison Schedule—Community Center Special Revenue Fund
Year ended June 30, 2003
Variance withfinal budget—
Original Final positivebudget budget Actual (negative)
Expenditures:Capital outlay:
Parks and recreation $ — — 5,124 (5,124)
Total expenditures — — 5,124 (5,124)
Excess (deficiency) of revenuesover (under) expenditures — — (5,124) (5,124)
Net change in fund balances — — (5,124) (5,124)
Fund balances—beginning 929,526 929,526 — (929,526) Fund balances—ending $ 929,526 929,526 (5,124) (924,402)
See accompanying independent auditors’ report.
76

77
(This page left blank intentionally)

78
Nonmajor Governmental Funds
Capital Projects Funds
Capital Projects Funds account for financial resources to be used for the acquisition or construction of major capital facilities other than those financed by Enterprise Funds. The City’s Nonmajor Capital Projects Funds are as follows:
North Tax Increment Financing—Established to account for public improvements needed to support new private development in northern areas of the City.
Eastport Neighborhood Improvement District Fund—Established to account for neighborhood improvements to roads in the area of Woods Chapel and Lakewood Way.
Water Quality—Established to account for improvements to area water lines and storage tanks.
Neighborhood Development—Established to account for neighborhood improvement projects within designated areas of the City.
Police Facility—Established to account for construction of a new police facility.
Fire Facility No. 6—Established to account for construction of a new fire facility.
Fire Facility No. 7—Established to account for construction of a new fire facility.
Road and Bridge Improvement—Established to account for road and bridge improvement projects within the City related to a fiscal year 1995 tax levy.
Thoroughfare Improvement—Established to account for thoroughfare improvement projects within the City related to a fiscal year 1995 bond issue.
Street Division and Central Vehicle Maintenance Facility—Established to account for construction of a new Street/Storm Water Division and Central Vehicle Maintenance facility.
Summit Woods Tax Increment Financing—Established to account for public improvements needed to support new private development in the I-470 and M-350 Highway area.
Chapel Ridge Tax Increment Financing—Established to account for public improvements needed to support new private development in the I-470 and Woods Chapel Road area.
New Longview Tax Increment Financing—Established to account for public improvements needed to support new private development in the Longview Farm area.
Downtown Improvements—Established to account for improvement projects in the downtown area of the City related to a fiscal year 2003 bond issue.

North Tax Eastport FireIncrement Neighborhood Water Neighborhood Police Facility
Assets Financing Development Quality Development Facility No. 6
Pooled cash and investments $ 270,209 539 29 3,144 327,616 — Receivables (net of allowance):
Accounts and other — — — — — — Accrued interest 10,278 — — — 20,795 1,774
Due from other governments — — — — — — Restricted cash and investments 436,249 — — — — —
Total assets $ 716,736 539 29 3,144 348,411 1,774
Liabilities and Fund Balances
Liabilities:Accounts and contracts payable $ — 71 — 120 — — Accrued interest payable — — — — — — Due to other funds — 7,000 100 10,000 — —
Total liabilities — 7,071 100 10,120 — —
Fund balances:Unreserved:
Undesignated 716,736 (6,532) (71) (6,976) 348,411 1,774
Total fund balances 716,736 (6,532) (71) (6,976) 348,411 1,774 Total liabilities and fund balances $ 716,736 539 29 3,144 348,411 1,774
See accompanying independent auditors’ report.
CITY OF LEE’S SUMMIT, MISSOURI
Combining Balance Sheet—Nonmajor Capital Projects Funds
June 30, 2003
79

Fire Road and Street Summit Chappel New NonmajorFacility Bridge Throughfare Division & Woods Ridge Longview Downtown CapitalNo. 7 Improvement Improvement CVM Facility TIF TIF TIF Improvements Projects
308,569 3,535,810 214,296 798,791 4,817 242,716 24,780 6,670 5,737,986
— — — — 1,419,262 — 7,929 — 1,427,191 1,574 40,204 1,709 17,295 7,537 1,656 95 — 102,917
— 2,707,112 — — 167,349 41,805 — — 2,916,266 — — — — — — — — 436,249
310,143 6,283,126 216,005 816,086 1,598,965 286,177 32,804 6,670 10,620,609
— 328,941 132,922 131,410 1,002,207 110,032 889 20,040 1,726,632 — — 5,288 — — — — — 5,288 — — — — 50,000 — — 50,000 117,100
— 328,941 138,210 131,410 1,052,207 110,032 889 70,040 1,849,020
310,143 5,954,185 77,795 684,676 546,758 176,145 31,915 (63,370) 8,771,589
310,143 5,954,185 77,795 684,676 546,758 176,145 31,915 (63,370) 8,771,589 310,143 6,283,126 216,005 816,086 1,598,965 286,177 32,804 6,670 10,620,609
80

North Tax Eastport FireIncrement Neighborhood Water Neighborhood Police FacilityFinancing Development Quality Development Facility No. 6
Revenues:Taxes:
Property $ 836,982 — — 15,273 — — Sales — — — — — —
Intergovernmental — — — — — — Interest 19,782 — — — 14,646 — Other 626 — — 92 — —
Total revenues 857,390 — — 15,365 14,646 —
Expenditures:Debt service:
Principal retirements 185,000 — — — — — Interest and fiscal charges 83,430 276 12,141 920 — —
Capital outlay:General government — — — — — — Public works and streets — — 908 — — — Public safety — — — — 18,510 —
Total expenditures 268,430 276 13,049 920 18,510 —
Excess (deficiency) of revenuesover (under) expenditures 588,960 (276) (13,049) 14,445 (3,864) —
Other financing sources (uses):Transfers in — — 13,103 — — — Transfers out (612,910) — — — — —
Total other financing sourcesand uses (612,910) — 13,103 — — —
Net change in fund balances (23,950) (276) 54 14,445 (3,864) —
Fund balances—beginning 740,686 (6,256) (125) (21,421) 352,275 1,774 Fund balances—ending $ 716,736 (6,532) (71) (6,976) 348,411 1,774
See accompanying independent auditors’ report.
CITY OF LEE’S SUMMIT, MISSOURI
Governmental Funds Statement of Revenues, Expenditures, and Changes in Fund Balances—Nonmajor Capital Projects Funds
Year ended June 30, 2002
81

Fire Road and Street Summit Chappel New NonmajorFacility Bridge Thoroughfare Division & Woods Ridge Longview Downtown Capital No. 7 Improvement Improvement CVM Facility TIF TIF TIF Improvements Projects
— — — — 1,782,768 186,119 — — 2,821,142 — 4,447,724 — — 2,127,306 461,126 — — 7,036,156 — 919,610 — — 797,694 169,804 — — 1,887,108
13,208 160,168 6,365 111,575 16,046 6,295 166 — 348,251 — 424,610 — — 2,482,406 — 27,409 — 2,935,143
13,208 5,952,112 6,365 111,575 7,206,220 823,344 27,575 — 15,027,800
— — — — — — — — 185,000 — — — — 1,086 — — 144 97,997
— — 4,422 — — — — — 4,422 — 6,331,887 — 3,734,980 6,622,345 1,259,984 15,660 63,226 18,028,990 — — — — — — — — 18,510
— 6,331,887 4,422 3,734,980 6,623,431 1,259,984 15,660 63,370 18,334,919
13,208 (379,775) 1,943 (3,623,405) 582,789 (436,640) 11,915 (63,370) (3,307,119)
— 211,646 — — — 612,910 20,000 — 857,659 — (2,931,000) — — — — — — (3,543,910)
— (2,719,354) — — — 612,910 20,000 — (2,686,251)
13,208 (3,099,129) 1,943 (3,623,405) 582,789 176,270 31,915 (63,370) (5,993,370)
296,935 9,053,314 75,852 4,308,081 (36,031) (125) — — 14,764,959 310,143 5,954,185 77,795 684,676 546,758 176,145 31,915 (63,370) 8,771,589
82

CITY OF LEE’S SUMMIT, MISSOURI
Budgetary Comparison Schedule—Debt Service Fund
Year ended June 30, 2003
Variance withfinal budget—
Original Final positivebudget budget Actual (negative)
Revenues:Taxes:
Property $ 4,918,191 4,918,191 5,143,676 225,485 Sales 3,412,969 3,412,969 3,338,963 (74,006)
Fines and forfeitures — — 39,978 39,978 Interest 136,207 136,207 246,117 109,910 Other — — 2,656 2,656
Total revenues 8,467,367 8,467,367 8,771,390 304,023
Expenditures:Debt service:
Principal retirements 4,520,000 6,305,000 6,305,000 — Interest and fiscal charges 1,137,713 1,531,387 1,861,813 (330,426)
Total expenditures 5,657,713 7,836,387 8,166,813 (330,426)
Excess (deficiency) of revenuesover (under) expenditures 2,809,654 630,980 604,577 (26,403)
Other financing sources (uses):Transfers in — — 2,095,216 2,095,216 Transfers out (3,591,835) (3,604,938) (3,604,938) —
Total other financing sourcesand uses (3,591,835) (3,604,938) (1,509,722) 2,095,216
Net change in fund balances (782,181) (2,973,958) (905,145) 2,068,813
Fund balances—beginning 6,933,186 6,933,186 6,933,186 — Fund balances—ending $ 6,151,005 3,959,228 6,028,041 2,068,813
See accompanying independent auditors’ report.
83

CITY OF LEE’S SUMMIT, MISSOURI
Budgetary Comparison Schedule—Park Development Capital Projects Fund
Year ended June 30, 2003
Variance withfinal budget—
Original Final positivebudget budget Actual (negative)
Revenues:Intergovernmental $ — — 4,387 4,387 Interest 81,800 81,800 373,561 291,761 Other — — 89,000 89,000
Total revenues 81,800 81,800 466,948 385,148
Expenditures:Debt service:
Interest and fiscal charges 672,134 672,134 1,783 670,351 Capital outlay: —
Parks and recreation 6,777,000 18,679,521 6,389,172 12,290,349
Total expenditures 7,449,134 19,351,655 6,390,955 12,960,700
Excess (deficiency) of revenuesover (under) expenditures (7,367,334) (19,269,855) (5,924,007) 13,345,848
Other financing sources (uses):Transfers in 3,641,835 3,641,835 3,641,835 — Transfers out — (2,095,128) (2,095,216) (88)
Total other financing sourcesand uses 3,641,835 1,546,707 1,546,619 (88)
Net change in fund balances (3,725,499) (17,723,148) (4,377,388) 13,345,760
Fund balances—beginning 10,920,123 10,920,123 10,920,123 — Fund balances—ending $ 7,194,624 (6,803,025) 6,542,735 13,345,760
See accompanying independent auditors’ report.
84

CITY OF LEE’S SUMMIT, MISSOURI
Budgetary Comparison Schedule—Road and Bridge Excise/Sales Tax Capital Projects Fund
Year ended June 30, 2003
Variance withfinal budget—
Original Final positivebudget budget Actual (negative)
Revenues:Taxes:
Property $ 1,018,333 1,018,333 1,587,628 569,295 Sales 4,843,803 4,843,803 4,654,793 (189,010)
Interest 105,271 105,271 596,614 491,343 Other — — 67,712 67,712
Total revenues 5,967,407 5,967,407 6,906,747 939,340
Expenditures:Capital outlay:
Parks and recreation 13,415,000 23,947,978 6,528,329 17,419,649
Total expenditures 13,415,000 23,947,978 6,528,329 17,419,649
Excess (deficiency) of revenuesover (under) expenditures (7,447,593) (17,980,571) 378,418 18,358,989
Other financing sources (uses):Transfers in 2,931,000 2,931,000 2,945,114 14,114
Total other financing sourcesand uses 2,931,000 2,931,000 2,945,114 14,114
Net change in fund balances (4,516,593) (15,049,571) 3,323,532 18,373,103
Fund balances—beginning 9,221,727 9,221,727 9,221,727 — Fund balances—ending $ 4,705,134 (5,827,844) 12,545,259 18,373,103
See accompanying independent auditors’ report.
85

86
Nonmajor Enterprise Funds
Proprietary Funds are used to account for operations, which provide a service to the general public and are financed primarily by a user charge for the provision of such services. The City’s Nonmajor Proprietary Funds are as follows:
Airport—Established to account for all assets, liabilities, and revenues and expenses relating to the operation of the City-owned airport.
Recreation Center—Established to account for all assets, liabilities, and revenues and expenditures related to the City-owned recreation center.

CITY OF LEE’S SUMMIT, MISSOURI
Combining Balance Sheet—Nonmajor Enterprise Funds
June 30, 2003
RecreationAssets Airport Center Nonmajor
Current assets: Pooled cash and investments $ 419,800 141,934 561,734
Receivables (net of allowance for uncollectibles):
Accounts and other 91,892 — 91,892 Accrued interest 7,847 2,268 10,115
Inventories 9,754 — 9,754 Prepaid insurance 8,255 — 8,255 Other assets 1,438 647 2,085
Total current assets 538,986 144,849 683,835
Restricted cash and investments — 73,751 73,751 Deferred bond issue costs, net 16,260 2,291 18,551 Property, plant, and equipment, net
of accumulated depreciation 12,877,800 389,055 13,266,855 Total assets $ 13,433,046 609,946 14,042,992
Liabilities and Fund Equity
Current liabilities:Accounts and contracts payable $ 23,633 35,903 59,536 Salaries and wages payable 12,171 11,035 23,206 Accrued interest payable 15,238 5,894 21,132 Current portion of long-term debt:
Revenue bonds, current — 45,000 45,000 Certificates of participation 30,000 — 30,000
Due to other funds 1,839,012 — 1,839,012 Deferred revenue 25,906 — 25,906
Total current liabilities 1,945,960 97,832 2,043,792
Payable from restricted assets:Customer deposits 27,241 — 27,241
Total liabilities payablefrom restricted assets 27,241 — 27,241
Long-term debt payable:Revenue bonds — 158,488 158,488 Certificates of participation 854,638 — 854,638 Compensated absences 9,766 — 9,766
Total liabilities 2,837,605 256,320 3,093,925
Net assets:Investment in capital assets, net
of related debt 11,982,800 184,055 12,166,855 Unrestricted (1,387,359) 169,571 (1,217,788)
Total net assets 10,595,441 353,626 10,949,067
Total liabilities and netassets $ 13,433,046 609,946 14,042,992
See accompanying independent auditors’ report.
87

CITY OF LEE’S SUMMIT, MISSOURI
Combining Statement of Revenues, Expenses, andChanges in Retained Earnings—Nonmajor Enterprise Funds
Year ended June 30, 2003
RecreationAirport Center Nonmajor
Operating revenues: Charges for services $ 447,665 625,489 1,073,154
Fuel sales 474,695 — 474,695 Other 99,231 23,501 122,732
Total operating revenues 1,021,591 648,990 1,670,581
Operating expenses:Salaries, wages, and employee
benefits 298,859 460,931 759,790 Maintenance and repairs 76,263 10,219 86,482 Utilities 30,193 19,159 49,352 Fuels and lubricants 347,807 — 347,807 Depreciation and amortization 254,287 30,448 284,735 Other 112,536 193,176 305,712
Total operating expenses 1,119,945 713,933 1,833,878
Operating loss (98,354) (64,943) (163,297)
Nonoperating revenues (expenses):Interest income 13,920 8,371 22,291 Interest expense (73,504) (17,869) (91,373) Grant reimbursements 37,181 — 37,181
Total nonoperating expenses (22,403) (9,498) (31,901)
Net loss before transfers (120,757) (74,441) (195,198)
Transfers in 830,000 — 830,000 Transfers out (66,104) (23,094) (89,198)
Net income 643,139 (97,535) 545,604
Total net assets—beginning of year 9,952,302 451,161 10,403,463 Total net assets—end of year $ 10,595,441 353,626 10,949,067
See accompanying independent auditors’ report.
88
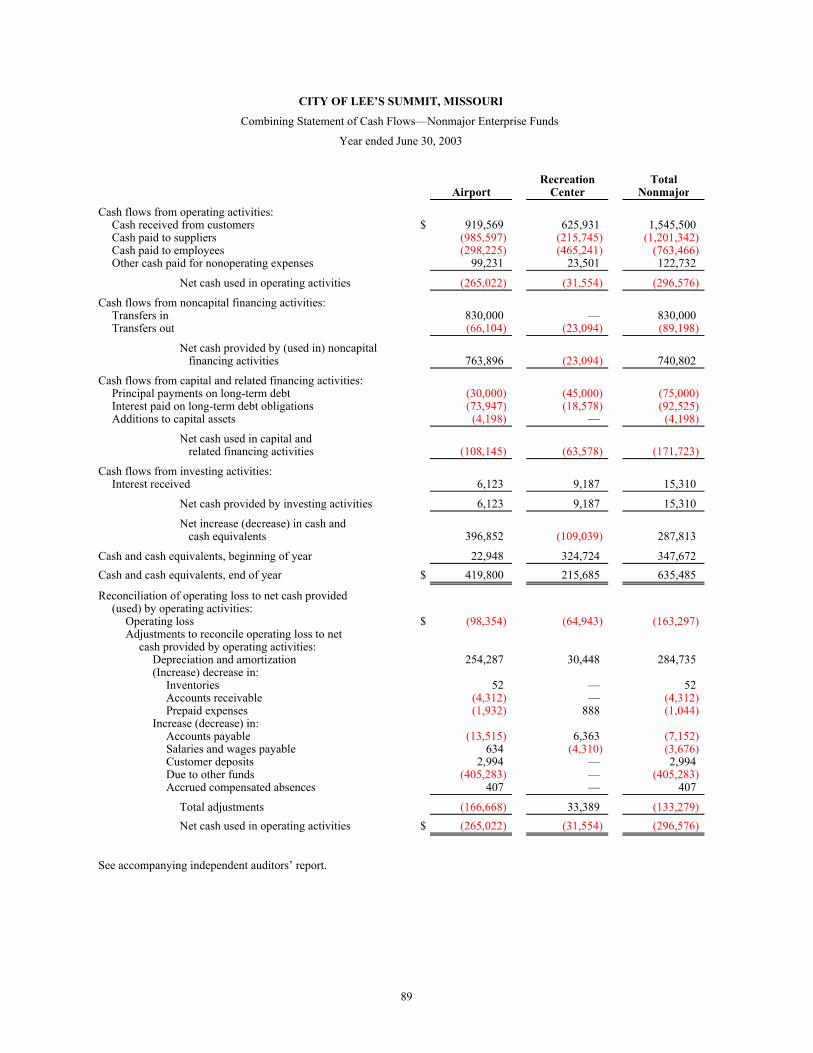
CITY OF LEE’S SUMMIT, MISSOURI
Combining Statement of Cash Flows—Nonmajor Enterprise Funds
Year ended June 30, 2003
Recreation TotalAirport Center Nonmajor
Cash flows from operating activities:Cash received from customers $ 919,569 625,931 1,545,500 Cash paid to suppliers (985,597) (215,745) (1,201,342) Cash paid to employees (298,225) (465,241) (763,466) Other cash paid for nonoperating expenses 99,231 23,501 122,732
Net cash used in operating activities (265,022) (31,554) (296,576)
Cash flows from noncapital financing activities:Transfers in 830,000 — 830,000 Transfers out (66,104) (23,094) (89,198)
Net cash provided by (used in) noncapital financing activities 763,896 (23,094) 740,802
Cash flows from capital and related financing activities:Principal payments on long-term debt (30,000) (45,000) (75,000) Interest paid on long-term debt obligations (73,947) (18,578) (92,525) Additions to capital assets (4,198) — (4,198)
Net cash used in capital and related financing activities (108,145) (63,578) (171,723)
Cash flows from investing activities:Interest received 6,123 9,187 15,310
Net cash provided by investing activities 6,123 9,187 15,310
Net increase (decrease) in cash and cash equivalents 396,852 (109,039) 287,813
Cash and cash equivalents, beginning of year 22,948 324,724 347,672 Cash and cash equivalents, end of year $ 419,800 215,685 635,485
Reconciliation of operating loss to net cash provided(used) by operating activities:
Operating loss $ (98,354) (64,943) (163,297) Adjustments to reconcile operating loss to net
cash provided by operating activities:Depreciation and amortization 254,287 30,448 284,735 (Increase) decrease in:
Inventories 52 — 52 Accounts receivable (4,312) — (4,312) Prepaid expenses (1,932) 888 (1,044)
Increase (decrease) in:Accounts payable (13,515) 6,363 (7,152) Salaries and wages payable 634 (4,310) (3,676) Customer deposits 2,994 — 2,994 Due to other funds (405,283) — (405,283) Accrued compensated absences 407 — 407
Total adjustments (166,668) 33,389 (133,279) Net cash used in operating activities $ (265,022) (31,554) (296,576)
See accompanying independent auditors’ report.
89

90
Internal Service Funds
Internal Service Funds are used to account for the financing of goods or services provided by one department to other departments of the City on a cost-reimbursement basis. The City’s Internal Service Funds are as follows:
Central Vehicle Services—Established to account for operating a central maintenance facility for the City’s vehicles and equipment.
Unemployment Insurance—Established to account for self-insurance funding for any unemployment claims filed by terminated City employees.
Insurance Reserve Fund—Established to account for premium refunds and special assessment charges for self-insurance funding for health and dental liability claims.
Management Information Systems (M.I.S.) Services—Established to account for the City’s electronic data processing systems and information services provided for City departments.
Short-Term Disability Fund—Established to provide compensation for City employees who are ill and who have exhausted all sick time but are not yet eligible for long-term disability (90 days).
Workers’ Compensation Self-Insurance Fund—Established to account for self-insurance funding for any workers’ compensation claims filed by City employees.

CITY OF LEE’S SUMMIT, MISSOURI
Combining Balance Sheet—Internal Service Funds
June 30, 2003
Central Short-Term Workers’ TotalVehicle Unemployment Insurance M.I.S. Disability Compensation Internal Service
Assets Services Insurance Reserve Services Fund Self-Insurance Funds
Current assets: Pooled cash and investments $ 4,649,128 72,468 324,049 2,635,167 77,888 1,504,213 9,262,913
Accrued interest receivable 45,880 872 3,453 26,838 710 15,488 93,241 Due from other funds 13 — — — 2,617 — 2,630 Inventories 66,508 — — — — — 66,508 Other assets 3,861 — — 4,412 — — 8,273
Total current assets 4,765,390 73,340 327,502 2,666,417 81,215 1,519,701 9,433,565
Capital assets, netof accumulated depreciation 7,010,579 — — 246,745 — — 7,257,324
Total assets $ 11,775,969 73,340 327,502 2,913,162 81,215 1,519,701 16,690,889
Liabilities and Fund Equity
Current liabilities:Accounts and contracts payable $ 45,876 — — 97,779 1,009 10,442 155,106 Salaries and wages payable 17,203 — — 18,106 2,624 — 37,933 Accrued interest payable 2,955 — — — — — 2,955 Due to other funds 42 — — 120 — — 162
Total current liabilities 66,076 — — 116,005 3,633 10,442 196,156
Long-term debt payable:Compensated absences 11,277 — — 7,548 — — 18,825
Total liabilities 77,353 — — 123,553 3,633 10,442 214,981
Net assets:Invested in capital assets, net
of related debt 7,010,579 — — 246,745 — — 7,257,324 Unrestricted 4,688,037 73,340 327,502 2,542,864 77,582 1,509,259 9,218,584
Total net assets 11,698,616 73,340 327,502 2,789,609 77,582 1,509,259 16,475,908
Total liabilities and net assets $ 11,775,969 73,340 327,502 2,913,162 81,215 1,519,701 16,690,889
See accompanying independent auditors’ report.
91
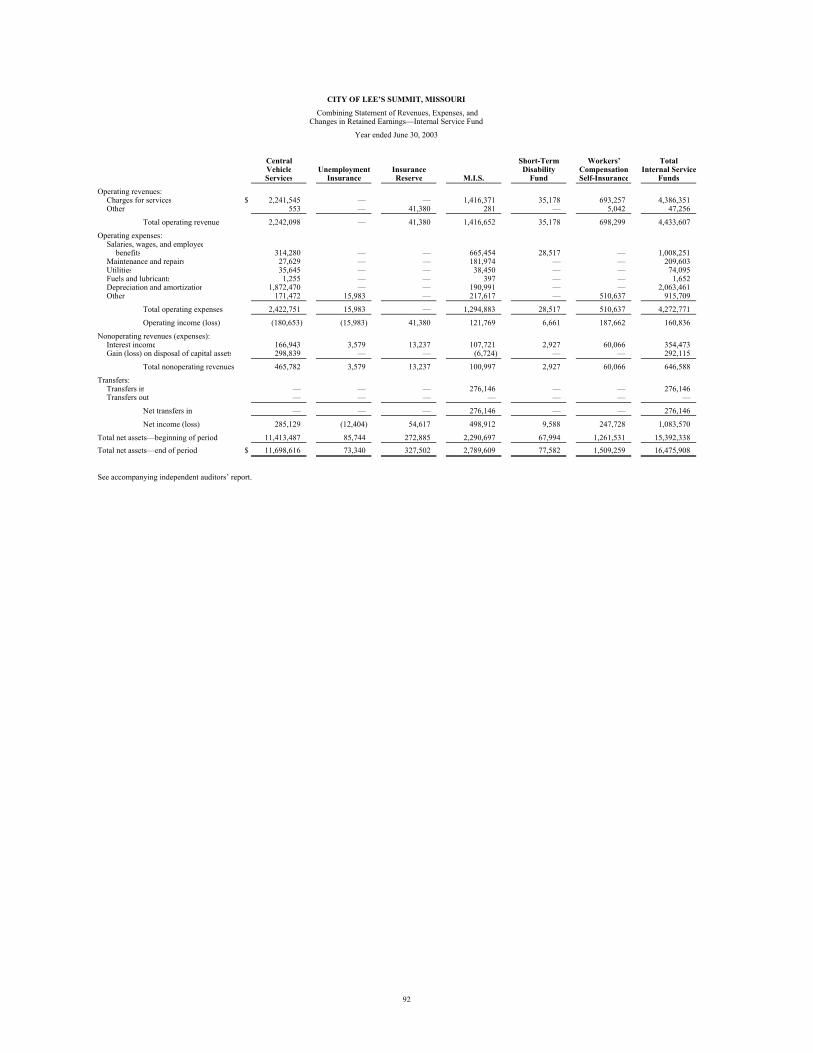
CITY OF LEE’S SUMMIT, MISSOURI
Combining Statement of Revenues, Expenses, andChanges in Retained Earnings—Internal Service Fund
Year ended June 30, 2003
Central Short-Term Workers’ TotalVehicle Unemployment Insurance Disability Compensation Internal ServiceServices Insurance Reserve M.I.S. Fund Self-Insurance Funds
Operating revenues:Charges for services $ 2,241,545 — — 1,416,371 35,178 693,257 4,386,351 Other 553 — 41,380 281 — 5,042 47,256
Total operating revenue 2,242,098 — 41,380 1,416,652 35,178 698,299 4,433,607
Operating expenses: Salaries, wages, and employee
benefits 314,280 — — 665,454 28,517 — 1,008,251 Maintenance and repairs 27,629 — — 181,974 — — 209,603 Utilities 35,645 — — 38,450 — — 74,095 Fuels and lubricants 1,255 — — 397 — — 1,652 Depreciation and amortization 1,872,470 — — 190,991 — — 2,063,461 Other 171,472 15,983 — 217,617 — 510,637 915,709
Total operating expenses 2,422,751 15,983 — 1,294,883 28,517 510,637 4,272,771
Operating income (loss) (180,653) (15,983) 41,380 121,769 6,661 187,662 160,836
Nonoperating revenues (expenses):Interest income 166,943 3,579 13,237 107,721 2,927 60,066 354,473 Gain (loss) on disposal of capital assets 298,839 — — (6,724) — — 292,115
Total nonoperating revenues 465,782 3,579 13,237 100,997 2,927 60,066 646,588
Transfers:Transfers in — — — 276,146 — — 276,146 Transfers out — — — — — — —
Net transfers in — — — 276,146 — — 276,146
Net income (loss) 285,129 (12,404) 54,617 498,912 9,588 247,728 1,083,570
Total net assets—beginning of period 11,413,487 85,744 272,885 2,290,697 67,994 1,261,531 15,392,338 Total net assets—end of period $ 11,698,616 73,340 327,502 2,789,609 77,582 1,509,259 16,475,908
See accompanying independent auditors’ report.
92
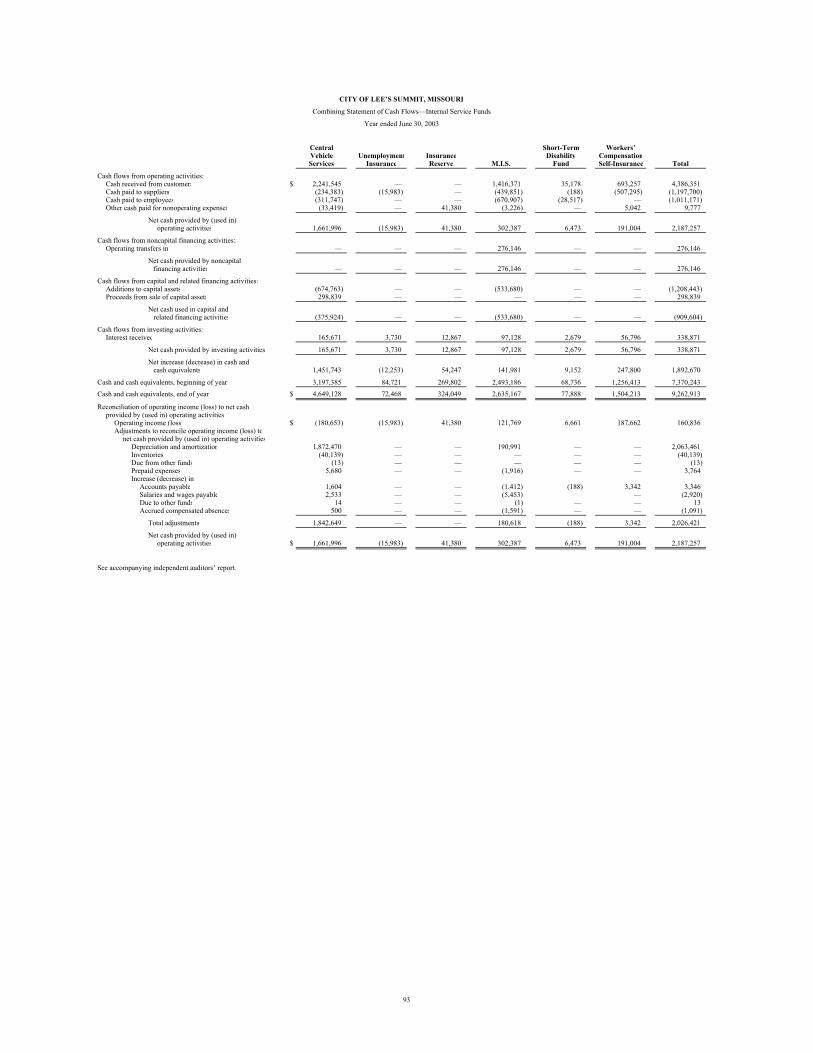
CITY OF LEE’S SUMMIT, MISSOURI
Combining Statement of Cash Flows—Internal Service Funds
Year ended June 30, 2003
Central Short-Term Workers’Vehicle Unemployment Insurance Disability CompensationServices Insurance Reserve M.I.S. Fund Self-Insurance Total
Cash flows from operating activities:Cash received from customers $ 2,241,545 — — 1,416,371 35,178 693,257 4,386,351 Cash paid to suppliers (234,383) (15,983) — (439,851) (188) (507,295) (1,197,700) Cash paid to employees (311,747) — — (670,907) (28,517) — (1,011,171) Other cash paid for nonoperating expenses (33,419) — 41,380 (3,226) — 5,042 9,777
Net cash provided by (used in) operating activities 1,661,996 (15,983) 41,380 302,387 6,473 191,004 2,187,257
Cash flows from noncapital financing activities:Operating transfers in — — — 276,146 — — 276,146
Net cash provided by noncapital financing activities — — — 276,146 — — 276,146
Cash flows from capital and related financing activities:Additions to capital assets (674,763) — — (533,680) — — (1,208,443) Proceeds from sale of capital assets 298,839 — — — — — 298,839
Net cash used in capital and related financing activities (375,924) — — (533,680) — — (909,604)
Cash flows from investing activities:Interest received 165,671 3,730 12,867 97,128 2,679 56,796 338,871
Net cash provided by investing activities 165,671 3,730 12,867 97,128 2,679 56,796 338,871
Net increase (decrease) in cash and cash equivalents 1,451,743 (12,253) 54,247 141,981 9,152 247,800 1,892,670
Cash and cash equivalents, beginning of year 3,197,385 84,721 269,802 2,493,186 68,736 1,256,413 7,370,243 Cash and cash equivalents, end of year $ 4,649,128 72,468 324,049 2,635,167 77,888 1,504,213 9,262,913
Reconciliation of operating income (loss) to net cash provided by (used in) operating activities
Operating income (loss) $ (180,653) (15,983) 41,380 121,769 6,661 187,662 160,836 Adjustments to reconcile operating income (loss) to
net cash provided by (used in) operating activitiesDepreciation and amortization 1,872,470 — — 190,991 — — 2,063,461 Inventories (40,139) — — — — — (40,139) Due from other funds (13) — — — — — (13) Prepaid expenses 5,680 — — (1,916) — — 3,764 Increase (decrease) in
Accounts payable 1,604 — — (1,412) (188) 3,342 3,346 Salaries and wages payable 2,533 — — (5,453) — (2,920) Due to other funds 14 — — (1) — — 13 Accrued compensated absences 500 — — (1,591) — — (1,091)
Total adjustments 1,842,649 — — 180,618 (188) 3,342 2,026,421
Net cash provided by (used in) operating activities $ 1,661,996 (15,983) 41,380 302,387 6,473 191,004 2,187,257
See accompanying independent auditors’ report.
93

Statistical Section ________________________________________________________________________________

City of Lee's Summit, MissouriSchedule of Expenditures by Function
All Governmental Fund TypesLast Ten Years
YearEnded General Public Works Public Human Planning and Parks and Capital Debt Total
June 30 Government and Streets Safety Resources (2) Development (1) Recreation Improvement Service Other Expenditures
1994 2,101,704$ 3,077,256$ 9,336,933$ 256,309$ 719,395$ 1,262,616$ 3,822,514$ 2,934,178$ 12,364$ 23,523,269$ 1995 2,313,854 5,467,369 10,294,896 314,934 688,142 1,267,635 1,821,356 3,027,989 - 25,196,175 1996 3,669,303 5,005,281 11,184,887 359,385 414,972 1,357,590 3,731,600 3,085,576 - 28,808,594 1997 3,741,454 3,885,555 12,692,446 456,237 504,639 1,489,112 5,823,028 3,679,078 - 32,271,549 1998 4,292,188 4,761,846 14,463,091 397,396 608,080 1,542,142 13,899,249 5,097,032 - 45,061,024 1999 5,101,199 5,535,001 16,999,238 586,493 873,034 1,905,105 18,784,868 15,691,782 - 65,476,720 2000 6,570,047 5,582,899 18,038,975 616,143 606,912 1,969,716 13,726,120 5,102,132 - 52,212,944 2001 9,508,237 5,773,327 18,096,424 723,702 651,379 1,679,473 15,120,743 5,117,613 - 56,670,898 2002 10,328,038 6,165,164 19,716,050 524,202 632,888 1,979,870 27,847,293 5,688,551 - 72,882,056 2003 8,793,593 6,987,552 20,882,050 - 748,157 2,411,972 30,750,985 8,451,593 - 79,025,902
Notes:(1) From FY 93 thru FY 95, Building Inspections was included in Community Development. In FY 96, Building Inspections was transferred to General Government(2) In FY 2003, Human Resources expenditures were classified under General Government.
Parks and Recreation
3%
Planning and Development
1%
Public Works and Streets
9%
General Government
11%
Debt Service11%
Capital Improvement
39%
Public Safety26%
95
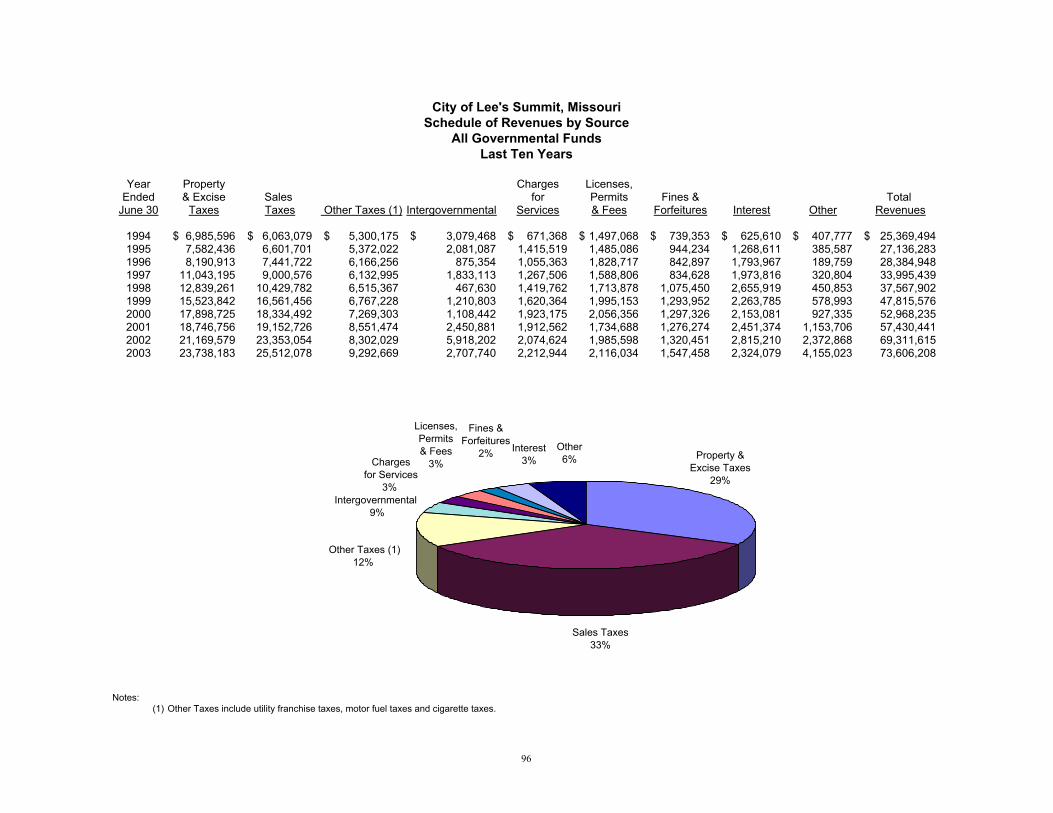
City of Lee's Summit, MissouriSchedule of Revenues by Source
All Governmental FundsLast Ten Years
Year Property Charges Licenses,Ended & Excise Sales for Permits Fines & Total
June 30 Taxes Taxes Other Taxes (1) Intergovernmental Services & Fees Forfeitures Interest Other Revenues
1994 6,985,596$ 6,063,079$ 5,300,175$ 3,079,468$ 671,368$ 1,497,068$ 739,353$ 625,610$ 407,777$ 25,369,494$ 1995 7,582,436 6,601,701 5,372,022 2,081,087 1,415,519 1,485,086 944,234 1,268,611 385,587 27,136,283 1996 8,190,913 7,441,722 6,166,256 875,354 1,055,363 1,828,717 842,897 1,793,967 189,759 28,384,948 1997 11,043,195 9,000,576 6,132,995 1,833,113 1,267,506 1,588,806 834,628 1,973,816 320,804 33,995,439 1998 12,839,261 10,429,782 6,515,367 467,630 1,419,762 1,713,878 1,075,450 2,655,919 450,853 37,567,902 1999 15,523,842 16,561,456 6,767,228 1,210,803 1,620,364 1,995,153 1,293,952 2,263,785 578,993 47,815,576 2000 17,898,725 18,334,492 7,269,303 1,108,442 1,923,175 2,056,356 1,297,326 2,153,081 927,335 52,968,235 2001 18,746,756 19,152,726 8,551,474 2,450,881 1,912,562 1,734,688 1,276,274 2,451,374 1,153,706 57,430,441 2002 21,169,579 23,353,054 8,302,029 5,918,202 2,074,624 1,985,598 1,320,451 2,815,210 2,372,868 69,311,615 2003 23,738,183 25,512,078 9,292,669 2,707,740 2,212,944 2,116,034 1,547,458 2,324,079 4,155,023 73,606,208
Notes:(1) Other Taxes include utility franchise taxes, motor fuel taxes and cigarette taxes.
Other6%
Other Taxes (1) 12%
Sales Taxes 33%
Property &Excise Taxes
29%
Interest3%
Licenses,Permits& Fees
3%
Fines &Forfeitures
2% Charges
for Services3%
Intergovernmental 9%
96

City of Lee's Summit, MissouriSchedule of General Fund Revenues and Other Financing Sources
Last Ten YearsTotal
Revenues Year Utility Charges Licenses, Fines and Other
Ended Property Sales Franchise Motor Fuel Cigarette Intergovern- for Permits and Operating Financing June 30 Taxes Taxes Taxes Taxes (2) Taxes mental Services (1) & Fees Forfeits Other Transfers In Sources
1994 3,306,827$ 4,133,743$ 3,563,262$ -$ 338,388$ 205,393$ 483,590$ 1,099,089$ 674,657$ 360,483$ 681,360$ 14,846,792$ 1995 3,850,826 4,495,723 3,471,371 - 347,887 236,079 783,181 980,106 933,817 588,266 1,205,108 16,892,364 1996 4,278,955 5,069,329 4,222,697 1,610,349 333,210 148,481 839,817 1,238,211 827,869 590,532 1,322,504 20,481,954 1997 6,679,756 5,781,792 4,514,886 1,769,200 346,044 548,121 1,097,421 1,085,998 824,050 632,205 1,317,951 24,597,424 1998 7,304,518 6,348,482 4,808,518 1,825,614 405,807 195,340 1,243,038 1,178,037 1,064,737 951,270 1,358,187 26,683,548 1999 8,215,764 6,713,615 5,057,083 1,853,619 648,428 529,153 1,453,115 1,414,329 1,262,032 973,127 1,187,360 29,307,625 2000 9,418,942 7,524,219 5,439,920 1,916,338 452,332 517,404 1,776,573 1,603,321 1,257,632 1,116,901 1,777,961 32,801,543 2001 10,191,068 7,805,325 6,772,507 1,925,706 449,844 761,961 1,814,969 1,566,925 1,233,220 1,305,880 1,464,759 35,292,164 2002 11,036,340 8,946,295 6,168,805 2,442,949 468,443 900,855 1,942,271 1,721,039 1,261,537 1,961,196 1,570,761 38,420,491 2003 11,780,520 9,310,409 6,853,447 2,818,587 473,182 684,431 2,042,341 1,939,017 1,491,763 1,638,046 1,873,283 40,905,026
(1) In FY 93 and FY 94, payments for ambulance, police training and other miscellaneous charges for services have been classified as charges for services.(2) In FY 96, the Street Operations Division was moved to the General Fund and the Motor Fuel Tax, Motor Vehicle Sales Tax and the Motor Vehicle License/
Transfer Fee was also moved to the General Fund.
Fines andForfeits
3%
Operating Transfers In
4%
Motor Fuel Taxes7%
Utility Franchise Taxes 17%
Sales Taxes 23%
Property Taxes 29%
Intergovernmental 2%
Other4%
Licenses,Permits & Fees
5%
Charges for Services 5%
Cigarette Taxes 1%
97

City of Lee's Summit, MissouriSchedule of General Fund Expenditures and Other Financing Uses by Function
Last Ten YearsTotal
Year ExpendituresEnded Administration Municipal Law Fire Planning and Public Operating and Other
June 30 (1) (3) Finance (2) Court Streets (4) Enforcement Protection Legal Development Works (2) Transfers Financing Uses
1994 889,906$ 1,779,273$ 195,863$ -$ 4,729,608$ 4,607,325$ 325,654$ 718,395$ 998,740$ 130,620$ 14,375,384$ 1995 1,076,960 1,181,042 226,985 - 5,211,579 5,083,317 335,298 688,142 1,128,406 193,083 15,124,812 1996 2,111,111 1,243,514 263,909 2,206,382 5,624,446 5,560,441 424,810 414,972 1,592,682 579,526 20,021,793 1997 1,833,856 1,282,161 301,255 2,218,526 6,202,965 6,489,481 496,077 504,639 1,667,029 347,577 21,343,566 1998 2,239,722 1,332,538 325,462 3,277,284 7,241,862 7,221,229 572,519 608,080 1,484,562 483,462 24,786,720 1999 2,308,527 2,336,920 388,460 3,953,073 8,522,010 8,477,228 596,333 873,034 1,581,928 1,476,430 30,513,943 2000 3,021,010 2,140,712 395,728 3,568,516 9,122,907 8,916,068 600,395 609,912 2,014,383 75,750 30,465,381 2001 3,293,933 4,287,677 407,052 3,704,498 9,492,241 8,604,183 589,798 651,379 2,068,829 1,059,802 34,159,392 2002 3,286,388 3,856,753 481,996 3,805,166 10,450,005 9,266,045 636,702 632,888 2,359,998 1,738,146 36,514,087 2003 4,033,127 2,285,741 508,993 4,403,884 11,046,068 9,835,987 629,055 748,158 2,504,662 1,238,794 37,234,469
NOTES:(1) In FY 03, Human Resources expenditures were classified in the Administration Department. For comparison purposes, expenditures for all years have been consolidated.(2) In FY 94, Building and Grounds Maintenance expenditures were split between Finance and Public Works.(3) Beginning with FY 96, Building Inspections expenditures were classified in Administration.(4) In FY 96, the Street Operations division was transferred to the General Fund.
TransfersOperating
3%Administration
11%
Finance6%
Municipal Court1%
Streets12%
Law Enforcement30%
Fire Protection
26%
Legal2%
Public Works7%Planning and
Development2%
98

City of Lee's Summit, MissouriProperty Tax Levies and Collections
Last Ten Years
Total Tax OutstandingCollections Delinquent
Year Percent Delinquent as Percent Outstanding Taxes asEnded Current Tax of Levy Tax Total Tax of Current Delinquent Percent of
June 30 Total Tax Levy Collection Collected Collections Collections Levy Taxes Current Levy
1994 5,855,676$ 5,708,980$ 97.5% 347,688$ 6,056,668$ 103.4% 410,658$ 7.0%1995 6,489,375 6,320,931 97.4% 154,524 6,475,455 99.8% 424,578 6.5%1996 7,186,402 7,010,337 97.6% 280,241 7,290,578 101.4% 320,402 4.5%1997 9,696,337 9,449,573 97.5% 201,478 9,651,051 99.5% 365,688 3.8%1998 11,083,789 10,707,945 96.6% 235,452 10,943,397 98.7% 506,079 4.6%1999 12,033,214 11,644,903 96.8% 320,441 11,965,344 99.4% 573,949 4.8%2000 13,271,353 12,706,633 95.7% 363,404 13,070,037 98.5% 775,265 5.8%2001 14,877,152 14,218,941 95.6% 506,614 14,725,555 99.0% 926,862 6.2%2002 15,517,866 14,831,021 95.6% 546,287 15,377,308 99.1% 1,067,420 6.9%2003 16,786,636 16,127,126 96.1% 588,930 16,716,056 99.6% 1,138,000 6.8%
1994 1996 1998 2000 2002
$-
$2,000,000
$4,000,000
$6,000,000
$8,000,000
$10,000,000
$12,000,000
$14,000,000
$16,000,000
$18,000,000
99

City of Lee's Summit, MissouriSchedule of Revenue Bond Coverage
Combined Waterworks and Sewerage System FundLast Ten Years
Payment to General Net Revenue Debt Service RequirementsYear Fund for General Available for
Ended Net Income Depreciation and and Administrative Debt ServiceJune 30 Loss (4) Amortization Interest (1) Services (2) (1) Principal Interest Total Coverage (3)
1994 1,650,294$ 1,652,018$ 2,385,202$ 871,713$ 6,559,227$ 690,000$ 2,290,467$ 2,980,467$ 2.201995 1,714,684 1,570,073 2,134,238 922,665 6,341,660 735,000 2,246,100 2,981,100 2.131996 2,337,784 1,676,714 2,268,368 1,002,660 7,285,526 780,000 2,197,824 2,977,824 2.451997 4,963,198 1,730,397 2,535,789 1,016,731 10,246,115 830,000 2,145,463 2,975,463 3.441998 5,703,531 1,821,695 2,276,191 1,053,716 10,855,133 885,000 2,080,693 2,965,693 3.661999 5,080,786 1,948,219 2,162,194 1,155,545 10,346,744 940,000 2,027,230 2,967,230 3.492000 6,303,992 2,137,295 2,074,427 2,519,666 13,035,380 1,005,000 1,960,468 2,965,468 4.402001 8,939,102 2,197,878 2,178,019 1,320,332 14,635,331 1,075,000 1,887,858 2,962,858 4.942002 11,255,593 2,322,713 1,776,695 1,361,229 16,716,230 1,145,000 1,808,175 2,953,175 5.662003 14,623,524 2,912,394 2,205,607 1,437,309 21,178,834 1,605,000 1,330,904 2,935,904 7.21
NET REVENUE AVAILABLE FOR DEBT SERVICE DIVIDED BY TOTAL DEBT SERVICE REQUIREMENTS
NOTES:(1) Interest relating to revenue bonds only, including interest capitalized as a cost of constructing property, plant and equipment.(2) Bond covenants specify that this payment is to be made only after all obligations including funding of debt service reserves have been met.(3) Net revenue available for debt service divided by total debt service requirements.(4) Excludes extraordinary gain or losses on advance refunding of revenue bonds, if any.
94 95 96 97 98 99 00 01 02 03
0.00
1.00
2.00
3.00
4.00
5.00
6.00
7.00
8.00
100
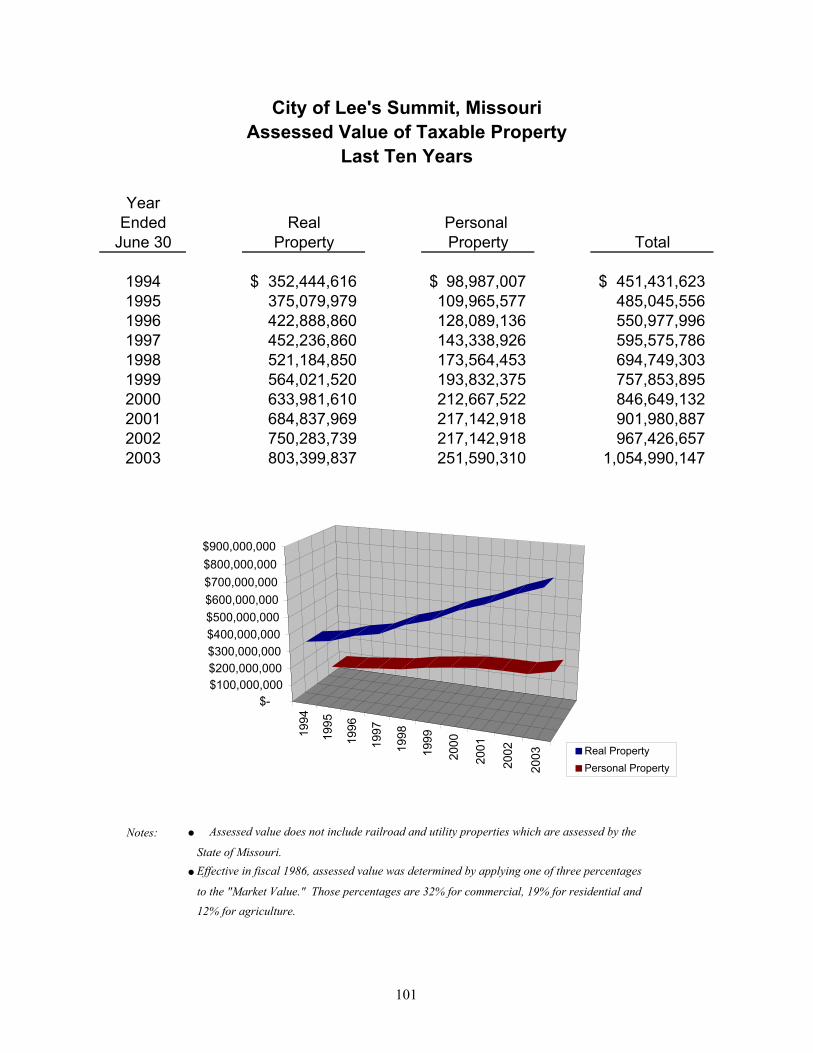
City of Lee's Summit, MissouriAssessed Value of Taxable Property
Last Ten Years
YearEnded Real Personal
June 30 Property Property Total
1994 352,444,616$ 98,987,007$ 451,431,623$ 1995 375,079,979 109,965,577 485,045,5561996 422,888,860 128,089,136 550,977,9961997 452,236,860 143,338,926 595,575,7861998 521,184,850 173,564,453 694,749,3031999 564,021,520 193,832,375 757,853,8952000 633,981,610 212,667,522 846,649,1322001 684,837,969 217,142,918 901,980,8872002 750,283,739 217,142,918 967,426,6572003 803,399,837 251,590,310 1,054,990,147
Notes: ● Assessed value does not include railroad and utility properties which are assessed by the
State of Missouri.● Effective in fiscal 1986, assessed value was determined by applying one of three percentages
to the "Market Value." Those percentages are 32% for commercial, 19% for residential and
12% for agriculture.
1994
1995
1996
1997
1998
1999
2000
2001
2002
2003
$-$100,000,000$200,000,000$300,000,000$400,000,000$500,000,000$600,000,000$700,000,000$800,000,000$900,000,000
Real PropertyPersonal Property
101

City of Lee's Summit, MissouriProperty Tax Rates - Direct and Overlapping Governmental Units
Last Ten Years
Tax Rates (Per $1,000 Valuation)
Year Ended Lee's Summit
June 30 City School District County State Other Total
1994 13.40 50.70 5.40 0.30 7.23 77.031995 13.40 50.70 5.00 0.30 7.53 76.931996 13.40 50.70 5.00 0.30 7.53 76.931997 16.30 52.70 5.00 0.30 7.63 81.931998 16.30 52.70 5.30 0.30 7.63 82.231999 16.30 52.70 5.30 0.30 7.63 82.232000 16.10 53.90 5.60 0.30 7.73 83.632001 16.10 53.90 5.60 0.30 7.73 83.632002 16.10 53.90 5.70 0.30 7.73 83.732003 16.10 53.90 5.70 0.30 7.73 83.73
Other9%State
0%City19%
School District65%
County7%
102
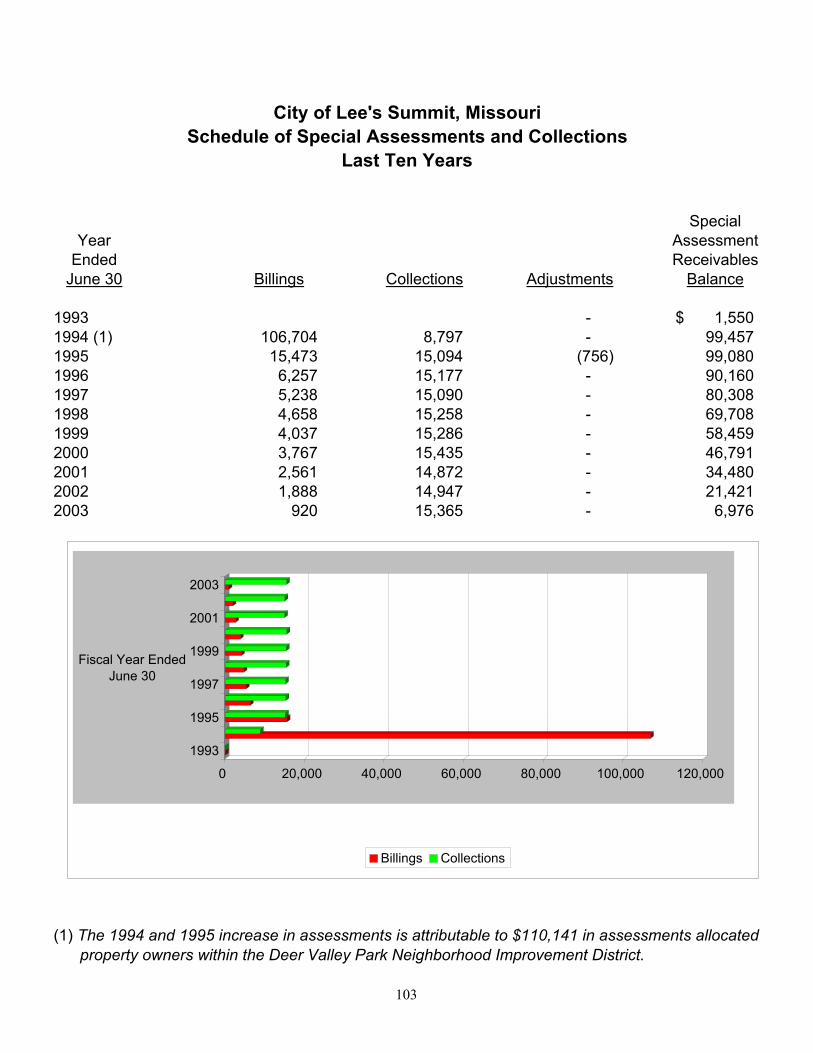
City of Lee's Summit, MissouriSchedule of Special Assessments and Collections
Last Ten Years
SpecialYear Assessment
Ended ReceivablesJune 30 Billings Collections Adjustments Balance
1993 - 1,550$ 1994 (1) 106,704 8,797 - 99,4571995 15,473 15,094 (756) 99,0801996 6,257 15,177 - 90,1601997 5,238 15,090 - 80,3081998 4,658 15,258 - 69,7081999 4,037 15,286 - 58,4592000 3,767 15,435 - 46,7912001 2,561 14,872 - 34,4802002 1,888 14,947 - 21,4212003 920 15,365 - 6,976
(1) The 1994 and 1995 increase in assessments is attributable to $110,141 in assessments allocated property owners within the Deer Valley Park Neighborhood Improvement District.
0 20,000 40,000 60,000 80,000 100,000 120,000
1993
1995
1997
1999
2001
2003
Fiscal Year Ended June 30
Billings Collections
103

City of Lee's Summit, MissouriSchedule of Construction Permits Issued
Last Ten Fiscal Years
Year ConstructionEnded Permits (1)
June 30 Residential Commercial
1994 1,174 221995 993 401996 1,296 1001997 806 581998 797 631999 843 602000 876 702001 754 482002 805 652003 1,003 61
(1) Information obtained from City Building Inspection Department.
1994
1995
1996
1997
1998
1999
2000
2001
2002
2003
0
200
400
600
800
1,000
1,200
1,400
Residential Commercial
104

City of Lee's Summit, MissouriComputation of Legal Debt Margin
June 30, 2003
GeneralObligation Bonds
Ordinary (1) Additional (2) Total
Assessed Valuation (December 31, 2002) $1,054,990,147 (3)
Constitutional debt limit $ 105,499,015 105,499,015 210,998,031
General Obligation bonds authorized: Issued 12,008,000 6,162,000 18,170,000 Unissued 24,063,000 12,937,000 37,000,000Less cash and securities available for retirement 2,868,288 1,471,884 4,340,172
33,202,712 17,627,116 50,829,828
LEGAL DEBT MARGIN $ 72,296,303 87,871,899$ 160,168,203$
NOTES: (1) Article VI, Sections 26 (b) and (c) of the State Constitution permits theCity, by vote of two-thirds of the voting electorate, to incur an indebted-ness for City purposes not to exceed 10% of the taxable tangible propertytherein as shown by the last completed assessment.
(2) Article IV, Sections 26(d) and (e) of the State Constitution providesthat the City may become indebted not exceeding in the aggregate an additional 10% for the purpose of acquiring rights-of-way, constructing, extending and improving streets and avenues and/or sanitary or storm systems, and purchasing or constructing waterworks, electric or otherlight plants, provided that the total general obligation indebtedness of theCity does not exceed 20% of the assessed valuation.
(3) Assessed value does not include railroad and utility properties whichare assessed by the State of Missouri.
Legal Debt MarginJune 30, 2003 Additional
8%
Debt Margin76%
Ordinary 16%
105

City of Lee's Summit, MissouriComputation of Direct and Estimated Overlapping Debt
June 30, 2003
Approximate
Gross Debt Percentage Amount Less Sinking Applicable to Applicable to
Taxing Jurisdiction Fund Lee's Summit (1) Lee's Summit
Counties:
Jackson County -$ 5.3% -$ Cass County - 0.1% -
School Districts:
Raymore-Peculiar 36,827,022 2.0% 736,540
Lee's Summit R-7 128,709,976 92.0% 118,413,178
Blue Springs 66,317,573 5.9% 3,912,737
Hickman Mills C-1 66,317,573 0.1% 66,318
Total Estimated Overlapping Debt 123,128,773
Direct debt obligations of the City of Lee's Summit (General Obligation Bonds, Net of Debt Service Funds) (a) 13,829,828
Total Direct and Estimated Overlapping Debt 136,958,601$
(1) On the basis of school district boundaries within the Lee's Summit city limits. The county percentage is basedon the ratio of land area of Lee's Summit to the size of Jackson County and Cass County respectively.
(a) The General Obligation Bonds Payable amount includes $18,170,000 outstanding less cash in the DebtService Fund.
NOTE: Other government entities whose boundaries overlap the City have outstanding bonds payable from ad valoremtaxes. This schedule of direct and estimated overlapping ad valorem debt was compiled from information furnished by the jurisdictions responsible for the debt. Except for the amounts relating to the City, the Cityhas not independently verified the accuracy or completeness of such information, and no representationregarding the reliability of such information is made. Furthermore, certain entities listed in the statement mayhave issued additional bonds and such entities may have programs requiring the issuance of substantial additional bonds, the amounts of which cannot be determined at this time.
106

City of Lee's Summit, MissouriRatio of Annual Debt Service Expenditures for
General Bonded Debt to Total "General" ExpendituresLast Ten Years
Ratio ofYear Advance Debt Service
Ended Principal Interest Refunding Total Debt Total General to GeneralJune 30 Payments Payments Escrow Service Expenditures Expenditures
1994 915,000$ 1,249,894$ -$ 2,164,894$ 23,523,269$ 9.2%1995 1,045,000 1,187,502 - 2,232,502 25,196,175 8.9%1996 1,095,000 1,117,419 - 2,212,419 28,808,594 7.7%1997 1,550,000 1,354,892 - 2,904,892 32,271,549 9.0%1998 2,610,000 1,618,181 - 4,228,181 45,061,024 9.4%1999 12,936,500 (1) 1,777,432 - 14,713,932 65,476,720 22.5%2000 3,353,500 1,365,514 - 4,719,014 52,224,517 9.0%2001 3,485,000 1,298,895 - 4,783,895 53,784,807 8.9%2002 3,655,000 1,498,210 - 5,153,210 72,882,056 7.1%2003 6,305,000 1,861,813 - 8,166,813 79,025,902 10.3%
(1) 1999 principal payments include $10,040,000 refunded in February 1996. Escrow Trust Fund will pay principal and interest until the crossover date (April 1, 1999).
$-
$10,000,000
$20,000,000
$30,000,000
$40,000,000
$50,000,000
$60,000,000
$70,000,000
$80,000,000
$90,000,000
1994 1995 1996 1997 1998 1999 2000 2001 2002 2003
Total Debt Service Total General Expenditures
107

City of Lee's Summit, MissouriRatio of Net Bonded Debt to Assessed Value and Net Bonded Debt Per Capita
Last Ten Fiscal YearsYear Ratio of Net Net Bonded
Ended Assessed Gross Bonded Less Debt Net Bonded Debt to Debt PerJune 30 Population (1) Valuation (2) Debt (3) Service Funds Bonded Debt Assessed Value Capita
1994 53,819 463,410,231$ 16,290,000$ 2,204,348$ 14,085,652$ 3.0% 2621995 56,826 498,209,617 15,605,000 2,697,466 12,907,534 2.6% 2271996 59,226 564,349,932 29,630,000 3,228,194 26,401,806 4.7% 4461997 61,954 610,635,688 28,015,000 3,383,564 24,631,436 4.0% 3981998 63,844 696,016,806 37,340,000 2,721,690 34,618,310 5.0% 5421999 64,718 752,736,587 24,485,000 2,165,122 22,319,878 3.0% 3452000 67,079 846,132,348 24,105,000 4,249,258 19,855,742 2.3% 2962001 70,700 915,305,192 20,595,000 4,104,670 16,490,330 1.8% 2332002 73,128 987,112,909 22,715,000 4,533,950 18,181,050 1.8% 2492003 76,043 1,071,882,858 18,170,000 4,340,172 13,829,828 1.3% 182
NOTES:(1) The 2001 population is from the U.S. Census Bureau tabulation; the population for other years are estimates by the
Planning and Development Department.(2) Assessed values include railroad and utility properties which are assessed by the State of Missouri.(3) 1996 gross bonded debt includes $10,040,000 refunded in February 1996. Escrow Trust Fund will pay principal
and interest until the crossover date (April 1, 1999).
1994 1995 1996 1997 1998 1999 2000 2001 2002 2003
0.0%0.5%1.0%1.5%2.0%2.5%3.0%3.5%4.0%4.5%5.0%
Perc
ent
Fiscal Years
Net Bonded Debt to Assessed Value
1994 1995 1996 1997 1998 1999 2000 2001 2002 2003
0
100
200
300
400
500
600
Dol
lars
Fiscal Years
Net Bonded Debt Per Capita
108

City of Lee's Summit, MissouriSchedule of Principal Taxpayers
For the Year Ended June 30, 2003
Percent Paidto Total Assessed
Taxpayer Amount Levied Taxes Valuation
Sprint Spectrum 396,379$ 2.4% 24,619,822$
Missouri Public Service 187,539 1.1% 11,648,391
Pfizer Chemical Company 118,445 0.7% 7,356,806 Toys R Us 113,237 0.7% 7,033,380
John Knox Village 111,159 0.7% 6,904,296
Southwestern Bell 104,187 0.6% 6,471,250
Southern Union Company 85,047 0.5% 5,282,438
Wal-Mart 60,534 0.4% 3,759,869
Missouri Gas Energy 54,602 0.3% 3,391,432 A Zeregas Sons Inc 52,098 0.3% 3,235,921
Data provided by Jackson County
109

City of Lee's Summit, MissouriMiscellaneous Statistics
June 30, 2003
2003 2002 % Change
Estimated Population 76,043 73,128 3.99%R-7 School District Enrollment 15,414 14,838 3.88%Unemployment Rates: Lee's Summit 3.8% 3.3% 15.15% Missouri 5.8% 5.5% 5.45% National 6.4% 5.9% 8.47%Building Permits Issued: (1) Residential/single family 887 748 18.58% Residential/multifamily 116 57 103.51% Commercial/industrial 61 65 (6.15%) Additions 1,090 1,187 (8.17%)Retail Sales (in millions) 1,061.9 968.6 9.63%Incorporated City (Square Miles) 64 64 - Culture and Recreation: Parks 26 26 0.00% Park Acreage 1,140 1,140 0.00% Tennis Courts 15 15 - Swimming Pool 1 1 - Community Center 3 3 - Fire Protection: (1) Number of Stations 6 6 - Number of Fire Personnel 126.0 126.0 - Number of Calls Answered 6,253 5,794 7.92%Police Protection: (1) Number of Police Personnel 156.8 156.8 - Number of Patrol Units 27 27 - Number of Law Violations: (1) Number of Calls Answered 69,037 70,589 (2.2%) Incidents and Other Offenses 5,592 5,678 (1.51%) Traffic Violations 16,635 17,897 (7.05%)Water System: Source: Kansas City, Missouri Water Company 45.85% 32.70% 40.21% Independence, Missouri Water Co. 54.15% 67.30% (19.54%) Miles of Water Mains 555 541 2.59% Number of Service Connections 28,662 27,726 3.38% Number of Fire Hydrants 3,566 3,419 4.30% Average Daily Consumption 10,100,000 9,400,000 7.45% Maximum Contract Amount 21,500,000 21,500,000 0.00% Maximum Daily Demand 25,500,000 20,500,000 24.39% Total Storage Capacity 32,200,000 32,200,000 0.00%
(1) Statistics based on calendar year.
110

City of Lee's Summit, MissouriSchedule of Insurance in Force
June 30, 2003
Name of Insurer Amount of Coverage Expiration Premium
Public Officials Bond Thomas McGee , L.C., Agent $250,000 07/01/03 $1,275.00 surety bond, finance director Fidelity & Deposit Company
of Maryland
Workers' Compensation & Employers Liability Self Insured Retention - $250,000 Statutory benefits per occurrence - security bond 07/01/03 $48,409.00Safety National Insurance (Excess) $1,000,000 per occurrence 2043 Woodland Pkwy, Suite 200 $5,000,000 /aggregate excess limitsSt. Louis MO 63126
General Liability (Casualty) Mid-America Regional Council Claims Made Policy 07/01/03 $628,311.00Insurance Trust (MARCIT) Limits:300 Rivergate Center, 600 BroadwayKansas City MO 64105-1536Thomas McGee , L.C., Agent
Policy Aggregate Limit $2,000,000 each occurrenceGeneral Liability Aggregate Limit $10,000,000/annual program liability aggregate
Liability Deductible $25,000/per incident
Personal & Advertising Injury Limit $2,000,000 each occurrence
Crime & Employee Fidelity Deductible $25,000/per incident
Uninsured & Underinsured Motorists $100,000/per person $200,000/per incident
Automobile Liability MARCIT Limits: 07/01/03Thomas McGee , L.C., Agent $2,000,000 combined single limit each accident
$25,000 deductible
Automobile Physical Damage MARCIT ACV (Actual Cash Value) 07/01/03Thomas McGee , L.C., Agent $5,000 deductible collision
Property MARCIT Per Statement of Values 07/01/03 $43,871.00Thomas McGee , L.C., AgentTravelers
Earthquake MARCIT $5,000,000 Limit 07/01/03Travelers
Boiler and Machinery MARCIT Limits per schedule of values 07/01/03 $5,466.00Thomas McGee , L.C., Agent $5,000 deductibleHartford Steam Boiler 1/3 month limitation
Electronic Data Processing MARCIT Limits per schedule of values 07/01/03 $2,024.00(Computer Equipment) Thomas McGee , L.C., Agent $5,000 deductible
Travelers
Type of Coverage
111
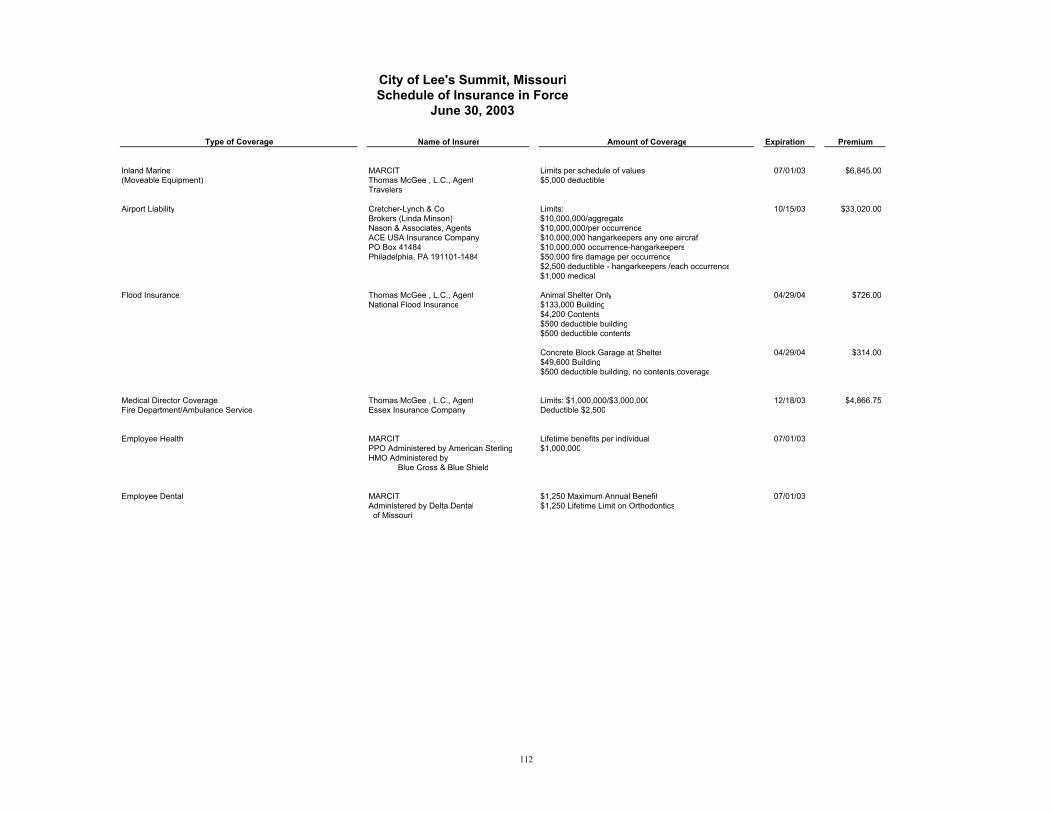
City of Lee's Summit, MissouriSchedule of Insurance in Force
June 30, 2003
Name of Insurer Amount of Coverage Expiration PremiumType of Coverage
Inland Marine MARCIT Limits per schedule of values 07/01/03 $6,845.00(Moveable Equipment) Thomas McGee , L.C., Agent $5,000 deductible
Travelers
Airport Liability Cretcher-Lynch & Co Limits: 10/15/03 $33,020.00Brokers (Linda Minson) $10,000,000/aggregateNason & Associates, Agents $10,000,000/per occurrenceACE USA Insurance Company $10,000,000 hangarkeepers any one aircraftPO Box 41484 $10,000,000 occurrence-hangarkeepersPhiladelphia, PA 191101-1484 $50,000 fire damage per occurrence
$2,500 deductible - hangarkeepers /each occurrence$1,000 medical
Flood Insurance Thomas McGee , L.C., Agent Animal Shelter Only 04/29/04 $726.00National Flood Insurance $133,000 Building
$4,200 Contents$500 deductible building$500 deductible contents
Concrete Block Garage at Shelter 04/29/04 $314.00$49,600 Building$500 deductible building, no contents coverage
Medical Director Coverage Thomas McGee , L.C., Agent Limits: $1,000,000/$3,000,000 12/18/03 $4,866.75Fire Department/Ambulance Service Essex Insurance Company Deductible $2,500
Employee Health MARCIT Lifetime benefits per individual 07/01/03PPO Administered by American Sterling $1,000,000HMO Administered by Blue Cross & Blue Shield
Employee Dental MARCIT $1,250 Maximum Annual Benefit 07/01/03Administered by Delta Dental $1,250 Lifetime Limit on Orthodontics of Missouri
112