comprehensive annual financial report - accounting office...of the board of trustees exercises...
TRANSCRIPT
Comprehensive Annual Financial ReportFor the Year Ended June 30, 2017Included as an Enterprise Fund of the State of Connecticut
Prepared by the Office of the Controller


1
TABLE OF CONTENTS INTRODUCTORY SECTION
Letter of Transmittal 4 – 7 Certificate of Achievement 8 Board of Trustees 9 Organization Chart 10
FINANCIAL SECTION
Independent Auditors' Report 12 – 13 Management’s Discussion and Analysis 15 – 25 Statement of Net Position 26 Statement of Revenues, Expenses, and Changes in Net Position 27 Statement of Cash Flows 28 – 29 The University of Connecticut Law School Foundation, Inc. - Component Unit Financial Statements 30
Notes to Financial Statements 31 – 51 Required Supplementary Information: Schedule of University’s Proportionate Share of Collective Net Pension Liability 52
Schedule of University Pension Contributions 52
STATISTICAL SECTION
Schedule of Revenues by Source 55 Schedule of Expenses by Natural Classification 56 Schedule of Expenses by Function 57 Schedule of Net Position and Changes in Net Position 58 Schedule of Long-Term Debt 59 Schedule of Debt Coverage - Revenue Bonds 60 Admissions and Enrollment 61 Academic Year Tuition and Mandatory Fees 62 Faculty and Staff 63 Schedule of Capital Asset Information 64 Demographic and Economic Statistics 65 Top Ten Nongovernmental Employers 66
2
[This Page Intentionally Left Blank]
3
INTRODUCTORY SECTION
4
LETTER OF TRANSMITTAL November 20, 2017 To President Herbst, Members of the Board of Trustees, and University of Connecticut Community: We are pleased to submit to you the Comprehensive Annual Financial Report (CAFR) of the University of Connecticut (University) for the fiscal year ended June 30, 2017. For purposes of this report, the University is herein defined as all financial activity from Storrs-based undergraduate and graduate programs, the regional campuses, the School of Law, and the School of Social Work. The University of Connecticut Health Center (UConn Health), which maintains a separate budget and issues its own audited financial statements, is excluded from this report. The CAFR includes the Management’s Discussion and Analysis (MD&A), the basic financial statements, notes, other supplementary and statistical information. The CAFR provides financial information about the University’s results of activities during the year and describes its financial position at the end of the year based on currently known facts, decisions, and conditions. Management assumes full responsibility for the contents of this report including the accuracy, completeness, and fairness of the data presented. We believe the University’s system of internal controls is sufficient to identify material misstatements. Although we have strong internal controls, the cost of internal controls should not exceed the benefits. Therefore, the objective of the University’s internal control system is to provide reasonable, rather than absolute, assurance that the financial statements are free of material misstatements, and that assets are safeguarded against loss from unauthorized use or disposition. The University’s Joint Audit and Compliance Committee of the Board of Trustees exercises oversight of the integrity of its financial statements and internal control systems, as well as direct engagement in the approval of independent auditing services. Certain bond covenants require that the University’s accounting and financial records be subject to an annual independent audit. The University’s annual audit for the fiscal year ended June 30, 2017, was performed by the State of Connecticut Auditors of Public Accounts. They have issued an unqualified opinion on the fair presentation of the financial statements that can be found in the front of the financial section.
The CAFR is prepared in accordance with generally accepted accounting principles (GAAP) and in conformity with standards established by the Governmental Accounting Standards Board (GASB), also using guidelines of the Government Finance Officers Association of the United States and Canada (GFOA). The MD&A is presented to supplement the financial statements and should be read in conjunction with this letter of transmittal. The MD&A can be found immediately following the auditors’ report. University Profile Background The University was founded in 1881 when Charles and Augustus Storrs donated land and money to the State of Connecticut (State), establishing the Storrs Agricultural School later to become Connecticut’s land-grant college. Today the University serves as the State’s flagship institution for higher education, meeting the educational needs of undergraduate, graduate, professional, and continuing education students through the integration of teaching, research, service, and outreach. The University is governed by a Board of Trustees that is composed of 21 members, including the Governor, the UConn Health Board of Directors Chair, and the Commissioners of Agriculture, Economic and Community Development, and Education. The University is reported as an enterprise fund in the State’s CAFR and operates as a State-assisted institution of higher education. In addition to academics, the University also participates in Division I athletics. The women’s field hockey team recently won the national championship, claiming its third national title in 5 years. The women’s basketball team continues to be a national powerhouse, following their record-breaking 2015-2016 season where they won their fourth consecutive and eleventh all-time national championship. Student and Faculty Data For the 2016-2017 academic year, the number of applications for admissions increased by three percent and total enrollment grew to 31,440 students, including more than 7,800 graduate students. All 169 Connecticut towns were represented in the University’s undergraduate population, 42 states, and 109 countries. Of the 23,630 undergraduates, 50 percent were female and 31 percent were minority students. The University employs 1,518
5
full-time faculty members and an additional 722 part-time faculty and adjuncts. In 2017, the University awarded 8,487 degrees, an increase of 33 percent since 2006. Component Units In accordance with GASB reporting requirements, the University of Connecticut Law School Foundation, Inc. (Law School Foundation) is discretely presented as a component unit of the University. The University of Connecticut Foundation, Inc. (Foundation), another related organization, operates exclusively to promote the educational, scientific, cultural, research and recreational objectives for both the University and UConn Health, and is therefore not included as a component unit in the accompanying financial statements. See Notes 1 and 14 for additional information regarding component units and related organizations. Economic Condition The Connecticut economy had another year of steady growth going into 2017. In the past twelve months, Connecticut’s headline unemployment rate fell by 0.6 percent to 4.8 percent. Statewide real average annual wages grew 0.5 percent to $65,869, remaining fourth in the nation behind only Massachusetts, New York, and Washington, D.C. The Connecticut Economic Digest reported that statewide single-family home sales gained 8.7 percent in 2016, reaching the highest level in nine years. Importantly, these gains were not at the expense of median sale prices, which grew at 0.4 percent. Initial data through the beginning of 2017 indicates this trend should continue as sales gained 6.5 percent in the first quarter of 2017 when compared to the same period in the prior year. Despite Connecticut’s recent economic gains, growth in expenses exceeds revenues at the State level, causing large and continuing overall budget deficits. The growth in expenses is largely due to the State’s unfunded pension liability, debt service, and growth in other services. For the biennium fiscal years of 2018 and 2019, the budget process was extremely difficult with the State Legislature not passing a budget bill until well into the current fiscal year. After an initial budget was vetoed by the Governor, in October 2017 the Connecticut General Assembly approved a bipartisan budget agreement that cut the University by $106.7 million over the biennium when compared to the fiscal year 2017 appropriation. This steep reduction requires difficult decisions to be made in order to manage the cut and support a balanced budget going forward. The University will contend with these cuts in various ways including establishing a freeze on hiring, delaying certain capital projects, restructuring administrative functions and departments with the elimination of positions, and reducing services that are not essential to the academic mission. Based on this reality,
the University must rely less on State support and adhere to a strategic financial plan that will meet both its current objectives and long-term goals. Long-Term Financial Planning Despite the cut in State support, the University is a financially stable institution with exceptional educational programs and research, and it continues to successfully balance financial needs and investments for long-term growth while providing high-quality education. The University’s long-term plan includes becoming more self-reliant in generating diverse operating revenues to offset forecasted decreases in State support. The University will maintain a balanced budget for its growing operations through increases in student tuition, growth in research, increases in philanthropy, and new revenue sources. Increases in Student Tuition As of fiscal year 2017, tuition revenue is now the largest source of revenue for the University. During fiscal year 2016, the University’s Board of Trustees approved a four-year tuition plan that allows for modest increases each year from fiscal year 2017 to fiscal year 2020. This is the second time that the Board of Trustees adopted a four-year tuition plan rather than addressing tuition each year. The multi-year plan provides more detail and certainty for students as they plan with their families for their college careers. Additionally, having a four-year tuition plan allows the University to better engage in strategic long-term planning; given the financial stress the State faces, having a revenue category that is set and predictable is important to the long-term stability of the University. Although tuition will increase, more financial aid will also be available to help address issues of affordability and accessibility for the University’s students. Increases in Philanthropy Philanthropy is an area of revenue growth for the University and is part of the University’s long-term financial planning. The Foundation, which supports both the University and UConn Health, has seen transformative changes in the last few years, with the last three years being the best in its history. In fact, the endowment investments of the Foundation grew by $36.4 million during fiscal year 2017, ending at $368.6 million. In fiscal year 2016, the University of Connecticut Alumni Association was moved under the umbrella of the Foundation, consolidating alumni engagement, service, and philanthropy. During summer 2017, the Law School Foundation dissolved and its assets were transferred to the Foundation, further strengthening the overall portfolio. New Revenue Sources The University continues to look at other ways to generate revenue and this will continue to be a focus in the coming

6
years. Some specific examples of recent changes include a new agreement with the University’s bookstore operator (see Note 10), new self-supporting business school programs, increased enrollment in other revenue-generating programs, increases in summer school revenue, opening the new Stamford residence hall, and increasing room and board fees. Specifically, the new bookstore model includes an increase of guaranteed revenue from fiscal year 2017 of $3.5 million to $4.5 million in fiscal year 2018. Over the past decade, the growth and diversification of the University’s funding streams combined with continuing physical transformation through the University’s capital improvement program have led to record enrollments, growth in philanthropy, new revenue streams, and significant contributions to the State’s economy. Major Initiatives Next Generation Connecticut (NextGenCT) represents one of the most ambitious State investments in economic development, higher education, and research in the nation, with a particular focus on capital investment. The NextGenCT initiative added $1.5 billion in bond funds for new and renovated facilities, extending the UCONN 2000 capital improvement program that began in 1995 to 2027. An operating component was also included, but has been limited due to the State’s recent financial constraints. The general obligation bonds issued through UCONN 2000 and NextGenCT are secured by the State’s debt service commitment, thus there are no revenues budgeted for payment of these bonds. Since fiscal year 2015, UConn has been authorized $685.3 million in funding, with an additional $200.0 million coming in fiscal years 2018 and 2019. These funds have allowed UConn to open a new residential hall, renovate the associated dining hall, build the new downtown Hartford campus, complete the Engineering and Science Building, open the Innovation Partnership Building, update and renovate various buildings throughout campus, and address needed infrastructure and deferred maintenance improvements. Despite reductions in operating funding, the NextGenCT initiative has provided a strong framework for the University and has aided the State’s economy. Since the beginning of the initiative, many new faculty have been hired particularly in the fields of science, technology, engineering, and math (STEM). Additionally, funds have been provided for STEM scholarships, STEM fellowships, the IDEA (Imagine Develop Engage Apply) Grant program for student-designed and led projects, and for staff positions. Since fiscal year 2013, undergraduate enrollment has grown by 1,329 across all campuses. This ongoing success has attracted higher quality students and the University maintains solid rankings in virtually all
relevant areas. Highlights from the 2016-2017 academic year include the following: As of fall 2016, the University ranked 18 out of
58 public research universities in graduation rates for all freshmen and 21 out of 58 for minority freshmen.
In fiscal year 2017, approximately 76 percent of
undergraduates enrolled were residents of the State. Nearly 80 percent of the recent alumni securing jobs in Connecticut were residents before coming to the University, and 30 percent of the graduates who came to the University from other states were also employed in Connecticut following graduation.
In fiscal year 2017, the University provided $113.5 million in institutionally funded financial aid and has budgeted an additional $8.9 million for fiscal year 2018.
The time to graduation is 4.2 years, ranking third among public research peers. This was accomplished by increasing the number of class offerings and reducing the student-to-faculty ratio. Lower time to graduation helps UConn students pay less in tuition and join the workforce more quickly.
Through the end of fiscal year 2017, the UCONN 2000 capital improvement program authorized 112 major projects, totaling $3.1 billion in bond authorizations.
Looking ahead, the University will continue to build on these accomplishments and further strengthen its programs and services for faculty, staff, students, and the University community. Awards and Acknowledgements The University marked its seventh consecutive year among the nation’s top 25 public universities as ranked by U.S. News & World Report in 2017. The No. 18 ranking in 2017 reflects the University’s strong graduation and retention rates, academic excellence, faculty resources, and other factors that are weighed in its annual evaluations.
In 2017, Money magazine ranked the University No. 22 in best value among public universities, partly due to low tuition costs and a higher percentage of students who get need-based aid and merit scholarships. The University also came in at No. 27 in Kiplinger’s list of best values in
7
public colleges and No. 28 in Forbes’ annual ranking for best public colleges. The University was among the top 25 schools in the Sierra Club’s “Cool Schools Ranking” for the sixth consecutive year. The Sierra Club bases the school rankings on sustainability data collected in a range of areas, including energy, investments, academics, waste reduction and diversion, transportation, and purchasing. The University was No. 4 in the University of Indonesia’s GreenMetric World University Rankings that rates universities worldwide on leadership on sustainability issues.
The University is a member of Universitas 21, an international network of leading research-intensive universities in 17 countries. The University is one of only three universities in the United States invited into the network, which is composed of some of the world’s major institutions of higher education. Membership in Universitas 21 permits faculty and students to have additional opportunities for collaboration on projects around the world. Membership will increase the University’s global reach, student participation in
education abroad programs, fellowships, and research opportunities.
The GFOA awarded a Certificate of Achievement for Excellence in Financial Reporting to the University for its CAFR for the fiscal year ended June 30, 2016. To receive a Certificate of Achievement, a report issuer must publish an easily readable and efficiently organized CAFR, and must satisfy both GAAP and applicable legal requirements. A Certificate of Achievement is valid for a period of one year only. The University will submit its CAFR for the fiscal year ended June 30, 2017, to the GFOA and anticipates this year’s report will continue to meet the requirements to receive the Certificate of Achievement.
Preparation of this CAFR in a timely manner would not have been possible without the coordinated efforts from staff within the Office of the Controller and other University financial staff. Each member has my sincere appreciation for their individual contribution in the preparation of the report.
Respectfully submitted,
Scott Jordan Executive Vice President for Administration and Chief Financial Officer

8
9
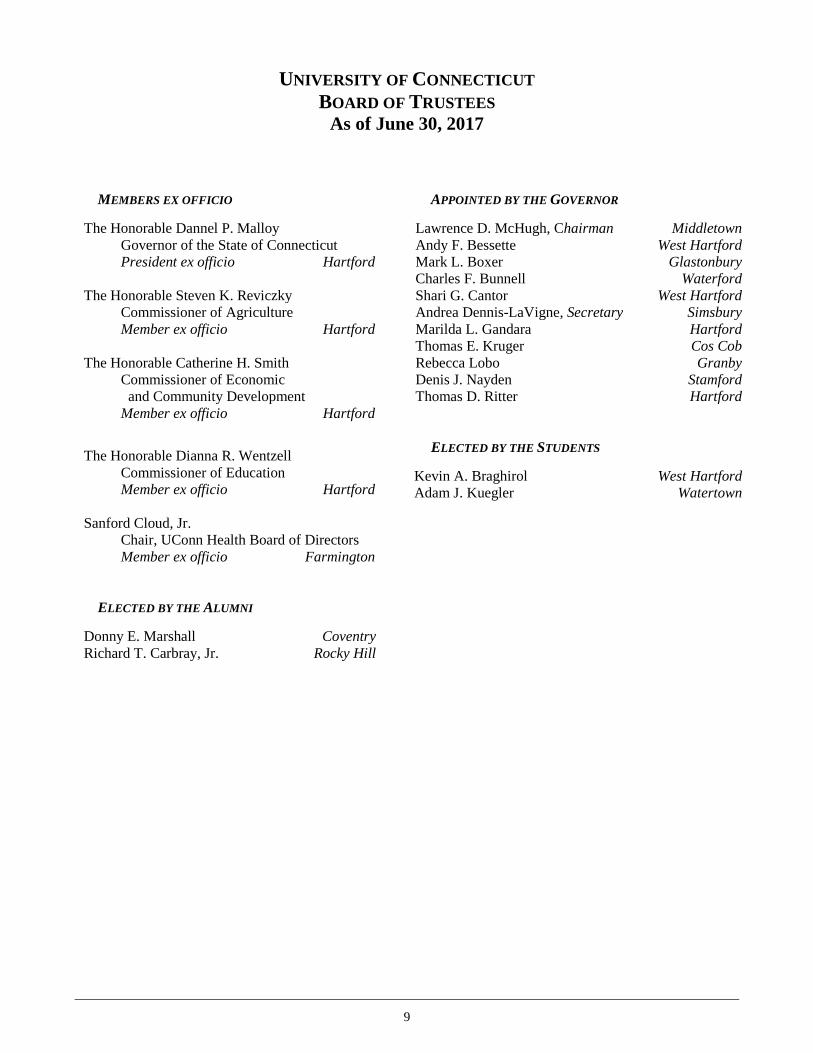
UNIVERSITY OF CONNECTICUT BOARD OF TRUSTEES
As of June 30, 2017
MEMBERS EX OFFICIO The Honorable Dannel P. Malloy Governor of the State of Connecticut President ex officio Hartford The Honorable Steven K. Reviczky Commissioner of Agriculture Member ex officio Hartford The Honorable Catherine H. Smith Commissioner of Economic
and Community Development Member ex officio Hartford
The Honorable Dianna R. Wentzell Commissioner of Education Member ex officio Hartford Sanford Cloud, Jr. Chair, UConn Health Board of Directors Member ex officio Farmington
ELECTED BY THE ALUMNI Donny E. Marshall Coventry Richard T. Carbray, Jr. Rocky Hill
APPOINTED BY THE GOVERNOR
Lawrence D. McHugh, Chairman Middletown Andy F. Bessette West Hartford Mark L. Boxer Glastonbury Charles F. Bunnell Waterford Shari G. Cantor West Hartford Andrea Dennis-LaVigne, Secretary Simsbury Marilda L. Gandara Hartford Thomas E. Kruger Cos Cob Rebecca Lobo Granby Denis J. Nayden Stamford Thomas D. Ritter Hartford
ELECTED BY THE STUDENTS
Kevin A. Braghirol West Hartford Adam J. Kuegler Watertown

10
PresidentSusan Herbst
University of ConnecticutBoard of Trustees
Chief of Staff to the President and
Executive Secretary to the Board of Trustees
Rachel Rubin
Interim Provost and Executive Vice President for
Academic Affairs
Jeremy Teitelbaum
Executive Vice President for
Administration andChief Financial Officer
Scott Jordan
Senior Director,Governmental
Relations
Joann Lombardo
Vice President for Student Affairs
Michael Gilbert
Vice President for Enrollment Planning and Management
Wayne Locust
Vice President for Global Affairs
Daniel Weiner
Vice President for Research
Radenka Maric
Vice President forCommunications
Tysen Kendig
Director ofAthletics
David Benedict
Vice President and General
Counsel
Richard Orr
Executive Vice President for Health Affairs and Chief Executive Officer
of UConn Health
Dr. Andrew Agwunobi
Associate Vice President andChief Diversity
Officer
Joelle Murchison
UNIVERSITY OF CONNECTICUT Organization Chart
Chief Audit and Compliance Officer
VACANT

11
FINANCIAL SECTION

12
STATE OF CONNECTICUT
AUDITORS OF PUBLIC ACCOUNTS STATE CAPITOL
JOHN C. GERAGOSIAN 20 TRINITY STREET ROBERT J. KANE HARTFORD, CONNECTICUT 06106-1559
INDEPENDENT AUDITORS' REPORT
Board of Trustees of the University of Connecticut Report on Financial Statements We have audited the accompanying financial statements of the University of Connecticut (UConn), a component unit of the University of Connecticut system, which includes UConn, the University of Connecticut Health Center and the University of Connecticut Foundation, Inc. The accompanying financial statements, which consist of the statement of net position as of June 30, 2017 and the related statements of revenues, expenses and changes in net position and cash flows for the year then ended, and the related notes to the financial statements, collectively comprise UConn’s basic financial statements as listed in the table of contents. Management’s Responsibility for the Financial Statements Management is responsible for the preparation and fair presentation of these financial statements in accordance with accounting principles generally accepted in the United States of America; this includes the design, implementation, and maintenance of internal control relevant to the preparation and fair presentation of financial statements that are free from material misstatement, whether due to fraud or error. Auditor’s Responsibility Our responsibility is to express an opinion on these financial statements based on our audit. We conducted our audit in accordance with auditing standards generally accepted in the United States of America. Those standards require that we plan and perform the audit to obtain reasonable assurance about whether the financial statements are free of material misstatement. We did not audit the financial statements of the University of Connecticut Law School Foundation, Inc., a discretely presented component unit of UConn, which represented less than one percent of the assets of UConn as of June 30, 2017 and less than one percent of total revenues and support for UConn for the year then ended. Those financial statements were audited by other auditors whose report thereon has been furnished to us, and our opinion, insofar as it relates to the amounts included for the University of Connecticut Law School Foundation, Inc., is based solely on the report of the other auditors. The audit of the University of Connecticut Law School Foundation, Inc. was conducted in accordance with auditing standards generally accepted in the United States of America. An audit involves performing procedures to obtain audit evidence about the amounts and disclosures in the financial statements. The procedures selected depend on the auditor’s judgment, including the assessment of the risks of material misstatement of the financial statements, whether due to fraud or error. In making those risk assessments, the auditor considers internal control relevant to the entity’s preparation and fair presentation of the financial statements in order to design audit procedures that are appropriate in the circumstances, but not for the purpose of expressing an opinion on the effectiveness of the entity’s internal control. Accordingly, we express no such opinion. An audit also includes evaluating the appropriateness of accounting policies used and the reasonableness of significant accounting estimates made by management, as well as evaluating the overall presentation of the financial statements. We believe that the audit evidence we have obtained is sufficient and appropriate to provide a basis for our audit opinion.
13
Opinion In our opinion, based upon our audit and the report of other auditors, the financial statements referred to above present fairly, in all material respects, the financial position of UConn as of June 30, 2017 and the respective changes in financial position and cash flows for the year then ended in accordance with accounting principles generally accepted in the United States of America. Other Matters Required Supplementary Information The accompanying Management’s Discussion and Analysis on pages 15 through 25 and the Required Supplementary Information on page 52 is required by accounting principles generally accepted in the United States of America to supplement the basic financial statements. Such information, although not part of the basic financial statements, is required by the Governmental Accounting Standards Board who considers it to be an essential part of financial reporting for placing the basic financial statements in an appropriate operational, economic, or historical context. We have applied certain limited procedures to the required supplementary information in accordance with auditing standards generally accepted in the United States of America, which consisted of inquiries of management about the methods of preparing the information and comparing the information for consistency with management’s responses to our inquiries, the basic financial statements, and other knowledge we obtained during our audit of the basic financial statements. We do not express an opinion or provide any assurance on the information because the limited procedures do not provide us with sufficient evidence to express an opinion or provide any assurance. Supplementary and Other Information The introductory and statistical sections are presented for purposes of additional analysis and are not a required part of the basic financial statements. Such information has not been subjected to the auditing procedures applied in the audit of the basic financial statements and, accordingly, we do not express and opinion or provide any assurance on them. Sincerely,
John C. Geragosian Auditor of Public Accounts
Robert J. Kane Auditor of Public Accounts
November 20, 2017 State Capitol Hartford, Connecticut
14
[This Page Intentionally Left Blank]
University of Connecticut June 30, 2017
15
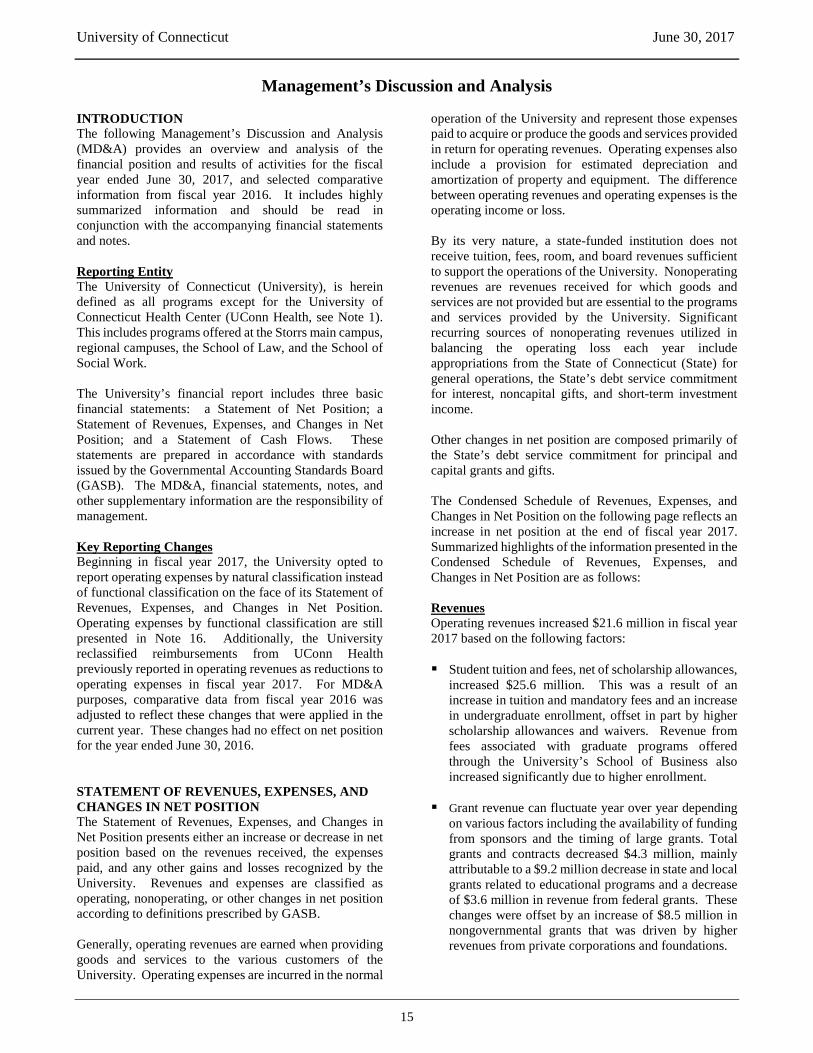
Management’s Discussion and Analysis INTRODUCTION The following Management’s Discussion and Analysis (MD&A) provides an overview and analysis of the financial position and results of activities for the fiscal year ended June 30, 2017, and selected comparative information from fiscal year 2016. It includes highly summarized information and should be read in conjunction with the accompanying financial statements and notes. Reporting Entity The University of Connecticut (University), is herein defined as all programs except for the University of Connecticut Health Center (UConn Health, see Note 1). This includes programs offered at the Storrs main campus, regional campuses, the School of Law, and the School of Social Work. The University’s financial report includes three basic financial statements: a Statement of Net Position; a Statement of Revenues, Expenses, and Changes in Net Position; and a Statement of Cash Flows. These statements are prepared in accordance with standards issued by the Governmental Accounting Standards Board (GASB). The MD&A, financial statements, notes, and other supplementary information are the responsibility of management. Key Reporting Changes Beginning in fiscal year 2017, the University opted to report operating expenses by natural classification instead of functional classification on the face of its Statement of Revenues, Expenses, and Changes in Net Position. Operating expenses by functional classification are still presented in Note 16. Additionally, the University reclassified reimbursements from UConn Health previously reported in operating revenues as reductions to operating expenses in fiscal year 2017. For MD&A purposes, comparative data from fiscal year 2016 was adjusted to reflect these changes that were applied in the current year. These changes had no effect on net position for the year ended June 30, 2016. STATEMENT OF REVENUES, EXPENSES, AND CHANGES IN NET POSITION The Statement of Revenues, Expenses, and Changes in Net Position presents either an increase or decrease in net position based on the revenues received, the expenses paid, and any other gains and losses recognized by the University. Revenues and expenses are classified as operating, nonoperating, or other changes in net position according to definitions prescribed by GASB. Generally, operating revenues are earned when providing goods and services to the various customers of the University. Operating expenses are incurred in the normal
operation of the University and represent those expenses paid to acquire or produce the goods and services provided in return for operating revenues. Operating expenses also include a provision for estimated depreciation and amortization of property and equipment. The difference between operating revenues and operating expenses is the operating income or loss. By its very nature, a state-funded institution does not receive tuition, fees, room, and board revenues sufficient to support the operations of the University. Nonoperating revenues are revenues received for which goods and services are not provided but are essential to the programs and services provided by the University. Significant recurring sources of nonoperating revenues utilized in balancing the operating loss each year include appropriations from the State of Connecticut (State) for general operations, the State’s debt service commitment for interest, noncapital gifts, and short-term investment income. Other changes in net position are composed primarily of the State’s debt service commitment for principal and capital grants and gifts. The Condensed Schedule of Revenues, Expenses, and Changes in Net Position on the following page reflects an increase in net position at the end of fiscal year 2017. Summarized highlights of the information presented in the Condensed Schedule of Revenues, Expenses, and Changes in Net Position are as follows: Revenues Operating revenues increased $21.6 million in fiscal year 2017 based on the following factors: Student tuition and fees, net of scholarship allowances,
increased $25.6 million. This was a result of an increase in tuition and mandatory fees and an increase in undergraduate enrollment, offset in part by higher scholarship allowances and waivers. Revenue from fees associated with graduate programs offered through the University’s School of Business also increased significantly due to higher enrollment.
Grant revenue can fluctuate year over year depending
on various factors including the availability of funding from sponsors and the timing of large grants. Total grants and contracts decreased $4.3 million, mainly attributable to a $9.2 million decrease in state and local grants related to educational programs and a decrease of $3.6 million in revenue from federal grants. These changes were offset by an increase of $8.5 million in nongovernmental grants that was driven by higher revenues from private corporations and foundations.
University of Connecticut June 30, 2017
16
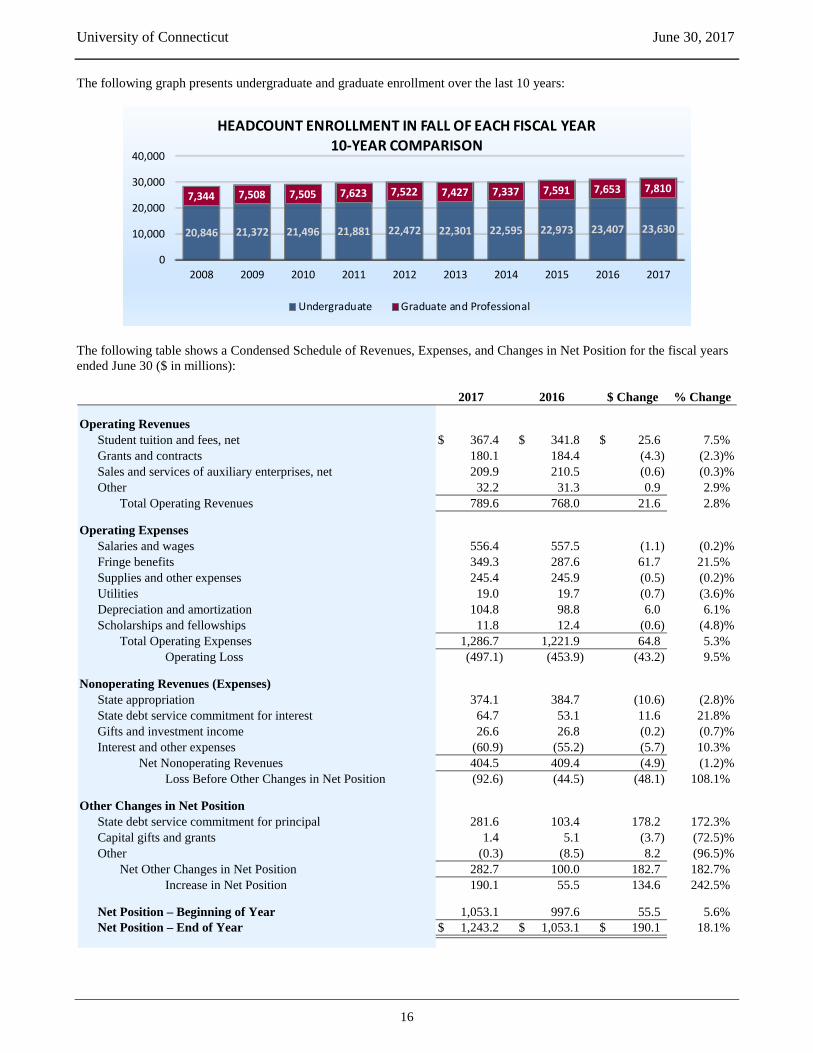
The following graph presents undergraduate and graduate enrollment over the last 10 years:
The following table shows a Condensed Schedule of Revenues, Expenses, and Changes in Net Position for the fiscal years ended June 30 ($ in millions):
0
10,000
20,000
30,000
40,000
2008 2009 2010 2011 2012 2013 2014 2015 2016 2017
20,846 21,372 21,496 21,881 22,472 22,301 22,595 22,973 23,407 23,630
7,344 7,508 7,505 7,623 7,522 7,427 7,337 7,591 7,653 7,810
HEADCOUNT ENROLLMENT IN FALL OF EACH FISCAL YEAR10-YEAR COMPARISON
Undergraduate Graduate and Professional
Operating RevenuesStudent tuition and fees, net $ 367.4 $ 341.8 $ 25.6 7.5%Grants and contracts 180.1 184.4 (4.3) (2.3)%Sales and services of auxiliary enterprises, net 209.9 210.5 (0.6) (0.3)%Other 32.2 31.3 0.9 2.9%
Total Operating Revenues 789.6 768.0 21.6 2.8%
Operating ExpensesSalaries and wages 556.4 557.5 (1.1) (0.2)%Fringe benefits 349.3 287.6 61.7 21.5%Supplies and other expenses 245.4 245.9 (0.5) (0.2)%Utilities 19.0 19.7 (0.7) (3.6)%Depreciation and amortization 104.8 98.8 6.0 6.1%Scholarships and fellowships 11.8 12.4 (0.6) (4.8)%
Total Operating Expenses 1,286.7 1,221.9 64.8 5.3%Operating Loss (497.1) (453.9) (43.2) 9.5%
Nonoperating Revenues (Expenses)State appropriation 374.1 384.7 (10.6) (2.8)%State debt service commitment for interest 64.7 53.1 11.6 21.8%Gifts and investment income 26.6 26.8 (0.2) (0.7)%Interest and other expenses (60.9) (55.2) (5.7) 10.3% Net Nonoperating Revenues 404.5 409.4 (4.9) (1.2)% Loss Before Other Changes in Net Position (92.6) (44.5) (48.1) 108.1%
Other Changes in Net PositionState debt service commitment for principal 281.6 103.4 178.2 172.3%Capital gifts and grants 1.4 5.1 (3.7) (72.5)%Other (0.3) (8.5) 8.2 (96.5)% Net Other Changes in Net Position 282.7 100.0 182.7 182.7%
Increase in Net Position 190.1 55.5 134.6 242.5%
Net Position – Beginning of Year 1,053.1 997.6 55.5 5.6%Net Position – End of Year $ 1,243.2 $ 1,053.1 $ 190.1 18.1%
2017 2016 $ Change % Change
University of Connecticut June 30, 2017
17
Sales and services of auxiliary enterprises, net of scholarship allowances, showed an overall decrease of $0.6 million. This included a decrease of $2.9 million in revenues from athletics programs due largely to reduced conference distributions and lower ticket revenues. An additional decrease of $2.4 million was attributed to reductions in both room occupancy and non-board dining revenues. These decreases were offset by a one-time receipt of $4.7 million for insurance proceeds from a claim related to an auxiliary building complex.
Other operating revenues increased $0.9 million. This
was primarily due to an increase in renewable energy credits related the University’s energy conservation programs.
Revenues under nonoperating and other changes in net position increased $175.3 million based on the following: State appropriations decreased by $10.6 million,
including decreases to funding for education and general, research, and Next Generation Connecticut activities. The decrease in appropriation was the result of the State’s concerns regarding its fiscal year 2017 budget.
The State commits to pay for interest incurred on
general obligation bonds issued by the University for capital purposes and for UConn Health projects (see
Note 7). Effectively, this revenue offsets a significant portion of interest expense each year, and the noted increase in revenue from interest corresponds with a related increase in interest expense. Also, as general obligation bonds are issued, the State commits to the repayment of the future principal amounts. The increase in revenue related to the repayment of principal was due in part to a larger proportion of bond proceeds designated for University projects reduced by amounts allocated for UConn Health projects. Furthermore, there was a greater amount of proceeds related to debt issued in the current year and recorded as revenue compared with proceeds used to directly refund debt that existed in the previous fiscal year.
Gifts and investment income decreased $0.2 million,
mainly due to a reduction in gifts received from the University of Connecticut Foundation. Total gift revenue decreased $1.7 million offset by an increase in investment income of $1.5 million. Investment income increased due to higher interest rates for funds held in the State’s short-term investment fund.
Capital gifts and grants decreased $3.7 million. The
change was mainly due to property that was acquired through the dissolution of the University of Connecticut Alumni Association in fiscal year 2016, offset by a gift received for the Law School Campus Center Library in the current year.
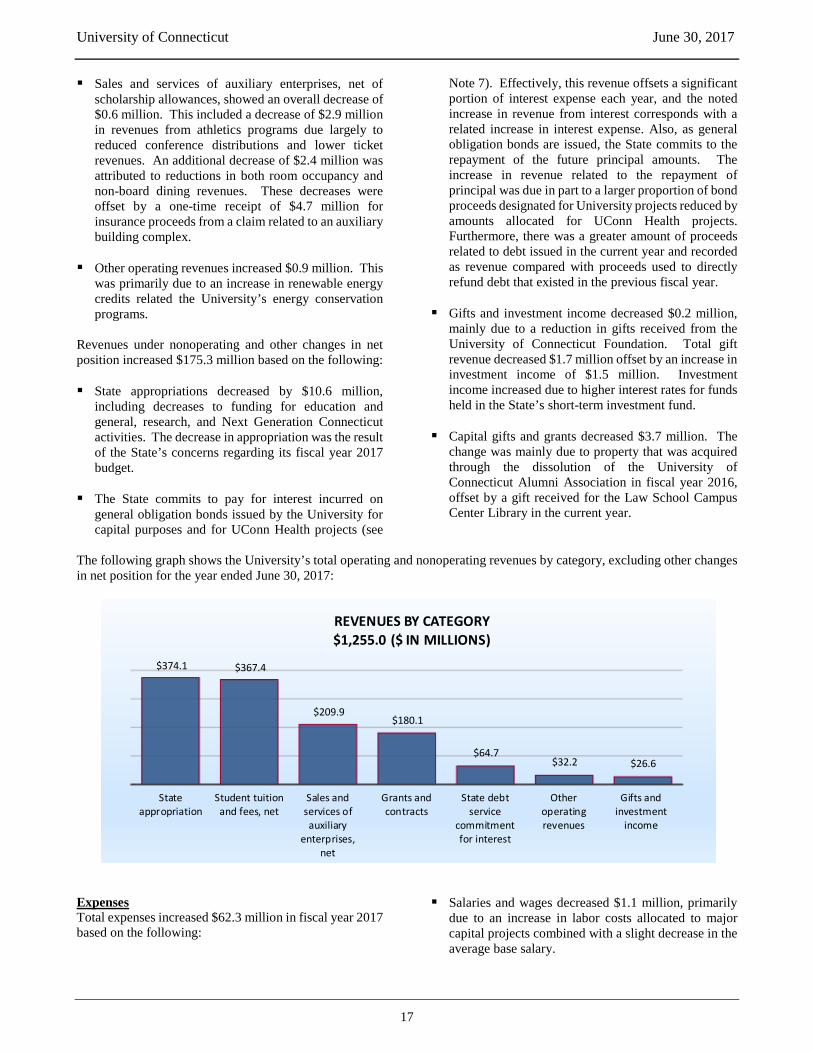
The following graph shows the University’s total operating and nonoperating revenues by category, excluding other changes in net position for the year ended June 30, 2017:
Expenses Total expenses increased $62.3 million in fiscal year 2017 based on the following:
Salaries and wages decreased $1.1 million, primarily due to an increase in labor costs allocated to major capital projects combined with a slight decrease in the average base salary.
Stateappropriation
Student tuitionand fees, net
Sales andservices ofauxiliary
enterprises,net
Grants andcontracts
State debtservice
commitmentfor interest
Otheroperatingrevenues
Gifts andinvestment
income
$374.1 $367.4
$209.9 $180.1
$64.7 $32.2 $26.6
REVENUES BY CATEGORY$1,255.0 ($ IN MILLIONS)
University of Connecticut June 30, 2017
18
Fringe benefits increased $61.7 million due to a significant increase in the collective pension expense for the State Employees’ Retirement System (SERS). The majority of this increase was attributed to changes in experience data and economic assumptions used to calculate the total pension liability.
Supplies and other expenses decreased $0.5 million
due to the following:
Instruction expenses decreased $1.8 million due to a reduction in purchases of noncapital equipment for classrooms and the relocation of the Roper Center.
Research expenses were higher by $1.0 million due
to increases in sub-awards, animal care expenses, and laboratory supplies.
Public service expenses were lower by $2.7 million,
mainly due to a reduction in costs related to nonrecurring federal programs.
Institutional support increased $4.7 million due to
noncapital expenditures related to software implementations that took place in the current year, including the Core-CT payroll system project, and an increase in professional services such as advertising and recruitment.
Auxiliary enterprises reflected expenses that were
lower by $1.3 million due to a decrease in commodities purchased offset by an increase in facilities maintenance costs.
Depreciation and amortization expense increased $6.0 million due to a significant increase in depreciable assets, including the Next Generation Residence Hall, and the Monteith and Putnam Refectory Renovations.
Utilities expense decreased $0.7 million, mainly due to
lower gas costs resulting from participation in the Energy Savings Performance Contracting program. This was offset by higher water costs resulting from steam costs associated with the new downtown Hartford campus.
Scholarships and fellowships decreased $0.6 million,
primarily due to a reduction in tuition charged to grants offset by an increase in the Next Generation STEM scholarship commitment and University-provided aid.
Interest expense increased $7.8 million due to a full
year of interest expense on the 2016 General Obligation Bonds and interest expense on new debt issued in fiscal year 2017. This was partially offset by decreases in interest on remaining bonds due to lower principal balances. Other nonoperating expenses, which consists mainly of bond issuance costs and fair market value adjustments, decreased $2.1 million. This was primarily due to an increase in unrealized gains on the University’s endowment investments combined with one-time insurance recoveries received and a decrease in legal fees from the prior year.
Other expenses under other changes in net position
decreased $8.2 million in fiscal year 2017. This was mainly due to the disposal of the Connecticut Commons complex in fiscal year 2016 combined with an increase in additions to permanent endowments.
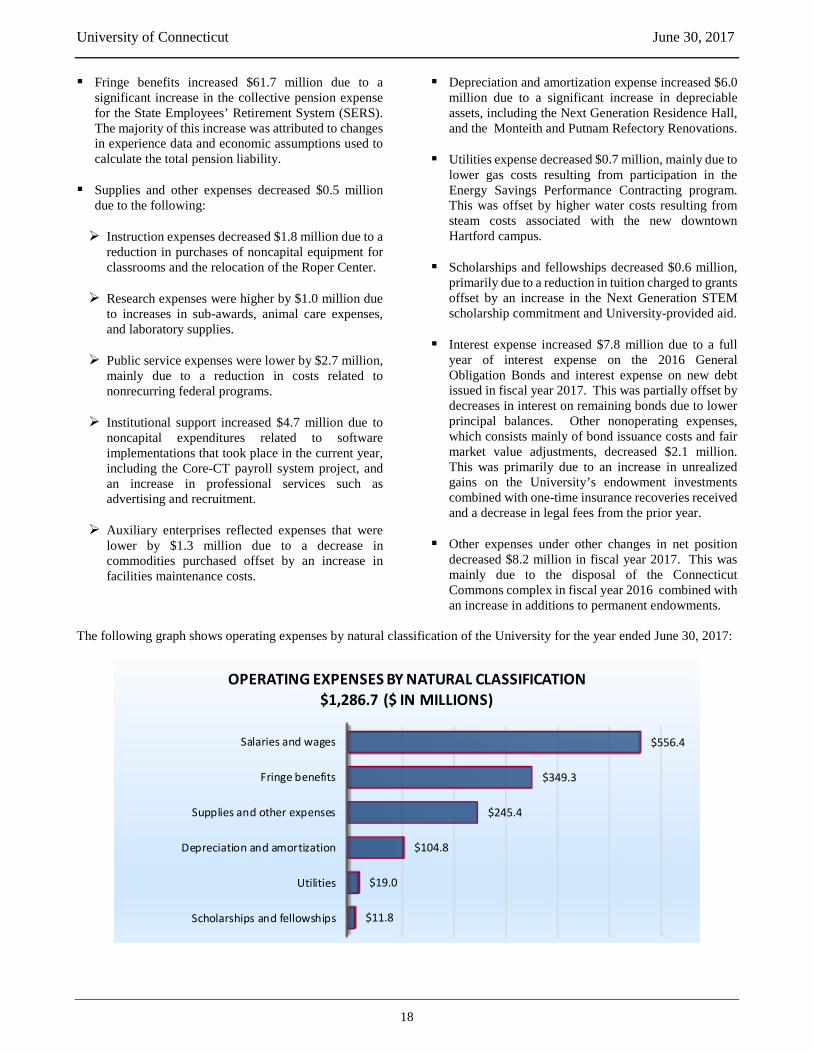
The following graph shows operating expenses by natural classification of the University for the year ended June 30, 2017:
Salaries and wages
Fringe benefits
Supplies and other expenses
Depreciation and amortization
Utilities
Scholarships and fellowships
$556.4
$349.3
$245.4
$104.8
$19.0
$11.8
OPERATING EXPENSES BY NATURAL CLASSIFICATION$1,286.7 ($ IN MILLIONS)

University of Connecticut June 30, 2017
19
The University’s operating expenses by functional classification are presented below for the year ended June 30, 2017:
STATEMENT OF NET POSITION The Statement of Net Position presents the assets, deferred outflows of resources, liabilities, deferred inflows of resources, and net position of the University as of the end of the fiscal year. The Statement of Net Position is a point in time financial statement and is used as a measure of the financial condition of the University. This statement presents a snapshot concerning assets classified as current (those available for use within one year) and noncurrent (those available beyond one year), liabilities categorized as current (those maturing and due within one year) and noncurrent (those maturing and due after one year), and net position. Assets represent what is owned by or what is owed to the University, including payments made to others before a service was received. Assets are recorded at their current value except for property and equipment, which is recorded at historical cost, net of accumulated depreciation and amortization. Liabilities represent what is owed to others or what has been received from others prior to services being provided by the University. A deferred outflow of resources represents the consumption of net assets by the University that is applicable to a future reporting period, whereas a deferred inflow of resources is an acquisition of net assets by the University that is applicable to a future reporting period. The University’s net position is the residual value in assets and deferred outflows after liabilities and deferred inflows are deducted. Over time, an increase in net position is an indicator of the University’s improving financial strength. Assets Total assets increased $396.1 million in fiscal year 2017. Current assets decreased $0.8 million, whereas property
and equipment, net, increased $205.9 million and noncurrent assets increased $191.0 million. The change in current assets was due to the following: Cash and cash equivalents increased $40.2 million,
which corresponds with higher operating revenues and unearned revenues over the prior year.
Due from State decreased $54.9 million, primarily
as a result of capital expenditures paid by State general obligation bonds for the technology park during fiscal year 2017.
The current portion of the State debt service
commitment increased $18.2 million, attributable to the issuance of new general obligation bonds and an increase in interest expense, offset by principal payments and refundings.
Deposit with bond trustee decreased $6.7 million
due to additional drawdowns for capital expenditures in fiscal year 2017 compared to the prior year.
Prepaid expenses and other assets also increased
$2.2 million, primarily due to an increase in prepaid library subscriptions and prepaid advertising costs.
There was a net increase in capital assets of $205.9
million, which is made up of $312.1 million in additions offset by $104.8 million of depreciation and $1.4 million of disposals. The large additions are mostly due to the University’s active construction program.
Instruction
Auxiliary enterprises
Academic support
Operations and maintenance of plant
Depreciation and amortization
Research
Institutional support
Public service
Student services
Scholarships and fellowships
$419.3
$227.8
$138.9
$137.3
$104.8
$80.9
$74.2
$53.1
$40.1
$10.3
OPERATING EXPENSES BY FUNCTIONAL CLASSIFICATION$1,286.7 ($ IN MILLIONS)

University of Connecticut June 30, 2017
20
Other noncurrent assets increased due to the following:
The long-term portion of the State debt service commitment increased $189.8 million. This increase corresponds with the increase in long-term debt related to the issuance of the 2017 general obligation bonds.
Investments increased $1.4 million, primarily due to $1.1 million in additions to permanent endowments. Fair market values for endowments also increased offset by a decrease in the market value of corporate stock held by the University.
The following table shows a Condensed Schedule of Net Position at June 30 ($ in millions):
The following graph shows total assets by major category:
Current assets $ 822.7 $ 823.5 $ (0.8) (0.1)%1,904.1 1,698.2 205.9 12.1%1,411.3 1,220.3 191.0 15.7%
Total Assets 4,138.1 3,742.0 396.1 10.6%
446.3 206.9 239.4 115.7%
471.0 554.6 (83.6) (15.1)%2,866.0 2,337.0 529.0 22.6%
Total Liabilities 3,337.0 2,891.6 445.4 15.4%
4.2 4.2 - 0.0%
1,557.5 1,365.9 191.6 14.0%14.5 12.6 1.9 15.1%
125.7 76.6 49.1 64.1%(454.5) (402.0) (52.5) 13.1%
Total Net Position $ 1,243.2 $ 1,053.1 $ 190.1 18.1%
Deferred Inflows of Resources
2017 2016 $ Change % ChangeAssets
Property and equipment, netOther noncurrent assets
Deferred Outflows of Resources
LiabilitiesCurrent liabilitiesNoncurrent liabilities
Net PositionNet investment in capital assetsRestricted nonexpendableRestricted expendableUnrestricted
Cash and cash equivalents, $368.5
Receivables, $169.1
Deposit with bond trustee, $142.4
State debt service commitment,
$1,531.4
Property and equipment, net,
$1,904.1 Other, $22.6
TOTAL ASSETS AS OF JUNE 30, 2017$4,138.1 ($ IN MILLIONS)

University of Connecticut June 30, 2017
21
The following graph shows total liabilities by major category:
Liabilities Total liabilities increased $445.4 million in fiscal year 2017. Current liabilities decreased $83.6 million, whereas noncurrent liabilities increased $529.0 million. Current liabilities decreased due to the following: Accounts payable and due to affiliate decreased
$25.7 million and $76.7 million, respectively, attributable to capital project costs associated with UConn Health’s Bioscience Connecticut project nearing completion.
Unearned revenue increased by $9.4 million, which
corresponds with increases in student enrollment, combined with higher tuition and fee rates as well as an increase in athletic sponsorships and commitments received in advance of the next fiscal year.
The University’s current portion of debt payable
also increased $8.6 million. This was primarily due to new general obligation bonds issued during the year, offset by debt refundings and a decrease in the Nathan Hale Inn note payable that was paid in full in fiscal year 2017.
Noncurrent liabilities increased due to the following: Long-term debt increased $205.1 million resulting
from issuances of new general obligation bonds offset by refundings and repayments in fiscal year 2017.
Pension liabilities also increased $321.3 million,
mostly due to changes in the actuarial calculation of
the total pension liability for SERS combined with a slight increase in the University’s proportionate share of the collective net pension liability.
Deferred Outflows and Deferred Inflows of Resources Deferred outflows of resources increased $239.4 million, mainly due to pension-related adjustments, including changes in assumptions, increases from differences between expected versus actual experience, and investment losses offset by a decrease for amortization of changes in proportion. Deferred inflows decreased primarily due to the amortization of revenue related to the University’s bookstore service concession arrangement. Net Position Net position is divided into three major categories. The first category, net investment in capital assets, represents the University’s equity in property and equipment. The second category, restricted net position, is subdivided into nonexpendable and expendable. The corpus of restricted nonexpendable resources is only available for investment purposes and is included with investments in the University’s Statement of Net Position. Expendable restricted net position is available for expenditure by the institution. However, it must be spent for purposes determined by donors or external entities that have placed time or purpose restrictions on the use of the assets. The final category is unrestricted net position, representing funds available to the University for any lawful purpose of the institution. Generally, unrestricted funds are internally assigned to academic and research programs, capital programs, retirement of debt, and auxiliary enterprise activities.
Accounts payable and other accruals,
$156.7 Payroll liabilities,
$121.8
Due to affiliate, $11.5
Debt payable, $1,855.7
Noncurrent pension liabilities, $1,131.4
Unearned revenue and other, $59.9
TOTAL LIABILITIES AS OF JUNE 30, 2017$3,337.0 ($ IN MILLIONS)
University of Connecticut June 30, 2017
22
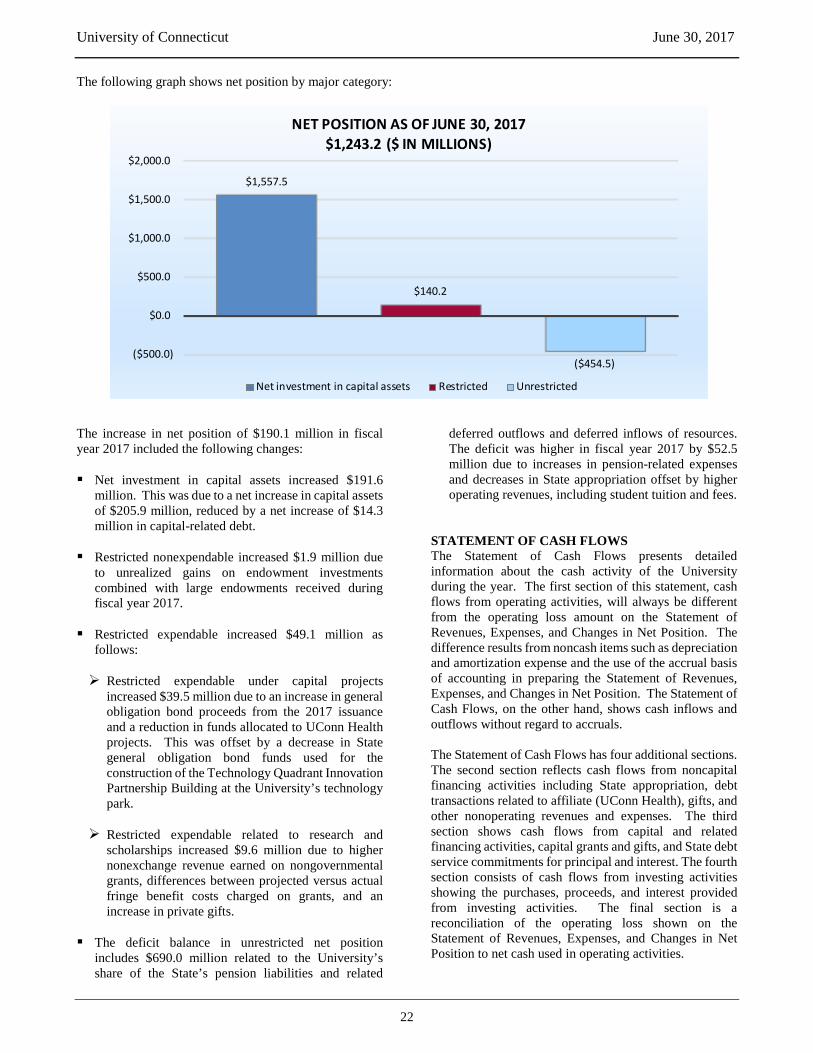
The following graph shows net position by major category:
The increase in net position of $190.1 million in fiscal year 2017 included the following changes: Net investment in capital assets increased $191.6
million. This was due to a net increase in capital assets of $205.9 million, reduced by a net increase of $14.3 million in capital-related debt.
Restricted nonexpendable increased $1.9 million due
to unrealized gains on endowment investments combined with large endowments received during fiscal year 2017.
Restricted expendable increased $49.1 million as
follows:
Restricted expendable under capital projects increased $39.5 million due to an increase in general obligation bond proceeds from the 2017 issuance and a reduction in funds allocated to UConn Health projects. This was offset by a decrease in State general obligation bond funds used for the construction of the Technology Quadrant Innovation Partnership Building at the University’s technology park.
Restricted expendable related to research and
scholarships increased $9.6 million due to higher nonexchange revenue earned on nongovernmental grants, differences between projected versus actual fringe benefit costs charged on grants, and an increase in private gifts.
The deficit balance in unrestricted net position
includes $690.0 million related to the University’s share of the State’s pension liabilities and related
deferred outflows and deferred inflows of resources. The deficit was higher in fiscal year 2017 by $52.5 million due to increases in pension-related expenses and decreases in State appropriation offset by higher operating revenues, including student tuition and fees.
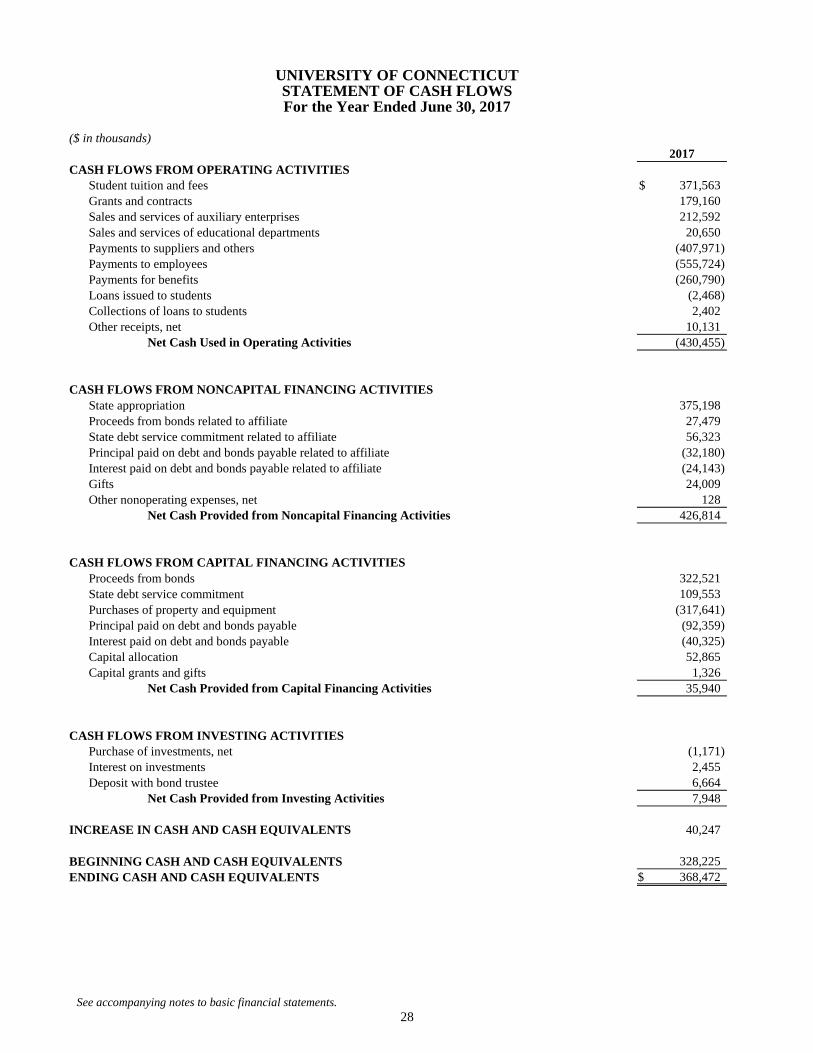
STATEMENT OF CASH FLOWS The Statement of Cash Flows presents detailed information about the cash activity of the University during the year. The first section of this statement, cash flows from operating activities, will always be different from the operating loss amount on the Statement of Revenues, Expenses, and Changes in Net Position. The difference results from noncash items such as depreciation and amortization expense and the use of the accrual basis of accounting in preparing the Statement of Revenues, Expenses, and Changes in Net Position. The Statement of Cash Flows, on the other hand, shows cash inflows and outflows without regard to accruals. The Statement of Cash Flows has four additional sections. The second section reflects cash flows from noncapital financing activities including State appropriation, debt transactions related to affiliate (UConn Health), gifts, and other nonoperating revenues and expenses. The third section shows cash flows from capital and related financing activities, capital grants and gifts, and State debt service commitments for principal and interest. The fourth section consists of cash flows from investing activities showing the purchases, proceeds, and interest provided from investing activities. The final section is a reconciliation of the operating loss shown on the Statement of Revenues, Expenses, and Changes in Net Position to net cash used in operating activities.
($500.0)
$0.0
$500.0
$1,000.0
$1,500.0
$2,000.0
$1,557.5
$140.2
($454.5)
NET POSITION AS OF JUNE 30, 2017$1,243.2 ($ IN MILLIONS)
Net investment in capital assets Restricted Unrestricted

University of Connecticut June 30, 2017
23
CAPITAL ACTIVITIES Property and equipment, net of accumulated depreciation and amortization, consisted of the following ($ in millions):
Construction in progress increased approximately
$99.2 million as construction continued on the Technology Quadrant Innovation Partnership Building, the Engineering and Science Building, the Hartford campus relocation, and other projects. Approximately $125.8 million was transferred from construction in progress to non-structural improvements and buildings and improvements.
Art and historical collections decreased by $0.1
million, representing approximately $40,000 in additions and $130,000 in disposals.
Non-structural improvements increased by $13.3
million. Additions totaling $22.3 million included infrastructure for the Next Generation Residence Hall, the Sewer Line Replacement at Storrs Road Pump Station, the North Hillside Road Completion, and other projects. These additions were offset by depreciation expense of $9.0 million.
Buildings and improvements increased by $96.0
million. Additions of $163.5 million included the Next Generation Residence Hall, the Monteith Renovation, the Putnam Refectory Renovation, the Heating Plant Upgrade, the Young Building Addition, and other renovation projects. These additions were offset by depreciation expense of $67.3 million and net disposals of $145,000.
Intangible assets increased by $1.6 million. Additions of $6.5 million included costs associated with the Core-CT payroll system and other software implementations offset by amortization expense of $4.9 million.
Library materials decreased by $5.1 million.
Additions of approximately $408,000 were offset by $5.5 million in depreciation expense.
Equipment increased by $1.0 million. Additions of
$20.3 million were offset by depreciation expense and net asset disposals of $19.3 million.
In conjunction with the Hartford campus relocation,
the University executed an agreement in July 2016 to transfer land, buildings, and related infrastructure to the Town of West Hartford. As of the date of these financial statements, a final selling price and other terms related to the agreement are still under negotiation. The closing and transfer of title is anticipated to occur after December 15, 2017.
See also Note 4 in the financial statements for details related to capital activities.
% Change
Land $ 20.7 $ 20.7 $ - 0.0%Construction in progress 404.4 305.2 99.2 32.5%Art and historical collections 55.0 55.1 (0.1) (0.2)%Non-structural improvements 146.1 132.8 13.3 10.0%Buildings and improvements 1,174.7 1,078.7 96.0 8.9%Intangible assets 11.5 9.9 1.6 16.2%Library materials 7.9 13.0 (5.1) (39.2)%Equipment 83.8 82.8 1.0 1.2% Total Property and Equipment, Net $ 1,904.1 $ 1,698.2 $ 205.9 12.1%
2017 2016 $ Change

University of Connecticut June 30, 2017
24
DEBT ACTIVITIES The University issues general obligation bonds in its own name for a special capital improvement program (UCONN 2000) designed to modernize and expand the physical plant of the University. As amended, it provides for a capital budget program in three phases for the University and UConn Health, with an estimated total cost of $4.6 billion. In fiscal year 2017, the Governor proposed a budget deferring $334.1 million in UCONN 2000 authorizations and extending the program three years to 2027. The State has made a commitment to fund the University for all principal and interest payments due on UCONN 2000 general obligation debt. As the general obligation debt is incurred, the commitment from the State is recorded as a current and noncurrent receivable in the Statement of Net Position.
In fiscal year 2017, the University issued UCONN 2000 general obligation bonds with a combined face value of $345.2 million, of which $27.5 million was committed to UConn Health for its UCONN 2000 projects. This issuance included the refunding of the general obligation 2007 Refunding Series A bonds. Revenue bonds noted in the graph below relate to special obligation bonds issued and with debt service paid by the University. These bonds are secured by certain pledged revenues. There were no special obligation bonds issued or refunded in fiscal year 2017. See also Note 7 in the financial statements for details related to debt activities.
The following graph illustrates total debt by category, exclusive of premiums and discounts:
ECONOMIC OUTLOOK The University continues to face fiscal uncertainty given the difficulties the State is experiencing with its 2018 budget. In June 2017, the University’s Board of Trustees adopted a preliminary budget of $1.3 billion for fiscal year 2018 in order to move forward into the next fiscal year. The adopted budget relies heavily on revenue from tuition, fees, and State support. However, future reductions in State support are likely depending on how the State plans to balance its budget and address the current economic crisis. On July 31, 2017, the State Legislature approved the State Employees’ Bargaining Agent Coalition (SEBAC) 2017 agreement that was ratified by union membership. In addition, contracts were ratified for all of the University’s bargaining units participating in SEBAC. The SEBAC 2017 agreement includes changes to employee healthcare benefits, retirement plans, and future wage adjustments,
resulting in cost-savings that are expected to offset ongoing increases to fringe benefit costs. The decline in State support and rising costs are forcing the University to shift from expanding its academic and research initiatives to focusing on maintaining its current financial position. The fiscal year 2018 budget avoids raising tuition above the rate that was already approved in the four-year plan that went into effect in fall 2016. Although enrollment is expected to increase at the new downtown Hartford regional campus and at the Stamford regional campus, overall enrollment for the University over the next two years is expected to remain level. The downtown Hartford campus opened in August 2017 and is a major component of the Governor’s Next Generation Connecticut initiative to expand STEM education. New student housing also opened at the Stamford regional campus for the fall 2017 semester and will accommodate approximately 300 students annually.
General obligation bonds, $1,505.0
Revenue bonds, $106.0
Obligation under capital lease for
cogeneration, $42.8
Other debt, $0.1
TOTAL DEBT AS OF JUNE 30, 2017$1,653.9 ($ IN MILLIONS)
University of Connecticut June 30, 2017
25
In fiscal year 2018, the University plans to award $122.4 million in University-funded financial aid to students in addition to the state, federal, and private aid for which they may qualify. Of this amount, $69.3 million is earmarked for need-based aid. Despite fiscal challenges, the University continues to be one of the top-rated public universities in New England and the nation. Applications have reached record highs
for the past several years, the number of class offerings has increased by 33 percent, and in fiscal year 2017 the University graduated more students than ever before in its history. These accomplishments are the direct result of the University’s commitment to preserve academic excellence, fund key priorities in support of teaching and research, provide strong student support, and deliver a high standard of service to its students, faculty, staff, and the citizens of the State.
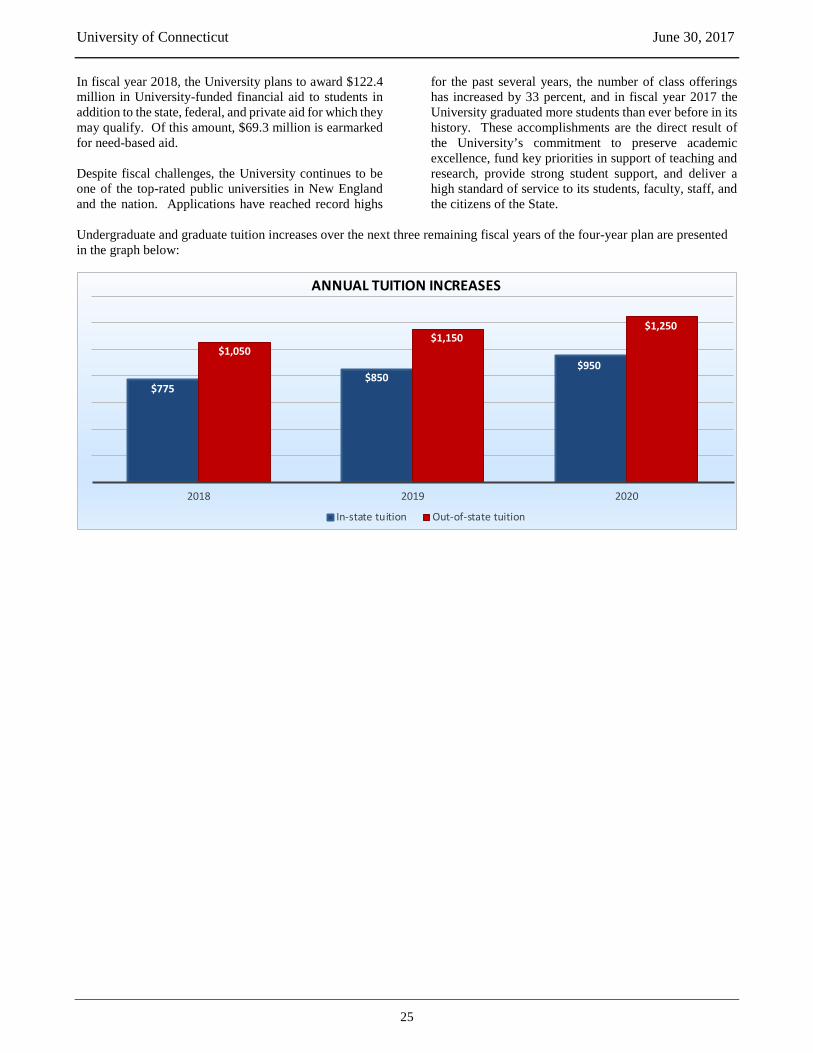
Undergraduate and graduate tuition increases over the next three remaining fiscal years of the four-year plan are presented in the graph below:
$775 $850
$950 $1,050
$1,150 $1,250
2018 2019 2020
ANNUAL TUITION INCREASES
In-state tuition Out-of-state tuition

See accompanying notes to basic financial statements. 26
ASSETSCurrent Assets
Cash and cash equivalents $ 368,472 Accounts receivable, net 57,460 Student loans receivable, net 2,293 Due from State of Connecticut 97,993 Due from related agencies 763 State debt service commitment 145,663 Inventories 792 Deposit with bond trustee 142,418 Prepaid expenses and other assets 6,830
Total Current Assets 822,684 Noncurrent Assets
Investments 15,045 Student loans receivable, net 10,591 State debt service commitment 1,385,710 Property and equipment, net 1,904,088
Total Noncurrent Assets 3,315,434 Total Assets 4,138,118
DEFERRED OUTFLOWS OF RESOURCES 446,264
LIABILITIESCurrent Liabilities
Accounts payable 116,141 Unearned revenue 46,484 Deposits held for others 1,553 Wages payable 56,520 Compensated absences 23,903 Due to State of Connecticut 28,981 Due to affiliate 11,480 Current portion of long-term debt and bonds payable 145,357 Other current liabilities 40,535
Total Current Liabilities 470,954 Noncurrent Liabilities
Compensated absences 12,380 Long-term debt and bonds payable 1,710,386 Federal refundable loans 11,906 Pension liabilities 1,131,370
Total Noncurrent Liabilities 2,866,042 Total Liabilities 3,336,996
DEFERRED INFLOWS OF RESOURCES 4,141
NET POSITIONNet investment in capital assets 1,557,469 Restricted nonexpendable 14,483 Restricted expendable
Research, instruction, scholarships, and other 34,058 Loans 2,543 Capital projects and debt service 89,146
Unrestricted (454,454)Total Net Position $ 1,243,245
UNIVERSITY OF CONNECTICUTSTATEMENT OF NET POSITION
As of June 30, 2017 ($ in thousands)
2017
See accompanying notes to basic financial statements. 27
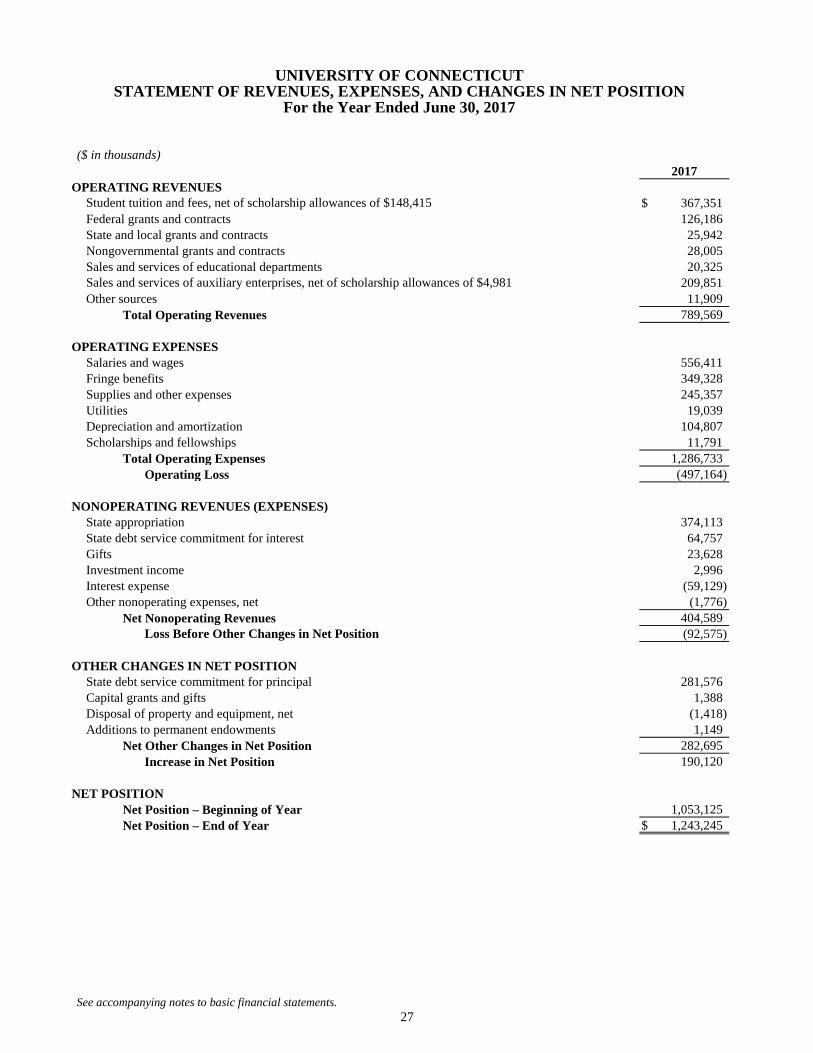
OPERATING REVENUES$ 367,351
Federal grants and contracts 126,186 State and local grants and contracts 25,942 Nongovernmental grants and contracts 28,005 Sales and services of educational departments 20,325
209,851 Other sources 11,909
Total Operating Revenues 789,569
OPERATING EXPENSESSalaries and wages 556,411 Fringe benefits 349,328 Supplies and other expenses 245,357 Utilities 19,039 Depreciation and amortization 104,807 Scholarships and fellowships 11,791
Total Operating Expenses 1,286,733 Operating Loss (497,164)
NONOPERATING REVENUES (EXPENSES)State appropriation 374,113 State debt service commitment for interest 64,757 Gifts 23,628 Investment income 2,996 Interest expense (59,129) Other nonoperating expenses, net (1,776)
Net Nonoperating Revenues 404,589 (92,575)
OTHER CHANGES IN NET POSITIONState debt service commitment for principal 281,576 Capital grants and gifts 1,388 Disposal of property and equipment, net (1,418) Additions to permanent endowments 1,149
Net Other Changes in Net Position 282,695 Increase in Net Position 190,120
NET POSITIONNet Position – Beginning of Year 1,053,125 Net Position – End of Year $ 1,243,245
2017
Student tuition and fees, net of scholarship allowances of $148,415
Sales and services of auxiliary enterprises, net of scholarship allowances of $4,981
Loss Before Other Changes in Net Position
UNIVERSITY OF CONNECTICUTSTATEMENT OF REVENUES, EXPENSES, AND CHANGES IN NET POSITION
For the Year Ended June 30, 2017
($ in thousands)
See accompanying notes to basic financial statements. 28
($ in thousands)
CASH FLOWS FROM OPERATING ACTIVITIESStudent tuition and fees $ 371,563 Grants and contracts 179,160 Sales and services of auxiliary enterprises 212,592 Sales and services of educational departments 20,650 Payments to suppliers and others (407,971) Payments to employees (555,724) Payments for benefits (260,790) Loans issued to students (2,468) Collections of loans to students 2,402 Other receipts, net 10,131
(430,455)
State appropriation 375,198 Proceeds from bonds related to affiliate 27,479 State debt service commitment related to affiliate 56,323 Principal paid on debt and bonds payable related to affiliate (32,180) Interest paid on debt and bonds payable related to affiliate (24,143) Gifts 24,009 Other nonoperating expenses, net 128
426,814
Proceeds from bonds 322,521 State debt service commitment 109,553 Purchases of property and equipment (317,641) Principal paid on debt and bonds payable (92,359) Interest paid on debt and bonds payable (40,325) Capital allocation 52,865 Capital grants and gifts 1,326
35,940
CASH FLOWS FROM INVESTING ACTIVITIESPurchase of investments, net (1,171) Interest on investments 2,455 Deposit with bond trustee 6,664
7,948
40,247
BEGINNING CASH AND CASH EQUIVALENTS 328,225 ENDING CASH AND CASH EQUIVALENTS $ 368,472
INCREASE IN CASH AND CASH EQUIVALENTS
UNIVERSITY OF CONNECTICUTSTATEMENT OF CASH FLOWSFor the Year Ended June 30, 2017
2017
Net Cash Used in Operating Activities
CASH FLOWS FROM NONCAPITAL FINANCING ACTIVITIES
Net Cash Provided from Noncapital Financing Activities
CASH FLOWS FROM CAPITAL FINANCING ACTIVITIES
Net Cash Provided from Capital Financing Activities
Net Cash Provided from Investing Activities

See accompanying notes to basic financial statements. 29
($ in thousands)
RECONCILIATION OF OPERATING LOSS TO NET CASH USED IN OPERATING ACTIVITIES
Operating Loss $ (497,164) Adjustments to Reconcile Operating Loss to Net Cash
Provided from (Used in) Operating ActivitiesDepreciation and amortization expense 104,807 Property and equipment 7,914 Investment (247) In-kind workers' compensation 1,214 Obligations under capital leases 98
Changes in Assets and LiabilitiesReceivables, net 1,124 Inventories 143 Prepaid expenses and other assets (2,198)
(7,662) Unearned revenue 9,438 Deposits (1,242) Due from (to) State of Connecticut, net 1,698 Due to affiliate (123,288)
80,129 Other liabilities (5,421) Loans to students 202
Net Cash Used in Operating Activities $ (430,455)
Proceeds from refunding bonds $ 36,960 $ 13,018
Loss on disposal of capital assets $ (1,418)
ACCOMPANYING SCHEDULE OF SIGNIFICANT NONCASH TRANSACTIONS
Amortization of premiums, discounts, and net loss on debt refundings
UNIVERSITY OF CONNECTICUTSTATEMENT OF CASH FLOWS (Continued)
For the Year Ended June 30, 2017
2017
Accounts payable, wages payable, and compensated absences
Pension liabilities and related deferred outflows/inflows

See accompanying notes to basic financial statements. 30
($ in thousands)
ASSETSCurrent Assets
Cash and cash equivalents $ 23,660 Pledges receivable, net 240 Other current assets 36
Total Current Assets 23,936
Noncurrent AssetsPledges receivable, net 252
Total Assets 24,188
LIABILITIES AND NET ASSETSCurrent Liabilities
Accounts payable 35
Net AssetsUnrestricted 1,736 Temporarily restricted 7,387 Permanently restricted 15,030
Total Net Assets 24,153 Total Liabilities and Net Assets $ 24,188
($ in thousands)
UnrestrictedTemporarily
RestrictedPermanently
Restricted TotalREVENUES AND SUPPORT
Contributions and grants 313$ 424$ 585$ 1,322$ Interest and dividends 23 441 - 464 Net realized and unrealized gains 64 1,333 - 1,397 Net assets released from restrictions 1,746 (1,746) - -
Total Revenues and Support 2,146 452 585 3,183
EXPENSESProgram Expenses
Student support and faculty support 1,229 - - 1,229 Scholarships and awards 275 - - 275 Alumni and graduate relations 92 - - 92
Total Program Expenses 1,596 - - 1,596 Support Expenses
Management and general 492 - - 492 Fundraising 52 - - 52
Total Support Expenses 544 - - 544 Total Expenses 2,140 - - 2,140
Changes in Net Assets 6 452 585 1,043
Net Assets – Beginning of Year 1,730 6,935 14,445 23,110 Net Assets – End of Year 1,736$ 7,387$ 15,030$ 24,153$
For the Year Ended June 30, 2017
UNIVERSITY OF CONNECTICUTTHE UNIVERSITY OF CONNECTICUT LAW SCHOOL FOUNDATION, INC.
STATEMENT OF FINANCIAL POSITIONAs of June 30, 2017
2017
STATEMENT OF ACTIVITIES

University of Connecticut June 30, 2017
31
Notes to Financial Statements For the Year Ended June 30, 2017
NOTE 1. SUMMARY OF SIGNIFICANT ACCOUNTING POLICIES Reporting Entity The University of Connecticut, a comprehensive institution for higher education governed by a 21-member Board of Trustees, serves as the flagship for higher education in the State of Connecticut (State). This institution is composed of programs based in Storrs and at the regional campuses, the School of Law, the School of Social Work, and the University of Connecticut Health Center (UConn Health). UConn Health is a fiscally independent branch, defined in State statute as a health care institution, that oversees clinical care, advanced biomedical research, and academic education in medicine. Separate for purposes of audit and financial reporting, UConn Health has its own Board of Directors to whom the Board of Trustees has delegated authority and by State statute is a separate entity for purposes of budgeting, maintaining operating funds, and receiving appropriations from the State. The transactions and balances of UConn Health are not included within this comprehensive annual financial report for the year ended June 30, 2017, and the University of Connecticut (University) is herein defined as all programs except for UConn Health. In accordance with standards issued by the Governmental Accounting Standards Board (GASB), the financial reporting entity consists of the primary government, organizations for which the primary government is financially accountable, and other organizations for which the nature and significance of their relationship with the primary government are such that exclusion would cause the reporting entity's financial statements to be misleading. Legally separate and tax exempt entities shall be presented as component units of the reporting entity if they meet all of the following criteria: the economic resources of the organization are entirely or almost entirely for the direct benefit of the reporting unit; the reporting unit is entitled to access all or a majority of the economic resources received or held by the organization; and the economic resources received or held by the organization are significant to the reporting unit. The financial operations of the University along with those of UConn Health are reported in the State’s comprehensive annual report using the fund structure prescribed by GASB. The State includes the transactions and balances of the University within an enterprise fund under the major business-type activities of the government-wide financial statements, and has noted that State colleges and universities do not possess corporate powers that would distinguish them as being legally separate.
Two related, but independent, corporate entities that support the mission of the University and are also included in the State’s annual report are the University of Connecticut Foundation, Inc. (Foundation) and the University of Connecticut Law School Foundation, Inc. (Law School Foundation). The Foundation raises funds to promote, encourage, and assist education and research at both the University and UConn Health, whereas the Law School Foundation, with similar objectives, supports only the University. Although the Foundation materially supports the mission of both the University and UConn Health, displaying the Foundation’s financial statements as a component unit of either entity individually would distort its actual contribution or economic benefit to that entity. Therefore, the Foundation is not included as a component unit in the accompanying financial statements, but is included as a component unit of the State. The Law School Foundation, which is organized for the benefit of the University with economic resources that can only be used by or for the benefit of the University, is included as a component unit of the University. The Law School Foundation’s audited Statement of Financial Position and Statement of Activities are discretely presented in their original formats on a separate page of the accompanying financial statements. The Law School Foundation’s complete financial statements are available upon request by contacting its administrative office at 55 Elizabeth Street, Hartford, Connecticut, 06105. Financial Statement Presentation The accompanying financial statements have been prepared in conformity with United States generally accepted accounting principles (GAAP), as prescribed by GASB. The University is considered a special-purpose government engaged in business-type activities, defined by GASB as those activities that are financed in whole or in part by fees charged to external parties for goods or services. The University’s financial statements include a Statement of Net Position; a Statement of Revenues, Expenses, and Changes in Net Position; and a Statement of Cash Flows. These financial statements have been prepared using the economic resources measurement focus and the accrual basis of accounting. Revenues are recognized when earned, expenses are recognized when incurred, and all significant intra-agency transactions have been eliminated. Adoption of New Accounting Standards Effective for the University’s fiscal year ended June 30, 2017, GASB issued the following statements that were adopted for this financial report:
University of Connecticut June 30, 2017
32
GASB Statement No. 80, Blending Requirements for Certain Component Units – an amendment of GASB Statement No. 14, requires blended presentation for certain component units identified based on criteria from GASB Statement No. 14, The Financial Reporting Entity. This includes component units that are incorporated as a not-for-profit corporation in which the primary government is the sole member. There was no impact on the University’s component unit presentation related to this issuance.
GASB Statement No. 82, Pension Issues – an
amendment of GASB Statements No. 67, No. 68, and No. 73, specifically addresses issues pertaining to (1) the presentation of payroll-related measures in required supplementary information, (2) the selection of assumptions and the treatment of deviations from the guidance in an Actuarial Standards of Practice for financial reporting purposes, and (3) the classification of any payments made by employers to satisfy employee contribution requirements. There was no significant impact on the accompanying financial statements as a result of this adoption.
Cash Equivalents The University considers all highly liquid investments with an original maturity of three months or less to be cash equivalents. Funds invested in the State of Connecticut Treasurer’s Short-Term Investment Fund (STIF) are also considered cash equivalents, with the exception of those classified as restricted balances included in deposit with bond trustee. Investments The University accounts for its investments at fair value, categorized for disclosure purposes within the fair value hierarchy established by GAAP. The hierarchy is based on the valuation inputs used to measure the fair value of the investment. The three-level hierarchy of inputs is summarized as follows: Level 1 – Quoted prices for identical investments in an
active market. Level 2 – Inputs other than Level 1 that are observable,
such as quoted prices for similar investments in active markets; quoted prices for identical or similar investments in markets that are not active; or inputs other than quoted prices that are observable such as interest rate and yield curves, volatilities, and credit spreads, among others.
Level 3 – Inputs that are unobservable but supported
by the University’s or the Foundation’s own assumptions, taking into consideration the assumptions that market participants would use in pricing the investment. These inputs are developed
based on the best information available under the circumstances.
The net asset value (NAV), or its equivalent, is used to determine the fair value of all investments that do not have a readily determinable fair value. Since they are not readily determinable, the fair values of these investments may differ from the values that would have been used had a ready market for these investments existed. Changes in the unrealized gain or loss on the carrying value of the University’s investments are recorded as nonoperating revenues or expenses in the accompanying Statement of Revenues, Expenses, and Changes in Net Position. Accounts and Student Loans Receivable Accounts receivable consists of tuition, fees, auxiliary enterprises service fees, and amounts due from state and federal governments for grants and contracts. Student loans receivable consists primarily of amounts due from students under the Federal Perkins Loan Program, which are subject to significant restrictions. The receivable for student loans is classified as current and noncurrent based on the amount estimated to be collected from students within one year and beyond one year, respectively. Accounts and student loans receivable are recorded net of an estimated allowance for doubtful accounts. Inventories Maintenance and custodial supplies, repair parts, and other general supplies used in daily operations are expensed when purchased. Inventories classified as available for resale are reported in the accompanying Statement of Net Position and are valued at cost as determined by the first-in, first-out method. Deposit with Bond Trustee Tax-exempt bond proceeds are deposited to various accounts held by the Trustee Bank as required by certain trust indentures. The funds are invested and disbursed as directed by the University. The University’s bond proceeds investment policy is to balance an appropriate risk-return level heavily weighted towards safety of assets, as defined and permitted under the relative indentures and the General Statutes of Connecticut (State General Statutes). The University has directed the Trustee Bank to invest UCONN 2000 General Obligation construction fund proceeds in STIF. Similarly, the University has directed the Trustee Bank to invest the debt service funds and cost of issuance for the special obligation bonds in dedicated STIF accounts. Investment earnings from UCONN 2000 General Obligation Bond proceeds are retained by the State Treasurer’s Office and do not flow to the University or to
University of Connecticut June 30, 2017
33
the Trustee Bank. Investment earnings from Student Fee Revenue Bonds are part of pledged revenues and are directly retained by the Trustee Bank to pay debt service on the bonds or for other indenture permitted purposes. Earnings on the UCONN 2000 General Obligation Debt Service Commitment Refunding Bonds and the Special Obligation Student Fee Revenue Refunding Redemption Fund escrows form part of the irrevocable escrows that are used by the Trustee Bank to meet debt service payments on defeased bonds until called. Property and Equipment Property and equipment are reported at cost at the date of acquisition or, in the case of gifts, at acquisition value. All land is capitalized, regardless of cost. Renovations greater than $100,000 that significantly increase the value or useful life of an asset are capitalized. Routine repairs and maintenance costs are charged to operating expenses in the year incurred. Equipment with a unit value of $5,000 or more and a useful life of more than one year is capitalized. Art and historical collections are recognized at their acquisition values and are not depreciated. The Thomas J. Dodd Research Center at the University maintains historical collections of original source materials used for research and serves as the University’s official archive. New items are added to the collection if their acquisition value can be substantiated by an external appraisal. Depreciation and amortization expenses are recorded on a straight-line basis over the estimated useful lives of the respective assets:
Nonstructural improvements 10 – 50 years Buildings and building components 6 – 60 years Intangible assets 3 – 10 years Library materials 15 years Equipment 3 – 30 years
Most University capital assets are financed through the issuance of general obligation bonds, which are restricted in accordance with State legislation. Additionally, the repayment of interest on these bonds is funded through the State. Therefore, the University generally does not include interest in the cost of the capital assets constructed. Unearned Revenue Unearned revenue includes amounts received for services to be rendered in a future accounting period. This amount is composed primarily of student charges (tuition, fees, room, and board) received in advance of the applicable academic period and amounts received from sponsors related to certain restricted research grants that will not be included in revenue until the funds are expended. It also includes advance ticket sales for sporting events and commitments received in advance of the athletic season.
Compensated Absences Employee vacation, holiday, compensatory, and sick leave are accrued at year-end for financial statement purposes. The recorded liability is included as compensated absences in the accompanying Statement of Net Position and is classified as current and noncurrent based on the amount estimated to be paid to eligible employees in one year and beyond one year, respectively. The related expense is included as operating expense in the accompanying Statement of Revenues, Expenses, and Changes in Net Position. Noncurrent Liabilities Noncurrent liabilities include the long-term portion of compensated absences, principal payments due on bonds (net of unamortized premiums and discounts), loans and capital leases with a maturity of more than one year, pension liabilities, and governmental advances for revolving loan programs required to be returned to the federal government upon cessation of the student loan program. Pension Liabilities The University records its proportionate share of the State’s collective net pension liability and collective pension expense for each defined benefit plan offered to its employees. The collective net pension liability for each plan is measured as the total pension liability less the amount of the pension plan’s fiduciary net position. The total pension liability is the portion of the actuarial present value of projected benefit payments that are attributable to past periods of plan member service. Information about the fiduciary net position as well as additions to and deductions from each pension plan’s fiduciary net position have been determined on the same basis as they are reported by each pension plan. For this purpose, plan member contributions are recognized in the period the contributions are due and employer contributions are recognized in the period the contributions are appropriated. Benefits and refunds are both recognized when due and payable in accordance with the terms of each plan. Investments are reported at fair value. Deferred Outflows and Deferred Inflows of Resources The University reports its proportionate share of collective deferred outflows or collective deferred inflows of resources related to the State’s defined benefit plans. Differences between expected and actual experience in the measurement of the total pension liability, changes in assumptions, changes in proportion, and differences between actual and proportionate share of contributions are classified as either deferred outflows or deferred inflows. These differences and changes are recognized over the average of the expected remaining service lives of employees eligible for pension benefits. The net differences between projected and actual earnings on pension plan investments are reported as deferred outflows or deferred inflows and are recognized over five
University of Connecticut June 30, 2017
34
years. Contributions to the pension plan made by the University subsequent to the measurement date of the net pension liability and before the end of the reporting period are reported as deferred outflows of resources related to pensions. The difference between the reacquisition price and the net carrying amount of refunded bonds is classified as an accumulated net gain or loss in deferred inflows or deferred outflows of resources. Such amounts are amortized as a component of interest expense on a straight-line basis over the life of either the old debt or the new debt, whichever is shorter. The difference between assets and contractual liabilities recorded in connection with a service concession arrangement is also reported as a deferred inflow of resources to be amortized as revenue over the contract term. Net Position GASB requires that resources be classified for accounting and reporting purposes into the following categories of net position: Net investment in capital assets: Capital assets, net
of accumulated depreciation and amortization, reduced by outstanding principal balances of bonds (net of State debt service commitment) and notes that are attributable to the acquisition, construction, or improvement of those assets. Deferred outflows of resources and deferred inflows of resources that are attributable to the acquisition, construction, or improvement of those assets or related debt are also included in this component.
Restricted nonexpendable: Endowment and similar
type assets for which donors or outside sources have stipulated as a condition of the gift instrument that the principal is to be maintained inviolate and in perpetuity. These assets are invested for the purpose of producing present and future income, which may be expended or reinvested in principal.
Restricted expendable: Assets reduced by liabilities
and deferred inflows of resources related to those assets that are expendable but where the University is legally or contractually obligated to spend the resources in accordance with restrictions imposed by external third parties.
Unrestricted: The net amount of assets, deferred
outflows of resources, liabilities, and deferred inflows of resources that do not meet the definition of “restricted” or “net investment in capital assets”. These assets are not subject to externally imposed stipulations, but they may be subject to internal designations. For example, amounts classified as unrestricted may be assigned to specific purposes by action of management or the Board of Trustees, or may
otherwise be limited by contractual agreements with outside parties. In general, all unrestricted amounts in net position are assigned to support academic and research programs, capital projects, retirement of indebtedness, and auxiliary enterprise activities.
The University’s policy regarding whether to first apply restricted or unrestricted resources when an expense is incurred is based on a variety of factors. These factors include consideration of prior or future revenue sources, the type of expense incurred, the University’s budgetary policies surrounding the various revenue sources, and whether the expense is a recurring cost. In order to ensure observance of limitations and restrictions placed on the use of the resources available to the University, the accounts of the University are maintained internally following the principles of fund accounting. This is the procedure by which resources for various purposes are classified for accounting and reporting purposes into funds that are in accordance with specified activities or objectives. Revenues and Expenses The University has classified its revenues and expenses as either operating or nonoperating according to the following criteria: Operating revenues and expenses: Operating
revenues consist of tuition and fees, grants and contracts, sales and services of educational activities, auxiliary enterprises revenue, and other sources of revenue that generally have the characteristics of exchange transactions. GASB Statement No. 33, Accounting and Financial Reporting for Nonexchange Transactions, requires recipients of government-mandated and voluntary nonexchange transactions to recognize revenue when all applicable eligibility requirements are met for these transactions. Restricted grant revenue that does not meet the nonexchange transaction definition is also recognized to the extent expended or, in the case of fixed price contracts, when the contract terms are met or completed. Operating expenses include all expense transactions incurred other than those related to investing or financing, irrespective as to whether the revenues associated with those expenses are classified as operating or nonoperating. These expenses are reported using natural classification, comprehensive of expenses incurred under both educational and general programs and auxiliary enterprises. See also Note 16 for operating expenses presented by functional classification.
Nonoperating revenues and expenses: All other
revenues and expenses of the University are reported as nonoperating revenues and expenses including State appropriation, State debt service commitment for

University of Connecticut June 30, 2017
35
interest, noncapital gifts, investment income, interest expense, net other nonoperating revenues and expenses, and other changes in net position.
Scholarship Discounts and Allowances GASB requires that revenues be reported net of scholarship discounts and allowances, representing the difference between the stated charge for goods and services provided by the University and the amount that is ultimately paid by students or on their behalf. Any aid applied directly to student accounts in payment of tuition and fees, housing charges, and dining services is reflected as a scholarship allowance deducted from the University’s operating revenues. Scholarships and fellowships expense in the accompanying Statement of Revenues, Expenses and Changes in Net Position includes payments made directly to students. Component Unit The Law School Foundation prepares its financial statements on the accrual basis of accounting in accordance with GAAP. Net assets, revenues, and expenses are classified based on the terms of donor-imposed restrictions, if any. Accordingly, the Law School Foundation’s net assets and changes therein are classified and reported as follows: Unrestricted net assets: Net assets that are not
subject to donor-imposed restrictions. Temporarily restricted net assets: Net assets subject
to donor-imposed stipulations that may or will be met, either by actions of the Law School Foundation or passage of time. When the restriction expires, temporarily restricted net assets are reclassified to unrestricted net assets.
Permanently restricted net assets: Net assets subject
to donor-imposed stipulations that they be maintained permanently by the Law School Foundation. Generally, the donors of these assets permit the Law School Foundation to use all or part of the income earned on related investments for general or specific purposes.
Unconditional contributions are recognized as revenue when pledged or received. Conditional promises to give are not recognized as revenue until the conditions on which they depend are substantially met. Investments in marketable debt and equity securities, money market funds, and mutual funds are stated at fair value. On March 6, 2017, the Law School Foundation’s Board of Trustees unanimously approved dissolution of the Law School Foundation as of June 30, 2017. Accordingly, all investments were liquidated prior to the dissolution date. After payment of or provision for all existing Law School Foundation liabilities and with the exception of a nominal amount held to satisfy closing expenses, all remaining
assets were distributed to the UConn Foundation by July 7, 2017. These assets will continue to be managed in accordance with all donor restrictions and for the sole benefit of the University’s Law School. NOTE 2. CASH AND CASH EQUIVALENTS AND INVESTMENTS The University’s total cash and cash equivalents and investments included the following as of June 30, 2017 (amounts in thousands):
Cash and Cash Equivalents Collateralized deposits are protected by State statute. This statute requires that any bank holding public deposits must at all times maintain, segregated from its other assets, eligible collateral in an amount equal to at least a certain percentage of its public deposits. The applicable percentage is determined mainly by the bank’s financial condition, which is measured using ratios of leverage, net worth, and risk-based capital. The collateral is kept in the custody of the trust department of either the pledging bank or another bank in the name of the pledging bank. Portions of the bank balance of the State are insured by the Federal Deposit Insurance Corporation or collateralized. As a State agency, the University benefits from this protection, though the extent to which the deposits of an individual State agency such as the University are protected cannot be readily determined. STIF is a money market investment pool in which the State, municipal entities, and other political subdivisions of the State are eligible to invest. The State Treasurer is authorized to invest monies of STIF in United States government and agency obligations, certificates of deposit, commercial paper, corporate bonds, savings accounts, bankers’ acceptances, repurchase agreements, asset-backed securities, and student loans. The University's cash management investment policy permits the University to invest in STIF, United States Treasury bills, United States Treasury notes and bonds, United States Government Agency obligations, bankers’ acceptances, certificates of deposit (including EURO Dollars), commercial paper, money market funds, repurchase agreements, and savings accounts. Cash and
2017Cash maintained by State Treasurer 340,992$ Invested in STIF 22,169Other deposits 5,311
Total Cash and Cash Equivalents 368,472$
Foundation-managed endowments 14,484$ POET Technologies, Inc. 329UConn Innovations Fund, LLC 232
Total Investments 15,045$
University of Connecticut June 30, 2017
36
cash equivalents includes $22.2 million invested in STIF, which had a Standard and Poor’s rating of AAAm during fiscal year 2017. Foundation-Managed Endowments The University designated the Foundation as the manager of the University's endowment funds. The Foundation makes spending allocation distributions to the University for each participating endowment. The distribution is spent by the University in accordance with the respective purposes of the endowments, the policies and procedures of the University and State statutes, and in accordance with the Foundation’s endowment spending policy described below. The endowment spending policy adopted by the Foundation's Board of Directors, in conjunction with a strategic asset allocation policy for the long-term pooled investment portfolio, is designed to provide reliable growth in annual spending allocation levels and to preserve or increase the real value of the endowment principal over time. To meet these objectives, the Foundation utilizes a total return investment approach, with total return consisting of interest and dividends as well as realized and unrealized gains and losses, net of management fees. The Foundation’s endowment spending allocation policy adheres to the Connecticut Uniform Prudent Management of Institutional Funds Act (UPMIFA). UPMIFA considers prudence in maintaining an endowment fund in perpetuity. Therefore, spending can occur from an endowment fund whose fair value is below its historic value as long as the governing body has determined that its policies will continue the perpetual nature of the endowment over time. An administrative fee is assessed to fund expenses incurred in meeting the Foundation’s fiduciary and fundraising responsibilities to donors and the University. The endowment spending allocation and administrative fee taken together cannot exceed 6.75 percent or fall below 3.00 percent of the fair value of endowment funds at March 31. Should this occur, the calculated amounts will be decreased or increased, respectively, on a pro rata basis. Over the long term, the Foundation expects the current spending allocation and administrative fee policies to allow endowments to grow on average at least at the annualized rate of inflation. This is consistent with the organization’s objective of providing resources for the underlying purposes of its endowment assets over the life of the endowments, whether in perpetuity or for a specified term, as well as to provide additional growth through new gifts and investment return.
University endowment investments are managed by the Foundation in a pooled portfolio that is actively managed by professional investment managers as determined by the Investment Committee of the Foundation’s Board of Directors. The Foundation has established asset allocation guidelines for the pooled investment portfolio, providing that the maximum exposure with any one manager would be 20 percent for actively managed liquid assets and 5 percent for illiquid assets. The Foundation’s Board of Directors also established an asset allocation policy for the long-term pooled investment portfolio. The Foundation expects that portfolios will be invested in only the strategies described in the following table, and not above or below the individual strategy percentage and its total percentage by objective, unless otherwise specified by its Board of Directors.
The endowments invested with the Foundation are subject to risk due to the uncollateralized nature of most of its investments. Certain investments of the Foundation include external investment pools. The bond mutual funds had effective durations of 2.46 years. The University endowment’s foreign publicly traded equities totaled $2.8 million as of June 30, 2017. Private capital investments totaled approximately $1.5 million as of June 30, 2017. Other Investments Certain investments are also held directly by the University. As of June 30, 2017, the University held 1.5 million shares in POET Technologies, Inc. (POET) that were received in previous years in connection with technology licensing and royalty-related transactions. In addition, the University held an ownership interest in UConn Innovation Fund, LLC as of June 30, 2017 (see Note 14). The investment in POET is denominated in Canadian dollars and therefore is subject to foreign currency risk. Foreign currency risk is the risk that investments denominated in foreign currencies may lose value due to adverse fluctuation in the value of the U.S. dollar relative to the foreign currencies.
Investment Objectives and Strategies
Growth Public equity 10% - 60% Private equity 0% - 25%Risk Minimizing Global fixed income 5% - 30% Hedge funds – non-directional 0% - 20%Inflation Hedging Real assets 0% - 10%
Allocation Range as Percentage of Market Value
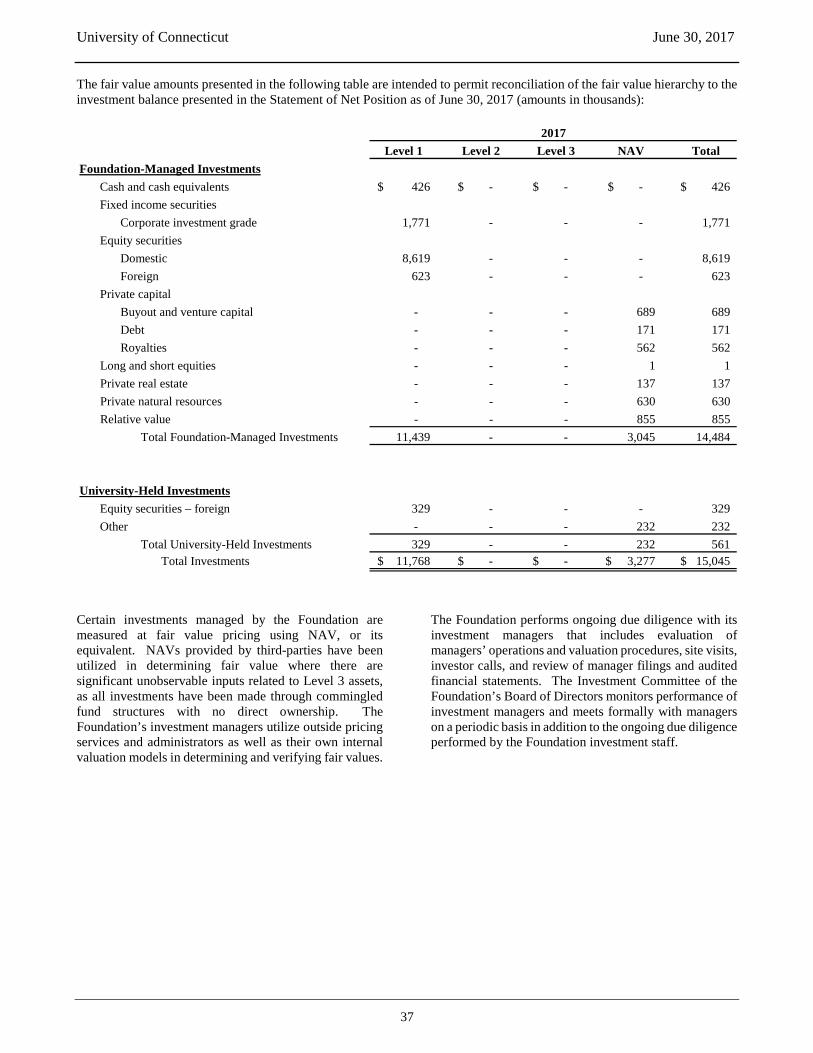
University of Connecticut June 30, 2017
37
The fair value amounts presented in the following table are intended to permit reconciliation of the fair value hierarchy to the investment balance presented in the Statement of Net Position as of June 30, 2017 (amounts in thousands):
Certain investments managed by the Foundation are measured at fair value pricing using NAV, or its equivalent. NAVs provided by third-parties have been utilized in determining fair value where there are significant unobservable inputs related to Level 3 assets, as all investments have been made through commingled fund structures with no direct ownership. The Foundation’s investment managers utilize outside pricing services and administrators as well as their own internal valuation models in determining and verifying fair values.
The Foundation performs ongoing due diligence with its investment managers that includes evaluation of managers’ operations and valuation procedures, site visits, investor calls, and review of manager filings and audited financial statements. The Investment Committee of the Foundation’s Board of Directors monitors performance of investment managers and meets formally with managers on a periodic basis in addition to the ongoing due diligence performed by the Foundation investment staff.
Level 1 Level 2 Level 3 NAV TotalFoundation-Managed Investments
Cash and cash equivalents 426$ -$ -$ -$ 426$ Fixed income securities
Corporate investment grade 1,771 - - - 1,771 Equity securities
Domestic 8,619 - - - 8,619 Foreign 623 - - - 623
Private capital Buyout and venture capital - - - 689 689 Debt - - - 171 171 Royalties - - - 562 562
Long and short equities - - - 1 1 Private real estate - - - 137 137 Private natural resources - - - 630 630 Relative value - - - 855 855
Total Foundation-Managed Investments 11,439 - - 3,045 14,484
University-Held InvestmentsEquity securities – foreign 329 - - - 329 Other - - - 232 232
Total University-Held Investments 329 - - 232 561 Total Investments 11,768$ -$ -$ 3,277$ 15,045$
2017
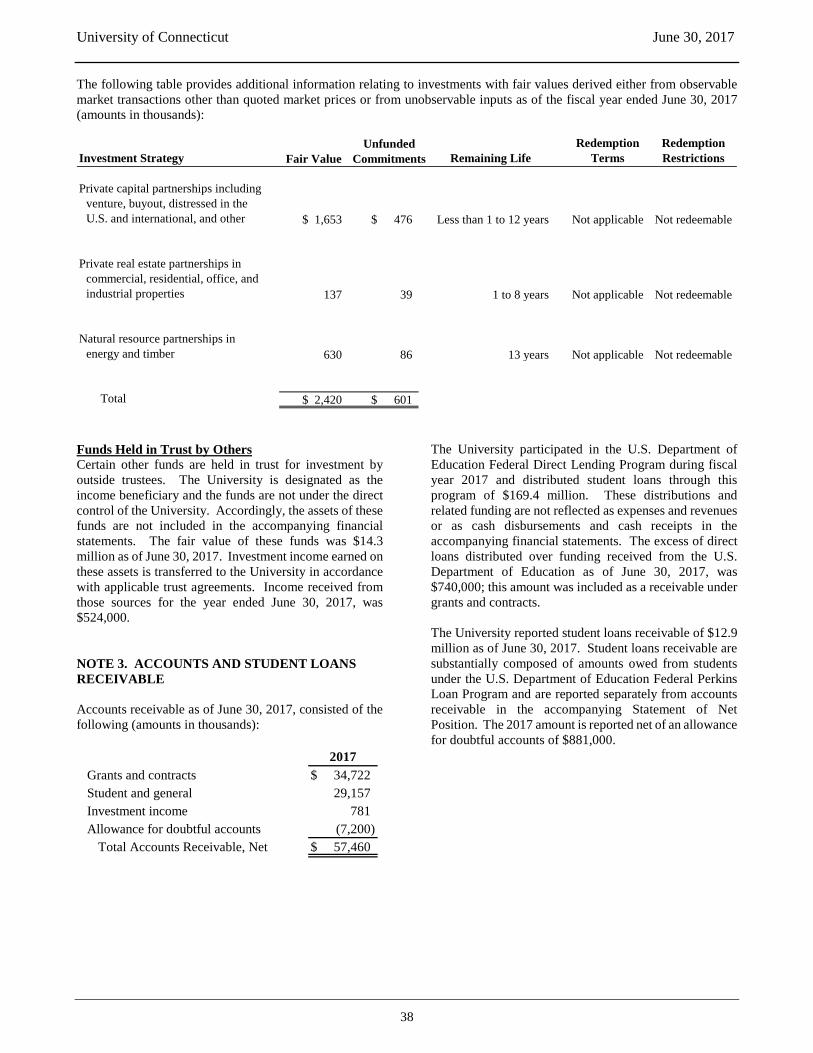
University of Connecticut June 30, 2017
38
The following table provides additional information relating to investments with fair values derived either from observable market transactions other than quoted market prices or from unobservable inputs as of the fiscal year ended June 30, 2017 (amounts in thousands):
Funds Held in Trust by Others Certain other funds are held in trust for investment by outside trustees. The University is designated as the income beneficiary and the funds are not under the direct control of the University. Accordingly, the assets of these funds are not included in the accompanying financial statements. The fair value of these funds was $14.3 million as of June 30, 2017. Investment income earned on these assets is transferred to the University in accordance with applicable trust agreements. Income received from those sources for the year ended June 30, 2017, was $524,000.
NOTE 3. ACCOUNTS AND STUDENT LOANS RECEIVABLE Accounts receivable as of June 30, 2017, consisted of the following (amounts in thousands):
The University participated in the U.S. Department of Education Federal Direct Lending Program during fiscal year 2017 and distributed student loans through this program of $169.4 million. These distributions and related funding are not reflected as expenses and revenues or as cash disbursements and cash receipts in the accompanying financial statements. The excess of direct loans distributed over funding received from the U.S. Department of Education as of June 30, 2017, was $740,000; this amount was included as a receivable under grants and contracts. The University reported student loans receivable of $12.9 million as of June 30, 2017. Student loans receivable are substantially composed of amounts owed from students under the U.S. Department of Education Federal Perkins Loan Program and are reported separately from accounts receivable in the accompanying Statement of Net Position. The 2017 amount is reported net of an allowance for doubtful accounts of $881,000.
Investment Strategy Remaining LifeRedemption
TermsRedemption Restrictions
Private capital partnerships including venture, buyout, distressed in the U.S. and international, and other 1,653$ 476$ Less than 1 to 12 years Not applicable Not redeemable
Private real estate partnerships incommercial, residential, office, andindustrial properties 137 39 1 to 8 years Not applicable Not redeemable
Natural resource partnerships in energy and timber 630 86 13 years Not applicable Not redeemable
Total 2,420$ 601$
Fair ValueUnfunded
Commitments
Grants and contracts $ 34,722Student and general 29,157Investment income 781Allowance for doubtful accounts (7,200)
Total Accounts Receivable, Net $ 57,460
2017
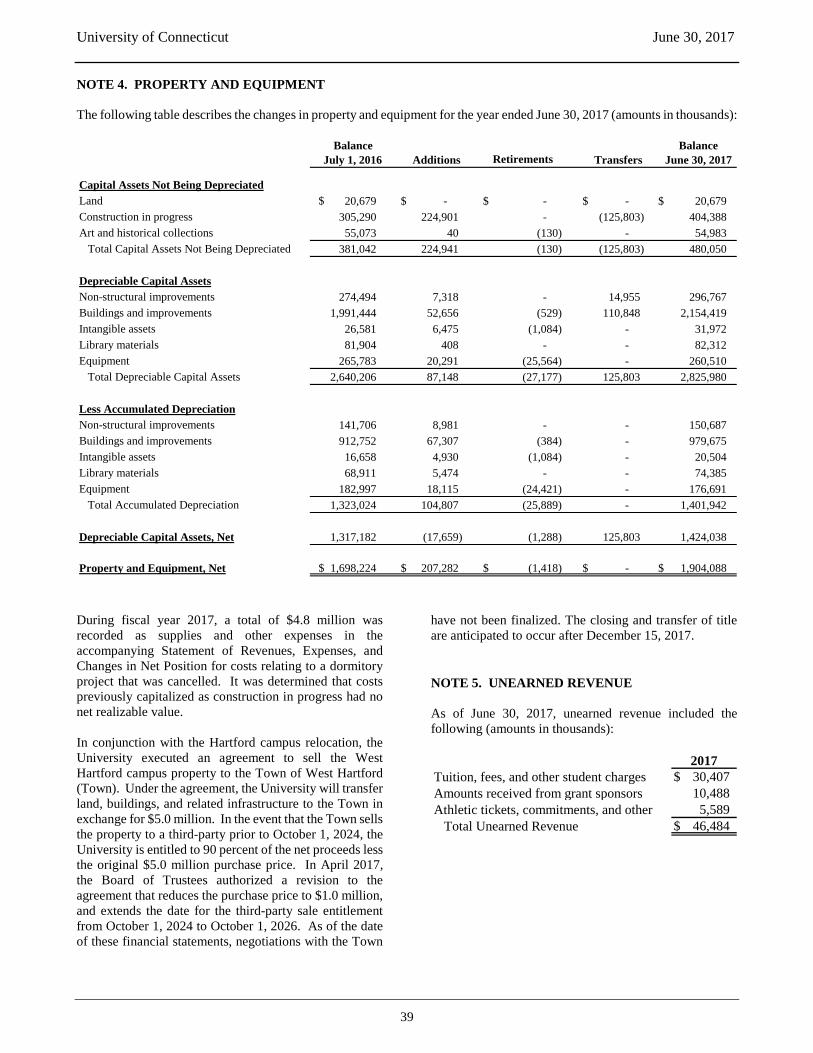
University of Connecticut June 30, 2017
39
NOTE 4. PROPERTY AND EQUIPMENT The following table describes the changes in property and equipment for the year ended June 30, 2017 (amounts in thousands):
During fiscal year 2017, a total of $4.8 million was recorded as supplies and other expenses in the accompanying Statement of Revenues, Expenses, and Changes in Net Position for costs relating to a dormitory project that was cancelled. It was determined that costs previously capitalized as construction in progress had no net realizable value. In conjunction with the Hartford campus relocation, the University executed an agreement to sell the West Hartford campus property to the Town of West Hartford (Town). Under the agreement, the University will transfer land, buildings, and related infrastructure to the Town in exchange for $5.0 million. In the event that the Town sells the property to a third-party prior to October 1, 2024, the University is entitled to 90 percent of the net proceeds less the original $5.0 million purchase price. In April 2017, the Board of Trustees authorized a revision to the agreement that reduces the purchase price to $1.0 million, and extends the date for the third-party sale entitlement from October 1, 2024 to October 1, 2026. As of the date of these financial statements, negotiations with the Town
have not been finalized. The closing and transfer of title are anticipated to occur after December 15, 2017. NOTE 5. UNEARNED REVENUE As of June 30, 2017, unearned revenue included the following (amounts in thousands):
Retirements
Capital Assets Not Being DepreciatedLand $ 20,679 $ - $ - $ - $ 20,679Construction in progress 305,290 224,901 - (125,803) 404,388Art and historical collections 55,073 40 (130) - 54,983
Total Capital Assets Not Being Depreciated 381,042 224,941 (130) (125,803) 480,050
Depreciable Capital AssetsNon-structural improvements 274,494 7,318 - 14,955 296,767Buildings and improvements 1,991,444 52,656 (529) 110,848 2,154,419Intangible assets 26,581 6,475 (1,084) - 31,972Library materials 81,904 408 - - 82,312Equipment 265,783 20,291 (25,564) - 260,510
Total Depreciable Capital Assets 2,640,206 87,148 (27,177) 125,803 2,825,980
Less Accumulated DepreciationNon-structural improvements 141,706 8,981 - - 150,687Buildings and improvements 912,752 67,307 (384) - 979,675Intangible assets 16,658 4,930 (1,084) - 20,504Library materials 68,911 5,474 - - 74,385Equipment 182,997 18,115 (24,421) - 176,691
Total Accumulated Depreciation 1,323,024 104,807 (25,889) - 1,401,942
Depreciable Capital Assets, Net 1,317,182 (17,659) (1,288) 125,803 1,424,038
Property and Equipment, Net $ 1,698,224 $ 207,282 $ (1,418) $ - $ 1,904,088
Balance BalanceJuly 1, 2016 Additions Transfers June 30, 2017
2017Tuition, fees, and other student charges 30,407$ Amounts received from grant sponsors 10,488Athletic tickets, commitments, and other 5,589
Total Unearned Revenue 46,484$
University of Connecticut June 30, 2017
40
NOTE 6. COMPENSATED ABSENCES AND WAGES PAYABLE The following table shows activity for compensated absences for the fiscal year ended June 30, 2017 (amounts in thousands):
Wages payable includes salaries and wages for amounts owed to employees at the fiscal year-end. The State administers benefit and retirement plans for the University; therefore, the liability for fringe benefits related to wages payable is included as due to State in the accompanying Statement of Net Position. NOTE 7. LONG-TERM DEBT AND BONDS PAYABLE Public Act (PA) No. 95-230 enabled the University to borrow money in its own name for a special 10-year capital improvement program designed to modernize, rehabilitate, and expand the physical plant of the University (UCONN 2000). It authorized projects for Phases I and II of UCONN 2000, estimated to cost $1,250.0 million, of which $962.0 million was to be financed by bonds of the University; $18.0 million was to be funded by State general obligation bonds; and the balance of $270.0 million was to be financed by gifts, other revenue, or borrowing resources of the University. In fiscal year 2002, the General Assembly of the State of Connecticut (General Assembly) enacted and the Governor signed into law PA No. 02-3, An Act Concerning 21st Century UConn (Act). The Act authorized additional projects for the University and UConn Health for what is called Phase III of UCONN 2000. This Act amended PA No. 95-230 and extended the UCONN 2000 financing program. The Act, as amended by PA No. 10-104 and 11-75, authorized projects under Phase III at a total estimated cost of $1,818.3 million, of which $1,769.9 million was financed by bonds of the University secured by the State’s debt service commitment. The remaining $48.4 million was financed by the University’s issuance of special obligation bonds, from gifts and other revenue or borrowing resources of the University, or through the deferring of projects or achieved savings.
In June 2013, the General Assembly enacted and the Governor signed into law PA No. 13-233, An Act Concerning Next Generation Connecticut, an extension of Phase III that authorized additional projects, increased the cost of certain projects, increased the authorized bond funding secured by the State’s debt service commitment by $1,551.0 million, and extended UCONN 2000 for an additional six fiscal years to 2024. In fiscal year 2017, the Governor proposed a budget deferring $334.1 million in UCONN 2000 authorizations and extending the program three years to 2027. The total estimated cost for Phases I, II, and III under UCONN 2000 is $4,619.3 million. The University issues general obligation bonds to finance UCONN 2000 projects. The University has also issued several series of general obligation refunding bonds, providing debt service savings for bonds refunded in advance of maturity. Sufficient proceeds are deposited into irrevocable escrow accounts held by the Trustee Bank to meet all obligations on the refunded debt and invested in U.S. Treasury, state and local government securities, and cash in accordance with the escrow agreement. These bonds are general obligations of the University, for which its full faith and credit are pledged, and are payable from all assured revenues. The bonds are additionally secured by the pledge of and a lien upon the State debt service commitment – the commitment by the State to pay an annual amount of debt service on securities issued as general obligations of the University. The University, consistent with the Act, is relying upon the receipt of the annual amount of the pledged State debt service commitment for the payment of the bonds and, accordingly, is not planning to budget any revenues for the payment of these bonds. Under the Master Indenture, the University expects to issue additional bonds to finance UCONN 2000 projects secured by the State debt service commitment. In January 2017, the University issued general obligation bonds at a face value of $345.2 million, comprising $311.2 million of 2017 Series A bonds and $34.0 million of 2017 Refunding Series A bonds. The total bonds were issued at a premium of $43.8 million. Total net proceeds realized from the 2017 Series A bonds were $350.0 million after the payment of issuance costs and underwriter fees. Of this amount, $27.5 million was allocated to finance projects at UConn Health. Net proceeds realized from the 2017 Refunding Series A bonds were used to refund $36.1 million of the previously issued 2007 Refunding Series A General Obligation Bonds in advance of maturity. This reduced the general obligation debt service in future years by $3.8 million and resulted in an economic gain (present value of the savings) of $3.3 million. A loss of $945,000 resulting from the debt refunding was reported as a deferred outflow of resources
Beginning Balance, July 1 $ 36,616
Additions, net 3,532Deductions (separations only) (3,865)
Ending Balance, June 30 $ 36,283
2017

University of Connecticut June 30, 2017
41
in the accompanying Statement of Net Position. This difference is being amortized to interest expense through the year 2022 using the straight-line method. As general obligation bonds are issued, nonoperating revenue for State debt service commitment for principal is recognized at face value less any refunded debt and amounts set aside to finance UConn Health projects. For the year ended June 30, 2017, total State debt service commitment for principal recognized was $281.6 million. The portion of proceeds allocated to UConn Health is recorded as due to affiliate in the accompanying Statement of Net Position. As of June 30, 2017, the unspent portion of this balance was $11.5 million. In addition, nonoperating revenue for State debt service commitment for interest on general obligation bonds of $64.8 million was recognized for the year ended June 30, 2017, of which approximately $24.8 million was associated with UConn Health projects. As of June 30, 2017, approximately $596.5 million of the total general obligation bonds outstanding, net of premiums and discounts, pertained to proceeds used to finance UConn Health projects. In addition, the University may issue special obligation bonds, also called Student Fee Revenue Bonds. There were no special obligation bonds issued or refunded in fiscal year 2017. Special obligation bonds are secured by certain pledged revenues as defined in the indenture. In fiscal year 2017, this consisted of gross and net revenue amounts of approximately $91.2 million. Gross pledged revenues include the infrastructure maintenance fee and the general university fee plus investment income on the bond accounts held by the Trustee Bank, prior to any payments, deductions, offsets, or provisions. Net pledged revenues include the residential life room fee, student apartment rentals, Greek housing fee, the board (dining) fee, and parking and transportation fees, after providing for the cost of maintaining, repairing, insuring, and operating the
facilities for which the fees are imposed and before depreciation expense is deducted. In addition to securing revenue bonds, the gross and net pledged revenues available are pledged toward certain other debt. The University has covenanted to collect, in each fiscal year, fees representing pledged revenues so that the sum of gross and net revenue amounts is no less than 1.25 times the debt service requirements in each respective fiscal year for its special obligation bonds. The total principal and interest remaining to be paid on all special obligation bonds as of June 30, 2017, was $141.4 million. The total amount paid by pledged revenues was $6.5 million for the principal and $5.1 million for the interest on this debt in fiscal year 2017. The State issues certain general obligation bonds that are categorized as self-liquidating bonds. These bonds are issued to fund the construction and renovations of revenue-generating capital projects. The University reimburses the State primarily with revenue from student fee charges in the amount equal to the debt service on self-liquidating bonds. All outstanding self-liquidating bonds were paid in full in June 2017. The University also has a long-term UCONN 2000 Governmental Lease Purchase Agreement to finance the UCONN 2000 Cogeneration facility (see Note 8). On July 1, 2015, the University assumed a note payable related to the purchase of the Nathan Hale Inn for $5.4 million. The note payable required monthly payments of principal and interest and was paid in full in December 2016. Unamortized premiums and discounts are recorded as additions or reductions to the face value of bonds payable. These amounts are amortized using the straight-line basis over the life of the bonds, reducing interest expense for premiums and increasing it for discounts.
Long-term debt activity for the year ended June 30, 2017, was as follows (amounts in thousands):
General obligation bonds $ 1,303,870 $ 345,150 $ (144,025) $ 1,504,995 $ 119,285 Revenue bonds 112,410 - (6,455) 105,955 6,700 Self-liquidating bonds 275 - (275) - - Installment loans 282 98 (263) 117 55 Obligation under capital lease
for Cogeneration 47,229 - (4,411) 42,818 4,623 Note payable – Nathan Hale Inn 5,205 - (5,205) - -
Total Long-Term Debt 1,469,271 345,248 (160,634) 1,653,885 130,663 Premiums and discounts 172,757 43,842 (14,741) 201,858 14,694
Total Long-Term Debt, Net $ 1,642,028 $ 389,090 $ (175,375) $ 1,855,743 $ 145,357
Balance Balance CurrentJuly 1, 2016 Additions Retirements June 30, 2017 Portion

University of Connecticut June 30, 2017
42
Long-term debt outstanding as of June 30, 2017, consisted of the following (amounts in thousands):
*For bonds, the weighted average coupon rates are averaged by year of redemption.
Type of Debt and Issue DateOriginal Amount
Maturity Dates
Through Fiscal Year
Interest Rate*
2017 Balance
BondsGO 2009 Series A 144,855$ 2029 3.0-5.0% 86,525$ GO 2010 Series A 97,115 2030 3.0-5.0% 63,110 GO 2010 Ref. Series A 36,095 2021 2.25-5.0% 17,290 GO 2011 Series A 179,730 2031 3.515-5.0% 125,795 GO 2011 Ref. Series A 31,905 2023 2.0-5.0% 17,495 GO 2013 Series A 172,660 2034 2.0-5.0% 146,760 GO 2013 Ref. Series A 51,250 2024 2.0-5.0% 43,665 GO 2014 Series A 109,050 2034 2.0-5.0% 92,690 GO 2014 Ref. Series A 92,940 2025 2.0-5.0% 13,685 GO 2015 Series A 220,165 2035 1.0-5.0% 198,155 GO 2015 Ref. Series A 34,625 2026 4.0-5.0% 31,120 GO 2016 Series A 261,510 2036 3.0-5.0% 248,430 GO 2016 Ref. Series A 80,425 2027 4.0-5.0% 75,125 GO 2017 Series A 311,200 2037 2.5-5.0% 311,200 GO 2017 Ref. Series A 33,950 2022 2.5-5.0% 33,950
Total General Obligation Bonds 1,857,475 1,504,995
Rev 2010 Ref. Series A 47,545 2028 3.0-5.0% 28,845 Rev 2012 Ref. Series A 87,980 2030 1.5-5.0% 77,110
Total Revenue Bonds 135,525 105,955
Total Bonds 1,993,000 1,610,950 Loans and Other Debt
Installment loans 246 various 1.05-1.959% 117 Obligation under capital
lease for Cogeneration 81,900 2026 2.22% 42,818 Total Loans and Other Debt 82,146 42,935
Total Bonds, Loans, and Other Debt 2,075,146$ 1,653,885
201,858 1,855,743
145,357 1,710,386$
Add: premiums and discountsTotal Bonds, Loans, and Installment Purchases, Net Less: current portion, netTotal Noncurrent Portion, Net

University of Connecticut June 30, 2017
43
Long-term debt including general obligation bonds, revenue bonds, and loans are scheduled to mature in the following fiscal years as of June 30 (amounts in thousands):
NOTE 8. LEASES Capital Leases In December 2003, the University entered into a 20-year lease purchase agreement for a project to provide on-site generation of electricity, steam, and chilled water for heating and cooling at the University’s Storrs campus. The project initially assumed a total cost of $75.0 million and included construction of a building and the engineering, design, and installation of certain equipment to establish the Cogeneration facility. The lease was amended in August 2005 as a result of an increase in the total anticipated cost to $81.9 million. After another amendment, the remaining monthly payments decreased from $517,000 to $482,000 beginning August 2013 and the original lease term did not change. In November 2016, the lease was amended again to reflect a new nominal rate, causing monthly payments to decrease to $462,000 beginning January 2017. Amounts advanced by the lessor include capitalized interest during construction and are reflected as long-term debt in the accompanying Statement of Net Position. At the completion of the lease term, the University has an option to purchase the project assets for one dollar. The historical cost and accumulated depreciation of the Cogeneration facility were $82.6 million and $39.5 million, respectively, as of June 30, 2017. The University leases equipment assets with a historical cost and accumulated depreciation of $246,000 and $59,000, respectively, as of June 30, 2017. All assets subject to capital lease agreements are included as property and equipment in the accompanying Statement of Net Position; depreciation on these assets is included as depreciation and amortization expense in the accompanying Statement of Revenues, Expenses, and Changes in Net Position (see Note 4). Loans related to these capital lease agreements are included as long-term
debt and bonds payable in the accompanying Statement of Net Position (see Note 7). On August 1, 2017, the University entered into a 25-year master sublease agreement for 116 apartment units at 900 Washington Boulevard in Stamford. The apartments will serve as the University’s residential facility for the Stamford campus. The University will have options to purchase the property on each tenth anniversary of the term and a right of first refusal if the lessor receives a bona-fide offer to buy the property. The first year cost under the master sublease will be $2.7 million and payments will increase by 1.9 percent annually. Operating Leases The University has leases related to equipment and building space that expire at various dates. Future minimum rental payments at June 30, 2017, under non-cancellable operating leases that exceeded $500,000 each were as follows (amounts in thousands):
Expenses related to operating lease commitments in excess of $500,000 each were approximately $2.4 million for the fiscal year ended June 30, 2017.
Year(s) Principal Interest Total Principal Interest Total Principal Interest Total2018 119,285$ 70,141$ 189,426$ 11,378$ 5,768$ 17,146$ 130,663$ 75,909$ 206,572$ 2019 115,210 65,646 180,856 11,576 5,404 16,980 126,786 71,050 197,836 2020 109,430 60,333 169,763 12,594 4,993 17,587 122,024 65,326 187,350 2021 104,435 55,311 159,746 12,546 4,541 17,087 116,981 59,852 176,833 2022 99,190 50,366 149,556 13,004 4,079 17,083 112,194 54,445 166,639
2023-2027 432,595 184,223 616,818 60,452 12,940 73,392 493,047 197,163 690,210 2028-2032 333,575 87,685 421,260 27,340 1,993 29,333 360,915 89,678 450,593 2033-2037 191,275 21,063 212,338 - - - 191,275 21,063 212,338
Total 1,504,995$ 594,768$ 2,099,763$ 148,890$ 39,718$ 188,608$ 1,653,885$ 634,486$ 2,288,371$
General Obligation BondsLong-Term Debt Other Than General
Total ObligationsObligation Bonds
Fiscal Year Payments2018 3,104$ 2019 3,479 2020 3,516 2021 3,553 2022 3,534 Thereafter 16,985 Total 34,171$
University of Connecticut June 30, 2017
44
NOTE 9. RETIREMENT PLANS AND POST EMPLOYMENT BENEFITS State Retirement Systems The University sponsors two defined benefit plans administered through the State: the State Employees’ Retirement System (SERS) and the Connecticut Teachers’ Retirement System (TRS). SERS and TRS do not issue stand-alone financial reports but are reported as fiduciary funds within the State’s Comprehensive Annual Financial Report (CAFR). Financial reports are available on the website of the Office of the State Comptroller at www.osc.ct.gov. Plan descriptions. SERS is a single-employer defined-benefit plan that covers substantially all of the State’s full-time employees who are not eligible for another State sponsored retirement plan. Approximately 51 percent of the University’s eligible employees participate in SERS, which is administered by the State Comptroller’s Retirement Division under the direction of the State Employees’ Retirement Commission. As of June 30, 2017, SERS consisted of five plans: Tier I, Tier II, Tier IIA, Tier III, and the Hybrid Plan. TRS is a cost-sharing multiple-employer defined-benefit plan covering any teacher, principal, superintendent, or supervisor engaged in service of public schools in the State. Employees previously qualified for TRS continue coverage during employment with the University and do not participate in any other offered retirement plans. TRS is governed by Chapter 167a of the State General Statutes, as amended through the current session of the State Legislature, and is administered by the Teachers’ Retirement Board. Benefits provided. SERS provides retirement, disability, and death benefits along with annual cost-of-living adjustments (COLAs) to plan members and their beneficiaries. Generally, the monthly pension benefit is calculated in accordance with a basic formula that takes into consideration average salary, credited service, and age at retirement. Further details on plan benefits, COLAs, and other plan provisions are described in Sections 5-152 to 5-192x of the State General Statutes. TRS also provides retirement, disability, and death benefits along with annual COLAs to plan members and their beneficiaries. Generally, monthly plan benefits are based on a formula in combination with the member’s age, service, and the average of the highest three years of paid salaries. Further information on TRS plan benefits, COLAs, and other plan provisions are described in Sections 10-183b to 10-183ss of the State General Statutes. Contributions. SERS contribution requirements are established and may be amended by the State Legislature
subject to the contractual rights established by collective bargaining. Tier I Plan B regular and Hazardous Duty members are required to contribute two percent and four percent of their annual salary, respectively, up to the Social Security Taxable Wage Base plus five percent above that level; Tier I Plan C members are required to contribute five percent of their annual salary; Tier II Plan Hazardous Duty members are required to contribute four percent of their annual salary; Tier IIA and Tier III Plans regular and Hazardous Duty members are required to contribute two percent and five percent of their annual salary, respectively. Individuals hired on or after July 1, 2011, who are otherwise eligible for the Alternate Retirement Plan are also eligible to become members of the Hybrid Plan. The Hybrid Plan has defined benefits identical to Tiers II, IIA, and III for individuals hired on or after July 1, 2011, but requires employee contributions three percent higher than the contribution required from the applicable Tier II, IIA, or III Plan. The State is required to contribute at an actuarially determined rate. TRS contribution requirements are also established and may be amended by the State Legislature. Plan members are required to contribute six percent of their annual salary. Employer contributions are funded by the State on behalf of the participating municipal employers, which is considered to be a special funding situation. However, this special funding situation does not apply to the University, an agency of the State, because there is not a separate non-employer contributing entity. The University contributes to both plans on behalf of its employees by applying fringe benefit rates assessed by the State to eligible salaries and wages in each participant category. The rates of actual University contributions as a percentage of covered payroll during fiscal year 2017 were 37.7 percent and 9.9 percent for SERS and TRS, respectively. These amounts are expected to finance the costs of benefits earned by employees during the year and any unfunded accrued liability. The University’s contributions for fiscal year 2017 were $73.8 million and $135,000 for SERS and TRS, respectively. Subsequent to year-end, provisions under collective bargaining agreements were amended for existing SERS plans by revising certain factors including employee contribution rates and COLAs. A Tier IV plan was also placed into effect for employees hired on or after the effective date. These changes were effective July 1, 2017, and their overall impact cannot be reasonably estimated as of the date of this report. Proportionate share of collective net pension liability (NPL) and collective pension expense. The total pension liability (TPL) used to calculate the collective NPL was determined based on the annual actuarial funding valuation report as of June 30, 2016. The University’s proportion of the collective NPL was based on the

University of Connecticut June 30, 2017
45
University’s share of contributions relative to total contributions made to the respective pension plans. Based on this calculation, the University’s proportion was 4.91 percent and 0.03 percent for SERS and TRS, respectively, at the measurement date of June 30, 2016. SERS increased 0.03 of a percentage point from its proportion measured as of June 30, 2015, and TRS decreased by 0.01 of a percentage point from the same measurement date. The University’s proportionate share of the collective NPL at June 30, 2017, and related pension expense for fiscal year 2017 consisted of the following (amounts in thousands):
Actuarial assumptions. For SERS, the RP-2014 White Collar Mortality Table projected to 2020 by scale BB at 100 percent for males and 95 percent for females is used for the period after service retirement and for dependent beneficiaries. The RP-2014 Disabled Retiree Mortality Table at 65 percent for males and 85 percent for females is used for the period after disability. TRS mortality rates were based on the RPH-2014 White Collar Table with employee and annuitant rates blended from ages 50 to 80, projected to the year 2020 using the BB improvement scale, and further adjusted to grade in
increases (five percent for females and eight percent for males) to rates over age 80 for the period after service retirement and for dependent beneficiaries as well as for active members. The RPH-2014 Disabled Mortality Table projected to 2017 with Scale BB is used for the period after disability retirement. The TPL was based on an actuarial study for the period July 1, 2011 – June 30, 2015 for SERS and the period July 1, 2010 – June 30, 2015 for TRS, using the following key actuarial assumptions:
The long-term expected rate of return on pension plan investments was determined using a log-normal distribution analysis in which best-estimate ranges of expected future real rates of return (expected returns, net of pension plan investment expense and inflation) are developed for each major asset class. These ranges are combined to produce the long-term expected rate of return by weighting the expected future real rates of return by the target asset allocation percentage and adding expected inflation.
The target asset allocation and best estimates of arithmetic real rates of return for each major asset class as of the June 30, 2016 measurement date are summarized in the following table for each plan:
SERS TRS TotalProportionate share of
collective NPL 1,126,394$ 4,976$ 1,131,370$
Proportionate share ofcollective pension expense 154,188$ 405$ 154,593$
2017 SERS TRS
Inflation 2.50% 2.75%
Salary increases, including 3.50% – 3.25% – inflation 19.50% 6.50%
Investment rate of return, net of pension plan investmentexpense, including inflation 6.90% 8.00%
Asset ClassTarget
Allocation
Long-Term Expected Real Rate of Return
Target Allocation
Long-Term Expected Real Rate of Return
Large cap U.S. equities 21.0% 5.8% 21.0% 5.8% Developed non-U.S. equities 18.0% 6.6% 18.0% 6.6% Emerging markets (non-U.S.) 9.0% 8.3% 9.0% 8.3% Real estate 7.0% 5.1% 7.0% 5.1% Private equity 11.0% 7.6% 11.0% 7.6% Alternative investment 8.0% 4.1% 8.0% 4.1% Fixed income (core) 8.0% 1.3% 7.0% 1.3% High yield bonds 5.0% 3.9% 5.0% 3.9% Emerging market bond 4.0% 3.7% 5.0% 3.7% Inflation linked bonds 5.0% 1.0% 3.0% 1.0% Cash 4.0% 0.4% 6.0% 0.4%
Total 100.0% 100.0%
SERS TRS

University of Connecticut June 30, 2017
46
Discount rate. The discount rate used to measure the TPL was 6.9 percent and 8.0 percent for SERS and TRS, respectively. The projection of cash flows used to determine the discount rates assumed that employee contributions would be made at the current contribution rates and that employer contributions would be made according to actuarially determined amounts in future years. Based on those assumptions, the SERS and TRS pension plans’ fiduciary net position was projected to be available to make all projected future benefit payments of current plan members. Therefore, the long-term expected rate of return on pension plan investments was applied to all periods of projected benefit payments to determine the TPL. Sensitivity analysis. The following table presents the University’s proportionate share of the collective NPL calculated using the discount rate of 6.9 percent and 8.0 percent for SERS and TRS, respectively. The table also
shows what the University’s proportionate share of the collective NPL would be if it were calculated using a discount rate that is one percentage point lower or one percentage point higher than the current rate (amounts in thousands):
Pension plan fiduciary net position. Detailed information about the fiduciary net position of the SERS and TRS pension plans are available in the State’s CAFR for the fiscal year ended June 30, 2016.
Deferred outflows and deferred inflows of resources related to pensions. At June 30, 2017, the University reported deferred outflows of resources and deferred inflows of resources related to pensions from the following sources (amounts in thousands):
1% Current 1%Decrease Rate Increase
SERS 1,336,691$ 1,126,394$ 951,378$
TRS 6,130$ 4,976$ 3,993$
SERS TRS TotalDeferred Outflows of ResourcesChanges in assumptions 200,828$ 660$ 201,488$
Changes in proportion and differences between University contributions and proportionate share of contributions 99,678 20 99,698
Net differences between projected and actual earnings on pension plan investments 35,322 421 35,743
University contributions subsequent to the measurement date 73,781 135 73,916
Difference between expected and actual experience 31,291 - 31,291
Total Deferred Outflows 440,900$ 1,236$ 442,136$
Deferred Inflows of Resources
Changes in proportion and differences between University contributions and proportionate share of contributions -$ 691$ 691$
Difference between expected and actual experience - 112 112
Total Deferred Inflows -$ 803$ 803$
University of Connecticut June 30, 2017
47
The $73.9 million in deferred outflows relating to University contributions made subsequent to the measurement date will be recognized as a reduction of the collective NPL in the reporting year ending June 30, 2018. Other amounts reported as deferred outflows of resources and deferred inflows of resources related to pensions will be recognized in pension expense as follows (amounts in thousands):
Alternate Retirement Plan The University also sponsors the Alternate Retirement Plan (ARP), a defined contribution plan administered through a third-party administrator, Prudential Financial, Inc. The Connecticut State Employees Retirement Commission has the authority to supervise and control the operation of the plan including the authority to make and amend rules and regulations relating to the administration of the plan. All unclassified employees not already in a pension plan of a constituent unit of the State system of higher education or the central office staff of the Department of Higher Education are eligible to participate in ARP. Participants must contribute five percent of eligible compensation each pay period and their employer must contribute an amount equal to eight percent of the participant’s eligible compensation. The University contributes its employer share through a fringe benefit charge assessed by the State. Participant and employer contributions are both 100 percent vested immediately. For fiscal year 2017, the University’s employer contributions to ARP were $18.8 million. A participant who retires or experiences severance of employment for any reason other than retirement may elect, by written notice to the ARP administrator, to commence distribution of his or her account after attaining age 55; provided however, that the participant who experiences a severance of employment from State service with less than 5 years of participation may elect, at the time and in the manner prescribed by the ARP administrator, to have his or her entire account paid directly to an eligible retirement plan in a direct rollover prior to attaining age 55. Other ARP provisions are described in Chapter 66 of the State General Statutes, State Employees Retirement Act.
Subsequent to year-end, provisions under collective bargaining agreements were amended by revising certain factors including employee contribution rates related to ARP. These changes were effective July 1, 2017, and their overall impact cannot be reasonably estimated as of the date of this report. Department of Dining Services The University’s Department of Dining Services (DDS) employs 497 full-time staff, of which 66 participate in either SERS or ARP. The remaining 431 are eligible to participate in two other defined contribution plans: the University of Connecticut, Department of Dining Services Money Purchase Pension Plan (MPPP) or the University of Connecticut, Department of Dining Services 403(b) Retirement Plan (403(b) Retirement Plan). Both plans are administered through a third-party administrator, Pension Consultants, Inc. The fiduciary of the plans has the authority to supervise and control the operation of the plans including the authority to make and amend rules and regulations relating to the administration of the plans. Under the provisions of MPPP, all employees of DDS with at least 700 hours of service and 12 months of service are eligible to participate. DDS is required to contribute six percent or eight percent of covered compensation for eligible employees, dependent upon hire date, and its employees do not make any contributions to MPPP. Employees are vested after three years of credited service. Any amounts forfeited are used to reduce DDS’s contribution. On behalf of MPPP participants, DDS contributed approximately $807,300 to the plan during fiscal year 2017. Forfeitures used to reduce the required contributions were approximately $5,500. Upon separation of service in accordance with plan provisions, a participant or designated beneficiary can withdraw a lump sum payment or receive annuity payments. Other plan provisions can be found in the MPPP document. Under the provisions of the 403(b) Retirement Plan, all employees who perform services for DDS as common law employees are eligible to participate. For any participant employed on September 1, 1994, or terminated and rehired prior to September 1, 1995, and who has at least 700 hours of service, DDS is required to match 50 percent of the first 4 percent of the employee’s contributions. Participants hired after August 31, 1994, do not receive a DDS match. Participant and State matches are both 100 percent vested. On behalf of 403(b) Retirement Plan participants, DDS contributed approximately $18,500 to the plan during fiscal year 2017. Upon separation of service in accordance with plan provisions, a participant or designated beneficiary can withdraw a lump sum payment or receive annuity payments. Other plan provisions can be found in the 403(b) Retirement Plan document.
Fiscal Year2018 $ 87,712 $ 40 $ 87,7522019 87,712 40 87,7522020 89,188 115 89,3032021 66,055 65 66,1202022 36,451 23 36,474Thereafter - 16 16Total $ 367,118 $ 299 $ 367,417
SERS TRS Total
University of Connecticut June 30, 2017
48
Post-Employment Benefits Other Than Pension In addition to pension benefits, the State provides post-retirement health care and life insurance benefits to University employees in accordance with State General Statutes Sections 5-257(d) and 5-259(a). When employees retire, the State may pay up to 100 percent of their health care insurance premium cost (including dependents’ coverage), depending on the plan chosen by the employee. In addition, the State pays 100 percent of the premium cost for a portion of the employees’ life insurance continued after retirement. The amount of life insurance continued at no cost to the retiree is determined by a formula based on the number of years of State service that the retiree had at the time of retirement. The State is responsible for and finances the cost of post-retirement health care and life insurance benefits on a pay-as-you-go basis through an appropriation in the State’s General Fund (General Fund); therefore, no liability is recorded by the University as of June 30, 2017. Effective for fiscal year 2018, GASB Statement No. 75, Accounting and Financial Reporting for Postemployment Benefits Other Than Pensions, will require the University to report its proportionate share of the net liability related to its participation in these post-employment benefit plans in its Statement of Net Position. This standard will also require more extensive note disclosures and required supplementary information to be presented about the reported post-employment liabilities. The University is still evaluating the full impact of this new standard. In addition, certain provisions under collective bargaining agreements were amended subsequent to year-end that will impact post-employment benefits. These changes were effective July 1, 2017, and their overall impact cannot be reasonably estimated as of the date of this report. NOTE 10. SERVICE CONCESSION ARRANGEMENT In June 2016, the University contracted with Barnes & Noble College Booksellers, Inc. (Barnes & Noble) to manage the University’s bookstore facilities for the next 10 years. The University recorded an execution payment for $1.5 million that will be amortized over the 10-year period. In March 2017, the contract was amended to include an additional location at the new downtown Hartford campus. For each contract year, Barnes & Noble will pay the University a percentage of commissionable sales as defined by the contract with a minimum annual guarantee of $3.5 million for the first year, $4.5 million for the second contract year, and $1.0 million for the third contract year. The University is obligated to provide bookstore facilities and utilities, including amounts related to leased locations in Storrs Center and Hartford. Barnes & Noble is obligated to invest a minimum of $4.0
million to improve and furnish the bookstores by December 31, 2017. As of June 30, 2017, Barnes & Noble has not completed these renovations. At June 30, 2017, the University reported bookstore facilities as capital assets with a carrying amount of $4.2 million and a receivable of $6.0 million, representing June 2017 income and the present value of the installment payments for the second and third contract year. The University also reported a liability of $6.2 million, representing the present value of the lease obligations and utilities, and a deferred inflow of resources of $3.3 million that will be amortized as revenue over the contract term. NOTE 11. DEFERRED OUTFLOWS AND DEFERRED INFLOWS OF RESOURCES Deferred outflows and deferred inflows of resources consisted of the following as of June 30, 2017 (amounts in thousands):
NOTE 12. COMMITMENTS The University had outstanding commitments, in excess of $500,000 each, of $335.6 million as of June 30, 2017. This amount included $271.4 million related to capital projects for the University and $55.1 million related to UCONN 2000 capital projects that are administered by the University for UConn Health. UCONN 2000 expenditures made on behalf of UConn Health offset the due to affiliate liability in the accompanying Statement of Net Position (see Note 7). In addition to the amounts related to capital outlay, approximately $9.1 million in outstanding commitments related to operating expenses. A portion of the total amount of outstanding commitments was also included within accounts payable in the accompanying Statement of Net Position as of June 30, 2017. See Note 8 for amounts related to operating leases. NOTE 13. TUITION WAIVERS AND GRADUATE ASSISTANTSHIPS The University is required by law to waive tuition for certain veterans and children of veterans, certain students
2017Deferred Outflows of Resources
Accumulated loss on debt refundings, net 4,128$ Amounts related to pension liabilities 442,136
Total Deferred Outflows of Resources 446,264$
Deferred Inflows of ResourcesAmounts related to service concession
arrangement 3,338$ Amounts related to pension liabilities 803
Total Deferred Inflows of Resources 4,141$

University of Connecticut June 30, 2017
49
over the age of 62, graduate assistants, and certain other students. The University is also required by collective bargaining agreements to waive tuition for certain employees and their dependents. The University has included the portion of waived tuition related to employees and their dependents as a fringe benefit cost and the same amount as tuition revenue in the accompanying Statement of Revenues, Expenses, and Changes in Net Position. This increased tuition and fee revenues and operating expenses by $4.7 million for the fiscal year ended June 30, 2017. The total amount of waivers not reflected in the accompanying financial statements was $57.2 million in fiscal year 2017. Approximately 92 percent of this amount was provided to graduate assistants and $1.2 million was charged back to grants for reimbursement. NOTE 14. RELATED PARTY TRANSACTIONS Transactions with related parties occur in the normal course of the University’s operations. The following related party transactions were deemed significant and material in nature:
The Foundation The Foundation is a tax-exempt organization supporting the University and UConn Health (see Note 1). The University entered into a written agreement with the Foundation whereby the University agreed to provide financial support to the Foundation through a guaranteed contractual amount and the Foundation agreed to reimburse the University for certain operating expenses incurred on the Foundation’s behalf. The terms of the agreement also stipulate that goals, objectives, and financial arrangements are reviewed and agreed upon by both parties on an annual basis. In addition to this agreement, the University provides other services to the Foundation. The following transactions occurred between the University and the Foundation as of and for the year ended June 30, 2017 (amounts in thousands):
*Included in accounts receivable, net, in the accompanying Statement
of Net Position. The Foundation also has the primary responsibility for alumni engagement activities for the University. The University has granted the Foundation rights to use the
Alumni Center building, which is owned by the University, at an annual rental amount of one dollar. In accordance with the terms of a ground lease between the University and the Foundation, approximately 1.58 acres on which the Foundation building was constructed is leased to the Foundation at an annual rental amount of one dollar. The initial term of the ground lease is 99 years and the Foundation has the right to extend the term of the ground lease for another 99 years. The ground lease provides that, at its expiration or earlier termination, the Foundation shall surrender the premises and title to the building will be transferred to the University. The State The University receives funding from the State for capital projects via UCONN 2000 (see Note 7). In addition, the State supports the University’s mission primarily via two mechanisms: State appropriation and the provision of payments for fringe benefits. State appropriation represents amounts appropriated to the University from the General Fund. Payments for fringe benefits are made by the State for reimbursements related to salaries expensed from the General Fund. State appropriation and the provision of payments for fringe benefits for the year ended June 30, 2017, consisted of the following (amounts in thousands):
Pursuant to various public or special bond acts, the General Assembly empowers the State Bond Commission to allocate and approve the issuance of bonds for a variety of projects or purposes. PA No. 11-57, as amended by PA 14-98, authorized $169.5 million of State General Obligation Bonds to create a technology park on the Storrs campus. The State Bond Commission allocated the total $169.5 million to finance the initial design, development costs, equipment purchases, and construction related to the technology park. These bonds are an obligation of the State and therefore are not recorded as a liability by the University. The unspent portion related to these bonds was $58.6 million as of June 30, 2017, and was included as part of due from State in the accompanying Statement of Net Position. UConn Health The University is responsible for the management of UCONN 2000 funds for UConn Health’s construction projects. The unspent portion of these funds was recorded
2017Total expenses incurred for guaranteed contractual
services provided by the Foundation 9,105$ Reimbursements from the Foundation for operating
expenses 206$ Accrued capital and noncapital gift and grant revenue
from the Foundation 20,295$
Amount receivable from the Foundation* 5,545$
Amount of General Fund appropriation received from the State $ 217,799
Amount of payments for fringe benefits received from the State 158,314
Decrease of General Fund payroll included in due from the State (2,000)
Total Appropriation and Payments for Fringe Benefits from the State $ 374,113
2017

University of Connecticut June 30, 2017
50
under due to affiliate in the accompanying Statement of Net Position (see Note 7). In addition, the University engaged in certain cost-share arrangements with UConn Health for shared services. The University and UConn Health have also collaborated to support economic development activities and to achieve successful outcomes for the technology park and Bioscience Connecticut initiatives. In accordance with an annual memorandum of agreement, the University and UConn Health are obligated to provide an equal share of funding for economic development activities. Per the agreement, the University manages the program’s budget and UConn Health reimburses the University for the majority of its share of funding obligations. In fiscal year 2017, the University recorded a $2.0 million reduction to expense, representing amounts reimbursed by UConn Health during that period for economic development activities. In addition, the University and UConn Health have entered into an agreement that supports a unified marketing initiative. This agreement leverages the internal staff, resources, and expertise of both entities to provide marketing support. UConn Health has agreed to reimburse the University a baseline sum for marketing services under the agreement. In fiscal year 2017, the University incurred $3.8 million in expenses that were offset in total by reimbursements from UConn Health for its share of marketing support. UConn Innovation Fund, LLC On April 14, 2016, the University entered into an agreement with Connecticut Innovations, Inc. and Webster Bank, N.A. to create an investment fund for the purpose of making investments in early stage technology companies affiliated with the University. Each member commits to contribute $500,000 to the fund during the commitment period that extends to April 2018. In fiscal year 2017, the University paid $250,000 as part of its capital commitment. Mansfield Downtown Partnership, Inc. The Mansfield Downtown Partnership, Inc. (MDP) is a not-for-profit corporation that is exempt from taxation under section 501(c)(3) of the Internal Revenue Code and is composed of the Town of Mansfield, the University, and individual business members and residents. MDP is responsible for organizing the enhancement and revitalization of three of the Town of Mansfield’s
commercial areas: Storrs Center, King Hill Road, and Four Corners. In accordance with its governing by-laws, members are required to submit annual dues, as determined by the Board of Directors, in lieu of financial support. In fiscal year 2017, the University paid $125,000 in annual membership dues to MDP. NOTE 15. CONTINGENCIES Certain claims and judgments against the University are covered by the State under State General Statutes section 4-160, which governs most tort claims. Additional coverage is provided for the University by insurance policies and funds maintained by the State. The University is a party to various legal actions arising in the ordinary course of its operations. Although it is not feasible to predict the ultimate outcome of these actions, it is the opinion of management that the resolution of the majority of these matters will not have a material effect on the University's financial statements. However, there are a small number of outstanding matters, including unasserted claims, of potential individual significance. With respect to one matter, the claimant seeks $20.0 million, though the State expects this matter to be resolved for substantially less than the amount claimed. If the claimant is successful, the claim will be paid from the General Fund, not by the University. A second matter is being handled under the State’s fleet insurance policy. Although no demand has been made, it is expected to be several million dollars. The policy is self-insured for $4.0 million and is funded by the State, not by the University. Payments above that amount are covered by the State’s excess coverage. It is unlikely that the final resolution will exceed the excess coverage. Any portion of the claim not covered by insurance will be paid out of the General Fund. In the opinion of legal counsel, the aggregate exposure to the University pertaining to any other remaining claims and unasserted claims cannot be reasonably estimated but is not expected to exceed $5.0 million. The University also participates in federal, state and local government programs that are subject to final audit by the granting agencies. Management believes any adjustment of costs resulting from such audits would not have a material effect on the University’s financial statements.
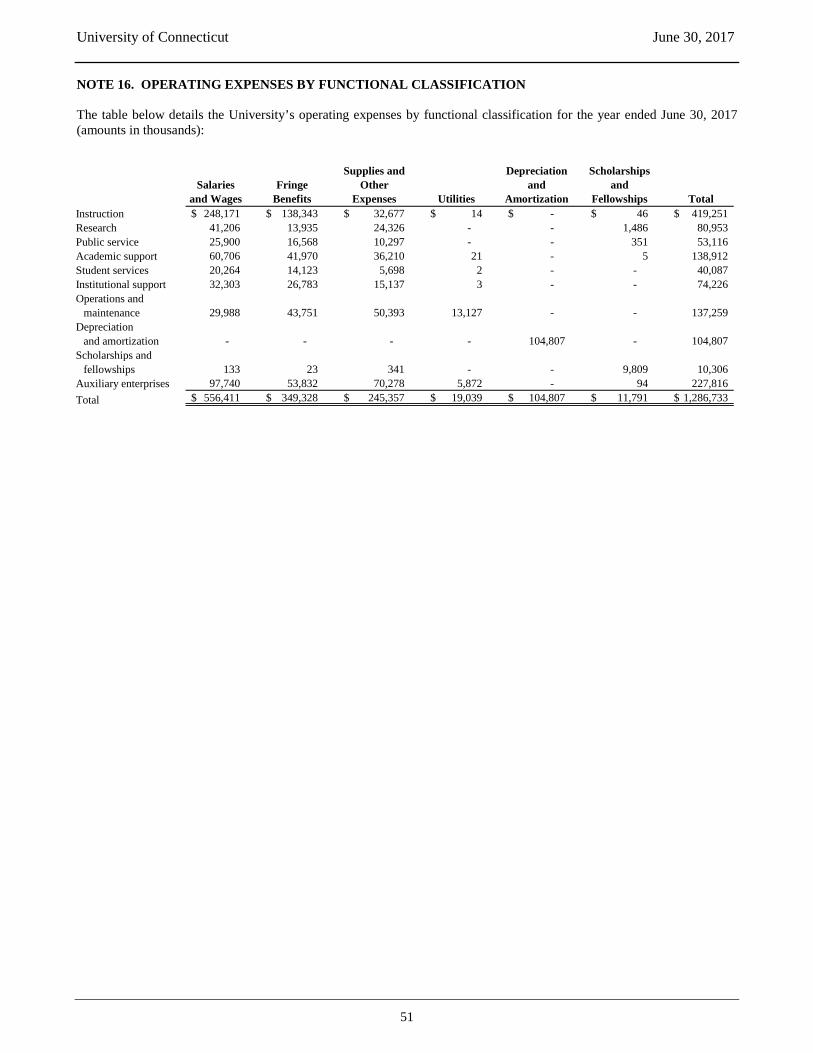
University of Connecticut June 30, 2017
51
NOTE 16. OPERATING EXPENSES BY FUNCTIONAL CLASSIFICATION The table below details the University’s operating expenses by functional classification for the year ended June 30, 2017 (amounts in thousands):
Salaries and Wages
Fringe Benefits
Supplies and Other
Expenses Utilities
Depreciation and
Amortization
Scholarships and
Fellowships TotalInstruction 248,171$ 138,343$ 32,677$ 14$ -$ 46$ 419,251$ Research 41,206 13,935 24,326 - - 1,486 80,953 Public service 25,900 16,568 10,297 - - 351 53,116 Academic support 60,706 41,970 36,210 21 - 5 138,912 Student services 20,264 14,123 5,698 2 - - 40,087 Institutional support 32,303 26,783 15,137 3 - - 74,226 Operations and
maintenance 29,988 43,751 50,393 13,127 - - 137,259 Depreciation
and amortization - - - - 104,807 - 104,807 Scholarships and
fellowships 133 23 341 - - 9,809 10,306 Auxiliary enterprises 97,740 53,832 70,278 5,872 - 94 227,816
556,411$ 349,328$ 245,357$ 19,039$ 104,807$ 11,791$ 1,286,733$ Total
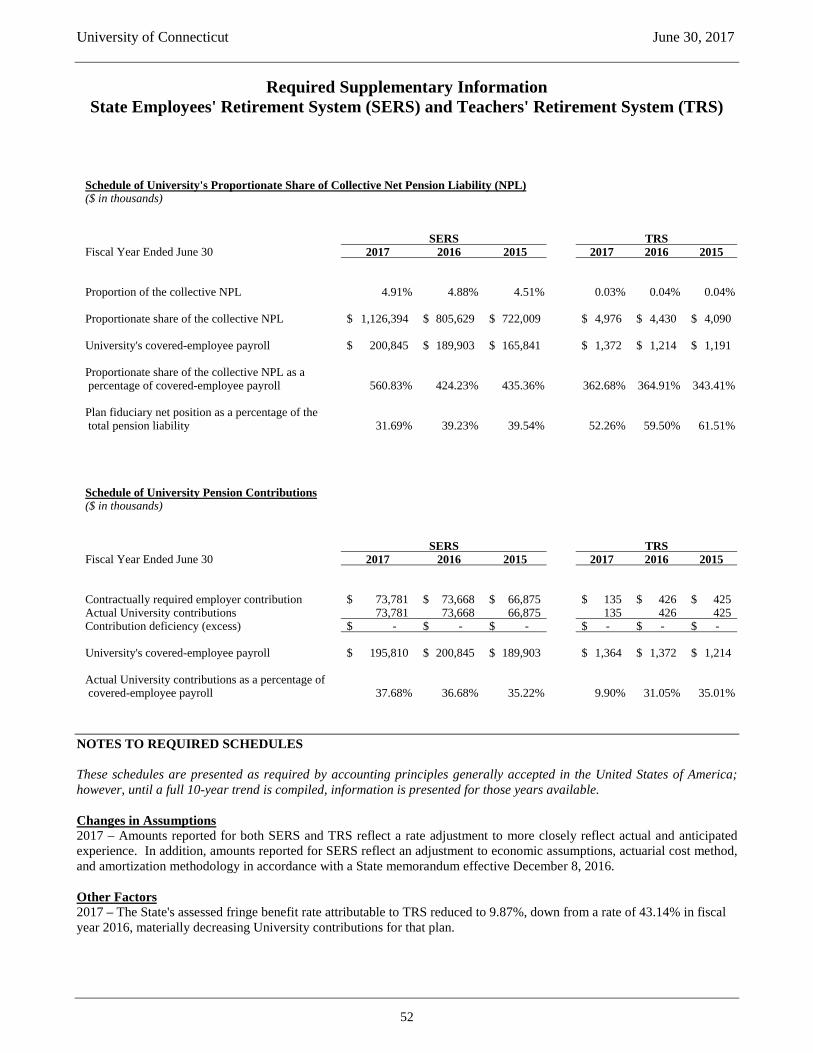
University of Connecticut June 30, 2017
52
Required Supplementary Information State Employees' Retirement System (SERS) and Teachers' Retirement System (TRS)
NOTES TO REQUIRED SCHEDULES These schedules are presented as required by accounting principles generally accepted in the United States of America; however, until a full 10-year trend is compiled, information is presented for those years available. Changes in Assumptions 2017 – Amounts reported for both SERS and TRS reflect a rate adjustment to more closely reflect actual and anticipated experience. In addition, amounts reported for SERS reflect an adjustment to economic assumptions, actuarial cost method, and amortization methodology in accordance with a State memorandum effective December 8, 2016. Other Factors 2017 – The State's assessed fringe benefit rate attributable to TRS reduced to 9.87%, down from a rate of 43.14% in fiscal year 2016, materially decreasing University contributions for that plan.
Schedule of University's Proportionate Share of Collective Net Pension Liability (NPL)($ in thousands)
Fiscal Year Ended June 30 2017 2016 2015 2017 2016 2015
Proportion of the collective NPL 4.91% 4.88% 4.51% 0.03% 0.04% 0.04%
Proportionate share of the collective NPL 1,126,394$ 805,629$ 722,009$ 4,976$ 4,430$ 4,090$
University's covered-employee payroll 200,845$ 189,903$ 165,841$ 1,372$ 1,214$ 1,191$
Proportionate share of the collective NPL as a percentage of covered-employee payroll 560.83% 424.23% 435.36% 362.68% 364.91% 343.41%
Plan fiduciary net position as a percentage of the total pension liability 31.69% 39.23% 39.54% 52.26% 59.50% 61.51%
Schedule of University Pension Contributions($ in thousands)
Fiscal Year Ended June 30 2017 2016 2015 2017 2016 2015
Contractually required employer contribution 73,781$ 73,668$ 66,875$ 135$ 426$ 425$ Actual University contributions 73,781 73,668 66,875 135 426 425 Contribution deficiency (excess) -$ -$ -$ -$ -$ -$
University's covered-employee payroll 195,810$ 200,845$ 189,903$ 1,364$ 1,372$ 1,214$
Actual University contributions as a percentage of covered-employee payroll 37.68% 36.68% 35.22% 9.90% 31.05% 35.01%
SERS TRS
SERS TRS

53
STATISTICAL SECTION
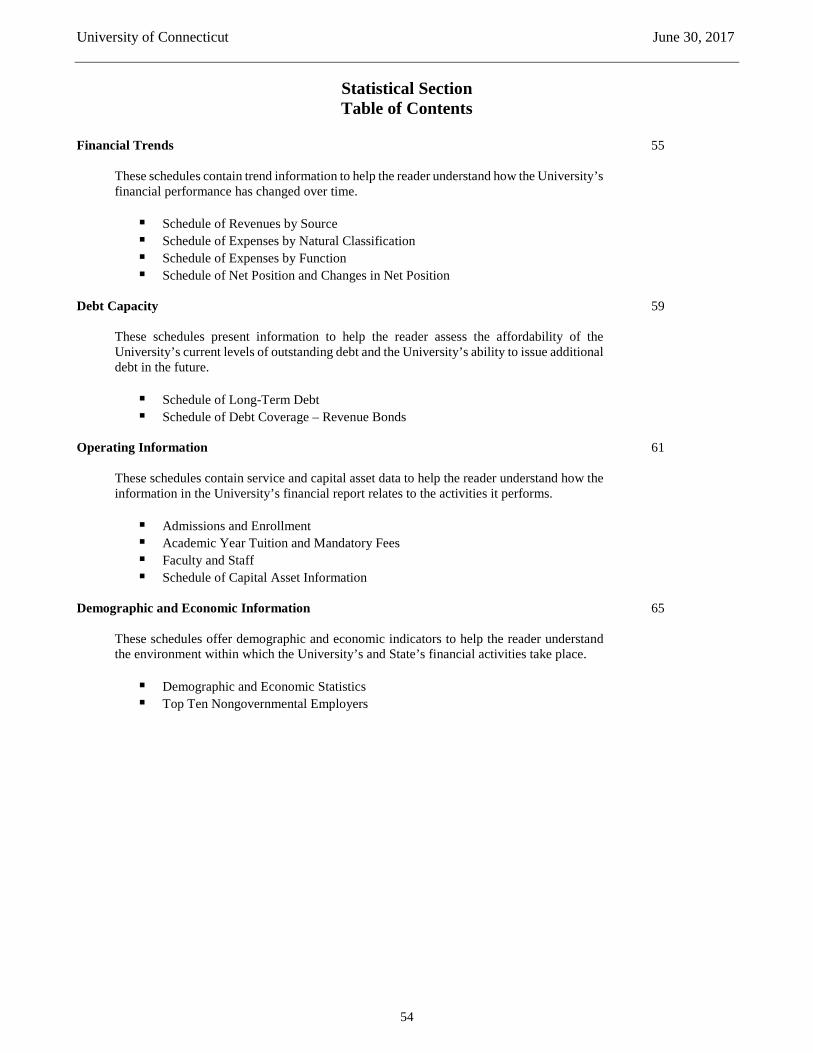
University of Connecticut June 30, 2017
54
Statistical Section Table of Contents
Financial Trends 55
These schedules contain trend information to help the reader understand how the University’s financial performance has changed over time. Schedule of Revenues by Source Schedule of Expenses by Natural Classification Schedule of Expenses by Function Schedule of Net Position and Changes in Net Position
Debt Capacity 59
These schedules present information to help the reader assess the affordability of the University’s current levels of outstanding debt and the University’s ability to issue additional debt in the future. Schedule of Long-Term Debt Schedule of Debt Coverage – Revenue Bonds
Operating Information 61
These schedules contain service and capital asset data to help the reader understand how the information in the University’s financial report relates to the activities it performs. Admissions and Enrollment Academic Year Tuition and Mandatory Fees Faculty and Staff Schedule of Capital Asset Information
Demographic and Economic Information 65
These schedules offer demographic and economic indicators to help the reader understand the environment within which the University’s and State’s financial activities take place. Demographic and Economic Statistics Top Ten Nongovernmental Employers
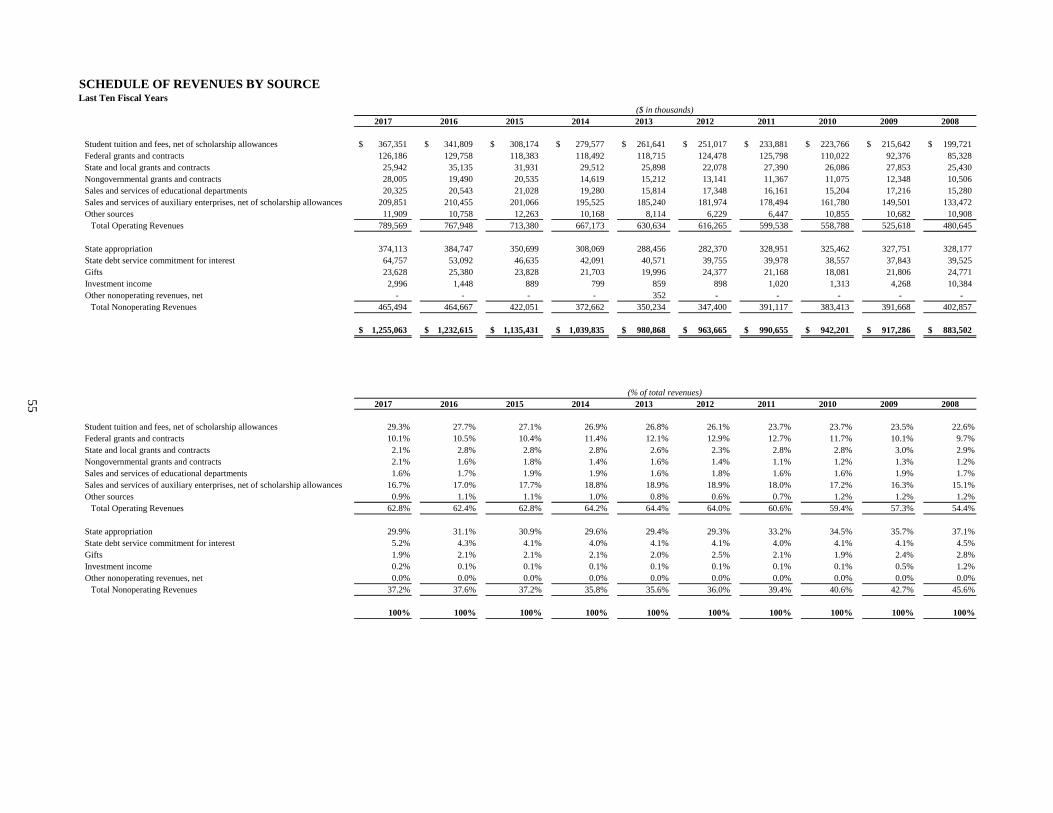
55
SCHEDULE OF REVENUES BY SOURCELast Ten Fiscal Years
2017 2016 2015 2014 2013 2012 2011 2010 2009 2008
Student tuition and fees, net of scholarship allowances 367,351$ 341,809$ 308,174$ 279,577$ 261,641$ 251,017$ 233,881$ 223,766$ 215,642$ 199,721$ Federal grants and contracts 126,186 129,758 118,383 118,492 118,715 124,478 125,798 110,022 92,376 85,328 State and local grants and contracts 25,942 35,135 31,931 29,512 25,898 22,078 27,390 26,086 27,853 25,430 Nongovernmental grants and contracts 28,005 19,490 20,535 14,619 15,212 13,141 11,367 11,075 12,348 10,506 Sales and services of educational departments 20,325 20,543 21,028 19,280 15,814 17,348 16,161 15,204 17,216 15,280 Sales and services of auxiliary enterprises, net of scholarship allowances 209,851 210,455 201,066 195,525 185,240 181,974 178,494 161,780 149,501 133,472 Other sources 11,909 10,758 12,263 10,168 8,114 6,229 6,447 10,855 10,682 10,908
Total Operating Revenues 789,569 767,948 713,380 667,173 630,634 616,265 599,538 558,788 525,618 480,645
State appropriation 374,113 384,747 350,699 308,069 288,456 282,370 328,951 325,462 327,751 328,177 State debt service commitment for interest 64,757 53,092 46,635 42,091 40,571 39,755 39,978 38,557 37,843 39,525 Gifts 23,628 25,380 23,828 21,703 19,996 24,377 21,168 18,081 21,806 24,771 Investment income 2,996 1,448 889 799 859 898 1,020 1,313 4,268 10,384 Other nonoperating revenues, net - - - - 352 - - - - -
Total Nonoperating Revenues 465,494 464,667 422,051 372,662 350,234 347,400 391,117 383,413 391,668 402,857
1,255,063$ 1,232,615$ 1,135,431$ 1,039,835$ 980,868$ 963,665$ 990,655$ 942,201$ 917,286$ 883,502$
2017 2016 2015 2014 2013 2012 2011 2010 2009 2008
Student tuition and fees, net of scholarship allowances 29.3% 27.7% 27.1% 26.9% 26.8% 26.1% 23.7% 23.7% 23.5% 22.6%Federal grants and contracts 10.1% 10.5% 10.4% 11.4% 12.1% 12.9% 12.7% 11.7% 10.1% 9.7%State and local grants and contracts 2.1% 2.8% 2.8% 2.8% 2.6% 2.3% 2.8% 2.8% 3.0% 2.9%Nongovernmental grants and contracts 2.1% 1.6% 1.8% 1.4% 1.6% 1.4% 1.1% 1.2% 1.3% 1.2%Sales and services of educational departments 1.6% 1.7% 1.9% 1.9% 1.6% 1.8% 1.6% 1.6% 1.9% 1.7%Sales and services of auxiliary enterprises, net of scholarship allowances 16.7% 17.0% 17.7% 18.8% 18.9% 18.9% 18.0% 17.2% 16.3% 15.1%Other sources 0.9% 1.1% 1.1% 1.0% 0.8% 0.6% 0.7% 1.2% 1.2% 1.2%
Total Operating Revenues 62.8% 62.4% 62.8% 64.2% 64.4% 64.0% 60.6% 59.4% 57.3% 54.4%
State appropriation 29.9% 31.1% 30.9% 29.6% 29.4% 29.3% 33.2% 34.5% 35.7% 37.1%State debt service commitment for interest 5.2% 4.3% 4.1% 4.0% 4.1% 4.1% 4.0% 4.1% 4.1% 4.5%Gifts 1.9% 2.1% 2.1% 2.1% 2.0% 2.5% 2.1% 1.9% 2.4% 2.8%Investment income 0.2% 0.1% 0.1% 0.1% 0.1% 0.1% 0.1% 0.1% 0.5% 1.2%Other nonoperating revenues, net 0.0% 0.0% 0.0% 0.0% 0.0% 0.0% 0.0% 0.0% 0.0% 0.0%
Total Nonoperating Revenues 37.2% 37.6% 37.2% 35.8% 35.6% 36.0% 39.4% 40.6% 42.7% 45.6%
100% 100% 100% 100% 100% 100% 100% 100% 100% 100%
(% of total revenues)
($ in thousands)

56
SCHEDULE OF EXPENSES BY NATURAL CLASSIFICATIONLast Ten Fiscal Years
2017 2016 2015 2014 2013 2012 2011 2010 2009 2008
Salaries and wages 556,411$ 557,497$ 542,082$ 521,076$ 482,685$ 474,385$ 472,725$ 444,481$ 456,102$ 435,751$ Fringe benefits 349,328 287,553 271,164 237,715 190,549 172,765 168,133 157,746 155,215 151,888 Supplies and other expenses 245,357 248,651 217,413 211,654 205,774 190,442 208,789 192,793 188,420 158,413 Utilities 19,039 19,737 23,212 20,963 19,725 21,684 26,506 27,810 33,600 29,224 Depreciation and amortization 104,807 98,767 95,990 95,377 91,713 88,478 90,335 90,039 90,037 100,187 Scholarships and fellowships 11,791 9,657 10,713 10,953 8,070 9,039 9,910 9,151 8,943 7,519
Total Operating Expenses 1,286,733 1,221,862 1,160,574 1,097,738 998,516 956,793 976,398 922,020 932,317 882,982
Interest expense 59,129 51,333 46,420 45,955 46,961 47,117 48,824 48,558 48,916 51,247 Transfers to State General Fund - - - - - - 15,000 8,000 - - Other nonoperating expenses, net 1,776 3,893 1,540 1,873 - 1,635 297 1,957 4,247 2,869
Total Nonoperating Expenses 60,905 55,226 47,960 47,828 46,961 48,752 64,121 58,515 53,163 54,116
1,347,638$ 1,277,088$ 1,208,534$ 1,145,566$ 1,045,477$ 1,005,545$ 1,040,519$ 980,535$ 985,480$ 937,098$
2017 2016 2015 2014 2013 2012 2011 2010 2009 2008
Salaries and wages 41.3% 43.6% 44.9% 45.5% 46.1% 47.1% 45.5% 45.3% 46.3% 46.5%Fringe benefits 25.9% 22.5% 22.5% 20.8% 18.2% 17.2% 16.2% 16.1% 15.8% 16.2%Supplies and other expenses 18.2% 19.6% 18.0% 18.4% 19.7% 18.9% 20.0% 19.7% 19.1% 16.9%Utilities 1.4% 1.5% 1.9% 1.8% 1.9% 2.2% 2.5% 2.8% 3.4% 3.1%Depreciation and amortization 7.8% 7.7% 7.9% 8.3% 8.8% 8.8% 8.7% 9.2% 9.1% 10.7%Scholarships and fellowships 0.9% 0.8% 0.9% 1.0% 0.8% 0.9% 1.0% 0.9% 0.9% 0.8%
Total Operating Expenses 95.5% 95.7% 96.1% 95.8% 95.5% 95.1% 93.9% 94.0% 94.6% 94.2%
Interest expense 4.4% 4.0% 3.8% 4.0% 4.5% 4.7% 4.7% 5.0% 5.0% 5.5%Transfers to State General Fund 0.0% 0.0% 0.0% 0.0% 0.0% 0.0% 1.4% 0.8% 0.0% 0.0%Other nonoperating expenses, net 0.1% 0.3% 0.1% 0.2% 0.0% 0.2% 0.0% 0.2% 0.4% 0.3%
Total Nonoperating Expenses 4.5% 4.3% 3.9% 4.2% 4.5% 4.9% 6.1% 6.0% 5.4% 5.8%
100% 100% 100% 100% 100% 100% 100% 100% 100% 100%
(% of total expenses)
($ in thousands)
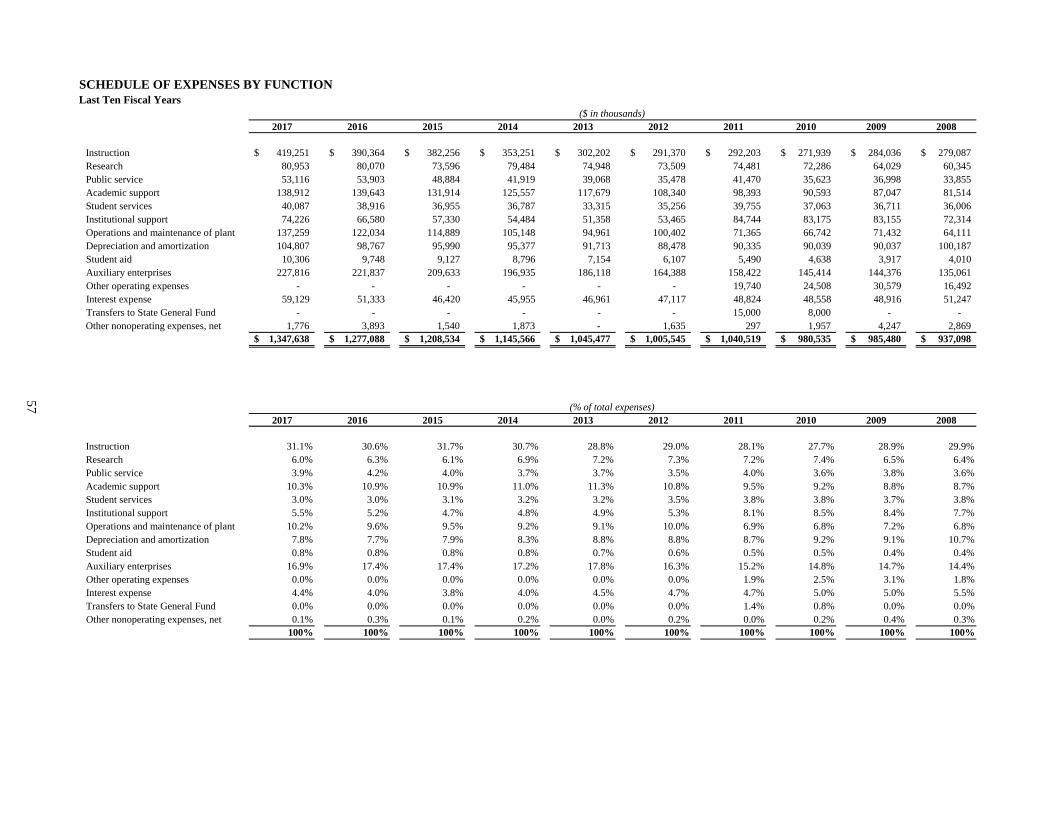
57
SCHEDULE OF EXPENSES BY FUNCTIONLast Ten Fiscal Years
2017 2016 2015 2014 2013 2012 2011 2010 2009 2008
Instruction 419,251$ 390,364$ 382,256$ 353,251$ 302,202$ 291,370$ 292,203$ 271,939$ 284,036$ 279,087$ Research 80,953 80,070 73,596 79,484 74,948 73,509 74,481 72,286 64,029 60,345 Public service 53,116 53,903 48,884 41,919 39,068 35,478 41,470 35,623 36,998 33,855 Academic support 138,912 139,643 131,914 125,557 117,679 108,340 98,393 90,593 87,047 81,514 Student services 40,087 38,916 36,955 36,787 33,315 35,256 39,755 37,063 36,711 36,006 Institutional support 74,226 66,580 57,330 54,484 51,358 53,465 84,744 83,175 83,155 72,314 Operations and maintenance of plant 137,259 122,034 114,889 105,148 94,961 100,402 71,365 66,742 71,432 64,111 Depreciation and amortization 104,807 98,767 95,990 95,377 91,713 88,478 90,335 90,039 90,037 100,187 Student aid 10,306 9,748 9,127 8,796 7,154 6,107 5,490 4,638 3,917 4,010 Auxiliary enterprises 227,816 221,837 209,633 196,935 186,118 164,388 158,422 145,414 144,376 135,061 Other operating expenses - - - - - - 19,740 24,508 30,579 16,492 Interest expense 59,129 51,333 46,420 45,955 46,961 47,117 48,824 48,558 48,916 51,247 Transfers to State General Fund - - - - - - 15,000 8,000 - - Other nonoperating expenses, net 1,776 3,893 1,540 1,873 - 1,635 297 1,957 4,247 2,869
1,347,638$ 1,277,088$ 1,208,534$ 1,145,566$ 1,045,477$ 1,005,545$ 1,040,519$ 980,535$ 985,480$ 937,098$
2017 2016 2015 2014 2013 2012 2011 2010 2009 2008
Instruction 31.1% 30.6% 31.7% 30.7% 28.8% 29.0% 28.1% 27.7% 28.9% 29.9%Research 6.0% 6.3% 6.1% 6.9% 7.2% 7.3% 7.2% 7.4% 6.5% 6.4%Public service 3.9% 4.2% 4.0% 3.7% 3.7% 3.5% 4.0% 3.6% 3.8% 3.6%Academic support 10.3% 10.9% 10.9% 11.0% 11.3% 10.8% 9.5% 9.2% 8.8% 8.7%Student services 3.0% 3.0% 3.1% 3.2% 3.2% 3.5% 3.8% 3.8% 3.7% 3.8%Institutional support 5.5% 5.2% 4.7% 4.8% 4.9% 5.3% 8.1% 8.5% 8.4% 7.7%Operations and maintenance of plant 10.2% 9.6% 9.5% 9.2% 9.1% 10.0% 6.9% 6.8% 7.2% 6.8%Depreciation and amortization 7.8% 7.7% 7.9% 8.3% 8.8% 8.8% 8.7% 9.2% 9.1% 10.7%Student aid 0.8% 0.8% 0.8% 0.8% 0.7% 0.6% 0.5% 0.5% 0.4% 0.4%Auxiliary enterprises 16.9% 17.4% 17.4% 17.2% 17.8% 16.3% 15.2% 14.8% 14.7% 14.4%Other operating expenses 0.0% 0.0% 0.0% 0.0% 0.0% 0.0% 1.9% 2.5% 3.1% 1.8%Interest expense 4.4% 4.0% 3.8% 4.0% 4.5% 4.7% 4.7% 5.0% 5.0% 5.5%Transfers to State General Fund 0.0% 0.0% 0.0% 0.0% 0.0% 0.0% 1.4% 0.8% 0.0% 0.0%Other nonoperating expenses, net 0.1% 0.3% 0.1% 0.2% 0.0% 0.2% 0.0% 0.2% 0.4% 0.3%
100% 100% 100% 100% 100% 100% 100% 100% 100% 100%
(% of total expenses)
($ in thousands)
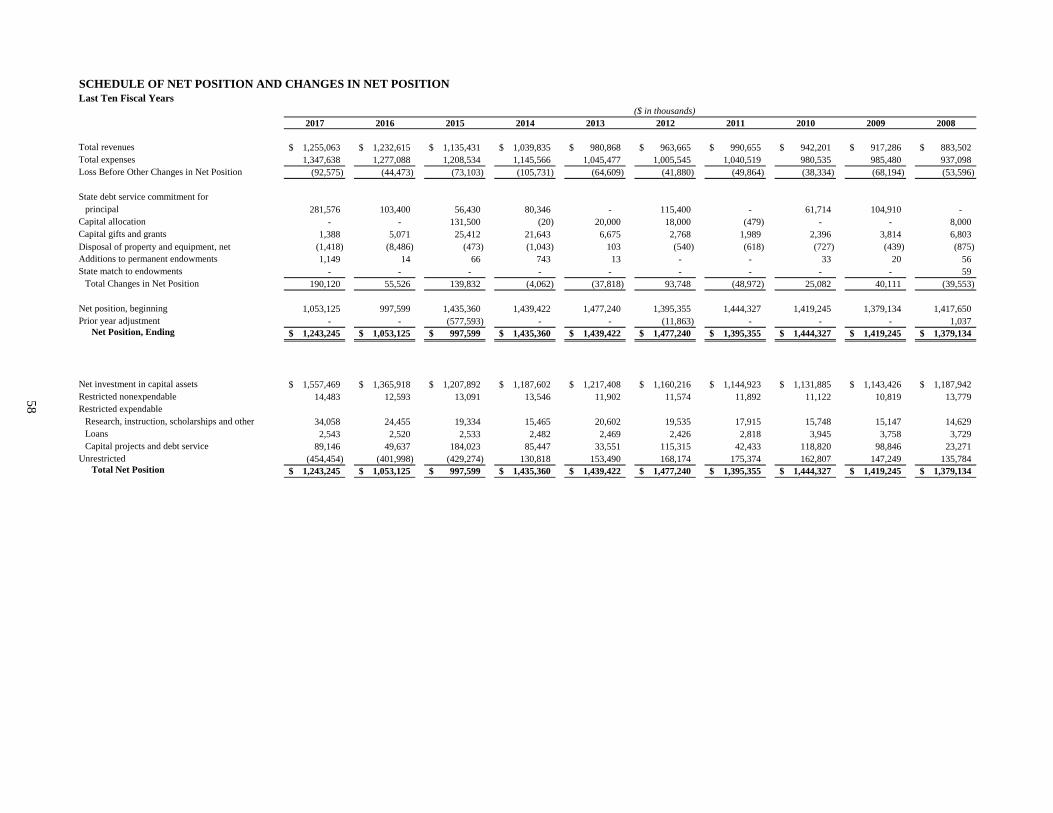
58
SCHEDULE OF NET POSITION AND CHANGES IN NET POSITIONLast Ten Fiscal Years
2017 2016 2015 2014 2013 2012 2011 2010 2009 2008
Total revenues 1,255,063$ 1,232,615$ 1,135,431$ 1,039,835$ 980,868$ 963,665$ 990,655$ 942,201$ 917,286$ 883,502$ Total expenses 1,347,638 1,277,088 1,208,534 1,145,566 1,045,477 1,005,545 1,040,519 980,535 985,480 937,098 Loss Before Other Changes in Net Position (92,575) (44,473) (73,103) (105,731) (64,609) (41,880) (49,864) (38,334) (68,194) (53,596)
State debt service commitment forprincipal 281,576 103,400 56,430 80,346 - 115,400 - 61,714 104,910 -
Capital allocation - - 131,500 (20) 20,000 18,000 (479) - - 8,000 Capital gifts and grants 1,388 5,071 25,412 21,643 6,675 2,768 1,989 2,396 3,814 6,803 Disposal of property and equipment, net (1,418) (8,486) (473) (1,043) 103 (540) (618) (727) (439) (875) Additions to permanent endowments 1,149 14 66 743 13 - - 33 20 56 State match to endowments - - - - - - - - - 59
Total Changes in Net Position 190,120 55,526 139,832 (4,062) (37,818) 93,748 (48,972) 25,082 40,111 (39,553)
Net position, beginning 1,053,125 997,599 1,435,360 1,439,422 1,477,240 1,395,355 1,444,327 1,419,245 1,379,134 1,417,650 Prior year adjustment - - (577,593) - - (11,863) - - - 1,037
Net Position, Ending 1,243,245$ 1,053,125$ 997,599$ 1,435,360$ 1,439,422$ 1,477,240$ 1,395,355$ 1,444,327$ 1,419,245$ 1,379,134$
Net investment in capital assets 1,557,469$ 1,365,918$ 1,207,892$ 1,187,602$ 1,217,408$ 1,160,216$ 1,144,923$ 1,131,885$ 1,143,426$ 1,187,942$ Restricted nonexpendable 14,483 12,593 13,091 13,546 11,902 11,574 11,892 11,122 10,819 13,779 Restricted expendable
Research, instruction, scholarships and other 34,058 24,455 19,334 15,465 20,602 19,535 17,915 15,748 15,147 14,629 Loans 2,543 2,520 2,533 2,482 2,469 2,426 2,818 3,945 3,758 3,729 Capital projects and debt service 89,146 49,637 184,023 85,447 33,551 115,315 42,433 118,820 98,846 23,271
Unrestricted (454,454) (401,998) (429,274) 130,818 153,490 168,174 175,374 162,807 147,249 135,784 Total Net Position 1,243,245$ 1,053,125$ 997,599$ 1,435,360$ 1,439,422$ 1,477,240$ 1,395,355$ 1,444,327$ 1,419,245$ 1,379,134$
($ in thousands)

59
SCHEDULE OF LONG-TERM DEBTLast Ten Fiscal Years
2017 2016 2015 2014 2013 2012 2011 2010 2009 2008General obligation bonds 1,504,995$ 1,303,870$ 1,147,985$ 1,023,985$ 828,795$ 903,550$ 804,310$ 877,492$ 844,945$ 763,413$ Revenue bonds 105,955 112,410 118,625 124,615 130,415 154,170 159,290 164,375 172,830 177,330 Self-liquidating bonds - 275 349 551 1,050 2,171 2,953 3,793 4,786 5,808 Capital lease obligations 42,818 47,229 51,398 55,437 59,320 62,785 66,098 69,267 72,298 75,196 Installment loans and other 117 5,487 671 1,027 1,319 1,727 150 253 416 178
1,653,885 1,469,271 1,319,028 1,205,615 1,020,899 1,124,403 1,032,801 1,115,180 1,095,275 1,021,925
Premiums and discounts 201,858 172,757 134,213 107,074 82,980 46,320 25,849 27,956 18,825 13,727 Total Long-Term Debt 1,855,743 1,642,028 1,453,241 1,312,689 1,103,879 1,170,723 1,058,650 1,143,136 1,114,100 1,035,652
Less: State debt service commitment for general obligation bonds (1,504,995) (1,303,870) (1,147,985) (1,023,985) (828,795) (903,550) (804,310) (877,492) (844,945) (763,413)
Total Long-Term Debt, Net 350,748$ 338,158$ 305,256$ 288,704$ 275,084$ 267,173$ 254,340$ 265,644$ 269,155$ 272,239$
Full-time equivalent students* 29,220 28,832 28,134 27,461 27,036 27,240 26,686 26,705 26,382 24,147
Outstanding debt per student 12,004$ 11,729$ 10,850$ 10,513$ 10,175$ 9,808$ 9,531$ 9,947$ 10,202$ 11,274$
*Source: IPEDS (Integrated Postsecondary Education Data System) 12-month Instructional Activity surveys for fiscal years 2008 to 2017, including Storrs and Regional Campuses.
($ in thousands, except for outstanding debt per student)
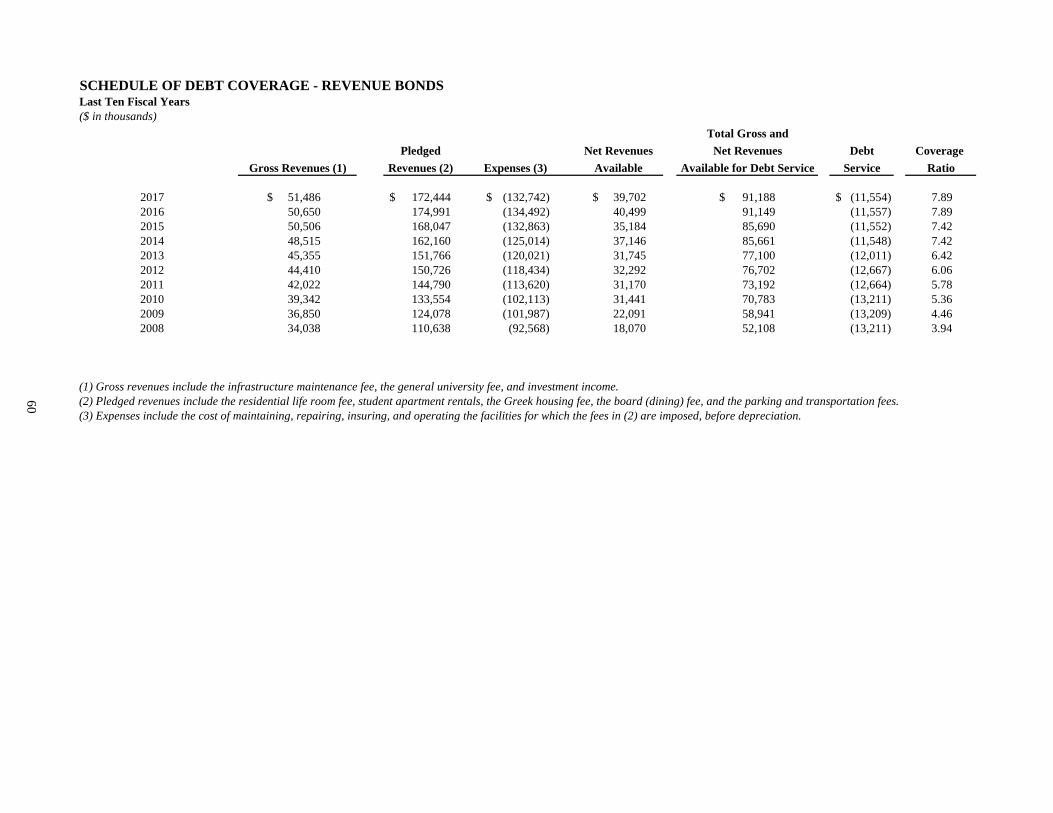
60
SCHEDULE OF DEBT COVERAGE - REVENUE BONDSLast Ten Fiscal Years($ in thousands)
Pledged DebtRevenues (2) Service
2017 51,486$ 172,444$ (132,742)$ 39,702$ 91,188$ (11,554)$ 7.89 2016 50,650 174,991 (134,492) 40,499 91,149 (11,557) 7.89 2015 50,506 168,047 (132,863) 35,184 85,690 (11,552) 7.42 2014 48,515 162,160 (125,014) 37,146 85,661 (11,548) 7.42 2013 45,355 151,766 (120,021) 31,745 77,100 (12,011) 6.42 2012 44,410 150,726 (118,434) 32,292 76,702 (12,667) 6.06 2011 42,022 144,790 (113,620) 31,170 73,192 (12,664) 5.78 2010 39,342 133,554 (102,113) 31,441 70,783 (13,211) 5.36 2009 36,850 124,078 (101,987) 22,091 58,941 (13,209) 4.46 2008 34,038 110,638 (92,568) 18,070 52,108 (13,211) 3.94
(1) Gross revenues include the infrastructure maintenance fee, the general university fee, and investment income.(2) Pledged revenues include the residential life room fee, student apartment rentals, the Greek housing fee, the board (dining) fee, and the parking and transportation fees.(3) Expenses include the cost of maintaining, repairing, insuring, and operating the facilities for which the fees in (2) are imposed, before depreciation.
Total Gross andNet Revenues Net Revenues Coverage
Gross Revenues (1) Expenses (3) Available Available for Debt Service Ratio
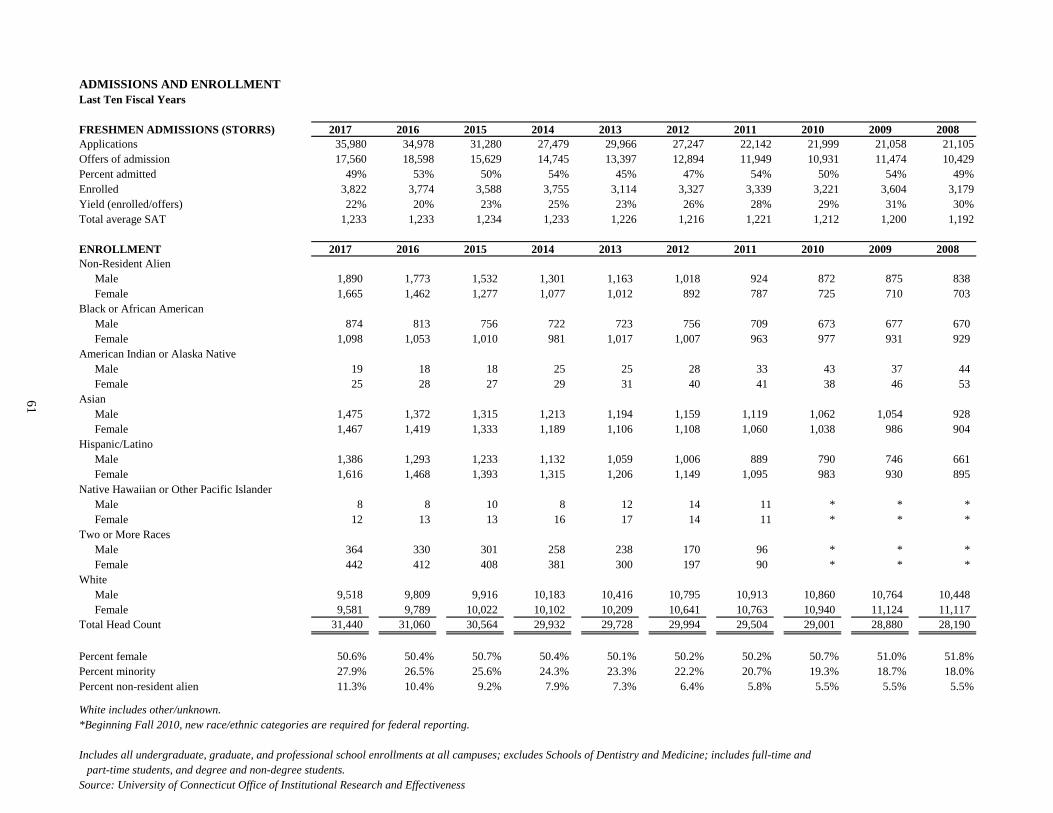
61
ADMISSIONS AND ENROLLMENTLast Ten Fiscal Years
FRESHMEN ADMISSIONS (STORRS) 2017 2016 2015 2014 2013 2012 2011 2010 2009 2008Applications 35,980 34,978 31,280 27,479 29,966 27,247 22,142 21,999 21,058 21,105Offers of admission 17,560 18,598 15,629 14,745 13,397 12,894 11,949 10,931 11,474 10,429Percent admitted 49% 53% 50% 54% 45% 47% 54% 50% 54% 49%Enrolled 3,822 3,774 3,588 3,755 3,114 3,327 3,339 3,221 3,604 3,179Yield (enrolled/offers) 22% 20% 23% 25% 23% 26% 28% 29% 31% 30%Total average SAT 1,233 1,233 1,234 1,233 1,226 1,216 1,221 1,212 1,200 1,192
ENROLLMENT 2017 2016 2015 2014 2013 2012 2011 2010 2009 2008Non-Resident Alien
Male 1,890 1,773 1,532 1,301 1,163 1,018 924 872 875 838 Female 1,665 1,462 1,277 1,077 1,012 892 787 725 710 703
Black or African AmericanMale 874 813 756 722 723 756 709 673 677 670 Female 1,098 1,053 1,010 981 1,017 1,007 963 977 931 929
American Indian or Alaska NativeMale 19 18 18 25 25 28 33 43 37 44 Female 25 28 27 29 31 40 41 38 46 53
AsianMale 1,475 1,372 1,315 1,213 1,194 1,159 1,119 1,062 1,054 928 Female 1,467 1,419 1,333 1,189 1,106 1,108 1,060 1,038 986 904
Hispanic/LatinoMale 1,386 1,293 1,233 1,132 1,059 1,006 889 790 746 661 Female 1,616 1,468 1,393 1,315 1,206 1,149 1,095 983 930 895
Native Hawaiian or Other Pacific IslanderMale 8 8 10 8 12 14 11 * * *Female 12 13 13 16 17 14 11 * * *
Two or More RacesMale 364 330 301 258 238 170 96 * * *Female 442 412 408 381 300 197 90 * * *
WhiteMale 9,518 9,809 9,916 10,183 10,416 10,795 10,913 10,860 10,764 10,448 Female 9,581 9,789 10,022 10,102 10,209 10,641 10,763 10,940 11,124 11,117
Total Head Count 31,440 31,060 30,564 29,932 29,728 29,994 29,504 29,001 28,880 28,190
Percent female 50.6% 50.4% 50.7% 50.4% 50.1% 50.2% 50.2% 50.7% 51.0% 51.8%Percent minority 27.9% 26.5% 25.6% 24.3% 23.3% 22.2% 20.7% 19.3% 18.7% 18.0%Percent non-resident alien 11.3% 10.4% 9.2% 7.9% 7.3% 6.4% 5.8% 5.5% 5.5% 5.5%
White includes other/unknown. *Beginning Fall 2010, new race/ethnic categories are required for federal reporting.
Includes all undergraduate, graduate, and professional school enrollments at all campuses; excludes Schools of Dentistry and Medicine; includes full-time and part-time students, and degree and non-degree students.
Source: University of Connecticut Office of Institutional Research and Effectiveness
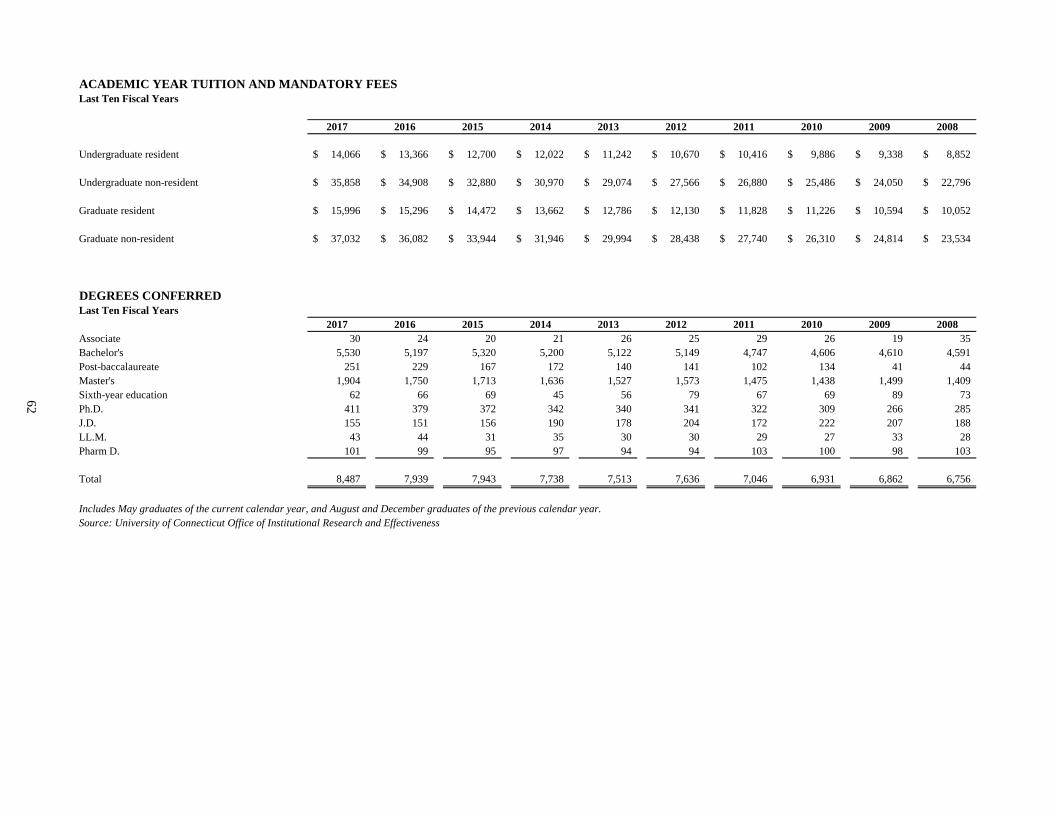
62
ACADEMIC YEAR TUITION AND MANDATORY FEESLast Ten Fiscal Years
2017 2016 2015 2014 2013 2012 2011 2010 2009 2008
Undergraduate resident 14,066$ 13,366$ 12,700$ 12,022$ 11,242$ 10,670$ 10,416$ 9,886$ 9,338$ 8,852$
Undergraduate non-resident 35,858$ 34,908$ 32,880$ 30,970$ 29,074$ 27,566$ 26,880$ 25,486$ 24,050$ 22,796$
Graduate resident 15,996$ 15,296$ 14,472$ 13,662$ 12,786$ 12,130$ 11,828$ 11,226$ 10,594$ 10,052$
Graduate non-resident 37,032$ 36,082$ 33,944$ 31,946$ 29,994$ 28,438$ 27,740$ 26,310$ 24,814$ 23,534$
DEGREES CONFERREDLast Ten Fiscal Years
2017 2016 2015 2014 2013 2012 2011 2010 2009 2008Associate 30 24 20 21 26 25 29 26 19 35 Bachelor's 5,530 5,197 5,320 5,200 5,122 5,149 4,747 4,606 4,610 4,591 Post-baccalaureate 251 229 167 172 140 141 102 134 41 44 Master's 1,904 1,750 1,713 1,636 1,527 1,573 1,475 1,438 1,499 1,409 Sixth-year education 62 66 69 45 56 79 67 69 89 73 Ph.D. 411 379 372 342 340 341 322 309 266 285 J.D. 155 151 156 190 178 204 172 222 207 188 LL.M. 43 44 31 35 30 30 29 27 33 28 Pharm D. 101 99 95 97 94 94 103 100 98 103
Total 8,487 7,939 7,943 7,738 7,513 7,636 7,046 6,931 6,862 6,756
Includes May graduates of the current calendar year, and August and December graduates of the previous calendar year. Source: University of Connecticut Office of Institutional Research and Effectiveness

63
FACULTY AND STAFFFall EmploymentLast Ten Fiscal Years
2017 2016 2015 2014 2013 2012 2011 2010 2009 2008FACULTY
Full-time 1,518 1,489 1,517 1,485 1,377 1,330 1,304 1,286 1,324 1,294 Part-time 32 30 33 34 39 43 43 35 36 34 Total Faculty 1,550 1,519 1,550 1,519 1,416 1,373 1,347 1,321 1,360 1,328
Tenured 841 848 877 874 848 841 815 777 815 809 Percentage tenured 54% 56% 57% 58% 60% 61% 61% 59% 60% 61%
Mean salary of full-time teaching faculty 110,138$ 113,975$ 107,895$ 104,458$ 100,172$ 101,179$ 102,482$ 98,369$ 99,220$ 95,846$
STAFFFull-time 3,198 3,115 3,080 3,063 3,028 2,956 3,017 2,879 3,049 2,994 Part-time 82 158 186 175 180 181 222 210 222 233 Total Staff 3,280 3,273 3,266 3,238 3,208 3,137 3,239 3,089 3,271 3,227
Total Faculty and Staff 4,830 4,792 4,816 4,757 4,624 4,510 4,586 4,410 4,631 4,555
Student to faculty ratio* 16 to 1 17 to 1 16 to 1 16 to 1 17 to 1 18 to 1 18 to 1 18 to 1 17 to 1 17 to 1
Full-time and part-time facultyFemale 41% 41% 39% 39% 40% 40% 39% 38% 37% 37%Minority 23% 23% 22% 22% 22% 21% 20% 20% 19% 18%
Full-time and part-time staff Female 57% 57% 58% 57% 58% 58% 58% 58% 58% 58%Minority 17% 17% 17% 17% 17% 17% 15% 15% 15% 15%
Staff covered by collective bargaining agreements 90% 90% 91% 91% 90% 91% 92% 91% 91% 91%
Adjunct lecturers 690 679 708 696 686 692 691 648 669 691
*Full-time equivalent students to full-time instructional faculty, Storrs and regional campuses. Source: University of Connecticut Office of Institutional Research and Effectiveness

64
SCHEDULE OF CAPITAL ASSET INFORMATIONLast Ten Fiscal Years
2017 2016 2015 2014 2013 2012 2011 2010 2009 2008Academic Buildings
Net assignable square feet (in thousands) 2,654 2,753 2,753 2,736 2,684 2,604 2,604 2,604 2,604 2,597 Number of buildings 168 171 171 171 171 172 172 172 172 172
Auxiliary and Independent Operations BuildingsNet assignable square feet (in thousands) 3,753 3,277 3,336 3,279 3,279 3,396 3,430 3,430 3,430 3,430 Number of buildings 189 193 209 213 213 217 220 220 220 220
Administrative and Support BuildingsNet assignable square feet (in thousands) 852 964 949 949 949 948 948 948 948 948 Number of buildings 88 97 96 96 96 95 95 95 95 95
Total Net Assignable Square Feet (in thousands) 7,259 6,994 7,038 6,964 6,912 6,948 6,982 6,982 6,982 6,975 Total Number of Buildings 445 461 476 480 480 484 487 487 487 487
Source: University of Connecticut Office of Cost Analysis and Office of University Planning, Design and Construction
2017 2016 2015 2014 2013 2012 2011 2010 2009 2008
Residential halls* 101 115 115 116 117 116 114 114 114 114
Residential hall occupancy 12,699 12,723 12,711 12,668 12,469 12,716 12,546 12,378 11,970 11,307
Percentage of main campus undergraduates in campus housing 67% 70% 71% 72% 72% 73% 74% 73% 71% 68%
*Residential halls include houses owned by the University and used for student housing.Source: Office of Institutional Research and Effectiveness
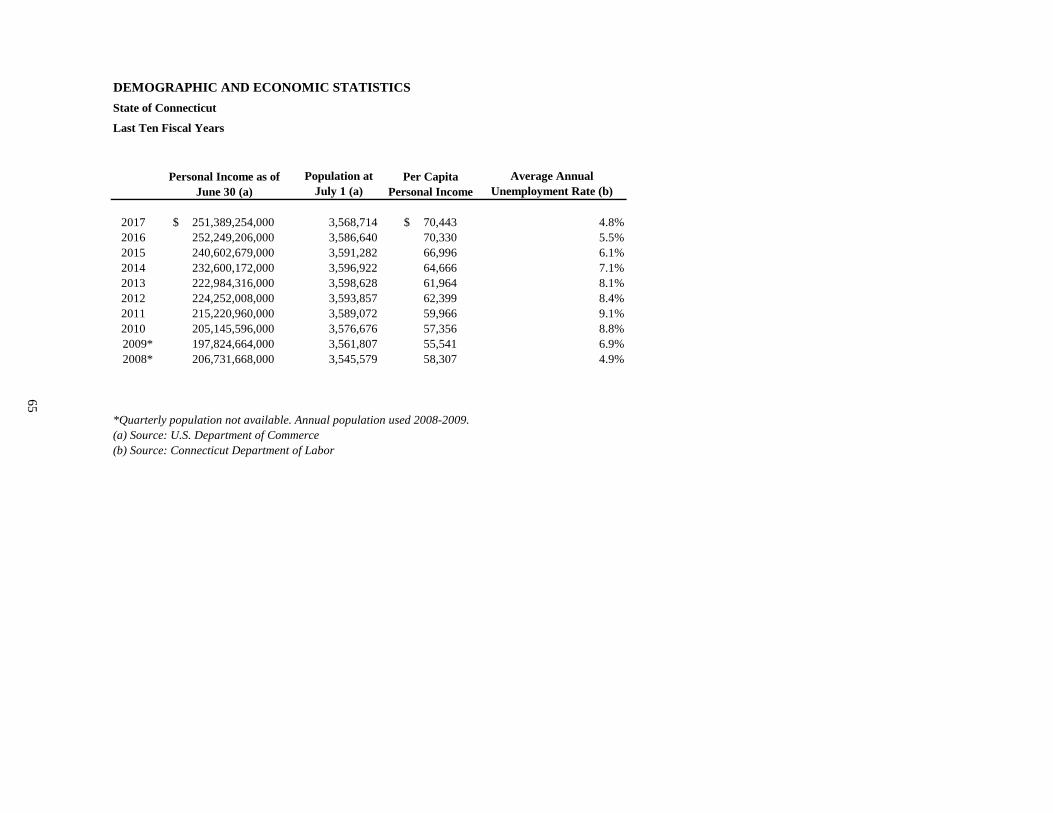
65
DEMOGRAPHIC AND ECONOMIC STATISTICSState of Connecticut
Last Ten Fiscal Years
Population at July 1 (a)
Average Annual Unemployment Rate (b)
2017 251,389,254,000$ 3,568,714 70,443$ 4.8%2016 252,249,206,000 3,586,640 70,330 5.5%2015 240,602,679,000 3,591,282 66,996 6.1%2014 232,600,172,000 3,596,922 64,666 7.1%2013 222,984,316,000 3,598,628 61,964 8.1%2012 224,252,008,000 3,593,857 62,399 8.4%2011 215,220,960,000 3,589,072 59,966 9.1%2010 205,145,596,000 3,576,676 57,356 8.8%2009* 197,824,664,000 3,561,807 55,541 6.9%2008* 206,731,668,000 3,545,579 58,307 4.9%
*Quarterly population not available. Annual population used 2008-2009.(a) Source: U.S. Department of Commerce(b) Source: Connecticut Department of Labor
Personal Income as of June 30 (a)
Per Capita Personal Income
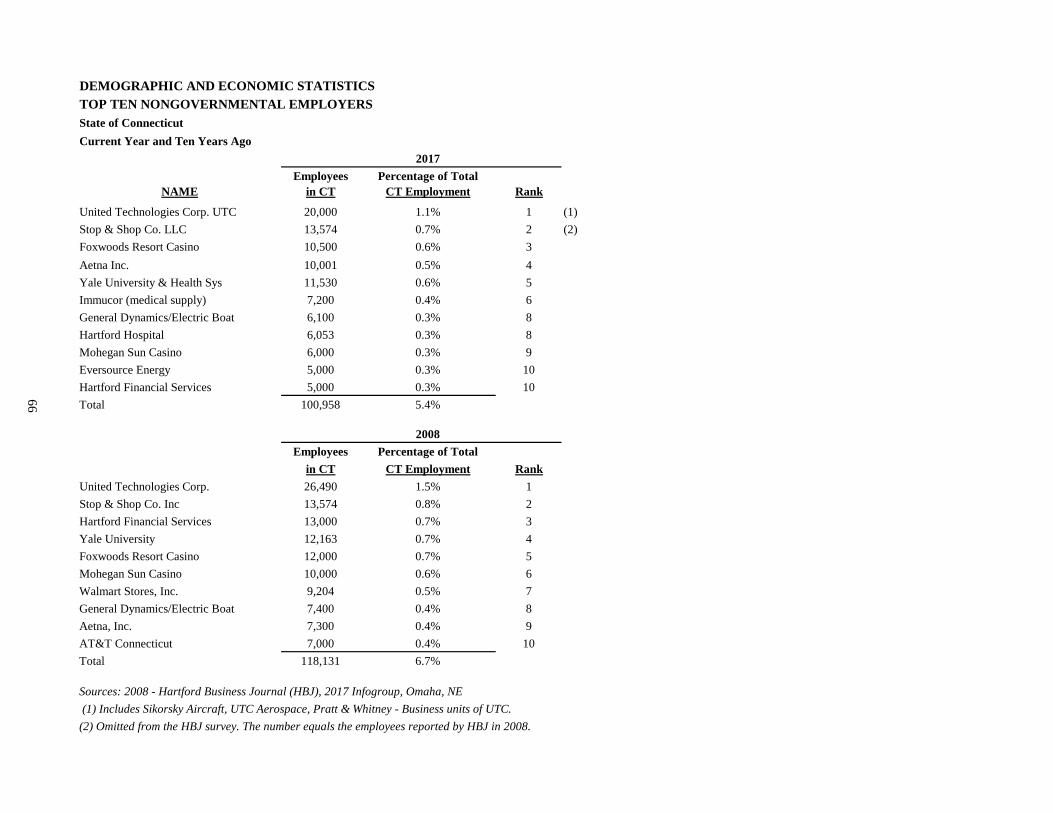
66
DEMOGRAPHIC AND ECONOMIC STATISTICSTOP TEN NONGOVERNMENTAL EMPLOYERSState of ConnecticutCurrent Year and Ten Years Ago
2017Employees Percentage of Total
NAME in CT CT Employment Rank
United Technologies Corp. UTC 20,000 1.1% 1 (1)Stop & Shop Co. LLC 13,574 0.7% 2 (2)Foxwoods Resort Casino 10,500 0.6% 3Aetna Inc. 10,001 0.5% 4Yale University & Health Sys 11,530 0.6% 5Immucor (medical supply) 7,200 0.4% 6General Dynamics/Electric Boat 6,100 0.3% 8Hartford Hospital 6,053 0.3% 8Mohegan Sun Casino 6,000 0.3% 9Eversource Energy 5,000 0.3% 10Hartford Financial Services 5,000 0.3% 10Total 100,958 5.4%
2008Employees Percentage of Total
in CT CT Employment RankUnited Technologies Corp. 26,490 1.5% 1Stop & Shop Co. Inc 13,574 0.8% 2Hartford Financial Services 13,000 0.7% 3Yale University 12,163 0.7% 4Foxwoods Resort Casino 12,000 0.7% 5Mohegan Sun Casino 10,000 0.6% 6Walmart Stores, Inc. 9,204 0.5% 7General Dynamics/Electric Boat 7,400 0.4% 8Aetna, Inc. 7,300 0.4% 9AT&T Connecticut 7,000 0.4% 10Total 118,131 6.7%
Sources: 2008 - Hartford Business Journal (HBJ), 2017 Infogroup, Omaha, NE (1) Includes Sikorsky Aircraft, UTC Aerospace, Pratt & Whitney - Business units of UTC. (2) Omitted from the HBJ survey. The number equals the employees reported by HBJ in 2008.

