composition, dynamics and function of extracellular ... · composition, dynamics and function of...
TRANSCRIPT
Composition, dynamics and function of
extracellular polymeric substances in
drinking-water biofilms
Dissertation
zur Erlangung des akademischen Grades eines
Doktors der Naturwissenschaften
– Dr. rer. nat. –
vorgelegt von
Witold Dariusz Michalowski
geboren in Warschau
Biofilm Centre – Aquatische Mikrobiologie
der
Universität Duisburg-Essen
2012
Die vorliegende Arbeit wurde im Zeitraum von Januar 2008 bis August
2012 im Arbeitskreis von Prof. Dr. Hans-Curt Flemming am Biofilm
Centre der Universität Duisburg-Essen durchgeführt.
Tag der Disputation: 06.11.2012
Gutachter: Prof. Dr. Hans-Curt Flemming
Prof. Dr. Ulrich Szewzyk
Vorsitzender: Prof. Dr. Jochen Stefan Gutmann

“Water, taken in moderation,
cannot hurt anybody”
- Mark Twain -
Acknowledgements
i
ACKNOWLEDGEMENTS
First of all I would like to express my gratefulness to Prof. Dr. Hans-Curt Flemming for setting
up this interesting project and for his excellent supervision throughout my research. Hans-
Curt, thank you for the inspiration, as well as the trust and the liberties to implement my
own ideas, which I was able to present at the very reasonable number of conferences I’ve
attended.
Thank you to Jost Wingender for the numerous and inspiring discussions and support
throughout all stages of my research.
I am deeply indebted to both, Prof. Dr. Hans-Curt Flemming and Dr. Jost Wingender, for
spending countless hours reviewing this manuscript and giving creative input.
I wish to express my gratidude to Prof. Dr. Ulrich Szewzyk for accepting the task of being my
co-referee.
Many thanks to the Max Buchner Research Foundation for financial support.
I would like to acknowledge Prof. Dr. Ursula Obst, Dr. Gerald Brenner-Weiß and Boris Kühl
from the KIT for giving me the opportunity to identify proteins in their lab.
Thanks to Daniel, Sascha and Mathias for their assistance during my first days in the lab, as
well as to Miriam for lots of advice and encouragement especially towards the end of this
work. I thank Barbara for the great work investigating parts of the dynamics of drinking-
water biofilms and Dominik for the incorporation experiments with P. aeruginosa. Thank you
to all current and former colleagues who worked with me in the department of Aquatic
Microbiolgy and who provided a great atmosphere and lots of fun. All of you contributed a
great deal to the success of this study.
A special thanks to Silke for the support, the encouragement, the advice and the distraction
whenever I needed it, as well as for proofreading this manuscript countless times. Silke,
thank you for travelling the world with me!
As last, I would like to thank my family and friends who had to suffer from my lack of time,
especially during the more demanding periods of this work.
Table of contents
ii
TABLE OF CONTENTS
ACKNOWLEDGEMENTS ................................................................................................................................ i
TABLE OF CONTENTS ....................................................................................................................................ii
LIST OF TABLES .......................................................................................................................................... vi
LIST OF FIGURES ....................................................................................................................................... viii
GLOSSARY ................................................................................................................................................. xi
ABSTRACT ............................................................................................................................................... xiii
1. INTRODUCTION ...................................................................................................................................... 1
1.1 The biofilm way of life ................................................................................................................... 1
1.2 Extracellular polymeric substances (EPS) ...................................................................................... 3
1.2.1 EPS components ..................................................................................................................... 6
1.2.2 EPS matrix formation ............................................................................................................ 14
1.2.3 Mechanical stability of biofilms ............................................................................................ 17
1.3 Biofilms in drinking water distribution systems .......................................................................... 19
1.4 Methods for biofilm and EPS analysis ......................................................................................... 22
1.4.1 Tools to study biofilm composition ...................................................................................... 23
1.4.2 Tools to study biofilm architecture ...................................................................................... 37
1.5 Aims of the study ......................................................................................................................... 41
2. MATERIALS ......................................................................................................................................... 43
2.1 Chemicals ..................................................................................................................................... 43
2.2 Cultivation media ........................................................................................................................ 46
2.3 Buffers and solutions ................................................................................................................... 47
2.4 Commercial kits ........................................................................................................................... 51
2.5 Enzymes ....................................................................................................................................... 51
2.6 Equipment ................................................................................................................................... 51
2.7 Software and databases .............................................................................................................. 54
3. METHODS ........................................................................................................................................... 55
Table of contents
iii
3.1 Cultivation of drinking-water biofilms ......................................................................................... 55
3.2 Sampling of drinking-water biofilms ........................................................................................... 57
3.3 Determination of biofilm mass .................................................................................................... 57
3.4 Multi-element analysis of drinking water and biofilms............................................................... 58
3.5 Scanning electron microscopy of drinking-water biofilms .......................................................... 58
3.6 Confocal laser scanning microscopy (CLSM) ............................................................................... 58
3.7 Microbiological analysis .............................................................................................................. 59
3.7.1 Total cell count ..................................................................................................................... 59
3.7.2 Heterotrophic plate count .................................................................................................... 59
3.7.3 Culturability of P. aeruginosa pure cultures ......................................................................... 59
3.7.4 Culturability of P. aeruginosa in biofilms ............................................................................. 60
3.8 Isolation of extracellular polymeric substances (EPS) ................................................................. 60
3.9 Biochemical analysis of biofilms and EPS .................................................................................... 63
3.9.1 Proteins................................................................................................................................. 63
3.9.2 Carbohydrates ...................................................................................................................... 63
3.9.3 Uronic acids .......................................................................................................................... 64
3.9.4 DNA ....................................................................................................................................... 65
3.9.5 2-keto-3-deoxyoctonate (KDO) ............................................................................................ 66
3.10 Enzyme activity measurements ................................................................................................. 66
3.10.1 Glucose-6-phosphate dehydrogenase activity ................................................................... 66
3.10.2 Protease activity determination by zymogram gels ........................................................... 68
3.10.3 Fluorometric determination of enzyme activity ................................................................ 68
3.11 Molecular biology methods....................................................................................................... 70
3.11.1 Sample preparation for population analysis by DGGE ....................................................... 70
3.11.2 DNA Isolation ...................................................................................................................... 70
3.11.3 Amplification of 16S rDNA fragments ................................................................................ 71
3.11.4 Agarose gel electrophoresis ............................................................................................... 72
3.11.5 Denaturing Gradient Gel Electrophoresis (DGGE) .............................................................. 72
3.11.6 Fluorescence in situ hybridization ...................................................................................... 73
3.12 Analysis of proteins by 2D gel electrophoresis ......................................................................... 74
3.12.1 Sample preparation ............................................................................................................ 74
3.12.2 Isoelectric focusing (IEF) ..................................................................................................... 75
3.12.3 Preparation of SDS-Tris-glycine gels ................................................................................... 76
3.12.4 Gel electrophoresis of EPS proteins ................................................................................... 76
3.12.5 MALDI-TOF-MS ................................................................................................................... 77
Table of contents
iv
3.13 Gel staining and image acquisition ............................................................................................ 80
3.13.1 Coomassie Brilliant Blue staining ....................................................................................... 80
3.13.2 Ethidium bromide staining ................................................................................................. 80
3.13.3 Silver staining ..................................................................................................................... 80
3.13.4 Simply Blue Safe Stain ........................................................................................................ 81
3.13.5 SybrGold staining ................................................................................................................ 81
3.13.6 SyproRuby protein gel stain ............................................................................................... 82
4. RESULTS .............................................................................................................................................. 83
4.1 Establishment of methods for the cultivation of drinking-water biofilms and EPS recovery .... 83
4.1.1 Cultivation of drinking-water biofilms .................................................................................. 83
4.1.2 Optimization of EPS isolation by CER ................................................................................... 85
4.1.3 Cell integrity measurements after CER isolation .................................................................. 86
4.1.4 Efficiency of CER isolation .................................................................................................... 88
4.2 Optimization of 2D gel electrophoresis for EPS proteins ............................................................ 90
4.2.1 EPS sample preparation for 2DE........................................................................................... 90
4.2.2 Optimization of isoelectric focusing (IEF) for EPS samples .................................................. 92
4.2.3 Selection of staining method for SDS-Tris-glycine gels ........................................................ 94
4.3 Comparison of EPS isolation methods ........................................................................................ 96
4.3.1 Quantitative comparison of EPS recovery ............................................................................ 96
4.3.2 Qualitative comparison of isolated EPS proteins ............................................................... 100
4.3.3 Impact of EPS isolation methods on culturability of biofilm cells ...................................... 102
4.4 Dynamics of microbial populations and biochemical composition within drinking-water
biofilms ..................................................................................................................................... 103
4.4.1 Progress of surface colonization and drinking-water biofilm formation ........................... 103
4.4.2 Dynamics of microbial populations of drinking-water biofilms over 28 d ......................... 104
4.4.3 Changes in biochemical composition of drinking-water biofilms over 28 d ...................... 106
4.4.4 2DE analysis of the dynamics of EPS proteins from drinking-water biofilms..................... 110
4.4.5 Dynamics of proteases in drinking-water biofilms ............................................................. 115
4.4.6 Enzymatic activity within drinking-water biofilms ............................................................. 117
4.5 Comparison of drinking-water biofilms grown at different locations ....................................... 119
4.5.1 Drinking water composition and characteristics at the cultivation sites ........................... 119
4.5.2 General composition of drinking-water biofilms from different locations ........................ 122
4.5.3 Microbiological and population analysis of drinking-water biofilms with different origin 123
4.5.4 Biochemical composition of drinking-water biofilms from different locations ................. 126
Table of contents
v
4.6 Identification of EPS proteins .................................................................................................... 134
4.7 Influence of Pseudomonas aeruginosa on drinking-water biofilm composition ..................... 141
4.7.1 Incorporation of P. aeruginosa into drinking-water biofilms ............................................. 141
4.7.2 Influence of P. aeruginosa on the biochemical composition of drinking-water biofilms .. 144
5. DISCUSSION ....................................................................................................................................... 147
5.1 EPS isolation from drinking-water biofilms ............................................................................... 149
5.2 Drinking-water biofilm formation on the elastomer EPDM ...................................................... 160
5.2.1 Colonization of EPDM by drinking water microorganisms ................................................. 160
5.2.2 Dynamics of population diversity of drinking-water biofilms ............................................ 162
5.2.3 Biochemical composition of drinking-water biofilms ......................................................... 164
5.3 Influence of upstream plumbing materials on drinking-water biofilms ................................... 169
5.3.1 Variability of drinking-water biofilms cultivated on EPDM according to water
characteristics and plumbing materials ............................................................................ 170
5.3.2 Incorporation of hygienically relevant microorganisms into drinking-water biofilms ....... 176
5.4 Identification and function of extracellular proteins in drinking-water biofilms ...................... 180
5.5 Outlook ...................................................................................................................................... 184
6. REFERENCES ...................................................................................................................................... 187
APPENDIX .............................................................................................................................................. 213
List of tables
vi
LIST OF TABLES
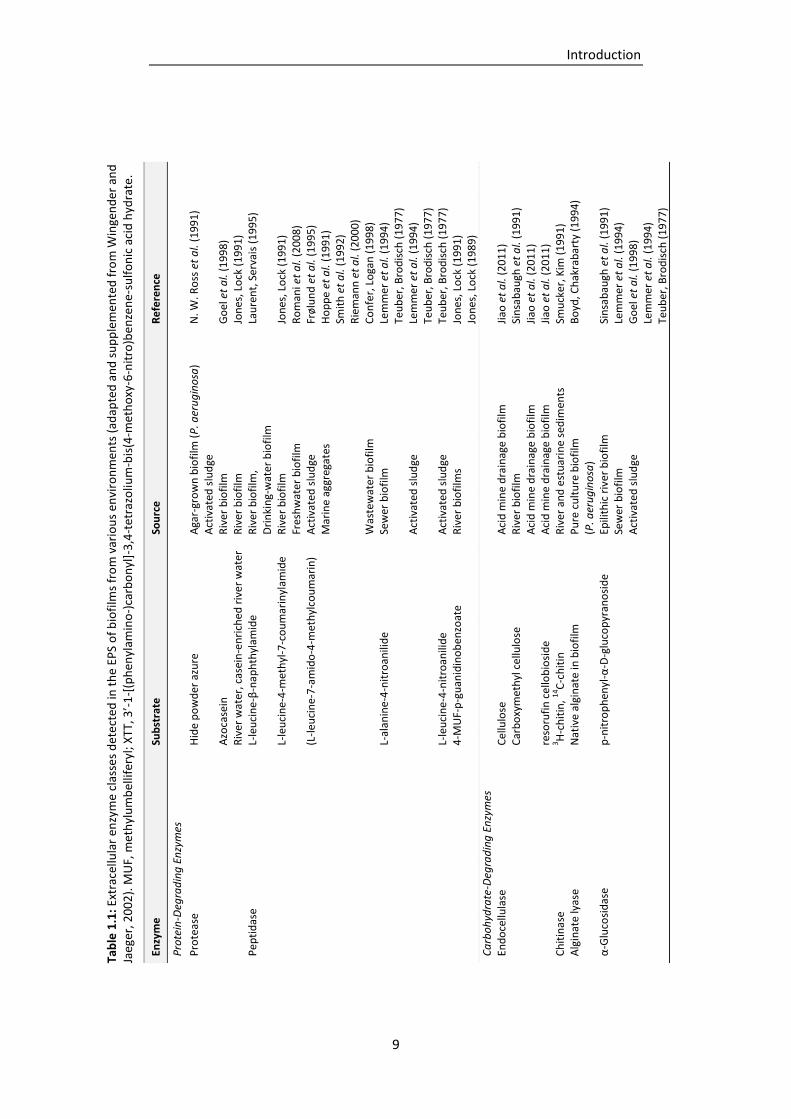
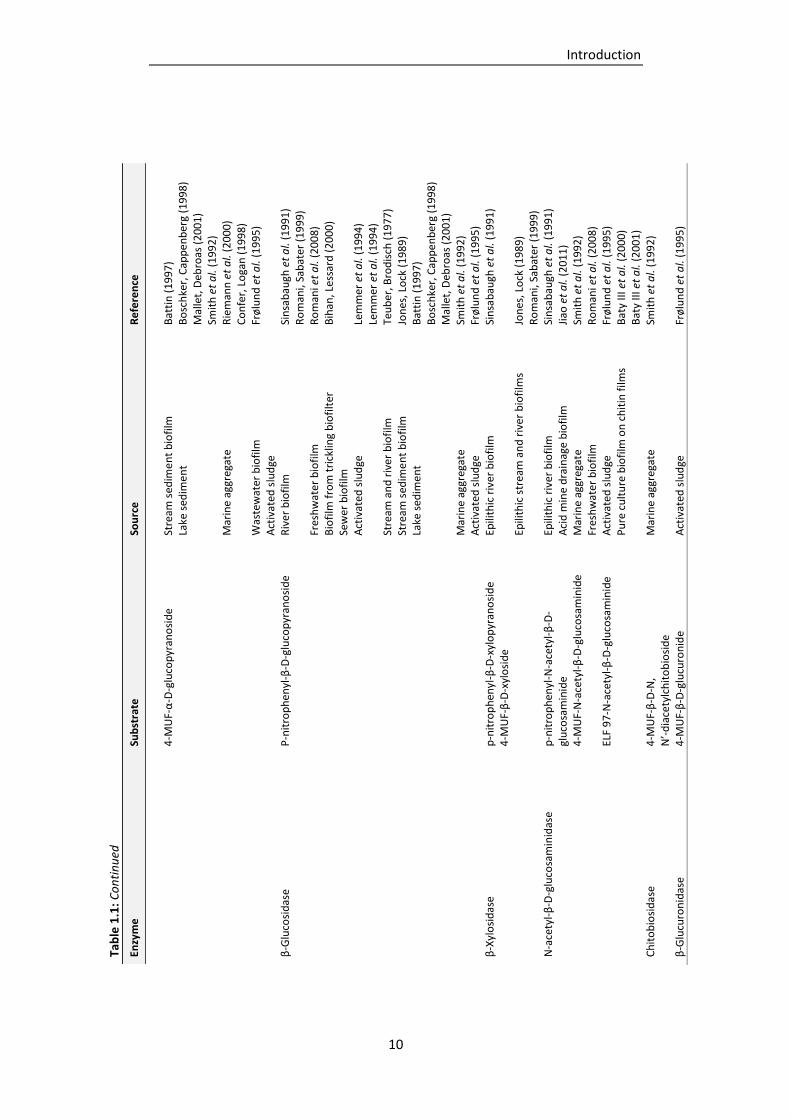
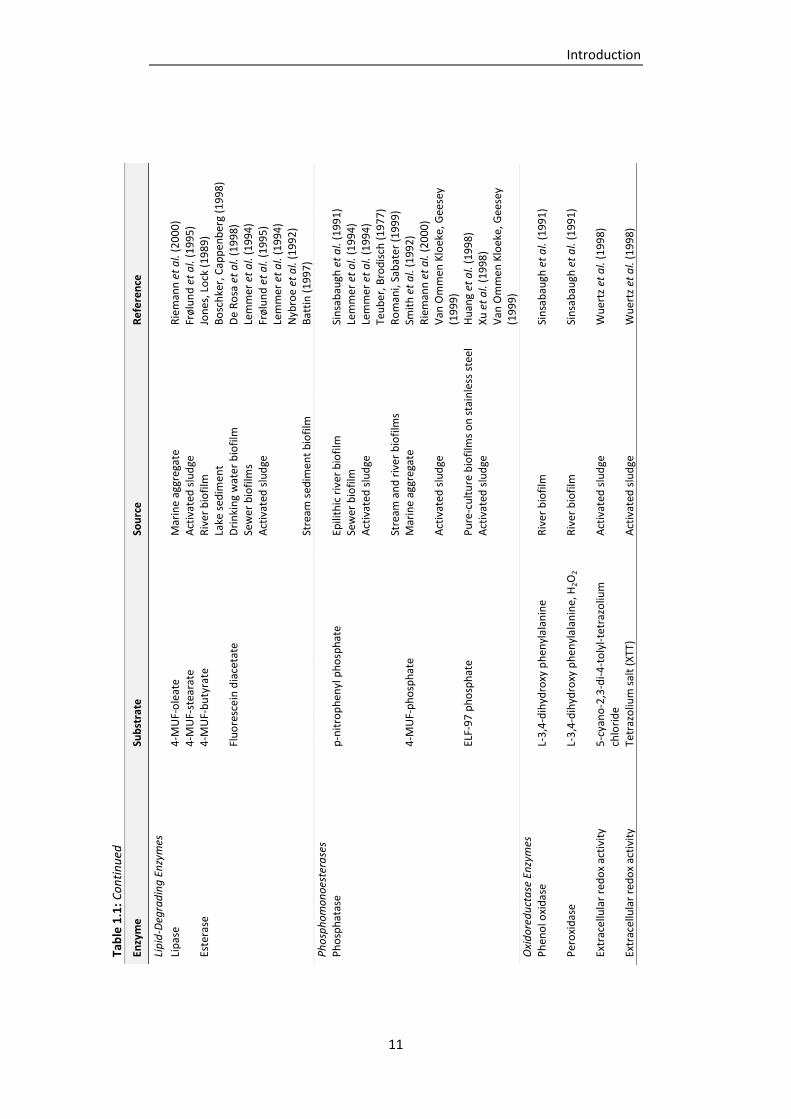
Table 1.1: Extracellular enzyme classes detected in the EPS of biofilms from various environments
(adapted and supplemented from Wingender and Jaeger, 2002). ....................................... 9
Table 1.2: EPS isolation procedures described in literature (adapted and supplemented from Nielsen
and Jahn, 1999). .................................................................................................................. 27
Table 1.3: Photometric or fluorometric assays used for the quantification of EPS components. ....... 32
Table 1.4: Fluorescent stains or markers applied for microscopical analysis of biofilms (adapted and
supplemented from Strathmann, 2002). ............................................................................ 39
Table 2.1: Chemicals used in this study. .............................................................................................. 43
Table 2.2: Commercial kits used in this study. ..................................................................................... 51
Table 2.3: Enzymes used in this study. ................................................................................................. 51
Table 2.4: Equipment used in this study. ............................................................................................. 51
Table 2.5: Software and databases used in this study. ........................................................................ 54
Table 3.1: Locations and drinking water installations used for the cultivation of drinking-water
biofilms. ............................................................................................................................... 55
Table 3.2: PCR master mix composition for one reaction. ................................................................... 71
Table 3.3: Primers applied for 16S rDNA amplification. ...................................................................... 72
Table 3.4: Composition of 40 % and 60 % denaturant solutions for DGGE. ........................................ 72
Table 3.5: Program applied for the IEF of EPS proteins from drinking-water biofilms. ....................... 75
Table 3.6: Silver staining protocol according to Blum et al. (1987). .................................................... 81
Table 4.1: Comparison of metal ion concentrations in drinking water and in 14 d-old drinking-water
biofilm, as well as the distribution of the cations after EPS isolation by 20 min CER
treatment. ........................................................................................................................... 90
Table 4.2: Comparison of the PCR-DGGE band patterns with regards to number of bands and
similarity of profiles of drinking-water biofilms grown for up to 28 d at plumbing system A
or plumbing system C. ....................................................................................................... 106
Table 4.3: Number of proteins in the EPS isolated from drinking-water biofilms grown for up to 28 d
in plumbing system A or plumbing system C resolved by 2DE. ........................................ 110
List of tables
vii
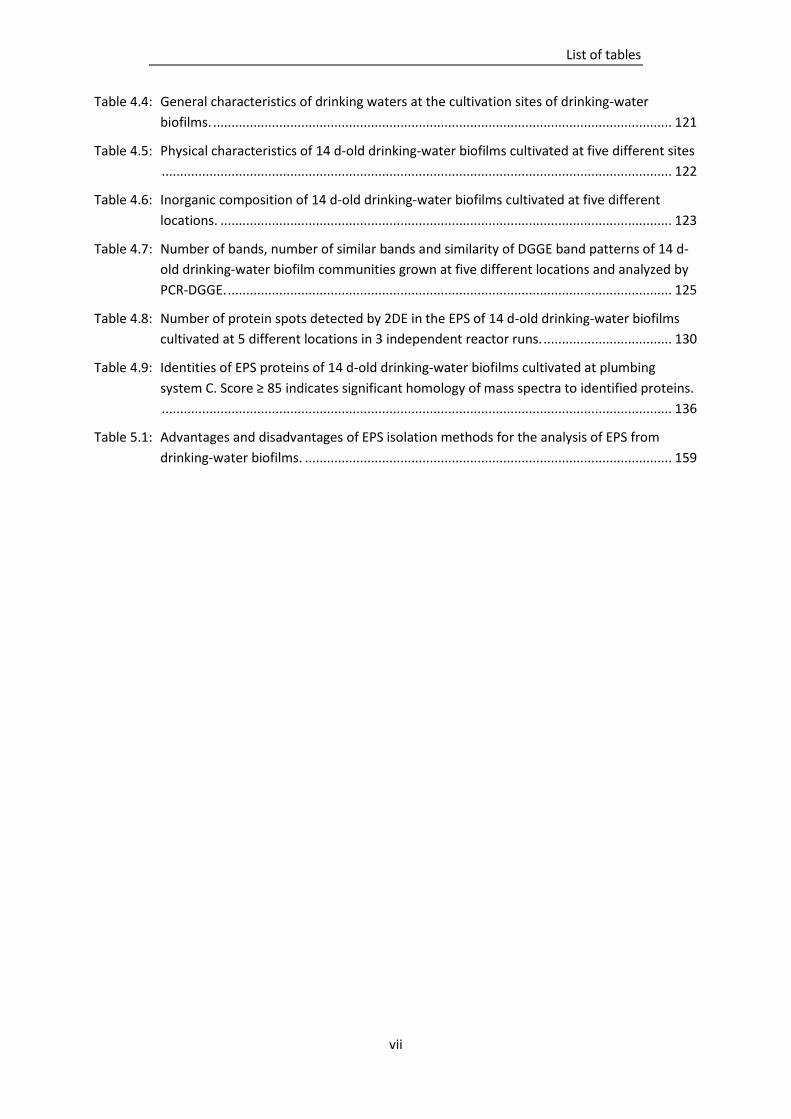
Table 4.4: General characteristics of drinking waters at the cultivation sites of drinking-water
biofilms. ............................................................................................................................. 121
Table 4.5: Physical characteristics of 14 d-old drinking-water biofilms cultivated at five different sites
........................................................................................................................................... 122
Table 4.6: Inorganic composition of 14 d-old drinking-water biofilms cultivated at five different
locations. ........................................................................................................................... 123
Table 4.7: Number of bands, number of similar bands and similarity of DGGE band patterns of 14 d-
old drinking-water biofilm communities grown at five different locations and analyzed by
PCR-DGGE. ......................................................................................................................... 125
Table 4.8: Number of protein spots detected by 2DE in the EPS of 14 d-old drinking-water biofilms
cultivated at 5 different locations in 3 independent reactor runs. ................................... 130
Table 4.9: Identities of EPS proteins of 14 d-old drinking-water biofilms cultivated at plumbing
system C. Score ≥ 85 indicates significant homology of mass spectra to identified proteins.
........................................................................................................................................... 136
Table 5.1: Advantages and disadvantages of EPS isolation methods for the analysis of EPS from
drinking-water biofilms. .................................................................................................... 159
List of figures
viii
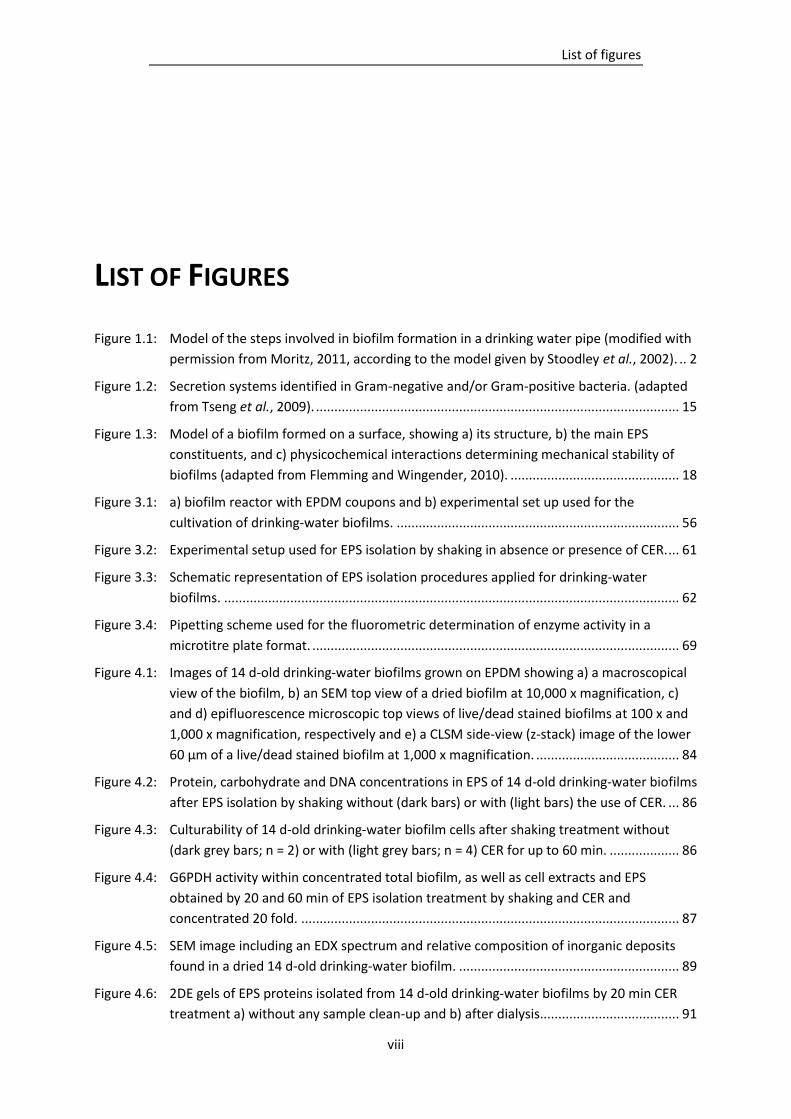
LIST OF FIGURES
Figure 1.1: Model of the steps involved in biofilm formation in a drinking water pipe (modified with
permission from Moritz, 2011, according to the model given by Stoodley et al., 2002). .. 2
Figure 1.2: Secretion systems identified in Gram-negative and/or Gram-positive bacteria. (adapted
from Tseng et al., 2009). ................................................................................................... 15
Figure 1.3: Model of a biofilm formed on a surface, showing a) its structure, b) the main EPS
constituents, and c) physicochemical interactions determining mechanical stability of
biofilms (adapted from Flemming and Wingender, 2010). .............................................. 18
Figure 3.1: a) biofilm reactor with EPDM coupons and b) experimental set up used for the
cultivation of drinking-water biofilms. ............................................................................. 56
Figure 3.2: Experimental setup used for EPS isolation by shaking in absence or presence of CER. ... 61
Figure 3.3: Schematic representation of EPS isolation procedures applied for drinking-water
biofilms. ............................................................................................................................ 62
Figure 3.4: Pipetting scheme used for the fluorometric determination of enzyme activity in a
microtitre plate format. .................................................................................................... 69
Figure 4.1: Images of 14 d-old drinking-water biofilms grown on EPDM showing a) a macroscopical
view of the biofilm, b) an SEM top view of a dried biofilm at 10,000 x magnification, c)
and d) epifluorescence microscopic top views of live/dead stained biofilms at 100 x and
1,000 x magnification, respectively and e) a CLSM side-view (z-stack) image of the lower
60 µm of a live/dead stained biofilm at 1,000 x magnification. ....................................... 84
Figure 4.2: Protein, carbohydrate and DNA concentrations in EPS of 14 d-old drinking-water biofilms
after EPS isolation by shaking without (dark bars) or with (light bars) the use of CER. ... 86
Figure 4.3: Culturability of 14 d-old drinking-water biofilm cells after shaking treatment without
(dark grey bars; n = 2) or with (light grey bars; n = 4) CER for up to 60 min. ................... 86
Figure 4.4: G6PDH activity within concentrated total biofilm, as well as cell extracts and EPS
obtained by 20 and 60 min of EPS isolation treatment by shaking and CER and
concentrated 20 fold. ....................................................................................................... 87
Figure 4.5: SEM image including an EDX spectrum and relative composition of inorganic deposits
found in a dried 14 d-old drinking-water biofilm. ............................................................ 89
Figure 4.6: 2DE gels of EPS proteins isolated from 14 d-old drinking-water biofilms by 20 min CER
treatment a) without any sample clean-up and b) after dialysis...................................... 91
List of figures
ix
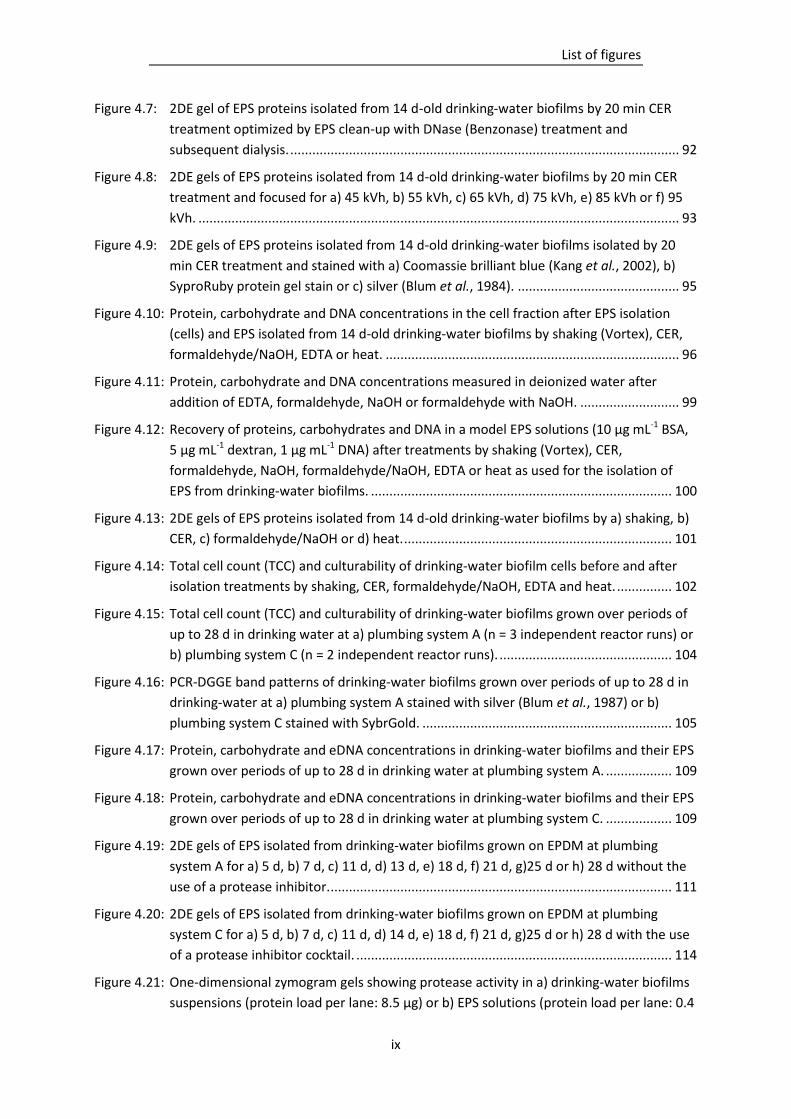
Figure 4.7: 2DE gel of EPS proteins isolated from 14 d-old drinking-water biofilms by 20 min CER
treatment optimized by EPS clean-up with DNase (Benzonase) treatment and
subsequent dialysis. .......................................................................................................... 92
Figure 4.8: 2DE gels of EPS proteins isolated from 14 d-old drinking-water biofilms by 20 min CER
treatment and focused for a) 45 kVh, b) 55 kVh, c) 65 kVh, d) 75 kVh, e) 85 kVh or f) 95
kVh. ................................................................................................................................... 93
Figure 4.9: 2DE gels of EPS proteins isolated from 14 d-old drinking-water biofilms isolated by 20
min CER treatment and stained with a) Coomassie brilliant blue (Kang et al., 2002), b)
SyproRuby protein gel stain or c) silver (Blum et al., 1984). ............................................ 95
Figure 4.10: Protein, carbohydrate and DNA concentrations in the cell fraction after EPS isolation
(cells) and EPS isolated from 14 d-old drinking-water biofilms by shaking (Vortex), CER,
formaldehyde/NaOH, EDTA or heat. ................................................................................ 96
Figure 4.11: Protein, carbohydrate and DNA concentrations measured in deionized water after
addition of EDTA, formaldehyde, NaOH or formaldehyde with NaOH. ........................... 99
Figure 4.12: Recovery of proteins, carbohydrates and DNA in a model EPS solutions (10 µg mL-1 BSA,
5 µg mL-1 dextran, 1 µg mL-1 DNA) after treatments by shaking (Vortex), CER,
formaldehyde, NaOH, formaldehyde/NaOH, EDTA or heat as used for the isolation of
EPS from drinking-water biofilms. .................................................................................. 100
Figure 4.13: 2DE gels of EPS proteins isolated from 14 d-old drinking-water biofilms by a) shaking, b)
CER, c) formaldehyde/NaOH or d) heat. ......................................................................... 101
Figure 4.14: Total cell count (TCC) and culturability of drinking-water biofilm cells before and after
isolation treatments by shaking, CER, formaldehyde/NaOH, EDTA and heat. ............... 102
Figure 4.15: Total cell count (TCC) and culturability of drinking-water biofilms grown over periods of
up to 28 d in drinking water at a) plumbing system A (n = 3 independent reactor runs) or
b) plumbing system C (n = 2 independent reactor runs). ............................................... 104
Figure 4.16: PCR-DGGE band patterns of drinking-water biofilms grown over periods of up to 28 d in
drinking-water at a) plumbing system A stained with silver (Blum et al., 1987) or b)
plumbing system C stained with SybrGold. .................................................................... 105
Figure 4.17: Protein, carbohydrate and eDNA concentrations in drinking-water biofilms and their EPS
grown over periods of up to 28 d in drinking water at plumbing system A. .................. 109
Figure 4.18: Protein, carbohydrate and eDNA concentrations in drinking-water biofilms and their EPS
grown over periods of up to 28 d in drinking water at plumbing system C. .................. 109
Figure 4.19: 2DE gels of EPS isolated from drinking-water biofilms grown on EPDM at plumbing
system A for a) 5 d, b) 7 d, c) 11 d, d) 13 d, e) 18 d, f) 21 d, g)25 d or h) 28 d without the
use of a protease inhibitor. ............................................................................................. 111
Figure 4.20: 2DE gels of EPS isolated from drinking-water biofilms grown on EPDM at plumbing
system C for a) 5 d, b) 7 d, c) 11 d, d) 14 d, e) 18 d, f) 21 d, g)25 d or h) 28 d with the use
of a protease inhibitor cocktail. ...................................................................................... 114
Figure 4.21: One-dimensional zymogram gels showing protease activity in a) drinking-water biofilms
suspensions (protein load per lane: 8.5 µg) or b) EPS solutions (protein load per lane: 0.4

List of figures
x
µg) isolated from drinking-water biofilms after cultivation for up to 28 d in plumbing
system C using zymogram gels containing gelatin as substrate. .................................... 116
Figure 4.22: Total enzyme activities expressed in nmol min-1 of seven enzyme classes determined in
the whole biofilm, in biofilm cells after EPS isolation, or in isolated EPS obtained from
drinking-water biofilms after cultivation for up to 28 d. ................................................ 118
Figure 4.23: Specific enzyme activities expressed in nkat mg-1 protein of seven enzyme classes
determined in the whole biofilm, in biofilm cells after EPS isolation, or in isolated EPS
obtained from drinking-water biofilms after cultivation for up to 28 d. ........................ 118
Figure 4.24: Total cell counts (TCC) and HPC of 14 d-old drinking-water biofilms grown at five
different locations. .......................................................................................................... 124
Figure 4.25: PCR-DGGE gel of 14 d-old drinking-water biofilm communities grown at five different
locations. Arrows indicate bands at the same positions in all biofilm samples. ............ 125
Figure 4.26: Protein-, carbohydrate- and eDNA concentrations in 14 d-old drinking-water biofilms
and their EPS. .................................................................................................................. 127
Figure 4.27: Proportions of isolated EPS proteins (left) and carbohydrates (right) from five different
drinking-water biofilms in relation to the Cu concentration in the respective drinking
water. .............................................................................................................................. 128
Figure 4.28: 2DE gels of EPS proteins from 14 d-old drinking-water biofilms cultivated at a) plumbing
system A, b) distribution system A, c) plumbing system B, d) distribution system B and e)
plumbing system C. ......................................................................................................... 131
Figure 4.29: 2DE gel of EPS proteins from drinking-water biofilms. Marked spots represent excised
protein spots from the 2DE gel. ...................................................................................... 135
Figure 4.30: Total cell count and HPC of drinking-water biofilms and concentrations of P. aeruginosa
AdS before as well as 24 h and 7 d after inoculation. .................................................... 142
Figure 4.31: Total cell count (TCC) and culturability of P. aeruginosa AdS after 24 h exposition at 20 °C
to a) dilutions of drinking water in deionized water (n = 1), or b) different concentrations
of copper in 6 mM phosphate buffer at pH 7.0 (n = 2). .................................................. 143
Figure 4.32: Protein, carbohydrate and eDNA concentrations in drinking-water biofilms and isolated
EPS, 24 h or 7 d after inoculation with P. aeruginosa AdS (+P.a.) or deionized water (-P.a.
control)............................................................................................................................ 144
Figure 4.33: 2DE gels of EPS proteins isolated from a) drinking-water biofilms before inoculation, b)
drinking-water biofilm 24 h after inoculation with P. aeruginosa AdS in deionized water,
c) drinking-water biofilm 24 h after inoculation with deionized water (control), d)
drinking-water biofilm 7 d after inoculation with P. aeruginosa AdS in deionized water,
and e) drinking-water biofilm 7 d after inoculation with deionized water (control). .... 146
Figure 5.10: Materials used in plumbing systems of public buildings in Germany (according to
Kistemann et al., 2010). .................................................................................................. 170
Glossary
xi
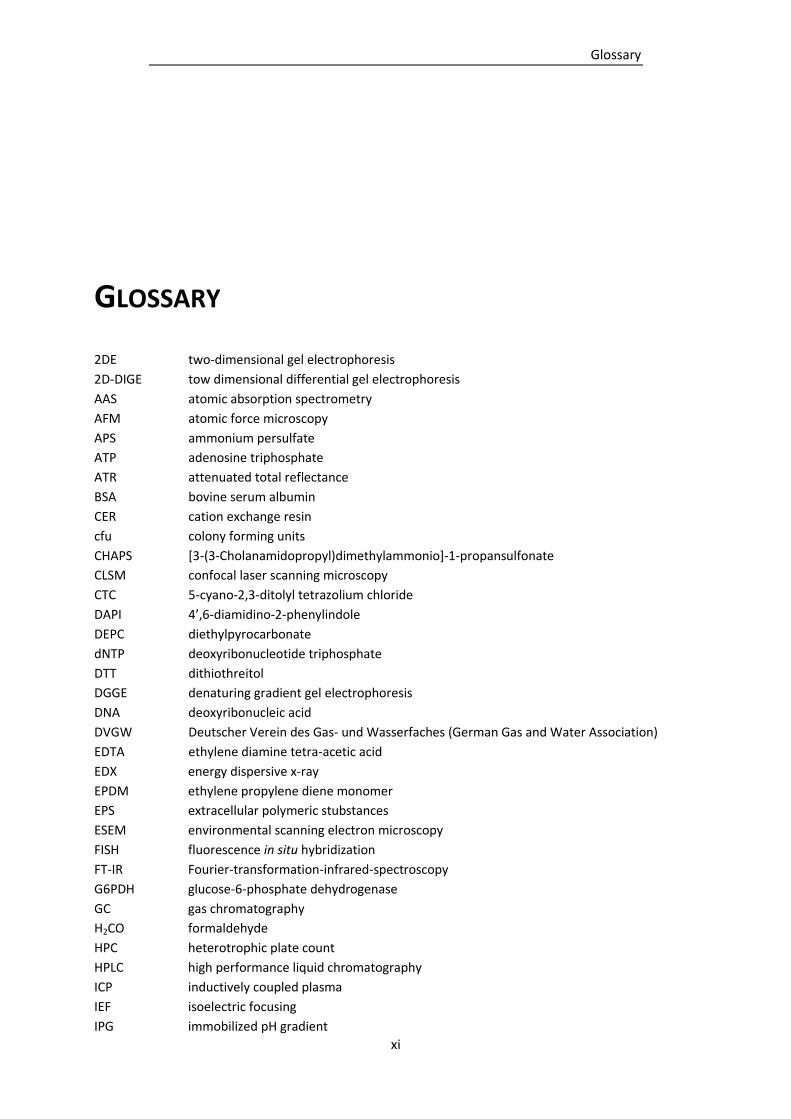
GLOSSARY
2DE two-dimensional gel electrophoresis
2D-DIGE tow dimensional differential gel electrophoresis
AAS atomic absorption spectrometry
AFM atomic force microscopy
APS ammonium persulfate
ATP adenosine triphosphate
ATR attenuated total reflectance
BSA bovine serum albumin
CER cation exchange resin
cfu colony forming units
CHAPS [3-(3-Cholanamidopropyl)dimethylammonio]-1-propansulfonate
CLSM confocal laser scanning microscopy
CTC 5-cyano-2,3-ditolyl tetrazolium chloride
DAPI 4’,6-diamidino-2-phenylindole
DEPC diethylpyrocarbonate
dNTP deoxyribonucleotide triphosphate
DTT dithiothreitol
DGGE denaturing gradient gel electrophoresis
DNA deoxyribonucleic acid
DVGW Deutscher Verein des Gas- und Wasserfaches (German Gas and Water Association)
EDTA ethylene diamine tetra-acetic acid
EDX energy dispersive x-ray
EPDM ethylene propylene diene monomer
EPS extracellular polymeric stubstances
ESEM environmental scanning electron microscopy
FISH fluorescence in situ hybridization
FT-IR Fourier-transformation-infrared-spectroscopy
G6PDH glucose-6-phosphate dehydrogenase
GC gas chromatography
H2CO formaldehyde
HPC heterotrophic plate count
HPLC high performance liquid chromatography
ICP inductively coupled plasma
IEF isoelectric focusing
IPG immobilized pH gradient
Glossary
xii
kDa kilo Dalton
KDO 2-keto-3-deoxyoctonate ammonium salt
LB Lenox broth
LC liquid chromatography
MALDI matrix assisted laser desorption/ionization
MS mass spectrometry
MUF methylumbelliferyl
MWCO molecular weight cut-off
NADP nicotinamide-adenine-dinucleotide phosphate
NMR nuclear magnetic resonance
OES optical emission spectrometry
p. a. per analysis
P. a. Pseudomonas aeruginosa
PAGE polyacrylamide gel electrophoresis
PBS phosphate-buffered saline
PCR polymerase chain reaction
PE polyethylene
pI isoelectric point
PI propidium iodide
PMMA polymethyl-methacrylate
PVC polyvinylchloride
RNA ribonucleic acid
RT-qPCR real-time quantitative polymerase chain reaction
SDS sodium dodecyl sulfate
SEM scanning electron microscopy
SERS surface-enhanced Raman scattering
SSCP single strand conformation polymorphism
TAE Tris/acetic acid/EDTA
TE Tris/EDTA
TCC total cell count
TEM transmission electron microscopy
TEMED N,N,N’,N’-tetramethylethylenediamine
T-RFLP terminal restriction fragment length polymorphism
TLC thin-layer chromatography
TOC total organic carbon
TOF time of flight
TrinkwV Trinkwasserverordnung (German Drinking Water Ordinance)
Tris Tris(hydroxymethyl)-aminomethane
VBNC viable but nonculturable
v/v volume per volume
w/v weight per volume
XTT 3’-1-[(phenylamino-)carbonyl]-3,4-tetrazolium-bis(4-methoxy-6-nitro)benzene-sulfonic
acid hydrate
Abstract
xiii
ABSTRACT
Drinking water distribution systems as well as domestic plumbing systems are colonized by
microbial biofilms. Under unfavourable conditions they may act as reservoirs for hygienically
relevant microorganisms, posing a potential threat to human health. The aim of this study
was the investigation of the formation, composition and function of drinking-water biofilms
and their extracellular polymeric substances (EPS). The biofilms were grown on a synthetic
elastomeric material, exposed to drinking water in different drinking water distribution
systems as well as public plumbing systems made of copper. Characterization of biofilms and
their EPS was carried out by microbiological, molecular biological and biochemical methods,
which were adapted and optimized to meet the difficulty provided by the low amounts of
biomass usually found in drinking water systems.
The elastomeric material provided a suitable substratum for the cultivation of drinking-water
biofilms. After 14 d of exposure, biofilm growth reached a quasi-stationary state, showing
constant cell numbers in the range of 1.0 x 10⁸ cells cm-2 to 5.0 x 10⁸ cells cm-2. Culturability
of biofilm cells was one order of magnitude lower compared to total cell numbers. Analysis
by PCR-DGGE showed an increase in population diversity for the first 7 d of biofilm growth
and from then on remained constant for up to 28 d. Comparison of band patterns of biofilms
in different water systems showed variable microbial composition of drinking-water biofilms,
with similarities of only 46 % to 63 %.
EPS were isolated from drinking-water biofilms by application of a cation exchange resin
(CER). Due to the low biomass yield this EPS isolation method was miniaturized and
optimized, and compared to other commonly applied isolation methods including treatment
by shaking (control), formaldehyde/NaOH, EDTA, or heat. The CER method showed
significantly higher yields of EPS components compared to the control method, and, in
Abstract
xiv
contrast to chemical methods or heat, caused no damage to biofilm cells or interference
with analyses. Proteins represented the main component, irrespective of biofilm age or
origin, followed by carbohydrates and DNA. Protein and carbohydrate contents in the EPS
increased continuously throughout the cultivation period of up to 28 d, while DNA showed
an increase in concentration for the initial 11 d to 21 d of cultivation, from which on the
concentration remained constant. The isolation yields of EPS constituents varied depending
on the biofilm’s origin and showed a decreasing trend with increasing Cu content in the
water phase. Similarly to protein production, also activity of the hydrolytic enzyme groups
proteases, peptidases, α-/ß-glucosidases, N-acetyl-ß-D-glucosaminidases, lipases, esterases,
and phosphatases increased with biofilm age, in particular once biofilms reached 14 d of
age. EPS protein diversity was analyzed by two-dimensional gel electrophoresis and
exhibited significant variability according to the biofilm’s origin. In the course of biofilm
formation, diversity of EPS proteins increased for the first 14 d and decreased from then on,
showing a lower amount of protein spots with high molecular weightes or isoelectric points.
Analysis of protein spots by MALDI-TOF-MS identified proteins with metabolic, transport, or
regulatory functions in the EPS of drinking-water biofilms. A few protein clusters, including
efflux proteins, were only present in biofilms grown in copper plumbing systems.
The incorporation of a hygienically relevant microorganism into drinking-water biofilms was
examined. As a model microorganism of hygienical relevance, Pseudomonas aeruginosa was
used to examine the hypothesis, that it can influence the composition of existing biofilms
and their EPS. The incorporation of P. aeruginosa as detected by FISH showed the potential
of drinking-water biofilms to harbor hygienically relevant microorganisms. An effect on the
composition of drinking-water biofilms or their EPS was not observed.
The results demonstrated the variability of drinking-water biofilms in terms of microbial
populations and EPS composition in response to variations of conditions in different
distribution systems and in particular in copper plumbing systems. Furthermore, this study
demonstrated the dynamics of EPS components in the course of biofilm formation,
indicating continuous changes to the EPS matrix induced by the constituent organisms.
Drinking-water biofilms were shown to be another type of biofilms, in which proteins
represent the main EPS component, followed by polysaccharides and DNA. EPS proteins in
drinking-water biofilms exhibited metabolic, transport and regulatory functions.
Introduction
1
1. INTRODUCTION
1.1 The biofilm way of life
Biofilms represent a fascinating lifestyle found in all three domains of life and one of the
oldest forms of life on earth (Flemming, 2011). The term “biofilm” describes microbial
aggregates embedded in a highly hydrated, self-produced slime matrix composed of
extracellular polymeric substances (EPS). EPS are composed of a variety of different
macromolecules, such as polysaccharides, proteins, DNA or (phospho-) lipids, which form
the three-dimensional structure of biofilms, affect their porosity, density, water content and
sorption properties, and afford protection for biofilm organisms (Wingender et al., 1999;
Flemming and Wingender, 2002; Denkhaus et al., 2007; Flemming et al., 2007; Karatan and
Watnik, 2009; Flemming and Wingender, 2010). Biofilms form at interfaces of two-phase
systems such as water-air, water-oil, solid-air or water-solid (Wimpenny, 2000). These
aggregates were investigated ever since van Leeuwenhoek’s observations of the “very little
animalia” he had found in the plaque on his teeth late in the 17th century. In his studies on
freshwater bacteria Henrici (1933) was one of the first to describe the affinity of
microorganisms to surfaces, discussing a layer of various bacteria along with algae and
protozoa firmly attached to glass slides, which had been submerged into aquarium waters or
Lake Alexander (Minnesota/USA). However, the term “biofilm” and its theory were not
established until 1978, stating that the majority of microorganisms live as conglomerates
attached to surfaces, enclosed in a self-produced matrix and exhibiting an altered gene
expression compared to their planktonic counterparts (Costerton et al., 1978; Donlan and
Costerton, 2002; Hall-Stoodley et al., 2004; Karatan and Watnik, 2009). By now the biofilm
mode of growth is considered the natural state of microbial existence. Over 99.9 % of
microorganisms in natural aquatic environments are predicted to live in such aggregates,
Introduction
2
suggesting that planktonic growth represents only a temporary state in microbial life
(Donlan and Costerton, 2002).
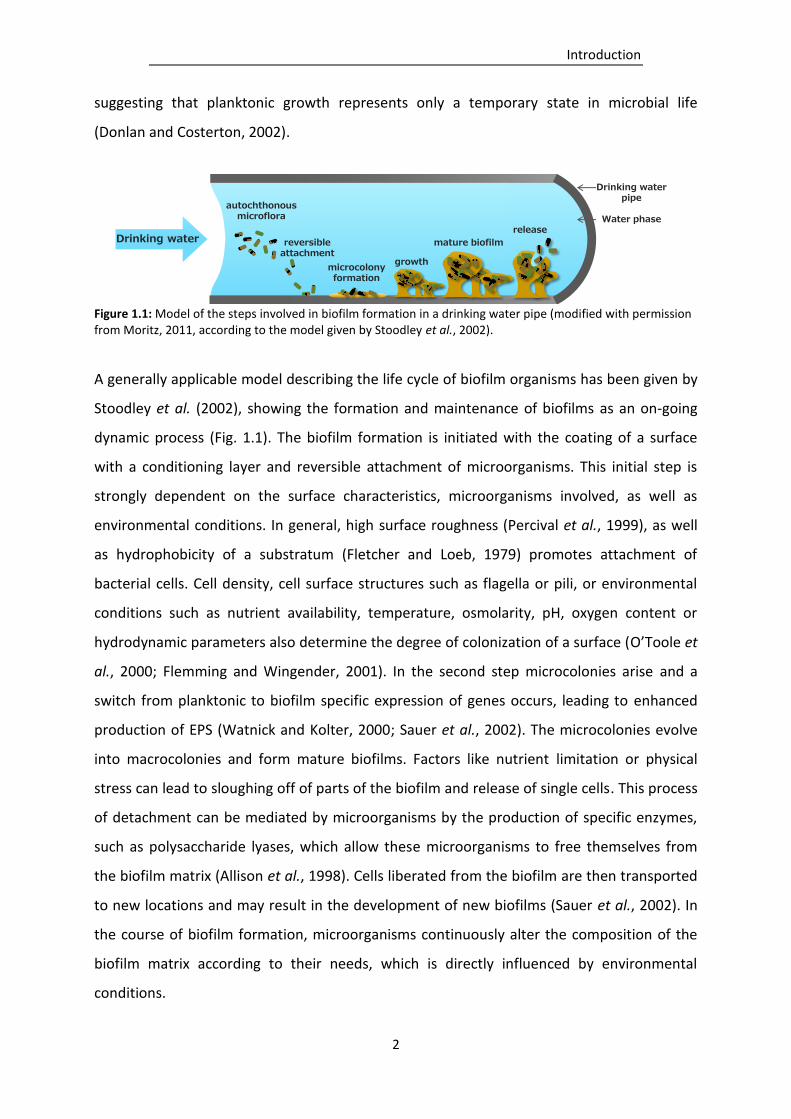
Figure 1.1: Model of the steps involved in biofilm formation in a drinking water pipe (modified with permission from Moritz, 2011, according to the model given by Stoodley et al., 2002).
A generally applicable model describing the life cycle of biofilm organisms has been given by
Stoodley et al. (2002), showing the formation and maintenance of biofilms as an on-going
dynamic process (Fig. 1.1). The biofilm formation is initiated with the coating of a surface
with a conditioning layer and reversible attachment of microorganisms. This initial step is
strongly dependent on the surface characteristics, microorganisms involved, as well as
environmental conditions. In general, high surface roughness (Percival et al., 1999), as well
as hydrophobicity of a substratum (Fletcher and Loeb, 1979) promotes attachment of
bacterial cells. Cell density, cell surface structures such as flagella or pili, or environmental
conditions such as nutrient availability, temperature, osmolarity, pH, oxygen content or
hydrodynamic parameters also determine the degree of colonization of a surface (O’Toole et
al., 2000; Flemming and Wingender, 2001). In the second step microcolonies arise and a
switch from planktonic to biofilm specific expression of genes occurs, leading to enhanced
production of EPS (Watnick and Kolter, 2000; Sauer et al., 2002). The microcolonies evolve
into macrocolonies and form mature biofilms. Factors like nutrient limitation or physical
stress can lead to sloughing off of parts of the biofilm and release of single cells. This process
of detachment can be mediated by microorganisms by the production of specific enzymes,
such as polysaccharide lyases, which allow these microorganisms to free themselves from
the biofilm matrix (Allison et al., 1998). Cells liberated from the biofilm are then transported
to new locations and may result in the development of new biofilms (Sauer et al., 2002). In
the course of biofilm formation, microorganisms continuously alter the composition of the
biofilm matrix according to their needs, which is directly influenced by environmental
conditions.
Drinking water
autochthonousmicroflora
reversibleattachment
mature biofilm
release
growthmicrocolonyformation
Drinking waterpipe
Water phase
Introduction
3
The aggregation into biofilms provides various benefits for microorganisms in comparison to
life in the planktonic state, which can include increased nutrient availability, protection
against environmental stress such as extreme temperatures or pH, desiccation, salinity and
antimicrobial agents, or enhanced gene exchange, allowing for fast adaptation to
environmental changes (Hall-Stoodley et al., 2004). Many of these advantageous features
can be attributed to the self-produced EPS matrix surrounding biofilm cells.
1.2 Extracellular polymeric substances (EPS)
EPS represent the major constituents of microbial biofilms and determine the environmental
conditions for the residing microorganisms. In a way they resemble, as Flemming et al.
(2007) aptly called it, “the house of biofilm cells.” They form the extracellular matrix of
biofilms, generate their porosity, density, water content and sorption properties, and afford
protection for biofilm organisms (Wingender et al., 1999; Flemming and Wingender, 2002;
Flemming et al., 2007; Karatan and Watnik, 2009; Flemming and Wingender, 2010). Several
definitions for EPS have been given in the past. Geesey (1982) for example described EPS as
“extracellular polymeric substances of biological origin that participate in the formation of
microbial aggregates”. Characklis and Wilderer (1989) defined EPS as “organic polymers of
microbial origin which in biofilm systems are frequently responsible for binding cells and
other particulate materials together (cohesion) and to the substratum (adhesion)”. In
general EPS are composed of a variety of macromolecules, including polysaccharides,
proteins, DNA and (phospho-) lipids and can account for over 90 % of the biofilm dry weight
(Wingender et al., 1999; Flemming and Wingender, 2010). In early studies, polysaccharides
were the main target for analysis, as they have been assumed to be the main constituents of
EPS. Hence, “EPS” were formerly considered “exopolysaccharides” or “extracellular
polysaccharides”. However, further studies showed that proteins and extracellular DNA
(eDNA) can be found in similar or even higher concentrations within EPS of environmental
biofilms compared to polysaccharides (Platt et al., 1985; Jahn and Nielsen, 1995; Frølund et
al., 1996).
Introduction
4
Numerous functions have been ascribed to the EPS and elucidate their importance in all
stages of biofilm formation. EPS are essential components during microbial adhesion to
surfaces, aggregation of cells as well as cohesion of biofilms (Wingender et al., 1999). They
form a three-dimensional micro-environment, in which organisms are temporarily
immobilised. The nature and quantity of the individual EPS components determine the
architecture of a biofilm, as well as living conditions for its residents (Flemming and
Wingender, 2010).
The EPS matrix is the key agent providing protection for microorganisms against
environmental stress. The EPS can for instance provide nutrients for the residing
microorganisms due to their ability to adsorb and store organic matter from the water phase
(Decho and Lopez, 1993; Decho, 2000; Flemming, 2002). Especially in oligotrophic
environments such as drinking water distribution systems, which provide only low
concentrations of organic matter, this trait can be vital for the survival of biofilm organisms.
The low amounts of organic substances present in the water phase can be adsorbed by
hydrophobic polysaccharides and proteins, and in this way the biofilm matrix can serve as a
nutrient reservoir for microorganisms (Sutherland, 2001; Leis and Flemming, 2002). Channel
systems within biofilms allow for distribution of nutrients as well as metabolites into all
regions of the biofilm and also allow exchange of metabolites with the surrounding bulk
solution (de Beer et al., 1994; Stoodley et al., 1994; Costerton, 1995; Sutherland, 2001). The
utilization of organic matter as nutrients can, depending on the complexity of the
substances, pose a challenge for the microorganisms. A common feature of biofilms is the
establishment of synergistic microconsortia in which microorganisms can engage in
metabolic cooperations, allowing for degradation of very diverse and complex organic
substrates as nutrient and energy source, for example during anaerobic digestion of sludge
accumulated during wastewater treatment (Davey and O’Toole, 2000) or microbial
nitrification (Okabe et al., 1999). Extracellular enzymes play an important role in the
metabolism of high-molecular polymeric substances. The EPS matrix has been shown to
retain and stabilize hydrolytic enzymes, allowing for predigestion of diverse polymers and
utilization of a wide variety of organic substances (Tielen, 2006). In case of nutrient
deficiency, the EPS matrix itself can be utilized as nutrient source, ensuring survival of
biofilm organisms (Decho and Lopez, 1993; Decho, 2000; Flemming, 2002).
Introduction
5
The EPS matrix can, furthermore, represent a protection barrier against biocides, such as
antibiotics or disinfectants, toxins, exoenzymes or toxic metals (Costerton et al., 1987; de
Beer et al., 1994; Suci et al., 1994; Wingender et al., 1999; Flemming, 2002; Szewzyk and
Szewzyk, 2003; Stoodley et al., 2004). While planktonic cells may be relatively easily
inactivated for example by disinfectants, biofilm cells embedded in the EPS matrix require
more intense measures, due to different mechanisms through which they can withstand
biocides (Szewzyk and Szewzyk, 2003). One mechanism for the enhanced resistance is for
example reaction-diffusion inhibition of antimicrobial agents into the biofilm (de Beer et al.,
1994; Suci et al., 1994). Chemical reactions of biocides with EPS components such as
extracellular polysaccharides or with enzymes, for instance catalases degrading H2O2, which
can be produced as stress response by inherent microorganisms, may decrease the biocide
concentration up to a limit, at which it poses no threat to the microorganisms (Suci et al.,
1994; Watnick and Kolter, 2000). Presence of toxic metal ions has been shown to promote
EPS production as means to compensate for toxic stress. The EPS components contain
functional groups, such as carboxyl, amino, hydroxyl, acetyl or phosphate groups, which can
interact with metal cations to form metal-complexes. In this way toxic metals are
immobilised within the biofilm matrix, and thus, rendered harmless for the biofilm
organisms (White and Gadd, 1998, 2000). Not only chemical reactions of biocides with
biofilm components provide means for increased survival of biofilm microorganisms, also
physiological and phenotypic changes occur within a biofilm, allowing for higher stress
tolerance compared to planktonic cells (Gilbert et al., 1990).
Moreover, EPS can protect biofilm organisms from desiccation (Roberson and Firestone,
1992; Potts, 1994). Drying events can lead to loss of intracellular water, which few single
organisms can temporarily tolerate and counteract by increasing intracellular solute
concentrations, for example by absorption of salts or by producing compatible solutes such
as amino acids, trehalose or betaines (Measures, 1975; Harris, 1981; Lapeña et al., 1987;
Harland et al., 2009). The biofilm matrix, however, offers the residing organisms a habitat,
which withstands desiccation for prolonged periods of time. The EPS matrix acts
hygroscopically, attracting and retaining water from the environment, and may cause water
contents > 99 % of the biofilm wet weight (Roberson and Firestone, 1992; Flemming and
Wingender, 2010). Water retention has been shown to be significantly increased in
Introduction
6
environments if biofilms are involved. Rosenzweig et al. (2012) indicated that EPS
components in soils can increase the water content by 270 % of its value compared to pure
soil. Results by Roberson and Firestone (1992) suggested that gene expression during drying
events is altered in terms of an increased polysaccharide production, in order to store
increased amounts of water, and thus, enhancing the survival of biofilm organisms.
Retention of genetic information within the EPS matrix is a further characteristic of microbial
biofilms. The diversity of microorganisms within environmental biofilms, which can be
comprised of a variety of different bacteria or archaea, as well as algae, fungi or protozoa,
results in a large and concentrated pool of genetic information, facilitating horizontal gene
transfer among biofilm organisms (Flemming et al., 2007; Madsen et al., 2012). Transfer of
genetic material among microorganisms is important for the development of new genetic
traits and for the evolution of any organism. Uptake of certain genes can for example lead to
the acquisition of resistance towards certain antibiotics (Fux et al., 2005). Microorganisms
within biofilms have been shown to exhibit accelerated rates of uptake of genetic material
compared to planktonic cells (Angles et al., 1993; Hausner and Wuertz, 1999; Molin and
Tolker-Nielsen, 2003; Madsen et al., 2012). The close proximity of cells and the retention of
genes within the EPS matrix provide enhanced conditions for horizontal gene transfer and
allow biofilm organisms to adapt faster to environmental changes compared to planktonic
cells.
Hence, the EPS matrix provides biofilm organisms an ideal habitat to co-exist, interact and
form long-term microcosortia.
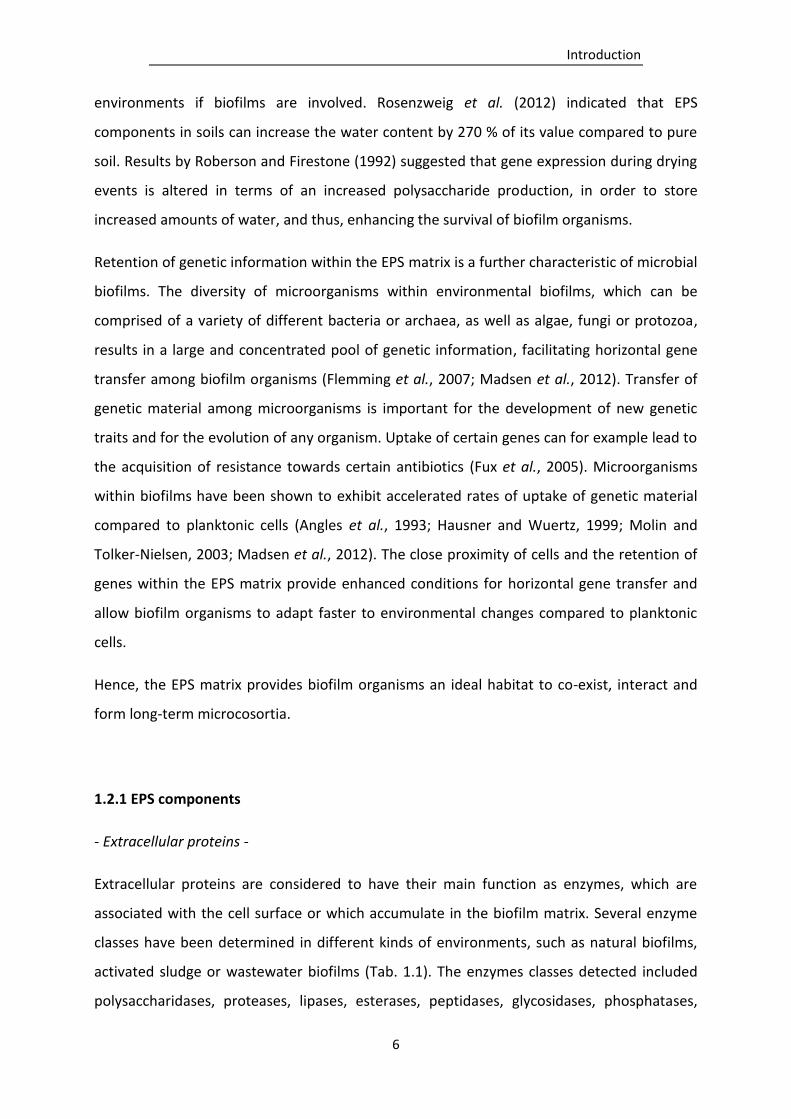
1.2.1 EPS components
- Extracellular proteins -
Extracellular proteins are considered to have their main function as enzymes, which are
associated with the cell surface or which accumulate in the biofilm matrix. Several enzyme
classes have been determined in different kinds of environments, such as natural biofilms,
activated sludge or wastewater biofilms (Tab. 1.1). The enzymes classes detected included
polysaccharidases, proteases, lipases, esterases, peptidases, glycosidases, phosphatases,
Introduction
7
nucleases and oxidoreductases (Wingender and Jaeger, 2002; McDougald et al., 2012). The
main function of these enzymes is considered to be the degradation of macromolecules or
particulate matter into low molecular weight substances, which can be taken up and readily
metabolised by microorganisms. This step is required as only small molecules can be
transported across cell membranes into the cell. In this way organic matter sequestered
from the environment by the biofilm matrix, which can substantially differ in complexity, can
be utilized as nutrient source by biofilm cells. Moreover, in nutrient-limited conditions these
enzymes can hydrolyse parts of the EPS matrix itself, which can then serve as nutrient
source, enabling survival under starvation stress. In this case extracellular proteins display
the role of an external digestive system for the microorganisms (Flemming and Wingender,
2010). Besides being of metabolic importance for the microorganisms, proteins can serve
several other functions. Hydrolytic enzymes can for example be excreted by bacteria to free
themselves from the biofilm once conditions become unfavourable. The enzymes degrade
parts of the surrounding EPS matrix, leading to a breakdown and sloughing off of biofilm
parts and liberation of the cells (McDougald et al., 2012). This allows for dispersion of
microorganisms into new locations and the formation of new biofilms. Dispersin B (DspB) is
an example of an enzyme involved in the detachment and dispersal of biofilms. DspB is an
N-acetylglucosaminidase produced by Actinobacillus actinomycetemcomitans, which cleaves
the 14 glycosidic bonds of N-acetylglucosamine-containing exopolysaccharides, and thus
participates in the release of biofilm cells from N-acetylglucosamine-containing EPS matrices
(Kaplan et al., 2003, 2004).
In addition to their enzymatic function, proteins can also exhibit structural roles within the
biofilm matrix. Due to the large amount of negatively charged reactive sites, proteins are
prone to engage in electrostatic cross-linkages with multivalent cations, and thus, increasing
EPS stability. This type of bridging has been shown to be more pronounced among proteins
than polysaccharides (Higgins and Novak, 1997; Laspidou and Rittman, 2002). Dignac et al.
(1998) also suggested that proteins can be involved in hydrophobic bonds within the biofilm
matrix. A common type of structural proteins within biofilms includes the so-called lectins.
Lectins are carbohydrate-binding proteins of prokaryotic as well as eukaryotic origin, which
are highly specific for certain carbohydrate binding sites (Kennedy et al., 1995). Bacterial
lectins are usually located on surface structures of cells, and can, in the case of pathogens,
Introduction
8
engage in interactions with carbohydrate residues on eukaryotic host-cells or glycosylated
macromolecules (Garber et al., 1992). They are involved in biofilm formation and
stabilization by binding to exopolysaccharides, and thus, providing an anchor between the
cells and the biofilm matrix (Higgins and Novak, 1997; Tielker et al., 2005). Examples of
lectins include the galactose-specific LecA, the fucose-specific LecB, or the Psl-binding CdrA
protein produced by Pseudomonas aeruginosa (Tielker et al., 2005; Mayanski et al., 2012).
Biofilm-associated-proteins (Bap) and Bap-like proteins represent another family of proteins
with structural character. This type of proteins has first been described in Staphylococcus
aureus biofilms. By now this family includes a wide variety of proteins, including the BapA of
Salmonella enterica, the large adhesion protein (LapA) of Pseudomonas fluorescence and
Pseudomonas putida, the enterococcal surface protein (Esp) of Enterococcus faecalis and
AdhA adhesin of Burkholderia cenocepacia (Pamp et al., 2007). Members of this family of
proteins share several features. They are located on the cell surface, they are of high
molecular weight, they contain a core domain of tandem repeats, they are involved in
biofilm formation and infectious processes, and they can be mobilized (Lasa and Penadés,
2006).
A further type of structural proteins, which demonstrate important role in biofilm formation
are amyloids. Amyloids are fibrous, highly insoluble and thermally as well as chemically
stable proteins containing ß-sheet-rich structures with strands stacked perpendicular to the
fibril axis (Nelson et al., 2005; Larsen et al., 2007). These structures have been known for
decades in neurodegenerative diseases like Alzheimer’s or Parkinson’s disease. Recently they
have been detected in various environmental biofilms, including freshwater biofilms,
brackish water biofilms, activated sludge biofilms, as well as drinking-water biofilms (Larsen
et al., 2007). The high abundance of amyloids indicates their importance as EPS matrix
component in environmental biofilms. Amyloids exhibit diverse functions including adhesion
of microorganisms to surfaces as well as mammalian and plant cells, they mediate cell-cell
interactions or provide mechanical stability for biofilms (Chapman et al., 2002; Larsen et al.,
2008; Cegelski et al., 2009; Romero et al., 2009).
Introduction
9
Tab
le 1
.1:
Extr
acel
lula
r en
zym
e cl
asse
s d
ete
cted
in t
he
EPS
of
bio
film
s fr
om
var
iou
s en
viro
nm
ents
(ad
apte
d a
nd
su
pp
lem
ente
d f
rom
Win
gen
de
r an
d
Jaeg
er, 2
00
2).
MU
F, m
eth
ylu
mb
ellif
eryl
; XTT
, 3’-
1-[
(ph
enyl
amin
o-)
carb
on
yl]-
3,4
-tet
razo
lium
-bis
(4-m
eth
oxy
-6-n
itro
)be
nze
ne
-su
lfo
nic
aci
d h
ydra
te.
Enzy
me
Sub
stra
te
Sou
rce
R
efe
ren
ce
Pro
tein
-Deg
rad
ing
En
zym
es
Pro
teas
e H
ide
po
wd
er a
zure
A
zoca
sein
R
iver
wat
er, c
asei
n-e
nri
che
d r
ive
r w
ater
Aga
r-gr
ow
n b
iofi
lm (
P. a
eru
gin
osa
) A
ctiv
ated
slu
dge
R
iver
bio
film
R
iver
bio
film
N. W
. Ro
ss e
t a
l. (1
99
1)
Go
el e
t a
l. (1
99
8)
Jon
es, L
ock
(1
99
1)
Pep
tid
ase
L-
leu
cin
e-β
-nap
hth
ylam
ide
L-
leu
cin
e-4
-met
hyl
-7-c
ou
mar
inyl
amid
e
(L-l
euci
ne-
7-a
mid
o-4
-met
hyl
cou
mar
in)
L-al
anin
e-4
-nit
roan
ilid
e
L-le
uci
ne-
4-n
itro
anili
de
4
-MU
F-p
-gu
anid
ino
ben
zoat
e
Riv
er b
iofi
lm,
Dri
nki
ng-
wat
er b
iofi
lm
Riv
er b
iofi
lm
Fres
hw
ater
bio
film
A
ctiv
ated
slu
dge
M
arin
e ag
greg
ates
W
aste
wat
er b
iofi
lm
Sew
er b
iofi
lm
Act
ivat
ed s
lud
ge
Act
ivat
ed s
lud
ge
Riv
er b
iofi
lms
Lau
ren
t, S
erva
is (
19
95
) Jo
nes
, Lo
ck (
19
91
) R
om
ani e
t a
l. (2
00
8)
Frø
lun
d e
t a
l. (1
99
5)
Ho
pp
e et
al.
(19
91
) Sm
ith
et
al.
(19
92
) R
iem
ann
et
al.
(20
00
) C
on
fer,
Lo
gan
(1
99
8)
Lem
mer
et
al.
(19
94
) Te
ub
er, B
rod
isch
(1
97
7)
Lem
mer
et
al.
(19
94
) Te
ub
er, B
rod
isch
(1
97
7)
Teu
ber
, Bro
dis
ch (
19
77
) Jo
nes
, Lo
ck (
19
91
) Jo
nes
, Lo
ck (
19
89
)
Ca
rbo
hyd
rate
-Deg
rad
ing
En
zym
es
End
oce
llula
se
Cel
lulo
se
Car
bo
xym
eth
yl c
ellu
lose
re
soru
fin
ce
llob
iosi
de
Aci
d m
ine
dra
inag
e b
iofi
lm
Riv
er b
iofi
lm
Aci
d m
ine
dra
inag
e b
iofi
lm
Aci
d m
ine
dra
inag
e b
iofi
lm
Jiao
et
al.
(20
11
) Si
nsa
bau
gh e
t a
l. (1
99
1)
Jiao
et
al.
(20
11
) Ji
ao e
t a
l. (2
01
1)
Ch
itin
ase
3 H
-ch
itin
, 14C
-ch
itin
R
iver
an
d e
stu
arin
e se
dim
ents
Sm
uck
er, K
im (
19
91
) A
lgin
ate
lyas
e
N
ativ
e al
gin
ate
in b
iofi
lm
Pu
re c
ult
ure
bio
film
(P
. aer
ug
ino
sa)
Bo
yd, C
hak
rab
arty
(1
99
4)
α-G
luco
sid
ase
p-n
itro
ph
enyl
-α-D
-glu
cop
yran
osi
de
Epili
thic
riv
er b
iofi
lm
Sew
er b
iofi
lm
Act
ivat
ed s
lud
ge
Sin
sab
augh
et
al.
(19
91
) Le
mm
er e
t a
l. (1
99
4)
Go
el e
t a
l. (1
99
8)
Lem
mer
et
al.
(19
94
) Te
ub
er, B
rod
isch
(1
97
7)
Introduction
10
Tab
le 1
.1:
Co
nti
nu
ed
Enzy
me
Sub
stra
te
Sou
rce
R
efe
ren
ce
4
-MU
F-α
-D-g
luco
pyr
ano
sid
e
Stre
am s
edim
en
t b
iofi
lm
Lake
sed
ime
nt
Mar
ine
aggr
egat
e
Was
tew
ater
bio
film
A
ctiv
ated
slu
dge
Bat
tin
(1
99
7)
Bo
sch
ker,
Cap
pe
nb
erg
(19
98
) M
alle
t, D
ebro
as (
20
01
) Sm
ith
et
al.
(19
92
) R
iem
ann
et
al.
(20
00
) C
on
fer,
Lo
gan
(1
99
8)
Frø
lun
d e
t a
l. (1
99
5)
β-G
luco
sid
ase
P
-nit
rop
he
nyl
-β-D
-glu
cop
yran
osi
de
R
iver
bio
film
Fr
esh
wat
er b
iofi
lm
Bio
film
fro
m t
rick
ling
bio
filt
er
Sew
er b
iofi
lm
Act
ivat
ed s
lud
ge
Stre
am a
nd
riv
er b
iofi
lm
Stre
am s
edim
en
t b
iofi
lm
Lake
sed
ime
nt
Mar
ine
aggr
egat
e
Act
ivat
ed s
lud
ge
Sin
sab
augh
et
al.
(19
91
) R
om
ani,
Sab
ater
(1
99
9)
Ro
man
i et
al.
(20
08
) B
ihan
, Les
sard
(2
00
0)
Lem
mer
et
al.
(19
94
) Le
mm
er e
t a
l. (1
99
4)
Teu
ber
, Bro
dis
ch (
19
77
) Jo
nes
, Lo
ck (
19
89
) B
atti
n (
19
97
) B
osc
hke
r, C
app
en
ber
g (1
99
8)
Mal
let,
Deb
roas
(2
00
1)
Smit
h e
t a
l. (1
99
2)
Frø
lun
d e
t a
l. (1
99
5)
β-X
ylo
sid
ase
p
-nit
rop
hen
yl-β
-D-x
ylo
pyr
ano
sid
e 4
-MU
F-β
-D-x
ylo
sid
e
Epili
thic
riv
er b
iofi
lm
Epili
thic
str
eam
an
d r
iver
bio
film
s
Sin
sab
augh
et
al.
(19
91
) Jo
nes
, Lo
ck (
19
89
) R
om
ani,
Sab
ater
(1
99
9)
N-a
cety
l-β
-D-g
luco
sam
inid
ase
p
-nit
rop
hen
yl-N
-ace
tyl-
β-D
-gl
uco
sam
inid
e
4-M
UF-
N-a
cety
l-β
-D-g
luco
sam
inid
e
ELF
97
-N-a
cety
l-β
-D-g
luco
sam
inid
e
Epili
thic
riv
er b
iofi
lm
Aci
d m
ine
dra
inag
e b
iofi
lm
Mar
ine
aggr
egat
e
Fres
hw
ater
bio
film
A
ctiv
ated
slu
dge
P
ure
cu
ltu
re b
iofi
lm o
n c
hit
in f
ilms
Sin
sab
augh
et
al.
(19
91
) Ji
ao e
t a
l. (2
01
1)
Smit
h e
t a
l. (1
99
2)
Ro
man
i et
al.
(20
08
) Fr
ølu
nd
et
al.
(19
95
) B
aty
III e
t a
l. (2
00
0)
Bat
y II
I et
al.
(20
01
) C
hit
ob
iosi
das
e
4-M
UF-
β-D
-N,
N’-
dia
cety
lch
ito
bio
sid
e
Mar
ine
aggr
egat
e
Smit
h e
t a
l. (1
99
2)
β
-Glu
curo
nid
ase
4
-MU
F-β
-D-g
lucu
ron
ide
A
ctiv
ated
slu
dge
Fr
ølu
nd
et
al.
(19
95
)
Introduction
11
Tab
le 1
.1:
Co
nti
nu
ed
Enzy
me
Sub
stra
te
Sou
rce
R
efe
ren
ce
Lip
id-D
egra
din
g E
nzy
mes
Lip
ase
4
-MU
F-o
leat
e
4-M
UF-
stea
rate
M
arin
e ag
greg
ate
A
ctiv
ated
slu
dge
R
iem
ann
et
al.
(20
00
) Fr
ølu
nd
et
al.
(19
95
) Es
tera
se
4-M
UF-
bu
tyra
te
Flu
ore
sce
in d
iace
tate
Riv
er b
iofi
lm
Lake
sed
ime
nt
Dri
nki
ng
wat
er b
iofi
lm
Sew
er b
iofi
lms
Act
ivat
ed s
lud
ge
Stre
am s
edim
en
t b
iofi
lm
Jon
es, L
ock
(1
98
9)
Bo
sch
ker,
Cap
pe
nb
erg
(19
98
) D
e R
osa
et
al.
(19
98
) Le
mm
er e
t a
l. (1
99
4)
Frø
lun
d e
t a
l. (1
99
5)
Lem
mer
et
al.
(19
94
) N
ybro
e et
al.
(19
92
) B
atti
n (
19
97
)
Ph
osp
ho
mo
no
este
rase
s
Ph
osp
hat
ase
p
-nit
rop
hen
yl p
ho
sph
ate
4
-MU
F-p
ho
sph
ate
EL
F-9
7 p
ho
sph
ate
Epili
thic
riv
er b
iofi
lm
Sew
er b
iofi
lm
Act
ivat
ed s
lud
ge
Stre
am a
nd
riv
er b
iofi
lms
Mar
ine
aggr
egat
e
Act
ivat
ed s
lud
ge
Pu
re-c
ult
ure
bio
film
s o
n s
tain
less
ste
el
Act
ivat
ed s
lud
ge
Sin
sab
augh
et
al.
(19
91
) Le
mm
er e
t a
l. (1
99
4)
Lem
mer
et
al.
(19
94
) Te
ub
er, B
rod
isch
(1
97
7)
Ro
man
i, Sa
bat
er (
19
99
) Sm
ith
et
al.
(19
92
) R
iem
ann
et
al.
(20
00
) V
an O
mm
en K
loek
e, G
eese
y (1
99
9)
Hu
ang
et a
l. (1
99
8)
Xu
et
al.
(19
98
) V
an O
mm
en K
loek
e, G
eese
y (1
99
9)
Oxi
do
red
uct
ase
En
zym
es
P
hen
ol o
xid
ase
L-
3,4
-dih
ydro
xy p
hen
ylal
anin
e
Riv
er b
iofi
lm
Sin
sab
augh
et
al.
(19
91
)
Per
oxi
das
e
L-3
,4-d
ihyd
roxy
ph
enyl
alan
ine,
H2O
2 R
iver
bio
film
Si
nsa
bau
gh e
t a
l. (1
99
1)
Ex
trac
ellu
lar
red
ox
acti
vity
5
-cya
no
-2,3
-di-
4-t
oly
l-te
traz
oliu
m
chlo
rid
e
Act
ivat
ed s
lud
ge
Wu
ertz
et
al.
(19
98
)
Extr
acel
lula
r re
do
x ac
tivi
ty
Tetr
azo
lium
sal
t (X
TT)
Act
ivat
ed s
lud
ge
Wu
ertz
et
al.
(19
98
)
Introduction
12
- Polysaccharides -
Polysaccharides are high molecular weight carbohydrates comprised of monosaccharides.
The monomers form long chains, which are joined by glycosidic linkages. Common
monosaccharides used by bacteria to produce polysaccharides include D-glucose, D-
mannose, D-galactose, D-fucose, L-rhamnose, amino acids and the uronic acids D-glucuronic
acid, D-galacturonic acid as well as D-mannuronic acid and L-guluronic acid. These
monomers can either form homo-polysaccharides, which are composed of a single type of
monosaccharide, or hetero-polysaccharides, which are built up of repeating units of several
different monosaccharides. A typical example for a homo-polysaccharide is cellulose
produced for example by Acetobacter xylinum and other bacteria belonging to the genera
Acetobacter, Rhizobium, Agrobacter or Sarcina (Ross et al., 1991; Kimura and Kondo, 2002).
It is composed of β-1,4-glycosidic linked D-glucose monomers. Xanthan, which is produced
by Xanthomonas campestris, is an example for a hetero-polysaccharide. Xanthan is
composed of a β-1,4-glycosidic linked glucose backbone, as found in cellulose, which in
addition incorporates a trisaccharide side chain of O-acetylated D-mannose, D-glucuronic
acid and pyruvate-substituted D-mannose every other glucose monomer at the 3 position
(Sutherland, 1990). The side chains of polysaccharides can contain organic substituents such
as O-acetyl or O-succinyl esters and pyruvate ketals, or inorganic residues such as sulphate
or phosphate (Sutherland, 1990; Sutherland 2001). Composition and structure and,
therefore, the chemical and physical properties among polysaccharides vary greatly. Most
polysaccharides are polyanionic due to the presence of uronic acids, such as glucuronic,
galacturonic or mannuronic acids, or because of ketal-linked pyruvate, all of which
contribute to the anionic properties of biofilms. Some, however, can also be neutral or even
polycationic (Sutherland, 2001). Polysaccharides are usually very long and thin molecules
with molecular weightes between 0.5 – 2 x 10⁶ Da (Sutherland, 2001). Polymerases, which
are located in the cytoplasmic membrane, interlink monosaccharides and form long chains
of polysaccharides. These are then actively transported through the cytoplasmic membrane
into the environment, for instance with the help of the polyisoprenyl-carrier (Sutherland,
1988). Some polysaccharides, such as dextrans or levans, can also be produced
extracellularly. A main function of polysaccharides is the formation the three-dimensional
structure of the biofilm. Cross-linkages between polysaccharide chains determine the
Introduction
13
mechanical stability of biofilms (Mayer et al., 1999; Wingender, 1999). Additional functions
with regard to retention, stabilization and protection of enzymes have been attributed to
polysaccharides. Tielen (2006) could show that lipases secreted by P. aeruginosa were
retained in the EPS matrix. The enzymes formed complexes with alginate, which was a major
component of the P. aeruginosa strain applied in the study, by docking with the positively
charged amino acids arginine and histidine to the negative reactive groups of the polyanionic
alginate. The lipase-alginate complexes exhibited higher heat tolerance in contrast to
unbound lipase (Tielen, 2006).
- Extracellular DNA (eDNA) -
eDNA has been recognised as a constituent of slime produced by microorganisms under
certain conditions as early as in the 1950s (Smithies and Gibbons, 1955; Catlin, 1956).
Originally eDNA had been considered to be released due to leakage of the cell membrane
affected by adverse environmental conditions (Smithies and Gibbons, 1955), or a residual
released from lysed cells, which is retained within the biofilm matrix (Whitchurch et al.,
2002, Böckelmann et al., 2006). Muto and Goto (1986) reported that bacteria such as
P. aeruginosa deliberately produce eDNA, which has transforming capability. Further studies
have revealed considerable amounts of eDNA in the EPS of environmental biofilms or
biofilms in technical systems (Nishikawa and Kuriyama, 1968; Platt et al., 1985; Frølund et
al., 1996; Palmgren and Nielsen, 1996). Whitchurch et al. (2002) provided evidence, that
eDNA is an important structural component of P. aeruginosa biofilms, necessary for the
development of a biofilm especially during the early phases of biofilm growth. Their study
showed that addition of DNA degrading enzymes (DNases) to a culture medium with
P. aeruginosa prevented biofilm formation, even though bacterial growth was not inhibited.
Furthermore, up to 60 hours old biofilms of P. aeruginosa treated with DNase were dissolved
while older biofilms showed only minor alterations to the biofilm structure. eDNA has been
shown to be a universal EPS component of biofilms, and was detected for example in pure
culture biofilms of Acinetobacter calcoaceticus, Bacillus subtilis (Lorenz et al., 1991),
Neisseria gonorrhoeae (Dillard and Seifert, 2001), Streptococcus intermedius (Petersen et al.,
2004), S. aureus (Rice et al., 2007), S. epidermidis (Qin et al., 2007), Shewanella sp. (Pinchuk
Introduction
14
et al., 2008), Bacillus cereus (Vilain et al., 2009), S. mutans (Das et al., 2010), as well as
environmental biofilms as found in soils or sediments (Pietramellara et al., 2009) and in
technical system biofilms such as activated sludge (Dominiak et al., 2011). Studies by
Böckelmann et al. (2006, 2007) revealed that eDNA was organised in distinct patterns in
biofilms formed by the bacterial strain F8. This strongly supports the concept that eDNA
contributes to the spatial structure of biofilms forming an extracellular filamentous network
of DNA (Flemming et al., 2007). Furthermore, Das et al. (2010) demonstrated the importance
of eDNA for initial adhesion of microorganisms to surfaces. Further potential roles of eDNA
in the biofilm matrix have been debated in a discussion session conducted by and
summarized in Flemming et al. (2007). The retention of eDNA in the biofilm matrix provides
indication for a facilitated gene exchange within the biofilm. It was also hypothesized that
these filaments could be used for electron transfer or even communication, and that “it
seemed as if the cells could move along these filaments, using them as nanowires”
(Flemming et al., 2007). However, these additional roles of eDNA remain speculations.
- Lipids -
Though often disregarded in EPS analysis, lipids can also constitute a significant portion of
microbial EPS. Gehrke et al. (1998) as well as Sand and Gehrke (2006) for example identified
these polymers to be a major EPS component and crucial for adhesion of Thiobacillus
ferrooxidans to pyrite surfaces. Phospholipids, glycolipids and neutral lipids have also been
described as components of activated sludge flocs (Conrad et al., 2003).
1.2.2 EPS matrix formation
The release of EPS components into the matrix plays a central role in the formation of
biofilms. The release can occur actively, by secretion of the macromolecules through the
inner and outer membranes of a cell, by formation and release of membrane vesicles, or
passively through cell death and consequential discharge of intracellular material into the
surroundings.
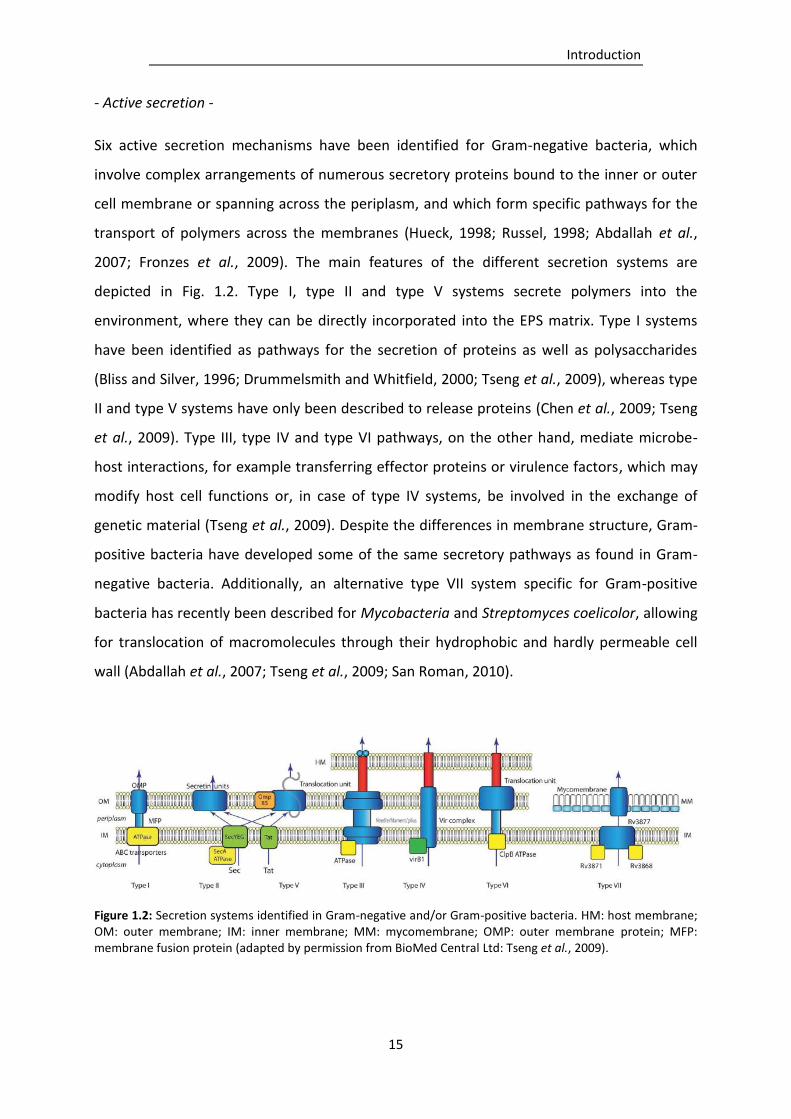
Introduction
15
- Active secretion -
Six active secretion mechanisms have been identified for Gram-negative bacteria, which
involve complex arrangements of numerous secretory proteins bound to the inner or outer
cell membrane or spanning across the periplasm, and which form specific pathways for the
transport of polymers across the membranes (Hueck, 1998; Russel, 1998; Abdallah et al.,
2007; Fronzes et al., 2009). The main features of the different secretion systems are
depicted in Fig. 1.2. Type I, type II and type V systems secrete polymers into the
environment, where they can be directly incorporated into the EPS matrix. Type I systems
have been identified as pathways for the secretion of proteins as well as polysaccharides
(Bliss and Silver, 1996; Drummelsmith and Whitfield, 2000; Tseng et al., 2009), whereas type
II and type V systems have only been described to release proteins (Chen et al., 2009; Tseng
et al., 2009). Type III, type IV and type VI pathways, on the other hand, mediate microbe-
host interactions, for example transferring effector proteins or virulence factors, which may
modify host cell functions or, in case of type IV systems, be involved in the exchange of
genetic material (Tseng et al., 2009). Despite the differences in membrane structure, Gram-
positive bacteria have developed some of the same secretory pathways as found in Gram-
negative bacteria. Additionally, an alternative type VII system specific for Gram-positive
bacteria has recently been described for Mycobacteria and Streptomyces coelicolor, allowing
for translocation of macromolecules through their hydrophobic and hardly permeable cell
wall (Abdallah et al., 2007; Tseng et al., 2009; San Roman, 2010).
Figure 1.2: Secretion systems identified in Gram-negative and/or Gram-positive bacteria. HM: host membrane; OM: outer membrane; IM: inner membrane; MM: mycomembrane; OMP: outer membrane protein; MFP: membrane fusion protein (adapted by permission from BioMed Central Ltd: Tseng et al., 2009).
Introduction
16
- Membrane vesicles -
Membrane vesicles represent a further export mechanism for polymers, such as proteins,
polysaccharides, nucleic acids, lipopolysaccharides or phospholipids, which is found in Gram-
negative bacteria (Kuehn and Kesty, 2005) and archaea (Ellen et al., 2009). Membrane
vesicles, in case of Gram-negative bacteria, are spherical lipid bilayers composed of the cell’s
outer membrane. The outer cell membrane forms a bleb which incorporates periplasmic
constituents and which is then released into the environment. In case of archaea, this bleb is
composed of tetraether lipids, which are coated with an S-layer (Ellen et al., 2009). This type
of secretion has been described for a number of organisms, often of pathogenic character,
including E. coli, P. aeruginosa, Campylobacter jejuni, Helicobacter jejuni, Salmonella spp.,
Shigella spp., Sulfolobus acidocaldarius, S. solfataricus and S. tokodaii (Hoekstra et al., 1976;
Logan and Trust, 1982; Kadurugamuwa and Beveridge, 1995; Fiocca et al., 1999;
Kandurugamuwa and Beveridge, 1999; Vesy et al., 2000; Kuehn and Kesty, 2005; Ellen et al.,
2009). Pathogens have been shown to use this type of secretion to engage in malignant host
interactions (Kadurugamuwa and Beveridge, 1995; Beveridge et al., 1997; Wingender et al.,
1999; Kuehn and Kesty, 2005). A variety of polymers has been detected within membrane
vesicles, including hydrolases, proteases, phosphatases, adhesins and toxins (Kuehn and
Kesty, 2005; Ellen et al., 2009). Due to their structure, membrane vesicles contribute to the
lipopolysaccharide and/or protein fraction of the EPS and play a potential structural role
within the matrix (Schooling and Beveridge, 2006).
- Cell lysis -
Cell death and consequential lysis of cells is a common and necessary element for the
formation of biofilms and represents another mechanism of polymer discharge (Rice et al.,
2007; O’Connelll, 2007). This type of release can represent a strategic mechanism for fast
release of the entire intracellular material into the environment as reaction to
environmental changes, regulated by a genetic program. Bacterial programmed cell death
has first been reported in E. coli in late 20th century (Naito et al., 1995; Yarmolinsky, 1995).
The best studied systems for programmed cell death are toxin-antitoxin modules, classified
into the eight so far identified families ccd, relBE, parDE, higBA, mazEF, phd/doc, vapBC/vag,
Introduction
17
and which are highly abundant among bacteria as well as archaea (Gerdes et al.,
2005; Pandey and Gerdes, 2005; Engelberg-Kulka et al., 2006). “Normal” environmental
conditions allow for a simultaneous expression of genes encoding for both, the toxin and the
corresponding antitoxin, inhibiting the action of the toxin. Stress conditions, however, result
in the deliberate arrest of expression of both genes. Since the antitoxin is more labile than
the toxin, the action of the toxin is no longer inhibited and growth arrest or cell death occurs
(Engelberg-Kulka et al., 2006). For single cells these mechanisms appear disadvantageous,
however, biofilm communities can highly benefit from the death of a subpopulation (Webb
et al., 2003). Starvation for instance can trigger programmed cell death of a subpopulation,
providing nutrients for the remaining population, and thus, enabling their survival
(Engelberg-Kulka and Hazan, 2003). Recent studies indicated that programmed cell death
may be a mechanism important for biofilm formation, which enables the release of
structural EPS components, in particular DNA, into the biofilm matrix (Rice et al., 2007;
O’Connell, 2007). Furthermore, dispersion of cells from mature biofilms can be induced by
the death of a subpopulation, releasing EPS degrading enzymes, and thus, liberating cells
from the matrix (Garcia-Contreras et al., 2008; Rice et al., 2009; Sillankorva et al., 2010;
McDougal, 2012).
1.2.3 Mechanical stability of biofilms
Environmental or industrial biofilms often encounter external perturbations in the form of
mechanical forces such as shear. Despite their slimy appearance, biofilms exhibit impressive
resilience towards these forces, while offering an adequate habitat for microorganisms to
reside. The EPS composition determines mechanical stability of biofilms. Macromolecules
like polysaccharides, proteins, DNA and lipids interact with themselves or with one another
and form a complex three-dimensional network, which enforces cohesion and adhesion of
the biofilm (Fig. 1.3; Flemming and Wingender, 2010). Multivalent cations can further
enhance cross-linkages of otherwise repelling, negatively charged reactive groups of
polymers (Busch and Stumm, 1968; Steiner et al., 1976; Mayer et al., 1999; Körstgens et al.,
2001).
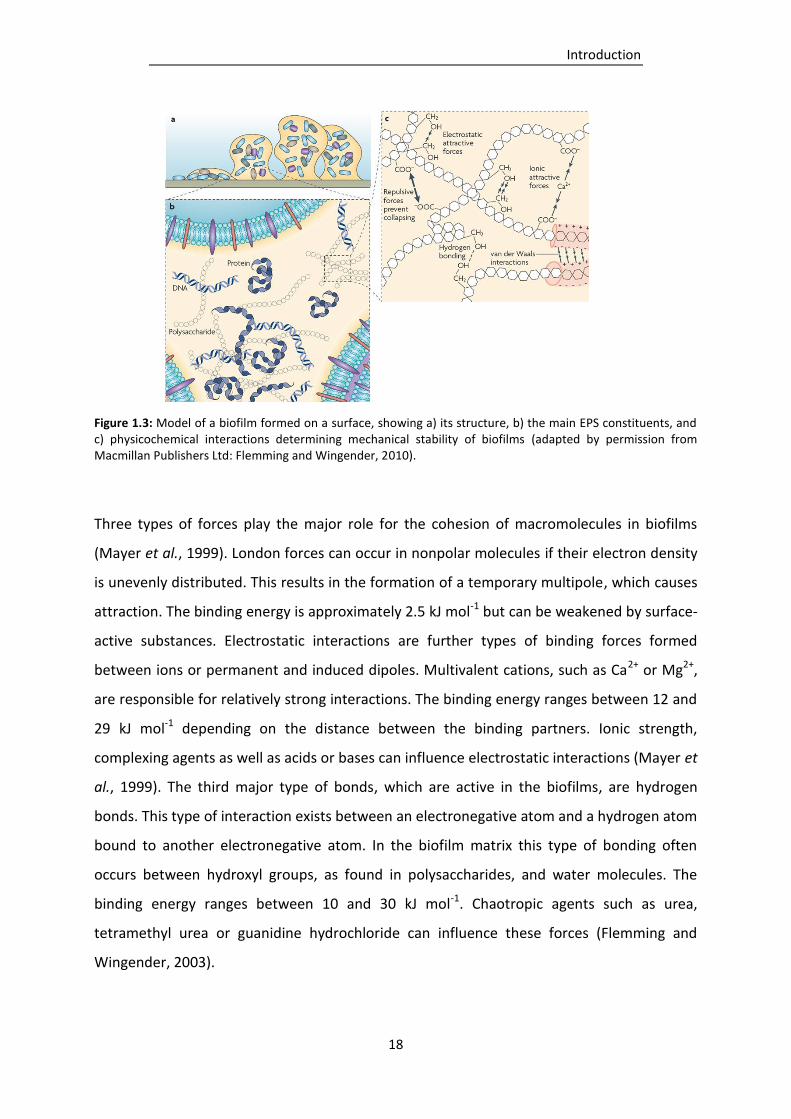
Introduction
18
Figure 1.3: Model of a biofilm formed on a surface, showing a) its structure, b) the main EPS constituents, and c) physicochemical interactions determining mechanical stability of biofilms (adapted by permission from Macmillan Publishers Ltd: Flemming and Wingender, 2010).
Three types of forces play the major role for the cohesion of macromolecules in biofilms
(Mayer et al., 1999). London forces can occur in nonpolar molecules if their electron density
is unevenly distributed. This results in the formation of a temporary multipole, which causes
attraction. The binding energy is approximately 2.5 kJ mol-1 but can be weakened by surface-
active substances. Electrostatic interactions are further types of binding forces formed
between ions or permanent and induced dipoles. Multivalent cations, such as Ca2+ or Mg2+,
are responsible for relatively strong interactions. The binding energy ranges between 12 and
29 kJ mol-1 depending on the distance between the binding partners. Ionic strength,
complexing agents as well as acids or bases can influence electrostatic interactions (Mayer et
al., 1999). The third major type of bonds, which are active in the biofilms, are hydrogen
bonds. This type of interaction exists between an electronegative atom and a hydrogen atom
bound to another electronegative atom. In the biofilm matrix this type of bonding often
occurs between hydroxyl groups, as found in polysaccharides, and water molecules. The
binding energy ranges between 10 and 30 kJ mol-1. Chaotropic agents such as urea,
tetramethyl urea or guanidine hydrochloride can influence these forces (Flemming and
Wingender, 2003).
Introduction
19
These three types of bonds show relatively low binding forces compared for example to
covalent bonds. Due to the large amount of binding sites, however, the total binding forces
may result in equivalent and even higher values compared to covalent bonds (Mayer et al.,
1999; Flemming and Wingender, 2003).
1.3 Biofilms in drinking water distribution systems
Biofilms are ubiquitous in environmental as well as technical systems in contact with water.
Drinking water distribution systems offer diverse surfaces, which are common targets for
biofilm formation. Starting from the extraction point of raw water, biofilms can be found
throughout the drinking water production chain, including inner walls of pipes, the different
stages of water treatment, valves or water storage tanks, all the way to the consumer’s tap
(Kilb et al., 2003; Schmeisser et al., 2003; Schwartz et al., 2003; Bagh et al., 2004; Emtiazi et
al., 2004; Wingender and Flemming, 2004; Hoefel et al., 2005; Bressler et al., 2009; Moritz et
al., 2010; Waines et al., 2011; Wingender, 2011; Flemming et al., 2012). The extent and
microbiological and biochemical composition of these biofilms can vary greatly depending
on the water source, organisms present, colonized surface or environmental conditions such
as pH, water temperature, hydrodynamic parameters, available nutrients or disinfectants
(Roeder et al., 2010a; Flemming et al., 2012). Flemming et al. (2002, 2012) estimated that 95
% of the overall biomass within drinking water systems can be found attached to surfaces.
Due to its oligotrophic conditions drinking water systems permit only limited biofilm
development and growth occurs until a plateau phase is reached, which does not interfere
with water quality. This plateau phase is controlled by factors like shear forces, temperature
and nutrients (Flemming, 2011). A number of studies have investigated the extent of biofilm
formation on pipe surfaces of drinking water distribution systems or on coupons submerged
in drinking water. These studies determined total cell counts in the range of 104 and 108 cells
cm-2, while culturability was significantly lower between 101 and 106 cfu cm-2 (LeChevallier et
al., 1987; Block et al., 1993; Kalmbach et al., 1997; Wingender and Flemming, 2004;
Långmark et al., 2005a; Moritz et al., 2010). Once availability of nutrients is increased, for
example through insufficient drinking water treatment or when materials containing
biodegradable ingredients are implemented, excessive biofilm growth can occur and lead to
Introduction
20
sloughing off of biofilm parts with subsequent contamination of the water phase (Flemming,
2002). In a case study Kilb et al. (2003) identified rubber coated valves as potential point
sources for continuous contamination of drinking water in different drinking water
distribution systems in north-west and north Germany. The surfaces of these valves, which
were made of ethylene-propylene-diene monomer (EPDM) rubber, inhabited elevated
numbers of microorganisms with total cell counts between 106 and 109 cells cm-2. EPDM
rubber materials are frequently used in drinking water distribution systems, for example for
valves or sealings. However, it has been shown that certain formulations of these synthetic
materials leach considerable amounts of nutrients, which can be readily utilized by
microorganisms and, thus, lead to significant biofilm development (Rogers et al., 1994; Kilb
et al., 2003).
According to the German Drinking Water Ordinance, drinking water is supplied in food-
quality and water suppliers need to guarantee chemically and microbiologically stable
drinking water up to the water meter of a plumbing system. However, by the time the water
reaches the consumer’s tap, the water can be substantially altered in quality compared to
the water leaving the water works (Pepper et al., 2004; Flemming et al., 2012). Since
drinking water distribution systems are systematically monitored, beginning from the
abstraction point up to the water meter, the major source of concern remain public and
domestic plumbing systems. Plumbing systems are, according to regulations, responsibility
of the owner of a building (TrinkwV, 2011). The materials used for plumbing systems can
differ to those used in drinking water distribution systems and include elastomers, synthetic
materials, copper or stainless steel (Kistemann et al., 2010). Also materials may be
implemented, which are not suitable or unapproved for the use in drinking water systems
(Schauer et al., 2008; Kistemann et al., 2010; Flemming et al., 2012). Increased biofilm
development may be supported due to the wrong choice of material. Auxiliary equipment,
such as water softeners, filters, or phosphate dosage devices, has also been shown to
increase the risk of enhanced biofilm formation (Völker et al., 2010). Conditions within
household installations can differ significantly from those in a water distribution system.
Domestic installations can include dead ends, resulting in points of stagnating water, and
also longer retention times of water are not uncommon, for example during vacations, both
of which allow for biofilm formation under low shear stress (Lautenschlager et al., 2010;
Introduction
21
Flemming et al., 2012). Water temperature can be elevated in plumbing systems compared
to the drinking water distribution systems, due to the pipe’s passage of heated rooms or
close proximity to warm water systems, especially if the pipe’s insulation is poor (Flemming
et al., 2012). These factors can result in conditions favouring a different biofilm flora.
Biofilms in drinking water distribution or plumbing systems are mainly formed by
autochthonous microorganisms, which are generally harmless to human health (Wingender,
2011; Flemming et al., 2012). This includes members of the groups of α-, ß-, and γ-
Proteobacteria, as well as Actinobacteria, Bacteroides, Firmicutes or Nitrospirae (Schmeisser
et al., 2003; Hoefel et al., 2005; Eichler et al., 2006; Bai et al., 2010; Yu et al., 2010).
However, recent studies have demonstrated the potential of drinking-water biofilms to
accommodate hygienically relevant microorganisms, which under unfavourable conditions
can pose a threat to human health (Szewzyk et al., 2000; Flemming et al., 2002; Bressler et
al., 2009; Moritz et al.,2010). Hygienically relevant microorganisms such as coliform bacteria,
which are indicators of faecal contamination, have been shown to reside in these biofilms
(Flemming et al., 2002; Kilb et al., 2003; Wingender and Flemming, 2011). Also opportunistic
pathogens like P. aeruginosa or Legionella pneumophila (Rogers et al., 1994; Flemming et al.,
2002; Bressler et al., 2009; Moritz et al.,2010), which are known to be involved in severe
cases of pneumonia, as well as Aeromonas, Campylobacter, Cryptosporidium, Helicobacter,
or Mycobacterium species (Berry et al., 2006; Yu et al., 2010; Wingender, 2011), or viral
pathogens (Skraber et al., 2005; Berry et al., 2006; Wingender and Flemming, 2011) can be
incorporated and reside in biofilms for prolonged periods of time. The influence of these
microorganisms on biofilm or EPS composition, however, has not been investigated so far.
Microbiological requirements for drinking water quality are based on cultivation on diverse
media, aiming at the determination of indicator parameters, such as colony counts of
heterotrophic microorganisms, or microbiological parameters, such as presence of
culturable coliform bacteria, Escherichia coli and enterococci, as well as P. aeruginosa or the
recently added Legionella spec. within the water phase (TrinkwV, 2011). Cultivation
techniques, however, are selective for certain microorganisms and, therefore, do not reflect
the total population of a microbial community (Amann et al., 1995; Moritz et al., 2010;
Wingender, 2011; Wingender and Flemming, 2011). The vast majority of microorganisms
cannot be cultivated on standard media and, moreover, adverse environmental conditions

Introduction
22
may induce the transition of microorganisms into a viable but nonculturable (VBNC) state,
resulting in an underestimation of the total microbial flora (Kalmbach et al., 1997;
Wingender, 2011). The VBNC state is defined as a state, in which bacteria “fail to grow on
the routine bacteriological media on which they would normally grow and develop into
colonies, but are alive and capable of renewed metabolic activity” (Oliver, 2005) and has
been of particular interest in recent studies investigating biofilms in drinking water systems.
Moritz et al. (2010) showed that P. aeruginosa can be incorporated and survive for
prolonged periods in drinking-water biofilms, and indicated that P. aeruginosa may enter the
VBNC state if grown in installations made of copper. Dwidjosiswojo et al. (2011) confirmed
the transition into the VBNC state due to copper, showing complete inactivation of
P. aeruginosa in 10 µM copper solutions and successful resuscitation once copper ions were
complexed by diethyldithiocarbamate. This state poses a risk for human health, since
P. aeruginosa would remain undetected by routine drinking water analyses, especially in
plumbing systems, which often include copper materials. Microbial growth on the surfaces
of drinking water installations in the form of biofilms is not considered by routine
examinations. However, biofilms may serve as a reservoir for hygienically relevant
microorganisms and can be reason for continuous contaminations with on a routine basis
undetected pathogens (Wingender, 2011).
1.4 Methods for biofilm and EPS analysis
The analysis of biofilms and their EPS represents a challenging field of research. There is no
single method able to completely characterize the different facets of a biofilm. Instead
interdisciplinary work is required, including microbiology, molecular biology, biochemistry,
physical chemistry, analytical chemistry, engineering and modelling to be able to thoroughly
investigate the nature of biofilms. Various techniques have been developed or adapted for
biofilm research, aiming at the identification of the microbial or (bio-) chemical composition,
the architecture or processes occurring within a biofilm (Denkhaus et al., 2007).
Biofilms are rarely investigated in detail in their natural habitat. The usual case is to recreate
environmental biofilms in the laboratory under standardized conditions or preferably
simulating growth conditions found in the biofilm’s native environment. Biofilm analysis,
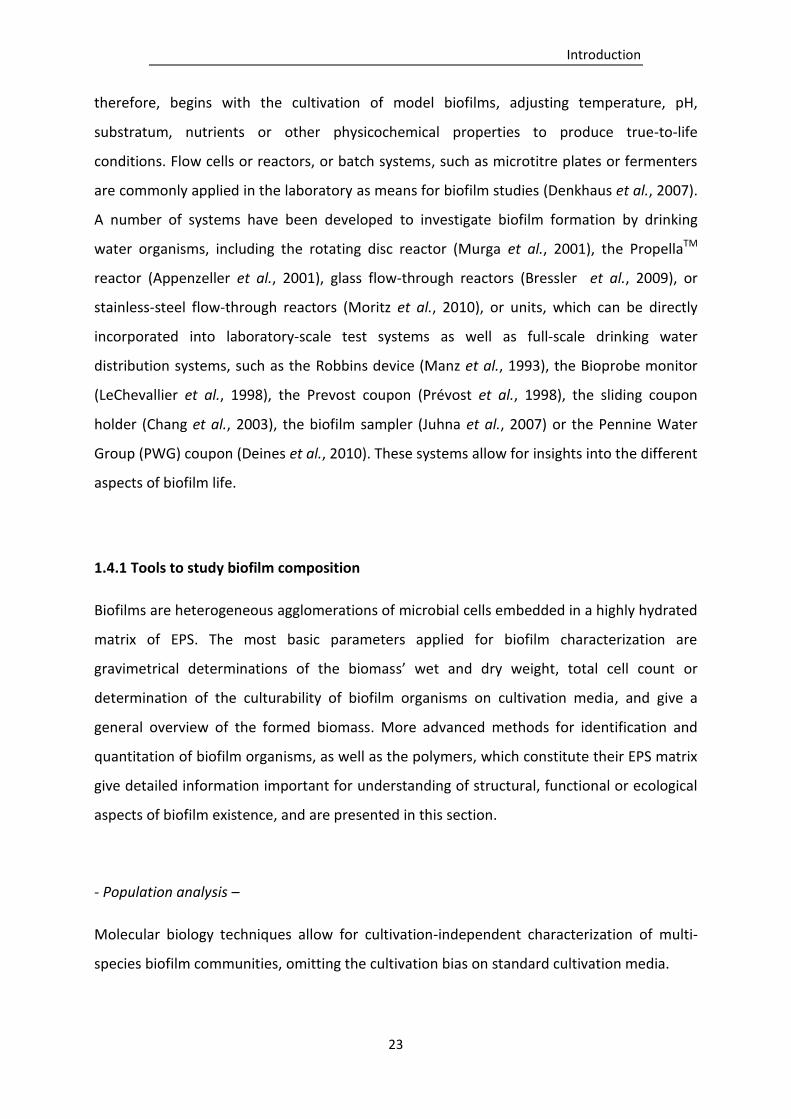
Introduction
23
therefore, begins with the cultivation of model biofilms, adjusting temperature, pH,
substratum, nutrients or other physicochemical properties to produce true-to-life
conditions. Flow cells or reactors, or batch systems, such as microtitre plates or fermenters
are commonly applied in the laboratory as means for biofilm studies (Denkhaus et al., 2007).
A number of systems have been developed to investigate biofilm formation by drinking
water organisms, including the rotating disc reactor (Murga et al., 2001), the PropellaTM
reactor (Appenzeller et al., 2001), glass flow-through reactors (Bressler et al., 2009), or
stainless-steel flow-through reactors (Moritz et al., 2010), or units, which can be directly
incorporated into laboratory-scale test systems as well as full-scale drinking water
distribution systems, such as the Robbins device (Manz et al., 1993), the Bioprobe monitor
(LeChevallier et al., 1998), the Prevost coupon (Prévost et al., 1998), the sliding coupon
holder (Chang et al., 2003), the biofilm sampler (Juhna et al., 2007) or the Pennine Water
Group (PWG) coupon (Deines et al., 2010). These systems allow for insights into the different
aspects of biofilm life.
1.4.1 Tools to study biofilm composition
Biofilms are heterogeneous agglomerations of microbial cells embedded in a highly hydrated
matrix of EPS. The most basic parameters applied for biofilm characterization are
gravimetrical determinations of the biomass’ wet and dry weight, total cell count or
determination of the culturability of biofilm organisms on cultivation media, and give a
general overview of the formed biomass. More advanced methods for identification and
quantitation of biofilm organisms, as well as the polymers, which constitute their EPS matrix
give detailed information important for understanding of structural, functional or ecological
aspects of biofilm existence, and are presented in this section.
- Population analysis –
Molecular biology techniques allow for cultivation-independent characterization of multi-
species biofilm communities, omitting the cultivation bias on standard cultivation media.
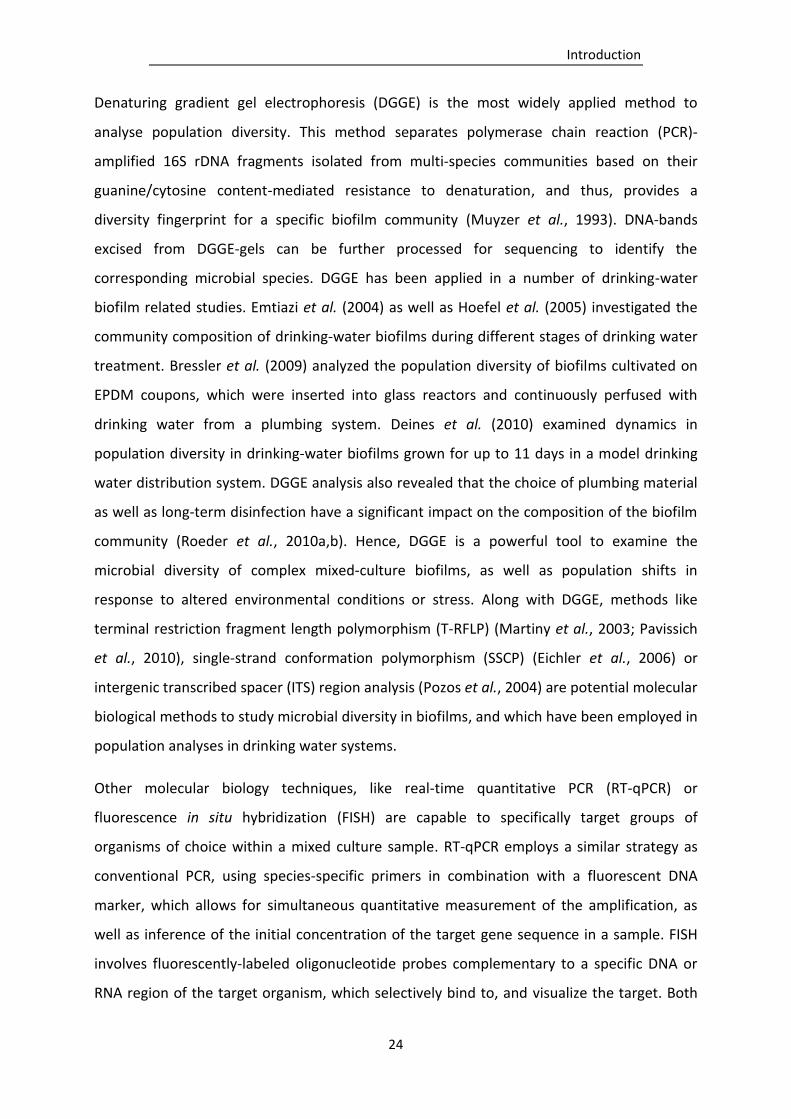
Introduction
24
Denaturing gradient gel electrophoresis (DGGE) is the most widely applied method to
analyse population diversity. This method separates polymerase chain reaction (PCR)-
amplified 16S rDNA fragments isolated from multi-species communities based on their
guanine/cytosine content-mediated resistance to denaturation, and thus, provides a
diversity fingerprint for a specific biofilm community (Muyzer et al., 1993). DNA-bands
excised from DGGE-gels can be further processed for sequencing to identify the
corresponding microbial species. DGGE has been applied in a number of drinking-water
biofilm related studies. Emtiazi et al. (2004) as well as Hoefel et al. (2005) investigated the
community composition of drinking-water biofilms during different stages of drinking water
treatment. Bressler et al. (2009) analyzed the population diversity of biofilms cultivated on
EPDM coupons, which were inserted into glass reactors and continuously perfused with
drinking water from a plumbing system. Deines et al. (2010) examined dynamics in
population diversity in drinking-water biofilms grown for up to 11 days in a model drinking
water distribution system. DGGE analysis also revealed that the choice of plumbing material
as well as long-term disinfection have a significant impact on the composition of the biofilm
community (Roeder et al., 2010a,b). Hence, DGGE is a powerful tool to examine the
microbial diversity of complex mixed-culture biofilms, as well as population shifts in
response to altered environmental conditions or stress. Along with DGGE, methods like
terminal restriction fragment length polymorphism (T-RFLP) (Martiny et al., 2003; Pavissich
et al., 2010), single-strand conformation polymorphism (SSCP) (Eichler et al., 2006) or
intergenic transcribed spacer (ITS) region analysis (Pozos et al., 2004) are potential molecular
biological methods to study microbial diversity in biofilms, and which have been employed in
population analyses in drinking water systems.
Other molecular biology techniques, like real-time quantitative PCR (RT-qPCR) or
fluorescence in situ hybridization (FISH) are capable to specifically target groups of
organisms of choice within a mixed culture sample. RT-qPCR employs a similar strategy as
conventional PCR, using species-specific primers in combination with a fluorescent DNA
marker, which allows for simultaneous quantitative measurement of the amplification, as
well as inference of the initial concentration of the target gene sequence in a sample. FISH
involves fluorescently-labeled oligonucleotide probes complementary to a specific DNA or
RNA region of the target organism, which selectively bind to, and visualize the target. Both
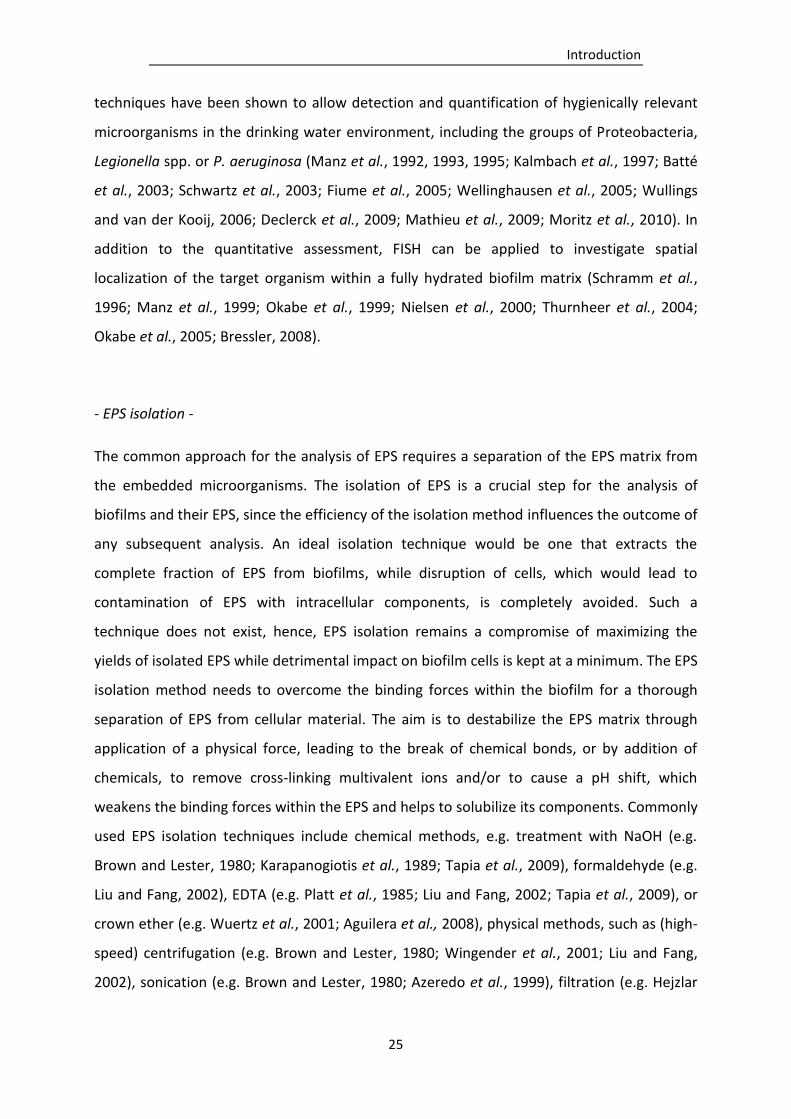
Introduction
25
techniques have been shown to allow detection and quantification of hygienically relevant
microorganisms in the drinking water environment, including the groups of Proteobacteria,
Legionella spp. or P. aeruginosa (Manz et al., 1992, 1993, 1995; Kalmbach et al., 1997; Batté
et al., 2003; Schwartz et al., 2003; Fiume et al., 2005; Wellinghausen et al., 2005; Wullings
and van der Kooij, 2006; Declerck et al., 2009; Mathieu et al., 2009; Moritz et al., 2010). In
addition to the quantitative assessment, FISH can be applied to investigate spatial
localization of the target organism within a fully hydrated biofilm matrix (Schramm et al.,
1996; Manz et al., 1999; Okabe et al., 1999; Nielsen et al., 2000; Thurnheer et al., 2004;
Okabe et al., 2005; Bressler, 2008).
- EPS isolation -
The common approach for the analysis of EPS requires a separation of the EPS matrix from
the embedded microorganisms. The isolation of EPS is a crucial step for the analysis of
biofilms and their EPS, since the efficiency of the isolation method influences the outcome of
any subsequent analysis. An ideal isolation technique would be one that extracts the
complete fraction of EPS from biofilms, while disruption of cells, which would lead to
contamination of EPS with intracellular components, is completely avoided. Such a
technique does not exist, hence, EPS isolation remains a compromise of maximizing the
yields of isolated EPS while detrimental impact on biofilm cells is kept at a minimum. The EPS
isolation method needs to overcome the binding forces within the biofilm for a thorough
separation of EPS from cellular material. The aim is to destabilize the EPS matrix through
application of a physical force, leading to the break of chemical bonds, or by addition of
chemicals, to remove cross-linking multivalent ions and/or to cause a pH shift, which
weakens the binding forces within the EPS and helps to solubilize its components. Commonly
used EPS isolation techniques include chemical methods, e.g. treatment with NaOH (e.g.
Brown and Lester, 1980; Karapanogiotis et al., 1989; Tapia et al., 2009), formaldehyde (e.g.
Liu and Fang, 2002), EDTA (e.g. Platt et al., 1985; Liu and Fang, 2002; Tapia et al., 2009), or
crown ether (e.g. Wuertz et al., 2001; Aguilera et al., 2008), physical methods, such as (high-
speed) centrifugation (e.g. Brown and Lester, 1980; Wingender et al., 2001; Liu and Fang,
2002), sonication (e.g. Brown and Lester, 1980; Azeredo et al., 1999), filtration (e.g. Hejzlar

Introduction
26
and Chudoba, 1986), or heating/boiling (e.g. Brown and Lester, 1980; Forster and Quarmby,
1995) or combinations of chemical and physical methods, in particular the use of a cation
exchange resin (CER) (e.g. Jahn and Nielsen, 1995; Frølund et al., 1996) (Tab. 1.2). These
techniques have been applied over past decades in a number of studies, mostly dealing with
pure culture biofilms or activated sludge (Nielsen and Jahn, 1999; Liu and Fang, 2003; Sheng
et al., 2010). Possible cell lysis induced by the isolation methods has often been disregarded,
even though this can substantially alter and falsify results (Nielsen and Jahn, 1999).
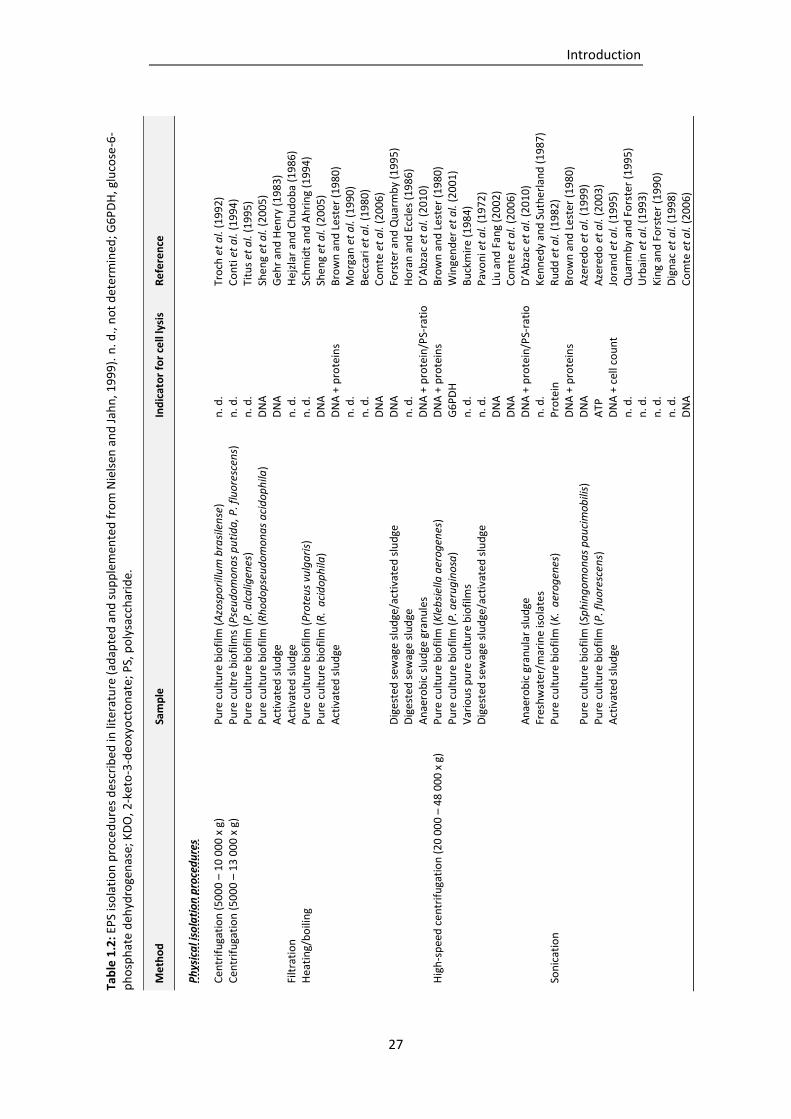
Introduction
27
Tab
le 1
.2:
EPS
iso
lati
on
pro
ced
ure
s d
escr
ibed
in li
tera
ture
(ad
apte
d a
nd
su
pp
lem
ente
d f
rom
Nie
lsen
an
d J
ahn
, 19
99
). n
. d.,
no
t d
eter
min
ed; G
6P
DH
, glu
cose
-6-
ph
osp
hat
e d
ehyd
roge
nas
e; K
DO
, 2-k
eto
-3-d
eoxy
oct
on
ate;
PS,
po
lysa
cch
arid
e.
Me
tho
d
Sam
ple
In
dic
ato
r fo
r ce
ll ly
sis
Re
fere
nce
Ph
ysic
al i
sola
tio
n p
roce
du
res
Cen
trif
uga
tio
n (
50
00
– 1
0 0
00
x g
) P
ure
cu
ltu
re b
iofi
lm (
Azo
spo
rillu
m b
rasi
len
se)
n. d
. Tr
och
et
al.
(19
92)
C
entr
ifu
gati
on
(5
00
0 –
13
00
0 x
g)
Pu
re c
ult
re b
iofi
lms
(Pse
ud
om
on
as
pu
tid
a, P
. flu
ore
scen
s)
Pu
re c
ult
ure
bio
film
(P
. alc
alig
enes
) P
ure
cu
ltu
re b
iofi
lm (
Rh
od
op
seu
do
mo
na
s a
cid
op
hila
) A
ctiv
ated
slu
dge
n. d
. n
. d.
DN
A
DN
A
Co
nti
et
al.
(19
94
) Ti
tus
et a
l. (1
99
5)
She
ng
et a
l. (2
00
5)
Geh
r an
d H
enry
(1
98
3)
Filt
rati
on
A
ctiv
ated
slu
dge
n
. d.
Hej
zlar
an
d C
hu
do
ba
(19
86
) H
eati
ng/
bo
ilin
g P
ure
cu
ltu
re b
iofi
lm (
Pro
teu
s vu
lga
ris)
P
ure
cu
ltu
re b
iofi
lm (
R.
aci
do
ph
ila)
Act
ivat
ed s
lud
ge
Dig
este
d s
ewag
e sl
ud
ge/a
ctiv
ate
d s
lud
ge
Dig
este
d s
ewag
e sl
ud
ge
An
aero
bic
slu
dge
gra
nu
les
n. d
. D
NA
D
NA
+ p
rote
ins
n. d
. n
. d.
DN
A
DN
A
n. d
. D
NA
+ p
rote
in/P
S-ra
tio
Sch
mid
t an
d A
hri
ng
(19
94
) Sh
en
g et
al.
(20
05
) B
row
n a
nd
Les
ter
(19
80
) M
org
an e
t a
l. (1
99
0)
Bec
cari
et
al.
(19
80
) C
om
te e
t a
l. (2
00
6)
Fors
ter
and
Qu
arm
by
(19
95
) H
ora
n a
nd
Ecc
les
(19
86
) D
’Ab
zac
et a
l. (2
01
0)
Hig
h-s
pee
d c
en
trif
uga
tio
n (
20
00
0 –
48
00
0 x
g)
Pu
re c
ult
ure
bio
film
(K
leb
siel
la a
ero
gen
es)
Pu
re c
ult
ure
bio
film
(P
. aer
ug
ino
sa)
Var
iou
s p
ure
cu
ltu
re b
iofi
lms
Dig
este
d s
ewag
e sl
ud
ge/a
ctiv
ate
d s
lud
ge
An
aero
bic
gra
nu
lar
slu
dge
Fr
esh
wat
er/m
arin
e is
ola
tes
DN
A +
pro
tein
s G
6P
DH
n
. d.
n. d
. D
NA
D
NA
D
NA
+ p
rote
in/P
S-ra
tio
n
. d.
Bro
wn
an
d L
este
r (1
98
0)
Win
gen
der
et
al.
(20
01
)
Bu
ckm
ire
(19
84
) P
avo
ni e
t a
l. (1
97
2)
Liu
an
d F
ang
(20
02
) C
om
te e
t a
l. (2
00
6)
D’A
bza
c et
al.
(20
10
) K
enn
ed
y an
d S
uth
erla
nd
(1
98
7)
Son
icat
ion
P
ure
cu
ltu
re b
iofi
lm (
K.
aer
og
enes
) P
ure
cu
ltu
re b
iofi
lm (
Sph
ing
om
on
as
pa
uci
mo
bili
s)
Pu
re c
ult
ure
bio
film
(P
. flu
ore
scen
s)
Act
ivat
ed s
lud
ge
Pro
tein
D
NA
+ p
rote
ins
DN
A
ATP
D
NA
+ c
ell c
ou
nt
n. d
. n
. d.
n. d
. n
. d.
DN
A
Ru
dd
et
al.
(19
82
) B
row
n a
nd
Les
ter
(19
80
) A
zere
do
et
al.
(19
99
) A
zere
do
et
al.
(20
03
) Jo
ran
d e
t a
l. (1
99
5)
Qu
arm
by
and
Fo
rste
r (1
99
5)
Urb
ain
et
al.
(19
93
) K
ing
and
Fo
rste
r (1
99
0)
Dig
nac
et
al.
(19
98
) C
om
te e
t a
l. (2
00
6)
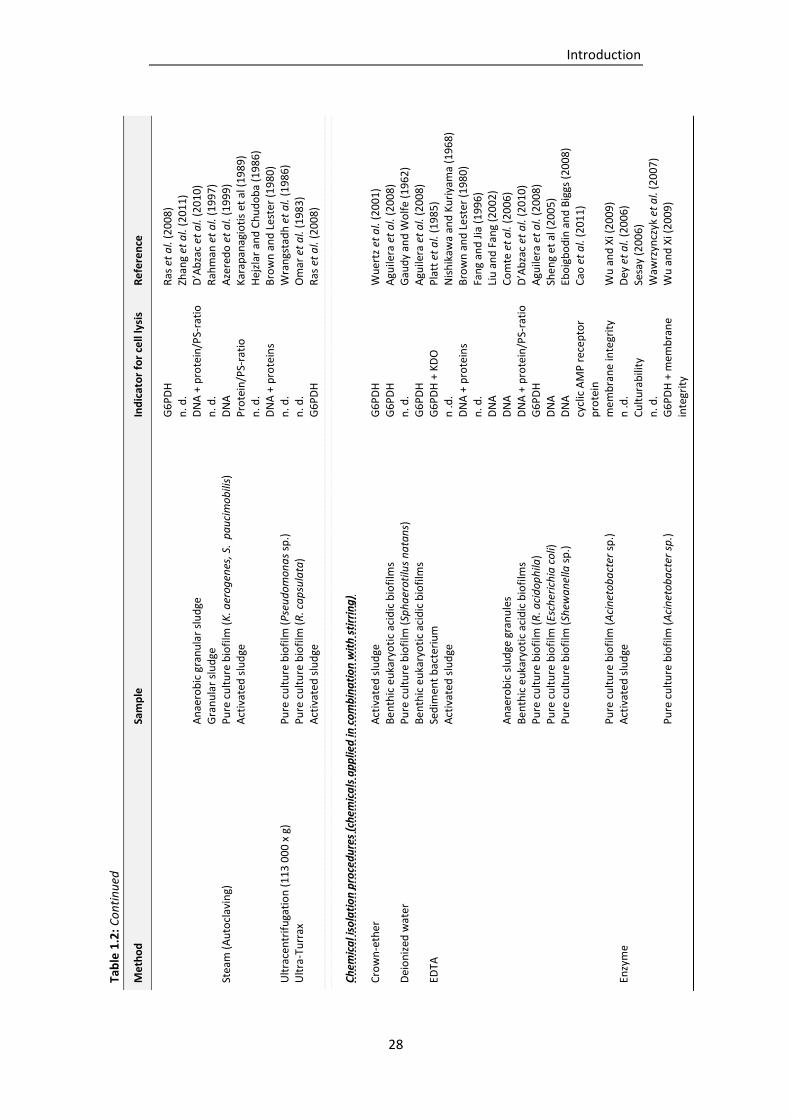
Introduction
28
Tab
le 1
.2:
Co
nti
nu
ed
Me
tho
d
Sam
ple
In
dic
ato
r fo
r ce
ll ly
sis
Re
fere
nce
A
nae
rob
ic g
ran
ula
r sl
ud
ge
Gra
nu
lar
slu
dge
G6
PD
H
n. d
. D
NA
+ p
rote
in/P
S-ra
tio
n
. d.
Ras
et
al.
(20
08
) Zh
ang
et a
l. (2
01
1)
D’A
bza
c et
al.
(20
10
) R
ahm
an e
t a
l. (1
99
7)
Stea
m (
Au
tocl
avin
g)
Pu
re c
ult
ure
bio
film
(K
. aer
og
enes
, S.
pa
uci
mo
bili
s)
Act
ivat
ed s
lud
ge
DN
A
Pro
tein
/PS-
rati
o
n. d
. D
NA
+ p
rote
ins
Aze
red
o e
t a
l. (1
99
9)
Kar
apan
agio
tis
et a
l (1
98
9)
Hej
zlar
an
d C
hu
do
ba
(19
86
) B
row
n a
nd
Les
ter
(19
80
) U
ltra
cen
trif
uga
tio
n (
11
3 0
00
x g
) P
ure
cu
ltu
re b
iofi
lm (
Pse
ud
om
on
as
sp.)
n
. d.
Wra
ngs
tad
h e
t a
l. (1
98
6)
Ult
ra-T
urr
ax
Pu
re c
ult
ure
bio
film
(R
. ca
psu
lata
) A
ctiv
ated
slu
dge
n
. d.
G6
PD
H
Om
ar e
t a
l. (1
98
3)
Ras
et
al.
(20
08
)
Ch
emic
al i
sola
tio
n p
roce
du
res
(ch
emic
als
ap
plie
d in
co
mb
ina
tio
n w
ith
sti
rrin
g)
Cro
wn
-eth
er
Act
ivat
ed s
lud
ge
Ben
thic
eu
kary
oti
c ac
idic
bio
film
s G
6P
DH
G
6P
DH
W
uer
tz e
t a
l. (2
00
1)
Agu
ilera
et
al.
(20
08
) D
eio
niz
ed w
ater
P
ure
cu
ltu
re b
iofi
lm (
Sph
aer
oti
lus
na
tan
s)
Ben
thic
eu
kary
oti
c ac
idic
bio
film
s n
. d.
G6
PD
H
Gau
dy
and
Wo
lfe
(19
62
) A
guile
ra e
t a
l. (2
00
8)
EDTA
Se
dim
ent
bac
teri
um
A
ctiv
ated
slu
dge
A
nae
rob
ic s
lud
ge g
ran
ule
s B
enth
ic e
uka
ryo
tic
acid
ic b
iofi
lms
Pu
re c
ult
ure
bio
film
(R
. aci
do
ph
ila)
Pu
re c
ult
ure
bio
film
(Es
cher
ich
ia c
oli)
P
ure
cu
ltu
re b
iofi
lm (
Shew
an
ella
sp
.)
Pu
re c
ult
ure
bio
film
(A
cin
eto
ba
cter
sp
.)
G6
PD
H +
KD
O
n .d
. D
NA
+ p
rote
ins
n. d
. D
NA
D
NA
D
NA
+ p
rote
in/P
S-ra
tio
G
6P
DH
D
NA
D
NA
cy
clic
AM
P r
ecep
tor
pro
tein
m
emb
ran
e in
tegr
ity
Pla
tt e
t a
l. (1
98
5)
Nis
hik
awa
and
Ku
riya
ma
(19
68
) B
row
n a
nd
Les
ter
(19
80
) Fa
ng
and
Jia
(1
99
6)
Liu
an
d F
ang
(20
02
) C
om
te e
t a
l. (2
00
6)
D’A
bza
c et
al.
(20
10
) A
guile
ra e
t a
l. (2
00
8)
She
ng
et a
l (2
00
5)
Ebo
igb
od
in a
nd
Big
gs (
20
08
) C
ao e
t a
l. (2
01
1)
Wu
an
d X
i (2
00
9)
Enzy
me
Act
ivat
ed s
lud
ge
Pu
re c
ult
ure
bio
film
(A
cin
eto
ba
cter
sp
.)
n .d
. C
ult
ura
bili
ty
n. d
. G
6P
DH
+ m
emb
ran
e in
tegr
ity
Dey
et
al.
(20
06
) Se
say
(20
06
) W
awrz
yncz
yk e
t a
l. (2
00
7)
Wu
an
d X
i (2
00
9)
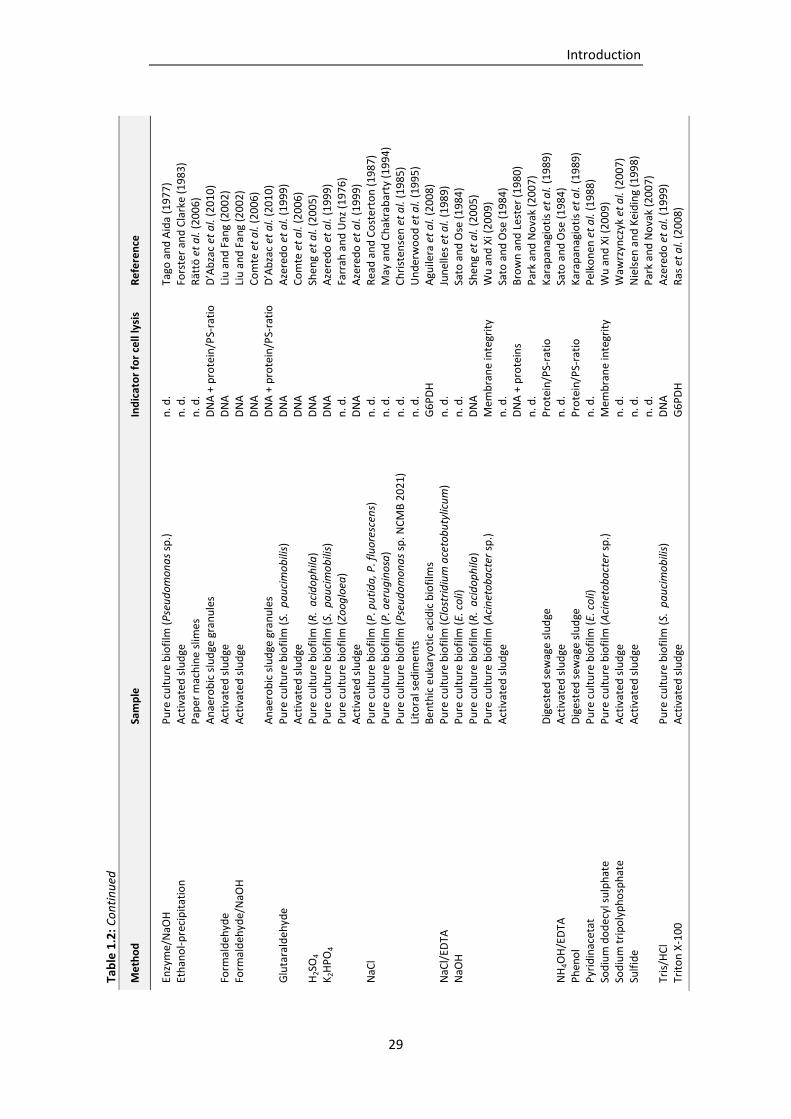
Introduction
29
Tab
le 1
.2:
Co
nti
nu
ed
Me
tho
d
Sam
ple
In
dic
ato
r fo
r ce
ll ly
sis
Re
fere
nce
Enzy
me/
NaO
H
Eth
ano
l-p
reci
pit
atio
n
Pu
re c
ult
ure
bio
film
(P
seu
do
mo
na
s sp
.)
Act
ivat
ed s
lud
ge
Pap
er m
ach
ine
slim
es
n. d
. n
. d.
n. d
.
Tago
an
d A
ida
(19
77
) Fo
rste
r an
d C
lark
e (1
98
3)
Rät
tö e
t a
l. (2
00
6)
Form
ald
ehyd
e
Form
ald
ehyd
e/N
aOH
G
luta
rald
ehyd
e
H2S
O4
An
aero
bic
slu
dge
gra
nu
les
Act
ivat
ed s
lud
ge
Act
ivat
ed s
lud
ge
An
aero
bic
slu
dge
gra
nu
les
Pu
re c
ult
ure
bio
film
(S.
pa
uci
mo
bili
s)
Act
ivat
ed s
lud
ge
Pu
re c
ult
ure
bio
film
(R
. a
cid
op
hila
)
DN
A +
pro
tein
/PS-
rati
o
DN
A
DN
A
DN
A
DN
A +
pro
tein
/PS-
rati
o
DN
A
DN
A
DN
A
D’A
bza
c et
al.
(20
10
) Li
u a
nd
Fan
g (2
00
2)
Liu
an
d F
ang
(20
02
) C
om
te e
t a
l. (2
00
6)
D’A
bza
c et
al.
(20
10
) A
zere
do
et
al.
(19
99
) C
om
te e
t a
l. (2
00
6)
She
ng
et a
l. (2
00
5)
K2H
PO
4 P
ure
cu
ltu
re b
iofi
lm (
S. p
au
cim
ob
ilis)
P
ure
cu
ltu
re b
iofi
lm (
Zoo
glo
ea)
Act
ivat
ed s
lud
ge
DN
A
n. d
. D
NA
Aze
red
o e
t a
l. (1
99
9)
Farr
ah a
nd
Un
z (1
97
6)
Aze
red
o e
t a
l. (1
99
9)
NaC
l P
ure
cu
ltu
re b
iofi
lm (
P. p
uti
da
, P. f
luo
resc
ens)
P
ure
cu
ltu
re b
iofi
lm (
P. a
eru
gin
osa
) P
ure
cu
ltu
re b
iofi
lm (
Pse
ud
om
on
as
sp. N
CM
B 2
02
1)
Lito
ral s
edim
en
ts
Ben
thic
eu
kary
oti
c ac
idic
bio
film
s
n. d
. n
. d.
n. d
. n
. d.
G6
PD
H
Rea
d a
nd
Co
ste
rto
n (
19
87
) M
ay a
nd
Ch
akra
bar
ty (
19
94
) C
hri
sten
sen
et
al.
(19
85
) U
nd
erw
oo
d e
t a
l. (1
99
5)
Agu
ilera
et
al.
(20
08
) N
aCl/
EDTA
P
ure
cu
ltu
re b
iofi
lm (
Clo
stri
diu
m a
ceto
bu
tylic
um
) n
. d.
Jun
elle
s et
al.
(19
89
) N
aOH
P
ure
cu
ltu
re b
iofi
lm (
E. c
oli)
P
ure
cu
ltu
re b
iofi
lm (
R.
aci
do
ph
ila)
Pu
re c
ult
ure
bio
film
(A
cin
eto
ba
cter
sp
.)
Act
ivat
ed s
lud
ge
Dig
este
d s
ewag
e sl
ud
ge
n. d
. D
NA
M
emb
ran
e in
tegr
ity
n. d
. D
NA
+ p
rote
ins
n. d
. P
rote
in/P
S-ra
tio
Sato
an
d O
se (
19
84
) Sh
en
g et
al.
(20
05
) W
u a
nd
Xi (
20
09
) Sa
to a
nd
Ose
(1
98
4)
Bro
wn
an
d L
este
r (1
98
0)
Par
k an
d N
ova
k (2
00
7)
Kar
apan
agio
tis
et a
l. (1
98
9)
NH
4OH
/ED
TA
Act
ivat
ed s
lud
ge
n. d
. Sa
to a
nd
Ose
(1
98
4)
Ph
eno
l D
iges
ted
sew
age
slu
dge
P
rote
in/P
S-ra
tio
K
arap
anag
ioti
s et
al.
(19
89
) P
yrid
inac
etat
So
diu
m d
od
ecyl
su
lph
ate
So
diu
m t
rip
oly
ph
osp
hat
e
Sulf
ide
Pu
re c
ult
ure
bio
film
(E.
co
li)
Pu
re c
ult
ure
bio
film
(A
cin
eto
ba
cter
sp
.)
Act
ivat
ed s
lud
ge
Act
ivat
ed s
lud
ge
n. d
. M
emb
ran
e in
tegr
ity
n. d
. n
. d.
n. d
.
Pel
kon
en e
t a
l. (1
98
8)
Wu
an
d X
i (2
00
9)
Waw
rzyn
czyk
et
al.
(20
07
) N
iels
en a
nd
Kei
din
g (1
99
8)
Par
k an
d N
ova
k (2
00
7)
Tris
/HC
l Tr
ito
n X
-10
0
Pu
re c
ult
ure
bio
film
(S.
pa
uci
mo
bili
s)
Act
ivat
ed s
lud
ge
DN
A
G6
PD
H
Aze
red
o e
t a
l. (1
99
9)
Ras
et
al.
(20
08
)
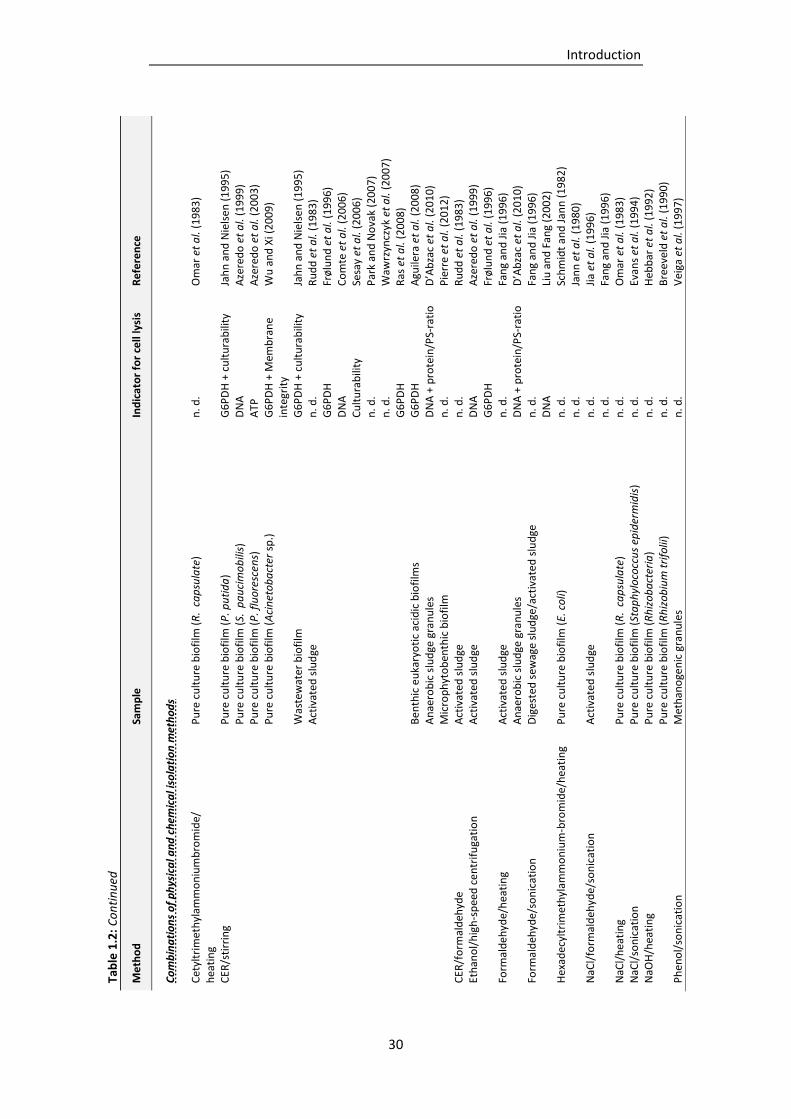
Introduction
30
Tab
le 1
.2:
Co
nti
nu
ed
Me
tho
d
Sam
ple
In
dic
ato
r fo
r ce
ll ly
sis
Re
fere
nce
Co
mb
ina
tio
ns
of
ph
ysic
al a
nd
ch
emic
al i
sola
tio
n m
eth
od
s
Cet
yltr
imet
hyl
amm
on
ium
bro
mid
e/
hea
tin
g P
ure
cu
ltu
re b
iofi
lm (
R.
cap
sula
te)
n. d
. O
mar
et
al.
(19
83
)
CER
/sti
rrin
g P
ure
cu
ltu
re b
iofi
lm (
P. p
uti
da
) P
ure
cu
ltu
re b
iofi
lm (
S. p
au
cim
ob
ilis)
P
ure
cu
ltu
re b
iofi
lm (
P. f
luo
resc
ens)
P
ure
cu
ltu
re b
iofi
lm (
Aci
net
ob
act
er s
p.)
G6
PD
H +
cu
ltu
rab
ility
D
NA
A
TP
G6
PD
H +
Mem
bra
ne
inte
grit
y
Jah
n a
nd
Nie
lse
n (
19
95
) A
zere
do
et
al.
(19
99
) A
zere
do
et
al.
(20
03
) W
u a
nd
Xi (
20
09
)
W
aste
wat
er b
iofi
lm
Act
ivat
ed s
lud
ge
Ben
thic
eu
kary
oti
c ac
idic
bio
film
s A
nae
rob
ic s
lud
ge g
ran
ule
s M
icro
ph
yto
ben
thic
bio
film
G6
PD
H +
cu
ltu
rab
ility
n
. d.
G6
PD
H
DN
A
Cu
ltu
rab
ility
n
. d.
n. d
. G
6P
DH
G
6P
DH
D
NA
+ p
rote
in/P
S-ra
tio
n
. d.
Jah
n a
nd
Nie
lse
n (
19
95
) R
ud
d e
t a
l. (1
98
3)
Frø
lun
d e
t a
l. (1
99
6)
Co
mte
et
al.
(20
06
) Se
say
et a
l. (2
00
6)
Par
k an
d N
ova
k (2
00
7)
Waw
rzyn
czyk
et
al.
(20
07
) R
as e
t a
l. (2
00
8)
Agu
ilera
et
al.
(20
08
) D
’Ab
zac
et a
l. (2
01
0)
Pie
rre
et a
l. (2
01
2)
CER
/fo
rmal
deh
yde
A
ctiv
ated
slu
dge
n
. d.
Ru
dd
et
al.
(19
83
) Et
han
ol/
hig
h-s
pee
d c
en
trif
uga
tio
n
Act
ivat
ed s
lud
ge
DN
A
G6
PD
H
Aze
red
o e
t a
l. (1
99
9)
Frø
lun
d e
t a
l. (1
99
6)
Form
ald
ehyd
e/h
eati
ng
Form
ald
ehyd
e/so
nic
atio
n
Act
ivat
ed s
lud
ge
An
aero
bic
slu
dge
gra
nu
les
Dig
este
d s
ewag
e sl
ud
ge/a
ctiv
ate
d s
lud
ge
n. d
. D
NA
+ p
rote
in/P
S-ra
tio
n
. d.
DN
A
Fan
g an
d J
ia (
19
96
) D
’Ab
zac
et a
l. (2
01
0)
Fan
g an
d J
ia (
19
96
) Li
u a
nd
Fan
g (2
00
2)
Hex
adec
yltr
imet
hyl
amm
on
ium
-bro
mid
e/h
eati
ng
Pu
re c
ult
ure
bio
film
(E.
co
li)
n. d
. n
. d.
Sch
mid
t an
d J
ann
(1
98
2)
Jan
n e
t a
l. (1
98
0)
NaC
l/fo
rmal
deh
yde/
son
icat
ion
A
ctiv
ated
slu
dge
n. d
. n
. d.
Jia
et a
l. (1
99
6)
Fan
g an
d J
ia (
19
96
) N
aCl/
hea
tin
g P
ure
cu
ltu
re b
iofi
lm (
R.
cap
sula
te)
n. d
. O
mar
et
al.
(19
83
) N
aCl/
son
icat
ion
P
ure
cu
ltu
re b
iofi
lm (
Sta
ph
ylo
cocc
us
epid
erm
idis
) n
. d.
Evan
s et
al.
(19
94
) N
aOH
/hea
tin
g P
ure
cu
ltu
re b
iofi
lm (
Rh
izo
ba
cter
ia)
Pu
re c
ult
ure
bio
film
(R
hiz
ob
ium
tri
folii
) n
. d.
n. d
. H
ebb
ar e
t a
l. (1
99
2)
Bre
evel
d e
t a
l. (1
99
0)
Ph
eno
l/so
nic
atio
n
Met
han
oge
nic
gra
nu
les
n. d
. V
eiga
et
al.
(19
97
)
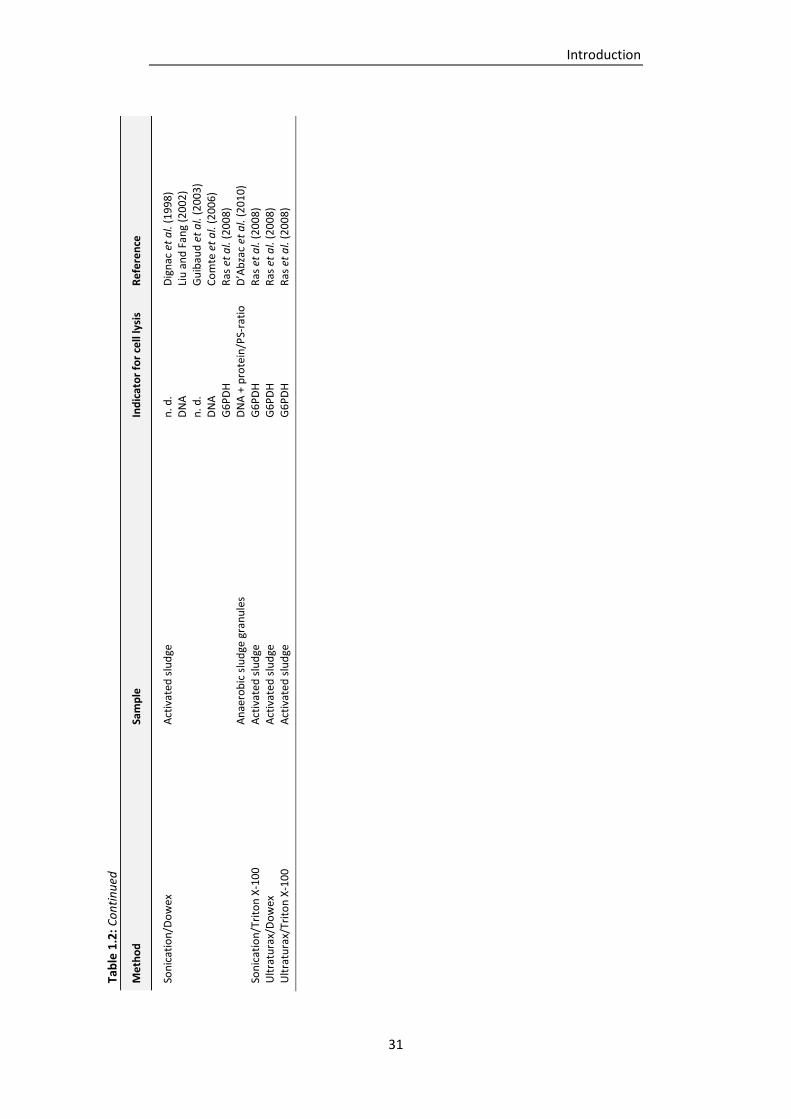
Introduction
31
Tab
le 1
.2:
Co
nti
nu
ed
Me
tho
d
Sam
ple
In
dic
ato
r fo
r ce
ll ly
sis
Re
fere
nce
Son
icat
ion
/Do
wex
So
nic
atio
n/T
rito
n X
-10
0
Ult
ratu
rax/
Do
wex
U
ltra
tura
x/Tr
ito
n X
-10
0
Act
ivat
ed s
lud
ge
An
aero
bic
slu
dge
gra
nu
les
Act
ivat
ed s
lud
ge
Act
ivat
ed s
lud
ge
Act
ivat
ed s
lud
ge
n. d
. D
NA
n
. d.
DN
A
G6
PD
H
DN
A +
pro
tein
/PS-
rati
o
G6
PD
H
G6
PD
H
G6
PD
H
Dig
nac
et
al.
(19
98
) Li
u a
nd
Fan
g (2
00
2)
Gu
ibau
d e
t a
l. (2
00
3)
Co
mte
et
al.
(20
06
) R
as e
t a
l. (2
00
8)
D’A
bza
c et
al.
(20
10
) R
as e
t a
l. (2
00
8)
Ras
et
al.
(20
08
) R
as e
t a
l. (2
00
8)
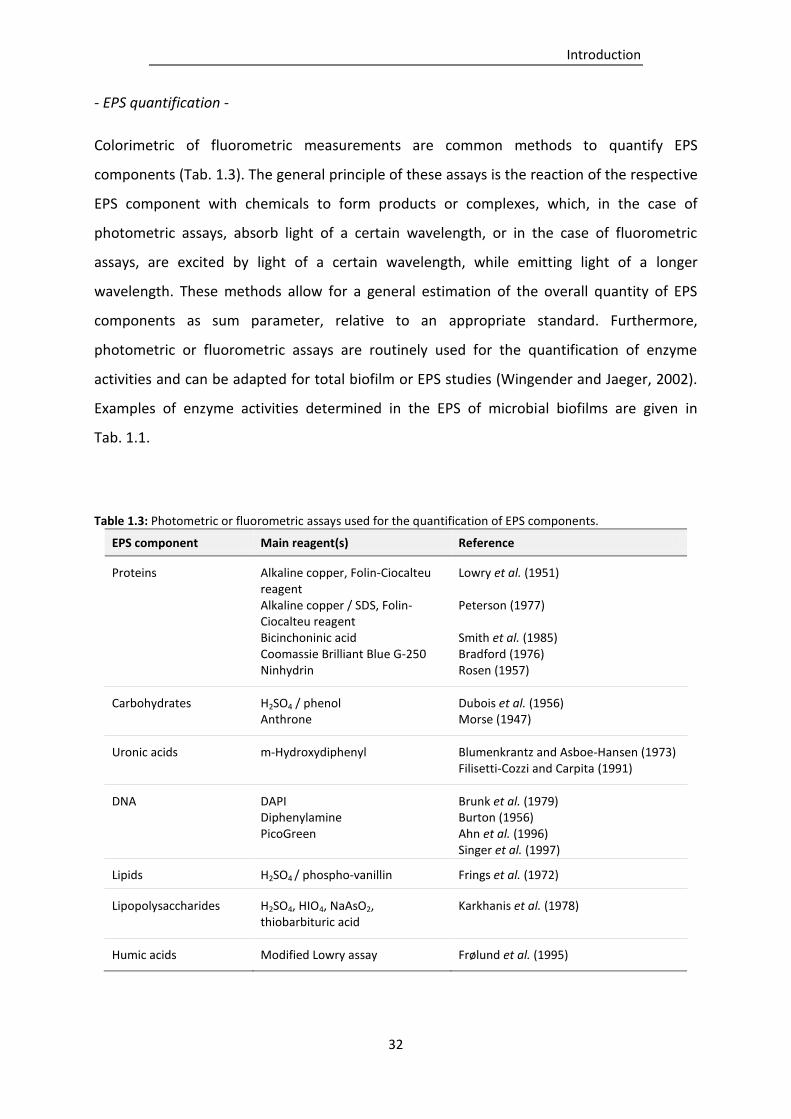
Introduction
32
- EPS quantification -
Colorimetric of fluorometric measurements are common methods to quantify EPS
components (Tab. 1.3). The general principle of these assays is the reaction of the respective
EPS component with chemicals to form products or complexes, which, in the case of
photometric assays, absorb light of a certain wavelength, or in the case of fluorometric
assays, are excited by light of a certain wavelength, while emitting light of a longer
wavelength. These methods allow for a general estimation of the overall quantity of EPS
components as sum parameter, relative to an appropriate standard. Furthermore,
photometric or fluorometric assays are routinely used for the quantification of enzyme
activities and can be adapted for total biofilm or EPS studies (Wingender and Jaeger, 2002).
Examples of enzyme activities determined in the EPS of microbial biofilms are given in
Tab. 1.1.
Table 1.3: Photometric or fluorometric assays used for the quantification of EPS components.
EPS component Main reagent(s) Reference
Proteins Alkaline copper, Folin-Ciocalteu reagent Alkaline copper / SDS, Folin-Ciocalteu reagent Bicinchoninic acid Coomassie Brilliant Blue G-250 Ninhydrin
Lowry et al. (1951) Peterson (1977) Smith et al. (1985) Bradford (1976) Rosen (1957)
Carbohydrates H2SO4 / phenol Anthrone
Dubois et al. (1956) Morse (1947)
Uronic acids m-Hydroxydiphenyl Blumenkrantz and Asboe-Hansen (1973) Filisetti-Cozzi and Carpita (1991)
DNA DAPI Diphenylamine PicoGreen
Brunk et al. (1979) Burton (1956) Ahn et al. (1996) Singer et al. (1997)
Lipids H2SO4 / phospho-vanillin Frings et al. (1972)
Lipopolysaccharides H2SO4, HIO4, NaAsO2, thiobarbituric acid
Karkhanis et al. (1978)
Humic acids Modified Lowry assay Frølund et al. (1995)
Introduction
33
- Electrophoretic and chromatographic EPS analysis -
Qualitative analysis of EPS components requires additional clean-up and separation steps of
the respective group of polymers to allow for their characterization. Electrophoretic or
chromatographic approaches, such as one- or two-dimensional gel electrophoresis,
denaturing gradient gel electrophoresis, thin-layer chromatography (TLC), gas
chromatography (GC) or high performance liquid chromatography (HPLC), have been
developed or adapted in order to analyse the biofilm matrix.
Qualitative analysis of proteins is usually performed by one-dimensional or two-dimensional
gel electrophoresis (1DE and 2DE, respectively). 1DE is a rapid method to separate proteins
by size on a polyacrylamide gel and is adequate to obtain band-patterns for protein samples.
This method, however, is limited to samples with a low diversity of proteins. Complex
samples require more sophisticated methods to achieve a thorough separation of the entire
proteome. The development of 2DE, as it is applied nowadays, provides a by far more
sensitive technique to study protein samples. 2DE separates proteins in the first dimension
according to their charge by isoelectric focusing (IEF), before they are further separated by
molecular weight using sodium dodecyl sulphate polyacrylamide gel electrophoresis (SDS-
PAGE) in the second dimension. This allows for separation of over 5000 proteins on a single
gel and provides a detailed fingerprint of the sample’s proteome (O’Ferrell, 1975; Görg et al.,
2004). Subsequent spot analysis for example by matrix-assisted laser desorption ionisation
mass spectrometry (MALDI-MS) or electrospray ionisation mass spectrometry (ESI-MS)
allows identification of the proteins (Denkhaus et al., 2007). A weakness of this method,
however, is the low throughput of samples, the reproducibility due to gel-to-gel variations,
the limited amount of mass spectra in databases and potential interferences of non-
proteinaceous compounds with the IEF step. This is especially of significance for the analysis
of extracellular proteins. Studies identifying EPS proteins are very scarcely represented in
literature and up to date EPS proteins from drinking-water biofilms have not been described
qualitatively. Furthermore, the EPS matrix can contains substances, which interfere with IEF
(Rémy et al., 2000; Görg et al., 2004). IEF is the most delicate step during 2DE, being very
sensitive to impurities within the protein sample. Broekman (2009) described the immensely
detrimental effect of alginate from P. aeruginosa on IEF as well as on conventionally applied
methods for protein purification for IEF, and eliminated alginate by ultrafiltration. Also
Introduction
34
nucleic acids or high salt contents are known to interfere with the IEF by clogging pores of
the gel or providing a high current during IEF, respectively (Rémy et al., 2000; Görg et al.,
2004). DNase treatment to digest interfering DNA and subsequent dialysis to reduce salt
content and to remove low molecular weight organic substances are means for protein
clean-up for IEF. 2DE is not only applied to identify the proteome of a culture, it is in
particular applied to compare protein expression under different cultivation conditions or
environmental stress. In this case, however, a large number of technical and biological
replicates needs to be performed to be able to exclude gel-to-gel variations or variations
within the same samples. In the attempt to overcome this problem, advancements resulted
in the recent development of the 2D difference gel electrophoresis (2D-DIGE) (Ünlü et al.,
1997; Tonge et al., 2001). This method allows for comparison of a set of proteomes, by
separation of proteins from two different samples on a single gel, eliminating the need of
technical replicates. 2D-DIGE software not only detects the presence or absence of proteins,
it is also capable of quantifying up or down regulation of protein expression in the respective
set of samples.
Chromatographic approaches, such as ion exchange or size exclusion chromatography, are
commonly applied for the separation and purification of proteins from undesired
contaminants, for instance polysaccharides or nucleic acids, but also for concentration of the
protein of choice. Chromatography has, furthermore, been described as potent tool for the
identification of proteins from microbial biofilms. Ram et al. (2005) used an HPLC approach
in the form of 2D nano-liquid chromatography tandem mass spectrometry to identify
proteins in a biofilm community from natural acid mine drainage. Recent developments of
labelling techniques, such as Isotope Coded Affinity Tags (ICAT) (Gygi et al., 1999; Han et al.,
2001), iTRAQ (Ross et al., 2004; Zieske, 2006), or aniline benzoic acid labelling (ANIBAL)
(Panchaud et al., 2008) in combination with HPLC and mass spectrometry, allow for
simultaneous qualitative analysis as well as assessment of the relative quantities of proteins
within multiplexed samples. Application of these techniques for complex environmental
samples, however, has not yet been reported, but should be considered as promising
alternatives for the analysis of biofilm proteomes (Schneider and Riedel, 2010).
Polysaccharide analysis usually involves chromatographic methods to characterize
polysaccharides by their molecular weight or in terms of their monosaccharide composition.
Introduction
35
Size exclusion chromatography is widely applied to separate polysaccharides according to
their molecular weight (Gaborieau and Castignolles, 2011). Modifications of this type of
chromatography, i.e. size-exclusion capillary electrochromatographic separation, allows for
separation of polysaccharides as large as 112,000 g mol-1 (Mistry et al., 2003). Identification
of the qualitative monosaccharide composition of polysaccharides requires hydrolysis of the
polymer into its monomers. The most common hydrolytic agents applied are acids, such as
hydrochloric acid, sulphuric acid or trifluoroacetic acid, which degrade polysaccharides at
high temperatures into its components (Denkhaus et al., 2007). Obtained mono- or
oligosaccharides can then be separated by chromatography. Identification of the
exopolysaccharide composition has for example been performed by use of TLC of
exopolysaccharides from Bacillus thermoantarcticus biofilms (Manca et al., 1996) or
P. aeruginosa biofilms (Rode, 2004). Dignac et al. (1998) described the sugar composition of
activated sludge floc polysaccharides applying GC (Dignac et al., 1998). Meisen et al. (2008)
presented an HPLC in combination with refractive index/UV detection technique for the
analysis of alginate purified from a P. aeruginosa biofilm.
- Spectroscopic methods -
A number of spectroscopic methods have been adapted for use in biofilm research. These
include Fourier-transformed infrared (FT-IR) or Raman spectroscopy, which give information
on fuctional groups, structural features, conformational changes or adsorption reactions
within the biofilm matrix with spatial resolution in the micrometer range (Suci et al., 2001;
Ivleva et al., 2010; Sheng et al., 2010). These spectroscopic methods allow for investigations
of fully hydrated samples with minimal sample preparation, thus minimizing artifacts caused
by sample manipulation (Denkhaus et al., 2007). FT-IR in the form of attenuated total
reflection (ATR/FT-IR) has been applied in a number of biofilm studies, for example to
analyse adhesion and growth of biofilms under varying conditions (Nivens et al., 1993;
Schmitt et al., 1995), to investigate the penetration of the antibiotic ciprofloxacin and its
interaction with EPS components (Suci et al., 1994) or to assess conformational changes of
EPS proteins in response to variations in solution chemistry (Omoike and Chorover, 2004).
Raman spectroscopy has been applied for example for comparative studies of S. epidermidis
Introduction
36
wild-type and mutant biofilms (Samek et al., 2010), as well as P. fluorescens biofilm cells and
planktonic cells (Huang et al., 2007). A few studies applied combinations of both methods
for an in-depth analysis of biofilms. Choo-Smith et al. (2001) used ATR/FT-IR as well as
Raman spectroscopy to investigate microbial colony heterogeneity of different bacterial
strains, while Suci et al. (2001) analyzed chlorhexidine spatial and temporal distribution in
Candida albicans biofilms. Recently the Raman spectrometry-based method surface-
enhanced Raman scattering (SERS) has been developed and applied for the analysis of
biofilms. Ivleva et al. (2010) demonstrated SERS’ applicability for in situ analysis of multi-
species biofilms, biofilm constituents and their spatial distribution.
Nuclear magnetic resonance (NMR) spectroscopy represents a technique capable of
providing monomeric (Mayer et al., 2001; Schürks et al., 2002), or structural information of
isolated polysaccharides (Gruter et al., 1993; Jann et al., 1994) or proteins (Wüthrich, 2001),
interactions of EPS components with metals (Lattner et al., 2003) or monitoring metabolic
turnover in cell suspensions (Brecker and Ribbons, 2000). The application of NMR for in situ
biofilm research, however, has been limited to investigations of water properties (Majors et
al., 2005; Denkhaus et al., 2007). These studies included determinations of the
hydrodynamic properties of water at biofilm surfaces (Lewandowski et al., 1992, 1995; Manz
et al., 2003; Seymour et al., 2004), as well as water diffusion in the EPS matrix (Vogt et al.,
2000).
- Mineral composition -
Multivalent cations like Ca2+ or Mg2+ are known to play a major role for the mechanical
stability of biofilms (Körstgens et al., 2001; Wloka et al., 2004). Furthermore, mechanisms
such as biosorption, precipitation as sulfides or phosphates and microbial reductive
precipitation are involved in the immobilisation and accumulation of heavy metals within
biofilms (van Hullebusch et al., 2003). Despite their profound influence on biofilm integrity
and composition, inorganic substances are often disregarded in biofilm and EPS
investigations (D’Abzac et al., 2010). Atomic spectrometry, such as atomic absorption
spectrometry (AAS), or inductively coupled plasma coupled with optical emission
spectrometry (ICP-OES) or mass spectrometry (ICP-MS) are routine methods used for the
Introduction
37
quantification of metals in liquid samples. A few studies have adapted these methods to
investigate metal sorption properties of biofilms. Pretreatment of the biomass by acid
digestion at high temperatures (White and Gadd, 1996, 1998, 2000), or in combination with
microwave treatment (Farag et al., 2007; D’Abzac et al., 2010) has been implemented and
allows for application of the samples for AAS or ICP analyses. Toxic metals like copper, zinc,
cadmium or lead were common metals of interest in studies of sulphate-reducing mixed
biofilms, wastewater or activated sludge biofilms (Späth et al., 1998; White and Gadd, 1998,
2000; Comte et al., 2008; Guibaud et al., 2009). Park and Novak (2007) determined the
concentrations of Ca, Mg, Fe and Al in activated sludge and evaluated the efficiency of the
CER Dowex as well as its selectivity towards certain cations, based on the removal of these
metals during EPS isolation. D’Abzac et al. (2010) applied ICP-OES and ICP-MS for a multi-
element analysis of anaerobic granular sludges. Their study provides a broad-range
quantification of the mineral fraction of the EPS, including Ca, K, Mg, Na, P, S, Si, Al, Fe, Mn,
Ni, Cu, As, Ag, Cd and Pb by ICP techniques (D’Abzac et al., 2010).
1.4.2 Tools to study biofilm architecture
Diverse microscopic methods have been designed to give an insight into the architecture of
biofilms. Light or epifluorescence microscopy can give a first indication of the structure of
microbial slime, however, more sophisticated methods, such as those described below, as
well as combinations of different microscopic methods are required to elucidate the
complex heterogeneity and spatial distribution of cells, polymers or minerals in fully
hydrated biofilm samples.
- Electron microscopy -
Electron microscopy has been developed in the 1930s and provides powerful techniques
achieving a resolution higher than 50 pm (Erni et al., 2009). These techniques apply an
electron beam, which interacts with the sample to produce an image. The most widely
applied methods in biofilm research include scanning electron microscopy (SEM) or
transmission electron microscopy (TEM). Their applicability for biofilm research has been
Introduction
38
shown in different studies, for example investigating anaerobic fixed film fermenter biofilms
(Richards and Turner, 1984), natural aquatic biofilms (Surman et al., 1996), microbially
influenced corrosion (Steele et al., 1994; Chen et al., 1997) or P. aeruginosa biofilms
(Priester et al., 2007). The high resolution power of these methods allows not only for
visualization of microbial cells, also cell organelles, EPS components and minerals can be
visualized. Coupling of SEM with an energy dispersive x-ray analysis (EDX) generates images
and quantifies relative concentrations of minerals within the observed sample region (Chen
et al., 1997; D’Abzac et al., 2010). Despite the high resolution power these techniques have a
flaw. Sample preparation includes chemical fixation and/or drying, which causes a
breakdown of the original biofilm structure and produces artifacts (Richards and Turner,
1984). Advancements of these microscopic methods, such as the development of a gaseous
secondary electron detector device for environmental SEM (ESEM), allow microscopic
analysis of fully hydrated samples (Danilatos, 1981, 1983). Theoretically, samples no longer
have to be fixed or dried for ESEM, however, resolution is lower compared to SEM and by
the time samples are loaded and observed, drying occurs and alters biofilm structure.
- Confocal laser scanning microscopy -
Confocal laser scanning microscopy (CLSM) is the by far most applied tool to study the three-
dimensional structure of biofilms and its components. This method allows for investigations
of a multitude of features in a fully hydrated, multi-layered biofilm sample (Lawrence and
Neu, 2003). CLSM can be performed in two modes, the rarely applied reflection mode, which
can give information about minerals, colloids, cell surfaces or cell inclusions (Lawrence and
Neu, 2003), or the fluorescence mode, which relies on autofluorescence of the sample or
fluorescent labelling of the sample component of interest. In the latter case, the fluorophore
is excited by a laser of a specific wavelength, while emitted light of the corresponding
wavelength is detected, generating an image. The application range covers investigations of
the autofluorescence of phototrophic algae or cyanobacteria, visualization of the spatial
distribution of cells or EPS components, identification of microorganisms of interest, viability
and cell activity, localization of enzyme activity, as well as diffusion, permeability, pH, ions or
metal studies (Lawrence and Neu, 2003). Multi-channel CLSM analysis allows for
Introduction
39
simultaneous investigation of several of these parameters. To be able to investigate these
different aspects of biofilms, a large number of stains have been developed, aiming at
selective binding to nucleic acids, polysaccharides or proteins, gene-markers, for selective
visualization of microorganisms of interest, or fluorescent substrates specific for different
classes of enzymes (Tab. 1.4). Due to their high specificity towards certain carbohydrate
binding sites (Kennedy, 1995), fluor-conjugated lectins have been of particular use for in situ
determination of the spatial distribution of polysaccharides in biofilms by CLSM (Neu et al.,
2001, 2005; Strathmann et al., 2002). The specificity of each stain needs to be considered, as
studies have shown, that the biofilm matrix can inhibit or enhance binding of the
fluorophores, in particular lectins, to the respective target (Neu et al., 2001).
Table 1.4: Fluorescent stains or markers applied for microscopical analysis of biofilms (adapted and supplemented from Strathmann, 2002).
Target Stain or marker Reference
Polysaccharides, Glycoconjugates
Alcian blue Wetzel et al., 1997; Karlyshev and Wren, 2001
Calcofluor white Wood, 1980; von Sengbusch et al., 1982; Marshall, 1992; Ramaswamy et al., 1997; Chandra et al., 2001; Kuhn et al., 2002
Congo red Wood, 1980; Allison und Sutherland, 1984; Marshall, 1992; Lawrence et al., 1998a
Ruthenium red Gutierrez-Gonzalvez et al., 1987
Fluorescently-labelled lectins
Sizemore et al., 1990; Caldwell et al., 1992; Quintero and Weiner, 1995, Hood and Schmidt, 1996; Holloway and Cowen, 1997; Neu and Lawrence, 1997, 1999; Langille and Weiner, 1998; Lawrence et al., 1998a; Johnsen et al., 2000; Neu et al., 2001; Wingender et al., 2001; Strathmann et al., 2002
Peroxidase-marked lectins
Leriche et al., 2000; Strathmann et al., 2002
Biotinylised lectins Sanford et al., 1995; Kawaguchi and Decho, 2000
Antibodies Costerton et al., 1981; Weiner et al., 1995
Proteins Hoechst 2495 Paul and Jeffrey, 1985; Neu and Marshall, 1991
Nano orange Grossart et al., 2000
Sypro Red Strathmann, 2002
Sypro Ruby Strathmann, 2002; Di Poto et al., 2009
Antibodies Dazzo and Wright, 1996
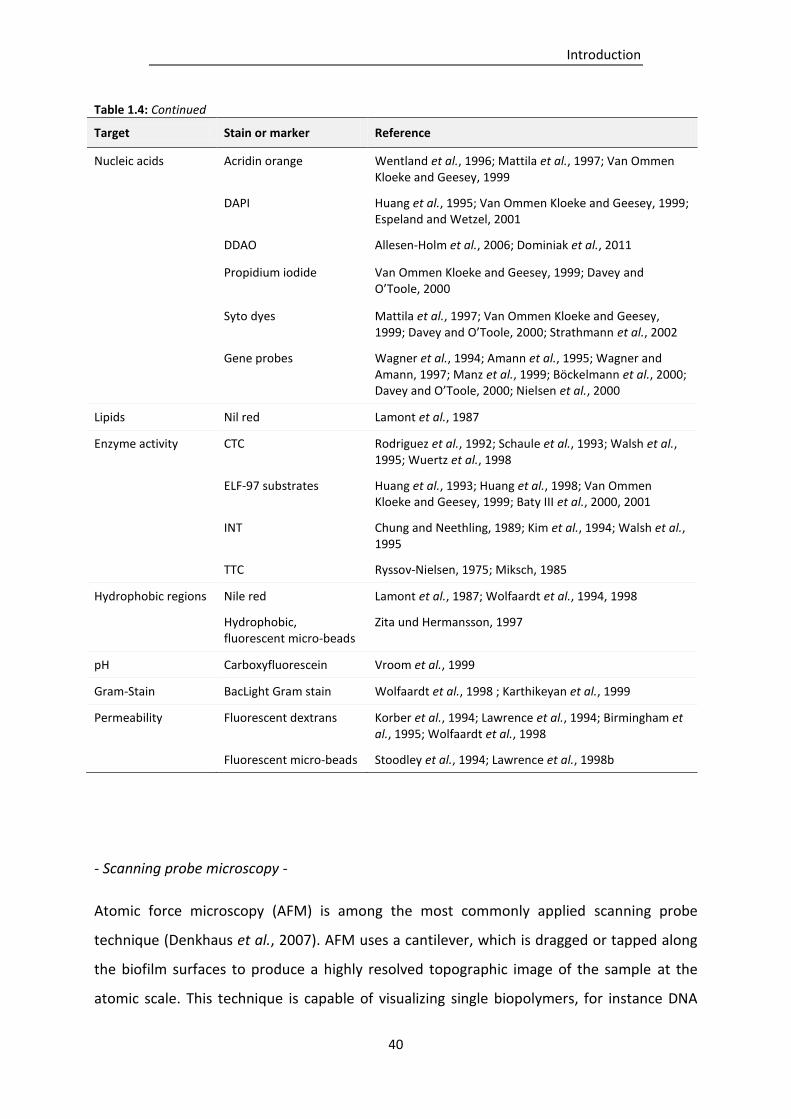
Introduction
40
Table 1.4: Continued
Target Stain or marker Reference
Nucleic acids Acridin orange Wentland et al., 1996; Mattila et al., 1997; Van Ommen Kloeke and Geesey, 1999
DAPI Huang et al., 1995; Van Ommen Kloeke and Geesey, 1999; Espeland and Wetzel, 2001
DDAO Allesen-Holm et al., 2006; Dominiak et al., 2011
Propidium iodide Van Ommen Kloeke and Geesey, 1999; Davey and O’Toole, 2000
Syto dyes Mattila et al., 1997; Van Ommen Kloeke and Geesey, 1999; Davey and O’Toole, 2000; Strathmann et al., 2002
Gene probes Wagner et al., 1994; Amann et al., 1995; Wagner and Amann, 1997; Manz et al., 1999; Böckelmann et al., 2000; Davey and O’Toole, 2000; Nielsen et al., 2000
Lipids Nil red Lamont et al., 1987
Enzyme activity CTC Rodriguez et al., 1992; Schaule et al., 1993; Walsh et al., 1995; Wuertz et al., 1998
ELF-97 substrates Huang et al., 1993; Huang et al., 1998; Van Ommen Kloeke and Geesey, 1999; Baty III et al., 2000, 2001
INT Chung and Neethling, 1989; Kim et al., 1994; Walsh et al., 1995
TTC Ryssov-Nielsen, 1975; Miksch, 1985
Hydrophobic regions Nile red Lamont et al., 1987; Wolfaardt et al., 1994, 1998
Hydrophobic, fluorescent micro-beads
Zita und Hermansson, 1997
pH Carboxyfluorescein Vroom et al., 1999
Gram-Stain BacLight Gram stain Wolfaardt et al., 1998 ; Karthikeyan et al., 1999
Permeability Fluorescent dextrans Korber et al., 1994; Lawrence et al., 1994; Birmingham et al., 1995; Wolfaardt et al., 1998
Fluorescent micro-beads Stoodley et al., 1994; Lawrence et al., 1998b
- Scanning probe microscopy -
Atomic force microscopy (AFM) is among the most commonly applied scanning probe
technique (Denkhaus et al., 2007). AFM uses a cantilever, which is dragged or tapped along
the biofilm surfaces to produce a highly resolved topographic image of the sample at the
atomic scale. This technique is capable of visualizing single biopolymers, for instance DNA
Introduction
41
(Allison et al., 1997), proteins (Chen et al., 1998) or DNA-protein interactions (Rippe et al.,
1997). This type of microscopy has also been applied for visualization of microbial EPS.
Steele et al. (1994) investigated microbially influenced corrosion of stainless steel by biofilm
organisms by AFM. Beech (1996) and Beech et al. (2002) used AFM for investigations of
microbial biofilms formed by sulfate-reducing bacterial biofilms on steel surfaces and their
interactions with the substratum. Van der Aa and Dufrêne (2002) performed an in situ
characterization of the organization of EPS produced by Azospirillum brasilense attached to
polystyrene substrata by application of AFM. Li and Logan (2004) used an AFM approach to
determine the adhesion of different E. coli strains to be able to predict microbial adhesion.
However, the AFM method is mainly suitable for investigations of bacterial monolayers.
Scanning probe microscopy furthermore includes techniques like scanning tunneling
electron microscopy and scanning ion-conductance microscopy (Hansma and Pietrasanta,
1998).
1.5 Aims of the study
Drinking water distribution systems as well as domestic plumbing systems are colonized by
microbial biofilms, which under unfavourable conditions can act as reservoirs for pathogenic
microorganisms, posing a potential threat to human health (Bressler et al., 2009; Moritz et
al., 2010; Wingender, 2011). Despite numerous studies investigating biofilm formation in
these systems, none has addressed the EPS composition of drinking-water biofilms. To be
able to understand, control and avoid biofilm formation, it is essential to gain an
understanding of the involved microorganisms as well as the quantity and composition of
EPS, both of which are targets for measures aimed at the inactivation and removal of biofilm
organisms from these systems.
This study was carried out to characterize drinking-water biofilms and their EPS grown in
drinking water distribution systems as well as public plumbing systems by microbiological,
molecular biological and biochemical means. The aims of this study included:
Introduction
42
Adaptation and optimization of analytical methods for the analysis of the typically low
amounts of drinking-water biofilms found in drinking water systems, as well as their EPS,
which have not been analyzed in drinking-water biofilms in detail before,
Evaluation of EPS isolation methods based on their EPS yield, detrimental impact on
biofilm cells, as well as compatibility with subsequent analytical methods, with main focus
on CER isolation,
Application of the established methods for the cultivation and characterization of
drinking-water biofilms cultivated in reactors connected to plumbing systems of public
buildings or to drinking water distribution systems,
Qualitative EPS analysis of drinking-water biofilms, with focus on the identification of
extracellular proteins, which unlike exopolysaccharides have been rarely investigated in
literature, applying two-dimensional gel electrophoresis, as well as enzyme activity
measurements, and
Investigation of the incorporation of the hygienically relevant P. aeruginosa in drinking-
water biofilms and its influence on biofilm community and EPS composition.
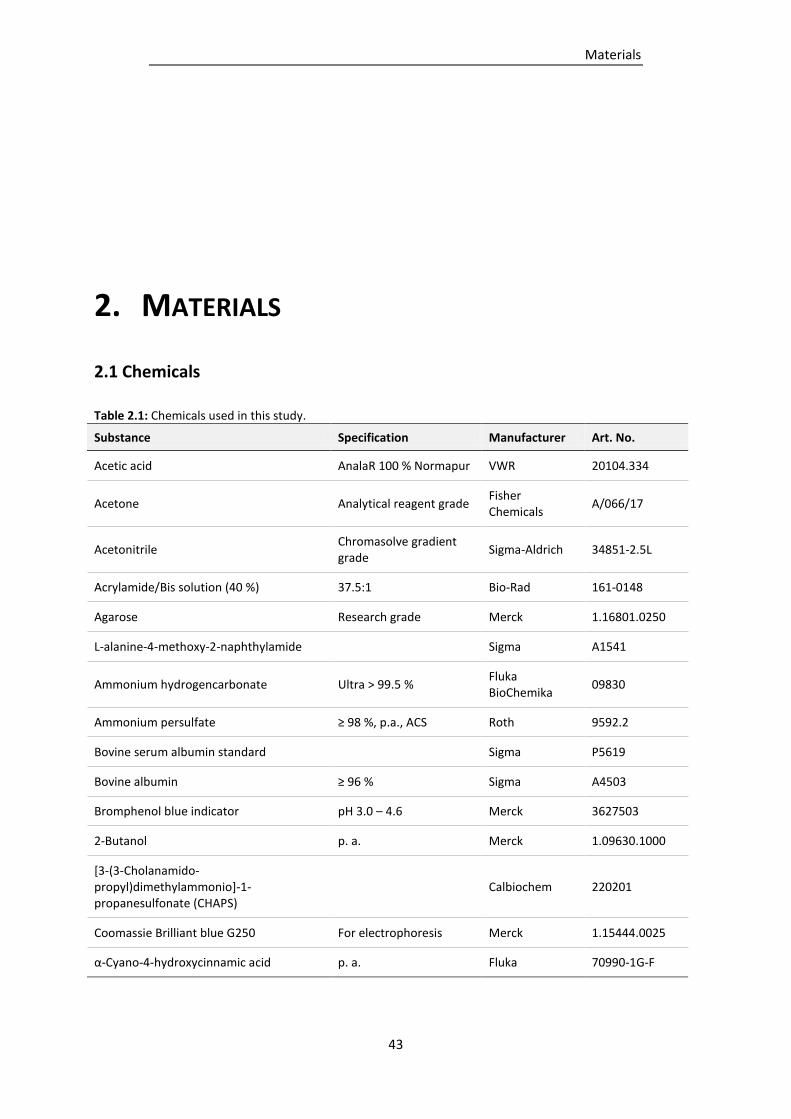
Materials
43
2. MATERIALS
2.1 Chemicals
Table 2.1: Chemicals used in this study.
Substance Specification Manufacturer Art. No.
Acetic acid AnalaR 100 % Normapur VWR 20104.334
Acetone Analytical reagent grade Fisher Chemicals
A/066/17
Acetonitrile Chromasolve gradient grade
Sigma-Aldrich 34851-2.5L
Acrylamide/Bis solution (40 %) 37.5:1 Bio-Rad 161-0148
Agarose Research grade Merck 1.16801.0250
L-alanine-4-methoxy-2-naphthylamide Sigma A1541
Ammonium hydrogencarbonate Ultra > 99.5 % Fluka BioChemika
09830
Ammonium persulfate ≥ 98 %, p.a., ACS Roth 9592.2
Bovine serum albumin standard Sigma P5619
Bovine albumin ≥ 96 % Sigma A4503
Bromphenol blue indicator pH 3.0 – 4.6 Merck 3627503
2-Butanol p. a. Merck 1.09630.1000
[3-(3-Cholanamido-propyl)dimethylammonio]-1-propanesulfonate (CHAPS)
Calbiochem 220201
Coomassie Brilliant blue G250 For electrophoresis Merck 1.15444.0025
α-Cyano-4-hydroxycinnamic acid p. a. Fluka 70990-1G-F

Materials
44
Table 2.1: Continued
Substance Specification Manufacturer Art. No.
Dextran From Leuconostoc mesenteroides
Sigma D5376
4,’6-Diamidino-2-phenylindole dihydrochloride (DAPI)
≥ 98 % Sigma D9542
DL-Dithiothreitol Sigma 43815
Dowex Marathon C, Na
+-form,
strongly acidic, particle size 20 – 50 mesh
Sigma 91973
Ethanol Rotipuran Roth 9065.4
Ethylenediaminetetraacetic acid tetrasodium salt (Na4EDTA)
Sigma ED4SS
Folin-Ciocalteu’s phenol reagent 2 mol/L Sigma F9252
Formaldehyde solution ~ 36 % in H2O Fluka 47630
Formamide deionized ≥ 99.5 % p.a. Roth P040.1
Formamide For molecular biology Sigma 47671
Glass beads ≤ 106 µm Sigma G4649
D-Glucose 6-phosphate monosodium salt 98.5 % Sigma F7879
D-Glucose 99.5 % Sigma F7528
D-Glucuronic acid Sigma F5269
Glycerin ACS Merck 1.04092.1000
m-Hydroxybiphenyl 90 % Sigma H6527
Iodoacetamide Sigma I6125
2-keto-3-deoxyoctonate ammonium salt Sigma K2755
Loading Dye TriTrack 6x concentrate Fermentas R1161
Lowry reagent modified Sigma L3540
Magnesium chloride hexahydrate p. a. Merck 1.05833.0250
Mark12 unstained standard Invitrogen LC5677
MassRuler DNA Ladder mix 103 µg µL-1
DNA Fermentas SM0403
Methanol Analytical reagent grade Fisher Chemical M/4000/17
2-methoxy-ethanol p. a. ACS Roth CP08.2
4-methoxy-2-naphthylamine Sigma M9894
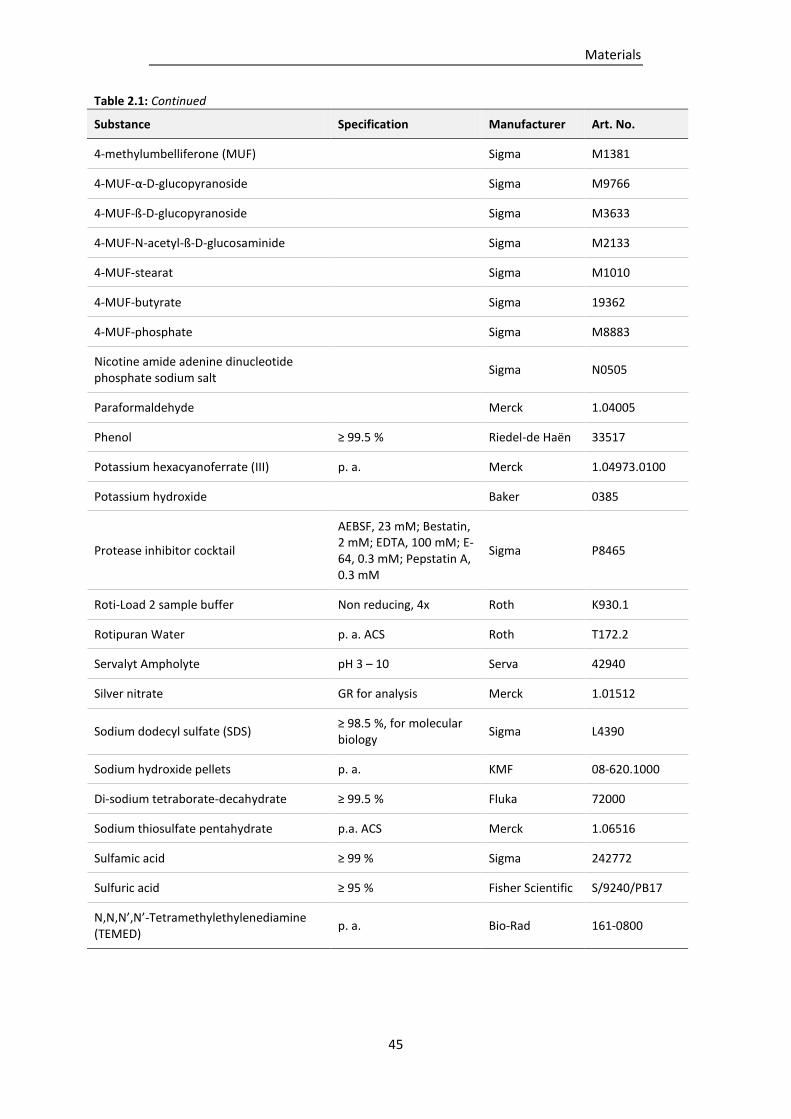
Materials
45
Table 2.1: Continued
Substance Specification Manufacturer Art. No.
4-methylumbelliferone (MUF) Sigma M1381
4-MUF-α-D-glucopyranoside Sigma M9766
4-MUF-ß-D-glucopyranoside Sigma M3633
4-MUF-N-acetyl-ß-D-glucosaminide Sigma M2133
4-MUF-stearat Sigma M1010
4-MUF-butyrate Sigma 19362
4-MUF-phosphate Sigma M8883
Nicotine amide adenine dinucleotide phosphate sodium salt
Sigma N0505
Paraformaldehyde Merck 1.04005
Phenol ≥ 99.5 % Riedel-de Haën 33517
Potassium hexacyanoferrate (III) p. a. Merck 1.04973.0100
Potassium hydroxide Baker 0385
Protease inhibitor cocktail
AEBSF, 23 mM; Bestatin, 2 mM; EDTA, 100 mM; E-64, 0.3 mM; Pepstatin A, 0.3 mM
Sigma P8465
Roti-Load 2 sample buffer Non reducing, 4x Roth K930.1
Rotipuran Water p. a. ACS Roth T172.2
Servalyt Ampholyte pH 3 – 10 Serva 42940
Silver nitrate GR for analysis Merck 1.01512
Sodium dodecyl sulfate (SDS) ≥ 98.5 %, for molecular biology
Sigma L4390
Sodium hydroxide pellets p. a. KMF 08-620.1000
Di-sodium tetraborate-decahydrate ≥ 99.5 % Fluka 72000
Sodium thiosulfate pentahydrate p.a. ACS Merck 1.06516
Sulfamic acid ≥ 99 % Sigma 242772
Sulfuric acid ≥ 95 % Fisher Scientific S/9240/PB17
N,N,N’,N’-Tetramethylethylenediamine (TEMED)
p. a. Bio-Rad 161-0800
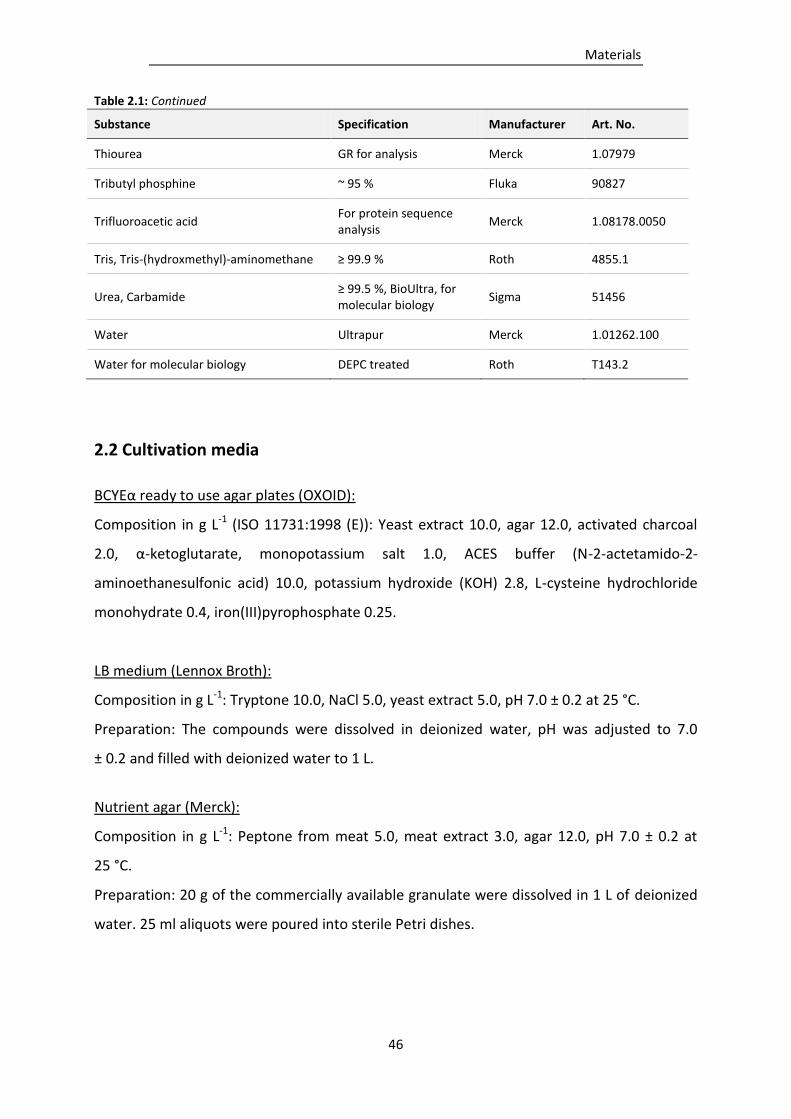
Materials
46
Table 2.1: Continued
Substance Specification Manufacturer Art. No.
Thiourea GR for analysis Merck 1.07979
Tributyl phosphine ~ 95 % Fluka 90827
Trifluoroacetic acid For protein sequence analysis
Merck 1.08178.0050
Tris, Tris-(hydroxmethyl)-aminomethane ≥ 99.9 % Roth 4855.1
Urea, Carbamide ≥ 99.5 %, BioUltra, for molecular biology
Sigma 51456
Water Ultrapur Merck 1.01262.100
Water for molecular biology DEPC treated Roth T143.2
2.2 Cultivation media
BCYEα ready to use agar plates (OXOID):
Composition in g L-1 (ISO 11731:1998 (E)): Yeast extract 10.0, agar 12.0, activated charcoal
2.0, α-ketoglutarate, monopotassium salt 1.0, ACES buffer (N-2-actetamido-2-
aminoethanesulfonic acid) 10.0, potassium hydroxide (KOH) 2.8, L-cysteine hydrochloride
monohydrate 0.4, iron(III)pyrophosphate 0.25.
LB medium (Lennox Broth):
Composition in g L-1: Tryptone 10.0, NaCl 5.0, yeast extract 5.0, pH 7.0 ± 0.2 at 25 °C.
Preparation: The compounds were dissolved in deionized water, pH was adjusted to 7.0
± 0.2 and filled with deionized water to 1 L.
Nutrient agar (Merck):
Composition in g L-1: Peptone from meat 5.0, meat extract 3.0, agar 12.0, pH 7.0 ± 0.2 at
25 °C.
Preparation: 20 g of the commercially available granulate were dissolved in 1 L of deionized
water. 25 ml aliquots were poured into sterile Petri dishes.

Materials
47
Pseudomonas selective agar with C-N supplement (CN agar) (Oxoid):
Composition in g L-1: Gelatin peptone 16.0, casein hydrolysate 10.0, potassium sulphate 10.0,
MgCl2 1.4, agar 11.0, pH 7.1 ± 0.2 at 25 °C.
Preparation: 24.2 g of the granulate and 5 mL glycerol were dissolved in 500 mL of deionized
water and autoclaved at 121 °C for 20 min. The content of one vial Pseudomonas C-N
supplement (100 mg cetrimide, 7.5 mg sodium nalidixate; Oxoid) was dissolved in a 1:1 (v/v)
solution of ethanol and sterile deionized water and aseptically added to the autoclaved agar
base once it has cooled to 50 °C. 25 ml aliquots were poured into sterile Petri dishes.
R2A medium (Difco):
Composition in g L-1: Yeast extract 0.5, proteose peptone No. 3 0.5, casamino acids 0.5,
dextrose 0.5, soluble starch 0.5, sodium pyruvate 0.3, dipotassium phosphate 0.3,
magnesium sulphate 0.05, agar 15.0, pH 7.2 ± 0.2 at 25 °C.
Preparation: 18.2 g R2A medium were dissolved in 1 L deionized water and autoclaved at
121°C for 20 min. 25 ml aliquots were poured into sterile Petri dishes.
2.3 Buffers and solutions
Agarose solution, 1 %
1 g agarose was suspended in 2 mL 50 x TAE-Puffer and 98 mL deionized water and dissolved
by heating. The agarose solution was stored at 55 °C until use.
Ammonium persulphate (APS) solution, 10 %
0.1 g APS were dissolved in 1 mL deionized water.
Ammonium persulphate (APS) solution, 40 %
0.4 g APS were dissolved in 1 mL deionized water.
Benzonase buffer (pH 8.0), 10 x
6.057 g Tris (500 mM) and 0.203 g MgCl2 x 6 H2O (10 mM) were dissolved and filled up to
100 mL in deionized water and adjusted to pH 8.0. The buffer was filter sterilized (cellulose
acetate filter, pore size 0.2 µm).
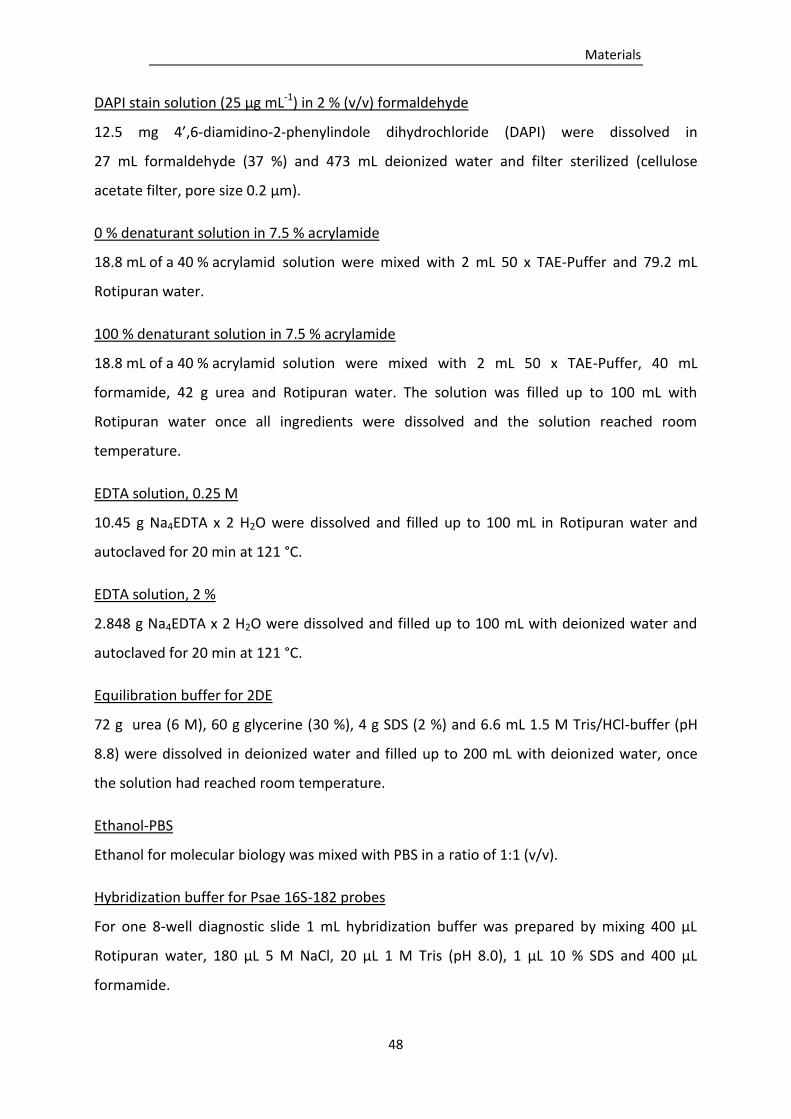
Materials
48
DAPI stain solution (25 μg mL-1) in 2 % (v/v) formaldehyde
12.5 mg 4’,6-diamidino-2-phenylindole dihydrochloride (DAPI) were dissolved in
27 mL formaldehyde (37 %) and 473 mL deionized water and filter sterilized (cellulose
acetate filter, pore size 0.2 μm).
0 % denaturant solution in 7.5 % acrylamide
18.8 mL of a 40 % acrylamid solution were mixed with 2 mL 50 x TAE-Puffer and 79.2 mL
Rotipuran water.
100 % denaturant solution in 7.5 % acrylamide
18.8 mL of a 40 % acrylamid solution were mixed with 2 mL 50 x TAE-Puffer, 40 mL
formamide, 42 g urea and Rotipuran water. The solution was filled up to 100 mL with
Rotipuran water once all ingredients were dissolved and the solution reached room
temperature.
EDTA solution, 0.25 M
10.45 g Na4EDTA x 2 H2O were dissolved and filled up to 100 mL in Rotipuran water and
autoclaved for 20 min at 121 °C.
EDTA solution, 2 %
2.848 g Na4EDTA x 2 H2O were dissolved and filled up to 100 mL with deionized water and
autoclaved for 20 min at 121 °C.
Equilibration buffer for 2DE
72 g urea (6 M), 60 g glycerine (30 %), 4 g SDS (2 %) and 6.6 mL 1.5 M Tris/HCl-buffer (pH
8.8) were dissolved in deionized water and filled up to 200 mL with deionized water, once
the solution had reached room temperature.
Ethanol-PBS
Ethanol for molecular biology was mixed with PBS in a ratio of 1:1 (v/v).
Hybridization buffer for Psae 16S-182 probes
For one 8-well diagnostic slide 1 mL hybridization buffer was prepared by mixing 400 µL
Rotipuran water, 180 µL 5 M NaCl, 20 µL 1 M Tris (pH 8.0), 1 µL 10 % SDS and 400 µL
formamide.
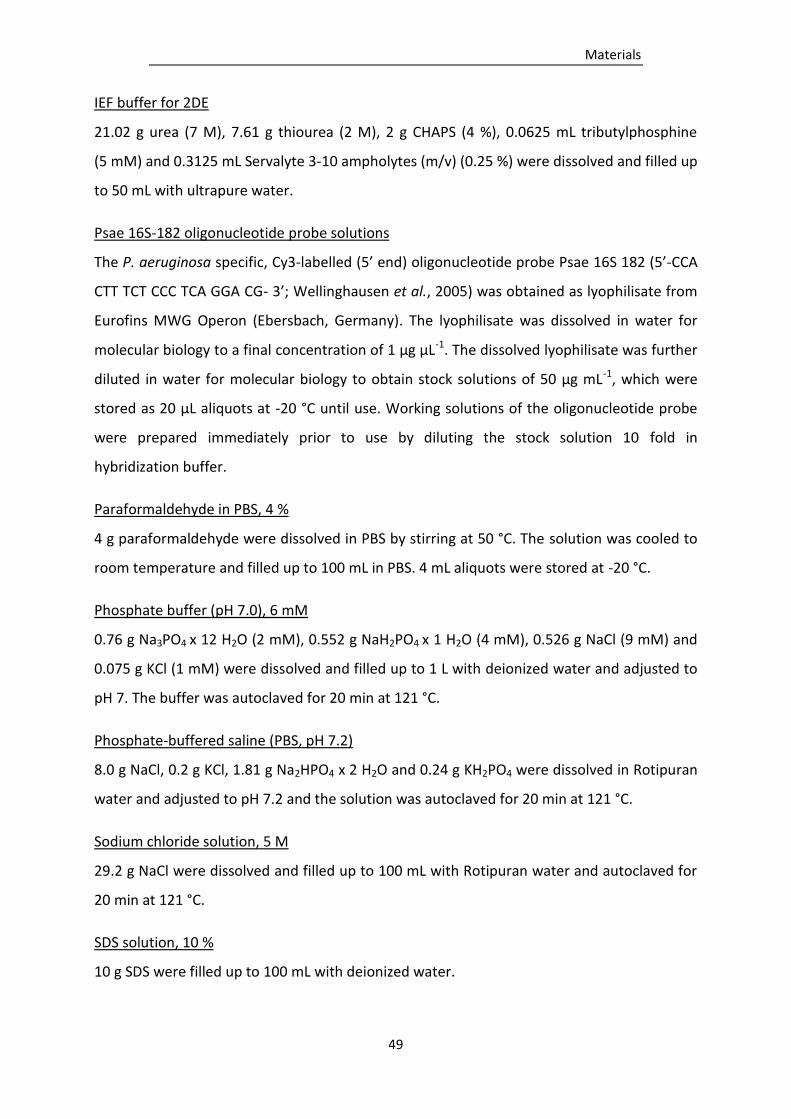
Materials
49
IEF buffer for 2DE
21.02 g urea (7 M), 7.61 g thiourea (2 M), 2 g CHAPS (4 %), 0.0625 mL tributylphosphine
(5 mM) and 0.3125 mL Servalyte 3-10 ampholytes (m/v) (0.25 %) were dissolved and filled up
to 50 mL with ultrapure water.
Psae 16S-182 oligonucleotide probe solutions
The P. aeruginosa specific, Cy3-labelled (5’ end) oligonucleotide probe Psae 16S 182 (5’-CCA
CTT TCT CCC TCA GGA CG- 3’; Wellinghausen et al., 2005) was obtained as lyophilisate from
Eurofins MWG Operon (Ebersbach, Germany). The lyophilisate was dissolved in water for
molecular biology to a final concentration of 1 µg µL-1. The dissolved lyophilisate was further
diluted in water for molecular biology to obtain stock solutions of 50 µg mL-1, which were
stored as 20 µL aliquots at -20 °C until use. Working solutions of the oligonucleotide probe
were prepared immediately prior to use by diluting the stock solution 10 fold in
hybridization buffer.
Paraformaldehyde in PBS, 4 %
4 g paraformaldehyde were dissolved in PBS by stirring at 50 °C. The solution was cooled to
room temperature and filled up to 100 mL in PBS. 4 mL aliquots were stored at -20 °C.
Phosphate buffer (pH 7.0), 6 mM
0.76 g Na3PO4 x 12 H2O (2 mM), 0.552 g NaH2PO4 x 1 H2O (4 mM), 0.526 g NaCl (9 mM) and
0.075 g KCl (1 mM) were dissolved and filled up to 1 L with deionized water and adjusted to
pH 7. The buffer was autoclaved for 20 min at 121 °C.
Phosphate-buffered saline (PBS, pH 7.2)
8.0 g NaCl, 0.2 g KCl, 1.81 g Na2HPO4 x 2 H2O and 0.24 g KH2PO4 were dissolved in Rotipuran
water and adjusted to pH 7.2 and the solution was autoclaved for 20 min at 121 °C.
Sodium chloride solution, 5 M
29.2 g NaCl were dissolved and filled up to 100 mL with Rotipuran water and autoclaved for
20 min at 121 °C.
SDS solution, 10 %
10 g SDS were filled up to 100 mL with deionized water.
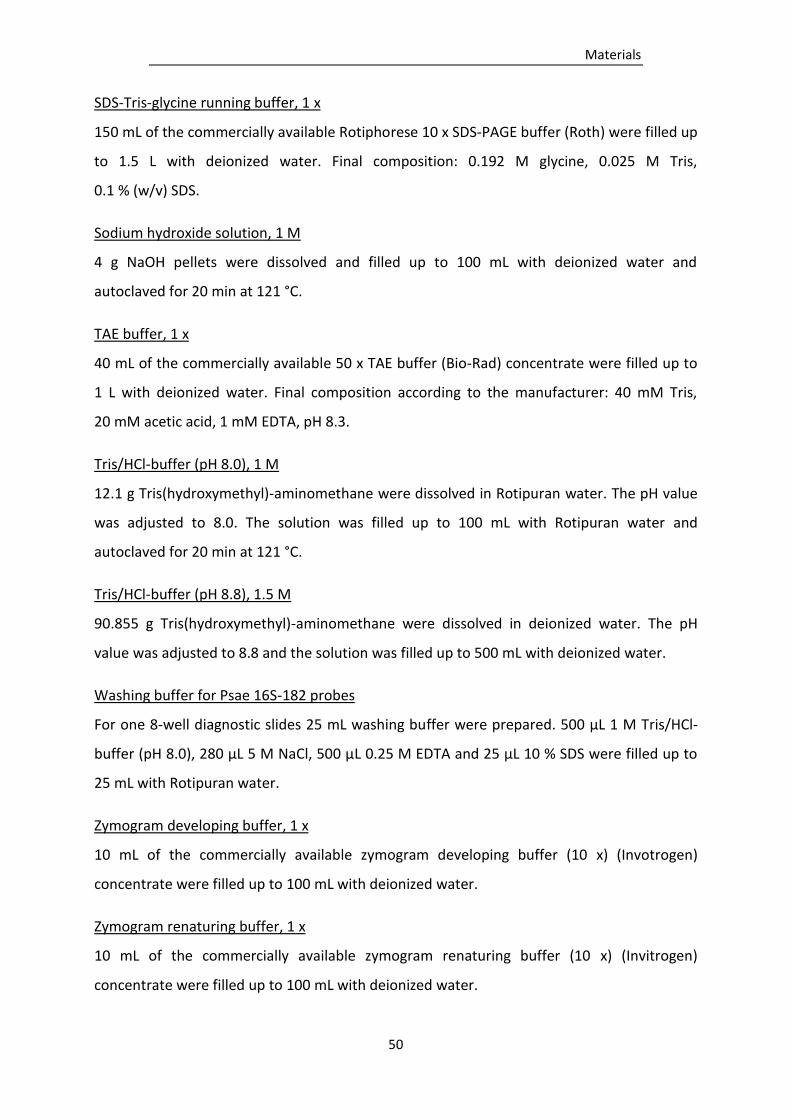
Materials
50
SDS-Tris-glycine running buffer, 1 x
150 mL of the commercially available Rotiphorese 10 x SDS-PAGE buffer (Roth) were filled up
to 1.5 L with deionized water. Final composition: 0.192 M glycine, 0.025 M Tris,
0.1 % (w/v) SDS.
Sodium hydroxide solution, 1 M
4 g NaOH pellets were dissolved and filled up to 100 mL with deionized water and
autoclaved for 20 min at 121 °C.
TAE buffer, 1 x
40 mL of the commercially available 50 x TAE buffer (Bio-Rad) concentrate were filled up to
1 L with deionized water. Final composition according to the manufacturer: 40 mM Tris,
20 mM acetic acid, 1 mM EDTA, pH 8.3.
Tris/HCl-buffer (pH 8.0), 1 M
12.1 g Tris(hydroxymethyl)-aminomethane were dissolved in Rotipuran water. The pH value
was adjusted to 8.0. The solution was filled up to 100 mL with Rotipuran water and
autoclaved for 20 min at 121 °C.
Tris/HCl-buffer (pH 8.8), 1.5 M
90.855 g Tris(hydroxymethyl)-aminomethane were dissolved in deionized water. The pH
value was adjusted to 8.8 and the solution was filled up to 500 mL with deionized water.
Washing buffer for Psae 16S-182 probes
For one 8-well diagnostic slides 25 mL washing buffer were prepared. 500 µL 1 M Tris/HCl-
buffer (pH 8.0), 280 µL 5 M NaCl, 500 µL 0.25 M EDTA and 25 µL 10 % SDS were filled up to
25 mL with Rotipuran water.
Zymogram developing buffer, 1 x
10 mL of the commercially available zymogram developing buffer (10 x) (Invotrogen)
concentrate were filled up to 100 mL with deionized water.
Zymogram renaturing buffer, 1 x
10 mL of the commercially available zymogram renaturing buffer (10 x) (Invitrogen)
concentrate were filled up to 100 mL with deionized water.
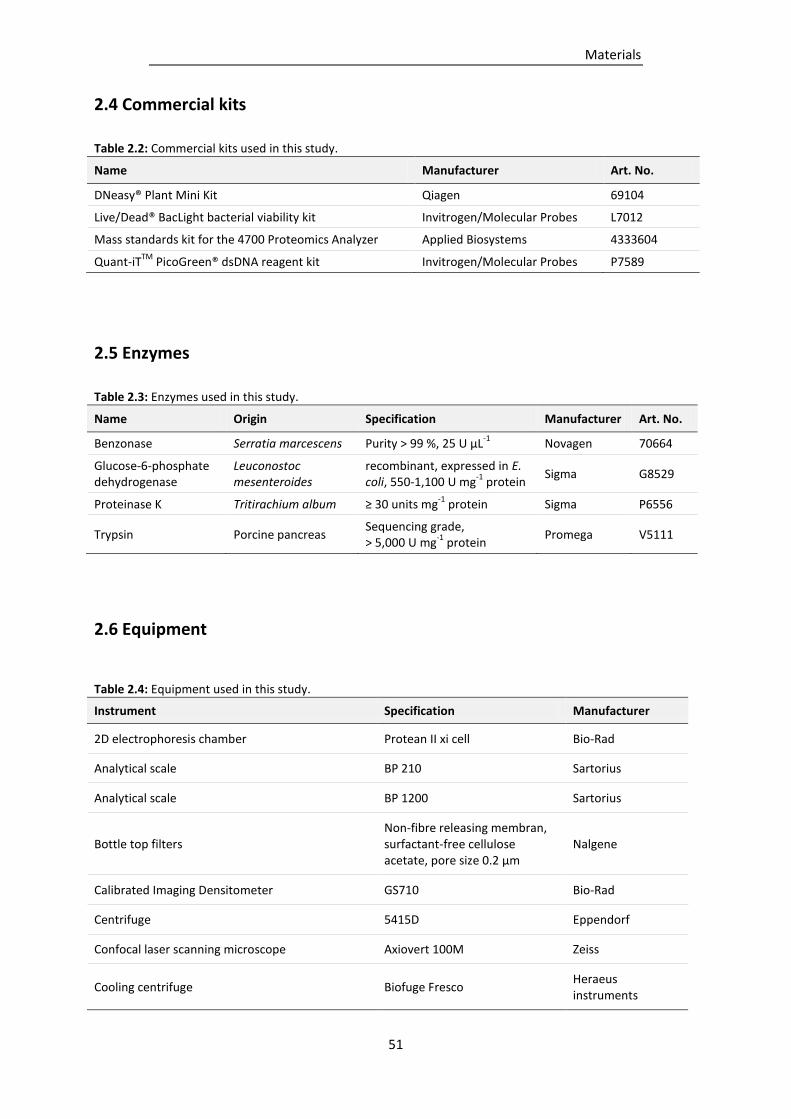
Materials
51
2.4 Commercial kits
Table 2.2: Commercial kits used in this study.
Name Manufacturer Art. No.
DNeasy® Plant Mini Kit Qiagen 69104
Live/Dead® BacLight bacterial viability kit Invitrogen/Molecular Probes L7012
Mass standards kit for the 4700 Proteomics Analyzer Applied Biosystems 4333604
Quant-iTTM
PicoGreen® dsDNA reagent kit Invitrogen/Molecular Probes P7589
2.5 Enzymes
Table 2.3: Enzymes used in this study.
Name Origin Specification Manufacturer Art. No.
Benzonase Serratia marcescens Purity > 99 %, 25 U µL-1
Novagen 70664
Glucose-6-phosphate dehydrogenase
Leuconostoc mesenteroides
recombinant, expressed in E. coli, 550-1,100 U mg
-1 protein
Sigma G8529
Proteinase K Tritirachium album ≥ 30 units mg-1
protein Sigma P6556
Trypsin Porcine pancreas Sequencing grade, > 5,000 U mg
-1 protein
Promega V5111
2.6 Equipment
Table 2.4: Equipment used in this study.
Instrument Specification Manufacturer
2D electrophoresis chamber Protean II xi cell Bio-Rad
Analytical scale BP 210 Sartorius
Analytical scale BP 1200 Sartorius
Bottle top filters Non-fibre releasing membran, surfactant-free cellulose acetate, pore size 0.2 µm
Nalgene
Calibrated Imaging Densitometer GS710 Bio-Rad
Centrifuge 5415D Eppendorf
Confocal laser scanning microscope Axiovert 100M Zeiss
Cooling centrifuge Biofuge Fresco Heraeus instruments
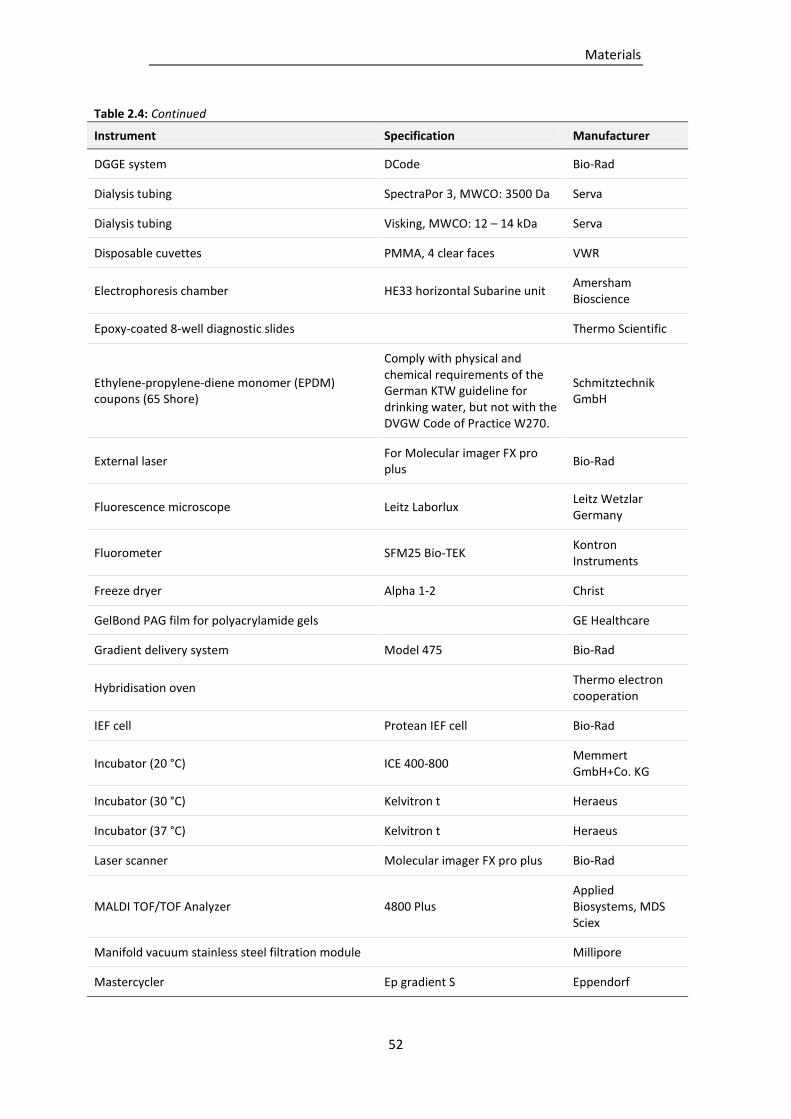
Materials
52
Table 2.4: Continued
Instrument Specification Manufacturer
DGGE system DCode Bio-Rad
Dialysis tubing SpectraPor 3, MWCO: 3500 Da Serva
Dialysis tubing Visking, MWCO: 12 – 14 kDa Serva
Disposable cuvettes PMMA, 4 clear faces VWR
Electrophoresis chamber HE33 horizontal Subarine unit Amersham Bioscience
Epoxy-coated 8-well diagnostic slides Thermo Scientific
Ethylene-propylene-diene monomer (EPDM) coupons (65 Shore)
Comply with physical and chemical requirements of the German KTW guideline for drinking water, but not with the DVGW Code of Practice W270.
Schmitztechnik GmbH
External laser For Molecular imager FX pro plus
Bio-Rad
Fluorescence microscope Leitz Laborlux Leitz Wetzlar Germany
Fluorometer SFM25 Bio-TEK Kontron Instruments
Freeze dryer Alpha 1-2 Christ
GelBond PAG film for polyacrylamide gels GE Healthcare
Gradient delivery system Model 475 Bio-Rad
Hybridisation oven Thermo electron cooperation
IEF cell Protean IEF cell Bio-Rad
Incubator (20 °C) ICE 400-800 Memmert GmbH+Co. KG
Incubator (30 °C) Kelvitron t Heraeus
Incubator (37 °C) Kelvitron t Heraeus
Laser scanner Molecular imager FX pro plus Bio-Rad
MALDI TOF/TOF Analyzer 4800 Plus Applied Biosystems, MDS Sciex
Manifold vacuum stainless steel filtration module Millipore
Mastercycler Ep gradient S Eppendorf
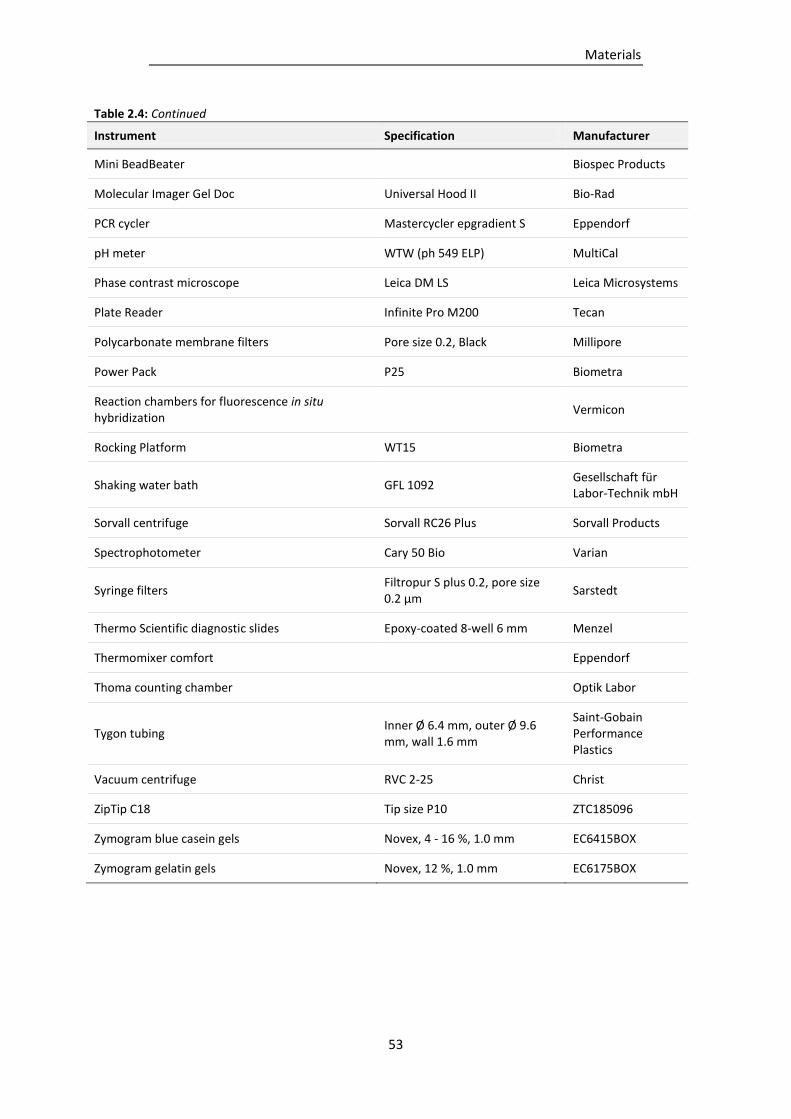
Materials
53
Table 2.4: Continued
Instrument Specification Manufacturer
Mini BeadBeater Biospec Products
Molecular Imager Gel Doc Universal Hood II Bio-Rad
PCR cycler Mastercycler epgradient S Eppendorf
pH meter WTW (ph 549 ELP) MultiCal
Phase contrast microscope Leica DM LS Leica Microsystems
Plate Reader Infinite Pro M200 Tecan
Polycarbonate membrane filters Pore size 0.2, Black Millipore
Power Pack P25 Biometra
Reaction chambers for fluorescence in situ hybridization
Vermicon
Rocking Platform WT15 Biometra
Shaking water bath GFL 1092 Gesellschaft für Labor-Technik mbH
Sorvall centrifuge Sorvall RC26 Plus Sorvall Products
Spectrophotometer Cary 50 Bio Varian
Syringe filters Filtropur S plus 0.2, pore size 0.2 µm
Sarstedt
Thermo Scientific diagnostic slides Epoxy-coated 8-well 6 mm Menzel
Thermomixer comfort Eppendorf
Thoma counting chamber Optik Labor
Tygon tubing Inner Ø 6.4 mm, outer Ø 9.6 mm, wall 1.6 mm
Saint-Gobain Performance Plastics
Vacuum centrifuge RVC 2-25 Christ
ZipTip C18 Tip size P10 ZTC185096
Zymogram blue casein gels Novex, 4 - 16 %, 1.0 mm EC6415BOX
Zymogram gelatin gels Novex, 12 %, 1.0 mm EC6175BOX
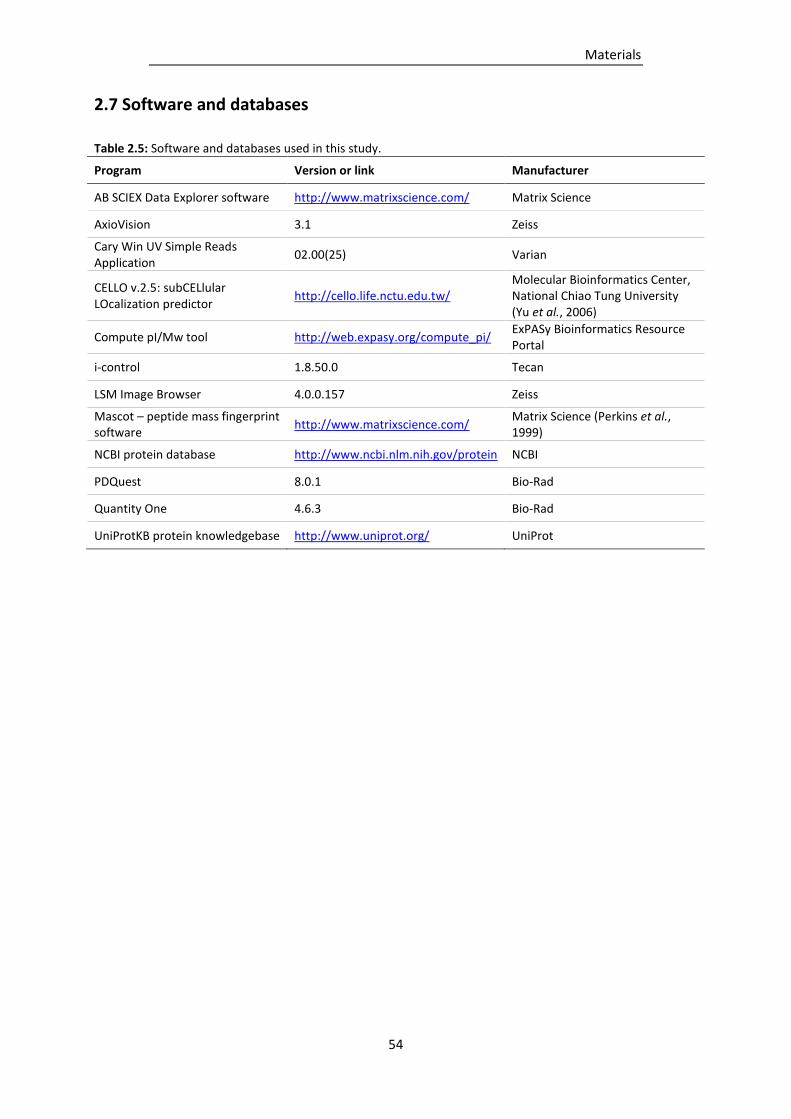
Materials
54
2.7 Software and databases
Table 2.5: Software and databases used in this study.
Program Version or link Manufacturer
AB SCIEX Data Explorer software http://www.matrixscience.com/ Matrix Science
AxioVision 3.1 Zeiss
Cary Win UV Simple Reads Application
02.00(25) Varian
CELLO v.2.5: subCELlular LOcalization predictor
http://cello.life.nctu.edu.tw/ Molecular Bioinformatics Center, National Chiao Tung University (Yu et al., 2006)
Compute pI/Mw tool http://web.expasy.org/compute_pi/ ExPASy Bioinformatics Resource Portal
i-control 1.8.50.0 Tecan
LSM Image Browser 4.0.0.157 Zeiss
Mascot – peptide mass fingerprint software
http://www.matrixscience.com/ Matrix Science (Perkins et al., 1999)
NCBI protein database http://www.ncbi.nlm.nih.gov/protein NCBI
PDQuest 8.0.1 Bio-Rad
Quantity One 4.6.3 Bio-Rad
UniProtKB protein knowledgebase http://www.uniprot.org/ UniProt
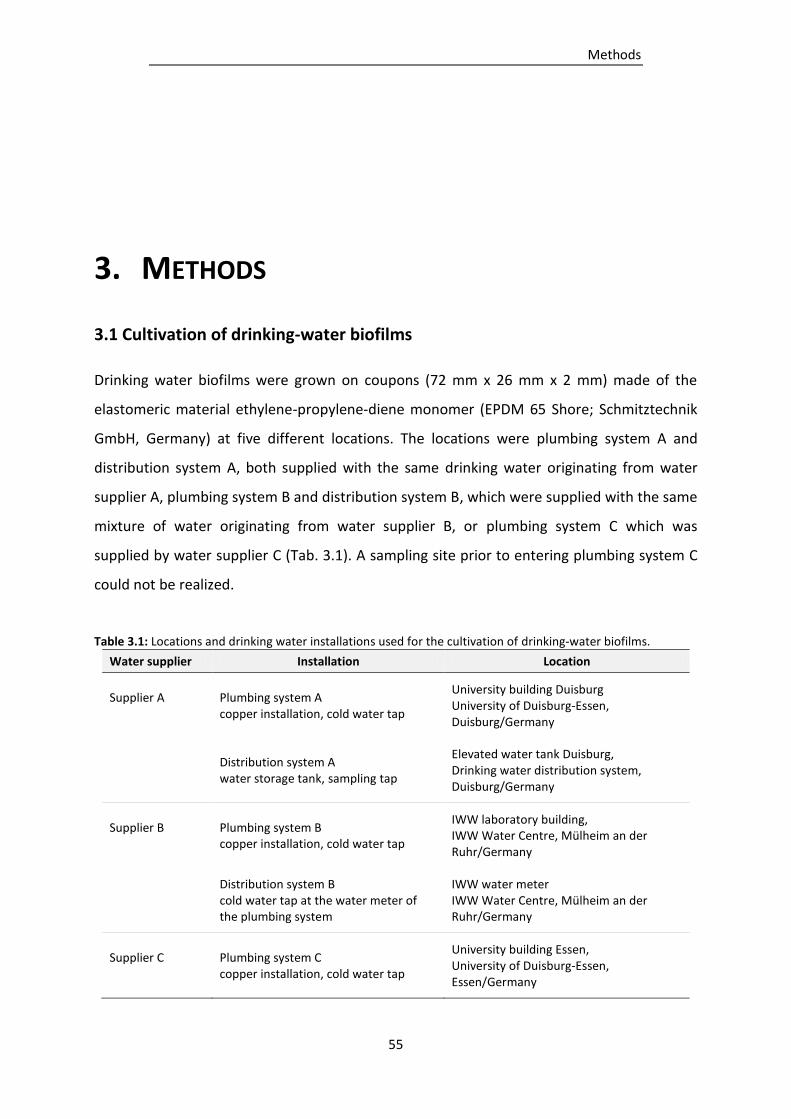
Methods
55
3. METHODS
3.1 Cultivation of drinking-water biofilms
Drinking water biofilms were grown on coupons (72 mm x 26 mm x 2 mm) made of the
elastomeric material ethylene-propylene-diene monomer (EPDM 65 Shore; Schmitztechnik
GmbH, Germany) at five different locations. The locations were plumbing system A and
distribution system A, both supplied with the same drinking water originating from water
supplier A, plumbing system B and distribution system B, which were supplied with the same
mixture of water originating from water supplier B, or plumbing system C which was
supplied by water supplier C (Tab. 3.1). A sampling site prior to entering plumbing system C
could not be realized.
Table 3.1: Locations and drinking water installations used for the cultivation of drinking-water biofilms.
Water supplier Installation Location
Supplier A
Plumbing system A copper installation, cold water tap
University building Duisburg University of Duisburg-Essen, Duisburg/Germany
Distribution system A water storage tank, sampling tap
Elevated water tank Duisburg, Drinking water distribution system, Duisburg/Germany
Supplier B
Plumbing system B copper installation, cold water tap
IWW laboratory building, IWW Water Centre, Mülheim an der Ruhr/Germany
Distribution system B cold water tap at the water meter of the plumbing system
IWW water meter IWW Water Centre, Mülheim an der Ruhr/Germany
Supplier C
Plumbing system C copper installation, cold water tap
University building Essen, University of Duisburg-Essen, Essen/Germany
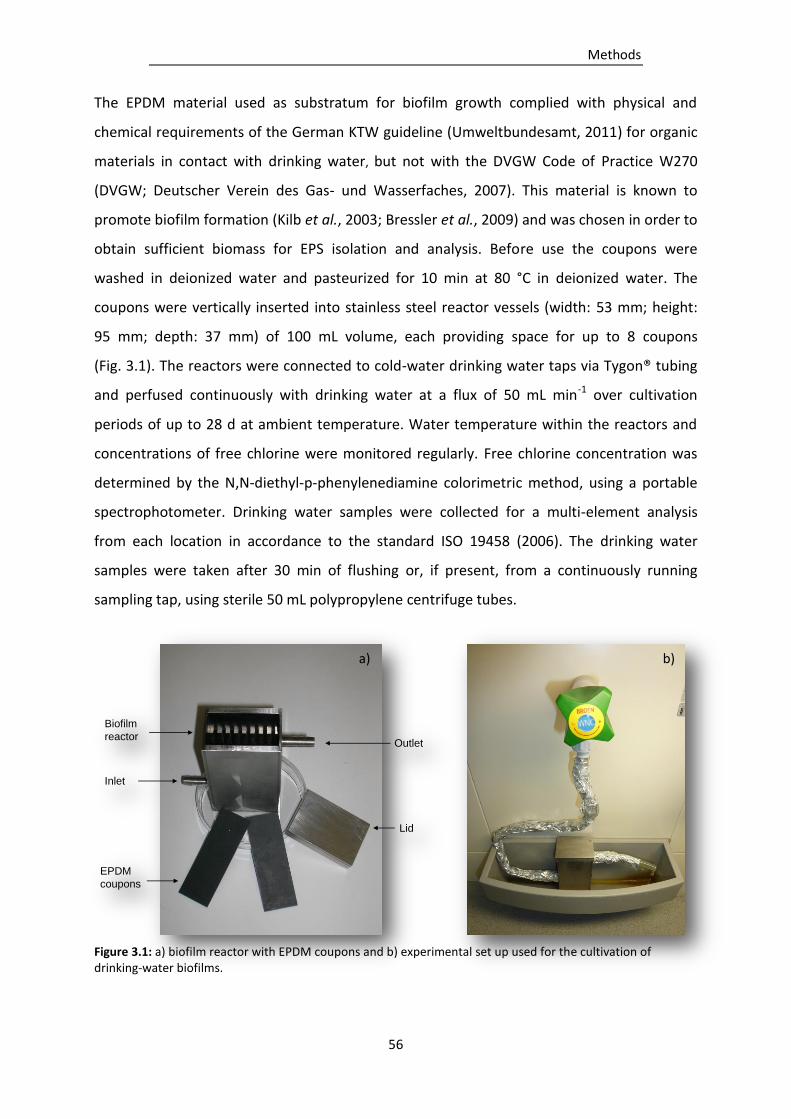
Methods
56
The EPDM material used as substratum for biofilm growth complied with physical and
chemical requirements of the German KTW guideline (Umweltbundesamt, 2011) for organic
materials in contact with drinking water, but not with the DVGW Code of Practice W270
(DVGW; Deutscher Verein des Gas- und Wasserfaches, 2007). This material is known to
promote biofilm formation (Kilb et al., 2003; Bressler et al., 2009) and was chosen in order to
obtain sufficient biomass for EPS isolation and analysis. Before use the coupons were
washed in deionized water and pasteurized for 10 min at 80 °C in deionized water. The
coupons were vertically inserted into stainless steel reactor vessels (width: 53 mm; height:
95 mm; depth: 37 mm) of 100 mL volume, each providing space for up to 8 coupons
(Fig. 3.1). The reactors were connected to cold-water drinking water taps via Tygon® tubing
and perfused continuously with drinking water at a flux of 50 mL min-1 over cultivation
periods of up to 28 d at ambient temperature. Water temperature within the reactors and
concentrations of free chlorine were monitored regularly. Free chlorine concentration was
determined by the N,N-diethyl-p-phenylenediamine colorimetric method, using a portable
spectrophotometer. Drinking water samples were collected for a multi-element analysis
from each location in accordance to the standard ISO 19458 (2006). The drinking water
samples were taken after 30 min of flushing or, if present, from a continuously running
sampling tap, using sterile 50 mL polypropylene centrifuge tubes.
Figure 3.1: a) biofilm reactor with EPDM coupons and b) experimental set up used for the cultivation of drinking-water biofilms.
a)
b)
Outlet
Lid
Inlet
EPDM
coupons
Biofilm
reactor
a)
Methods
57
3.2 Sampling of drinking-water biofilms
Coupons were aseptically removed from the reactors using sterile forceps and drinking-
water biofilms were scraped off both sides of the coupons into sterile Petri dishes using a
sterile rubber scraper. The biofilms were either directly used for biomass determination or
dispersed in 10 mL 6 mM phosphate buffer (pH 7.0) per coupon. The biofilm suspensions
were stirred for 5 min for cell dispersal and used for EPS isolation and for microbiological,
biochemical or molecular biological analyses.
3.3 Determination of biofilm mass
Wet weight, dry mass and water content of the biofilms were determined according to the
standard DIN EN 12880 (2001). A crucible was heated in a muffle furnace at 550 °C for at
least 30 min. The crucible was allowed to cool to room temperature (approximately 15 min)
in an exsiccator and weighed. 14 d-old drinking-water biofilms from at least 5 EPDM-
coupons were scraped off into the crucible and weighed to determine wet weight. To
determine the dry weight the crucible containing the biofilm was heated at 105 °C overnight,
allowed to cool to room temperature (approximately 5 min) in an exsiccator with P2O5
applying vacuum and weighed. The sample was heated again for 1 hour and weighed. The
last step was repeated until the sample showed constant mass readings (< 0.5 % (m/m)
difference from the previous determination).
The loss and residue on combustion of the dry mass of drinking-water biofilms was
determined according to the standard DIN EN 12879 (2001). The crucible containing the
dried biofilm mass was combusted in a muffle furnace at 550 °C for 1.5 hours. The crucible
was allowed to cool to room temperature (approximately 15 min) in an exsiccator with P2O5
applying vacuum and weighed. The sample was reheated to 550 °C for 30 min and weighed.
The last step was repeated until the sample showed constant mass readings (< 0.5 % (m/m)
difference from the previous determination).
Methods
58
3.4 Multi-element analysis of drinking water and biofilms
Multi-element analyses of all water samples, drinking-water biofilm suspensions or EPS
solutions were performed by the IWW Water Centre (Mülheim an der Ruhr, Germany)
according to ISO 11885 (2007), using inductively coupled plasma optical emission
spectrometry (ICP-OES). Biofilm samples required initial disintegration by acid digestion
using a mixture of HNO3 and H2O2 combined with microwave treatment prior to ICP-OES
measurement.
3.5 Scanning electron microscopy of drinking-water biofilms
Images of 14 d-old drinking-water biofilms grown on EPDM were acquired by scanning
electron microscopy. Coupons with grown biofilms were removed from the biofilm reactor
and dried overnight in an exsiccator with P2O5 applying vacuum. The coupons were cut into
squares of approximately 1 cm² and fixed onto specimen stubs. The biofilms were sputtered
with gold using a sputter coater (EMITECH K550; Emitech ltd., England). Images were
acquired with an environmental scanning electron microscope (ESEM Quanta 400 FEG; FEI
Company, USA) coupled to an energy dispersive x-ray micro analysis unit (Genesis 4000 EDS-
system; EDAX inc., USA).
3.6 Confocal laser scanning microscopy (CLSM)
Images of fully-hydrated 14 d-old drinking-water biofilms cultivated on EPDM were acquired
by CLSM after staining with the Live/Dead® BacLight bacterial viability kit
(Invitrogen/Molecular Probes). The fluorescent stains Syto 9 and propidium iodide were
mixed and diluted in deionized water to concentrations of 5 µM and 30 µM, respectively. An
EPDM coupon with attached 14 d-old drinking-water biofilm was removed from the biofilm
reactor and fixed onto a glass slide. 300 µL of the stain mix were applied on the biofilm and
the biofilm was incubated for 30 min in the dark in a moist environment. Biofilms were
examined at 100 fold (without cover slide) and 1000 fold (with cove slide and immersion oil)
magnification. Excitation of the stains was performed with an argon laser and an excitation
Methods
59
wavelength of 488 nm. The applied filters were a band-pass filter for detection of emission in
the range of 505 – 530 nm (Syto 9) and a long-pass filter for detection of emission ≥ 560 nm
(propidium iodide).
3.7 Microbiological analysis
3.7.1 Total cell count
Cells were stained with 4’,6-diamidino-2-phenylindole (DAPI; dihydrochloride, 25 µg ml-1 in
2 % formaldehyde). 1 mL of DAPI solution was added to 4 mL of biofilm or cell suspension, or
decimal dilutions of the suspensions in sterile particle-free deionized water and incubated
for 20 min in the dark at room temperature. Cells were filtered onto black polycarbonate
membrane filters (30 mm diameter, 0.2 µm pore size; Millipore) which were stored in the
dark at 4 °C until enumeration. Enumeration of cells was carried out with an epifluorescence
microscope (Laborlux S; Leitz Germany) at 1000 fold magnification (Objective: PL Fluotar;
100x/1.32 oil; PHACO 3) with the help of a counting grid (100 µm x 100 µm). 20 randomly
chosen fields of view of biofilm suspensions showing 20 to 150 cells were examined. Results
were given in cells mL-1.
3.7.2 Heterotrophic plate count
Culturable heterotrophic plate count bacteria were determined by the spread plate method
on R2A medium (Reasoner and Geldreich 1985). 0.1 mL of biofilm suspension or decimal
dilutions of the biofilm suspension in sterile particle-free deionized water were plated in
triplicates on R2A medium and the agar plates were incubated for 7 d at 20 °C. Plates
showing 30 to 300 colonies were used for enumeration. Results were given in colony-
forming units (cfu) mL-1.
3.7.3 Culturability of P. aeruginosa pure cultures
Culturability of P. aeruginosa AdS pure cultures were determined by spread plate method on
nutrient agar. 0.5 mL of cell suspension or 0.1 mL of decimal dilutions of the suspensions in
sterile particle free deionized water were plated in triplicates on nutrient agar plates and the

Methods
60
agar plates were incubated for 48 h at 37 °C. Plates showing 30 to 300 colonies were used
for enumeration. Results were given in cfu mL-1.
3.7.4 Culturability of P. aeruginosa in biofilms
Culturability of P. aeruginosa AdS present in or incorporated into established drinking-water
biofilms was determined by spread plate method on the selective CN agar. 0.5 mL of biofilm
suspension or 0.1 mL of decimal dilutions of the suspensions in sterile particle free deionized
water were plated in triplicates on CN agar plates and the agar plates were incubated for
48 h at 37 °C. Plates showing 30 to 300 colonies were used for enumeration. Results were
given in cfu mL-1.
3.8 Isolation of extracellular polymeric substances (EPS)
Isolation of EPS from drinking-water biofilms was carried out in a miniaturized form
compared to isolation procedures commonly applied for activated or sewage sludges (Jahn
and Nielsen, 1995; FrØlund et al., 1996), using 8 to 20 mL-volumes of biofilm suspensions.
The isolation procedures tested were shaking, shaking in presence of a cation exchange resin
(CER), NaOH treatment in combination with formaldehyde, EDTA treatment or heating,
which were carried out according to Fig. 3.3.
- Shaking treatment -
8 mL-volumes of biofilm suspensions were shaken on a Vortex (Genie 2) shaker in 50 mL
centrifuge tubes (conical bottom, polypropylene; Sarstedt) for up to 60 min at maximum
speed (Fig. 3.2). The Vortex was equipped with a platform head able to hold 4 centrifuge
tubes.
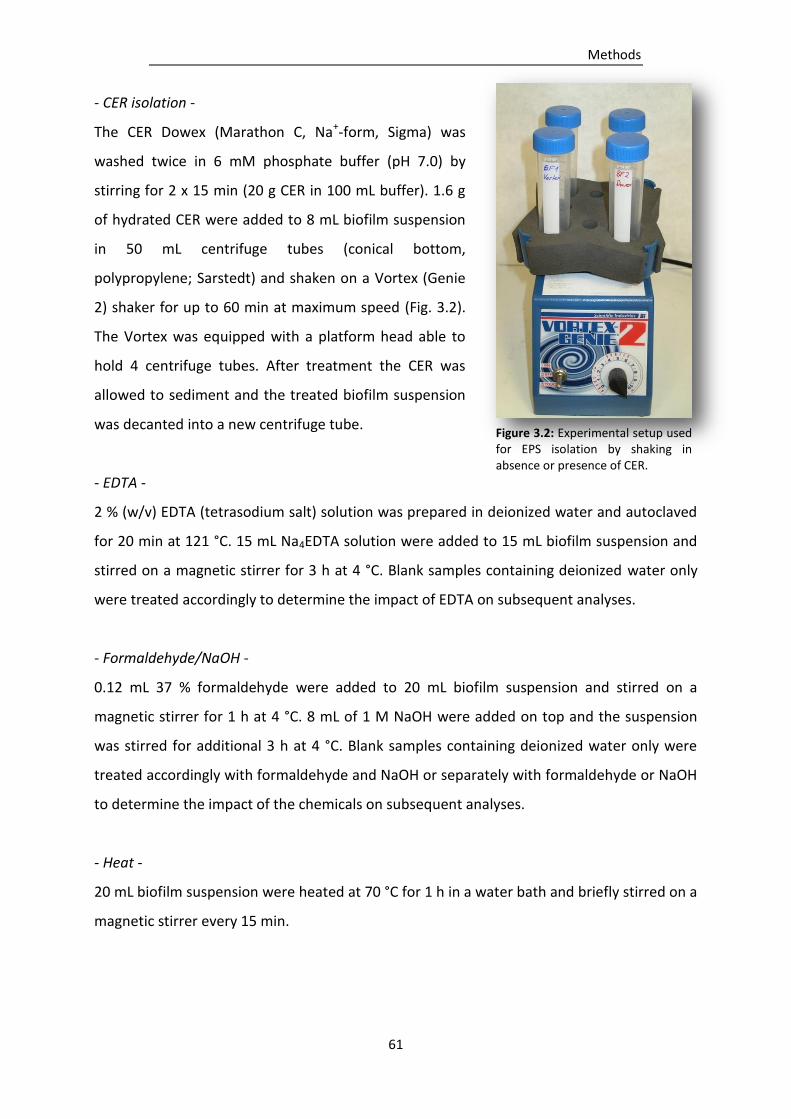
Methods
61
- CER isolation -
The CER Dowex (Marathon C, Na+-form, Sigma) was
washed twice in 6 mM phosphate buffer (pH 7.0) by
stirring for 2 x 15 min (20 g CER in 100 mL buffer). 1.6 g
of hydrated CER were added to 8 mL biofilm suspension
in 50 mL centrifuge tubes (conical bottom,
polypropylene; Sarstedt) and shaken on a Vortex (Genie
2) shaker for up to 60 min at maximum speed (Fig. 3.2).
The Vortex was equipped with a platform head able to
hold 4 centrifuge tubes. After treatment the CER was
allowed to sediment and the treated biofilm suspension
was decanted into a new centrifuge tube.
- EDTA -
2 % (w/v) EDTA (tetrasodium salt) solution was prepared in deionized water and autoclaved
for 20 min at 121 °C. 15 mL Na4EDTA solution were added to 15 mL biofilm suspension and
stirred on a magnetic stirrer for 3 h at 4 °C. Blank samples containing deionized water only
were treated accordingly to determine the impact of EDTA on subsequent analyses.
- Formaldehyde/NaOH -
0.12 mL 37 % formaldehyde were added to 20 mL biofilm suspension and stirred on a
magnetic stirrer for 1 h at 4 °C. 8 mL of 1 M NaOH were added on top and the suspension
was stirred for additional 3 h at 4 °C. Blank samples containing deionized water only were
treated accordingly with formaldehyde and NaOH or separately with formaldehyde or NaOH
to determine the impact of the chemicals on subsequent analyses.
- Heat -
20 mL biofilm suspension were heated at 70 °C for 1 h in a water bath and briefly stirred on a
magnetic stirrer every 15 min.
Figure 3.2: Experimental setup used for EPS isolation by shaking in absence or presence of CER.
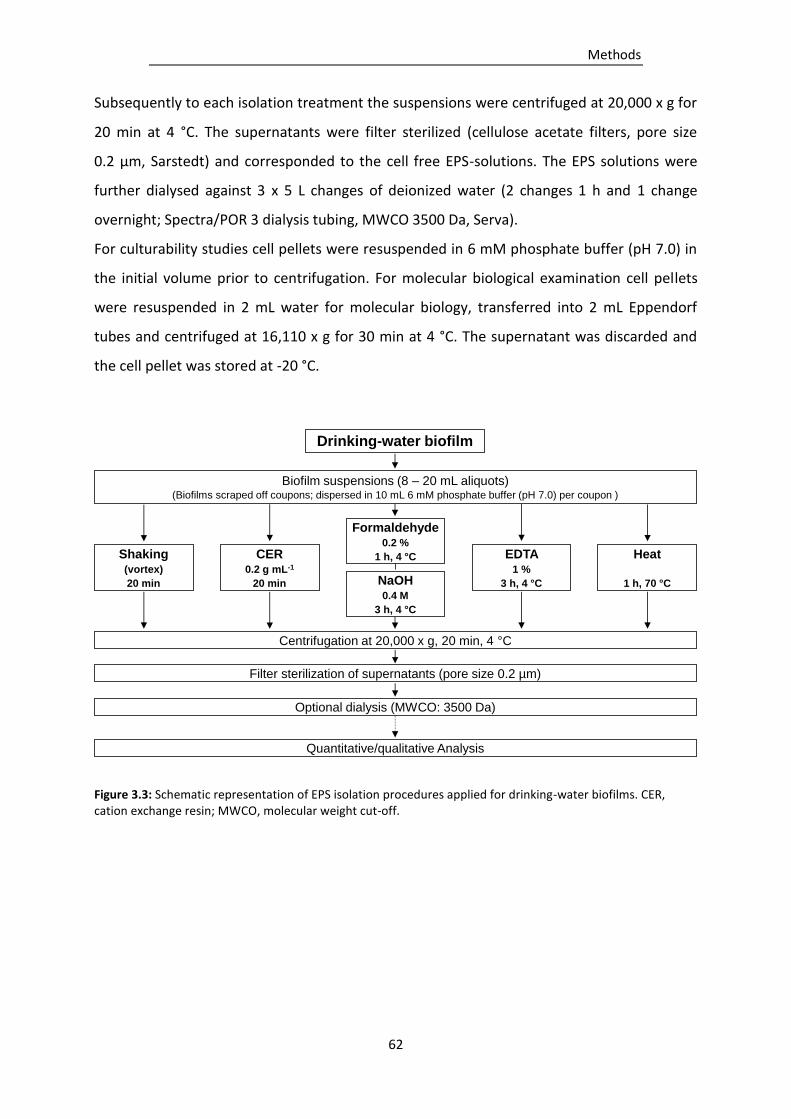
Methods
62
Subsequently to each isolation treatment the suspensions were centrifuged at 20,000 x g for
20 min at 4 °C. The supernatants were filter sterilized (cellulose acetate filters, pore size
0.2 µm, Sarstedt) and corresponded to the cell free EPS-solutions. The EPS solutions were
further dialysed against 3 x 5 L changes of deionized water (2 changes 1 h and 1 change
overnight; Spectra/POR 3 dialysis tubing, MWCO 3500 Da, Serva).
For culturability studies cell pellets were resuspended in 6 mM phosphate buffer (pH 7.0) in
the initial volume prior to centrifugation. For molecular biological examination cell pellets
were resuspended in 2 mL water for molecular biology, transferred into 2 mL Eppendorf
tubes and centrifuged at 16,110 x g for 30 min at 4 °C. The supernatant was discarded and
the cell pellet was stored at -20 °C.
Figure 3.3: Schematic representation of EPS isolation procedures applied for drinking-water biofilms. CER, cation exchange resin; MWCO, molecular weight cut-off.
Drinking-water biofilm
Biofilm suspensions (8 – 20 mL aliquots)(Biofilms scraped off coupons; dispersed in 10 mL 6 mM phosphate buffer (pH 7.0) per coupon )
Shaking (vortex)
20 min
CER0.2 g mL-1
20 min
Formaldehyde0.2 %
1 h, 4 °C EDTA 1 %
3 h, 4 °C
Heat
1 h, 70 °CNaOH0.4 M
3 h, 4 °C
Centrifugation at 20,000 x g, 20 min, 4 °C
Filter sterilization of supernatants (pore size 0.2 µm)
Optional dialysis (MWCO: 3500 Da)
Quantitative/qualitative Analysis
Methods
63
3.9 Biochemical analysis of biofilms and EPS
3.9.1 Proteins
Proteins were determined with the Lowry assay modified by Peterson (1977) using the
commercially available Lowry reagent (Sigma L3540), Folin-Ciocalteu’s phenol reagent
(Sigma F9252) and bovine serum albumin (Sigma P5619). The following reagents were
prepared according to the manufacturer’s instructions:
Lowry reagent:
The content of a vial containing 2 g Lowry reagent (composition according to the
manufacturer: 45.03 % sodium dodecyl sulfate, 38.49 % sodium carbonate, 15.13 %
lithiumhydroxide-monohydrate, 1.35 % copper-tartrate-complex) was dissolved in 40 mL
deionized water by stirring.
Folin-Ciocalteu’s phenol reagent:
18 mL Folin-Ciocalteu’s phenol reagent (composition according to the manufacturer:
61.2 % water, 12.2 % lithium sulfate, 2 % sodium tungstate dehydrate, 9.5 % hydrochloric
acid (≥ 25 %), 6.9 % phosphoric acid solution in water, 2 % sodium molybdate-dihydrate)
were mixed with 90 mL deionized water.
0.5 mL sample, deionized water (blank) or standards were mixed with 0.5 mL Lowry reagent,
weakly shaken and incubated for 20 min at room temperature. 0.25 mL Folin-Ciocalteu’s
phenol reagent were added, weakly shaken and the mixture was incubated for 30 min at
room temperature. The solutions were transferred into a semi-micro cuvette and
absorbance was measured against deionized water at 750 nm. If required, samples were
diluted in deionized water in test tubes. A 3-point calibration was carried out with BSA
standards covering a concentration range between 0 µg mL-1 (blank) and 60 µg mL-1 of
protein. The determination was performed in triplicates.
3.9.2 Carbohydrates
Carbohydrates were determined with the sulfuric acid/phenol method according to Dubois
et al. (1956). The following solutions were prepared:
Methods
64
5 % phenol solution:
25 g phenol were dissolved in 500 mL deionized water.
2.5 mL sulfuric acid (95 % - 97 %) and 0.5 mL phenol solution were added to 0.5 mL sample,
deionized water (blank) or standards. The samples were incubated for 10 min at room
temperature, further incubated in a water bath for 15 min at 30 °C and allowed to cool down
to room temperature for 5 min. The solutions were transferred into a macro cuvette and
absorbance was measured against deionized water either at 490 nm in case of neutral
polysaccharides or 480 nm in case of acidic polysaccharides. If required, samples were
diluted in deionized water in test tubes. A 3-point calibration was carried out either with
D(+)glucose standards for neutral polysaccharides or D-glucuronic acid standards for acidic
polysaccharides covering a range between 0 µg mL-1 (blank) and 75 µg mL-1 carbohydrate, or
0 µg mL-1 (blank) and 150 µg mL-1 carbohydrate, respectively. The determination was
performed in triplicates.
3.9.3 Uronic acids
Determination of uronic acids was performed according to Filisetti-Cozzi and Carpita (1991).
The following solutions were prepared:
4 M sulfamate solution:
19.42 g sulfamic acid were added to 20 ml deionized water. A saturated potassium KOH
solution was added drop wise to the solution for complete dissolution of the salts
(approximately 8 mL). The solution was allowed to cool to room temperature. The pH
value was adjusted to pH 1.6 with saturated KOH solution and the solution was filled up
to 50 mL with deionized water.
Sulfuric acid/tetraborate solution:
5.72 g di-sodium tetraborate-decahydrate was dissolved in 200 mL sulfuric acid (95 % -
97 %).
0.15 % m-hydroxybiphenyl solution:
15 mg m-hydroxybiphenyl were dissolved in 10 mL 0.5 % NaOH.
Methods
65
40 µL of sulfamate solution were added to 0.4 mL of samples, deionized water (blank) or
standards, respectively, and mixed thoroughly. 2.4 mL of sulfuric acid/tetraborate solution
were added. The solutions were shaken and then incubated in a water bath for 20 min at
98 °C. The solutions were cooled for 5 min on ice. 80 µL m-hydroxybiphenyl solution were
added, the mixtures were thoroughly stirred, and incubated for 10 min at room
temperature. Absorbance was measured with a spectrophotometer at 525 nm. If required,
samples were diluted in deionized water in test tubes. A 3-point calibration was prepared
with D-glucuronic acid standards covering a range between 0 µg mL-1 (blank) and
150 µg mL-1 uronic acid. The determination was performed in triplicates.
3.9.4 DNA
DNA was determined with the commercially available Quant-iTTM PicoGreen® dsDNA
Reagent and Kits (Invitrogen/Molecular Probes). The following reagents were prepared
according to the manufacturer’s instructions:
1 x TE buffer:
20 x TE buffer concentrate (composition: 200 mM Tris-HCl, 20 mM EDTA, pH 7.5;
Invitrogen/Molecular Probes) was diluted 20 fold in water for molecular biology (DEPC-
treated).
PicoGreen reagent:
The PicoGreen reagent concentrate was diluted 200 fold in 1 x TE buffer.
1 mL of PicoGreen reagent was added to 1 mL of sample, 1 x TE buffer or standard in single
use macro cuvettes (4 clear sides) and the mixtures were incubated for 2 min at room
temperature. Relative fluorescence was measured at an excitation wavelength of 480 nm
and an emission wavelength of 520 nm. If required, samples were diluted in TE buffer in
cuvettes. A 4-point calibration was prepared with λ-DNA (Invitrogen/Molecular Probes)
standards in TE buffer (1 x) covering a high range between 0 µg mL-1 (blank) and 2 µg mL-1
DNA, or low range between 0 µg mL-1 (blank) and 50 ng mL-1 for samples with low DNA
concentrations.
Methods
66
3.9.5 2-keto-3-deoxyoctonate (KDO)
KDO was determined according to Karkhanis et al. (1977). The following reagents were
prepared:
0.1 M H2SO4:
0.543 mL concentrated H2SO4 (98 %) were filled up to 100 mL with deionized water.
0.04 M HIO4 in 0.0625 M H2SO4:
0.912 g HIO4 were added to 0.34 mL concentrated H2SO4 (98 %) and filled up to 100 mL
with deionized water.
2.6 % (w/v) NaAsO2 in 0.5 M HCl:
4.2 mL concentrated HCl (36 %) were added to 2.6 g NaAsO2 and filled up to 100 mL with
deionized water.
0.6 % thiobarbituric acid (TBA):
0.6 g TBA were dissolved in 100 mL deionized water.
0.25 mL sample, deionized water (blank) or standards were mixed with 0.25 mL 0.1 M H2SO4
and heated at 100 °C for 30 min. The suspensions were allowed to cool to room temperature
and centrifuged at 8,000 x g for 5 min. 0.25 mL were transferred into a new 2 mL Eppendorf
tube, mixed with 0.125 mL 0.04 M HIO4 in 0.0625 M H2SO4 and incubated for 20 min at room
temperature. 0.125 mL 2.6 % NaAsO2 in 0.5 M HCl were added and mixed until the brown
color disappeared. The sample suspensions were mixed with 0.25 mL 0.6 % TBA, heated at
100 °C for 15 min and, while still hot, mixed with 0.5 mL DMSO. The samples were allowed
to cool to room temperature before absorbance was measured with a spectrophotometer at
548 nm. A 3-point calibration was prepared with KDO standards covering a range between
0 µg mL-1 (blank) and 30 µg mL-1 KDO. The determination was performed in duplicates.
3.10 Enzyme activity measurements
3.10.1 Glucose-6-phosphate dehydrogenase activity
Suspensions of 14 d-old drinking-water biofilms, drinking-water biofilm cell extracts and EPS
isolated by shaking or CER treatment were analyzed for presence of activity of the strictly
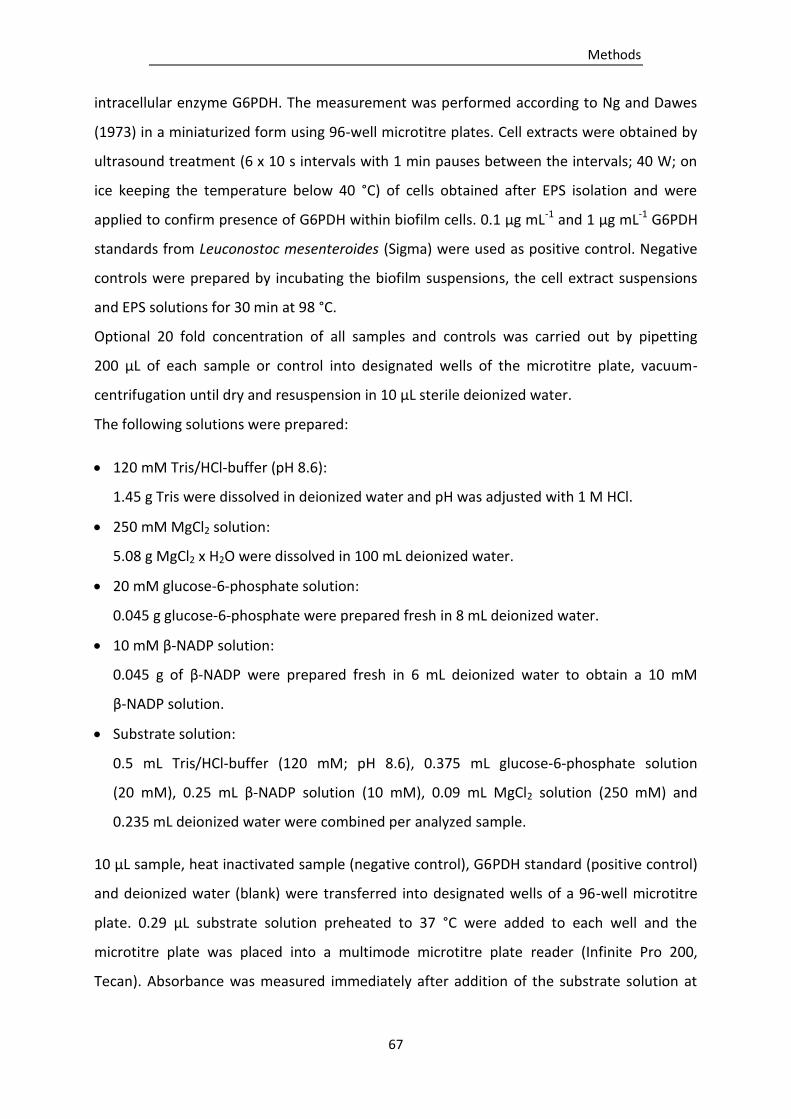
Methods
67
intracellular enzyme G6PDH. The measurement was performed according to Ng and Dawes
(1973) in a miniaturized form using 96-well microtitre plates. Cell extracts were obtained by
ultrasound treatment (6 x 10 s intervals with 1 min pauses between the intervals; 40 W; on
ice keeping the temperature below 40 °C) of cells obtained after EPS isolation and were
applied to confirm presence of G6PDH within biofilm cells. 0.1 µg mL-1 and 1 µg mL-1 G6PDH
standards from Leuconostoc mesenteroides (Sigma) were used as positive control. Negative
controls were prepared by incubating the biofilm suspensions, the cell extract suspensions
and EPS solutions for 30 min at 98 °C.
Optional 20 fold concentration of all samples and controls was carried out by pipetting
200 µL of each sample or control into designated wells of the microtitre plate, vacuum-
centrifugation until dry and resuspension in 10 µL sterile deionized water.
The following solutions were prepared:
120 mM Tris/HCl-buffer (pH 8.6):
1.45 g Tris were dissolved in deionized water and pH was adjusted with 1 M HCl.
250 mM MgCl2 solution:
5.08 g MgCl2 x H2O were dissolved in 100 mL deionized water.
20 mM glucose-6-phosphate solution:
0.045 g glucose-6-phosphate were prepared fresh in 8 mL deionized water.
10 mM β-NADP solution:
0.045 g of β-NADP were prepared fresh in 6 mL deionized water to obtain a 10 mM
β-NADP solution.
Substrate solution:
0.5 mL Tris/HCl-buffer (120 mM; pH 8.6), 0.375 mL glucose-6-phosphate solution
(20 mM), 0.25 mL β-NADP solution (10 mM), 0.09 mL MgCl2 solution (250 mM) and
0.235 mL deionized water were combined per analyzed sample.
10 µL sample, heat inactivated sample (negative control), G6PDH standard (positive control)
and deionized water (blank) were transferred into designated wells of a 96-well microtitre
plate. 0.29 µL substrate solution preheated to 37 °C were added to each well and the
microtitre plate was placed into a multimode microtitre plate reader (Infinite Pro 200,
Tecan). Absorbance was measured immediately after addition of the substrate solution at
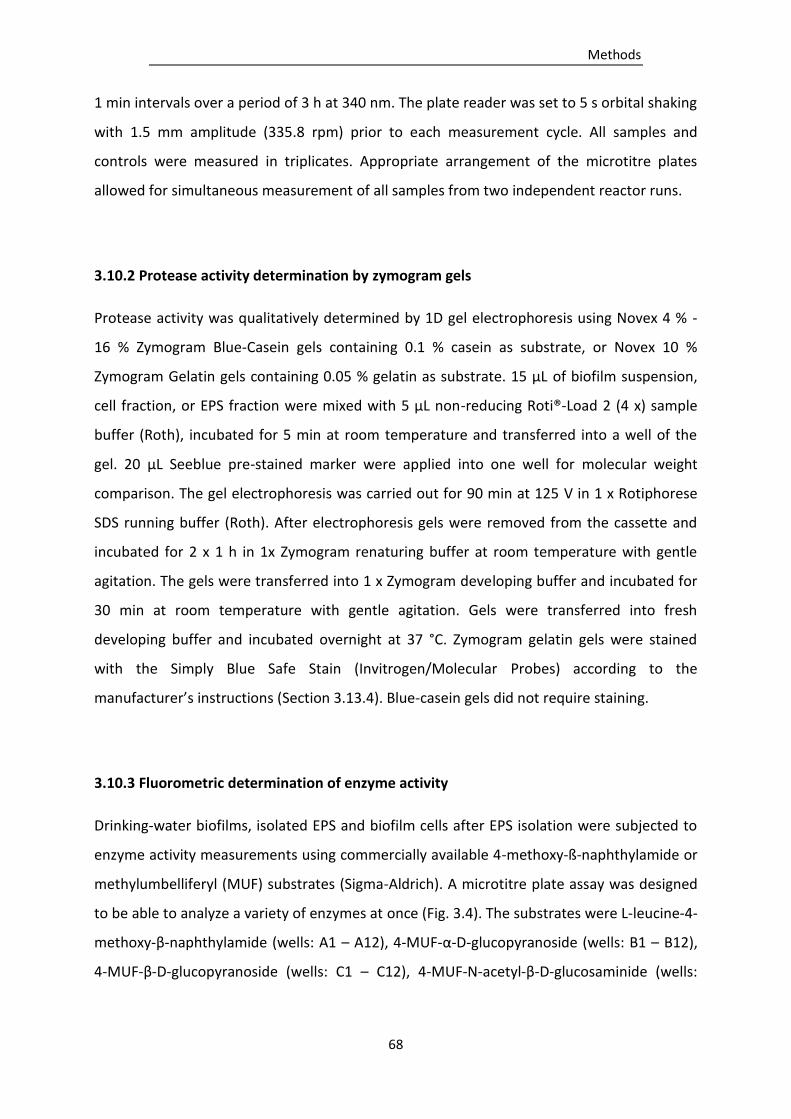
Methods
68
1 min intervals over a period of 3 h at 340 nm. The plate reader was set to 5 s orbital shaking
with 1.5 mm amplitude (335.8 rpm) prior to each measurement cycle. All samples and
controls were measured in triplicates. Appropriate arrangement of the microtitre plates
allowed for simultaneous measurement of all samples from two independent reactor runs.
3.10.2 Protease activity determination by zymogram gels
Protease activity was qualitatively determined by 1D gel electrophoresis using Novex 4 % -
16 % Zymogram Blue-Casein gels containing 0.1 % casein as substrate, or Novex 10 %
Zymogram Gelatin gels containing 0.05 % gelatin as substrate. 15 µL of biofilm suspension,
cell fraction, or EPS fraction were mixed with 5 µL non-reducing Roti®-Load 2 (4 x) sample
buffer (Roth), incubated for 5 min at room temperature and transferred into a well of the
gel. 20 µL Seeblue pre-stained marker were applied into one well for molecular weight
comparison. The gel electrophoresis was carried out for 90 min at 125 V in 1 x Rotiphorese
SDS running buffer (Roth). After electrophoresis gels were removed from the cassette and
incubated for 2 x 1 h in 1x Zymogram renaturing buffer at room temperature with gentle
agitation. The gels were transferred into 1 x Zymogram developing buffer and incubated for
30 min at room temperature with gentle agitation. Gels were transferred into fresh
developing buffer and incubated overnight at 37 °C. Zymogram gelatin gels were stained
with the Simply Blue Safe Stain (Invitrogen/Molecular Probes) according to the
manufacturer’s instructions (Section 3.13.4). Blue-casein gels did not require staining.
3.10.3 Fluorometric determination of enzyme activity
Drinking-water biofilms, isolated EPS and biofilm cells after EPS isolation were subjected to
enzyme activity measurements using commercially available 4-methoxy-ß-naphthylamide or
methylumbelliferyl (MUF) substrates (Sigma-Aldrich). A microtitre plate assay was designed
to be able to analyze a variety of enzymes at once (Fig. 3.4). The substrates were L-leucine-4-
methoxy-β-naphthylamide (wells: A1 – A12), 4-MUF-α-D-glucopyranoside (wells: B1 – B12),
4-MUF-β-D-glucopyranoside (wells: C1 – C12), 4-MUF-N-acetyl-β-D-glucosaminide (wells:

Methods
69
D1 – D12), 4-MUF-stearate (wells: E1 – E12), 4-MUF-butyrate (wells: F1 – F12) and 4-MUF-
phosphate (wells: G1 – G12).
2 mM substrate stock solutions were prepared in 2-methoxyethanol. 10 µL of each substrate
were transferred into designated wells of a microtitre plate (Fig. 3.4). 190 µL of biofilm
suspension (wells: A1 – G3), biofilm cells (wells: A4 – G6), or EPS (wells: A7 – G9) were added
into designated wells and mixed thoroughly by aspiration. Heat inactivated controls were
run using biofilms (wells: A10 – G10), biofilm cells (wells: A11 – G11), or EPS (wells: A12 –
G12), which were previously treated at 98 °C for 30 min. No substrate controls were
measured using 10 µL of 2-methoxyethanol without substrate and 190 µL of biofilm
suspension (well: H8), biofilm cells (well: H9), or EPS (well: H10).
Figure 3.4: Pipetting scheme used for the fluorometric determination of enzyme activity in a microtitre plate format. MUF, methylumbelliferyl.
3-point calibrations were performed using methylumbelliferone (wells: H2 – H4) or 4-
methoxy-ß-naphthylamide (wells: H5 – H7) covering a range of 0 mM (blank; well H1) to
200 mM or 0 mM (blank; well H1) to 100 mM, respectively. The arrangement of the
microtitre plate allowed for a simultaneous triplicate determination of enzyme activities of
seven enzyme classes in a biofilm sample, biofilm cells and isolated EPS. Fluorescence was
measured immediately after addition of samples with a multimode microtitre plate reader
Substrates
1 2 3 4 5 7 8 9 10 11 6 12
A
B
C
D
E
F
G
H
Biofilm Cells EPS
Heat inactivated
controls
Biofilm, Cells, EPS
Biofilm, Cells, EPS
No substrate
controls
Methylumbelli-
ferone
standards
4-methoxy-ß-
naphtylamid
standards
Blank
(2-methoxy-
ethanol)
L-alanine-4-methoxy-β-naphthylamide
4-MUF-α-D-glucopyranoside
4-MUF-β-D-glucopyranoside
4-MUF-N-acetyl-β-D-glucosaminide
4-MUF-stearate
4-MUF-butyrate
4-MUF-phosphate
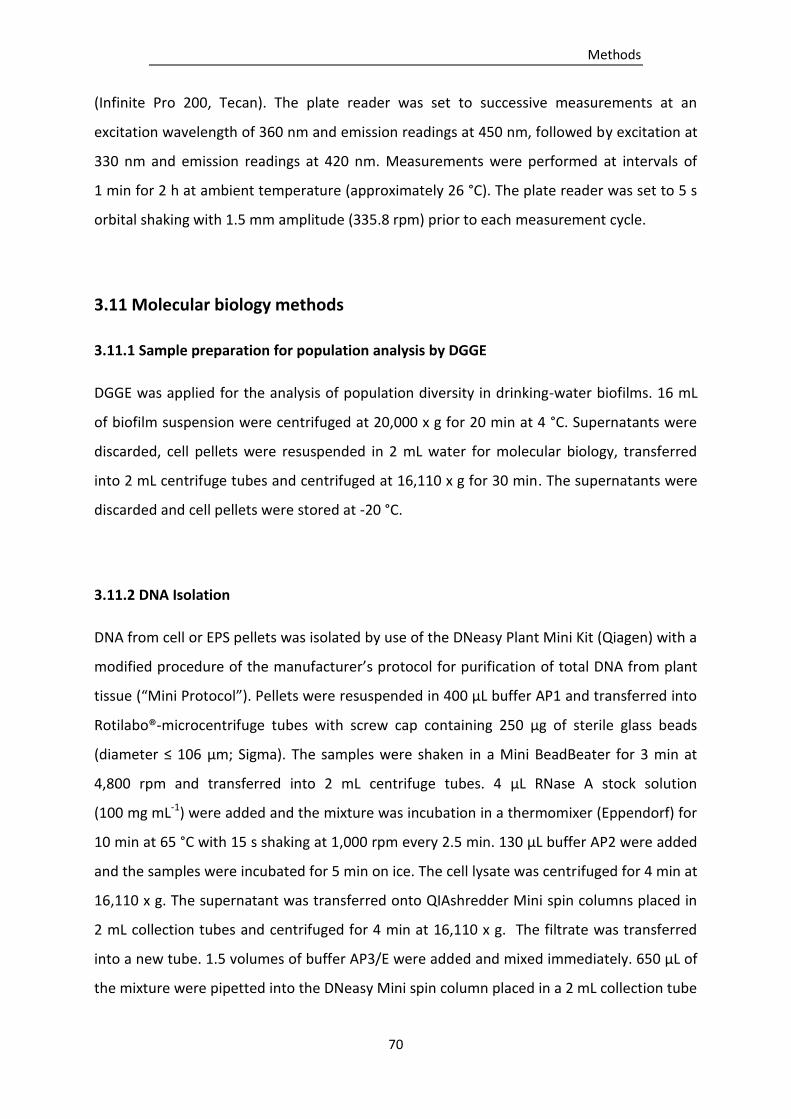
Methods
70
(Infinite Pro 200, Tecan). The plate reader was set to successive measurements at an
excitation wavelength of 360 nm and emission readings at 450 nm, followed by excitation at
330 nm and emission readings at 420 nm. Measurements were performed at intervals of
1 min for 2 h at ambient temperature (approximately 26 °C). The plate reader was set to 5 s
orbital shaking with 1.5 mm amplitude (335.8 rpm) prior to each measurement cycle.
3.11 Molecular biology methods
3.11.1 Sample preparation for population analysis by DGGE
DGGE was applied for the analysis of population diversity in drinking-water biofilms. 16 mL
of biofilm suspension were centrifuged at 20,000 x g for 20 min at 4 °C. Supernatants were
discarded, cell pellets were resuspended in 2 mL water for molecular biology, transferred
into 2 mL centrifuge tubes and centrifuged at 16,110 x g for 30 min. The supernatants were
discarded and cell pellets were stored at -20 °C.
3.11.2 DNA Isolation
DNA from cell or EPS pellets was isolated by use of the DNeasy Plant Mini Kit (Qiagen) with a
modified procedure of the manufacturer’s protocol for purification of total DNA from plant
tissue (“Mini Protocol”). Pellets were resuspended in 400 µL buffer AP1 and transferred into
Rotilabo®-microcentrifuge tubes with screw cap containing 250 µg of sterile glass beads
(diameter ≤ 106 µm; Sigma). The samples were shaken in a Mini BeadBeater for 3 min at
4,800 rpm and transferred into 2 mL centrifuge tubes. 4 µL RNase A stock solution
(100 mg mL-1) were added and the mixture was incubation in a thermomixer (Eppendorf) for
10 min at 65 °C with 15 s shaking at 1,000 rpm every 2.5 min. 130 µL buffer AP2 were added
and the samples were incubated for 5 min on ice. The cell lysate was centrifuged for 4 min at
16,110 x g. The supernatant was transferred onto QIAshredder Mini spin columns placed in
2 mL collection tubes and centrifuged for 4 min at 16,110 x g. The filtrate was transferred
into a new tube. 1.5 volumes of buffer AP3/E were added and mixed immediately. 650 µL of
the mixture were pipetted into the DNeasy Mini spin column placed in a 2 mL collection tube
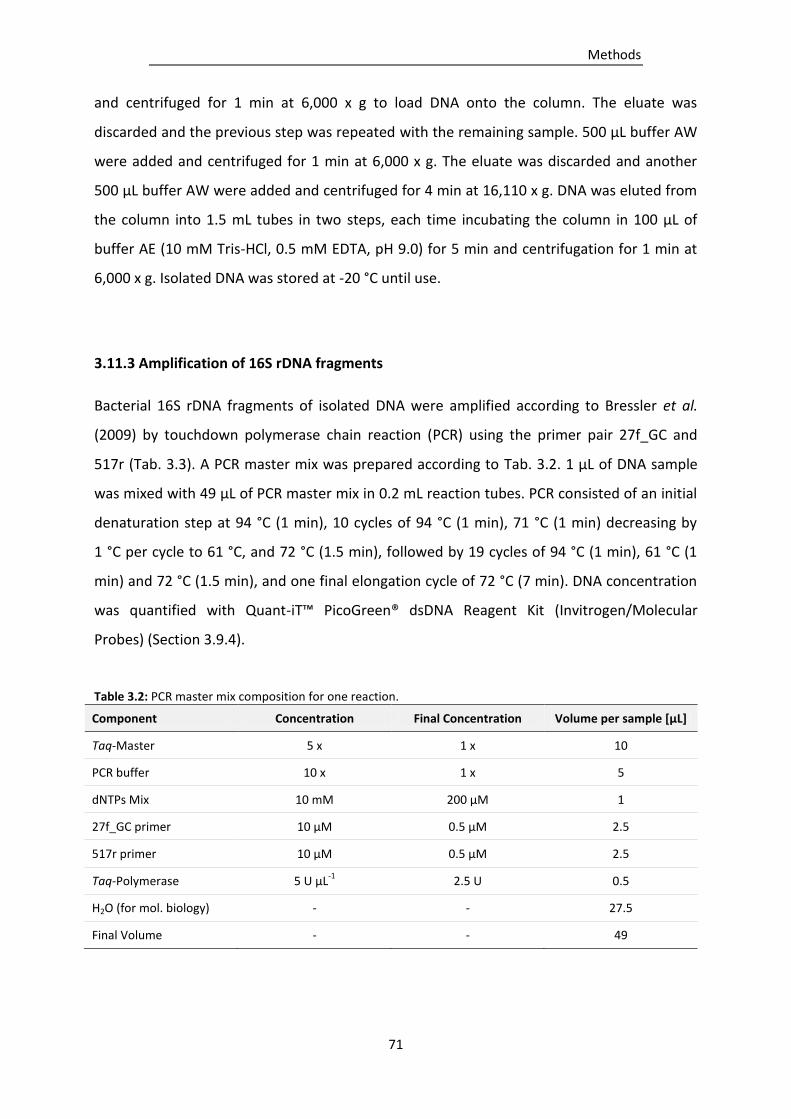
Methods
71
and centrifuged for 1 min at 6,000 x g to load DNA onto the column. The eluate was
discarded and the previous step was repeated with the remaining sample. 500 µL buffer AW
were added and centrifuged for 1 min at 6,000 x g. The eluate was discarded and another
500 µL buffer AW were added and centrifuged for 4 min at 16,110 x g. DNA was eluted from
the column into 1.5 mL tubes in two steps, each time incubating the column in 100 µL of
buffer AE (10 mM Tris-HCl, 0.5 mM EDTA, pH 9.0) for 5 min and centrifugation for 1 min at
6,000 x g. Isolated DNA was stored at -20 °C until use.
3.11.3 Amplification of 16S rDNA fragments
Bacterial 16S rDNA fragments of isolated DNA were amplified according to Bressler et al.
(2009) by touchdown polymerase chain reaction (PCR) using the primer pair 27f_GC and
517r (Tab. 3.3). A PCR master mix was prepared according to Tab. 3.2. 1 µL of DNA sample
was mixed with 49 µL of PCR master mix in 0.2 mL reaction tubes. PCR consisted of an initial
denaturation step at 94 °C (1 min), 10 cycles of 94 °C (1 min), 71 °C (1 min) decreasing by
1 °C per cycle to 61 °C, and 72 °C (1.5 min), followed by 19 cycles of 94 °C (1 min), 61 °C (1
min) and 72 °C (1.5 min), and one final elongation cycle of 72 °C (7 min). DNA concentration
was quantified with Quant-iT™ PicoGreen® dsDNA Reagent Kit (Invitrogen/Molecular
Probes) (Section 3.9.4).
Table 3.2: PCR master mix composition for one reaction.
Component Concentration Final Concentration Volume per sample [µL]
Taq-Master 5 x 1 x 10
PCR buffer 10 x 1 x 5
dNTPs Mix 10 mM 200 µM 1
27f_GC primer 10 µM 0.5 µM 2.5
517r primer 10 µM 0.5 µM 2.5
Taq-Polymerase 5 U µL-1
2.5 U 0.5
H2O (for mol. biology) - - 27.5
Final Volume - - 49
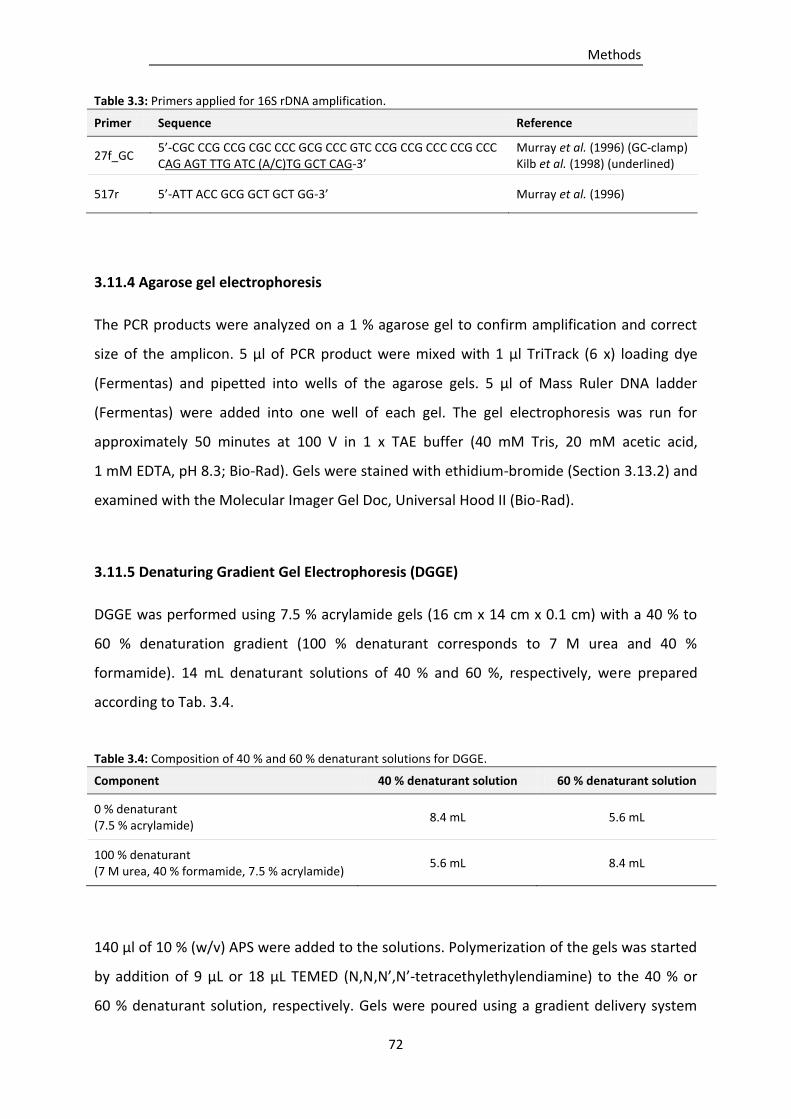
Methods
72
Table 3.3: Primers applied for 16S rDNA amplification.
Primer Sequence Reference
27f_GC 5’-CGC CCG CCG CGC CCC GCG CCC GTC CCG CCG CCC CCG CCC CAG AGT TTG ATC (A/C)TG GCT CAG-3’
Murray et al. (1996) (GC-clamp) Kilb et al. (1998) (underlined)
517r 5’-ATT ACC GCG GCT GCT GG-3’ Murray et al. (1996)
3.11.4 Agarose gel electrophoresis
The PCR products were analyzed on a 1 % agarose gel to confirm amplification and correct
size of the amplicon. 5 µl of PCR product were mixed with 1 µl TriTrack (6 x) loading dye
(Fermentas) and pipetted into wells of the agarose gels. 5 µl of Mass Ruler DNA ladder
(Fermentas) were added into one well of each gel. The gel electrophoresis was run for
approximately 50 minutes at 100 V in 1 x TAE buffer (40 mM Tris, 20 mM acetic acid,
1 mM EDTA, pH 8.3; Bio-Rad). Gels were stained with ethidium-bromide (Section 3.13.2) and
examined with the Molecular Imager Gel Doc, Universal Hood II (Bio-Rad).
3.11.5 Denaturing Gradient Gel Electrophoresis (DGGE)
DGGE was performed using 7.5 % acrylamide gels (16 cm x 14 cm x 0.1 cm) with a 40 % to
60 % denaturation gradient (100 % denaturant corresponds to 7 M urea and 40 %
formamide). 14 mL denaturant solutions of 40 % and 60 %, respectively, were prepared
according to Tab. 3.4.
Table 3.4: Composition of 40 % and 60 % denaturant solutions for DGGE.
Component 40 % denaturant solution 60 % denaturant solution
0 % denaturant (7.5 % acrylamide)
8.4 mL 5.6 mL
100 % denaturant (7 M urea, 40 % formamide, 7.5 % acrylamide)
5.6 mL 8.4 mL
140 µl of 10 % (w/v) APS were added to the solutions. Polymerization of the gels was started
by addition of 9 µL or 18 µL TEMED (N,N,N’,N’-tetracethylethylendiamine) to the 40 % or
60 % denaturant solution, respectively. Gels were poured using a gradient delivery system
Methods
73
(Model 475, Bio-Rad), overlaid with aqueous 2-butanol and allowed to polymerize for 3 to 4
hours. After polymerization the 2-butanol phase was removed and a stacking gel (5 mL 7.5 %
acrylamide, 60 µL 10 % APS, 6 µL TEMED) was poured on top of the separating gel and
allowed to polymerize. Samples were mixed with TriTrack (6 x) loading dye (Fermentas) and
volumes containing 500 ng – 750 ng of DNA were loaded into the wells of the gel.
Electrophoresis was carried out for 17 hours at 70 V and 58 °C in 1 x TAE buffer (Bio-Rad) in a
DCode™ Universal Mutation Detection System (Bio-Rad). The gels were stained either with
the silver staining protocol according to Blum et al. (1987) (Section 3.13.3) or with Sybr®Gold
(Invitrogen/Molecular Probes) (Section 3.13.5).
DGGE band patterns were evaluated by counting the number of bands of each sample.
Similarity of band patterns was analyzed by calculating the Dice coefficient Cs according to
the following equation:
Cs = 2j / (a + b)
With: j = number of similar bands in two samples (A and B)
a = number of samples in sample A
b = number of samples in sample B
3.11.6 Fluorescence in situ hybridization
Detection of P. aeruginosa in drinking-water biofilms by FISH was performed by use of the
Psae 16S-182 probe (Wellinghausen et al., 2005). 2 mL of the drinking-water biofilm
suspension were transferred into 2 mL Eppendorf tubes and centrifuged for 10 min at
6,000 x g and 4 °C. The supernatant was discarded and the cells were resuspended in 2 mL
4 % paraformaldehyde in phosphate-buffered saline (PBS, pH 7.2). The suspension was
incubated for 1 h at 4 °C. The cell suspension was centrifuged for 5 min at 6,000 x g and 4 °C.
The supernatant was discarded and the cell pellet was washed with 2 mL PBS. The cell
suspension was centrifuged for 5 min at 6,000 x g and 4 °C. The supernatant was discarded
and the cells were resuspended in a 1:1 (v/v) mixture of PBS and ethanol and stored at -20 °C
until further use. 10 µL of the fixed sample were pipetted into a well of an epoxy-coated
Methods
74
8-well diagnostic slide (Thermo Scientific) and air-dried. The slide was successively
submerged in 50 %, 80 % and 96 % ethanol solutions for 3 min each for dehydration and air-
dried. The fixed and dehydrated cells were hybridized by addition of 10 µL hybridization
buffer containing 5 µg mL-1 of the Psae 16S-182 probe. Hybridization was carried out in a
humid reaction chamber (Vermicon) for 90 min at 46 °C. The slide was transferred into a
reaction chamber containing 25 mL washing buffer, preheated to 46 °C, and incubated for
15 min at 46 °C to remove unbound probe. The slides were washed with deionized water
and air-dried. Cells were counterstained by addition of 10 µL DAPI (1 µg mL-1) solution to the
sample and incubation for 20 min at room temperature in the dark. The slides were washed
in deionized water and stored at 4 °C until enumeration. Enumeration of cells was carried
out with an epifluorescence microscope (Laborlux S; Leitz Germany) at 1,000 fold
magnification (Objective: PL Fluotar; 100x/1.32 oil; PHACO 3) with the help of a counting grid
(100 µm x 100 µm). FISH-positive and DAPI stained cells were enumerated in the same 20
randomly chosen fields of view successively applying the Cy3 and DAPI filter, respectively.
The ratio of FISH-positive and DAPI stained cells was determined, and concentration of FISH-
positive cells was calculated by multiplication of the ratio with total cell counts as
determined by the DAPI method as described in Section 3.7.1.
3.12 Analysis of proteins by 2D gel electrophoresis
3.12.1 Sample preparation
EPS proteins of drinking-water biofilms were separated by 2D gel electrophoresis (2DE). EPS
samples isolated from drinking-water biofilms as described in Section 3.8 required additional
preparatory steps, since preliminary experiments showed that eDNA and high contents of
inorganic cations interfered with the isoelectric focusing step of the 2DE (Fig. 4.6). EPS
solutions were treated with the DNase Benzonase to remove interference caused by eDNA.
1 mL Benzonase buffer (500 mM Tris, 10 mM MgCl2, pH 8, filter sterilized) were added to
9 mL aliquots of EPS solution. 10 µL of Benzonase (from Serratia marcescens; purity > 99 %;
Novagen) corresponding to final concentration of 65 U mL-1 were added, mixed thoroughly
and incubated at 37 °C for 1 h. Preliminary experiments indicated that these conditions
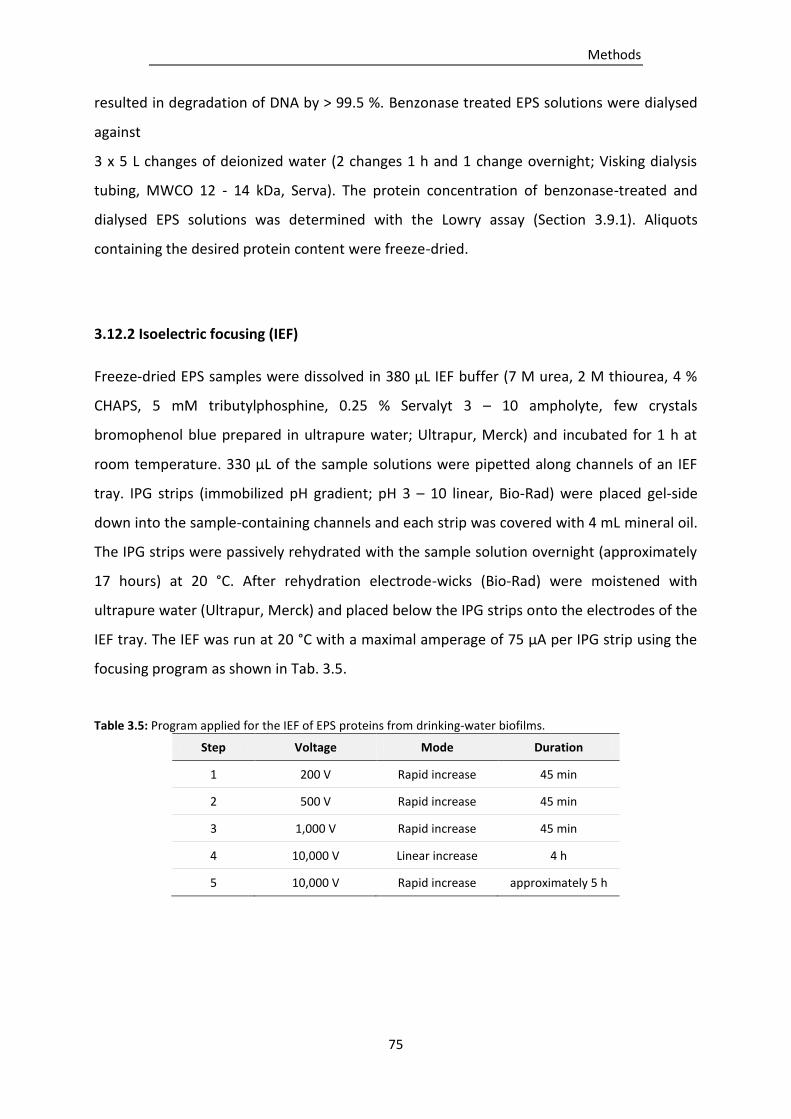
Methods
75
resulted in degradation of DNA by > 99.5 %. Benzonase treated EPS solutions were dialysed
against
3 x 5 L changes of deionized water (2 changes 1 h and 1 change overnight; Visking dialysis
tubing, MWCO 12 - 14 kDa, Serva). The protein concentration of benzonase-treated and
dialysed EPS solutions was determined with the Lowry assay (Section 3.9.1). Aliquots
containing the desired protein content were freeze-dried.
3.12.2 Isoelectric focusing (IEF)
Freeze-dried EPS samples were dissolved in 380 µL IEF buffer (7 M urea, 2 M thiourea, 4 %
CHAPS, 5 mM tributylphosphine, 0.25 % Servalyt 3 – 10 ampholyte, few crystals
bromophenol blue prepared in ultrapure water; Ultrapur, Merck) and incubated for 1 h at
room temperature. 330 µL of the sample solutions were pipetted along channels of an IEF
tray. IPG strips (immobilized pH gradient; pH 3 – 10 linear, Bio-Rad) were placed gel-side
down into the sample-containing channels and each strip was covered with 4 mL mineral oil.
The IPG strips were passively rehydrated with the sample solution overnight (approximately
17 hours) at 20 °C. After rehydration electrode-wicks (Bio-Rad) were moistened with
ultrapure water (Ultrapur, Merck) and placed below the IPG strips onto the electrodes of the
IEF tray. The IEF was run at 20 °C with a maximal amperage of 75 µA per IPG strip using the
focusing program as shown in Tab. 3.5.
Table 3.5: Program applied for the IEF of EPS proteins from drinking-water biofilms.
Step Voltage Mode Duration
1 200 V Rapid increase 45 min
2 500 V Rapid increase 45 min
3 1,000 V Rapid increase 45 min
4 10,000 V Linear increase 4 h
5 10,000 V Rapid increase approximately 5 h
Methods
76
The IEF was carried out until approximately 75 kVh were reached. Electrode-wicks were
exchanged regularly (at least between each step) to allow desalting the samples and
enhance current flow. Each step of the program was monitored and if necessary extended
until the amperage was below 45 µA per IPG strip prior to switching to the next step. IPG
strips were either directly applied for 2nd dimension separation of proteins or stored at
-20 °C for up to 1 week.
3.12.3 Preparation of SDS-Tris-glycine gels
Proteins were separated by size in the 2nd dimension on 12 % polyacrylamide SDS-Tris-
glycine gels. Cassettes each composed of a pair of glass plates, 1 mm spacers and screw
clamps were thoroughly cleaned with deionized water and acetone and assembled. Per gel
(20 cm x 20 cm) 17 mL deionized water, 12.5 mL 1.5 M Tris/HCl pH 8.8, 20 mL 30 % (w/v)
acrylamide/bisacrylamide solution (ratio 29:1), 0.5 mL 10 % (w/v) SDS, 25 µL TEMED and
75 µL 40 % (w/v) APS were prepared and poured in the space formed between the plates of
the cassette. 3 mL water-saturated 2-butanol were pipetted on top of the gel to form an
even surface and to protect the gels from drying. The gels were allowed to polymerize for
3 h at room temperature and stored overnight at 4 °C.
3.12.4 Gel electrophoresis of EPS proteins
IPG strips were equilibrated on a rocking platform (WT 15, Biometra) set to slight tilting for
10 min submerged in 10 mL equilibration buffer (6 M urea, 30 % glycerol, 2 % SDS, 50 mM
Tris/HCl pH 8.8) containing 0.1 g dithiothreitol in the first step and for another 10 min in
equilibration buffer containing 0.5 g iodoacetamide in the second step.
Residual 2-butanol was removed from the gel surface and the surface was washed three
times with 1 x SDS-Tris-glycine running buffer (0.192 M glycine, 0.025 M Tris, 0.1 % (w/v)
SDS; Roth). Equilibrated IPG strips were briefly washed in the running buffer and applied
onto of the upper gel surface. An electrode-wick was wetted with 5 µL protein marker
(Mark12, Invitrogen) and placed in a corner on the gel surface. The IPG strip and the
electrode-wick were fixed with 0.5 % (w/v) agarose containing a few crystals of
Methods
77
bromophenol blue, avoiding entrapment of air. Electrophoresis was performed at 20 mA per
gel for 45 min, followed by 35 mA per gel for 4.5 h in a Protean II Xi cell (Bio-Rad) and
1 x SDS-Tris-glycine running buffer (Roth). Gels were stained with the Coomassie-Brilliant
Blue protocol (Kang et al., 2002), SyproRuby protocol, or according to the silver staining
protocol by Blum et al. (1987) (Section 3.13).
3.12.5 MALDI-TOF-MS
MALDI-TOF-MS was applied to identify EPS proteins which were previously separated by
2DE. The analysis required a clean-up and trypsin digestion of the selected protein spots
using the following solutions and steps.
Solutions:
30 mM potassium-hexacyanoferrate
0.198 g K3[Fe(CN)6] were dissolved in 20 mL double distilled water
100 mM sodium thiosulfate
0.496 g Na2S2O3 were dissolved in 20 mL double distilled water
10 mM ammonium hydrogencarbonate buffer
77 mg NH4HCO3 were dissolved in 100 mL double distilled water. The solution was
prepared fresh on the day of clean-up.
5 mM dithiothreitol in 10 mM ammonium hydrogencarbonate
15.4 mg dithiothreitol were dissolved in 20 mL 10 mM NH4HCO3 buffer. The solution was
prepared fresh on the day of clean-up.
55 mM iodoacetamide in 10 mM ammonium hydrogencarbonate
102 mg iodoacetamide were dissolved in 10 mL 10 mM NH4HCO3 buffer. The solution was
prepared fresh on the day of clean-up
Acetonitrile
25 ng µL-1 trypsin working solution
A 100 ng µl-1 trypsin (from porcine pancreas, Promega) stock solution was prepared in
1 mM acetic acid. The stock solution was diluted 4 fold in 10 mM NH4HCO3 buffer
immediately prior to use.
Matrix solution
Methods
78
10 mg mL-1 a-cyano-4-hydroxycinnamon acid (CHCA) were prepared in acetonitrile and
0.1 % trifluoroacetic acid.
Calibration standard
The mass standards kit for the 4700 proteomics analyzer (Applied Biosystems, 4333604)
was used for calibration. The calibration mixture was composed of β-galactosidase
digested des-Arg1-Bradykinin, Angiotensin I, Glu1-Fibrinopeptide B, ACTH (1-17) and
ACTH (18-39) suspended in a CHCA matrix.
Sample clean-up and digestion:
All instruments were thoroughly rinsed with acetone and allowed to dry. 1 mL single use
plastic pipette tips were used to excise spots from the 2D gels. Before use the pipette tips
were cut to obtain an opening of approximately 2 mm in diameter. Excised gel plugs were
transferred into 1.5 mL Eppendorf tubes. 50 µL of a 10 % acetic acid solution were added
and the gel plugs were stored at 4 °C until clean-up. The clean-up was carried out in a
heating block set to 21 °C and 500 rpm shaking if not otherwise indicated. Solutions were
removed between each step.
1. The gel plugs were washed twice in 50 µL of a 1:2 (v/v) K3[Fe(CN)6] and Na2S2O3 solution
for 10 min.
2. The gel plugs were washed 3 x in 400 µL double distilled water for 10 min and the water
was discarded.
3. 50 µL of NH4HCO3 buffer were added and the gel plugs were incubated for 10 min.
4. The gel plugs were destained for 10 min with 50 µL of a 1:1 (v/v) mixture of acetonitrile
and NH4HCO3.
5. Proteins within the gel plugs were reduced in 50 µL of the dithiothreitol/NH4HCO3
solution for 15 min at 60 °C.
6. Proteins within the gel plugs were alkylated by incubation in 50 µL of the
iodoacetamide/NH4HCO3 solution for 15 min.
7. The gel plugs were washed in 50 µL NH4HCO3 solution for 10 min.
8. The gel plugs were destained in 50 µL acetonitrile/NH4HCO3 solution for 10 min.
9. Steps 7. and 8. were repeated twice.
10. The gel plugs were dried in a vacuum centrifuge set to 45 °C.
Methods
79
11. 5 µL of trypsin working solution were added and allowed to be soaked into the gel.
10 µL NH4HCO3 buffer were added on top and the samples were incubated overnight.
Peptides were released from the gels into the buffer by 10 min of ultrasound treatment
in an ultrasound bath.
MALDI-TOF-MS and data acquisition:
1. 0.5 µL of sample were mixed with 0.5 µL matrix-solution. 2 x 0.5 µL were pipetted onto
two MALDI targets and allowed to dry.
2. 0.5 µL of the calibration standard were applied onto the designated MALDI targets and
allowed to dry.
3. MS-spectra were acquired with a MALDI-TOF/TOF-MS 4800 Proteomics Analyzer set to
laser intensity of 2900 mW, 500 total shots per spectrum, mass range 800 – 4000 Da,
mass focus 2000 Da, MS reflector positive, acquisition control automatic.
4. MS-data were processed with the AB SCIEX Data Explorer software.
5. Protein identification was carried out with the Mascot – peptide mass fingerprint
software (Matrix Science; Perkins et al. 1999) using the NCBInr database, choosing
trypsin as enzyme, carbamidomethyl (C) as fixed modification, peptide tolerance of
± 0.15 Da, MH+ mass values and allowing up to 1 missed cleavage. Protein mass was
given by the Mascot software.
6. Theoretical pI were determined with the help of the Compute pI/Mw software (ExPASy
Bioinformatics Resource Portal; http://web.expasy.org/compute_pi/). Allocation of
proteins was predicted using the CELLO v.2.5: subCELlular LOcalization predictor
software (Molecular Bioinformatics Center, National Chiao Tung University;
http://cello.life.nctu.edu.tw/).
Optional enrichment of peptides:
In case of low MS-signal intensities trypsin digested samples were enriched using ZipTip C18
pipette tips (Millipore). Prior to use the C18 bed was successively conditioned by 3 x
aspirating and dispensing of 10 µL volumes of acetonitrile, followed by 3 x aspirating and
dispensing 10 µL volumes of 50 % acetonitrile/0.1 % trifluoroacetic acid solution and 3 x
aspirating and dispensing of 10 µL volumes 0.1 % trifluoroacetic acid. Tryptic digests were
Methods
80
loaded onto the C18 bed by aspirating and dispensing the sample (obtained in step 11 of
sample clean-up and digestion) 10 times. The peptides were eluted by aspirating 2 µL of
matrix solution and dispensing equal volumes (approximately 1 µL) onto two MALDI targets.
3.13 Gel staining and image acquisition
3.13.1 Coomassie Brilliant Blue staining
Gels were stained according to an improved Coomassie Brilliant Blue (CBB-G250) protocol
developed by Kang et al. (2002). Proteins were fixed by incubating the gels in 500 mL 30 %
ethanol containing 2 % phosphoric acid for 1 h. Gels were stained overnight in 500 mL
staining solution composed of 0.02 % CBB-G250, 2 % (w/v) phosphoric acid, 5 % aluminum
sulfate and 10 % ethanol. All staining steps were performed in plastic containers at slight
shaking on a rocking platform at room temperature. Gels were scanned with the Imaging
Densitometer GS-700 (Bio-Rad).
3.13.2 Ethidium bromide staining
Agarose gels were stained in a 1 L ethidium bromide bath (1 µg mL-1) for 15 min, followed by
destaining for up to 5 min in deionized water. The staining was carried out in containers with
lid made of stainless steel. The gels were examined with the Molecular Imager Gel Doc,
Universal Hood II (Bio-Rad).
3.13.3 Silver staining
Silver staining of gels was performed according to the protocol described by Blum et al.
(1987) and shown in Tab. 3.6. 400 mL of each solution were prepared fresh in deionized
water. All staining steps were performed in plastic containers at slight shaking on a rocking
platform at room temperature. Gel images were taken with the Imaging Densitometer GS-
700 (Bio-Rad).
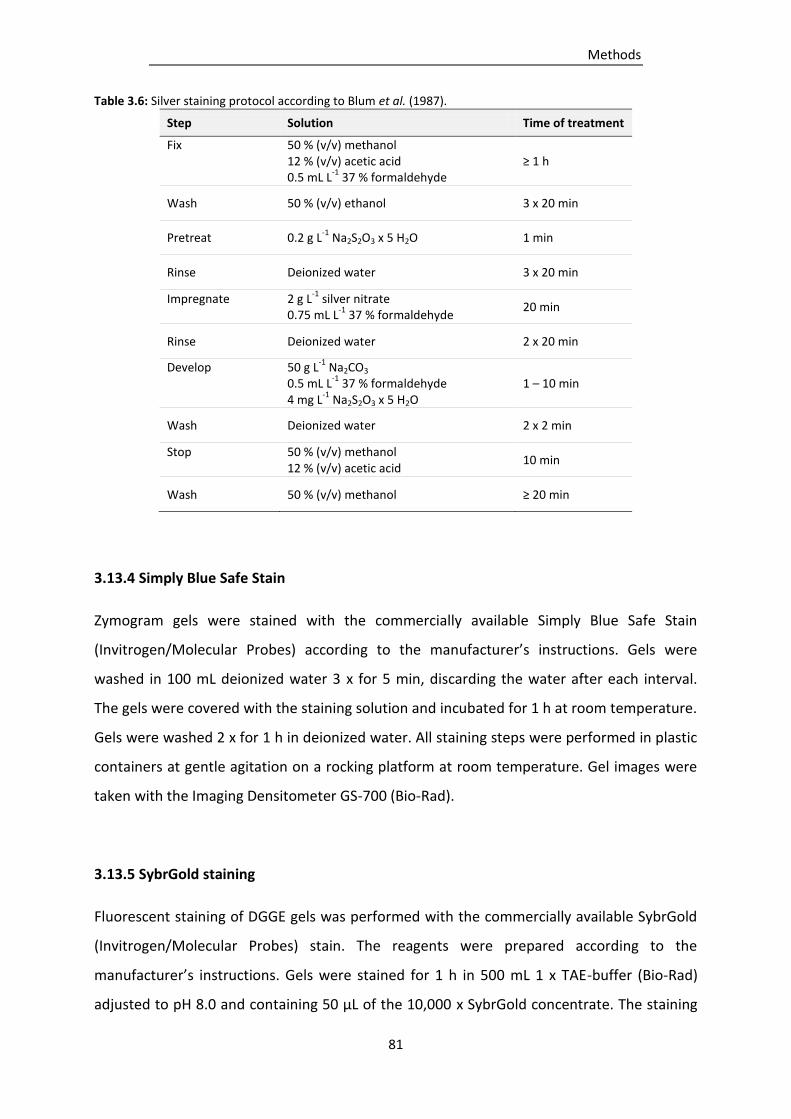
Methods
81
Table 3.6: Silver staining protocol according to Blum et al. (1987).
Step Solution Time of treatment
Fix
50 % (v/v) methanol 12 % (v/v) acetic acid 0.5 mL L
-1 37 % formaldehyde
≥ 1 h
Wash 50 % (v/v) ethanol 3 x 20 min
Pretreat 0.2 g L-1
Na2S2O3 x 5 H2O 1 min
Rinse Deionized water 3 x 20 min
Impregnate
2 g L-1
silver nitrate 0.75 mL L
-1 37 % formaldehyde
20 min
Rinse Deionized water 2 x 20 min
Develop
50 g L-1
Na2CO3
0.5 mL L-1
37 % formaldehyde 4 mg L
-1 Na2S2O3 x 5 H2O
1 – 10 min
Wash Deionized water 2 x 2 min
Stop
50 % (v/v) methanol 12 % (v/v) acetic acid
10 min
Wash 50 % (v/v) methanol ≥ 20 min
3.13.4 Simply Blue Safe Stain
Zymogram gels were stained with the commercially available Simply Blue Safe Stain
(Invitrogen/Molecular Probes) according to the manufacturer’s instructions. Gels were
washed in 100 mL deionized water 3 x for 5 min, discarding the water after each interval.
The gels were covered with the staining solution and incubated for 1 h at room temperature.
Gels were washed 2 x for 1 h in deionized water. All staining steps were performed in plastic
containers at gentle agitation on a rocking platform at room temperature. Gel images were
taken with the Imaging Densitometer GS-700 (Bio-Rad).
3.13.5 SybrGold staining
Fluorescent staining of DGGE gels was performed with the commercially available SybrGold
(Invitrogen/Molecular Probes) stain. The reagents were prepared according to the
manufacturer’s instructions. Gels were stained for 1 h in 500 mL 1 x TAE-buffer (Bio-Rad)
adjusted to pH 8.0 and containing 50 µL of the 10,000 x SybrGold concentrate. The staining
Methods
82
was performed in a lightproof, plastic staining container with lid, placed on a rocking
platform which was set to gentle agitation. Gels were scanned with a Molecular Imager FX
pro plus Fluorescence Laser Scanner (Bio-Rad) connected to an FX External Laser Module
(Bio-Rad). Excitation was set to 488 nm and fluorescence was detected using a 530 nm band
pass filter.
3.13.6 SyproRuby protein gel stain
SDS-Tris-glycine gels were stained with the fluorescent dye SyproRuby (Invitrogen) according
to the manufacturer’s basic protocol instructions. Gels were incubated twice in 500 mL
fixation solution (50 % (v/v) methanol, 7 % (v/v) acetic acid) for 30 min. The fixation solution
was decanted and 500 mL of SyproRuby stain were added. The gels were incubated
overnight in lightproof, plastic staining containers with lid. The gels were washed in 500 mL
wash solution (10 % (v/v) methanol, 7 % (v/v) acetic acid) for 30 min and rinsed twice in
deionized water for 5 min. All steps were performed on a rocking platform set to gentle
agitation. Images were acquired with the Molecular Imager FX pro plus Fluorescence Laser
Scanner (Bio-Rad) connected to an FX External Laser Module (Bio-Rad) set to excitation at
488 nm and emission detected at 610 nm.
Results
83
4. RESULTS
The main aim of the current study was the characterization of drinking-water biofilms and
their EPS grown in drinking water of different distribution systems as well as plumbing
systems by microbiological, molecular biological and biochemical means. The first part of the
study required establishment and adaptation of methods for the cultivation of drinking-
water biofilms, for EPS isolation, as well as methods for quantitative and qualitative analyses
of the biofilms and their EPS.
4.1 Establishment of methods for the cultivation of drinking-water biofilms
and EPS recovery
4.1.1 Cultivation of drinking-water biofilms
Drinking-water biofilms were grown on an EPDM rubber material, which complied with
physical and chemical requirements for rubber materials used in drinking water systems, but
not with microbiological recommendations according to DVGW Code of Practice W270
(DVGW, 2007). In previous studies Bressler et al. (2009) showed that exposure of this EPDM
material to drinking water resulted in significant growth of drinking-water biofilms. In their
study the biofilms reached a quasi-stationary state after 14 d of incubation in flow-through
reactors, and remained constant during further incubation for up to 5 weeks. The
experimental setup by Bressler et al. (2009) was chosen as basis for the current study.
EPDM coupons were inserted into stainless-steel flow-through reactors, which were
connected to drinking water taps of plumbing system A and continuously perfused with
50 mL min-1 drinking water for 14 d. The mean water temperature was 17.3 °C ± 2.9 °C
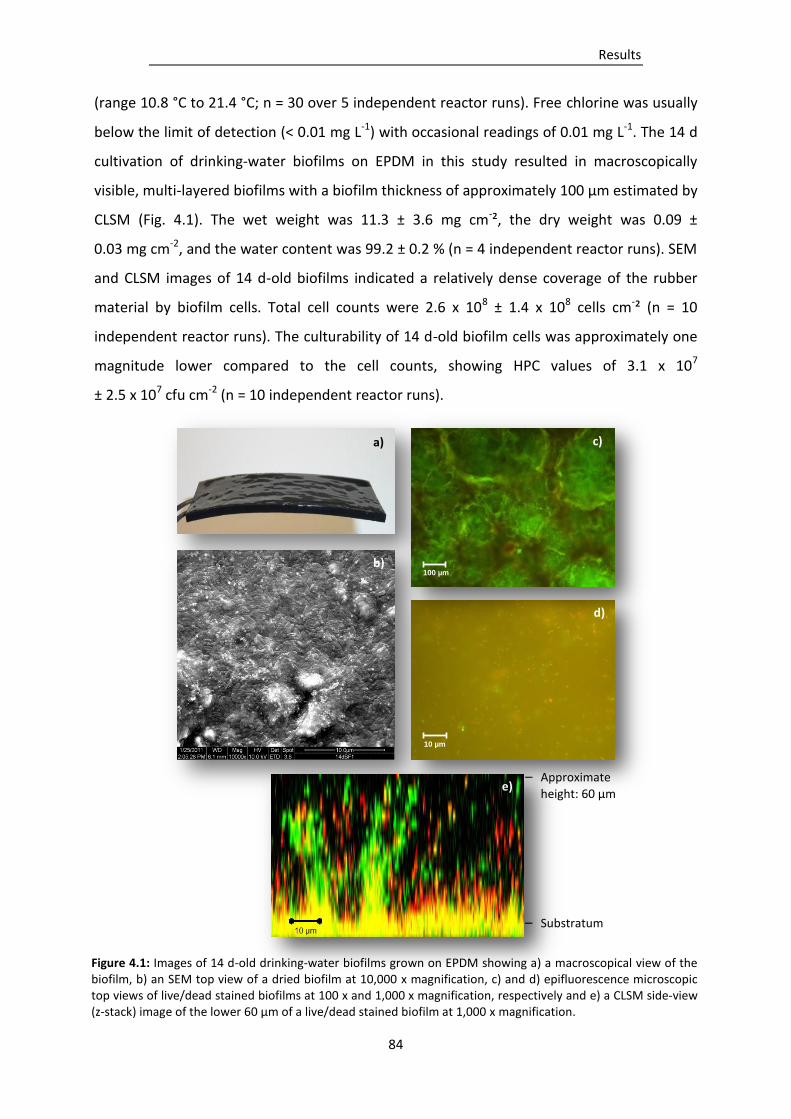
Results
84
(range 10.8 °C to 21.4 °C; n = 30 over 5 independent reactor runs). Free chlorine was usually
below the limit of detection (< 0.01 mg L-1) with occasional readings of 0.01 mg L-1. The 14 d
cultivation of drinking-water biofilms on EPDM in this study resulted in macroscopically
visible, multi-layered biofilms with a biofilm thickness of approximately 100 µm estimated by
CLSM (Fig. 4.1). The wet weight was 11.3 ± 3.6 mg cm-², the dry weight was 0.09 ±
0.03 mg cm-2, and the water content was 99.2 ± 0.2 % (n = 4 independent reactor runs). SEM
and CLSM images of 14 d-old biofilms indicated a relatively dense coverage of the rubber
material by biofilm cells. Total cell counts were 2.6 x 10⁸ ± 1.4 x 10⁸ cells cm-² (n = 10
independent reactor runs). The culturability of 14 d-old biofilm cells was approximately one
magnitude lower compared to the cell counts, showing HPC values of 3.1 x 10⁷
± 2.5 x 10⁷ cfu cm-2 (n = 10 independent reactor runs).
Figure 4.1: Images of 14 d-old drinking-water biofilms grown on EPDM showing a) a macroscopical view of the biofilm, b) an SEM top view of a dried biofilm at 10,000 x magnification, c) and d) epifluorescence microscopic top views of live/dead stained biofilms at 100 x and 1,000 x magnification, respectively and e) a CLSM side-view (z-stack) image of the lower 60 µm of a live/dead stained biofilm at 1,000 x magnification.
10 µm
100 µm
– Approximate
height: 60 µm
– Substratum
a) c)
d)
e)
b)
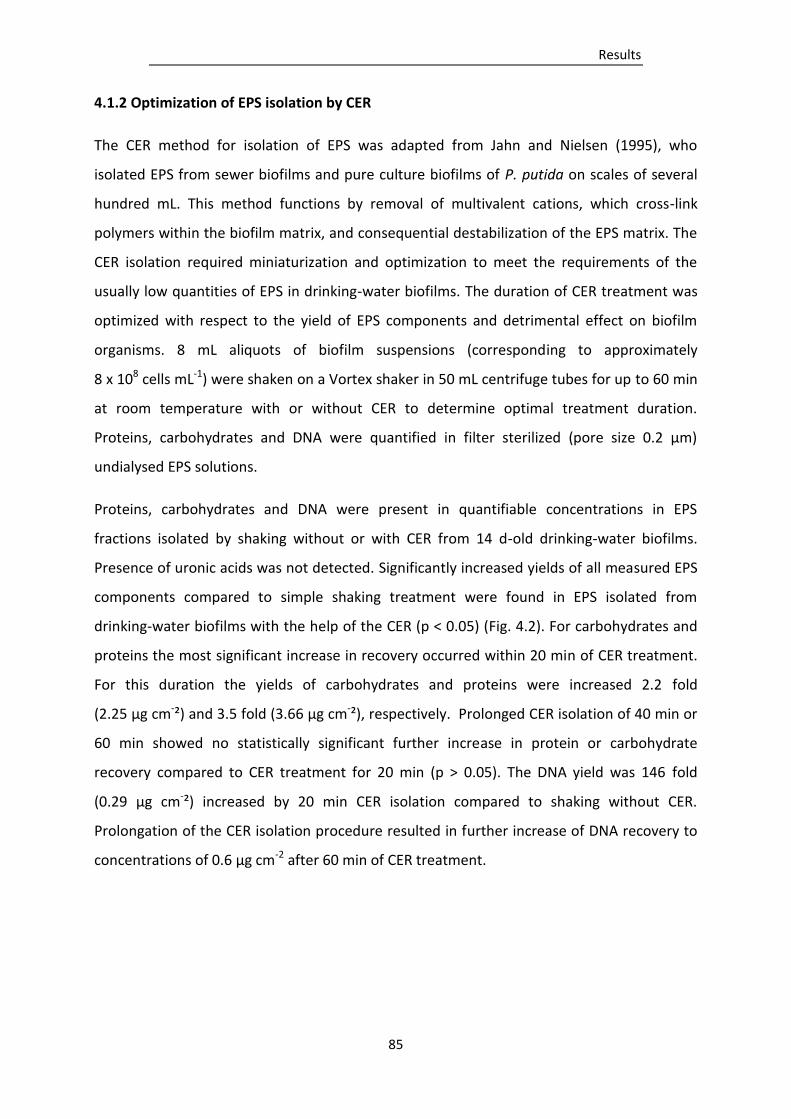
Results
85
4.1.2 Optimization of EPS isolation by CER
The CER method for isolation of EPS was adapted from Jahn and Nielsen (1995), who
isolated EPS from sewer biofilms and pure culture biofilms of P. putida on scales of several
hundred mL. This method functions by removal of multivalent cations, which cross-link
polymers within the biofilm matrix, and consequential destabilization of the EPS matrix. The
CER isolation required miniaturization and optimization to meet the requirements of the
usually low quantities of EPS in drinking-water biofilms. The duration of CER treatment was
optimized with respect to the yield of EPS components and detrimental effect on biofilm
organisms. 8 mL aliquots of biofilm suspensions (corresponding to approximately
8 x 10⁸ cells mL-1) were shaken on a Vortex shaker in 50 mL centrifuge tubes for up to 60 min
at room temperature with or without CER to determine optimal treatment duration.
Proteins, carbohydrates and DNA were quantified in filter sterilized (pore size 0.2 µm)
undialysed EPS solutions.
Proteins, carbohydrates and DNA were present in quantifiable concentrations in EPS
fractions isolated by shaking without or with CER from 14 d-old drinking-water biofilms.
Presence of uronic acids was not detected. Significantly increased yields of all measured EPS
components compared to simple shaking treatment were found in EPS isolated from
drinking-water biofilms with the help of the CER (p < 0.05) (Fig. 4.2). For carbohydrates and
proteins the most significant increase in recovery occurred within 20 min of CER treatment.
For this duration the yields of carbohydrates and proteins were increased 2.2 fold
(2.25 µg cm-²) and 3.5 fold (3.66 µg cm-²), respectively. Prolonged CER isolation of 40 min or
60 min showed no statistically significant further increase in protein or carbohydrate
recovery compared to CER treatment for 20 min (p > 0.05). The DNA yield was 146 fold
(0.29 µg cm-²) increased by 20 min CER isolation compared to shaking without CER.
Prolongation of the CER isolation procedure resulted in further increase of DNA recovery to
concentrations of 0.6 µg cm-2 after 60 min of CER treatment.
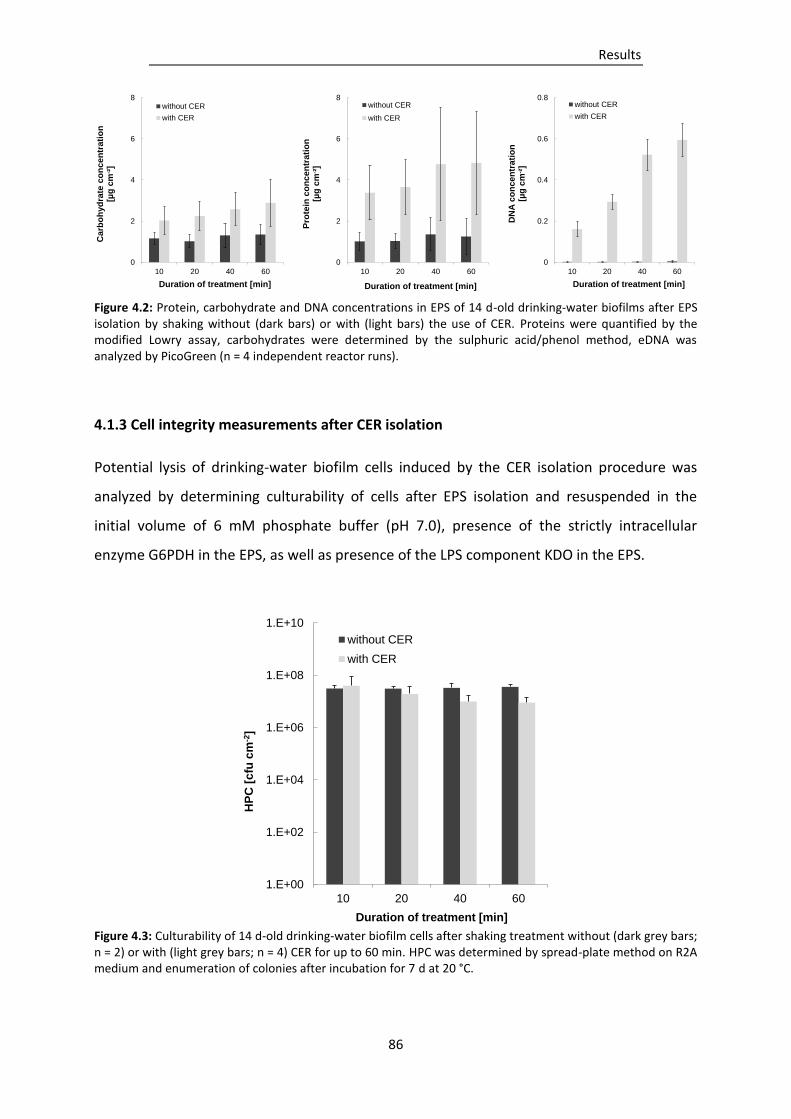
Results
86
Figure 4.2: Protein, carbohydrate and DNA concentrations in EPS of 14 d-old drinking-water biofilms after EPS isolation by shaking without (dark bars) or with (light bars) the use of CER. Proteins were quantified by the modified Lowry assay, carbohydrates were determined by the sulphuric acid/phenol method, eDNA was analyzed by PicoGreen (n = 4 independent reactor runs).
4.1.3 Cell integrity measurements after CER isolation
Potential lysis of drinking-water biofilm cells induced by the CER isolation procedure was
analyzed by determining culturability of cells after EPS isolation and resuspended in the
initial volume of 6 mM phosphate buffer (pH 7.0), presence of the strictly intracellular
enzyme G6PDH in the EPS, as well as presence of the LPS component KDO in the EPS.
Figure 4.3: Culturability of 14 d-old drinking-water biofilm cells after shaking treatment without (dark grey bars; n = 2) or with (light grey bars; n = 4) CER for up to 60 min. HPC was determined by spread-plate method on R2A medium and enumeration of colonies after incubation for 7 d at 20 °C.
0
2
4
6
8
10 20 40 60
Pro
tein
co
nc
en
tra
tio
n[µ
g c
m- ²]
Duration of treatment [min]
without CER
with CER
0
2
4
6
8
10 20 40 60
Ca
rbo
hyd
rate
co
nc
en
tra
tio
n[µ
g c
m- ²]
Duration of treatment [min]
without CER
with CER
0
0.2
0.4
0.6
0.8
10 20 40 60
DN
A c
on
cen
tra
tio
n[µ
g c
m- ²]
Duration of treatment [min]
without CER
with CER
1.E+00
1.E+02
1.E+04
1.E+06
1.E+08
1.E+10
10 20 40 60
HP
C [
cfu
cm
-2]
Duration of treatment [min]
without CER
with CER
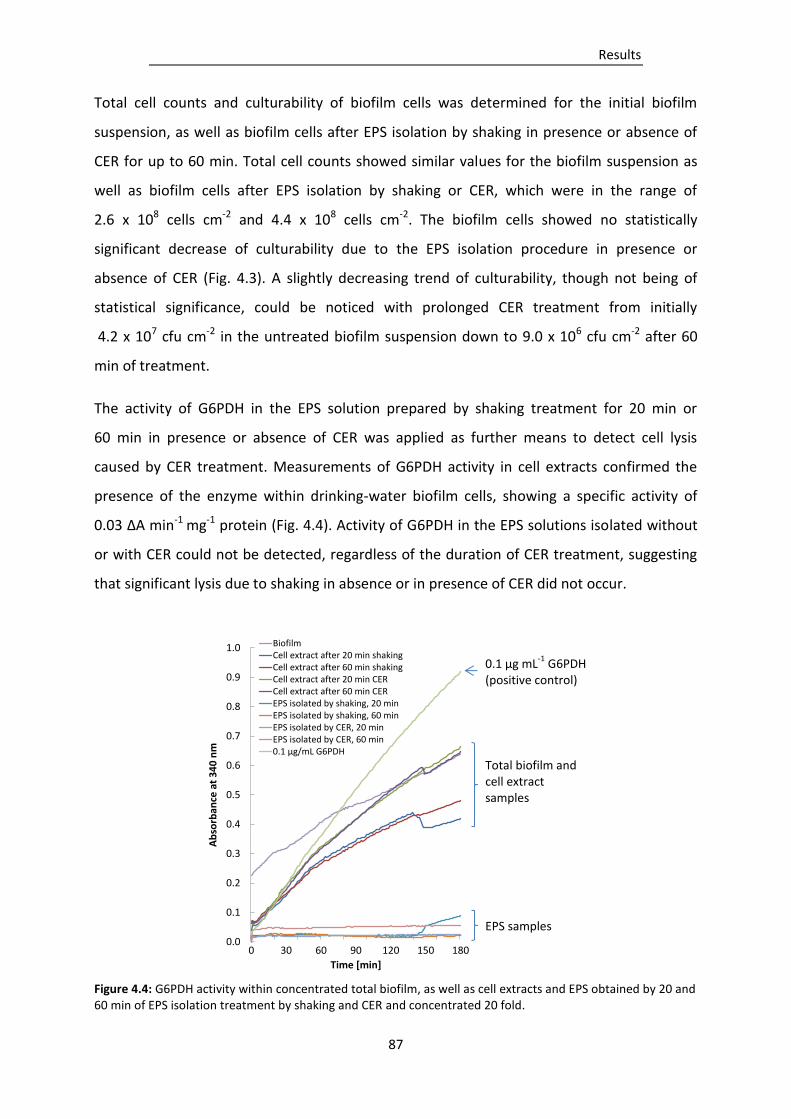
Results
87
Total cell counts and culturability of biofilm cells was determined for the initial biofilm
suspension, as well as biofilm cells after EPS isolation by shaking in presence or absence of
CER for up to 60 min. Total cell counts showed similar values for the biofilm suspension as
well as biofilm cells after EPS isolation by shaking or CER, which were in the range of
2.6 x 10⁸ cells cm-2 and 4.4 x 10⁸ cells cm-2. The biofilm cells showed no statistically
significant decrease of culturability due to the EPS isolation procedure in presence or
absence of CER (Fig. 4.3). A slightly decreasing trend of culturability, though not being of
statistical significance, could be noticed with prolonged CER treatment from initially
4.2 x 10⁷ cfu cm-2 in the untreated biofilm suspension down to 9.0 x 10⁶ cfu cm-2 after 60
min of treatment.
The activity of G6PDH in the EPS solution prepared by shaking treatment for 20 min or
60 min in presence or absence of CER was applied as further means to detect cell lysis
caused by CER treatment. Measurements of G6PDH activity in cell extracts confirmed the
presence of the enzyme within drinking-water biofilm cells, showing a specific activity of
0.03 ΔA min-1 mg-1 protein (Fig. 4.4). Activity of G6PDH in the EPS solutions isolated without
or with CER could not be detected, regardless of the duration of CER treatment, suggesting
that significant lysis due to shaking in absence or in presence of CER did not occur.
Figure 4.4: G6PDH activity within concentrated total biofilm, as well as cell extracts and EPS obtained by 20 and 60 min of EPS isolation treatment by shaking and CER and concentrated 20 fold.
0.0
0.1
0.2
0.3
0.4
0.5
0.6
0.7
0.8
0.9
1.0
0 30 60 90 120 150 180
Ab
sorb
ance
at
34
0 n
m
Time [min]
BiofilmCell extract after 20 min shakingCell extract after 60 min shakingCell extract after 20 min CERCell extract after 60 min CEREPS isolated by shaking, 20 minEPS isolated by shaking, 60 minEPS isolated by CER, 20 minEPS isolated by CER, 60 min0.1 µg/mL G6PDH
EPS samples
Total biofilm and cell extract samples
0.1 µg mL-1
G6PDH (positive control)
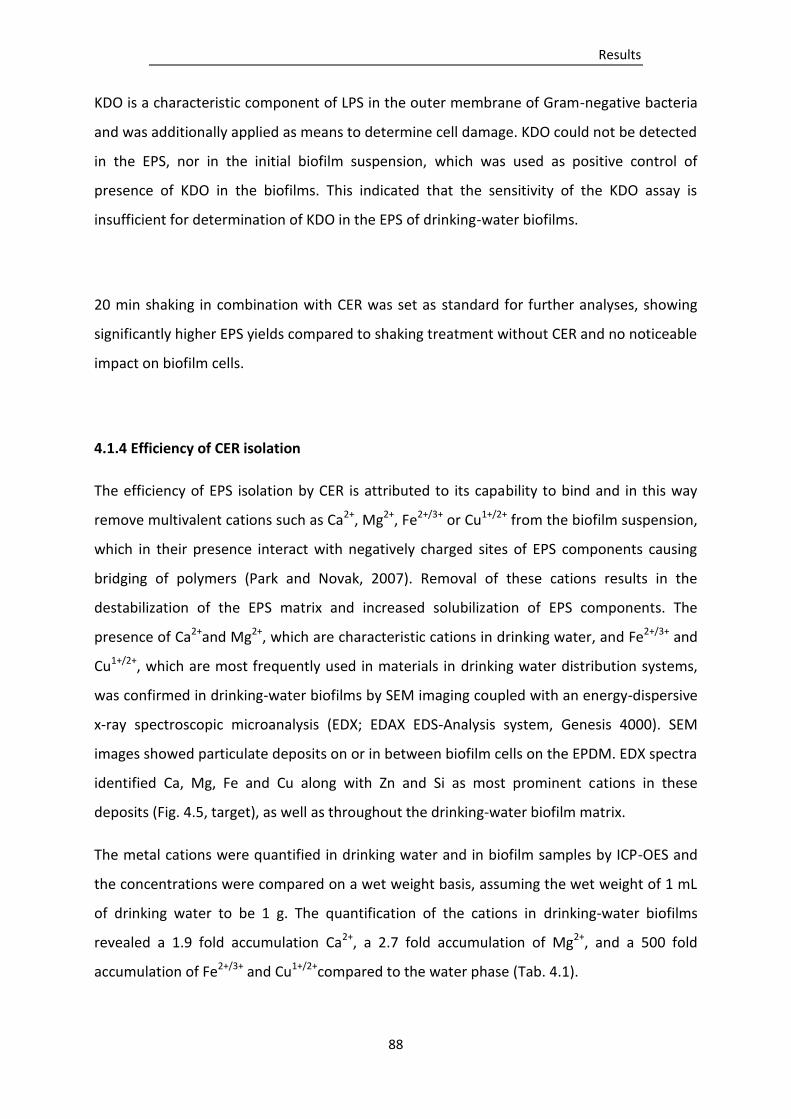
Results
88
KDO is a characteristic component of LPS in the outer membrane of Gram-negative bacteria
and was additionally applied as means to determine cell damage. KDO could not be detected
in the EPS, nor in the initial biofilm suspension, which was used as positive control of
presence of KDO in the biofilms. This indicated that the sensitivity of the KDO assay is
insufficient for determination of KDO in the EPS of drinking-water biofilms.
20 min shaking in combination with CER was set as standard for further analyses, showing
significantly higher EPS yields compared to shaking treatment without CER and no noticeable
impact on biofilm cells.
4.1.4 Efficiency of CER isolation
The efficiency of EPS isolation by CER is attributed to its capability to bind and in this way
remove multivalent cations such as Ca2+, Mg2+, Fe2+/3+ or Cu1+/2+ from the biofilm suspension,
which in their presence interact with negatively charged sites of EPS components causing
bridging of polymers (Park and Novak, 2007). Removal of these cations results in the
destabilization of the EPS matrix and increased solubilization of EPS components. The
presence of Ca2+and Mg2+, which are characteristic cations in drinking water, and Fe2+/3+ and
Cu1+/2+, which are most frequently used in materials in drinking water distribution systems,
was confirmed in drinking-water biofilms by SEM imaging coupled with an energy-dispersive
x-ray spectroscopic microanalysis (EDX; EDAX EDS-Analysis system, Genesis 4000). SEM
images showed particulate deposits on or in between biofilm cells on the EPDM. EDX spectra
identified Ca, Mg, Fe and Cu along with Zn and Si as most prominent cations in these
deposits (Fig. 4.5, target), as well as throughout the drinking-water biofilm matrix.
The metal cations were quantified in drinking water and in biofilm samples by ICP-OES and
the concentrations were compared on a wet weight basis, assuming the wet weight of 1 mL
of drinking water to be 1 g. The quantification of the cations in drinking-water biofilms
revealed a 1.9 fold accumulation Ca2+, a 2.7 fold accumulation of Mg2+, and a 500 fold
accumulation of Fe2+/3+ and Cu1+/2+compared to the water phase (Tab. 4.1).
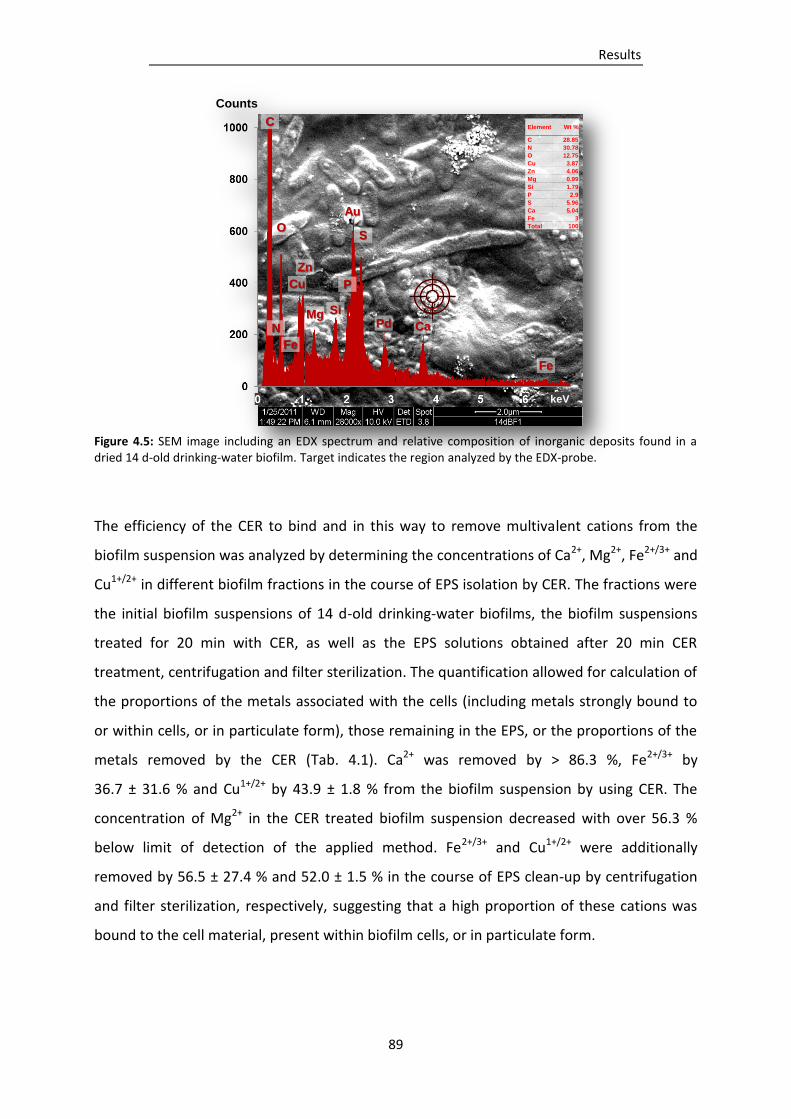
Results
89
Figure 4.5: SEM image including an EDX spectrum and relative composition of inorganic deposits found in a dried 14 d-old drinking-water biofilm. Target indicates the region analyzed by the EDX-probe.
The efficiency of the CER to bind and in this way to remove multivalent cations from the
biofilm suspension was analyzed by determining the concentrations of Ca2+, Mg2+, Fe2+/3+ and
Cu1+/2+ in different biofilm fractions in the course of EPS isolation by CER. The fractions were
the initial biofilm suspensions of 14 d-old drinking-water biofilms, the biofilm suspensions
treated for 20 min with CER, as well as the EPS solutions obtained after 20 min CER
treatment, centrifugation and filter sterilization. The quantification allowed for calculation of
the proportions of the metals associated with the cells (including metals strongly bound to
or within cells, or in particulate form), those remaining in the EPS, or the proportions of the
metals removed by the CER (Tab. 4.1). Ca2+ was removed by > 86.3 %, Fe2+/3+ by
36.7 ± 31.6 % and Cu1+/2+ by 43.9 ± 1.8 % from the biofilm suspension by using CER. The
concentration of Mg2+ in the CER treated biofilm suspension decreased with over 56.3 %
below limit of detection of the applied method. Fe2+/3+ and Cu1+/2+ were additionally
removed by 56.5 ± 27.4 % and 52.0 ± 1.5 % in the course of EPS clean-up by centrifugation
and filter sterilization, respectively, suggesting that a high proportion of these cations was
bound to the cell material, present within biofilm cells, or in particulate form.
C
N
O
Au
S
Mg
Cu
Zn
Fe
Pd Ca
Fe
Si
P
Counts
keV
Element Wt %
C 28.85
N 30.78
O 12.75
Cu 3.87
Zn 4.06
Mg 0.99
Si 1.79
P 2.9
S 5.96
Ca 5.04
Fe 3
Total 100
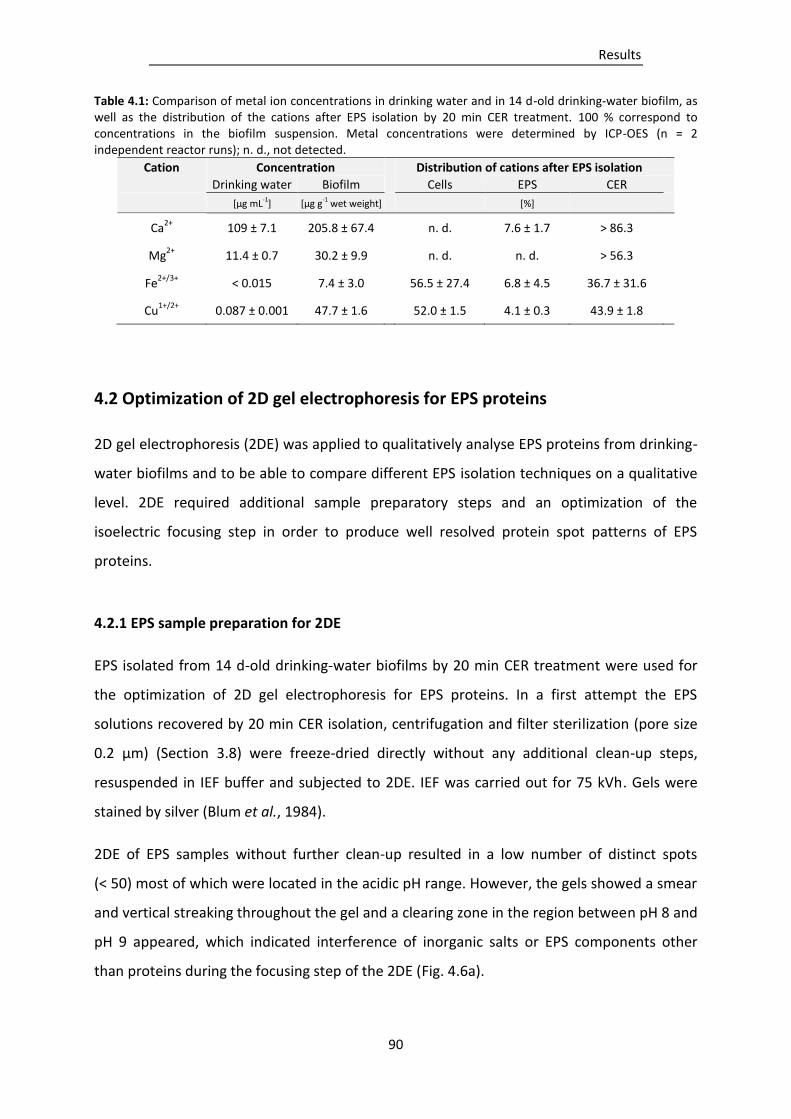
Results
90
Table 4.1: Comparison of metal ion concentrations in drinking water and in 14 d-old drinking-water biofilm, as well as the distribution of the cations after EPS isolation by 20 min CER treatment. 100 % correspond to concentrations in the biofilm suspension. Metal concentrations were determined by ICP-OES (n = 2 independent reactor runs); n. d., not detected.
Cation Concentration Distribution of cations after EPS isolation
Drinking water Biofilm Cells EPS CER
[µg mL-1] [µg g-1 wet weight] [%]
Ca2+
109 ± 7.1 205.8 ± 67.4 n. d. 7.6 ± 1.7 > 86.3
Mg2+
11.4 ± 0.7 30.2 ± 9.9 n. d. n. d. > 56.3
Fe2+/3+
< 0.015 7.4 ± 3.0 56.5 ± 27.4 6.8 ± 4.5 36.7 ± 31.6
Cu1+/2+
0.087 ± 0.001 47.7 ± 1.6 52.0 ± 1.5 4.1 ± 0.3 43.9 ± 1.8
4.2 Optimization of 2D gel electrophoresis for EPS proteins
2D gel electrophoresis (2DE) was applied to qualitatively analyse EPS proteins from drinking-
water biofilms and to be able to compare different EPS isolation techniques on a qualitative
level. 2DE required additional sample preparatory steps and an optimization of the
isoelectric focusing step in order to produce well resolved protein spot patterns of EPS
proteins.
4.2.1 EPS sample preparation for 2DE
EPS isolated from 14 d-old drinking-water biofilms by 20 min CER treatment were used for
the optimization of 2D gel electrophoresis for EPS proteins. In a first attempt the EPS
solutions recovered by 20 min CER isolation, centrifugation and filter sterilization (pore size
0.2 µm) (Section 3.8) were freeze-dried directly without any additional clean-up steps,
resuspended in IEF buffer and subjected to 2DE. IEF was carried out for 75 kVh. Gels were
stained by silver (Blum et al., 1984).
2DE of EPS samples without further clean-up resulted in a low number of distinct spots
(< 50) most of which were located in the acidic pH range. However, the gels showed a smear
and vertical streaking throughout the gel and a clearing zone in the region between pH 8 and
pH 9 appeared, which indicated interference of inorganic salts or EPS components other
than proteins during the focusing step of the 2DE (Fig. 4.6a).
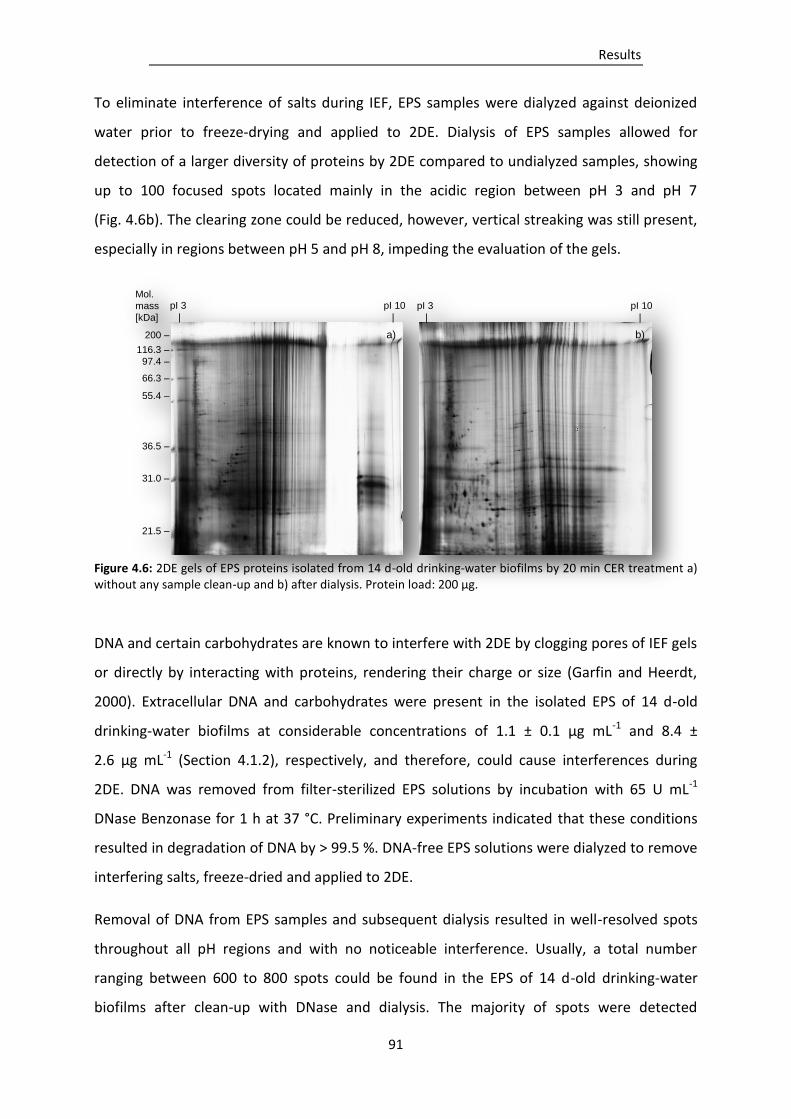
Results
91
To eliminate interference of salts during IEF, EPS samples were dialyzed against deionized
water prior to freeze-drying and applied to 2DE. Dialysis of EPS samples allowed for
detection of a larger diversity of proteins by 2DE compared to undialyzed samples, showing
up to 100 focused spots located mainly in the acidic region between pH 3 and pH 7
(Fig. 4.6b). The clearing zone could be reduced, however, vertical streaking was still present,
especially in regions between pH 5 and pH 8, impeding the evaluation of the gels.
Figure 4.6: 2DE gels of EPS proteins isolated from 14 d-old drinking-water biofilms by 20 min CER treatment a) without any sample clean-up and b) after dialysis. Protein load: 200 µg.
DNA and certain carbohydrates are known to interfere with 2DE by clogging pores of IEF gels
or directly by interacting with proteins, rendering their charge or size (Garfin and Heerdt,
2000). Extracellular DNA and carbohydrates were present in the isolated EPS of 14 d-old
drinking-water biofilms at considerable concentrations of 1.1 ± 0.1 µg mL-1 and 8.4 ±
2.6 µg mL-1 (Section 4.1.2), respectively, and therefore, could cause interferences during
2DE. DNA was removed from filter-sterilized EPS solutions by incubation with 65 U mL-1
DNase Benzonase for 1 h at 37 °C. Preliminary experiments indicated that these conditions
resulted in degradation of DNA by > 99.5 %. DNA-free EPS solutions were dialyzed to remove
interfering salts, freeze-dried and applied to 2DE.
Removal of DNA from EPS samples and subsequent dialysis resulted in well-resolved spots
throughout all pH regions and with no noticeable interference. Usually, a total number
ranging between 600 to 800 spots could be found in the EPS of 14 d-old drinking-water
biofilms after clean-up with DNase and dialysis. The majority of spots were detected
Mol.
mass
[kDa]
200 –
116.3 –
97.4 –
66.3 –
55.4 –
36.5 –
31.0 –
21.5 –
pI 3 pI 10
| |
pI 3 pI 10
| |
a) b)
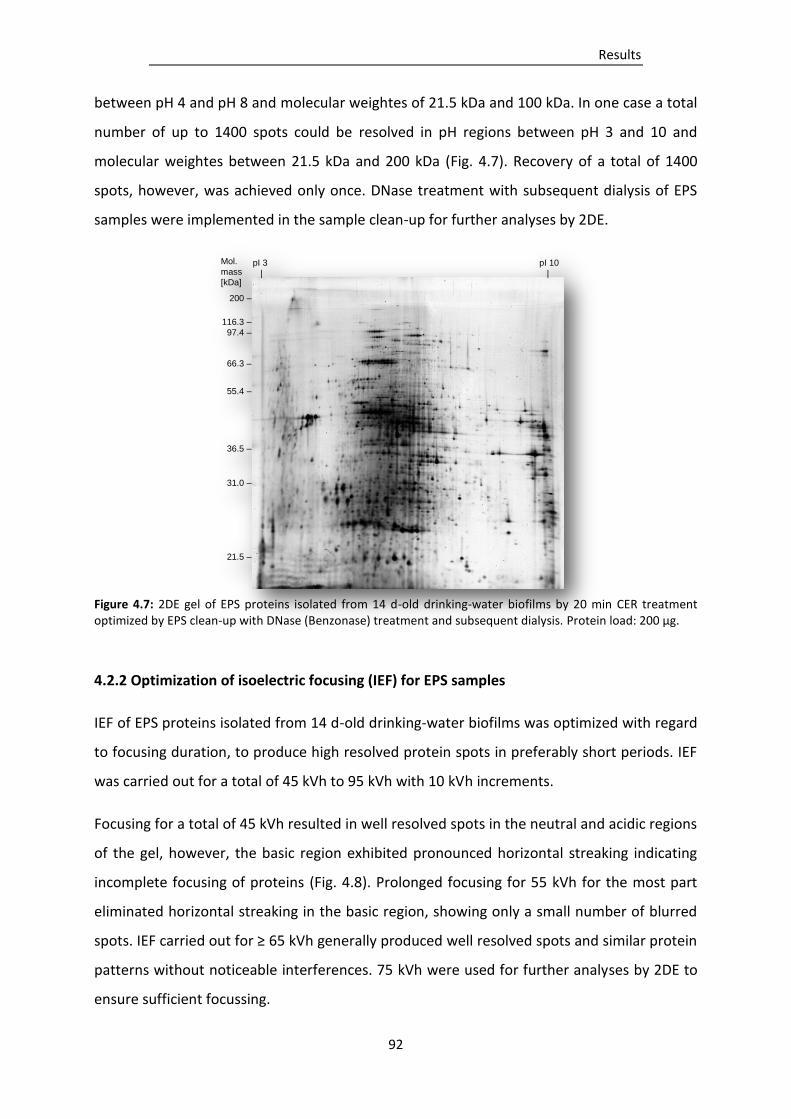
Results
92
between pH 4 and pH 8 and molecular weightes of 21.5 kDa and 100 kDa. In one case a total
number of up to 1400 spots could be resolved in pH regions between pH 3 and 10 and
molecular weightes between 21.5 kDa and 200 kDa (Fig. 4.7). Recovery of a total of 1400
spots, however, was achieved only once. DNase treatment with subsequent dialysis of EPS
samples were implemented in the sample clean-up for further analyses by 2DE.
Figure 4.7: 2DE gel of EPS proteins isolated from 14 d-old drinking-water biofilms by 20 min CER treatment optimized by EPS clean-up with DNase (Benzonase) treatment and subsequent dialysis. Protein load: 200 µg.
4.2.2 Optimization of isoelectric focusing (IEF) for EPS samples
IEF of EPS proteins isolated from 14 d-old drinking-water biofilms was optimized with regard
to focusing duration, to produce high resolved protein spots in preferably short periods. IEF
was carried out for a total of 45 kVh to 95 kVh with 10 kVh increments.
Focusing for a total of 45 kVh resulted in well resolved spots in the neutral and acidic regions
of the gel, however, the basic region exhibited pronounced horizontal streaking indicating
incomplete focusing of proteins (Fig. 4.8). Prolonged focusing for 55 kVh for the most part
eliminated horizontal streaking in the basic region, showing only a small number of blurred
spots. IEF carried out for ≥ 65 kVh generally produced well resolved spots and similar protein
patterns without noticeable interferences. 75 kVh were used for further analyses by 2DE to
ensure sufficient focussing.
Mol.
mass
[kDa]
200 –
116.3 –
97.4 –
66.3 –
55.4 –
36.5 –
31.0 –
21.5 –
pI 3 pI 10
| |
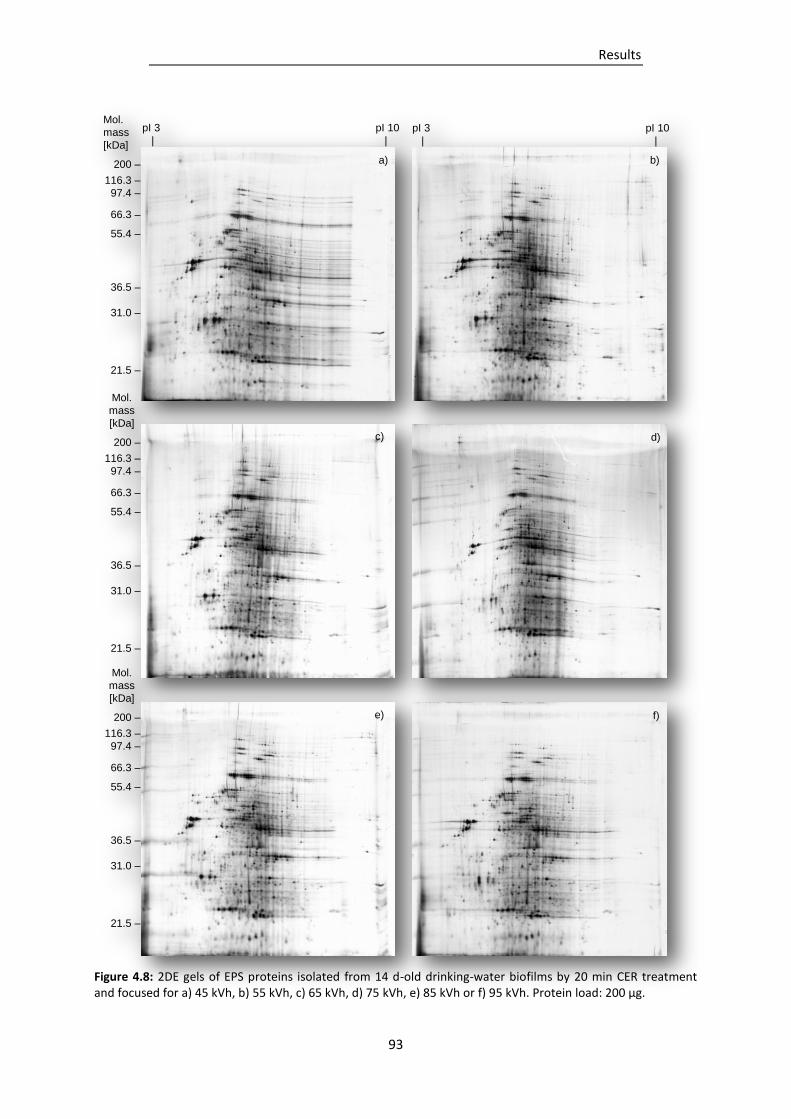
Results
93
Figure 4.8: 2DE gels of EPS proteins isolated from 14 d-old drinking-water biofilms by 20 min CER treatment and focused for a) 45 kVh, b) 55 kVh, c) 65 kVh, d) 75 kVh, e) 85 kVh or f) 95 kVh. Protein load: 200 µg.
Mol.
mass
[kDa]
200 –
116.3 –
97.4 –
66.3 –
55.4 –
36.5 –
31.0 –
21.5 –
Mol.
mass
[kDa]
200 –
116.3 –
97.4 –
66.3 –
55.4 –
36.5 –
31.0 –
21.5 –
Mol.
mass
[kDa]
200 –
116.3 –
97.4 –
66.3 –
55.4 –
36.5 –
31.0 –
21.5 –
pI 3 pI 10
| |
pI 3 pI 10
| |
d)
a) b)
c)
f) e)

Results
94
4.2.3 Selection of staining method for SDS-Tris-glycine gels
Three staining protocols were tested and compared for their capability to stain EPS proteins
from 14 d-old drinking-water biofilms, which were separated by 2DE on large format (20 cm
x 20 cm x 0.1 cm) SDS-Tris-glycine gels. The methods were silver staining as described by
Blum et al. (1984), an improved Coomassie brilliant blue staining technique according to
Kang et al. (2002), and the commercially available SyproRuby protein gel stain
(Invitrogen/Molecular Probes) (Section 3.13).
The comparison showed that silver staining according to Blum et al. (1984) was the most
sensitive and, therefore, most suitable method to stain gels containing isolated EPS proteins
(Fig. 4.9c). The improved Coomassie brilliant blue staining, which according to Kang et al.
(2002) is supposed to be as sensitive as silver staining when using mini-gels (7 cm x 7 cm x
0.1 cm), in this study only showed a total of 10 weakly stained spots on the large format gels
(20 cm x 20 cm x 0.1 cm) (Fig. 4.9a). Also the bands of the protein marker Mark12, applied
on the gel for molecular weight estimation of the proteins, appeared very faint, indicating
that the protocol by Kang et al. (2002) is not adequate to stain EPS proteins on large format
gels as applied in this study. The fluorescent SyproRuby stain, which according to the
manufacturer (Invitrogen/Molecular Probes) is also supposed to be as sensitive as silver
staining, showed a total of 221 spots, however, the fluorescence signal was relatively weak
and the diversity of detected spots was lower compared to silver staining (Fig. 4.9b). Silver
staining according to Blum et al. (1984) was used for further staining of 2DE gels.
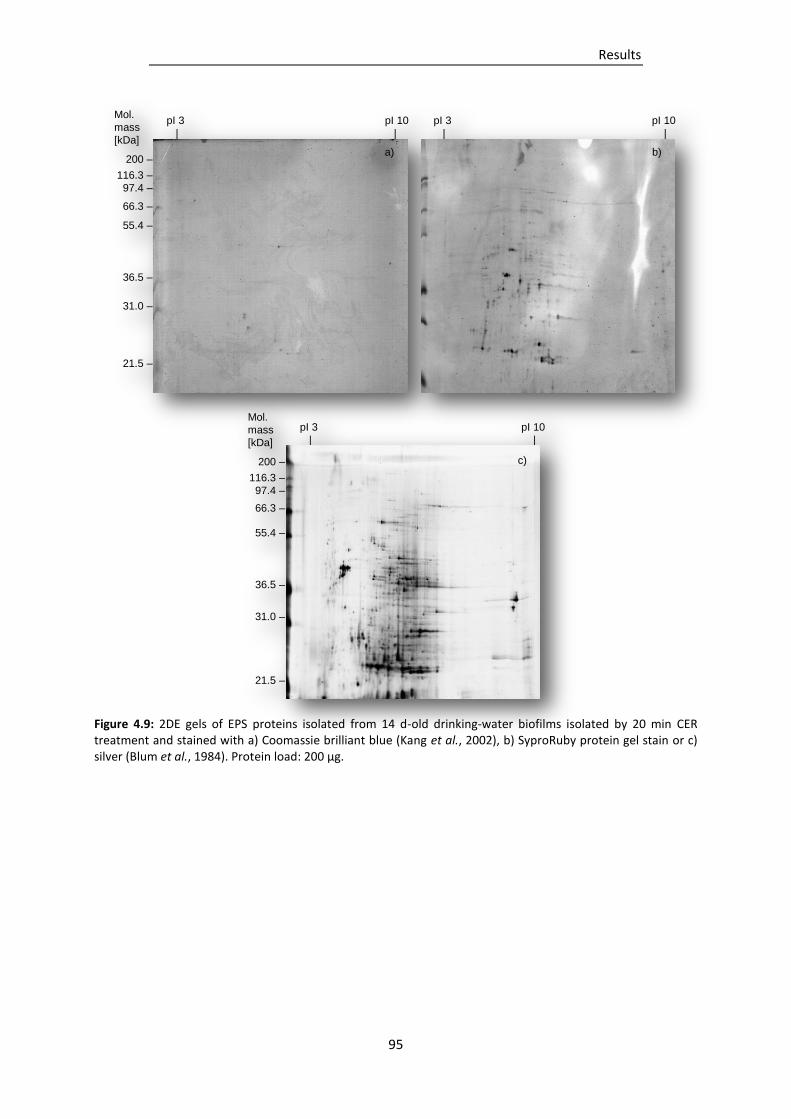
Results
95
Figure 4.9: 2DE gels of EPS proteins isolated from 14 d-old drinking-water biofilms isolated by 20 min CER treatment and stained with a) Coomassie brilliant blue (Kang et al., 2002), b) SyproRuby protein gel stain or c) silver (Blum et al., 1984). Protein load: 200 µg.
Mol.
mass
[kDa]
200 –
116.3 –
97.4 –
66.3 –
55.4 –
36.5 –
31.0 –
21.5 –
pI 3 pI 10
| |
pI 3 pI 10
| |
Mol.
mass
[kDa]
200 –
116.3 –
97.4 –
66.3 –
55.4 –
36.5 –
31.0 –
21.5 –
pI 3 pI 10
| |
b) a)
c)
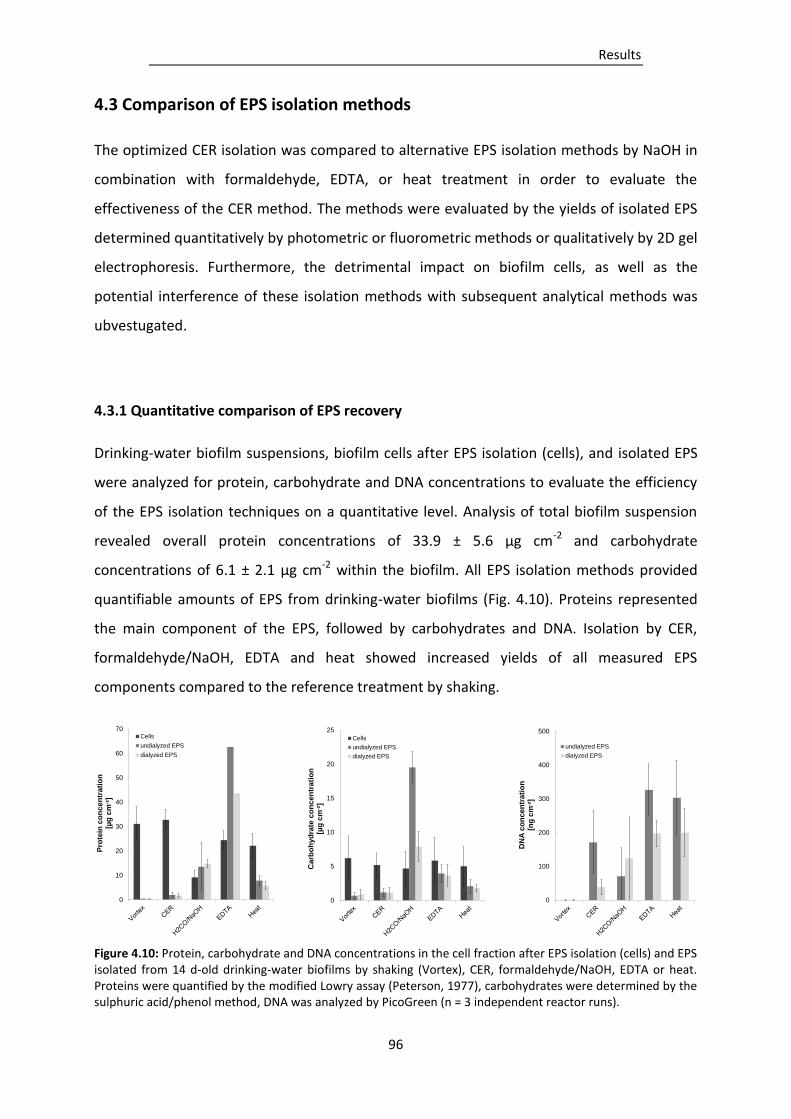
Results
96
4.3 Comparison of EPS isolation methods
The optimized CER isolation was compared to alternative EPS isolation methods by NaOH in
combination with formaldehyde, EDTA, or heat treatment in order to evaluate the
effectiveness of the CER method. The methods were evaluated by the yields of isolated EPS
determined quantitatively by photometric or fluorometric methods or qualitatively by 2D gel
electrophoresis. Furthermore, the detrimental impact on biofilm cells, as well as the
potential interference of these isolation methods with subsequent analytical methods was
ubvestugated.
4.3.1 Quantitative comparison of EPS recovery
Drinking-water biofilm suspensions, biofilm cells after EPS isolation (cells), and isolated EPS
were analyzed for protein, carbohydrate and DNA concentrations to evaluate the efficiency
of the EPS isolation techniques on a quantitative level. Analysis of total biofilm suspension
revealed overall protein concentrations of 33.9 ± 5.6 µg cm-2 and carbohydrate
concentrations of 6.1 ± 2.1 µg cm-2 within the biofilm. All EPS isolation methods provided
quantifiable amounts of EPS from drinking-water biofilms (Fig. 4.10). Proteins represented
the main component of the EPS, followed by carbohydrates and DNA. Isolation by CER,
formaldehyde/NaOH, EDTA and heat showed increased yields of all measured EPS
components compared to the reference treatment by shaking.
Figure 4.10: Protein, carbohydrate and DNA concentrations in the cell fraction after EPS isolation (cells) and EPS isolated from 14 d-old drinking-water biofilms by shaking (Vortex), CER, formaldehyde/NaOH, EDTA or heat. Proteins were quantified by the modified Lowry assay (Peterson, 1977), carbohydrates were determined by the sulphuric acid/phenol method, DNA was analyzed by PicoGreen (n = 3 independent reactor runs).
0
10
20
30
40
50
60
70
Pro
tein
co
nc
en
tra
tio
n
[µg
cm
- ²]
Cells
undialyzed EPS
dialyzed EPS
0
5
10
15
20
25
Carb
oh
yd
rate
co
nc
en
tra
tio
n
[µg
cm
- ²]
Cells
undialyzed EPS
dialyzed EPS
0
100
200
300
400
500
DN
A c
on
cen
tra
tio
n
[ng
cm
- ²]
undialyzed EPS
dialyzed EPS
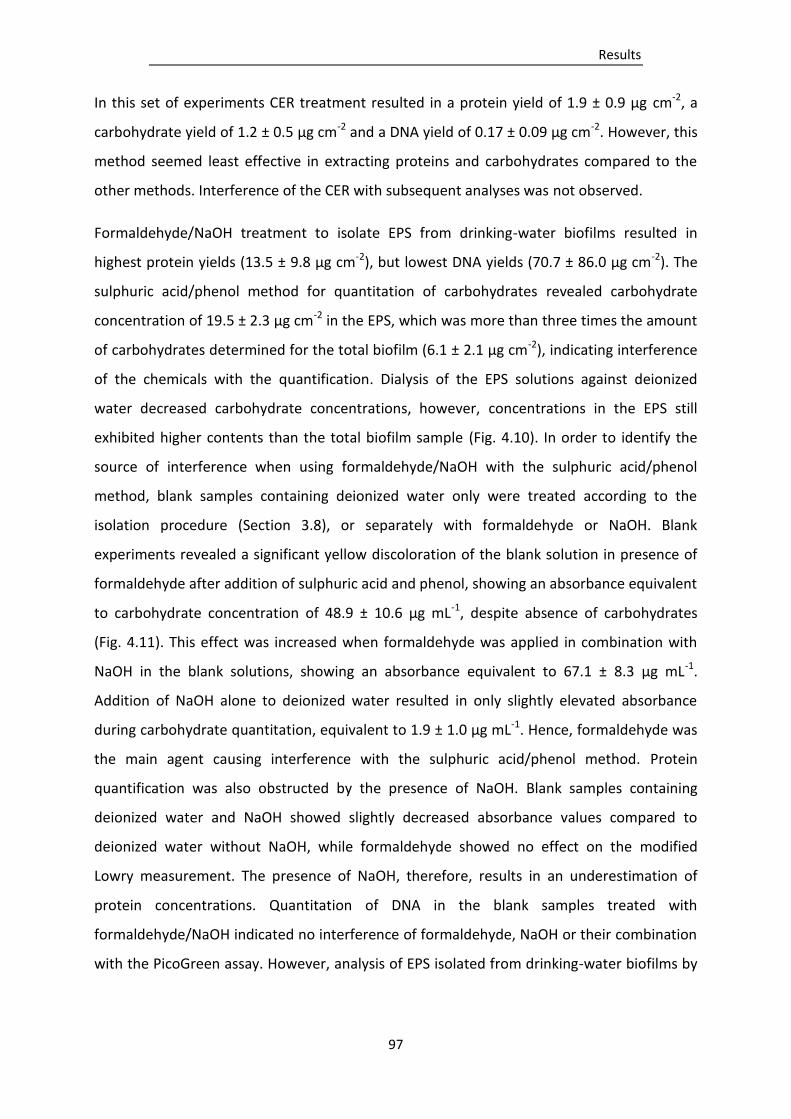
Results
97
In this set of experiments CER treatment resulted in a protein yield of 1.9 ± 0.9 µg cm-2, a
carbohydrate yield of 1.2 ± 0.5 µg cm-2 and a DNA yield of 0.17 ± 0.09 µg cm-2. However, this
method seemed least effective in extracting proteins and carbohydrates compared to the
other methods. Interference of the CER with subsequent analyses was not observed.
Formaldehyde/NaOH treatment to isolate EPS from drinking-water biofilms resulted in
highest protein yields (13.5 ± 9.8 µg cm-2), but lowest DNA yields (70.7 ± 86.0 µg cm-2). The
sulphuric acid/phenol method for quantitation of carbohydrates revealed carbohydrate
concentration of 19.5 ± 2.3 µg cm-2 in the EPS, which was more than three times the amount
of carbohydrates determined for the total biofilm (6.1 ± 2.1 µg cm-2), indicating interference
of the chemicals with the quantification. Dialysis of the EPS solutions against deionized
water decreased carbohydrate concentrations, however, concentrations in the EPS still
exhibited higher contents than the total biofilm sample (Fig. 4.10). In order to identify the
source of interference when using formaldehyde/NaOH with the sulphuric acid/phenol
method, blank samples containing deionized water only were treated according to the
isolation procedure (Section 3.8), or separately with formaldehyde or NaOH. Blank
experiments revealed a significant yellow discoloration of the blank solution in presence of
formaldehyde after addition of sulphuric acid and phenol, showing an absorbance equivalent
to carbohydrate concentration of 48.9 ± 10.6 µg mL-1, despite absence of carbohydrates
(Fig. 4.11). This effect was increased when formaldehyde was applied in combination with
NaOH in the blank solutions, showing an absorbance equivalent to 67.1 ± 8.3 µg mL-1.
Addition of NaOH alone to deionized water resulted in only slightly elevated absorbance
during carbohydrate quantitation, equivalent to 1.9 ± 1.0 µg mL-1. Hence, formaldehyde was
the main agent causing interference with the sulphuric acid/phenol method. Protein
quantification was also obstructed by the presence of NaOH. Blank samples containing
deionized water and NaOH showed slightly decreased absorbance values compared to
deionized water without NaOH, while formaldehyde showed no effect on the modified
Lowry measurement. The presence of NaOH, therefore, results in an underestimation of
protein concentrations. Quantitation of DNA in the blank samples treated with
formaldehyde/NaOH indicated no interference of formaldehyde, NaOH or their combination
with the PicoGreen assay. However, analysis of EPS isolated from drinking-water biofilms by
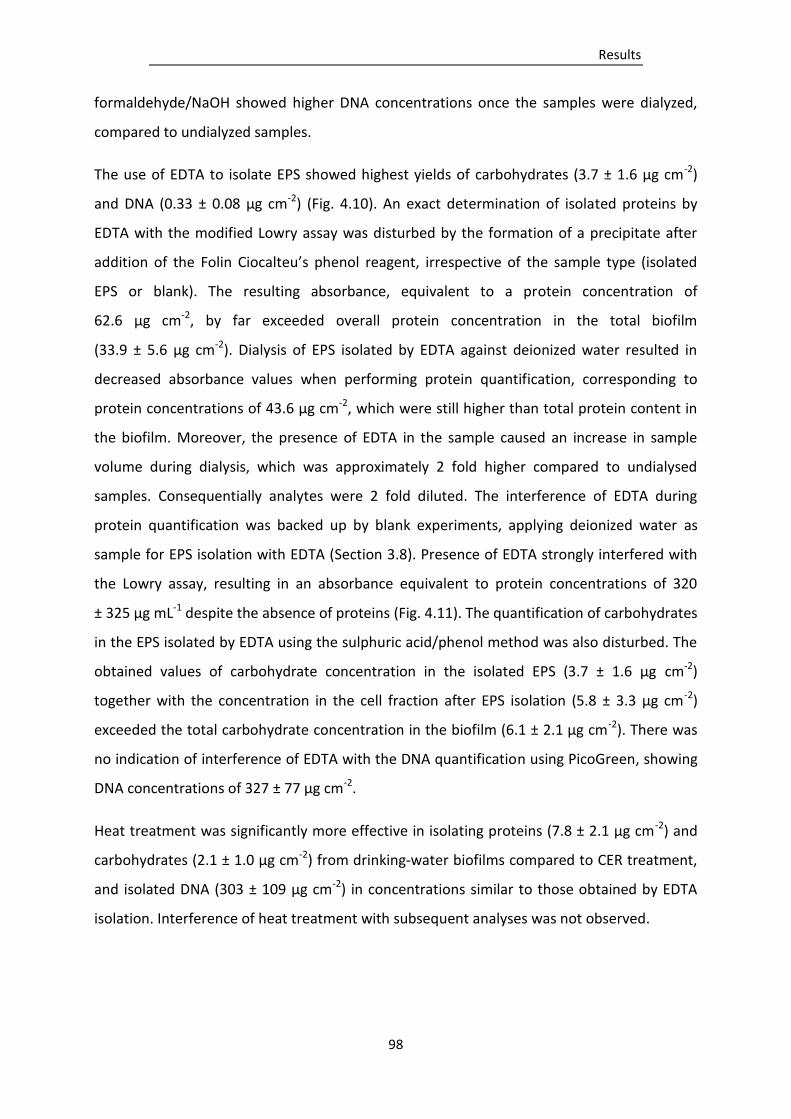
Results
98
formaldehyde/NaOH showed higher DNA concentrations once the samples were dialyzed,
compared to undialyzed samples.
The use of EDTA to isolate EPS showed highest yields of carbohydrates (3.7 ± 1.6 µg cm-2)
and DNA (0.33 ± 0.08 µg cm-2) (Fig. 4.10). An exact determination of isolated proteins by
EDTA with the modified Lowry assay was disturbed by the formation of a precipitate after
addition of the Folin Ciocalteu’s phenol reagent, irrespective of the sample type (isolated
EPS or blank). The resulting absorbance, equivalent to a protein concentration of
62.6 µg cm-2, by far exceeded overall protein concentration in the total biofilm
(33.9 ± 5.6 µg cm-2). Dialysis of EPS isolated by EDTA against deionized water resulted in
decreased absorbance values when performing protein quantification, corresponding to
protein concentrations of 43.6 µg cm-2, which were still higher than total protein content in
the biofilm. Moreover, the presence of EDTA in the sample caused an increase in sample
volume during dialysis, which was approximately 2 fold higher compared to undialysed
samples. Consequentially analytes were 2 fold diluted. The interference of EDTA during
protein quantification was backed up by blank experiments, applying deionized water as
sample for EPS isolation with EDTA (Section 3.8). Presence of EDTA strongly interfered with
the Lowry assay, resulting in an absorbance equivalent to protein concentrations of 320
± 325 µg mL-1 despite the absence of proteins (Fig. 4.11). The quantification of carbohydrates
in the EPS isolated by EDTA using the sulphuric acid/phenol method was also disturbed. The
obtained values of carbohydrate concentration in the isolated EPS (3.7 ± 1.6 µg cm-2)
together with the concentration in the cell fraction after EPS isolation (5.8 ± 3.3 µg cm-2)
exceeded the total carbohydrate concentration in the biofilm (6.1 ± 2.1 µg cm-2). There was
no indication of interference of EDTA with the DNA quantification using PicoGreen, showing
DNA concentrations of 327 ± 77 µg cm-2.
Heat treatment was significantly more effective in isolating proteins (7.8 ± 2.1 µg cm-2) and
carbohydrates (2.1 ± 1.0 µg cm-2) from drinking-water biofilms compared to CER treatment,
and isolated DNA (303 ± 109 µg cm-2) in concentrations similar to those obtained by EDTA
isolation. Interference of heat treatment with subsequent analyses was not observed.
Results
99
Figure 4.11: Protein, carbohydrate and DNA concentrations measured in deionized water after addition of EDTA, formaldehyde, NaOH or formaldehyde with NaOH. Proteins were quantified by the modified Lowry assay (Peterson, 1977), carbohydrates were determined by the sulphuric acid/phenol method, eDNA was analyzed by PicoGreen (n = 2 independent measurements).
To determine accuracy of the quantitation assays for the analysis of EPS from drinking-water
biofilms and recovery rates of proteins, carbohydrates and DNA after each EPS isolation
procedure, a model EPS solution containing BSA (10 µg mL-1), dextran (5 µg mL-1) and DNA
(1 µg mL-1) at similar concentrations and ratios as determined in the EPS of drinking-water
biofilms was prepared in deionized water. The model EPS solution was subjected to the EPS
isolation procedures by shaking (control), or treatments by CER, formaldehyde, NaOH,
formaldehyde in combination with NaOH, EDTA or heat.
EPS isolation by shaking (control), CER or heat resulted in protein and carbohydrate recovery
close to 100 % of the initial concentrations of the model EPS solution (Fig. 4.12). DNA was
recovered at lower concentrations after treatment by shaking, CER and heat, showing 57 %,
84 % and 60 % of the initial concentration, respectively. Dialysis of the EPS solutions isolated
by shaking or CER treatment resulted in a loss of protein by approximately 43 %,
carbohydrates and DNA were only marginally reduced by dialysis.
Exposure of the model EPS solution to EDTA, formaldehyde, NaOH or formaldehyde in
combination with NaOH resulted in similar interferences of subsequent quantitation
methods as described before for EPS isolated from drinking-water biofilms and blank
-100
0
100
200
300
400
500
600
700
Proteins Carbohydrates DNA
Co
ncen
trati
on
[µ
g m
L-1
]
EDTA
H2CO
NaOH
H2CO/NaOH
Results
100
samples (deionized water) (Fig. 4.12). EDTA caused values 30 times higher for proteins, 1.9
times higher for carbohydrates and 1.5 times higher for DNA than prepared in the model
EPS. Samples treated with formaldehyde showed a recovery of only 25 % of proteins, 860 %
of carbohydrates, or 29 % of DNA present in the model EPS. NaOH or formaldehyde/NaOH
exposed model EPS showed no presence of proteins, while carbohydrate concentration was
2.6 fold and 13.7 fold higher, respectively, and DNA concentration was 85 fold or 87 fold
lower, respectively. Dialysis of the model EPS against deionized water could to some extent
reduce interfering effects of the chemicals.
Figure 4.12: Recovery of proteins, carbohydrates and DNA in a model EPS solutions (10 µg mL-1
BSA, 5 µg mL-1
dextran, 1 µg mL
-1 DNA) after treatments by shaking (Vortex), CER, formaldehyde, NaOH, formaldehyde/NaOH,
EDTA or heat as used for the isolation of EPS from drinking-water biofilms. Proteins were quantified by the modified Lowry assay (Peterson, 1977), carbohydrates were determined by the sulphuric acid/phenol method, DNA was analyzed by PicoGreen (n = 2 independent measurements).
4.3.2 Qualitative comparison of isolated EPS proteins
The isolation procedures were further evaluated for the suitability of the isolated EPS
proteins for qualitative analysis by 2D gel electrophoresis. Shaking treatment was used as
reference and showed 198 spots in the range between 20 and 200 kDa and a pI of 3 to 10
(Fig. 4.13a). CER treatment resulted in the isolation of a higher diversity of proteins, with up
to 650 spots in the same range (Fig. 4.13b). The highest number of protein spots could be
found at pH 4 and pH 7 and molecular weights of 21.5 kDa and 55.4 kDa. EPS isolated with
formaldehyde/NaOH showed a smear in the acidic region of the gel and only a small number
of focused protein spots, including two spots corresponding to the DNase Benzonase used
0
20
40
60
80
100
120
140
160
180
200
Reco
very
of
pro
tein
s [
%]
undialyzed
dialyzed
100 % = 10 µg/mL BSA
0
50
100
150
200
250
300
350
400
450
500
Reco
very
of
carb
oh
yd
rate
s [
%]
undialyzed
dialyzed
100 % = 5 µg/mL Dextran
0
20
40
60
80
100
120
140
160
180
200
220
240
Reco
very
of
DN
A [
%]
undialyzed
dialyzed
100 % = 1 µg/mL DNA
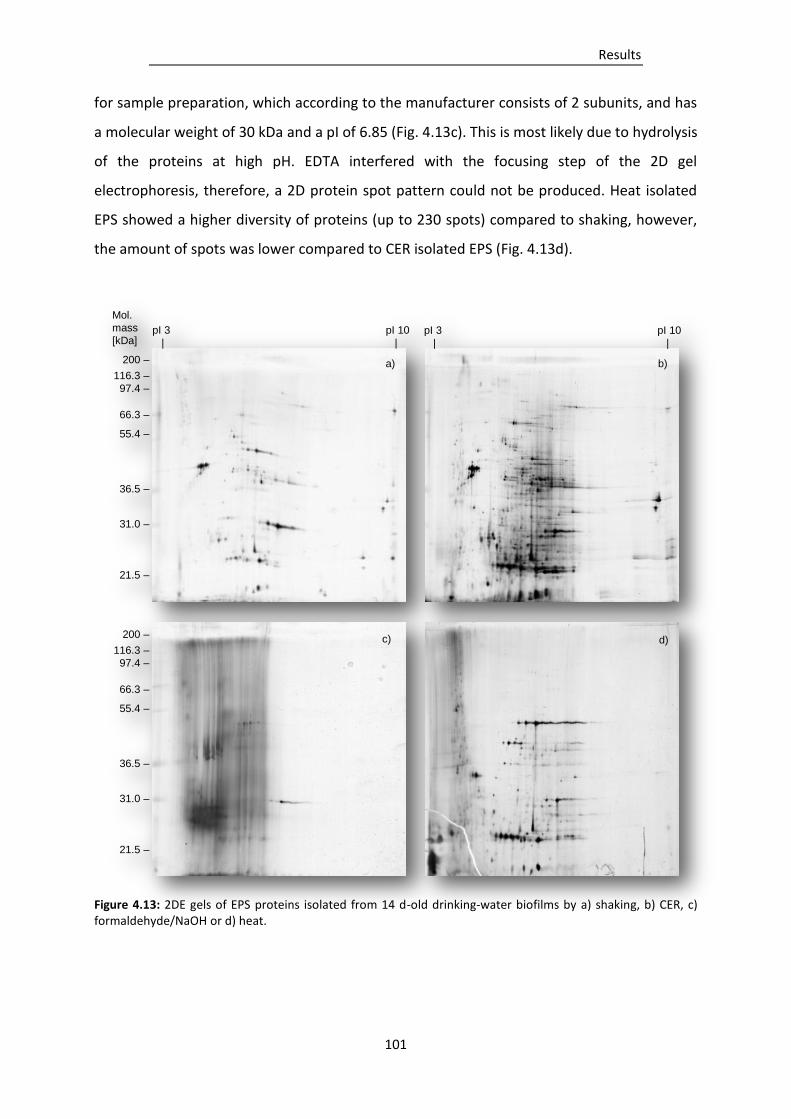
Results
101
for sample preparation, which according to the manufacturer consists of 2 subunits, and has
a molecular weight of 30 kDa and a pI of 6.85 (Fig. 4.13c). This is most likely due to hydrolysis
of the proteins at high pH. EDTA interfered with the focusing step of the 2D gel
electrophoresis, therefore, a 2D protein spot pattern could not be produced. Heat isolated
EPS showed a higher diversity of proteins (up to 230 spots) compared to shaking, however,
the amount of spots was lower compared to CER isolated EPS (Fig. 4.13d).
Figure 4.13: 2DE gels of EPS proteins isolated from 14 d-old drinking-water biofilms by a) shaking, b) CER, c) formaldehyde/NaOH or d) heat.
Mol.
mass
[kDa]
200 –
116.3 –
97.4 –
66.3 –
55.4 –
36.5 –
31.0 –
21.5 –
200 –
116.3 –
97.4 –
66.3 –
55.4 –
36.5 –
31.0 –
21.5 –
pI 3 pI 10
| |
pI 3 pI 10
| |
d)
a) b)
c)
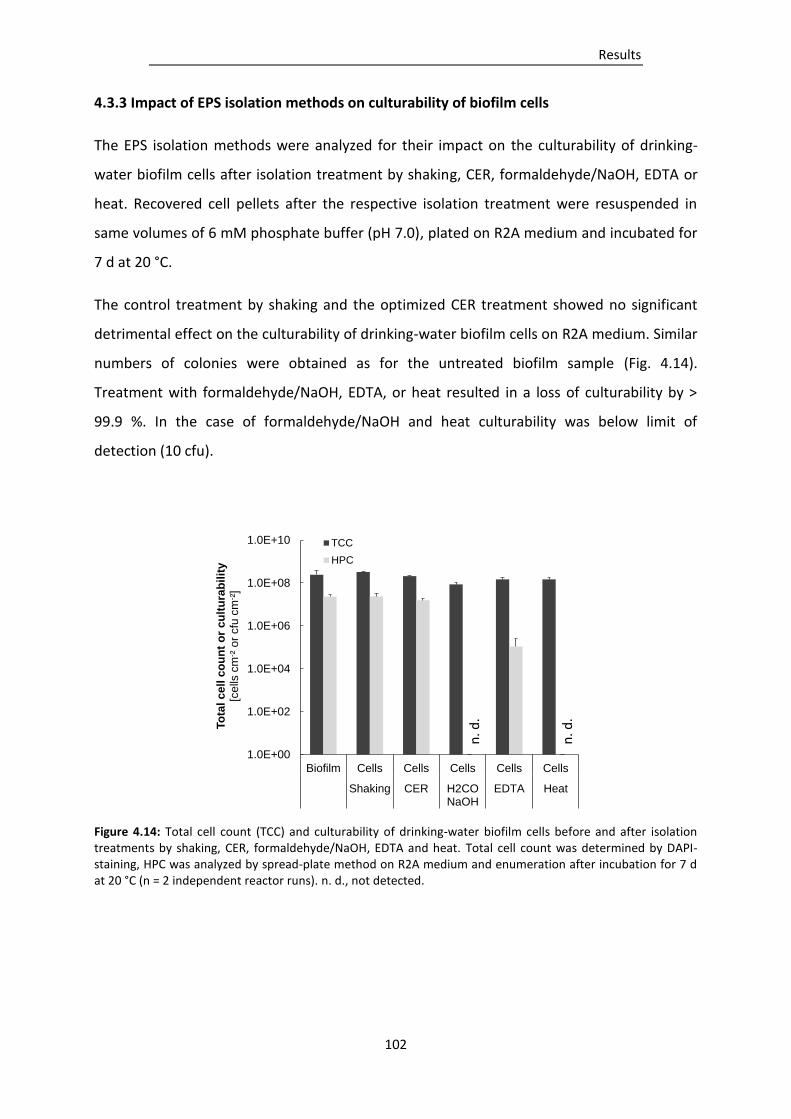
Results
102
4.3.3 Impact of EPS isolation methods on culturability of biofilm cells
The EPS isolation methods were analyzed for their impact on the culturability of drinking-
water biofilm cells after isolation treatment by shaking, CER, formaldehyde/NaOH, EDTA or
heat. Recovered cell pellets after the respective isolation treatment were resuspended in
same volumes of 6 mM phosphate buffer (pH 7.0), plated on R2A medium and incubated for
7 d at 20 °C.
The control treatment by shaking and the optimized CER treatment showed no significant
detrimental effect on the culturability of drinking-water biofilm cells on R2A medium. Similar
numbers of colonies were obtained as for the untreated biofilm sample (Fig. 4.14).
Treatment with formaldehyde/NaOH, EDTA, or heat resulted in a loss of culturability by >
99.9 %. In the case of formaldehyde/NaOH and heat culturability was below limit of
detection (10 cfu).
Figure 4.14: Total cell count (TCC) and culturability of drinking-water biofilm cells before and after isolation treatments by shaking, CER, formaldehyde/NaOH, EDTA and heat. Total cell count was determined by DAPI-staining, HPC was analyzed by spread-plate method on R2A medium and enumeration after incubation for 7 d at 20 °C (n = 2 independent reactor runs). n. d., not detected.
1.0E+00
1.0E+02
1.0E+04
1.0E+06
1.0E+08
1.0E+10
Biofilm Cells Cells Cells Cells Cells
Shaking CER H2CONaOH
EDTA Heat
To
tal cell
co
un
t o
r cu
ltu
rab
ilit
y[c
ells
cm
- ² o
r cfu
cm
- ²]
TCC
HPC
n. d
.
n. d
.
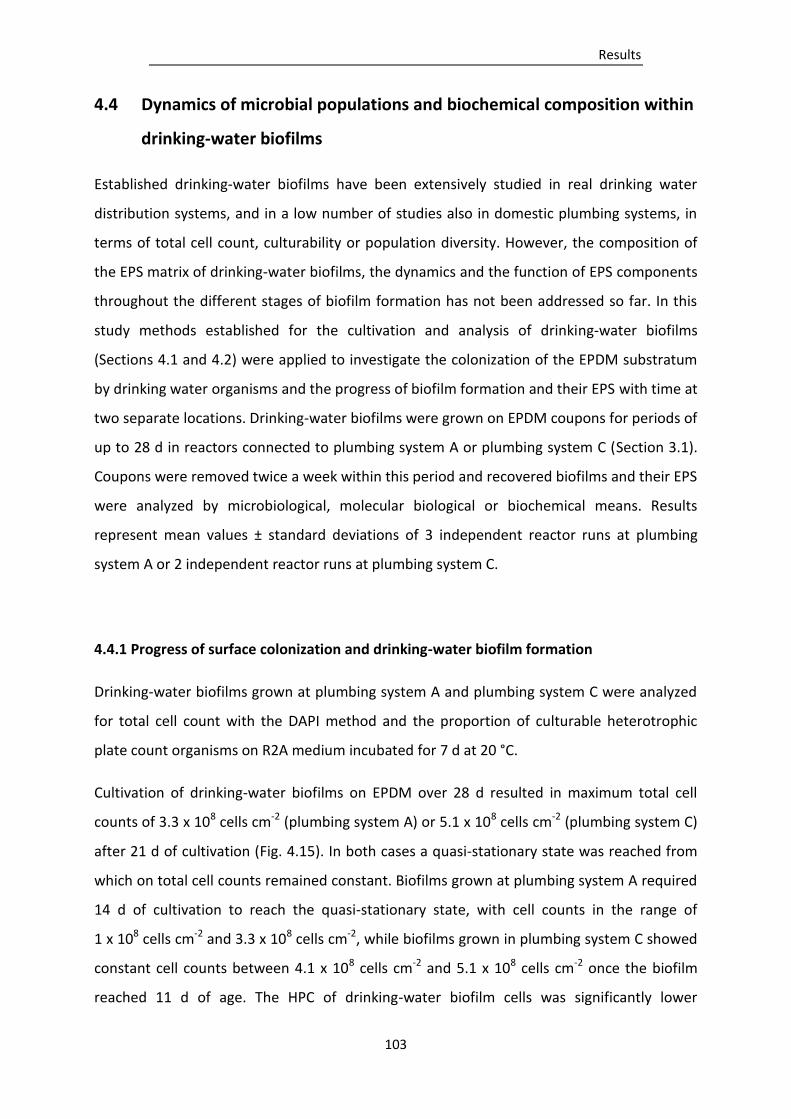
Results
103
4.4 Dynamics of microbial populations and biochemical composition within
drinking-water biofilms
Established drinking-water biofilms have been extensively studied in real drinking water
distribution systems, and in a low number of studies also in domestic plumbing systems, in
terms of total cell count, culturability or population diversity. However, the composition of
the EPS matrix of drinking-water biofilms, the dynamics and the function of EPS components
throughout the different stages of biofilm formation has not been addressed so far. In this
study methods established for the cultivation and analysis of drinking-water biofilms
(Sections 4.1 and 4.2) were applied to investigate the colonization of the EPDM substratum
by drinking water organisms and the progress of biofilm formation and their EPS with time at
two separate locations. Drinking-water biofilms were grown on EPDM coupons for periods of
up to 28 d in reactors connected to plumbing system A or plumbing system C (Section 3.1).
Coupons were removed twice a week within this period and recovered biofilms and their EPS
were analyzed by microbiological, molecular biological or biochemical means. Results
represent mean values ± standard deviations of 3 independent reactor runs at plumbing
system A or 2 independent reactor runs at plumbing system C.
4.4.1 Progress of surface colonization and drinking-water biofilm formation
Drinking-water biofilms grown at plumbing system A and plumbing system C were analyzed
for total cell count with the DAPI method and the proportion of culturable heterotrophic
plate count organisms on R2A medium incubated for 7 d at 20 °C.
Cultivation of drinking-water biofilms on EPDM over 28 d resulted in maximum total cell
counts of 3.3 x 10⁸ cells cm-2 (plumbing system A) or 5.1 x 10⁸ cells cm-2 (plumbing system C)
after 21 d of cultivation (Fig. 4.15). In both cases a quasi-stationary state was reached from
which on total cell counts remained constant. Biofilms grown at plumbing system A required
14 d of cultivation to reach the quasi-stationary state, with cell counts in the range of
1 x 10⁸ cells cm-2 and 3.3 x 10⁸ cells cm-2, while biofilms grown in plumbing system C showed
constant cell counts between 4.1 x 10⁸ cells cm-2 and 5.1 x 10⁸ cells cm-2 once the biofilm
reached 11 d of age. The HPC of drinking-water biofilm cells was significantly lower
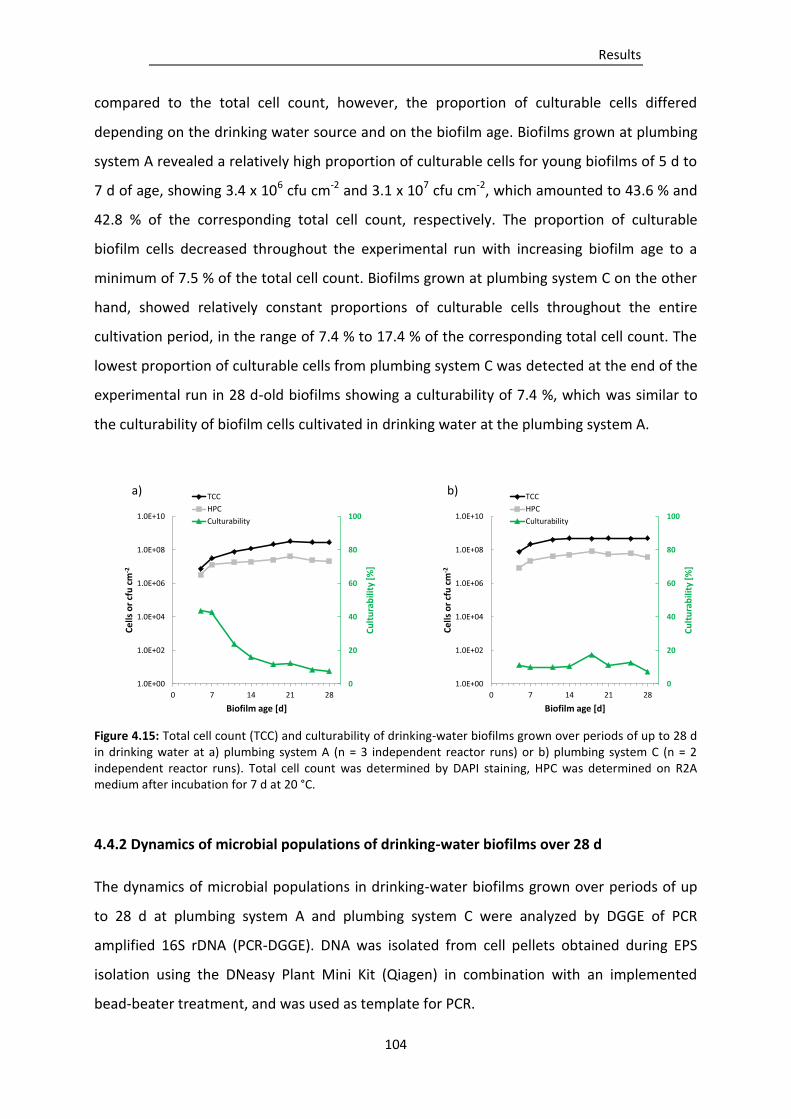
Results
104
compared to the total cell count, however, the proportion of culturable cells differed
depending on the drinking water source and on the biofilm age. Biofilms grown at plumbing
system A revealed a relatively high proportion of culturable cells for young biofilms of 5 d to
7 d of age, showing 3.4 x 10⁶ cfu cm-2 and 3.1 x 10⁷ cfu cm-2, which amounted to 43.6 % and
42.8 % of the corresponding total cell count, respectively. The proportion of culturable
biofilm cells decreased throughout the experimental run with increasing biofilm age to a
minimum of 7.5 % of the total cell count. Biofilms grown at plumbing system C on the other
hand, showed relatively constant proportions of culturable cells throughout the entire
cultivation period, in the range of 7.4 % to 17.4 % of the corresponding total cell count. The
lowest proportion of culturable cells from plumbing system C was detected at the end of the
experimental run in 28 d-old biofilms showing a culturability of 7.4 %, which was similar to
the culturability of biofilm cells cultivated in drinking water at the plumbing system A.
Figure 4.15: Total cell count (TCC) and culturability of drinking-water biofilms grown over periods of up to 28 d in drinking water at a) plumbing system A (n = 3 independent reactor runs) or b) plumbing system C (n = 2 independent reactor runs). Total cell count was determined by DAPI staining, HPC was determined on R2A medium after incubation for 7 d at 20 °C.
4.4.2 Dynamics of microbial populations of drinking-water biofilms over 28 d
The dynamics of microbial populations in drinking-water biofilms grown over periods of up
to 28 d at plumbing system A and plumbing system C were analyzed by DGGE of PCR
amplified 16S rDNA (PCR-DGGE). DNA was isolated from cell pellets obtained during EPS
isolation using the DNeasy Plant Mini Kit (Qiagen) in combination with an implemented
bead-beater treatment, and was used as template for PCR.
a) b)
0
20
40
60
80
100
1.0E+00
1.0E+02
1.0E+04
1.0E+06
1.0E+08
1.0E+10
0 7 14 21 28
Cu
ltu
rab
ility
[%
]
Ce
lls o
r cf
u c
m-2
Biofilm age [d]
TCC
HPC
Culturability
0
20
40
60
80
100
1.0E+00
1.0E+02
1.0E+04
1.0E+06
1.0E+08
1.0E+10
0 7 14 21 28C
ult
ura
bili
ty [
%]
Ce
lls o
r cf
u c
m-2
Biofilm age [d]
TCC
HPC
Culturability
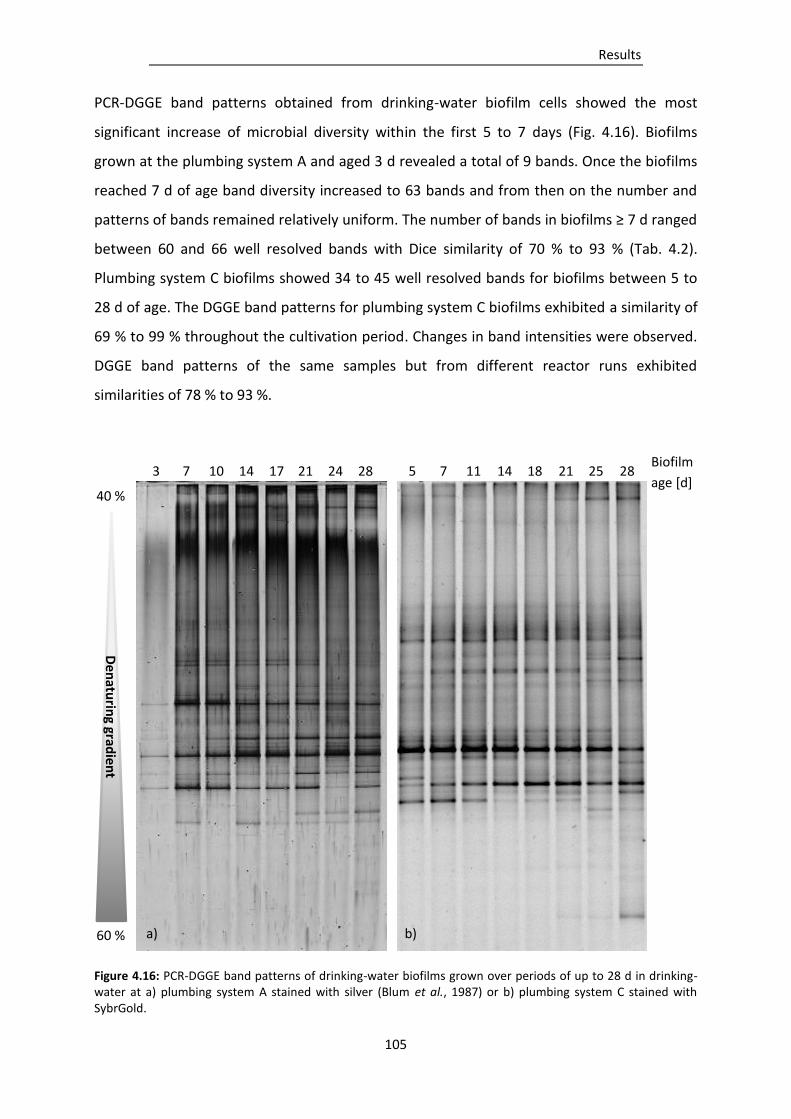
Results
105
PCR-DGGE band patterns obtained from drinking-water biofilm cells showed the most
significant increase of microbial diversity within the first 5 to 7 days (Fig. 4.16). Biofilms
grown at the plumbing system A and aged 3 d revealed a total of 9 bands. Once the biofilms
reached 7 d of age band diversity increased to 63 bands and from then on the number and
patterns of bands remained relatively uniform. The number of bands in biofilms ≥ 7 d ranged
between 60 and 66 well resolved bands with Dice similarity of 70 % to 93 % (Tab. 4.2).
Plumbing system C biofilms showed 34 to 45 well resolved bands for biofilms between 5 to
28 d of age. The DGGE band patterns for plumbing system C biofilms exhibited a similarity of
69 % to 99 % throughout the cultivation period. Changes in band intensities were observed.
DGGE band patterns of the same samples but from different reactor runs exhibited
similarities of 78 % to 93 %.
Figure 4.16: PCR-DGGE band patterns of drinking-water biofilms grown over periods of up to 28 d in drinking-water at a) plumbing system A stained with silver (Blum et al., 1987) or b) plumbing system C stained with SybrGold.
40 %
60 %
De
natu
ring grad
ient
3 7 10 14 17 21 24 28 5 7 11 14 18 21 25 28 Biofilm
age [d]
a) b)
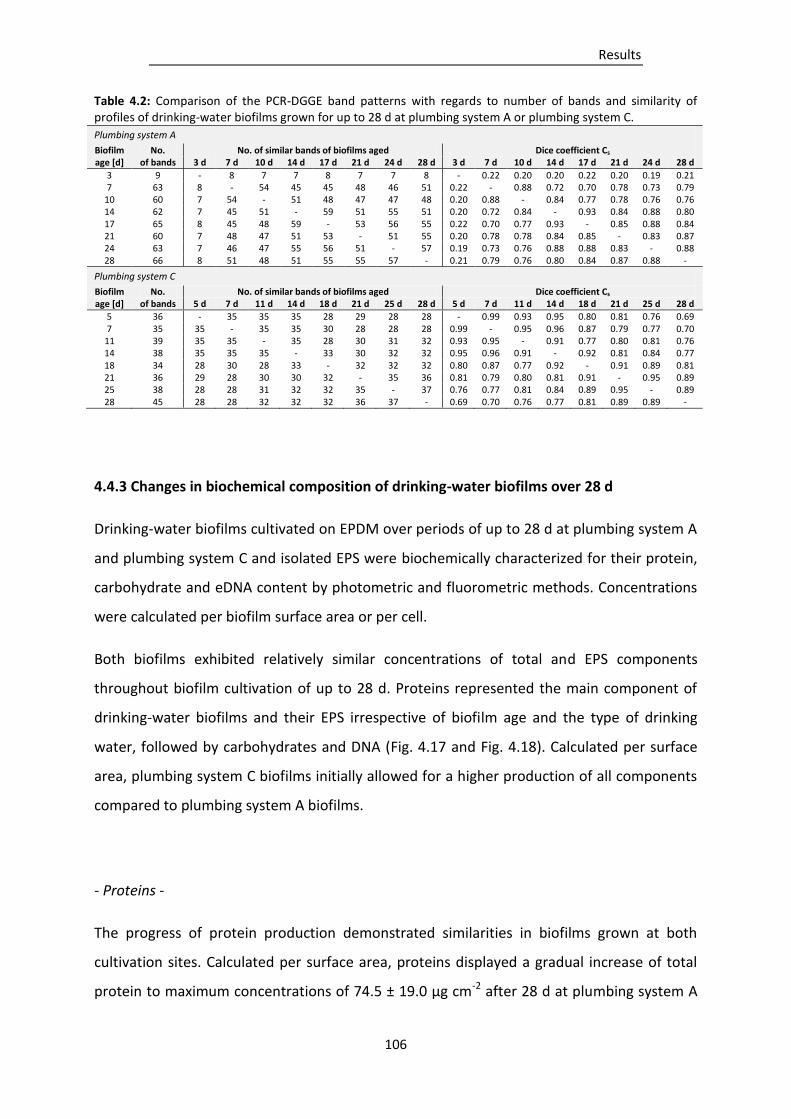
Results
106
Table 4.2: Comparison of the PCR-DGGE band patterns with regards to number of bands and similarity of profiles of drinking-water biofilms grown for up to 28 d at plumbing system A or plumbing system C.
Plumbing system A
Biofilm No. No. of similar bands of biofilms aged Dice coefficient Cs age [d] of bands 3 d 7 d 10 d 14 d 17 d 21 d 24 d 28 d 3 d 7 d 10 d 14 d 17 d 21 d 24 d 28 d
3 9 - 8 7 7 8 7 7 8 - 0.22 0.20 0.20 0.22 0.20 0.19 0.21 7 63 8 - 54 45 45 48 46 51 0.22 - 0.88 0.72 0.70 0.78 0.73 0.79
10 60 7 54 - 51 48 47 47 48 0.20 0.88 - 0.84 0.77 0.78 0.76 0.76 14 62 7 45 51 - 59 51 55 51 0.20 0.72 0.84 - 0.93 0.84 0.88 0.80 17 65 8 45 48 59 - 53 56 55 0.22 0.70 0.77 0.93 - 0.85 0.88 0.84 21 60 7 48 47 51 53 - 51 55 0.20 0.78 0.78 0.84 0.85 - 0.83 0.87 24 63 7 46 47 55 56 51 - 57 0.19 0.73 0.76 0.88 0.88 0.83 - 0.88 28 66 8 51 48 51 55 55 57 - 0.21 0.79 0.76 0.80 0.84 0.87 0.88 -
Plumbing system C
Biofilm No. No. of similar bands of biofilms aged Dice coefficient Cs age [d] of bands 5 d 7 d 11 d 14 d 18 d 21 d 25 d 28 d 5 d 7 d 11 d 14 d 18 d 21 d 25 d 28 d
5 36 - 35 35 35 28 29 28 28 - 0.99 0.93 0.95 0.80 0.81 0.76 0.69 7 35 35 - 35 35 30 28 28 28 0.99 - 0.95 0.96 0.87 0.79 0.77 0.70
11 39 35 35 - 35 28 30 31 32 0.93 0.95 - 0.91 0.77 0.80 0.81 0.76 14 38 35 35 35 - 33 30 32 32 0.95 0.96 0.91 - 0.92 0.81 0.84 0.77 18 34 28 30 28 33 - 32 32 32 0.80 0.87 0.77 0.92 - 0.91 0.89 0.81 21 36 29 28 30 30 32 - 35 36 0.81 0.79 0.80 0.81 0.91 - 0.95 0.89 25 38 28 28 31 32 32 35 - 37 0.76 0.77 0.81 0.84 0.89 0.95 - 0.89 28 45 28 28 32 32 32 36 37 - 0.69 0.70 0.76 0.77 0.81 0.89 0.89 -
4.4.3 Changes in biochemical composition of drinking-water biofilms over 28 d
Drinking-water biofilms cultivated on EPDM over periods of up to 28 d at plumbing system A
and plumbing system C and isolated EPS were biochemically characterized for their protein,
carbohydrate and eDNA content by photometric and fluorometric methods. Concentrations
were calculated per biofilm surface area or per cell.
Both biofilms exhibited relatively similar concentrations of total and EPS components
throughout biofilm cultivation of up to 28 d. Proteins represented the main component of
drinking-water biofilms and their EPS irrespective of biofilm age and the type of drinking
water, followed by carbohydrates and DNA (Fig. 4.17 and Fig. 4.18). Calculated per surface
area, plumbing system C biofilms initially allowed for a higher production of all components
compared to plumbing system A biofilms.
- Proteins -
The progress of protein production demonstrated similarities in biofilms grown at both
cultivation sites. Calculated per surface area, proteins displayed a gradual increase of total
protein to maximum concentrations of 74.5 ± 19.0 µg cm-2 after 28 d at plumbing system A
Results
107
and 81.7 ± 26.1 µg cm-2 after 21 d at plumbing system C (Fig. 4.17 and Fig. 4.18, upper
diagrams). EPS proteins also showed a gradual increase of concentrations throughout the
cultivation period, however, the increase of EPS proteins in biofilms grown at plumbing
system A was more pronounced, reaching values of 9.7 ± 2.9 µg cm-2 after 28 d, compared to
EPS proteins from plumbing system C biofilms, which showed a maximum concentration of
6.2 ± 2.3 µg cm-2 after 21 d. The overall progress of biochemical composition of drinking-
water biofilms as well as of their EPS did not correlate with total cell counts and calculation
of proteins produced per cell exhibited an altered development compared to calculations
per surface area (Fig. 4.17 and Fig. 4.18, lower diagrams). Both biofilms exhibited a
considerable decrease of protein amounts expressed per cell for the initial stages of biofilm
formation of up to 21 d, followed by an increase until the end of the experimental run. EPS
protein concentrations of both biofilms also displayed an initial decrease of concentrations
for the first 7 d of cultivation. From then on, EPS protein concentrations from plumbing
system A biofilms increased continuously to 35.5 ± 12.9 fg cell-1 after 28 d. EPS proteins from
plumbing system C biofilms, on the other hand, showed only a slight increase in the further
progress of biofilm formation to maximum concentrations of 12.0 ± 1.4 fg cell-1.
- Carbohydrates -
Carbohydrate concentrations of biofilms grown at plumbing system A exhibited a similar
trend in progress as was the case for proteins. Considered per surface area, concentrations
of total as well as EPS carbohydrate concentrations increased continuously throughout the
cultivation period (Fig. 4.17, upper diagrams). Total carbohydrates calculated per cell
showed a similar decrease of concentrations from day 5 to day 21, as was the case for
proteins, with a subsequent increase until the end of the experimental run (Fig. 4.17, lower
diagrams). Carbohydrate concentrations of biofilms grown at plumbing system C showed an
altered progress compared to carbohydrates from plumbing system A biofilms. Total
carbohydrate concentration calculated per biofilm area showed a saturation curve-like
development, showing a strong increase for the initial 14 d of cultivation and from this day
on fluctuating concentrations in the range between 18.8 ± 1.7 µg cm-2 and 28.3 ± 4.0 µg cm-2
(Fig. 4.18, upper diagrams). EPS carbohydrates isolated from plumbing system C biofilms
Results
108
considered per surface area showed a continuous increase of concentration for the initial
18 d, and from then on relatively constant values. Calculated per cell, total carbohydrate
concentration from plumbing system C biofilms decreased for the initial 18 d and from then
on remained in the range of 32.1 ± 4.0 fg cell-1 and 47.1 ± 6.6 fg cell-1 (Fig. 4.18, lower
diagrams). EPS carbohydrate concentration produced per cell showed relatively constant
values, with highest concentrations at the beginning of the experimental run.
- eDNA -
Extracellular DNA in biofilms grown at plumbing system A as well as at plumbing system C
exhibited a saturation curve-like development of concentrations calculated per surface area
(Fig. 4.17 and Fig. 4.18, upper diagrams). Plumbing system A biofilms showed the most
significant increase in eDNA concentration for the initial 21 d, from which on the
concentration increased only slightly to values of 0.36 ± 0.06 µg cm-2 after 28d. eDNA
concentrations in plumbing system C biofilms increased more steeply, reaching constancy
after 14 d at concentrations of 0.47 ± 0.19 µg cm-2. The concentrations of eDNA determined
per cell displayed a sharp decline with increasing biofilm age for the initial 18 d (plumbing
system A biofilms) or 11 d (plumbing system C biofilms) and in both cases remained constant
until the end of the experimental run (Fig. 4.17 and Fig. 4.18, lower diagrams).
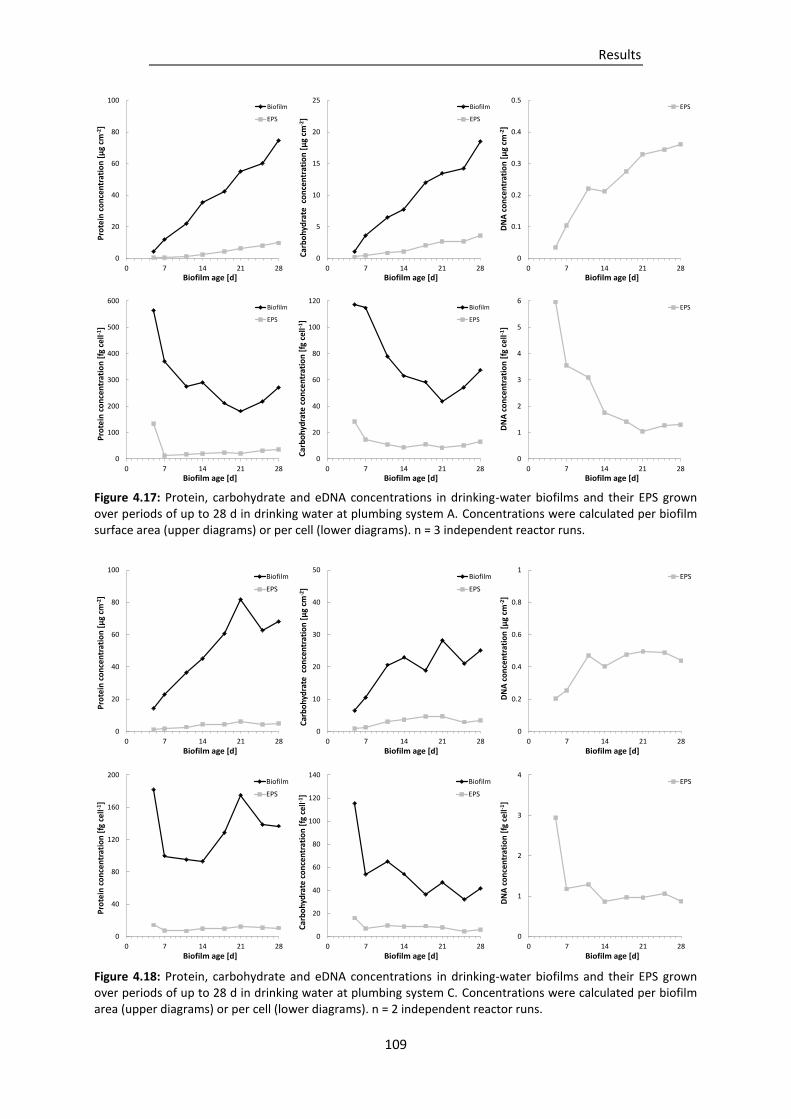
Results
109
Figure 4.17: Protein, carbohydrate and eDNA concentrations in drinking-water biofilms and their EPS grown over periods of up to 28 d in drinking water at plumbing system A. Concentrations were calculated per biofilm surface area (upper diagrams) or per cell (lower diagrams). n = 3 independent reactor runs.
Figure 4.18: Protein, carbohydrate and eDNA concentrations in drinking-water biofilms and their EPS grown over periods of up to 28 d in drinking water at plumbing system C. Concentrations were calculated per biofilm area (upper diagrams) or per cell (lower diagrams). n = 2 independent reactor runs.
0
20
40
60
80
100
0 7 14 21 28
Pro
tein
co
nce
ntr
atio
n [
µg
cm-2
]
Biofilm age [d]
Biofilm
EPS
0
100
200
300
400
500
600
0 7 14 21 28
Pro
tein
co
nce
ntr
atio
n [
fg c
ell-1
]
Biofilm age [d]
Biofilm
EPS
0
5
10
15
20
25
0 7 14 21 28
Car
bo
hyd
rate
co
nce
ntr
atio
n [
µg
cm-2
]
Biofilm age [d]
Biofilm
EPS
0
20
40
60
80
100
120
0 7 14 21 28
Car
bo
hyd
rate
co
nce
ntr
atio
n [
fg c
ell-1
]
Biofilm age [d]
Biofilm
EPS
0
0.1
0.2
0.3
0.4
0.5
0 7 14 21 28
DN
A c
on
cen
trat
ion
[µ
g cm
-2]
Biofilm age [d]
EPS
0
1
2
3
4
5
6
0 7 14 21 28
DN
A c
on
cen
trat
ion
[fg
cel
l-1]
Biofilm age [d]
EPS
0
20
40
60
80
100
0 7 14 21 28
Pro
tein
co
nce
ntr
atio
n [
µg
cm-2
]
Biofilm age [d]
Biofilm
EPS
0
40
80
120
160
200
0 7 14 21 28
Pro
tein
co
nce
ntr
atio
n [
fg c
ell-1
]
Biofilm age [d]
Biofilm
EPS
0
10
20
30
40
50
0 7 14 21 28
Car
bo
hyd
rate
co
nce
ntr
atio
n [
µg
cm-2
]
Biofilm age [d]
Biofilm
EPS
0
20
40
60
80
100
120
140
0 7 14 21 28
Car
bo
hyd
rate
co
nce
ntr
atio
n [
fg c
ell-1
]
Biofilm age [d]
Biofilm
EPS
0
0.2
0.4
0.6
0.8
1
0 7 14 21 28
DN
A c
on
cen
trat
ion
[µ
g cm
-2]
Biofilm age [d]
EPS
0
1
2
3
4
0 7 14 21 28
DN
A c
on
cen
trat
ion
[fg
cel
l-1]
Biofilm age [d]
EPS
Results
110
4.4.4 2DE analysis of the dynamics of EPS proteins from drinking-water biofilms
2DE was applied to generate 2-dimensional spot patterns of EPS proteins at different stages
of biofilm formation of drinking-water biofilms. The spot patterns were produced in pH
regions between pH 3 and 10 (linear gradient) and molecular weightes of 21.5 kDa and
200 kDa. The 2DE analysis was performed in two separate reactor runs at plumbing system
A. The diversity of EPS proteins from drinking-water biofilms cultivated at plumbing system A
increased with increasing biofilm age for the first 7 d of cultivation to 520 ± 23 spots and
remained relatively constant until day 18 (Tab. 4.3, Fig. 4.19). The majority of spots lay in the
range between pH 4 and 8 and molecular weightes of 21.5 kDa and 97.4 kDa. Also a number
of acidic proteins (< pI 4) as well as a few basic proteins (> pI 9) could be detected. The
number of spots decreased significantly for biofilms > 18 d, showing a total number of 257 ±
89 spots for 28 d-old biofilms at the end of the experimental run. The decrease of spots was
most apparent for high molecular weight proteins and for proteins with a high pI. After 18 d
of cultivation EPS proteins with molecular weightes > 55.4 kDa as well as EPS proteins with a
pI > 7 disappeared completely. Also the two spots which were attributed to the DNase
Benzonase (Fig. 4.19, encircled in red) used during sample clean-up disappeared. The
decrease of the number, size and pI of proteins and the absence of the Benzonase twin-
spots in samples > 14 d of age indicated enzymatic degradation of proteins by proteases. A
small number of proteins, however, could be detected throughout all stages of the
cultivation (Fig. 4.19, encircled in green), indicating their importance throughout biofilm
formation and maintenance.
Table 4.3: Number of proteins in the EPS isolated from drinking-water biofilms grown for up to 28 d in plumbing system A or plumbing system C resolved by 2DE. n = 2 independent reactor runs for plumbing system A biofilms. n = 1 reactor run for plumbing system C biofilms.
Biofilm age No. of protein spots [d] Plumbing system A Plumbing system C
5 219 ± 71 573 7 520 ± 23 578
10-11 485 ± 235 446 14 475 ± 240 523 18 509 ± 94 440 21 406 ± 26 479 25 354 ± 88 172 28 257 ± 89 150
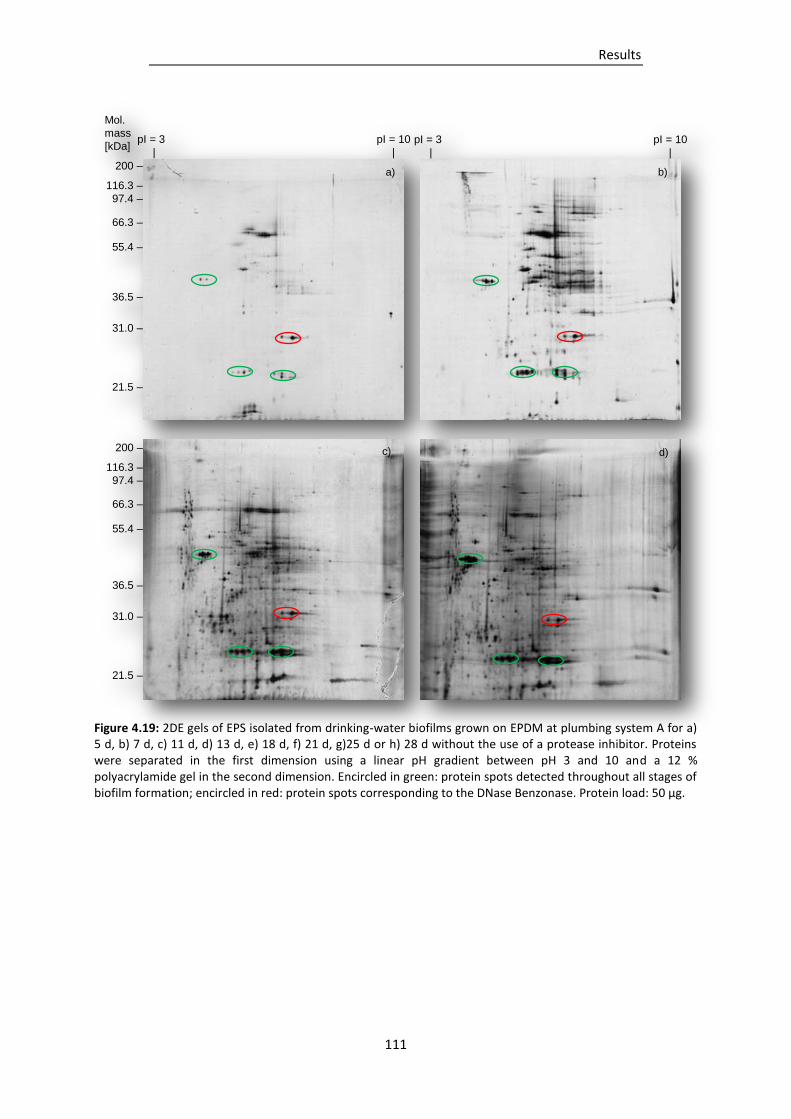
Results
111
Figure 4.19: 2DE gels of EPS isolated from drinking-water biofilms grown on EPDM at plumbing system A for a) 5 d, b) 7 d, c) 11 d, d) 13 d, e) 18 d, f) 21 d, g)25 d or h) 28 d without the use of a protease inhibitor. Proteins were separated in the first dimension using a linear pH gradient between pH 3 and 10 and a 12 % polyacrylamide gel in the second dimension. Encircled in green: protein spots detected throughout all stages of biofilm formation; encircled in red: protein spots corresponding to the DNase Benzonase. Protein load: 50 µg.
Mol.
mass
[kDa]
200 –
116.3 –
97.4 –
66.3 –
55.4 –
36.5 –
31.0 –
21.5 –
pI = 3 pI = 10
| |
pI = 3 pI = 10
| |
200 –
116.3 –
97.4 –
66.3 –
55.4 –
36.5 –
31.0 –
21.5 –
d)
a) b)
c)
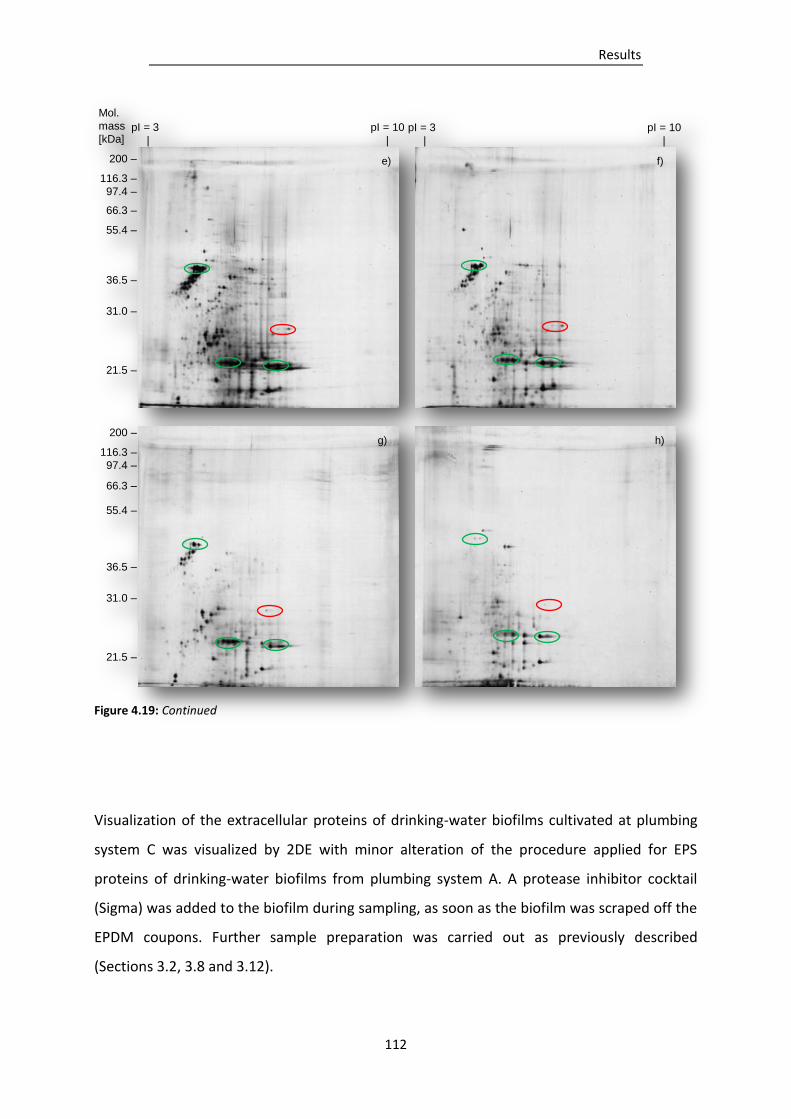
Results
112
Figure 4.19: Continued
Visualization of the extracellular proteins of drinking-water biofilms cultivated at plumbing
system C was visualized by 2DE with minor alteration of the procedure applied for EPS
proteins of drinking-water biofilms from plumbing system A. A protease inhibitor cocktail
(Sigma) was added to the biofilm during sampling, as soon as the biofilm was scraped off the
EPDM coupons. Further sample preparation was carried out as previously described
(Sections 3.2, 3.8 and 3.12).
Mol.
mass
[kDa]
200 –
116.3 –
97.4 –
66.3 –
55.4 –
36.5 –
31.0 –
21.5 –
pI = 3 pI = 10
| |
pI = 3 pI = 10
| |
200 –
116.3 –
97.4 –
66.3 –
55.4 –
36.5 –
31.0 –
21.5 –
h)
e) f)
g)
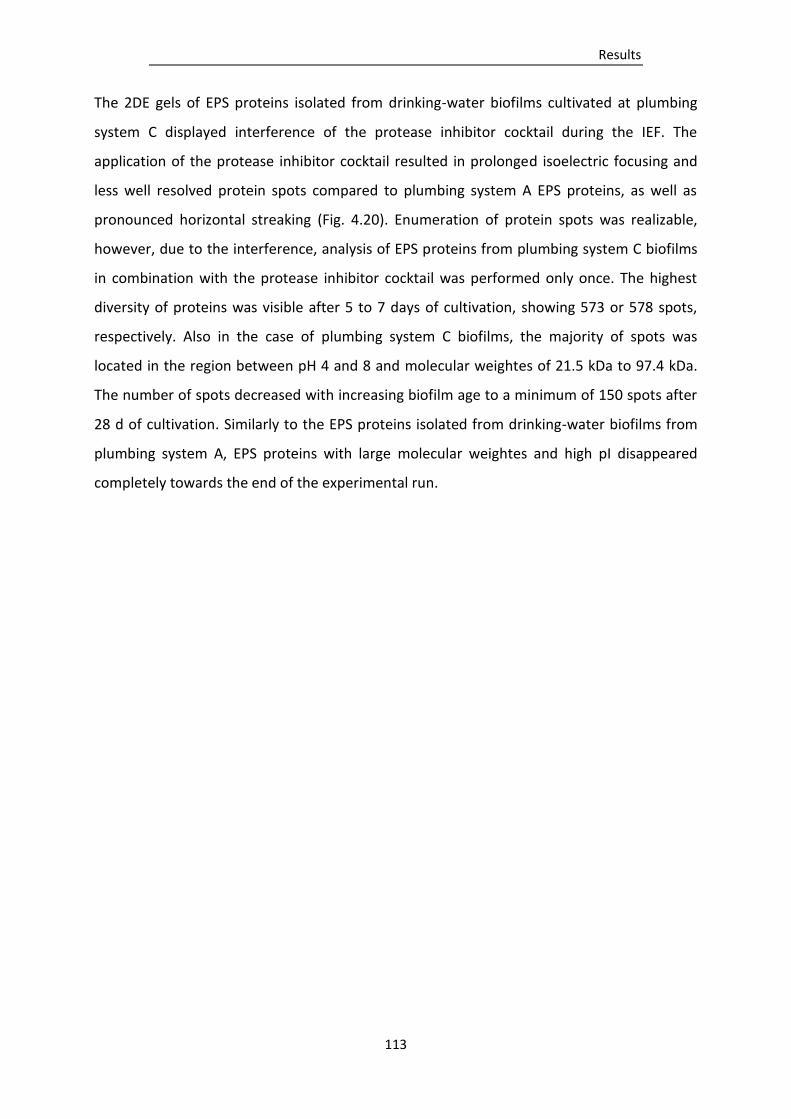
Results
113
The 2DE gels of EPS proteins isolated from drinking-water biofilms cultivated at plumbing
system C displayed interference of the protease inhibitor cocktail during the IEF. The
application of the protease inhibitor cocktail resulted in prolonged isoelectric focusing and
less well resolved protein spots compared to plumbing system A EPS proteins, as well as
pronounced horizontal streaking (Fig. 4.20). Enumeration of protein spots was realizable,
however, due to the interference, analysis of EPS proteins from plumbing system C biofilms
in combination with the protease inhibitor cocktail was performed only once. The highest
diversity of proteins was visible after 5 to 7 days of cultivation, showing 573 or 578 spots,
respectively. Also in the case of plumbing system C biofilms, the majority of spots was
located in the region between pH 4 and 8 and molecular weightes of 21.5 kDa to 97.4 kDa.
The number of spots decreased with increasing biofilm age to a minimum of 150 spots after
28 d of cultivation. Similarly to the EPS proteins isolated from drinking-water biofilms from
plumbing system A, EPS proteins with large molecular weightes and high pI disappeared
completely towards the end of the experimental run.
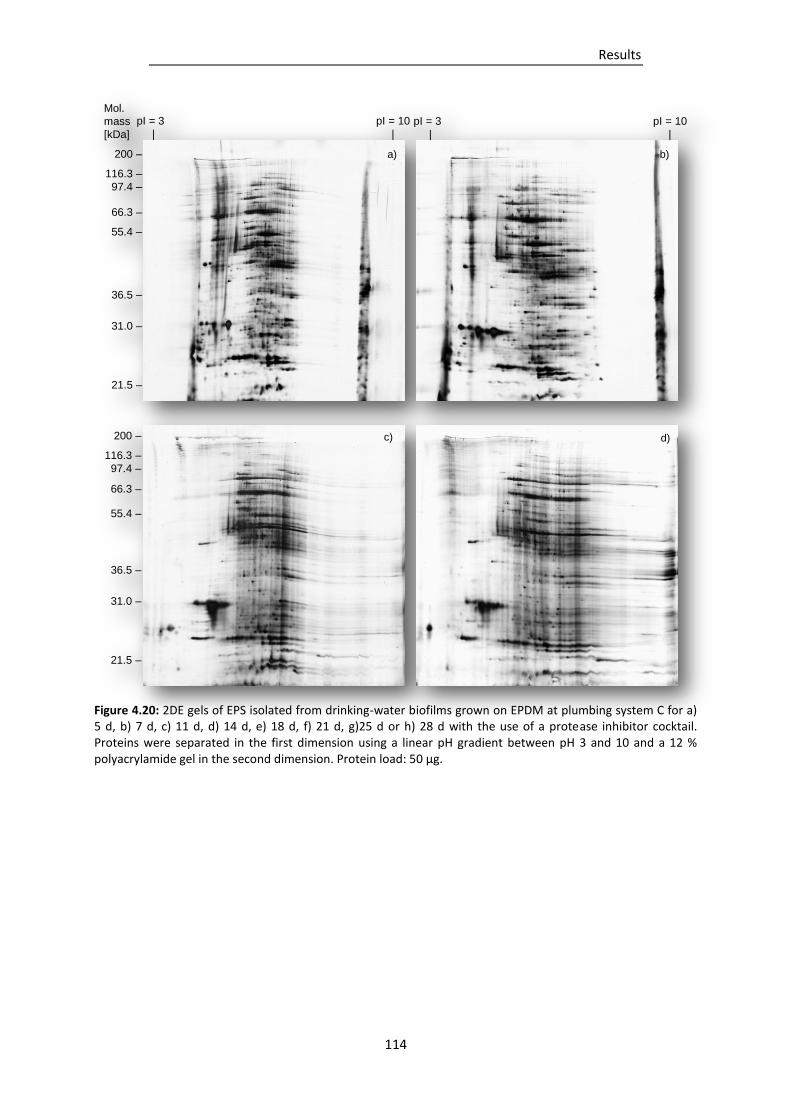
Results
114
Figure 4.20: 2DE gels of EPS isolated from drinking-water biofilms grown on EPDM at plumbing system C for a) 5 d, b) 7 d, c) 11 d, d) 14 d, e) 18 d, f) 21 d, g)25 d or h) 28 d with the use of a protease inhibitor cocktail. Proteins were separated in the first dimension using a linear pH gradient between pH 3 and 10 and a 12 % polyacrylamide gel in the second dimension. Protein load: 50 µg.
Mol.
mass
[kDa]
200 –
116.3 –
97.4 –
66.3 –
55.4 –
36.5 –
31.0 –
21.5 –
pI = 3 pI = 10
| |
pI = 3 pI = 10
| |
200 –
116.3 –
97.4 –
66.3 –
55.4 –
36.5 –
31.0 –
21.5 –
d)
a) b)
c)
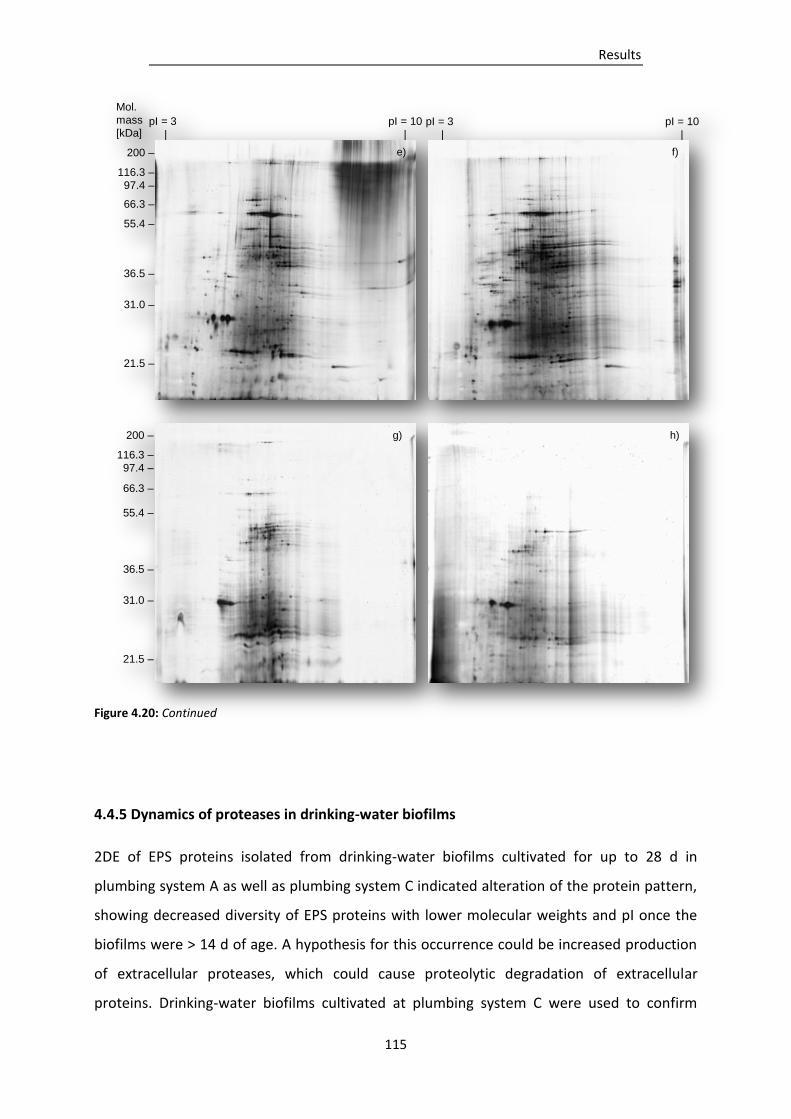
Results
115
Figure 4.20: Continued
4.4.5 Dynamics of proteases in drinking-water biofilms
2DE of EPS proteins isolated from drinking-water biofilms cultivated for up to 28 d in
plumbing system A as well as plumbing system C indicated alteration of the protein pattern,
showing decreased diversity of EPS proteins with lower molecular weights and pI once the
biofilms were > 14 d of age. A hypothesis for this occurrence could be increased production
of extracellular proteases, which could cause proteolytic degradation of extracellular
proteins. Drinking-water biofilms cultivated at plumbing system C were used to confirm
Mol.
mass
[kDa]
200 –
116.3 –
97.4 –
66.3 –
55.4 –
36.5 –
31.0 –
21.5 –
pI = 3 pI = 10
| |
pI = 3 pI = 10
| |
200 –
116.3 –
97.4 –
66.3 –
55.4 –
36.5 –
31.0 –
21.5 –
h)
e) f)
g)
Results
116
presence of proteases in drinking-water biofilms and their EPS and their progress during
biofilm formation. Protease activity was determined by use of gelatin-containing zymogram
gels, which, in presence of protease activity, show clear activity bands at the sites of
protease action. Casein-blue zymogram gels proved to be less sensitive compared to gels
containing gelatin as substrate.
The determination of proteases with zymogram gels could not detect presence of proteases
in 5 d-old or 7 d-old biofilms (Fig. 4.21a) as well as isolated EPS (Fig. 4.21b). Once the
biofilms were 11 d of age slightly cleared areas on the gels in molecular weight regions
> 62 kDa appeared in the biofilm sample and, less pronounced, in the EPS, however, distinct
bands were not obtained. The cleared areas on the gels increased with increasing biofilm
age. After 14 d of cultivation 5 faint but resolved activity bands could be visualized in the
biofilm sample as well as 3 bands in the EPS sample. The number of bands increased to a
maximum of 13 bands in the biofilm sample and 9 bands in the EPS in 28 d-old drinking-
water biofilms. Biofilm suspensions or EPS solutions heated at 98 °C for 30 min served as
negative controls and did not produce activity bands, irrespective of biofilm age.
Figure 4.21: One-dimensional zymogram gels showing protease activity in a) drinking-water biofilms suspensions (protein load per lane: 8.5 µg) or b) EPS solutions (protein load per lane: 0.4 µg) isolated from drinking-water biofilms after cultivation for up to 28 d in plumbing system C using zymogram gels containing gelatin as substrate. Gels were stained with the commercially available Simply Blue Safe Stain. Cleared bands indicate degradation of gelatin by proteases.
Biofilm
age [d] 5 187 11 14 21 25 28M 5 187 11 14 21 25M 28Mol.
Mass
[kDa]
188 –
62 –
49 –
38 –
28 –
18 –
a) b)
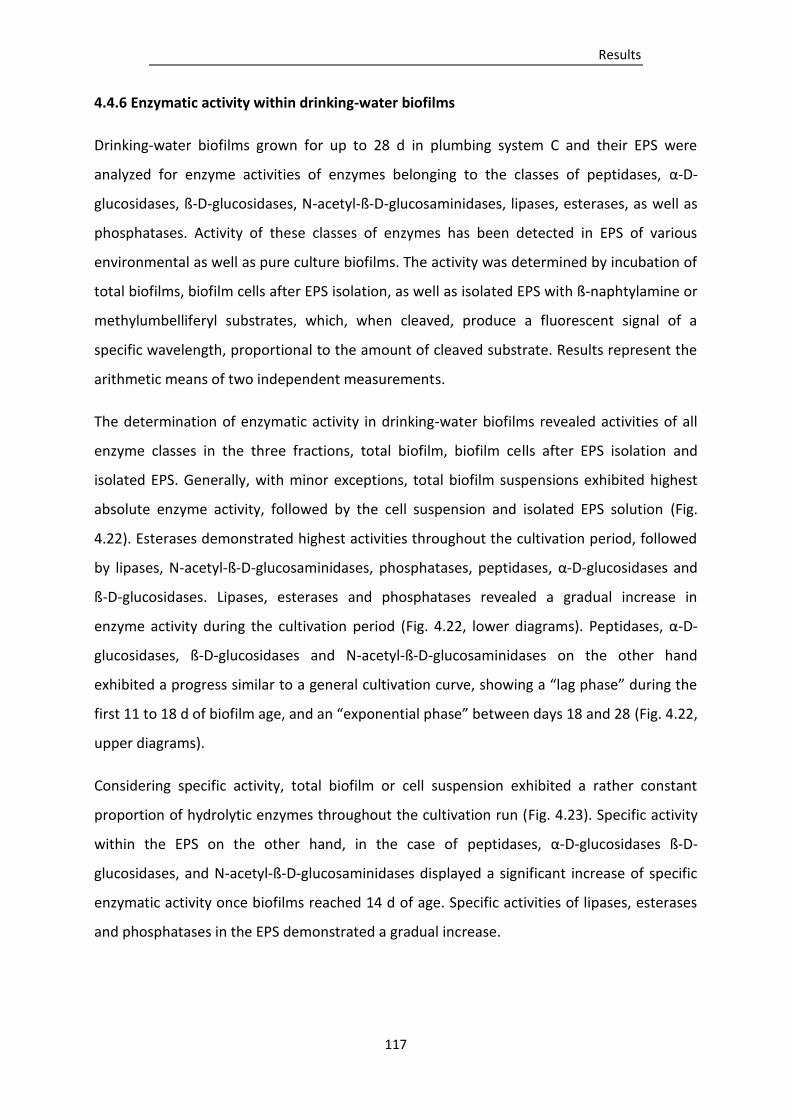
Results
117
4.4.6 Enzymatic activity within drinking-water biofilms
Drinking-water biofilms grown for up to 28 d in plumbing system C and their EPS were
analyzed for enzyme activities of enzymes belonging to the classes of peptidases, α-D-
glucosidases, ß-D-glucosidases, N-acetyl-ß-D-glucosaminidases, lipases, esterases, as well as
phosphatases. Activity of these classes of enzymes has been detected in EPS of various
environmental as well as pure culture biofilms. The activity was determined by incubation of
total biofilms, biofilm cells after EPS isolation, as well as isolated EPS with ß-naphtylamine or
methylumbelliferyl substrates, which, when cleaved, produce a fluorescent signal of a
specific wavelength, proportional to the amount of cleaved substrate. Results represent the
arithmetic means of two independent measurements.
The determination of enzymatic activity in drinking-water biofilms revealed activities of all
enzyme classes in the three fractions, total biofilm, biofilm cells after EPS isolation and
isolated EPS. Generally, with minor exceptions, total biofilm suspensions exhibited highest
absolute enzyme activity, followed by the cell suspension and isolated EPS solution (Fig.
4.22). Esterases demonstrated highest activities throughout the cultivation period, followed
by lipases, N-acetyl-ß-D-glucosaminidases, phosphatases, peptidases, α-D-glucosidases and
ß-D-glucosidases. Lipases, esterases and phosphatases revealed a gradual increase in
enzyme activity during the cultivation period (Fig. 4.22, lower diagrams). Peptidases, α-D-
glucosidases, ß-D-glucosidases and N-acetyl-ß-D-glucosaminidases on the other hand
exhibited a progress similar to a general cultivation curve, showing a “lag phase” during the
first 11 to 18 d of biofilm age, and an “exponential phase” between days 18 and 28 (Fig. 4.22,
upper diagrams).
Considering specific activity, total biofilm or cell suspension exhibited a rather constant
proportion of hydrolytic enzymes throughout the cultivation run (Fig. 4.23). Specific activity
within the EPS on the other hand, in the case of peptidases, α-D-glucosidases ß-D-
glucosidases, and N-acetyl-ß-D-glucosaminidases displayed a significant increase of specific
enzymatic activity once biofilms reached 14 d of age. Specific activities of lipases, esterases
and phosphatases in the EPS demonstrated a gradual increase.
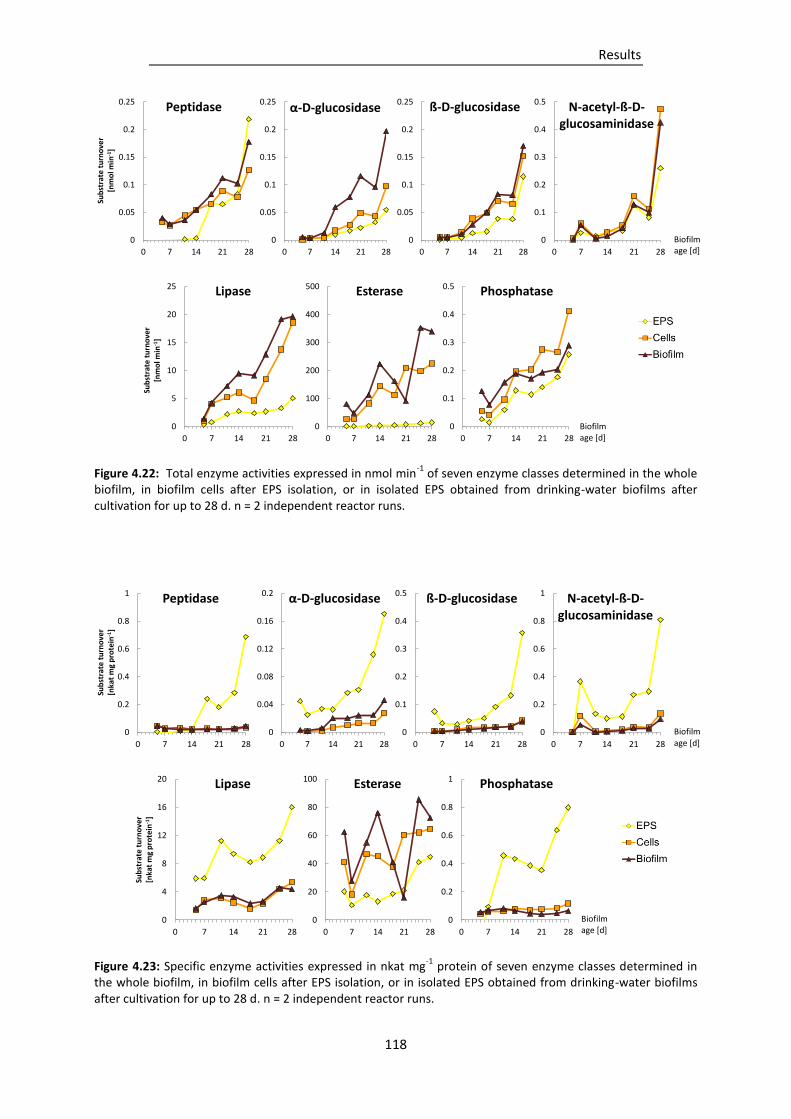
Results
118
Figure 4.22: Total enzyme activities expressed in nmol min-1
of seven enzyme classes determined in the whole biofilm, in biofilm cells after EPS isolation, or in isolated EPS obtained from drinking-water biofilms after cultivation for up to 28 d. n = 2 independent reactor runs.
Figure 4.23: Specific enzyme activities expressed in nkat mg-1
protein of seven enzyme classes determined in the whole biofilm, in biofilm cells after EPS isolation, or in isolated EPS obtained from drinking-water biofilms after cultivation for up to 28 d. n = 2 independent reactor runs.
Biofilm age [d]
Biofilm age [d]
Biofilm age [d]
Biofilm age [d]
0
0.05
0.1
0.15
0.2
0.25
0 7 14 21 28
Sub
stra
te t
urn
ove
r [n
mo
l min
-1]
Peptidase
0
0.05
0.1
0.15
0.2
0.25
0 7 14 21 28
α-D-glucosidase
0
0.05
0.1
0.15
0.2
0.25
0 7 14 21 28
ß-D-glucosidase
0
0.1
0.2
0.3
0.4
0.5
0 7 14 21 28
N-acetyl-ß-D-glucosaminidase
0
100
200
300
400
500
0 7 14 21 28
Esterase
0
5
10
15
20
25
0 7 14 21 28
Sub
stra
te t
urn
ove
r [n
mo
l min
-1]
Lipase
0
0.1
0.2
0.3
0.4
0.5
0 7 14 21 28
Phosphatase
0
0.2
0.4
0.6
0.8
1
0 7 14 21 28
Sub
stra
te t
urn
ove
r [n
kat
mg
pro
tein
-1]
Peptidase
0
0.04
0.08
0.12
0.16
0.2
0 7 14 21 28
α-D-glucosidase
0
0.1
0.2
0.3
0.4
0.5
0 7 14 21 28
ß-D-glucosidase
0
0.2
0.4
0.6
0.8
1
0 7 14 21 28
N-acetyl-ß-D-glucosaminidase
0
20
40
60
80
100
0 7 14 21 28
Esterase
0
4
8
12
16
20
0 7 14 21 28
Sub
stra
te t
urn
ove
r [n
kat
mg
pro
tein
-1]
Lipase
0
0.2
0.4
0.6
0.8
1
0 7 14 21 28
Phosphatase
Results
119
4.5 Comparison of drinking-water biofilms grown at different locations
Characteristics of drinking water can have substantial influence on the development of
drinking-water biofilms. Temperature and pH are in general major factors determining
biofilm growth. Additionally, the chemical composition of bulk water can have a direct
impact on microorganisms in the planktonic or sessile state (Fletcher, 1988; Donlan, 2002).
These parameters can vary considerably among drinking waters from different distribution
systems and in particular once drinking water passes through plumbing systems. In the
present study established methods for biofilm cultivation, EPS isolation and analysis were
applied to investigate the influence of drinking water quality as well as the influence of
plumbing materials made of Cu on biofilm formation, and to determine variability of
composition among drinking-water biofilms and their EPS. Drinking-water biofilms were
cultivated at five different locations for 14 d on EPDM coupons inserted into flow-through
reactors, which were connected to the respective water system. The locations were
distribution system A and plumbing system A, both supplied by water supplier A, distribution
system B and plumbing system B, both supplied by water supplier B, and plumbing system C,
supplied by water supplier C (Section 3.1). 14 d-old drinking-water biofilms from all sites
were analyzed for total cell count, HPC, population diversity and biochemical composition of
total biofilms and their EPS in three independent reactor runs. Wet weights, dry weights,
loss and residue on ignition, as well as water contents were determined in separate biofilm
cultivation runs. Temperature and free chlorine concentrations were monitored regularly
throughout the cultivation runs. Drinking water samples were collected from all location at
the end of two separate cultivation runs from the same taps, which fed the biofilm reactors,
and analyzed for their composition of inorganic substances.
4.5.1 Drinking water composition and characteristics at the cultivation sites
Substantial differences in water characteristics between the drinking waters supplied by the
three water suppliers A, B and C were detected, in particular regarding water temperature,
pH, water hardness, Ca and Mg concentrations and conductivity (Tab. 4.4). During the
experimental periods temperature fluctuations were relatively high for drinking waters
Results
120
obtained at plumbing system A, distribution system B and plumbing system B. The multi-
element analysis showed that all inorganic substances were present in the drinking waters at
concentrations below the permissible limit values set by the German Drinking Water
Ordinance. Differences in composition of inorganic substances were in particular evident for
Ca and Mg, which were among the most abundant ions in all drinking waters. Plumbing
system C, furthermore, revealed highest Fe concentrations (0.12 ± 0.01 mg L-1), while Fe in
all other drinking waters was below the limit of detection (0.01 mg L-1). Within the same
water systems significant changes in Cu concentrations were observed. Drinking waters
sampled from plumbing systems, which in all cases were made of Cu, revealed significantly
higher Cu concentrations in the drinking water compared to the respective distribution
systems. A 61 fold higher concentration was detected in the drinking water sampled from
plumbing system A (0.067 ± 0.019 mg L-1) compared to the drinking water sampled from the
distribution system A (0.0011 ± 0.0004 mg L-1), while Cu in the drinking water sampled from
plumbing system B (0.037 ± 0.001 mg L-1) was 22 fold higher compared to the drinking water
at the distribution system B (0.0017 ± 0.0001 mg L-1). The drinking water collected from
plumbing system C contained highest concentrations of Cu (0.14 ± 0.04 mg L-1).
Concentrations of all other inorganic substances in the drinking waters were similar
comparing water collected from distribution systems to those from the respective plumbing
systems. Free chlorine concentrations were usually below limit of detection (0.01 mg L-1),
with occasional readings of 0.01 mg L-1.
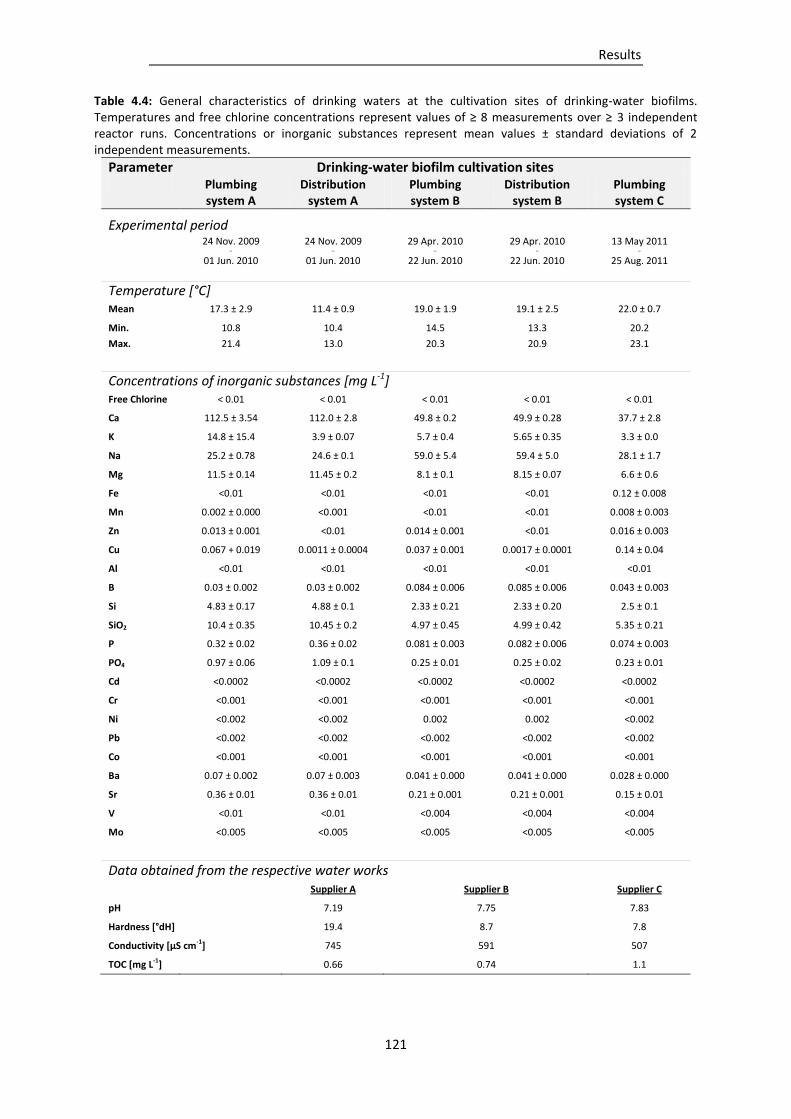
Results
121
Table 4.4: General characteristics of drinking waters at the cultivation sites of drinking-water biofilms. Temperatures and free chlorine concentrations represent values of ≥ 8 measurements over ≥ 3 independent reactor runs. Concentrations or inorganic substances represent mean values ± standard deviations of 2 independent measurements.
Parameter Drinking-water biofilm cultivation sites Plumbing
system A Distribution
system A Plumbing system B
Distribution system B
Plumbing system C
Experimental period
24 Nov. 2009
–
01 Jun. 2010
24 Nov. 2009 –
01 Jun. 2010
29 Apr. 2010 –
22 Jun. 2010
29 Apr. 2010 –
22 Jun. 2010
13 May 2011 –
25 Aug. 2011
Temperature [°C] Mean 17.3 ± 2.9 11.4 ± 0.9 19.0 ± 1.9 19.1 ± 2.5 22.0 ± 0.7
Min. 10.8 10.4 14.5 13.3 20.2
Max. 21.4 13.0 20.3 20.9 23.1
Concentrations of inorganic substances [mg L-1] Free Chlorine < 0.01 < 0.01 < 0.01 < 0.01 < 0.01
Ca 112.5 ± 3.54 112.0 ± 2.8 49.8 ± 0.2 49.9 ± 0.28 37.7 ± 2.8
K 14.8 ± 15.4 3.9 ± 0.07 5.7 ± 0.4 5.65 ± 0.35 3.3 ± 0.0
Na 25.2 ± 0.78 24.6 ± 0.1 59.0 ± 5.4 59.4 ± 5.0 28.1 ± 1.7
Mg 11.5 ± 0.14 11.45 ± 0.2 8.1 ± 0.1 8.15 ± 0.07 6.6 ± 0.6
Fe <0.01 <0.01 <0.01 <0.01 0.12 ± 0.008
Mn 0.002 ± 0.000 <0.001 <0.01 <0.01 0.008 ± 0.003
Zn 0.013 ± 0.001 <0.01 0.014 ± 0.001 <0.01 0.016 ± 0.003
Cu 0.067 + 0.019 0.0011 ± 0.0004 0.037 ± 0.001 0.0017 ± 0.0001 0.14 ± 0.04
Al <0.01 <0.01 <0.01 <0.01 <0.01
B 0.03 ± 0.002 0.03 ± 0.002 0.084 ± 0.006 0.085 ± 0.006 0.043 ± 0.003
Si 4.83 ± 0.17 4.88 ± 0.1 2.33 ± 0.21 2.33 ± 0.20 2.5 ± 0.1
SiO2 10.4 ± 0.35 10.45 ± 0.2 4.97 ± 0.45 4.99 ± 0.42 5.35 ± 0.21
P 0.32 ± 0.02 0.36 ± 0.02 0.081 ± 0.003 0.082 ± 0.006 0.074 ± 0.003
PO4 0.97 ± 0.06 1.09 ± 0.1 0.25 ± 0.01 0.25 ± 0.02 0.23 ± 0.01
Cd <0.0002 <0.0002 <0.0002 <0.0002 <0.0002
Cr <0.001 <0.001 <0.001 <0.001 <0.001
Ni <0.002 <0.002 0.002 0.002 <0.002
Pb <0.002 <0.002 <0.002 <0.002 <0.002
Co <0.001 <0.001 <0.001 <0.001 <0.001
Ba 0.07 ± 0.002 0.07 ± 0.003 0.041 ± 0.000 0.041 ± 0.000 0.028 ± 0.000
Sr 0.36 ± 0.01 0.36 ± 0.01 0.21 ± 0.001 0.21 ± 0.001 0.15 ± 0.01
V <0.01 <0.01 <0.004 <0.004 <0.004
Mo <0.005 <0.005 <0.005 <0.005 <0.005
Data obtained from the respective water works Supplier A Supplier B Supplier C
pH 7.19 7.75 7.83
Hardness [°dH] 19.4 8.7 7.8
Conductivity [µS cm-1] 745 591 507
TOC [mg L-1] 0.66 0.74 1.1
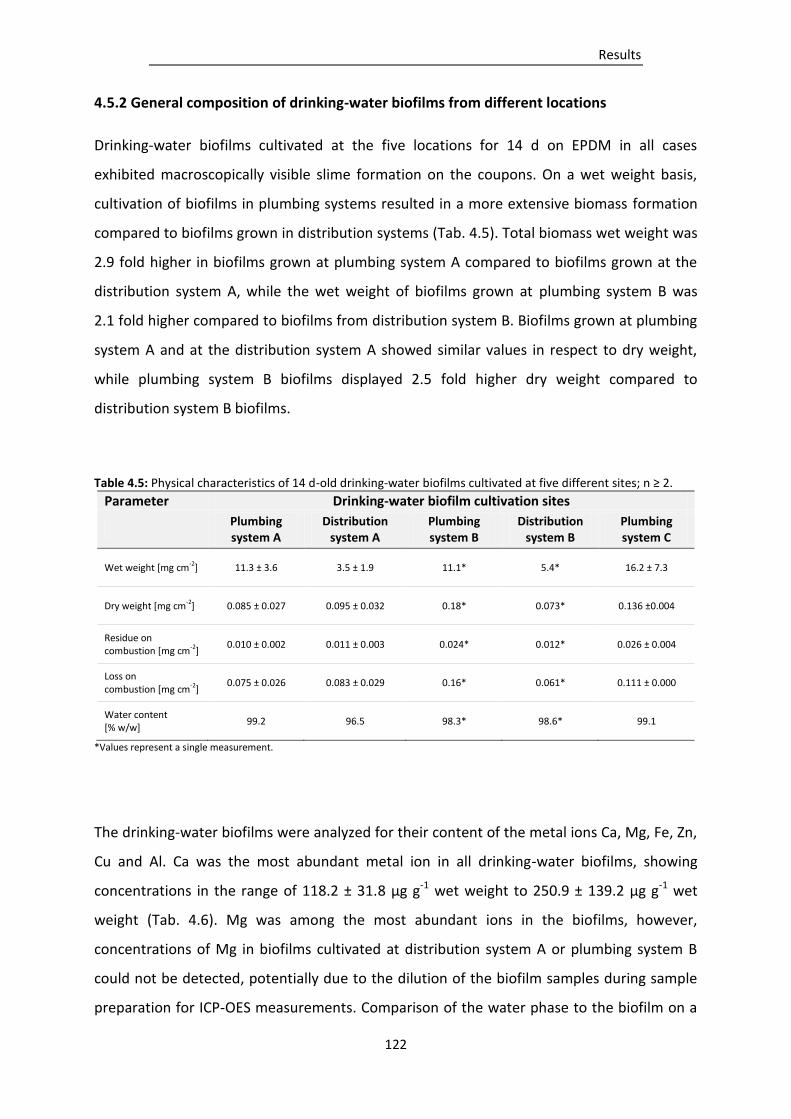
Results
122
4.5.2 General composition of drinking-water biofilms from different locations
Drinking-water biofilms cultivated at the five locations for 14 d on EPDM in all cases
exhibited macroscopically visible slime formation on the coupons. On a wet weight basis,
cultivation of biofilms in plumbing systems resulted in a more extensive biomass formation
compared to biofilms grown in distribution systems (Tab. 4.5). Total biomass wet weight was
2.9 fold higher in biofilms grown at plumbing system A compared to biofilms grown at the
distribution system A, while the wet weight of biofilms grown at plumbing system B was
2.1 fold higher compared to biofilms from distribution system B. Biofilms grown at plumbing
system A and at the distribution system A showed similar values in respect to dry weight,
while plumbing system B biofilms displayed 2.5 fold higher dry weight compared to
distribution system B biofilms.
Table 4.5: Physical characteristics of 14 d-old drinking-water biofilms cultivated at five different sites; n ≥ 2.
Parameter Drinking-water biofilm cultivation sites
Plumbing system A
Distribution system A
Plumbing system B
Distribution system B
Plumbing system C
Wet weight [mg cm-2] 11.3 ± 3.6 3.5 ± 1.9 11.1* 5.4* 16.2 ± 7.3
Dry weight [mg cm-2] 0.085 ± 0.027 0.095 ± 0.032 0.18* 0.073* 0.136 ±0.004
Residue on combustion [mg cm-2]
0.010 ± 0.002 0.011 ± 0.003 0.024* 0.012* 0.026 ± 0.004
Loss on combustion [mg cm-2]
0.075 ± 0.026 0.083 ± 0.029 0.16* 0.061* 0.111 ± 0.000
Water content [% w/w]
99.2 96.5 98.3* 98.6* 99.1
*Values represent a single measurement.
The drinking-water biofilms were analyzed for their content of the metal ions Ca, Mg, Fe, Zn,
Cu and Al. Ca was the most abundant metal ion in all drinking-water biofilms, showing
concentrations in the range of 118.2 ± 31.8 µg g-1 wet weight to 250.9 ± 139.2 µg g-1 wet
weight (Tab. 4.6). Mg was among the most abundant ions in the biofilms, however,
concentrations of Mg in biofilms cultivated at distribution system A or plumbing system B
could not be detected, potentially due to the dilution of the biofilm samples during sample
preparation for ICP-OES measurements. Comparison of the water phase to the biofilm on a
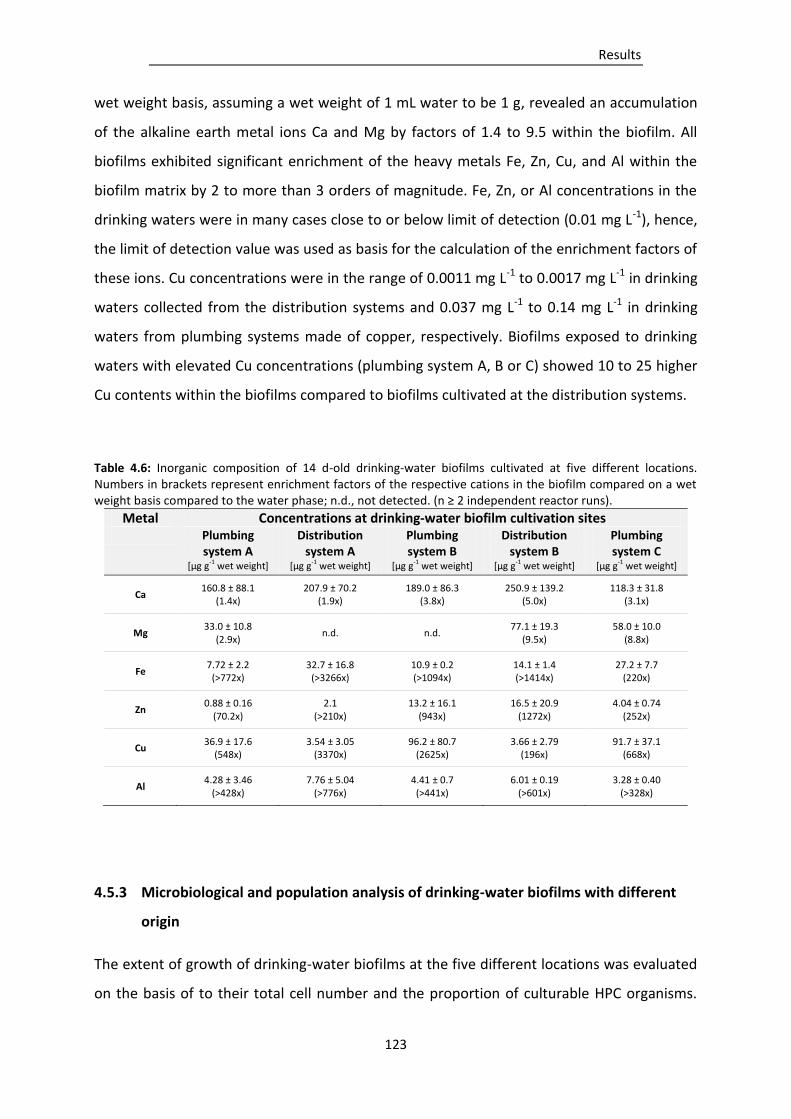
Results
123
wet weight basis, assuming a wet weight of 1 mL water to be 1 g, revealed an accumulation
of the alkaline earth metal ions Ca and Mg by factors of 1.4 to 9.5 within the biofilm. All
biofilms exhibited significant enrichment of the heavy metals Fe, Zn, Cu, and Al within the
biofilm matrix by 2 to more than 3 orders of magnitude. Fe, Zn, or Al concentrations in the
drinking waters were in many cases close to or below limit of detection (0.01 mg L-1), hence,
the limit of detection value was used as basis for the calculation of the enrichment factors of
these ions. Cu concentrations were in the range of 0.0011 mg L-1 to 0.0017 mg L-1 in drinking
waters collected from the distribution systems and 0.037 mg L-1 to 0.14 mg L-1 in drinking
waters from plumbing systems made of copper, respectively. Biofilms exposed to drinking
waters with elevated Cu concentrations (plumbing system A, B or C) showed 10 to 25 higher
Cu contents within the biofilms compared to biofilms cultivated at the distribution systems.
Table 4.6: Inorganic composition of 14 d-old drinking-water biofilms cultivated at five different locations. Numbers in brackets represent enrichment factors of the respective cations in the biofilm compared on a wet weight basis compared to the water phase; n.d., not detected. (n ≥ 2 independent reactor runs).
Metal Concentrations at drinking-water biofilm cultivation sites Plumbing
system A [µg g-1 wet weight]
Distribution system A
[µg g-1 wet weight]
Plumbing system B
[µg g-1 wet weight]
Distribution system B
[µg g-1 wet weight]
Plumbing system C
[µg g-1 wet weight]
Ca 160.8 ± 88.1
(1.4x) 207.9 ± 70.2
(1.9x) 189.0 ± 86.3
(3.8x) 250.9 ± 139.2
(5.0x) 118.3 ± 31.8
(3.1x)
Mg 33.0 ± 10.8
(2.9x) n.d. n.d.
77.1 ± 19.3 (9.5x)
58.0 ± 10.0 (8.8x)
Fe 7.72 ± 2.2
(>772x) 32.7 ± 16.8
(>3266x) 10.9 ± 0.2 (>1094x)
14.1 ± 1.4 (>1414x)
27.2 ± 7.7 (220x)
Zn 0.88 ± 0.16
(70.2x) 2.1
(>210x) 13.2 ± 16.1
(943x) 16.5 ± 20.9
(1272x) 4.04 ± 0.74
(252x)
Cu 36.9 ± 17.6
(548x) 3.54 ± 3.05
(3370x) 96.2 ± 80.7
(2625x) 3.66 ± 2.79
(196x) 91.7 ± 37.1
(668x)
Al 4.28 ± 3.46
(>428x) 7.76 ± 5.04
(>776x) 4.41 ± 0.7
(>441x) 6.01 ± 0.19
(>601x) 3.28 ± 0.40
(>328x)
4.5.3 Microbiological and population analysis of drinking-water biofilms with different
origin
The extent of growth of drinking-water biofilms at the five different locations was evaluated
on the basis of to their total cell number and the proportion of culturable HPC organisms.
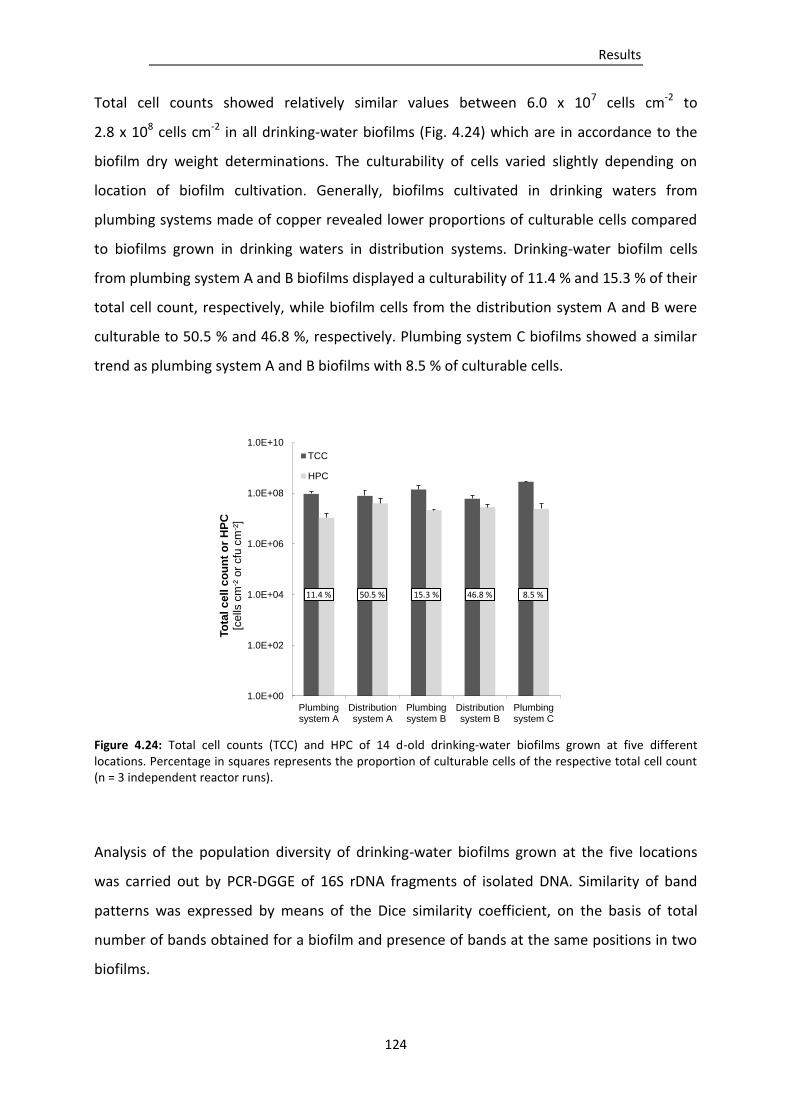
Results
124
Total cell counts showed relatively similar values between 6.0 x 10⁷ cells cm-2 to
2.8 x 10⁸ cells cm-2 in all drinking-water biofilms (Fig. 4.24) which are in accordance to the
biofilm dry weight determinations. The culturability of cells varied slightly depending on
location of biofilm cultivation. Generally, biofilms cultivated in drinking waters from
plumbing systems made of copper revealed lower proportions of culturable cells compared
to biofilms grown in drinking waters in distribution systems. Drinking-water biofilm cells
from plumbing system A and B biofilms displayed a culturability of 11.4 % and 15.3 % of their
total cell count, respectively, while biofilm cells from the distribution system A and B were
culturable to 50.5 % and 46.8 %, respectively. Plumbing system C biofilms showed a similar
trend as plumbing system A and B biofilms with 8.5 % of culturable cells.
Figure 4.24: Total cell counts (TCC) and HPC of 14 d-old drinking-water biofilms grown at five different locations. Percentage in squares represents the proportion of culturable cells of the respective total cell count (n = 3 independent reactor runs).
Analysis of the population diversity of drinking-water biofilms grown at the five locations
was carried out by PCR-DGGE of 16S rDNA fragments of isolated DNA. Similarity of band
patterns was expressed by means of the Dice similarity coefficient, on the basis of total
number of bands obtained for a biofilm and presence of bands at the same positions in two
biofilms.
1.0E+00
1.0E+02
1.0E+04
1.0E+06
1.0E+08
1.0E+10
Plumbingsystem A
Distributionsystem A
Plumbingsystem B
Distributionsystem B
Plumbingsystem C
To
tal c
ell
co
un
t o
r H
PC
[c
ells
cm
- ² o
r cfu
cm
- ²]
TCC
HPC
11.4 % 50.5 % 15.3 % 46.8 % 8.5 %
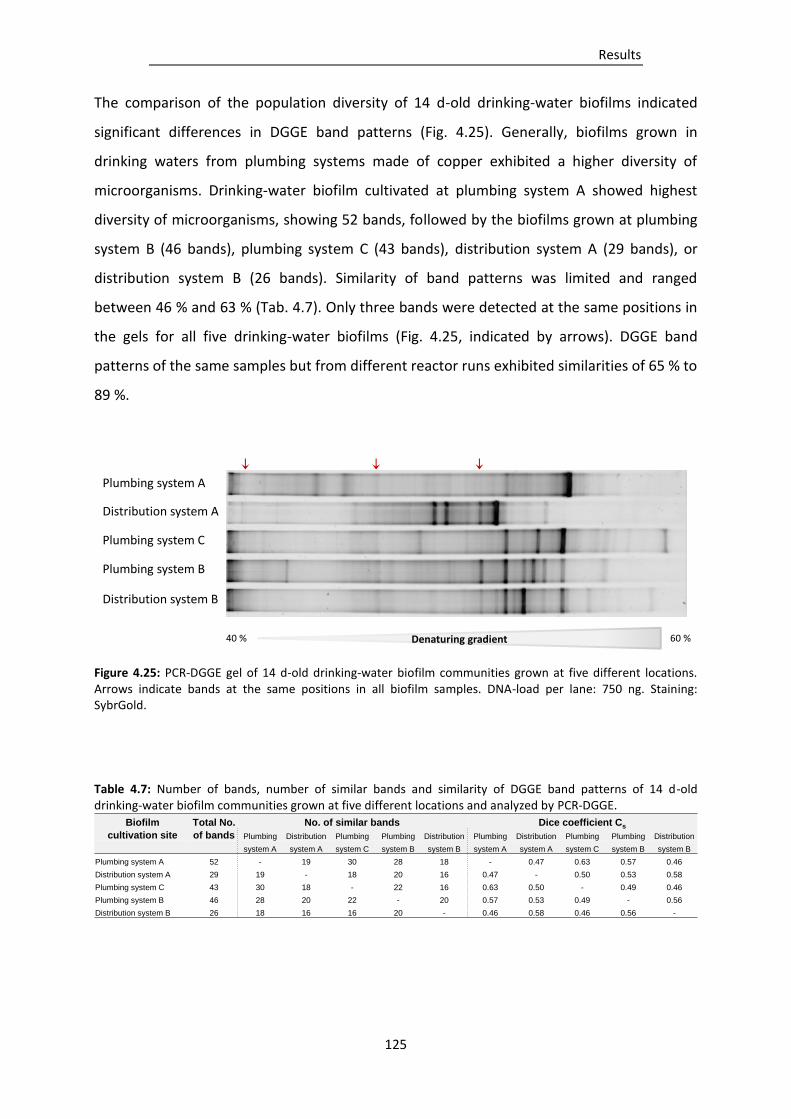
Results
125
The comparison of the population diversity of 14 d-old drinking-water biofilms indicated
significant differences in DGGE band patterns (Fig. 4.25). Generally, biofilms grown in
drinking waters from plumbing systems made of copper exhibited a higher diversity of
microorganisms. Drinking-water biofilm cultivated at plumbing system A showed highest
diversity of microorganisms, showing 52 bands, followed by the biofilms grown at plumbing
system B (46 bands), plumbing system C (43 bands), distribution system A (29 bands), or
distribution system B (26 bands). Similarity of band patterns was limited and ranged
between 46 % and 63 % (Tab. 4.7). Only three bands were detected at the same positions in
the gels for all five drinking-water biofilms (Fig. 4.25, indicated by arrows). DGGE band
patterns of the same samples but from different reactor runs exhibited similarities of 65 % to
89 %.
Figure 4.25: PCR-DGGE gel of 14 d-old drinking-water biofilm communities grown at five different locations. Arrows indicate bands at the same positions in all biofilm samples. DNA-load per lane: 750 ng. Staining: SybrGold.
Table 4.7: Number of bands, number of similar bands and similarity of DGGE band patterns of 14 d-old drinking-water biofilm communities grown at five different locations and analyzed by PCR-DGGE.
Biofilm Total No. No. of similar bands Dice coefficient Cs
cultivation site of bands Plumbing Distribution Plumbing Plumbing Distribution Plumbing Distribution Plumbing Plumbing Distribution
system A system A system C system B system B system A system A system C system B system B
Plumbing system A 52 - 19 30 28 18 - 0.47 0.63 0.57 0.46
Distribution system A 29 19 - 18 20 16 0.47 - 0.50 0.53 0.58
Plumbing system C 43 30 18 - 22 16 0.63 0.50 - 0.49 0.46
Plumbing system B 46 28 20 22 - 20 0.57 0.53 0.49 - 0.56
Distribution system B 26 18 16 16 20 - 0.46 0.58 0.46 0.56 -
Plumbing system A
Distribution system A
Plumbing system C
Plumbing system B
Distribution system B
Denaturing gradient 60 %40 %
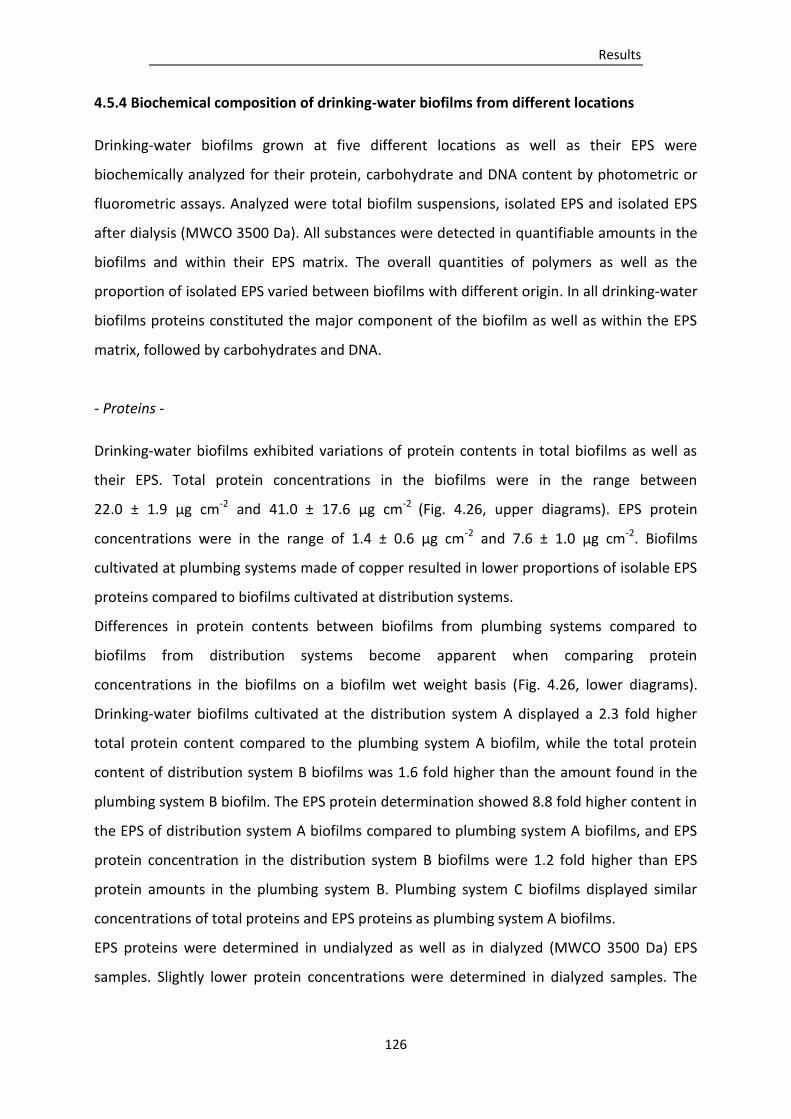
Results
126
4.5.4 Biochemical composition of drinking-water biofilms from different locations
Drinking-water biofilms grown at five different locations as well as their EPS were
biochemically analyzed for their protein, carbohydrate and DNA content by photometric or
fluorometric assays. Analyzed were total biofilm suspensions, isolated EPS and isolated EPS
after dialysis (MWCO 3500 Da). All substances were detected in quantifiable amounts in the
biofilms and within their EPS matrix. The overall quantities of polymers as well as the
proportion of isolated EPS varied between biofilms with different origin. In all drinking-water
biofilms proteins constituted the major component of the biofilm as well as within the EPS
matrix, followed by carbohydrates and DNA.
- Proteins -
Drinking-water biofilms exhibited variations of protein contents in total biofilms as well as
their EPS. Total protein concentrations in the biofilms were in the range between
22.0 ± 1.9 µg cm-2 and 41.0 ± 17.6 µg cm-2 (Fig. 4.26, upper diagrams). EPS protein
concentrations were in the range of 1.4 ± 0.6 µg cm-2 and 7.6 ± 1.0 µg cm-2. Biofilms
cultivated at plumbing systems made of copper resulted in lower proportions of isolable EPS
proteins compared to biofilms cultivated at distribution systems.
Differences in protein contents between biofilms from plumbing systems compared to
biofilms from distribution systems become apparent when comparing protein
concentrations in the biofilms on a biofilm wet weight basis (Fig. 4.26, lower diagrams).
Drinking-water biofilms cultivated at the distribution system A displayed a 2.3 fold higher
total protein content compared to the plumbing system A biofilm, while the total protein
content of distribution system B biofilms was 1.6 fold higher than the amount found in the
plumbing system B biofilm. The EPS protein determination showed 8.8 fold higher content in
the EPS of distribution system A biofilms compared to plumbing system A biofilms, and EPS
protein concentration in the distribution system B biofilms were 1.2 fold higher than EPS
protein amounts in the plumbing system B. Plumbing system C biofilms displayed similar
concentrations of total proteins and EPS proteins as plumbing system A biofilms.
EPS proteins were determined in undialyzed as well as in dialyzed (MWCO 3500 Da) EPS
samples. Slightly lower protein concentrations were determined in dialyzed samples. The
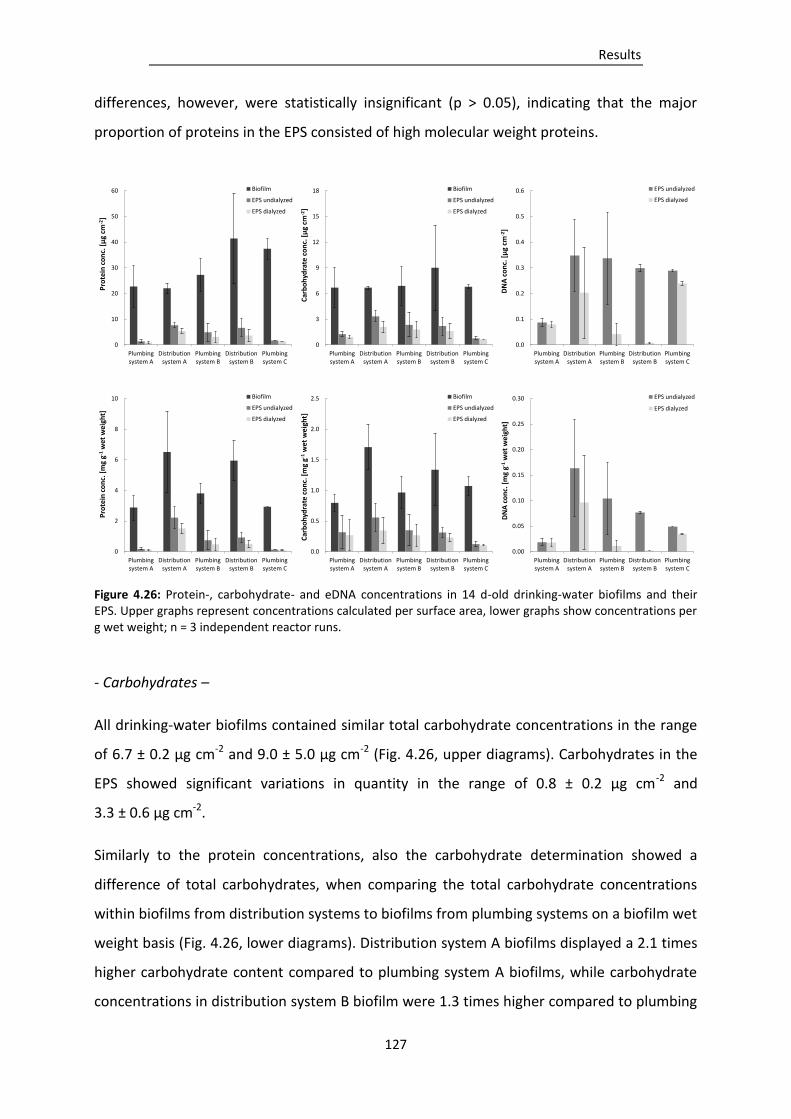
Results
127
differences, however, were statistically insignificant (p > 0.05), indicating that the major
proportion of proteins in the EPS consisted of high molecular weight proteins.
Figure 4.26: Protein-, carbohydrate- and eDNA concentrations in 14 d-old drinking-water biofilms and their EPS. Upper graphs represent concentrations calculated per surface area, lower graphs show concentrations per g wet weight; n = 3 independent reactor runs.
- Carbohydrates –
All drinking-water biofilms contained similar total carbohydrate concentrations in the range
of 6.7 ± 0.2 µg cm-2 and 9.0 ± 5.0 µg cm-2 (Fig. 4.26, upper diagrams). Carbohydrates in the
EPS showed significant variations in quantity in the range of 0.8 ± 0.2 µg cm-2 and
3.3 ± 0.6 µg cm-2.
Similarly to the protein concentrations, also the carbohydrate determination showed a
difference of total carbohydrates, when comparing the total carbohydrate concentrations
within biofilms from distribution systems to biofilms from plumbing systems on a biofilm wet
weight basis (Fig. 4.26, lower diagrams). Distribution system A biofilms displayed a 2.1 times
higher carbohydrate content compared to plumbing system A biofilms, while carbohydrate
concentrations in distribution system B biofilm were 1.3 times higher compared to plumbing
0
10
20
30
40
50
60
Plumbingsystem A
Distributionsystem A
Plumbingsystem B
Distributionsystem B
Plumbingsystem C
Pro
tein
co
nc.
[µ
g cm
-2]
Biofilm
EPS undialyzed
EPS dialyzed
0
2
4
6
8
10
Plumbingsystem A
Distributionsystem A
Plumbingsystem B
Distributionsystem B
Plumbingsystem C
Pro
tein
co
nc.
[m
g g-1
wet
we
igh
t]
Biofilm
EPS undialyzed
EPS dialyzed
0
3
6
9
12
15
18
Plumbingsystem A
Distributionsystem A
Plumbingsystem B
Distributionsystem B
Plumbingsystem C
Car
bo
hyd
rate
co
nc.
[µ
g cm
-2]
Biofilm
EPS undialyzed
EPS dialyzed
0.0
0.5
1.0
1.5
2.0
2.5
Plumbingsystem A
Distributionsystem A
Plumbingsystem B
Distributionsystem B
Plumbingsystem C
Car
bo
hyd
rate
co
nc.
[m
g g-1
wet
we
igh
t]
Biofilm
EPS undialyzed
EPS dialyzed
0.0
0.1
0.2
0.3
0.4
0.5
0.6
Plumbingsystem A
Distributionsystem A
Plumbingsystem B
Distributionsystem B
Plumbingsystem C
DN
A c
on
c. [
µg
cm-2
]
EPS undialyzed
EPS dialyzed
0.00
0.05
0.10
0.15
0.20
0.25
0.30
Plumbingsystem A
Distributionsystem A
Plumbingsystem B
Distributionsystem B
Plumbingsystem C
DN
A c
on
c. [
mg
g-1w
et w
eig
ht]
EPS undialyzed
EPS dialyzed
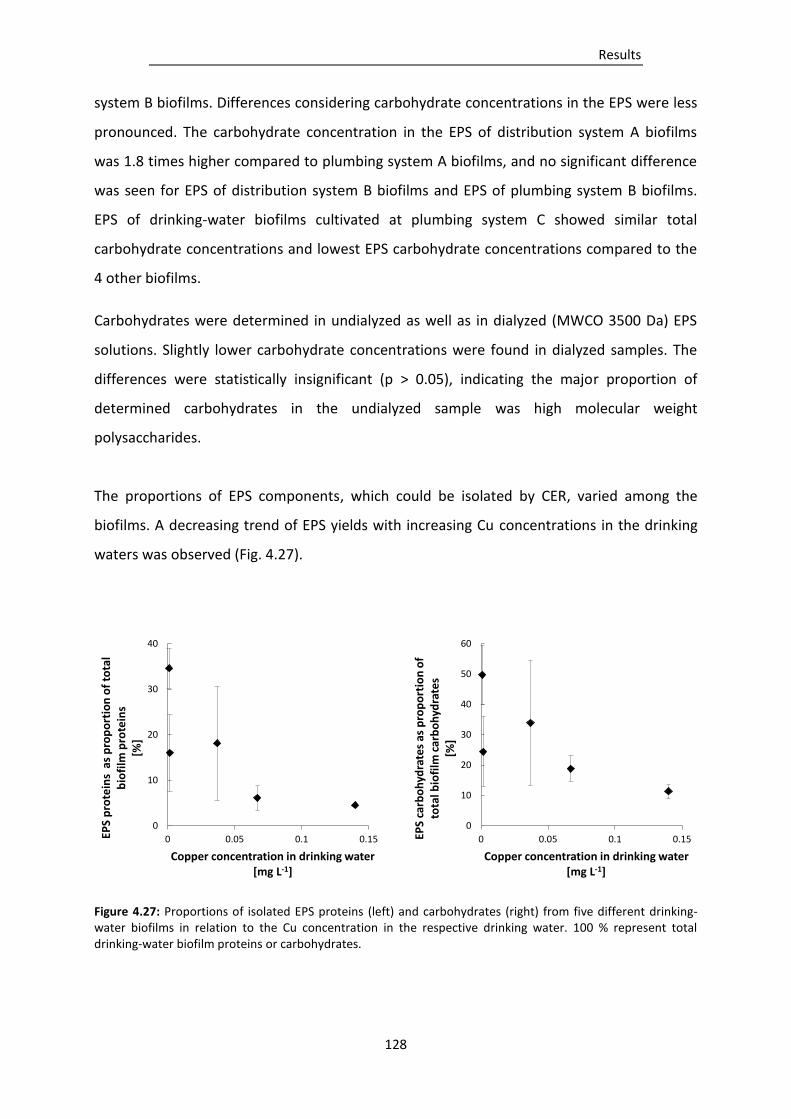
Results
128
system B biofilms. Differences considering carbohydrate concentrations in the EPS were less
pronounced. The carbohydrate concentration in the EPS of distribution system A biofilms
was 1.8 times higher compared to plumbing system A biofilms, and no significant difference
was seen for EPS of distribution system B biofilms and EPS of plumbing system B biofilms.
EPS of drinking-water biofilms cultivated at plumbing system C showed similar total
carbohydrate concentrations and lowest EPS carbohydrate concentrations compared to the
4 other biofilms.
Carbohydrates were determined in undialyzed as well as in dialyzed (MWCO 3500 Da) EPS
solutions. Slightly lower carbohydrate concentrations were found in dialyzed samples. The
differences were statistically insignificant (p > 0.05), indicating the major proportion of
determined carbohydrates in the undialyzed sample was high molecular weight
polysaccharides.
The proportions of EPS components, which could be isolated by CER, varied among the
biofilms. A decreasing trend of EPS yields with increasing Cu concentrations in the drinking
waters was observed (Fig. 4.27).
Figure 4.27: Proportions of isolated EPS proteins (left) and carbohydrates (right) from five different drinking-water biofilms in relation to the Cu concentration in the respective drinking water. 100 % represent total drinking-water biofilm proteins or carbohydrates.
0
10
20
30
40
50
60
0 0.05 0.1 0.15EPS
carb
oh
ydra
tes
as p
rop
ort
ion
of
tota
l bio
film
car
bo
hyd
rate
s[%
]
Copper concentration in drinking water [mg L-1]
0
10
20
30
40
0 0.05 0.1 0.15EPS
pro
tein
s a
s p
rop
ort
ion
of
tota
l b
iofi
lm p
rote
ins
[%]
Copper concentration in drinking water [mg L-1]
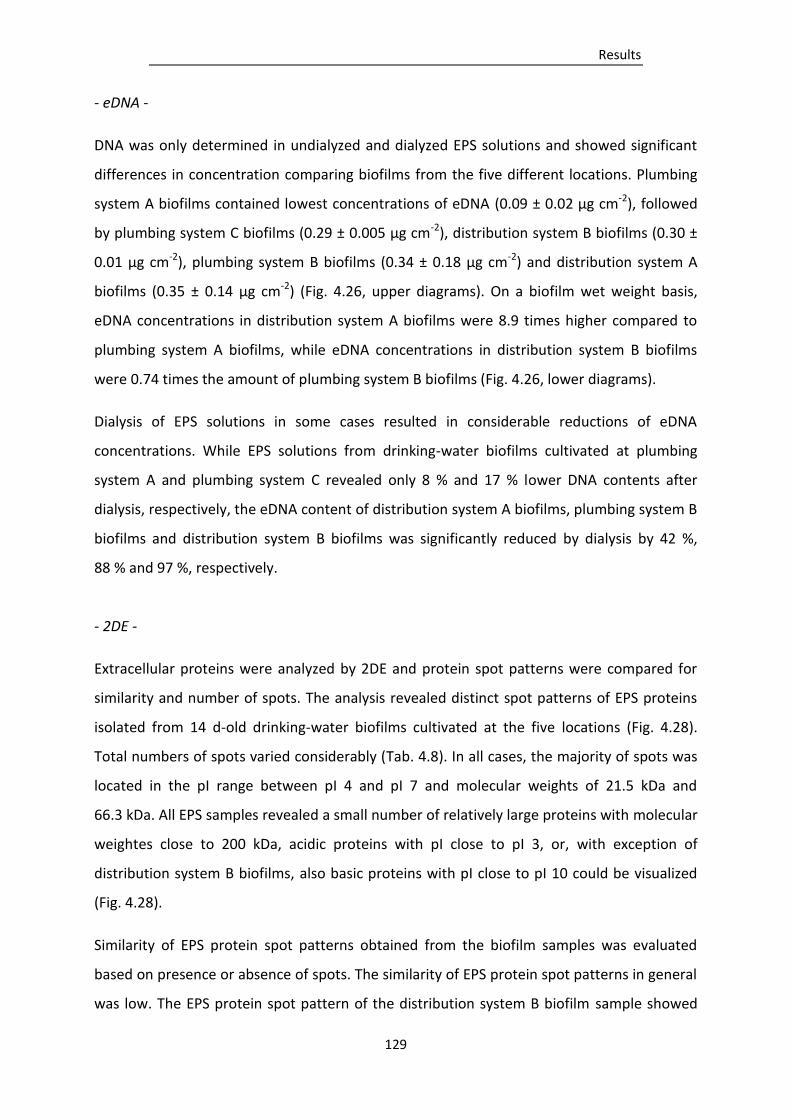
Results
129
- eDNA -
DNA was only determined in undialyzed and dialyzed EPS solutions and showed significant
differences in concentration comparing biofilms from the five different locations. Plumbing
system A biofilms contained lowest concentrations of eDNA (0.09 ± 0.02 µg cm-2), followed
by plumbing system C biofilms (0.29 ± 0.005 µg cm-2), distribution system B biofilms (0.30 ±
0.01 µg cm-2), plumbing system B biofilms (0.34 ± 0.18 µg cm-2) and distribution system A
biofilms (0.35 ± 0.14 µg cm-2) (Fig. 4.26, upper diagrams). On a biofilm wet weight basis,
eDNA concentrations in distribution system A biofilms were 8.9 times higher compared to
plumbing system A biofilms, while eDNA concentrations in distribution system B biofilms
were 0.74 times the amount of plumbing system B biofilms (Fig. 4.26, lower diagrams).
Dialysis of EPS solutions in some cases resulted in considerable reductions of eDNA
concentrations. While EPS solutions from drinking-water biofilms cultivated at plumbing
system A and plumbing system C revealed only 8 % and 17 % lower DNA contents after
dialysis, respectively, the eDNA content of distribution system A biofilms, plumbing system B
biofilms and distribution system B biofilms was significantly reduced by dialysis by 42 %,
88 % and 97 %, respectively.
- 2DE -
Extracellular proteins were analyzed by 2DE and protein spot patterns were compared for
similarity and number of spots. The analysis revealed distinct spot patterns of EPS proteins
isolated from 14 d-old drinking-water biofilms cultivated at the five locations (Fig. 4.28).
Total numbers of spots varied considerably (Tab. 4.8). In all cases, the majority of spots was
located in the pI range between pI 4 and pI 7 and molecular weights of 21.5 kDa and
66.3 kDa. All EPS samples revealed a small number of relatively large proteins with molecular
weightes close to 200 kDa, acidic proteins with pI close to pI 3, or, with exception of
distribution system B biofilms, also basic proteins with pI close to pI 10 could be visualized
(Fig. 4.28).
Similarity of EPS protein spot patterns obtained from the biofilm samples was evaluated
based on presence or absence of spots. The similarity of EPS protein spot patterns in general
was low. The EPS protein spot pattern of the distribution system B biofilm sample showed
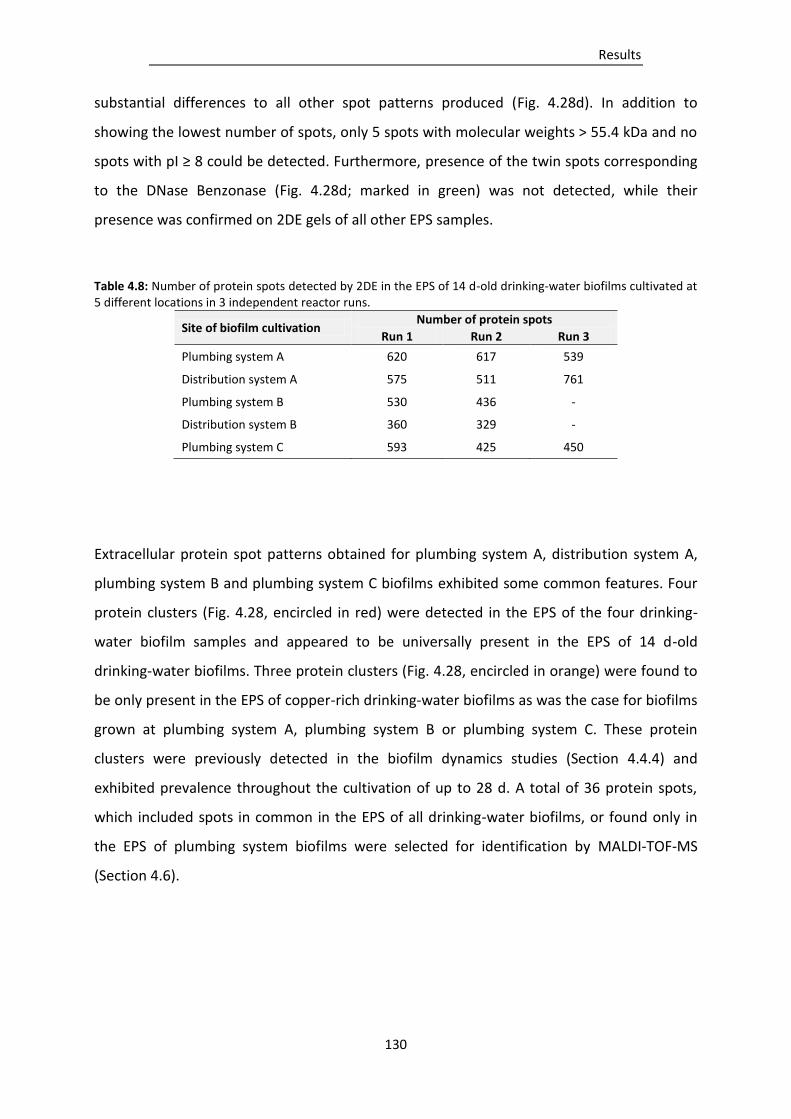
Results
130
substantial differences to all other spot patterns produced (Fig. 4.28d). In addition to
showing the lowest number of spots, only 5 spots with molecular weights > 55.4 kDa and no
spots with pI ≥ 8 could be detected. Furthermore, presence of the twin spots corresponding
to the DNase Benzonase (Fig. 4.28d; marked in green) was not detected, while their
presence was confirmed on 2DE gels of all other EPS samples.
Table 4.8: Number of protein spots detected by 2DE in the EPS of 14 d-old drinking-water biofilms cultivated at 5 different locations in 3 independent reactor runs.
Site of biofilm cultivation Number of protein spots
Run 1 Run 2 Run 3
Plumbing system A 620 617 539
Distribution system A 575 511 761
Plumbing system B 530 436 -
Distribution system B 360 329 -
Plumbing system C 593 425 450
Extracellular protein spot patterns obtained for plumbing system A, distribution system A,
plumbing system B and plumbing system C biofilms exhibited some common features. Four
protein clusters (Fig. 4.28, encircled in red) were detected in the EPS of the four drinking-
water biofilm samples and appeared to be universally present in the EPS of 14 d-old
drinking-water biofilms. Three protein clusters (Fig. 4.28, encircled in orange) were found to
be only present in the EPS of copper-rich drinking-water biofilms as was the case for biofilms
grown at plumbing system A, plumbing system B or plumbing system C. These protein
clusters were previously detected in the biofilm dynamics studies (Section 4.4.4) and
exhibited prevalence throughout the cultivation of up to 28 d. A total of 36 protein spots,
which included spots in common in the EPS of all drinking-water biofilms, or found only in
the EPS of plumbing system biofilms were selected for identification by MALDI-TOF-MS
(Section 4.6).
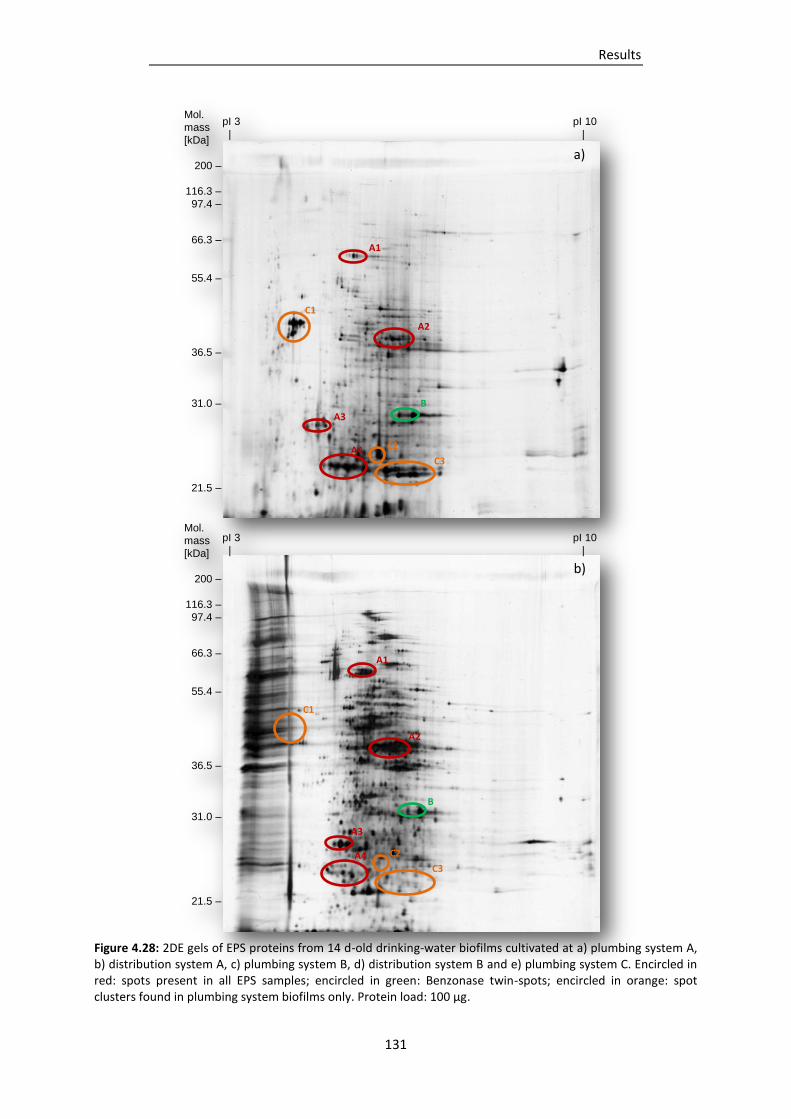
Results
131
Figure 4.28: 2DE gels of EPS proteins from 14 d-old drinking-water biofilms cultivated at a) plumbing system A, b) distribution system A, c) plumbing system B, d) distribution system B and e) plumbing system C. Encircled in red: spots present in all EPS samples; encircled in green: Benzonase twin-spots; encircled in orange: spot clusters found in plumbing system biofilms only. Protein load: 100 µg.
Mol.
mass
[kDa]
200 –
116.3 –
97.4 –
66.3 –
55.4 –
36.5 –
31.0 –
21.5 –
Mol.
mass
[kDa]
200 –
116.3 –
97.4 –
66.3 –
55.4 –
36.5 –
31.0 –
21.5 –
pI 3 pI 10
| |
pI 3 pI 10
| |
A1
A2
A3
A4
A1
A2
A3
A4
B
B
C1
C1
C3
C3
C2
C2
a)
b)

Results
132
Figure 4.28: Continued
Mol.
mass
[kDa]
200 –
116.3 –
97.4 –
66.3 –
55.4 –
36.5 –
31.0 –
21.5 –
Mol.
mass
[kDa]
200 –
116.3 –
97.4 –
66.3 –
55.4 –
36.5 –
31.0 –
21.5 –
pI 3 pI 10
| |
pI 3 pI 10
| |
A1
A2
A3
A4
A1
A2
A3
A4
B
B
C1
C1
C3
C3
C2
C2
c)
d)
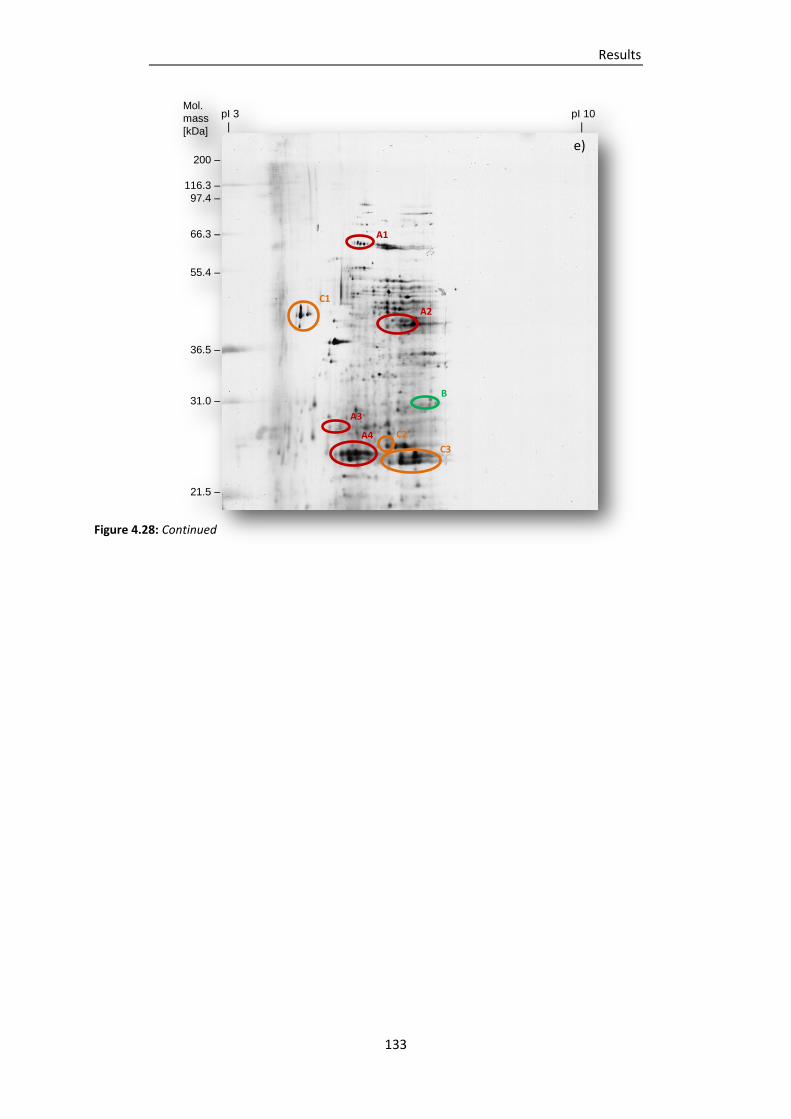
Results
133
Figure 4.28: Continued
Mol.
mass
[kDa]
200 –
116.3 –
97.4 –
66.3 –
55.4 –
36.5 –
31.0 –
21.5 –
pI 3 pI 10
| |
A1
A2
A3
A4
B
C1
C3
C2
e)
Results
134
4.6 Identification of EPS proteins
The main functions of extracellular proteins are considered to be as enzymes or as structural
components of the EPS matrix. To determine the role of EPS proteins in drinking-water
biofilms, EPS proteins were separated by 2DE and subjected to identification by MALDI-TOF-
MS. For identification of EPS proteins from drinking-water biofilms, the biofilms were
cultivated on EPDM for 14 d at plumbing system C and sampled according to sections 3.1
and 3.2. EPS was isolated by 20 min CER treatment (Section 3.8). EPS solutions were
incubated with the DNase Benzonase and dialyzed (MWCO 12 – 14 kDa) as clean-up for 2DE,
and aliquots containing 400 µg protein were freeze dried. Freeze-dried EPS were subjected
to 2DE in duplicates. The EPS were resuspended in IEF buffer and subjected to IEF on IPG
strips with a linear pH gradient of 3 to 10 for a total of 95 kVh, followed by separation by size
on 12 % SDS polyacrylamide gels. Gels were stained with silver (Blum et al., 1987). A total of
36 protein spots were excised from each gel from same locations on both gels (Fig. 4.29).
Proteins present in the excised gel plugs were digested with Trypsin and analyzed by MALDI-
TOF-MS.
Identification results are given in Tab. 4.9. The MS-spectra obtained for EPS proteins in most
cases showed significant homology (a score ≥ 85 is according to the Mascot software
considered significant) to MS-spectra of proteins present in the NCBInr database. The
majority of analyzed proteins exhibited significant homology to more than one protein.
Molecular weight or pI of the identified proteins only in some cases corresponded to the
location of the proteins on the gels. The majority of analyzed EPS protein spots displayed
significant homology of MS-spectra to proteins with metabolic, transport, or regulatory
functions.
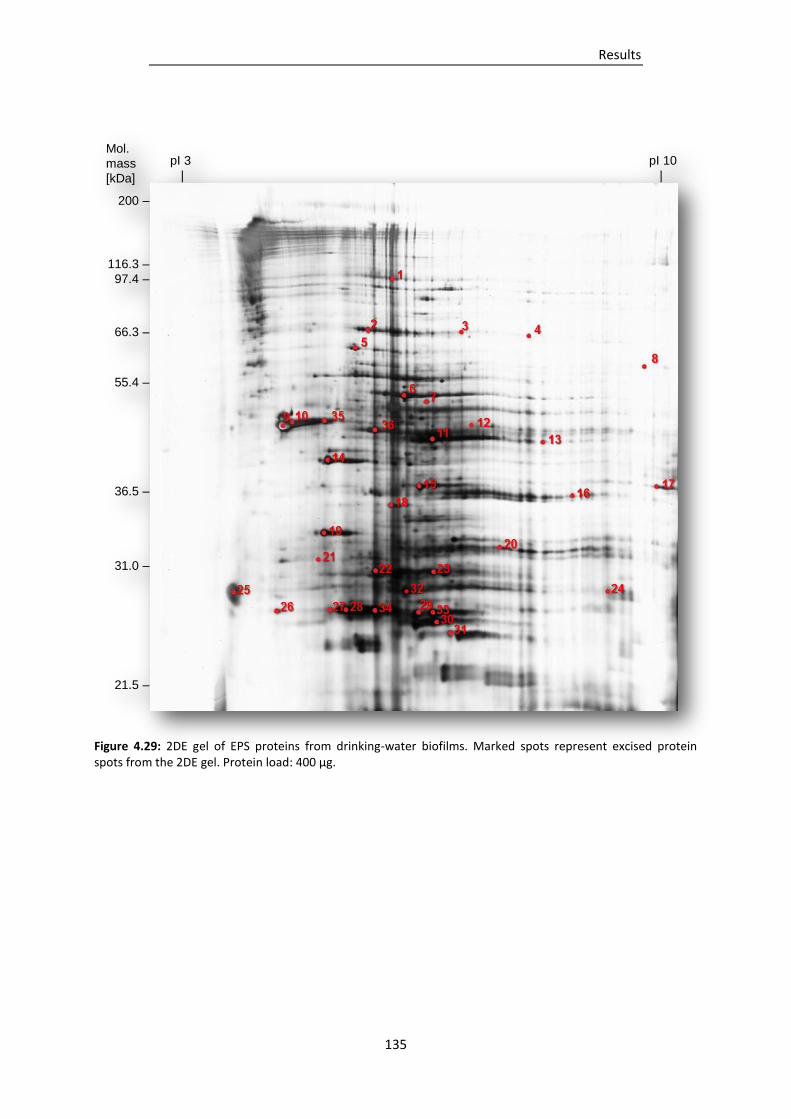
Results
135
Figure 4.29: 2DE gel of EPS proteins from drinking-water biofilms. Marked spots represent excised protein spots from the 2DE gel. Protein load: 400 µg.
Mol.
mass
[kDa]
200 –
116.3 –
97.4 –
66.3 –
55.4 –
36.5 –
31.0 –
21.5 –
pI 3 pI 10
| |
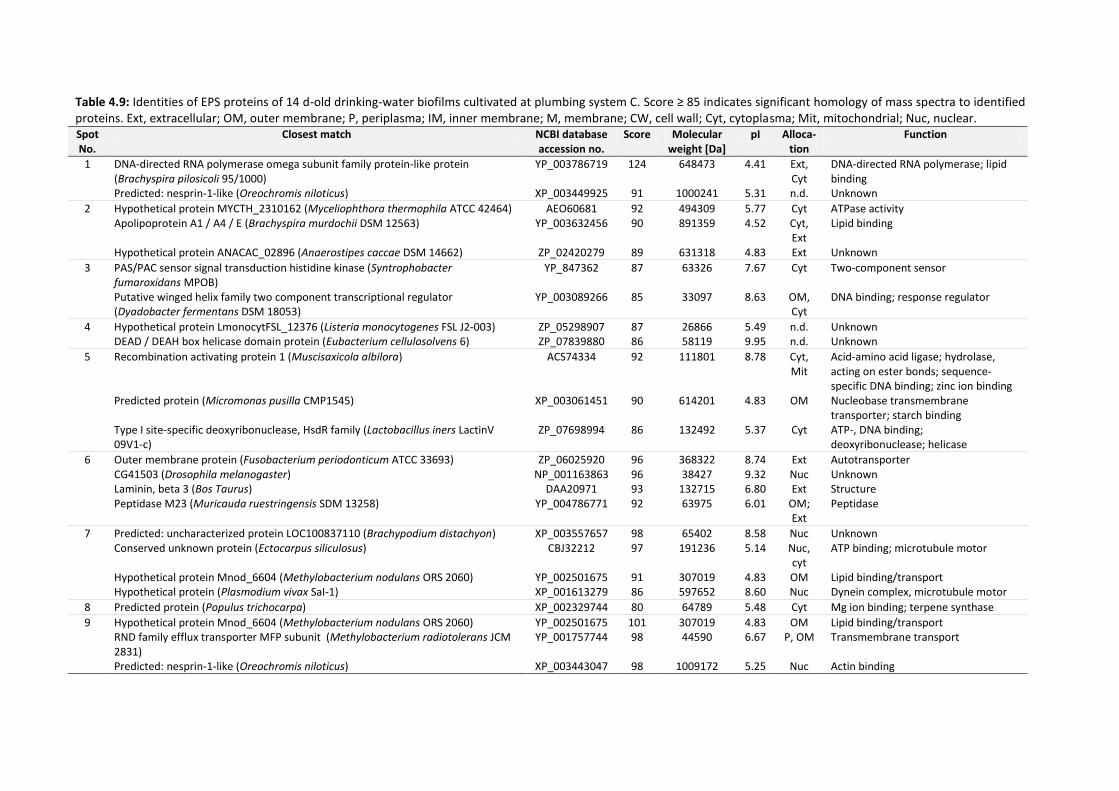
Table 4.9: Identities of EPS proteins of 14 d-old drinking-water biofilms cultivated at plumbing system C. Score ≥ 85 indicates significant homology of mass spectra to identified proteins. Ext, extracellular; OM, outer membrane; P, periplasma; IM, inner membrane; M, membrane; CW, cell wall; Cyt, cytoplasma; Mit, mitochondrial; Nuc, nuclear. Spot No.
Closest match NCBI database accession no.
Score Molecular weight [Da]
pI Alloca-tion
Function
1 DNA-directed RNA polymerase omega subunit family protein-like protein (Brachyspira pilosicoli 95/1000) Predicted: nesprin-1-like (Oreochromis niloticus)
YP_003786719
XP_003449925
124
91
648473
1000241
4.41
5.31
Ext, Cyt n.d.
DNA-directed RNA polymerase; lipid binding Unknown
2 Hypothetical protein MYCTH_2310162 (Myceliophthora thermophila ATCC 42464) Apolipoprotein A1 / A4 / E (Brachyspira murdochii DSM 12563) Hypothetical protein ANACAC_02896 (Anaerostipes caccae DSM 14662)
AEO60681 YP_003632456
ZP_02420279
92 90
89
494309 891359
631318
5.77 4.52
4.83
Cyt Cyt, Ext Ext
ATPase activity Lipid binding Unknown
3 PAS/PAC sensor signal transduction histidine kinase (Syntrophobacter fumaroxidans MPOB) Putative winged helix family two component transcriptional regulator (Dyadobacter fermentans DSM 18053)
YP_847362
YP_003089266
87
85
63326
33097
7.67
8.63
Cyt
OM, Cyt
Two-component sensor DNA binding; response regulator
4 Hypothetical protein LmonocytFSL_12376 (Listeria monocytogenes FSL J2-003) DEAD / DEAH box helicase domain protein (Eubacterium cellulosolvens 6)
ZP_05298907 ZP_07839880
87 86
26866 58119
5.49 9.95
n.d. n.d.
Unknown Unknown
5 Recombination activating protein 1 (Muscisaxicola albilora) Predicted protein (Micromonas pusilla CMP1545) Type I site-specific deoxyribonuclease, HsdR family (Lactobacillus iners LactinV 09V1-c)
ACS74334
XP_003061451
ZP_07698994
92
90
86
111801
614201
132492
8.78
4.83
5.37
Cyt, Mit
OM
Cyt
Acid-amino acid ligase; hydrolase, acting on ester bonds; sequence-specific DNA binding; zinc ion binding Nucleobase transmembrane transporter; starch binding ATP-, DNA binding; deoxyribonuclease; helicase
6 Outer membrane protein (Fusobacterium periodonticum ATCC 33693) CG41503 (Drosophila melanogaster) Laminin, beta 3 (Bos Taurus) Peptidase M23 (Muricauda ruestringensis SDM 13258)
ZP_06025920 NP_001163863
DAA20971 YP_004786771
96 96 93 92
368322 38427
132715 63975
8.74 9.32 6.80 6.01
Ext Nuc Ext
OM; Ext
Autotransporter Unknown Structure Peptidase
7 Predicted: uncharacterized protein LOC100837110 (Brachypodium distachyon) Conserved unknown protein (Ectocarpus siliculosus) Hypothetical protein Mnod_6604 (Methylobacterium nodulans ORS 2060) Hypothetical protein (Plasmodium vivax SaI-1)
XP_003557657 CBJ32212
YP_002501675 XP_001613279
98 97
91 86
65402 191236
307019 597652
8.58 5.14
4.83 8.60
Nuc Nuc, cyt OM Nuc
Unknown ATP binding; microtubule motor Lipid binding/transport Dynein complex, microtubule motor
8 Predicted protein (Populus trichocarpa) XP_002329744 80 64789 5.48 Cyt Mg ion binding; terpene synthase
9 Hypothetical protein Mnod_6604 (Methylobacterium nodulans ORS 2060) RND family efflux transporter MFP subunit (Methylobacterium radiotolerans JCM 2831) Predicted: nesprin-1-like (Oreochromis niloticus)
YP_002501675 YP_001757744
XP_003443047
101 98
98
307019 44590
1009172
4.83 6.67
5.25
OM P, OM
Nuc
Lipid binding/transport Transmembrane transport Actin binding
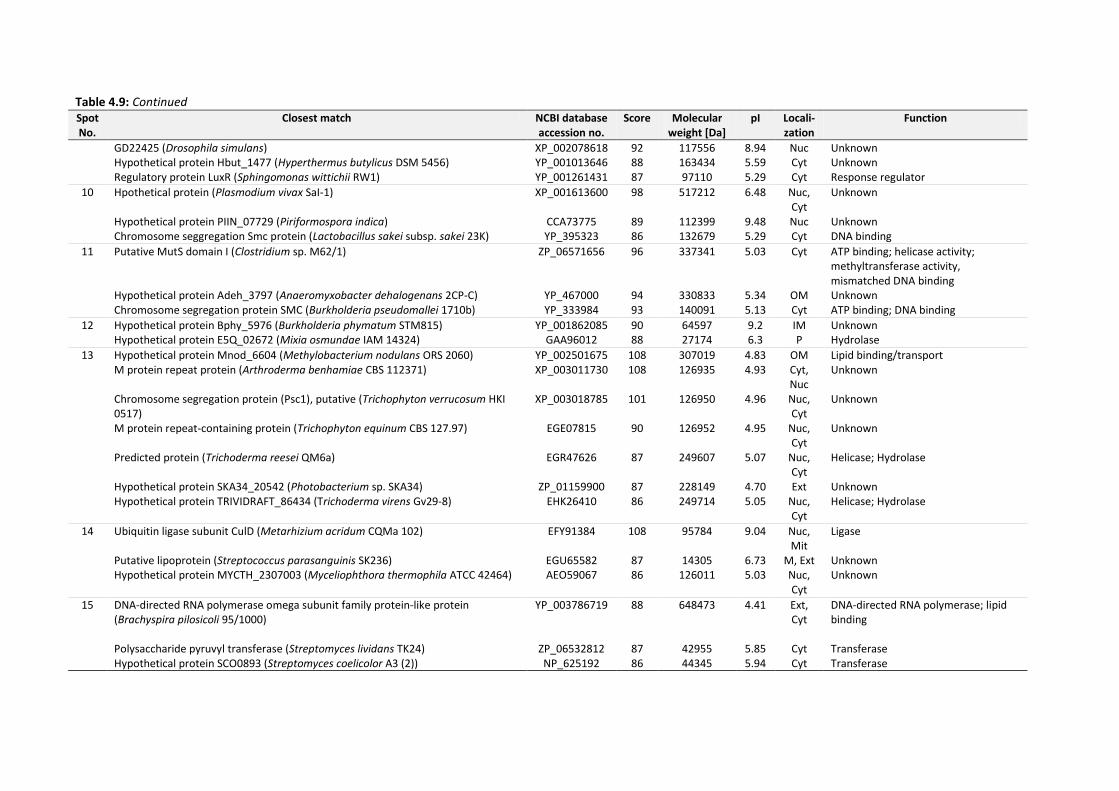
Table 4.9: Continued
Spot No.
Closest match NCBI database accession no.
Score Molecular weight [Da]
pI Locali-zation
Function
GD22425 (Drosophila simulans) Hypothetical protein Hbut_1477 (Hyperthermus butylicus DSM 5456) Regulatory protein LuxR (Sphingomonas wittichii RW1)
XP_002078618 YP_001013646 YP_001261431
92 88 87
117556 163434 97110
8.94 5.59 5.29
Nuc Cyt Cyt
Unknown Unknown Response regulator
10 Hpothetical protein (Plasmodium vivax SaI-1) Hypothetical protein PIIN_07729 (Piriformospora indica) Chromosome seggregation Smc protein (Lactobacillus sakei subsp. sakei 23K)
XP_001613600
CCA73775 YP_395323
98
89 86
517212
112399 132679
6.48
9.48 5.29
Nuc, Cyt Nuc Cyt
Unknown Unknown DNA binding
11 Putative MutS domain I (Clostridium sp. M62/1) Hypothetical protein Adeh_3797 (Anaeromyxobacter dehalogenans 2CP-C) Chromosome segregation protein SMC (Burkholderia pseudomallei 1710b)
ZP_06571656
YP_467000 YP_333984
96
94 93
337341
330833 140091
5.03
5.34 5.13
Cyt
OM Cyt
ATP binding; helicase activity; methyltransferase activity, mismatched DNA binding Unknown ATP binding; DNA binding
12 Hypothetical protein Bphy_5976 (Burkholderia phymatum STM815) Hypothetical protein E5Q_02672 (Mixia osmundae IAM 14324)
YP_001862085 GAA96012
90 88
64597 27174
9.2 6.3
IM P
Unknown Hydrolase
13 Hypothetical protein Mnod_6604 (Methylobacterium nodulans ORS 2060) M protein repeat protein (Arthroderma benhamiae CBS 112371) Chromosome segregation protein (Psc1), putative (Trichophyton verrucosum HKI 0517) M protein repeat-containing protein (Trichophyton equinum CBS 127.97) Predicted protein (Trichoderma reesei QM6a) Hypothetical protein SKA34_20542 (Photobacterium sp. SKA34) Hypothetical protein TRIVIDRAFT_86434 (Trichoderma virens Gv29-8)
YP_002501675 XP_003011730
XP_003018785
EGE07815
EGR47626
ZP_01159900
EHK26410
108 108
101
90
87
87 86
307019 126935
126950
126952
249607
228149 249714
4.83 4.93
4.96
4.95
5.07
4.70 5.05
OM Cyt, Nuc Nuc, Cyt
Nuc, Cyt
Nuc, Cyt Ext
Nuc, Cyt
Lipid binding/transport Unknown Unknown Unknown Helicase; Hydrolase Unknown Helicase; Hydrolase
14 Ubiquitin ligase subunit CulD (Metarhizium acridum CQMa 102) Putative lipoprotein (Streptococcus parasanguinis SK236) Hypothetical protein MYCTH_2307003 (Myceliophthora thermophila ATCC 42464)
EFY91384
EGU65582 AEO59067
108
87 86
95784
14305 126011
9.04
6.73 5.03
Nuc, Mit
M, Ext Nuc, Cyt
Ligase Unknown Unknown
15 DNA-directed RNA polymerase omega subunit family protein-like protein (Brachyspira pilosicoli 95/1000) Polysaccharide pyruvyl transferase (Streptomyces lividans TK24) Hypothetical protein SCO0893 (Streptomyces coelicolor A3 (2))
YP_003786719
ZP_06532812 NP_625192
88
87 86
648473
42955 44345
4.41
5.85 5.94
Ext, Cyt
Cyt Cyt
DNA-directed RNA polymerase; lipid binding Transferase Transferase
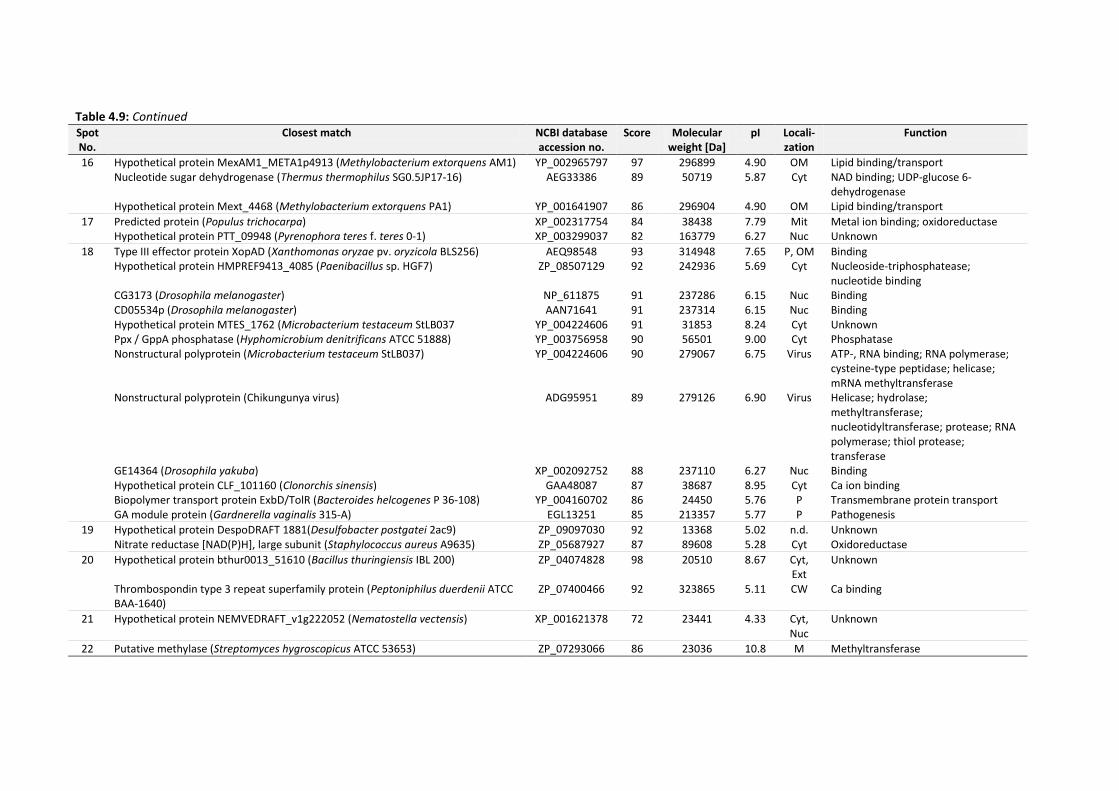
Table 4.9: Continued
Spot No.
Closest match NCBI database accession no.
Score Molecular weight [Da]
pI Locali-zation
Function
16 Hypothetical protein MexAM1_META1p4913 (Methylobacterium extorquens AM1) Nucleotide sugar dehydrogenase (Thermus thermophilus SG0.5JP17-16) Hypothetical protein Mext_4468 (Methylobacterium extorquens PA1)
YP_002965797 AEG33386
YP_001641907
97 89
86
296899 50719
296904
4.90 5.87
4.90
OM Cyt
OM
Lipid binding/transport NAD binding; UDP-glucose 6-dehydrogenase Lipid binding/transport
17 Predicted protein (Populus trichocarpa) Hypothetical protein PTT_09948 (Pyrenophora teres f. teres 0-1)
XP_002317754 XP_003299037
84 82
38438 163779
7.79 6.27
Mit Nuc
Metal ion binding; oxidoreductase Unknown
18 Type III effector protein XopAD (Xanthomonas oryzae pv. oryzicola BLS256) Hypothetical protein HMPREF9413_4085 (Paenibacillus sp. HGF7) CG3173 (Drosophila melanogaster) CD05534p (Drosophila melanogaster) Hypothetical protein MTES_1762 (Microbacterium testaceum StLB037 Ppx / GppA phosphatase (Hyphomicrobium denitrificans ATCC 51888) Nonstructural polyprotein (Microbacterium testaceum StLB037) Nonstructural polyprotein (Chikungunya virus) GE14364 (Drosophila yakuba) Hypothetical protein CLF_101160 (Clonorchis sinensis) Biopolymer transport protein ExbD/TolR (Bacteroides helcogenes P 36-108) GA module protein (Gardnerella vaginalis 315-A)
AEQ98548 ZP_08507129
NP_611875 AAN71641
YP_004224606 YP_003756958 YP_004224606
ADG95951
XP_002092752 GAA48087
YP_004160702 EGL13251
93 92
91 91 91 90 90
89
88 87 86 85
314948 242936
237286 237314 31853 56501
279067
279126
237110 38687 24450
213357
7.65 5.69
6.15 6.15 8.24 9.00 6.75
6.90
6.27 8.95 5.76 5.77
P, OM Cyt
Nuc Nuc Cyt Cyt
Virus
Virus
Nuc Cyt P P
Binding Nucleoside-triphosphatease; nucleotide binding Binding Binding Unknown Phosphatase ATP-, RNA binding; RNA polymerase; cysteine-type peptidase; helicase; mRNA methyltransferase Helicase; hydrolase; methyltransferase; nucleotidyltransferase; protease; RNA polymerase; thiol protease; transferase Binding Ca ion binding Transmembrane protein transport Pathogenesis
19 Hypothetical protein DespoDRAFT 1881(Desulfobacter postgatei 2ac9) Nitrate reductase [NAD(P)H], large subunit (Staphylococcus aureus A9635)
ZP_09097030 ZP_05687927
92 87
13368 89608
5.02 5.28
n.d. Cyt
Unknown Oxidoreductase
20 Hypothetical protein bthur0013_51610 (Bacillus thuringiensis IBL 200) Thrombospondin type 3 repeat superfamily protein (Peptoniphilus duerdenii ATCC BAA-1640)
ZP_04074828
ZP_07400466
98
92
20510
323865
8.67
5.11
Cyt, Ext CW
Unknown Ca binding
21 Hypothetical protein NEMVEDRAFT_v1g222052 (Nematostella vectensis) XP_001621378 72 23441 4.33 Cyt, Nuc
Unknown
22 Putative methylase (Streptomyces hygroscopicus ATCC 53653) ZP_07293066 86 23036 10.8 M Methyltransferase
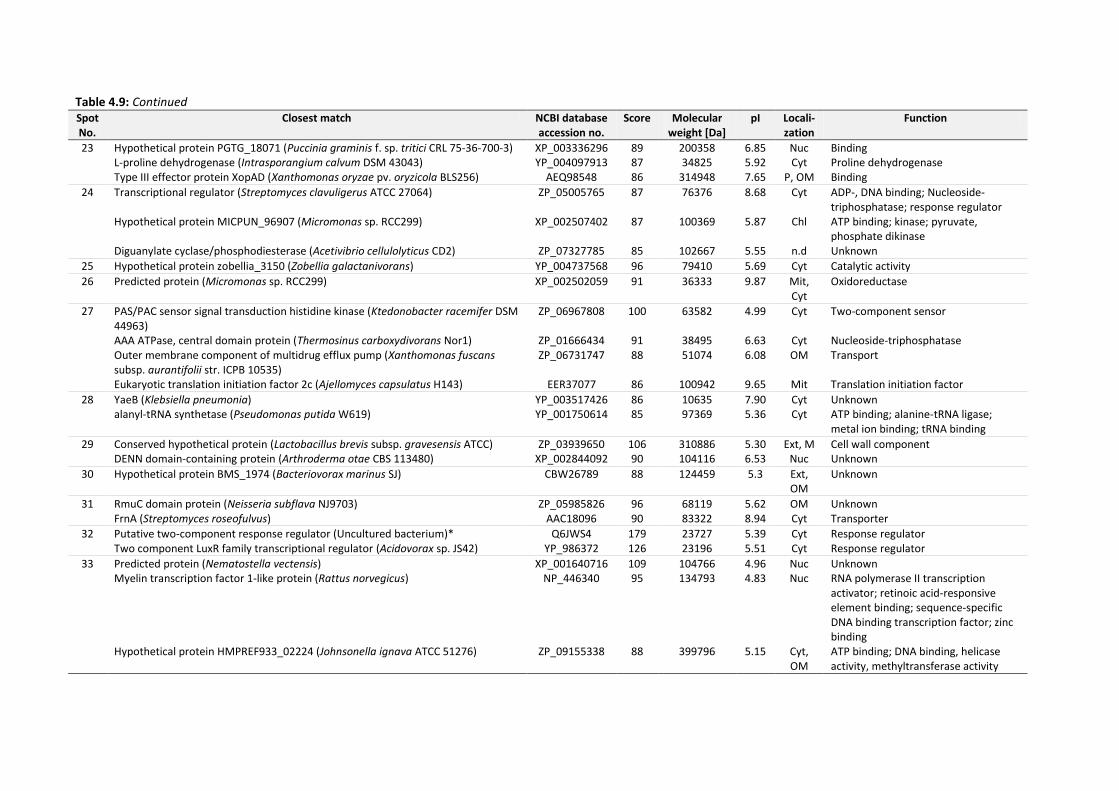
Table 4.9: Continued
Spot No.
Closest match NCBI database accession no.
Score Molecular weight [Da]
pI Locali-zation
Function
23 Hypothetical protein PGTG_18071 (Puccinia graminis f. sp. tritici CRL 75-36-700-3) L-proline dehydrogenase (Intrasporangium calvum DSM 43043) Type III effector protein XopAD (Xanthomonas oryzae pv. oryzicola BLS256)
XP_003336296 YP_004097913
AEQ98548
89 87 86
200358 34825
314948
6.85 5.92 7.65
Nuc Cyt
P, OM
Binding Proline dehydrogenase Binding
24 Transcriptional regulator (Streptomyces clavuligerus ATCC 27064) Hypothetical protein MICPUN_96907 (Micromonas sp. RCC299) Diguanylate cyclase/phosphodiesterase (Acetivibrio cellulolyticus CD2)
ZP_05005765
XP_002507402
ZP_07327785
87
87
85
76376
100369
102667
8.68
5.87
5.55
Cyt
Chl
n.d
ADP-, DNA binding; Nucleoside-triphosphatase; response regulator ATP binding; kinase; pyruvate, phosphate dikinase Unknown
25 Hypothetical protein zobellia_3150 (Zobellia galactanivorans) YP_004737568 96 79410 5.69 Cyt Catalytic activity
26 Predicted protein (Micromonas sp. RCC299) XP_002502059 91 36333 9.87 Mit, Cyt
Oxidoreductase
27 PAS/PAC sensor signal transduction histidine kinase (Ktedonobacter racemifer DSM 44963) AAA ATPase, central domain protein (Thermosinus carboxydivorans Nor1) Outer membrane component of multidrug efflux pump (Xanthomonas fuscans subsp. aurantifolii str. ICPB 10535) Eukaryotic translation initiation factor 2c (Ajellomyces capsulatus H143)
ZP_06967808
ZP_01666434 ZP_06731747
EER37077
100
91 88
86
63582
38495 51074
100942
4.99
6.63 6.08
9.65
Cyt
Cyt OM
Mit
Two-component sensor Nucleoside-triphosphatase Transport Translation initiation factor
28 YaeB (Klebsiella pneumonia) alanyl-tRNA synthetase (Pseudomonas putida W619)
YP_003517426 YP_001750614
86 85
10635 97369
7.90 5.36
Cyt Cyt
Unknown ATP binding; alanine-tRNA ligase; metal ion binding; tRNA binding
29 Conserved hypothetical protein (Lactobacillus brevis subsp. gravesensis ATCC) DENN domain-containing protein (Arthroderma otae CBS 113480)
ZP_03939650 XP_002844092
106 90
310886 104116
5.30 6.53
Ext, M Nuc
Cell wall component Unknown
30 Hypothetical protein BMS_1974 (Bacteriovorax marinus SJ) CBW26789 88 124459 5.3 Ext, OM
Unknown
31 RmuC domain protein (Neisseria subflava NJ9703) FrnA (Streptomyces roseofulvus)
ZP_05985826 AAC18096
96 90
68119 83322
5.62 8.94
OM Cyt
Unknown Transporter
32 Putative two-component response regulator (Uncultured bacterium)* Two component LuxR family transcriptional regulator (Acidovorax sp. JS42)
Q6JWS4 YP_986372
179 126
23727 23196
5.39 5.51
Cyt Cyt
Response regulator Response regulator
33 Predicted protein (Nematostella vectensis) Myelin transcription factor 1-like protein (Rattus norvegicus) Hypothetical protein HMPREF933_02224 (Johnsonella ignava ATCC 51276)
XP_001640716 NP_446340
ZP_09155338
109 95
88
104766 134793
399796
4.96 4.83
5.15
Nuc Nuc
Cyt, OM
Unknown RNA polymerase II transcription activator; retinoic acid-responsive element binding; sequence-specific DNA binding transcription factor; zinc binding ATP binding; DNA binding, helicase activity, methyltransferase activity
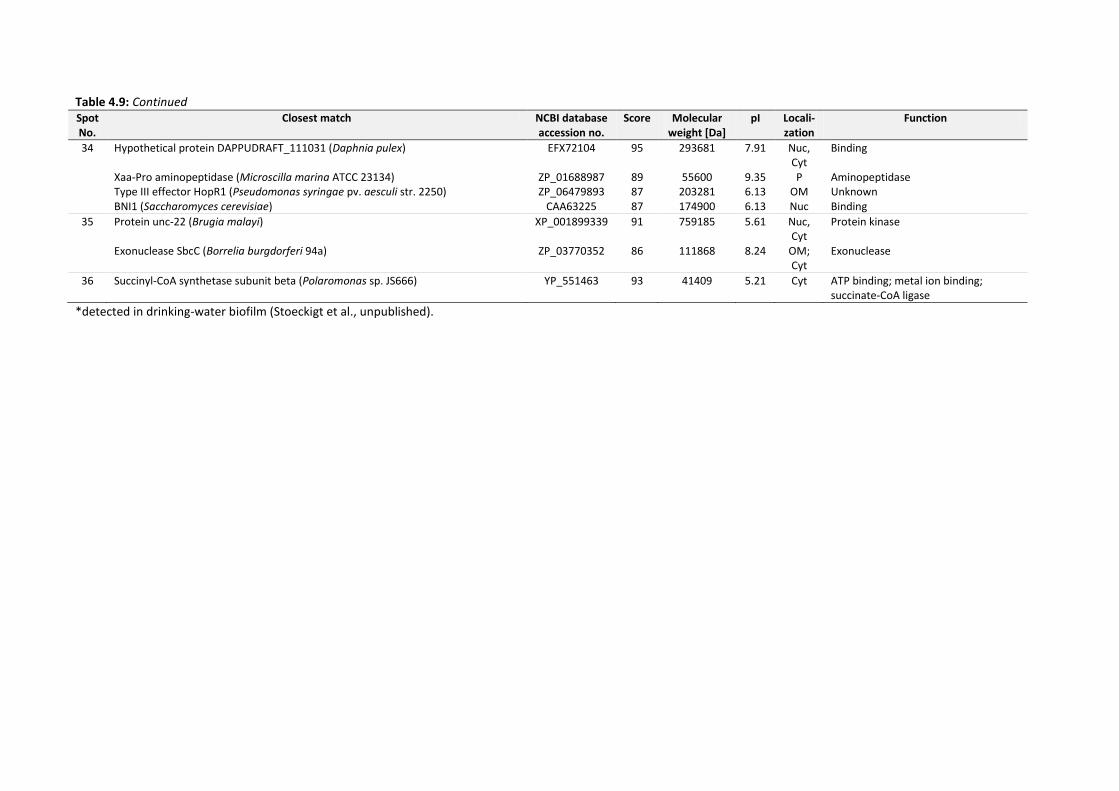
Table 4.9: Continued
Spot No.
Closest match NCBI database accession no.
Score Molecular weight [Da]
pI Locali-zation
Function
34 Hypothetical protein DAPPUDRAFT_111031 (Daphnia pulex) Xaa-Pro aminopeptidase (Microscilla marina ATCC 23134) Type III effector HopR1 (Pseudomonas syringae pv. aesculi str. 2250) BNI1 (Saccharomyces cerevisiae)
EFX72104
ZP_01688987 ZP_06479893
CAA63225
95
89 87 87
293681
55600 203281 174900
7.91
9.35 6.13 6.13
Nuc, Cyt P
OM Nuc
Binding Aminopeptidase Unknown Binding
35 Protein unc-22 (Brugia malayi) Exonuclease SbcC (Borrelia burgdorferi 94a)
XP_001899339
ZP_03770352
91
86
759185
111868
5.61
8.24
Nuc, Cyt
OM; Cyt
Protein kinase Exonuclease
36 Succinyl-CoA synthetase subunit beta (Polaromonas sp. JS666)
YP_551463 93 41409 5.21 Cyt ATP binding; metal ion binding; succinate-CoA ligase
*detected in drinking-water biofilm (Stoeckigt et al., unpublished).
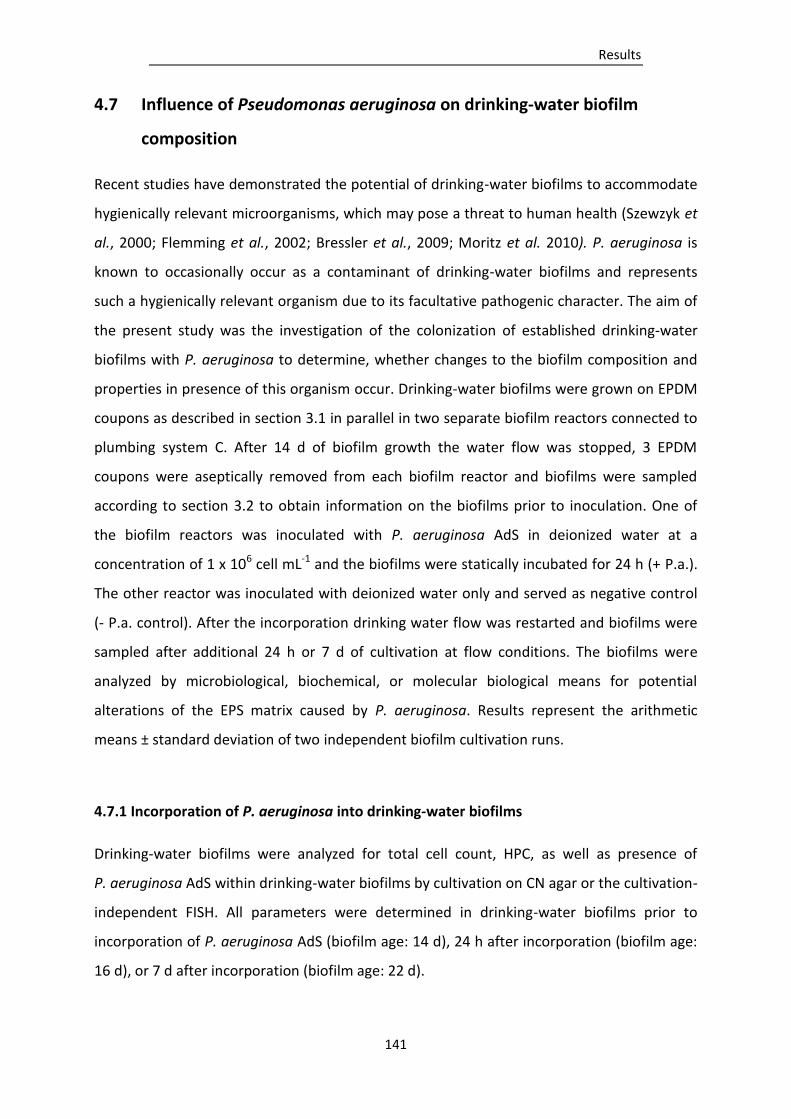
Results
141
4.7 Influence of Pseudomonas aeruginosa on drinking-water biofilm
composition
Recent studies have demonstrated the potential of drinking-water biofilms to accommodate
hygienically relevant microorganisms, which may pose a threat to human health (Szewzyk et
al., 2000; Flemming et al., 2002; Bressler et al., 2009; Moritz et al. 2010). P. aeruginosa is
known to occasionally occur as a contaminant of drinking-water biofilms and represents
such a hygienically relevant organism due to its facultative pathogenic character. The aim of
the present study was the investigation of the colonization of established drinking-water
biofilms with P. aeruginosa to determine, whether changes to the biofilm composition and
properties in presence of this organism occur. Drinking-water biofilms were grown on EPDM
coupons as described in section 3.1 in parallel in two separate biofilm reactors connected to
plumbing system C. After 14 d of biofilm growth the water flow was stopped, 3 EPDM
coupons were aseptically removed from each biofilm reactor and biofilms were sampled
according to section 3.2 to obtain information on the biofilms prior to inoculation. One of
the biofilm reactors was inoculated with P. aeruginosa AdS in deionized water at a
concentration of 1 x 10⁶ cell mL-1 and the biofilms were statically incubated for 24 h (+ P.a.).
The other reactor was inoculated with deionized water only and served as negative control
(- P.a. control). After the incorporation drinking water flow was restarted and biofilms were
sampled after additional 24 h or 7 d of cultivation at flow conditions. The biofilms were
analyzed by microbiological, biochemical, or molecular biological means for potential
alterations of the EPS matrix caused by P. aeruginosa. Results represent the arithmetic
means ± standard deviation of two independent biofilm cultivation runs.
4.7.1 Incorporation of P. aeruginosa into drinking-water biofilms
Drinking-water biofilms were analyzed for total cell count, HPC, as well as presence of
P. aeruginosa AdS within drinking-water biofilms by cultivation on CN agar or the cultivation-
independent FISH. All parameters were determined in drinking-water biofilms prior to
incorporation of P. aeruginosa AdS (biofilm age: 14 d), 24 h after incorporation (biofilm age:
16 d), or 7 d after incorporation (biofilm age: 22 d).
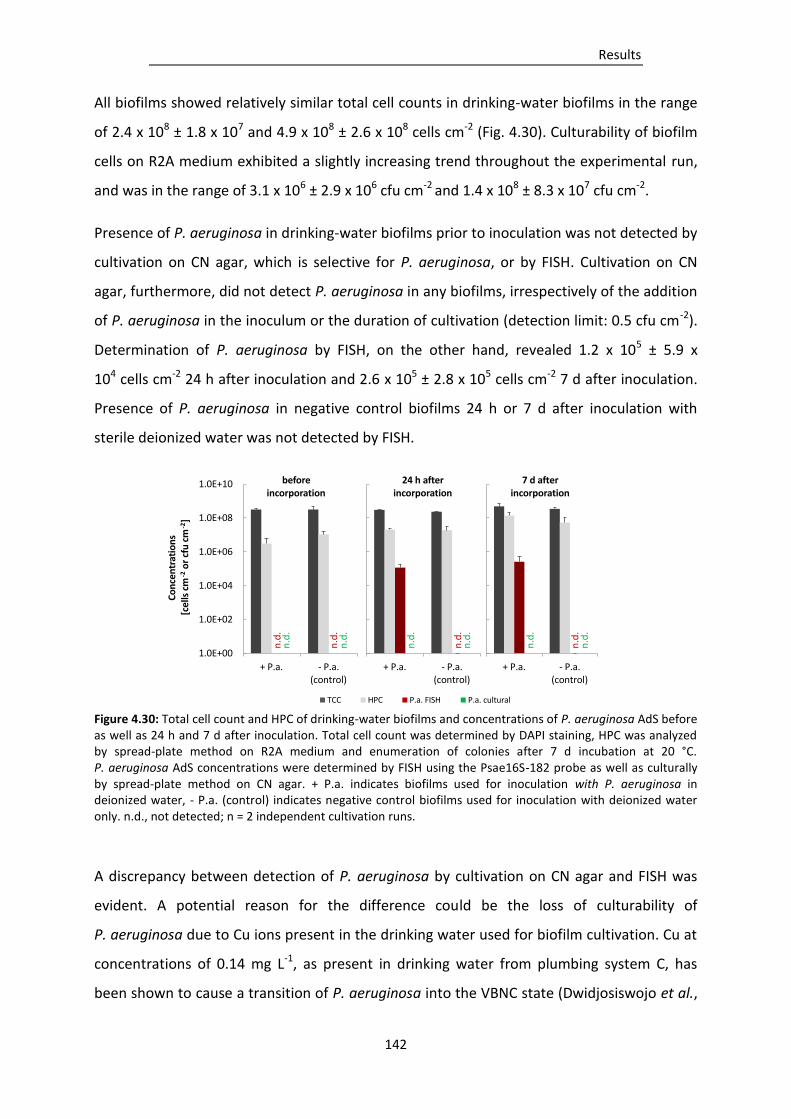
Results
142
All biofilms showed relatively similar total cell counts in drinking-water biofilms in the range
of 2.4 x 10⁸ ± 1.8 x 10⁷ and 4.9 x 10⁸ ± 2.6 x 10⁸ cells cm-2 (Fig. 4.30). Culturability of biofilm
cells on R2A medium exhibited a slightly increasing trend throughout the experimental run,
and was in the range of 3.1 x 10⁶ ± 2.9 x 10⁶ cfu cm-2 and 1.4 x 10⁸ ± 8.3 x 10⁷ cfu cm-2.
Presence of P. aeruginosa in drinking-water biofilms prior to inoculation was not detected by
cultivation on CN agar, which is selective for P. aeruginosa, or by FISH. Cultivation on CN
agar, furthermore, did not detect P. aeruginosa in any biofilms, irrespectively of the addition
of P. aeruginosa in the inoculum or the duration of cultivation (detection limit: 0.5 cfu cm-2).
Determination of P. aeruginosa by FISH, on the other hand, revealed 1.2 x 10⁵ ± 5.9 x
104 cells cm-2 24 h after inoculation and 2.6 x 10⁵ ± 2.8 x 10⁵ cells cm-2 7 d after inoculation.
Presence of P. aeruginosa in negative control biofilms 24 h or 7 d after inoculation with
sterile deionized water was not detected by FISH.
Figure 4.30: Total cell count and HPC of drinking-water biofilms and concentrations of P. aeruginosa AdS before as well as 24 h and 7 d after inoculation. Total cell count was determined by DAPI staining, HPC was analyzed by spread-plate method on R2A medium and enumeration of colonies after 7 d incubation at 20 °C. P. aeruginosa AdS concentrations were determined by FISH using the Psae16S-182 probe as well as culturally by spread-plate method on CN agar. + P.a. indicates biofilms used for inoculation with P. aeruginosa in deionized water, - P.a. (control) indicates negative control biofilms used for inoculation with deionized water only. n.d., not detected; n = 2 independent cultivation runs.
A discrepancy between detection of P. aeruginosa by cultivation on CN agar and FISH was
evident. A potential reason for the difference could be the loss of culturability of
P. aeruginosa due to Cu ions present in the drinking water used for biofilm cultivation. Cu at
concentrations of 0.14 mg L-1, as present in drinking water from plumbing system C, has
been shown to cause a transition of P. aeruginosa into the VBNC state (Dwidjosiswojo et al.,
TCC HPC P.a. FISH P.a. cultural
1.0E+00
1.0E+02
1.0E+04
1.0E+06
1.0E+08
1.0E+10
+ P.a. - P.a.(control)
Co
nce
ntr
atio
ns
[cel
ls c
m-2
or
cfu
cm
-2]
before incorporation
+ P.a. - P.a.(control)
24 h after incorporation
+ P.a. - P.a.(control)
7 d after incorporation
n.d
. n
.d.
n.d
. n
.d.
n.d
. n
.d.
n.d
. n
.d.
n.d
.
n.d
.
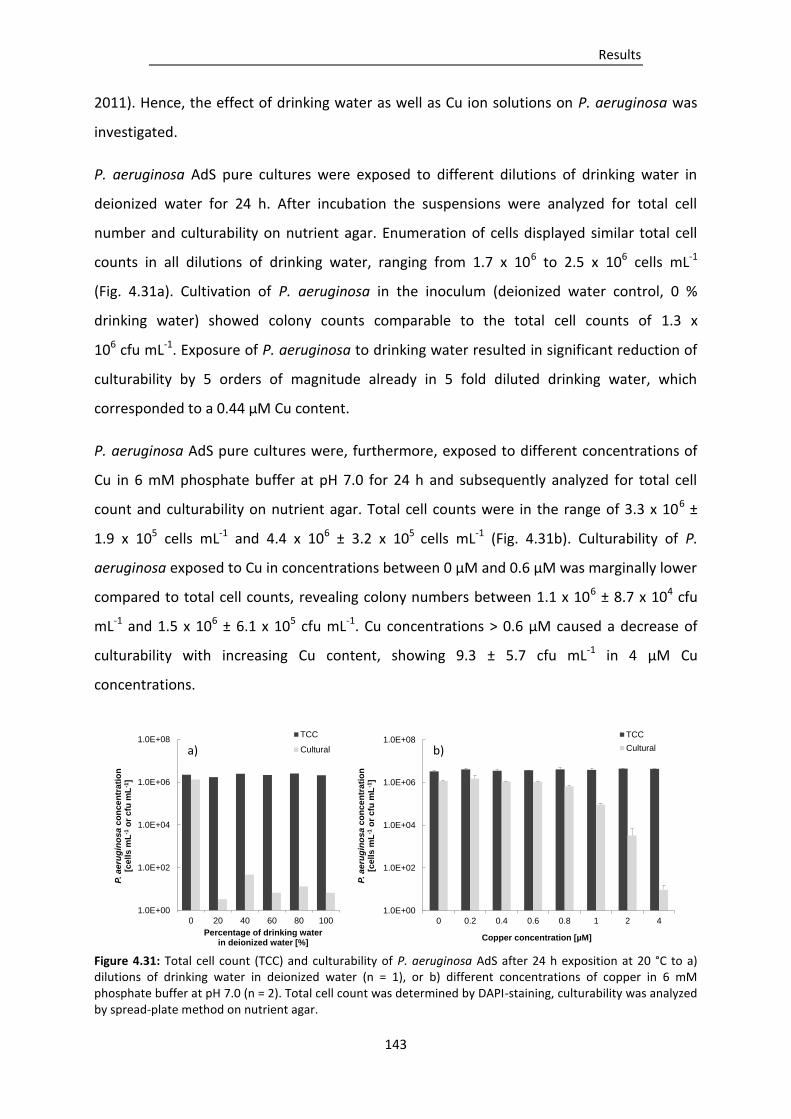
Results
143
2011). Hence, the effect of drinking water as well as Cu ion solutions on P. aeruginosa was
investigated.
P. aeruginosa AdS pure cultures were exposed to different dilutions of drinking water in
deionized water for 24 h. After incubation the suspensions were analyzed for total cell
number and culturability on nutrient agar. Enumeration of cells displayed similar total cell
counts in all dilutions of drinking water, ranging from 1.7 x 10⁶ to 2.5 x 10⁶ cells mL-1
(Fig. 4.31a). Cultivation of P. aeruginosa in the inoculum (deionized water control, 0 %
drinking water) showed colony counts comparable to the total cell counts of 1.3 x
106 cfu mL-1. Exposure of P. aeruginosa to drinking water resulted in significant reduction of
culturability by 5 orders of magnitude already in 5 fold diluted drinking water, which
corresponded to a 0.44 µM Cu content.
P. aeruginosa AdS pure cultures were, furthermore, exposed to different concentrations of
Cu in 6 mM phosphate buffer at pH 7.0 for 24 h and subsequently analyzed for total cell
count and culturability on nutrient agar. Total cell counts were in the range of 3.3 x 10⁶ ±
1.9 x 10⁵ cells mL-1 and 4.4 x 10⁶ ± 3.2 x 10⁵ cells mL-1 (Fig. 4.31b). Culturability of P.
aeruginosa exposed to Cu in concentrations between 0 µM and 0.6 µM was marginally lower
compared to total cell counts, revealing colony numbers between 1.1 x 10⁶ ± 8.7 x 10⁴ cfu
mL-1 and 1.5 x 10⁶ ± 6.1 x 10⁵ cfu mL-1. Cu concentrations > 0.6 µM caused a decrease of
culturability with increasing Cu content, showing 9.3 ± 5.7 cfu mL-1 in 4 µM Cu
concentrations.
Figure 4.31: Total cell count (TCC) and culturability of P. aeruginosa AdS after 24 h exposition at 20 °C to a) dilutions of drinking water in deionized water (n = 1), or b) different concentrations of copper in 6 mM phosphate buffer at pH 7.0 (n = 2). Total cell count was determined by DAPI-staining, culturability was analyzed by spread-plate method on nutrient agar.
1.0E+00
1.0E+02
1.0E+04
1.0E+06
1.0E+08
0 20 40 60 80 100
P. a
eru
gin
os
a c
on
ce
ntr
ati
on
[ce
lls
mL
-1o
r c
fu m
L-1
]
Percentage of drinking water in deionized water [%]
TCC
Cultural
1.0E+00
1.0E+02
1.0E+04
1.0E+06
1.0E+08
0 0.2 0.4 0.6 0.8 1 2 4
P. a
eru
gin
os
a c
on
ce
ntr
ati
on
[ce
lls
mL
-1o
r c
fu m
L-1
]
Copper concentration [µM]
TCC
Culturala) b)
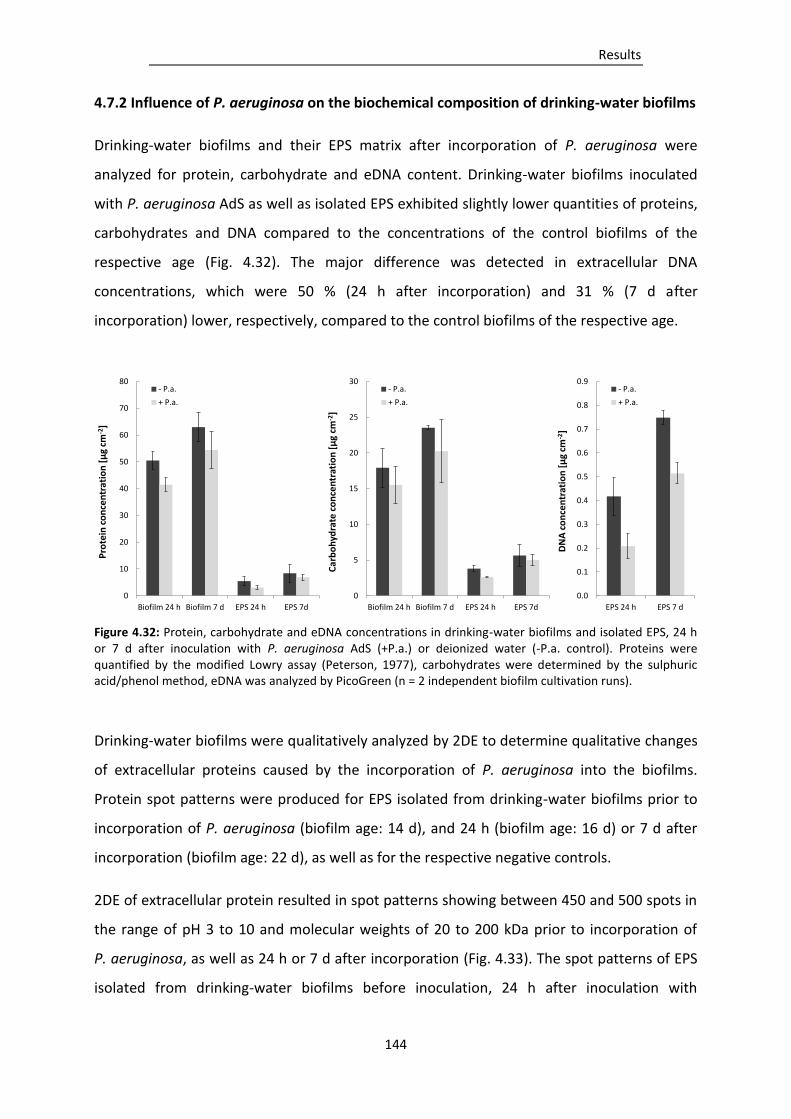
Results
144
4.7.2 Influence of P. aeruginosa on the biochemical composition of drinking-water biofilms
Drinking-water biofilms and their EPS matrix after incorporation of P. aeruginosa were
analyzed for protein, carbohydrate and eDNA content. Drinking-water biofilms inoculated
with P. aeruginosa AdS as well as isolated EPS exhibited slightly lower quantities of proteins,
carbohydrates and DNA compared to the concentrations of the control biofilms of the
respective age (Fig. 4.32). The major difference was detected in extracellular DNA
concentrations, which were 50 % (24 h after incorporation) and 31 % (7 d after
incorporation) lower, respectively, compared to the control biofilms of the respective age.
Figure 4.32: Protein, carbohydrate and eDNA concentrations in drinking-water biofilms and isolated EPS, 24 h or 7 d after inoculation with P. aeruginosa AdS (+P.a.) or deionized water (-P.a. control). Proteins were quantified by the modified Lowry assay (Peterson, 1977), carbohydrates were determined by the sulphuric acid/phenol method, eDNA was analyzed by PicoGreen (n = 2 independent biofilm cultivation runs).
Drinking-water biofilms were qualitatively analyzed by 2DE to determine qualitative changes
of extracellular proteins caused by the incorporation of P. aeruginosa into the biofilms.
Protein spot patterns were produced for EPS isolated from drinking-water biofilms prior to
incorporation of P. aeruginosa (biofilm age: 14 d), and 24 h (biofilm age: 16 d) or 7 d after
incorporation (biofilm age: 22 d), as well as for the respective negative controls.
2DE of extracellular protein resulted in spot patterns showing between 450 and 500 spots in
the range of pH 3 to 10 and molecular weights of 20 to 200 kDa prior to incorporation of
P. aeruginosa, as well as 24 h or 7 d after incorporation (Fig. 4.33). The spot patterns of EPS
isolated from drinking-water biofilms before inoculation, 24 h after inoculation with
0
10
20
30
40
50
60
70
80
Biofilm 24 h Biofilm 7 d EPS 24 h EPS 7d
Pro
tein
co
nce
ntr
atio
n [
µg
cm-2
]
- P.a.
+ P.a.
0
5
10
15
20
25
30
Biofilm 24 h Biofilm 7 d EPS 24 h EPS 7d
Car
bo
hyd
rate
co
nce
ntr
atio
n [
µg
cm-2
]
- P.a.
+ P.a.
0.0
0.1
0.2
0.3
0.4
0.5
0.6
0.7
0.8
0.9
EPS 24 h EPS 7 d
DN
A c
on
cen
trat
ion
[µ
g cm
-2]
- P.a.
+ P.a.
Results
145
P. aeruginosa, and the control 24 h after inoculation with deionized water showed slight
variations of the spot profiles, however, no significant changes were evident. Prolonged
incubation resulted in a smaller number of high molecular weight proteins as well as basic
proteins 7 d after inoculation with P. aeruginosa or the control. This decrease was similar to
the results obtained in the dynamics studies in section 4.4.4. EPS before inoculation or 24 h
after inoculation showed 35 to 40 high molecular weight spots > 66 kDa. These spots were
not detected in the EPS of drinking-water biofilms 7 d after incorporation, which showed
protein spots mainly in pH regions between pH 4 and 7 and molecular weights of 21.5 and
66.3 kDa.
Comparison of extracellular protein spot patterns of biofilms 7 d after inoculation with
P. aeruginosa in deionized water with the control biofilm inoculated only with deionized
water revealed a small number of noticable alterations to the extracellular protein pattern
(Fig. 4.33d,e). Region 1 displayed a cluster of proteins composed of approximately 10 spots,
which was present in biofilms before inoculation, 24 h after inoculation with P. aeruginosa
and its control, and 7 d after inoculation with P. aeruginosa. This cluster, however, was
missing in the EPS of negative control biofilms 7 d after inoculation. Regions 2 and 3 on the
other hand showed clusters of proteins, each composed of 5 spots, which are only present in
the EPS of negative control biofilms 7 d after inoculation, but in no other sample.
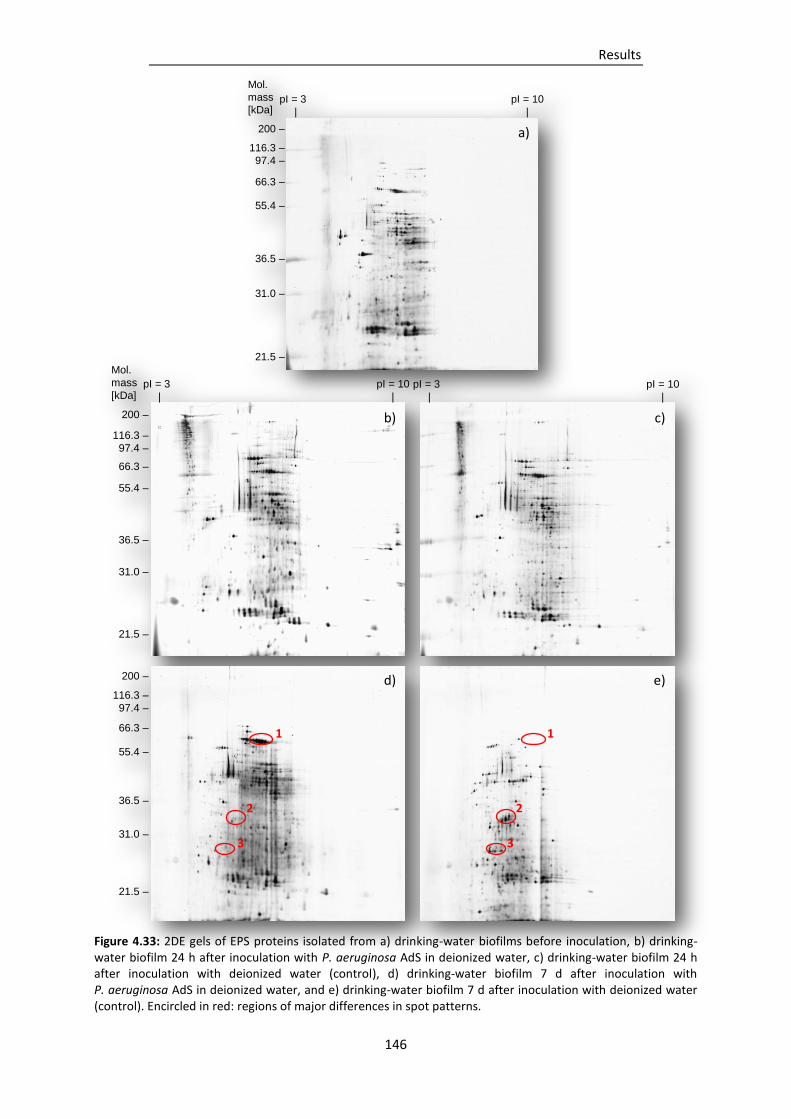
Results
146
Figure 4.33: 2DE gels of EPS proteins isolated from a) drinking-water biofilms before inoculation, b) drinking-water biofilm 24 h after inoculation with P. aeruginosa AdS in deionized water, c) drinking-water biofilm 24 h after inoculation with deionized water (control), d) drinking-water biofilm 7 d after inoculation with P. aeruginosa AdS in deionized water, and e) drinking-water biofilm 7 d after inoculation with deionized water (control). Encircled in red: regions of major differences in spot patterns.
Mol.
mass
[kDa]
200 –
116.3 –
97.4 –
66.3 –
55.4 –
36.5 –
31.0 –
21.5 –
pI = 3 pI = 10
| |
pI = 3 pI = 10
| |
200 –
116.3 –
97.4 –
66.3 –
55.4 –
36.5 –
31.0 –
21.5 –
Mol.
mass
[kDa]
200 –
116.3 –
97.4 –
66.3 –
55.4 –
36.5 –
31.0 –
21.5 –
pI = 3 pI = 10
| |
a)
1 1
2 2
3 3
b) c)
d) e)
Discussion
147
5. DISCUSSION
Drinking-water biofilms are ubiquitous in drinking water distribution as well as plumbing
systems. Generally, drinking-water biofilms are formed by autochthonous microorganisms,
which are considered harmless to human health (Wingender, 2011; Flemming et al., 2012).
The oligotrophic character of drinking water permits only limited biofilm development,
however, once nutrients become available, extensive growth can occur, leading to possible
contamination of the water phase. Furthermore, recent studies have demonstrated the
potential of drinking-water biofilms to accommodate hygienically relevant microorganisms,
which may pose a threat to human health (Szewzyk et al., 2000; Flemming et al., 2002;
Bressler et al., 2009; Moritz et al. 2010). This signifies the need of research in the field of
biofilm development and composition in drinking water systems, in order to understand the
formation mechanisms in this kind of environment and the biofilms’ significance as
reservoirs for hygienically relevant microorganisms. Despite numerous studies investigating
biofilm formation in these systems, none has addressed the EPS composition and function of
EPS within drinking-water biofilms.
The aim of the current study was the characterization of drinking-water biofilms with
particular regard to their EPS. Knowledge of the composition of drinking-water biofilms and
their EPS is essential, since EPS can be important targets for measures aimed at the
inactivation and removal of biofilm organisms from technical systems. In the first part of the
study, methods for cultivation of drinking-water biofilms, for EPS isolation and for analysis
were established and adapted, which was a particular challenge, due to the low amounts of
biomass usually found in drinking water systems. Drinking-water biofilms were cultivated on
coupons made of an EPDM rubber material, which met physical and chemical requirements
of the German KTW guideline (Umweltbundesamt, 2011) for plastic materials in drinking
Discussion
148
water, but not the microbiological recommendations according to the technical rule W270 of
the German Water and Gas Association (DVGW, 2007). This material was shown to support
elevated growth of drinking-water biofilms in real drinking water systems, causing
continuous contamination of the water phase (Kilb et al., 2003). Also Bressler et al. (2009)
indicated elevated drinking-water biofilm formation on this type of elastomer in a similar
experimental setup as used in the current study. The extensive biofilm formation on this
elastomer demonstrates a worst-case scenario for drinking water systems. This material was
applied in this study to obtain sufficient biomass for the analysis of drinking-water biofilms
and their EPS.
The characterization of EPS from drinking-water biofilms required isolation of EPS from the
biofilm. There is no universal method for the isolation of EPS from biofilms. Hence, the aim
was to establish a method for EPS isolation from drinking-water biofilms able to recover high
yields of EPS and allowing for a broad range of analytical methods for EPS characterization.
Commonly applied EPS isolation methods were tested and compared for their suitability to
isolate EPS from drinking-water biofilms. The methods were evaluated based on their EPS
yield, detrimental impact on biofilm cells, as well as compatibility with subsequent analytical
methods. The focus was on the CER isolation method described by Jahn and Nielsen (1995),
which was miniaturized and optimized in the present study.
The established methods for cultivation, sampling and characterization of drinking-water
biofilms and EPS were applied to investigate different aspects of drinking-water biofilms.
The progress of biofilm formation on EPDM was analyzed, to obtain information on the
dynamics of drinking-water biofilms and their EPS throughout the different stages of biofilm
growth. Moreover, drinking-water biofilms were cultivated on EPDM in different distribution
and copper plumbing systems to examine the influence of drinking water characteristics as
well as plumbing materials on biofilm and EPS composition, and to investigate variability
among drinking-water biofilms according to their origin. Furthermore, the potential of
drinking-water biofilms to harbor hygienically relevant microorganisms was addressed.
Established drinking-water biofilms were inoculated with P. aeruginosa as a model
microorganism of hygienical relevance, to examine its incorporation, persistence and
influence on drinking-water biofilm and EPS composition.
Discussion
149
The EPS matrix, which mainly consists of polysaccharides, proteins, DNA, and lipids, has a
profound role for the establishment and maintenance of biofilms (Flemming and Wingender,
2010). Extracellular proteins are considered to have their major functions as enzymes or as
structural components of biofilms (Wingender and Jaeger, 2002). However, identification of
extracellular enzymes within biofilms has only been attempted in a small number of studies.
In the present study, extracellular proteins were of particular interest and were analyzed and
identified to determine their function in the EPS matrix of drinking-water biofilms.
5.1 EPS isolation from drinking-water biofilms
EPS isolation is generally the most crucial step for the analysis of EPS, as the efficiency and
completeness of the isolation method determines the outcome of any subsequent analysis.
There is no universal method for the isolation of EPS, instead, various physical and chemical
methods have been developed in past decades, aiming at the destabilization and
consequential solubilization of EPS components. In this study EPS isolation from drinking-
water biofilms was pursued, in order to quantitatively and qualitatively analyze EPS
composition. EPS isolation from drinking-water biofilms represents a challenge due to the
usually low amounts of biomass found on surfaces of drinking-water systems. The
requirements for the EPS isolation method in this case were a) the method should mobilize
sufficient amounts of EPS components from the drinking-water biofilm matrix, b) the
method should allow for a broad range of subsequent analytical methods without
interference for a thorough characterization of the biofilms, and c) the isolation treatment
should not affect biofilm cell integrity. In this study the main focus was on EPS isolation by
CER (Jahn and Nielsen, 1995; Frølund et al., 1996), which has shown very promising results in
a study conducted by Bressler (2008) for EPS isolation from drinking-water biofilms. The CER
isolation was miniaturized, to meet the requirements of the low biomass of drinking-water
biofilms, and optimized, in respect to duration of shaking with CER. The optimized CER
isolation was compared to four alternative EPS isolation procedures conventionally applied
for activated sludge or pure culture biofilms, which included shaking (control), as well as
stirring in presence of formaldehyde and NaOH, stirring in presence of EDTA and heating.
Discussion
150
The substratum EPDM and the cultivation conditions allowed for the growth of relatively
thick biofilms of drinking-water organisms, so that a sufficient amount of EPS was present
within the biofilms and could be recovered in quantifiable amounts by all isolation methods.
The EPS yields varied depending on the EPS isolation method. Furthermore, the addition of
chemicals, such as formaldehyde, NaOH, or EDTA, for EPS isolation from drinking-water
biofilms showed limitations for subsequent EPS analyses (Tab. 5.1).
- CER isolation -
CER treatment has been applied for EPS isolation from a variety of biofilms, including pure
culture biofilms of several microbial species, sewer biofilms, activated sludge biofilms and
benthic biofilms (Tab. 1.2). This method functions through the mobilization of multivalent
cations which cross-link EPS polymers, resulting in the destabilization of the EPS matrix and
enhanced solubilization of EPS components (Rudd et al., 1983; Jahn and Nielsen, 1995;
Frølund et al., 1996). The selectivity of the CER towards divalent cations has been described
by Bonner and Smith (1956), using the CER Dowex 50, and showing the following hierarchy:
Ba > Pb > Sr > Ca > Ni > Cd > Cu > Co > Zn > Mg. Presence of multivalent cations including
Ca2+ and Mg2+, which are characteristic cations in drinking water, as well as Fe2+/3+, Cu1+/2+,
Zn2+ and Al3+, originating from the distribution system or plumbing materials, was confirmed
in drinking-water biofilms in the current study. These cations were hypothesized to stabilize
drinking-water biofilm’s EPS matrix. Treatment of drinking-water biofilms with CER was
expected to bind these cations and liberate increased amounts of EPS components also in
this type of biofilm analyzed in the present study.
The isolation of EPS by use of the CER proved to be most suitable for the recovery of EPS
from drinking-water biofilms in terms of EPS yields, without causing damage to biofilm cells
or interference with subsequent analyses. Significantly higher EPS yields were isolated with
the help of the CER compared to simple shaking treatment. Similar results were obtained by
Jahn and Nielsen (1995) and Frølund et al. (1996) for EPS isolated from sewer biofilms and
activated sludge, respectively. There was no interference with any subsequent analyses, as
the CER was completely separated from the treated biofilm suspension by simple
sedimentation. Also, absence of activity of the strictly intracellular enzyme G6PDH in the EPS
Discussion
151
solutions indicated no cell lysis induced by CER treatment for up to 60 min. This observation
was in accordance to results by Jahn and Nielsen (1995), Frølund et al. (1996), as well as Wu
and Xi (2009) who described this method as gentle to biofilm cells, based on G6PDH activity
measurements. Also application of other markers as indicators of cell lysis, such as increased
DNA (Azeredo et al., 1999; Comte et al., 2006) or ATP (Azeredo et al., 2003) content in the
EPS, as well as live/dead staining (Wu and Xi, 2009) showed no damage to cells in diverse
biofilms caused by EPS isolation by CER. However, prolonged duration of the CER isolation
may result in stress on the microorganisms, reflected by the slight decreasing trend of
culturability of biofilm cells, as occured in the present study, as well as indicated by Jahn and
Nielsen (1995). This may be caused by the removal of cations such as Mg2+ from the outer
membrane by CER, causing its destabilization (Jahn and Nielsen, 1995), or due to the higher
shear stress, causing physical damage to the cells (Taylor Eighmy and Bishop, 1985; Jahn and
Nielsen, 1995). Shaking in presence of CER for 20 min was found to be optimal for the
isolation of EPS from drinking-water biofilms, showing significantly increased yields of EPS
components compared to the control treatment by shaking and no noticeable detrimental
impact on cells.
Compared to the control EPS isolation by shaking, CER isolation showed highest increase in
yields for DNA, followed by proteins, while increase in polysaccharide yields was lowest. This
can be attributed to the polyanionic character and higher charge density of the polymers, in
particular DNA, or acidic proteins, which allow for cross-linkages of the polymers with the aid
of multivalent cations, and consequently, firm binding of the polymers within the EPS matrix.
Polysaccharides in drinking-water biofilms, on the other hand, were shown to be composed
mainly of non uronic acid-containing carbohydrates, offering lower amounts of binding sites
for multivalent cations, and being to a higher degree bound in the EPS matrix by forces other
than electrostatic bridging. Hence, removal of multivalent cations by CER isolation could
have affected DNA and proteins to a higher degree, compared to polysaccharides. Similar
findings have been shown by Higgins and Novak (1997), who demonstrated that proteins
readily bind to divalent cations leading to their precipitation. Once divalent cations have
been displaced in their study by the addition of monovalent ions, solubility of proteins
increased. Also Park and Novak (2007) described higher isolation yields of proteins
compared to polysaccharides from activated sludge. Increases in extraction yields of
Discussion
152
carbohydrates are thought to be caused mainly mechanically, due to the higher shear
imposed by shaking with the CER compared to simple shaking. Alternatively,
polysaccharides, which were bound directly to proteins, such as lectins or lectin-like
proteins, potentially present in drinking-water biofilms, could have been liberated due to the
release of the proteins (Park and Novak, 2007).
The higher isolation efficiency of CER isolation compared to simple shaking treatment can be
attributed to the removal of multivalent cations from the EPS, in particular Ca2+ or Mg2+.
These ions are characteristic components of drinking water and were accumulated from the
water phase in elevated concentrations within drinking-water biofilms cultivated in this
study. 20 min CER isolation was sufficient for an almost complete removal of Ca (> 86 %) and
Mg (> 56 %) from the biofilm. To some extent Fe (37 %) and Cu (44 %) could be removed
from the biofilm. The mobilization of Fe is contrary to results by Park and Novak (2007), who
demonstrated no effect of CER treatment on Fe or Al concentrations in activated sludge
after CER treatment. Wilén et al. (2003) found strong correlations between concentrations
of total EPS isolated by CER and concentrations of Ca2+ and Mg2+, while the correlations with
Fe3+ or Al3+ were low, and postulated, that the general mechanism of EPS matrix
disintegration by CER was mainly due to the removal of divalent cations, and not trivalent
cations (Wilén et al., 2003; Park and Novak, 2007). However, Fe can exist as trivalent Fe(III),
as well as divalent Fe(II). The divalent form was not considered in the study by Wilén et al.
(2003), as it usually constitutes a low proportion of total Fe in activated sludge (Nielsen et
al., 1997). The removal of Fe from drinking-water biofilms in the present study may indicate
presence of Fe(II) bound in the EPS of drinking-water biofilms, which, unlike the oxidized
Fe(III), could interact with the CER due to its divalent character. Though Fe in drinking water
exists solely as Fe(III), iron-reducing bacteria, which have been shown to reside in drinking-
water biofilms (Teng et al., 2008; Wang et al., 2012), may have utilized Fe(III), which was
accumulated in the biofilm matrix as electron-acceptor, reducing it to Fe(II).
Despite the relatively low removal rates of Fe and Cu from the biofilm suspension by CER
treatment, final EPS solutions contained only 6.8 % and 4.1 % of the initial concentration of
these cations, respectively. This indicates that Fe and Cu were additionally removed in the
course of EPS clean-up by centrifugation and filter sterilization. This can have various
explanations. Similarly to Fe, also Cu exists in two oxidation states, Cu(I) and Cu(II), both of
Discussion
153
which are stable in water (Mikolay et al., 2010). Both, the reduced Cu(I) as well as the
oxidized Fe(III) could have remained attached to the cell fraction, due to a potentially low
affinity of the CER towards the cations in these oxidations states. Moreover, irrespective of
their oxidation state, Fe and Cu could have been firmly bound to an EPS fraction, which
could not be isolated by CER treatment, to cellular material, or present within the cells.
Alternatively, Fe and Cu could be present in a particulate and insoluble form, which could
explain the particulate matter found during SEM analysis (Fig. 4.5), and which would
sediment during centrifugation.
- Formaldehyde/NaOH -
Formaldehyde/NaOH has been mainly applied for the isolation of EPS from activated sludge
(Liu and Fang, 2002; Comte et al., 2006a). Formaldehyde is believed to “fix” cells by
chemically reacting with amino, hydroxyl, carbonyl and sulfhydryl groups of proteins and
nucleic acids in the cell membrane, to prevent lysis during EPS isolation. NaOH on the other
hand strongly increases the pH, causing dissociation of acidic functional groups of EPS and
repulsion of negatively charged EPS components (Liu and Fang, 2002; Comte et al., 2006a,b;
D’Abzac et al., 2010).
Treatment of drinking-water biofilms with formaldehyde/NaOH resulted in interference of
the chemicals with analysis of EPS components as well as a complete loss of culturability.
The loss of culturability may indicate impairment of cells or, in the worst case, even potential
cell lysis, causing a contamination of the EPS with intracellular material. This observation is in
agreement with Wu and Xi (2009), who indicated cell lysis induced by NaOH treatment
applied for EPS isolation from pure culture biofilms of Acinetobacter sp. strain AC811 using
live/dead staining. Increased DNA content in the EPS has often been used as an indication
for cell lysis due to EPS isolation procedures, and has also been applied in various studies to
detect cell lysis due to formaldehyde, NaOH or combinations of formaldehyde with NaOH
(Tab. 1.2). The DNA yield of formaldehyde/NaOH isolation from drinking-water biofilms was,
with exception of the control method by shaking, lowest, which would be contrary to the
assumption of cell lysis. However, the high pH of the EPS solution of pH > 14 after addition of
NaOH may have resulted in a decreased fluorescence yield of the PicoGreen dye applied for
Discussion
154
DNA quantification in this study. According to the manufacturer, PicoGreen is effective in a
pH range of 7 to 8, with an optimum pH of 7.5 (Molecular Probes, 2008). An elevated pH
during DNA measurement in the current study could have inhibited correct binding of the
dye. Furthremore, PicoGreen mainly binds to double-stranded DNA, while contributions of
single-stranded DNA or RNA to the signal intensity are negligible (Singer et al., 1997;
Molecular Probes, 2008). DNA in the EPS would be denatured and consequently single
stranded at a pH > 14. Also hydrolysis of DNA at such a high pH value needs to be
considered. Dialyzed EPS solutions usually showed higher DNA contents, which may be
attributed to a decrease of pH during dialysis to pH 9.5, allowing for enhanced binding of the
PicoGreen reagent to DNA. Alternatively, the decrease in pH value may have allowed for a
partial reformation of hydrogen bonds and reannealing of the DNA strands and,
consequently, an improved binding of the PicoGreen reagent. Therefore, DNA
concentrations determined after EPS isolation by formaldehyde/NaOH are very likely to be
underestimated.
Formaldehyde/NaOH isolation, furthermore, caused an interference with the
phenol/sulphuric acid determination of carbohydrates, showing much higher concentrations
than were determined for the total biofilm. Formaldehyde was identified as the main
interference-causing agent in this study, resulting in yellow discoloration in deionized water
in the phenol/sulphuric acid assay, despite absence of carbohydrates. Comte et al. (2006a)
also suspected formaldehyde to contaminate their EPS samples isolated from activated
sludge and to chemically react with the polymers, modifying their properties and producing
an altered infrared spectrum when EPS isolation involved formaldehyde treatment
compared to EPS isolated by alternative methods.
Also the protein determination of EPS isolated with formaldehyde/NaOH was most likely
underestimated, which was attributed to both, formaldehyde as well as NaOH. The
interference in both assays could, for the most part, be reduced by dialysis. Hence,
elimination of formaldehyde and NaOH from the EPS solution by dialysis is essential for this
type of EPS isolation. Analysis of EPS proteins isolated by formaldehyde/NaOH by means of
2DE showed a smear of proteins in the acidic part of the gel. The high pH value most likely
denatured, or to some extent hydrolysed proteins. The denaturing effect of NaOH on
proteins has also been suspected by Karapanagiotis et al. (1989), who applied gel-
Discussion
155
permeation chromatography for the analysis of EPS isolated from digested sewage sludge by
NaOH treatment. The molecular size distribution of EPS isolated by NaOH in their study
showed a much higher heterogeneity compared to EPS isolated by other methods
(Karapanagiotis et al., 1989). Consequently, treatment of biofilm suspensions with
formaldehyde/NaOH can alter the pI and the molecular weights of proteins and peptides
and most likely caused the smear of proteins observed on 2DE gels in the present study.
Application of formaldehyde and NaOH separately as well as in combination is, therefore,
considered inadequate for EPS isolation from drinking-water biofilms, as well as for the
applied quantitative and qualitative analyses.
- EDTA -
EDTA has been applied for EPS isolation from a variety of biofilms (Tab. 1.2). EDTA chelates
multivalent cations which cross-link EPS polymers, resulting in the destabilization of the EPS
matrix and enhanced solubilization of EPS components. Unlike CER, which is separated from
the biofilm suspension by sedimentation in the course of EPS clean-up, EDTA remains in the
EPS solution and requires additional measures for removal.
The use of EDTA showed negative effects on culturability of drinking-water biofilm cells as
well as subsequent analyses. The culturability of biofilm cells decreased in the present study
by two orders of magnitude, which may indicate stress imposed on cells. Chelation of cations
by EDTA has been shown to cause disordering of the cell membrane of some
microorganisms, dissociating proteins and phospholipids, and releasing LPS from the outer
membrane of Gram-negative bacteria (Matsushita et al., 1978; Knirel et al., 1990).
Therefore, cell lysis during EPS isolation from drinking-water biofilms by EDTA was likely
promoted. Interference of EDTA with the Lowry assay has been documented by several
authors, including Neurath (1966) or Peterson (1979). They described an increase in colour
intensity due to reduction of the phosphomolybdate in the Folin-Ciocalteu’s phenol reagent
caused by EDTA. In the present study, as soon as the Folin-Ciocalteu’s phenol reagent was
added, a precipitate formed, which caused a strong increase in absorbance. Dialysis of EPS
solutions was applied to remove EDTA and other low molecular weight substances from the
samples. Results of the present study indicated that dialysis was insufficient to entirely
Discussion
156
eliminate EDTA from the samples, as protein determination in the EPS solutions showed
significantly higher concentrations compared to those determined for the biofilm
suspensions. EDTA can form complexes with EPS polymers (Liu and Fang, 2002; D’Abzac et
al., 2010). Therefore, it is likely that EDTA remained in the sample, and continued to cause
interference even after sample clean-up by dialysis. Dialysis of EPS solutions containing EDTA
had a further detrimental effect. A 2 fold increase in sample volume and, therefore, a
likewise dilution of the EPS solution was observed during dialysis. Such dilution of samples
can cause inaccuracy in measurements, especially in case of protein concentrations close to
the limit of detection. Neurath (1966) showed that addition of CaCl2 in equimolar
concentrations to EDTA to the sample, for the most part, eliminates the interference caused
by EDTA. Addition of CaCl2 results in formation of CaEDTA complexes, and thus reduces the
detrimental effect of EDTA. This effect was confirmed in the present study, using BSA
solutions as reference (results not shown). However, additional manipulation and dilution of
the sample by addition of CaCl2 solution decreases the accuracy of subsequent
measurements. Analysis of EPS-proteins isolated by EDTA by 2DE proved to be impossible
without additional clean-up steps. EDTA itself in concentrations as applied in this study (1 %
w/v) or EDTA-EPS complexes could have clogged the pores of the IEF gel. Alternatively, DNA,
which is known to interfere with IEF by increasing the viscosity of the sample and by clogging
the pores of the IEF gel, could have been insufficiently digested during EPS clean-up, due to
the presence of EDTA. EDTA is commonly used for the inactivation of nucleases by chelating
Mg2+ ions necessary for the functionality of these enzymes. Therefore, it is possible that the
DNA present in the EDTA-isolated EPS was not or only partially digested and caused the
interferences during IEF.
- Heat -
Heat treatment of biofilm samples at 70 °C to isolate EPS yielded the highest concentrations
of isolated polymers without any apparent disturbances on the protein, carbohydrate and
DNA assays or 2DE. However, culturability of biofilm cells decreased below the limit of
detection. Therefore, it is assumed that cell lysis occurred, which contaminated the EPS with
intracellular material, leading to increased polymer concentrations within the EPS. Cell lysis
by heat treatment was also suspected in studies by D’Abzac et al. (2010), who applied heat
Discussion
157
treatment at 80 °C for EPS isolation from activated sludge. Furthermore, denaturation of EPS
components at a temperature of 70 °C is likely to occur (Karapanagiotis et al., 1989; Comte
et al., 2006a; D’Abzac et al., 2010). Hence, biochemical characterization of polymers, in
particular enzymes, can be inhibited.
- Cell lysis -
Cell lysis induced by the EPS isolation procedure has to be kept at a minimum, as increased
lysis rates result in higher amounts of intracellular polymers than would be present in the
native biofilm, and therefore, would lead to misinterpretations of EPS analysis. Cell lysis
induced by the EPS isolation methods has often been disregarded in literature (Tab. 1.2),
probably due to the difficulty of its detection. Nevertheless, cell lysis caused by EPS isolation
treatment needs to be minimized, if not completely excluded, to be able to reliably evaluate
efficiency of EPS isolation methods. Common indicators for cell lysis applied in studies
included increased DNA or protein content (Brown and Lester, 1980), KDO (Platt et al.,
1985), activity of the strictly intracellular enzyme G6PDH (Platt et al., 1985),
protein/polysaccharide ratio (Karapanagiotis et al., 1989), culturability (Jahn and Nielsen,
1995) or membrane integrity (Wu and Xi, 2009). However, each of these methods has
weaknesses. Increased DNA or protein contents, or protein/polysaccharide ratios caused by
the EPS isolation method are unsatisfactory markers for cell lysis, as these polymers
constitute the EPS matrix and have been shown to be released in varying amounts, based on
the different selectivity of EPS isolation methods towards EPS polymers (Park and Novak,
2007). KDO is a constituent of lipopolysaccharides bound to the outer membrane of Gram-
negative bacteria (Karkhanis et al., 1978). Increased presence of KDO after EPS isolation
indicates shedding of the outer membrane due to the isolation procedure (Matsushita et al.,
1978), however, cells do not necessarily have to be lysed and could recover from the
isolation treatment. Furthermore, KDO needs to be present in sufficient concentrations to be
able to detect outer membrane damage. This was not the case in the current study for
drinking-water biofilm cells. G6PDH are strictly intracellular enzymes involved in glucose
metabolism (Ng and Dawes, 1973), therefore, increased activity of G6PDH in the EPS after
isolation treatment would indicate cell lysis. Presence of G6PDH within drinking-water
biofilm cells was confirmed in this study. However, G6PDH activity in the EPS isolated by
Discussion
158
shaking or CER treatment was not detected, indicating no cell lysis induced by both methods.
Determination of G6PDH activity in EPS isolated by formaldehyde/NaOH, EDTA or heat was
not attempted. The reason was, the high pH value during NaOH or EDTA isolation, as well as
prolonged exposure to high temperatures, as was the case during heat isolation, can
denature enzymes, and thus, inactivate them. EDTA can, furthermore, complex cations, such
as Mg2+, necessary for the functionality of the enzymes, decreasing their activity. Hence,
activity of G6PDH cannot be applied as reliable indicator of cell lysis for these isolation
methods. Culturability of cells after EPS isolation treatment can be applied as measure to
assess viability of cells after EPS isolation procedures (Jahn and Nielsen, 1995; Sesay et al.,
2006). Decrease of culturability does not necessarily indicate cell lysis, as cells could for
example enter the VBNC state due to the treatment. However, decreased culturability
suggests stress on biofilm cells imposed by the EPS isolation method, which in the worst case
may result in lysis. The Live/Dead BacLight bacterial viability kit allows for discrimination
between cells with intact cell membranes and cells with compromised membranes, based on
the penetration of the membrane impermeable propidium iodide into the cell and its
displacement of the counterstain Syto 9 (Ben-Amor et al., 2005). However, difficulties in
application, in particular for multi-species biofilms, have been described (Lawrence et al.,
1996; Barbesti et al., 2000; Hannig et al., 2010). Concentrations of the dyes need to be
adjusted to the sample, as propidium iodide applied in too high concentrations may enter
cells regardless of an intact membrane (Barbesti et al., 2000; Stocks, 2004; Berney et al.,
2007). The appropriate concentrations may vary greatly between species, hence, application
for multi-species samples can be problematic. Furthermore, lysed cells, which have released
their entire cytoplasmic components, would remain undetected. The use of propidium
monoazide has been shown to provide more reliable results for the distinction between live
and dead cells compared to propidium iodide (Nocker et al., 2007). This stain, however, has
not yet been applied for determination of cell damage caused by EPS isolation methods. The
variety of methods for the analysis of cell damage and their limitations reflect the difficulty
to reliably detect cell lysis induced by EPS isolation methods. Thus, application of several
methods for determination of cell integrity after EPS isolation is suggested.
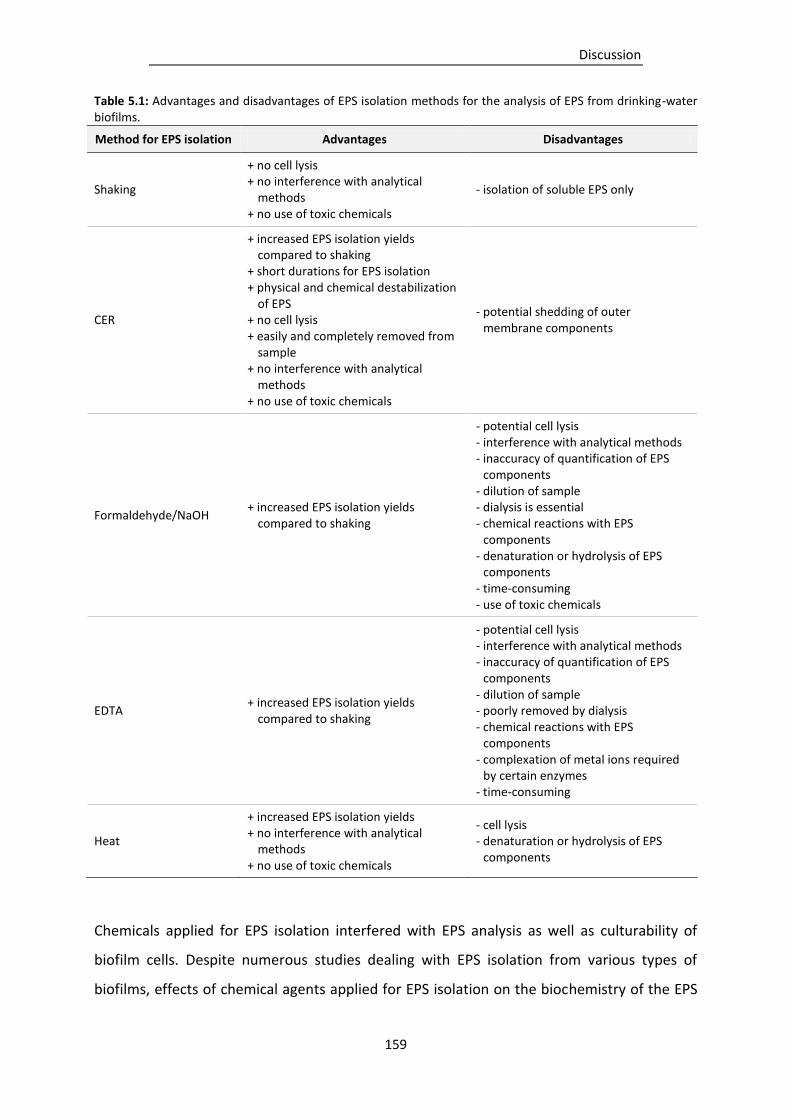
Discussion
159
Table 5.1: Advantages and disadvantages of EPS isolation methods for the analysis of EPS from drinking-water biofilms.
Method for EPS isolation Advantages Disadvantages
Shaking
+ no cell lysis + no interference with analytical
methods + no use of toxic chemicals
- isolation of soluble EPS only
CER
+ increased EPS isolation yields compared to shaking
+ short durations for EPS isolation + physical and chemical destabilization
of EPS + no cell lysis + easily and completely removed from
sample + no interference with analytical
methods + no use of toxic chemicals
- potential shedding of outer membrane components
Formaldehyde/NaOH + increased EPS isolation yields
compared to shaking
- potential cell lysis - interference with analytical methods - inaccuracy of quantification of EPS
components - dilution of sample - dialysis is essential - chemical reactions with EPS
components - denaturation or hydrolysis of EPS
components - time-consuming - use of toxic chemicals
EDTA + increased EPS isolation yields
compared to shaking
- potential cell lysis - interference with analytical methods - inaccuracy of quantification of EPS
components - dilution of sample - poorly removed by dialysis - chemical reactions with EPS
components - complexation of metal ions required
by certain enzymes - time-consuming
Heat
+ increased EPS isolation yields + no interference with analytical
methods + no use of toxic chemicals
- cell lysis - denaturation or hydrolysis of EPS
components
Chemicals applied for EPS isolation interfered with EPS analysis as well as culturability of
biofilm cells. Despite numerous studies dealing with EPS isolation from various types of
biofilms, effects of chemical agents applied for EPS isolation on the biochemistry of the EPS
Discussion
160
constituents, as well as interferences with subsequent analytical methods have been
considered by only few authors, in particular Comte et al., (2006a,b) and D’Abzac et al.
(2010). Results of the current study showed that EPS isolation should always be selected and
adjusted according to the sample type as well as the objective of a study, considering its
effects on the biochemistry of polymers and applied biochemical analyses. The optimized
CER isolation proved to be the most suitable procedure for the isolation of EPS from
drinking-water biofilms, yielding increased amounts of EPS components without detrimental
impact on biofilm cells or subsequent analyses. This method was, therefore, applied for
further analysis of EPS from drinking-water biofilms.
5.2 Drinking-water biofilm formation on the elastomer EPDM
Established drinking-water biofilms have been extensively studied in real drinking water
distribution systems, and in a low number of studies also in domestic plumbing systems, in
terms of total cell count, culturability, or population diversity. However, the composition of
the EPS matrix of drinking-water biofilms and the dynamics of EPS components throughout
the different stages of biofilm formation has not been addressed so far. In this study the
established methods for biofilm cultivation, EPS isolation, and analysis were applied to
investigate the progress of drinking-water biofilm formation on EPDM over a period of 28 d
in two independent plumbing systems. Twice per week biofilms were sampled and analyzed
by microbiological, biochemical and molecular biological methods.
5.2.1 Colonization of EPDM by drinking water microorganisms
The EPDM rubber used in the present study was found to be an adequate material for
microbial colonization and development of drinking-water biofilms. The exposure of EPDM
coupons in biofilm reactors to a continuous flow-through of drinking water resulted in
macroscopically visible biofilms. The main colonization on the elastomeric material occurred
within the first week of cultivation. Within 11 to 14 d of cultivation biofilm growth reached a
quasi-stationary state in which the total cell number remained relatively constant between
1 x 10⁸ and 3.3 x 10⁸ cells cm-2 at plumbing system A, or between 4.1 x 10⁸ cells cm-2 and
Discussion
161
5.1 x 10⁸ cells cm-2 at plumbing system C. This state may be attributed to the shear imposed
by the drinking-water flow, or grazing protozoa controlling cell densities in the biofilms
(Pedersen, 1990; Kalmbach et al., 1997). Culturability of drinking-water biofilm cells was
relatively high and ranged between 7.4 % to 43.6 % of the total cell count. Cell density and
proportion of culturable microorganisms revealed similar orders of magnitude to those
determined by Kilb et al. (2003) in biofilms grown on EPDM-coated valves in real drinking
water distribution systems, but slightly lower values compared to results by Bressler et al.
(2009), who used a similar experimental system and type of EPDM for the cultivation of
drinking-water biofilms as applied in the current study. In contrast to an EPDM, which meets
microbiological recommendations according to DVGW Code of Practice W270, and which
was applied by Moritz et al. (2010) in a similar experimental system, one order of magnitude
higher total cell counts were obtained in the present study in 14 d-old drinking-water
biofilms. Compared to findings by Wingender and Flemming (2004), who investigated the
colonization of steel, copper, polyethylene an polyvinyl chloride coupons exposed to
drinking water over a period of 12 to 18 months, total cell counts in the current study were 1
to 2 orders of magnitude higher, while culturability was 2 to 3 orders of magnitude higher.
The differences were even more evident when comparing the results obtained in this study
to those determined for 2 to 99 year old pipe sections from various German drinking-water
networks with established biofilms. These pipe sections revealed total cell numbers between
4 x 10⁵ and 2 x 10⁸ cells cm-2 and an HPC in the range of 101 to 2 x 10⁵ cfu cm-2 (Wingender
and Flemming, 2004).
Comparative studies of different types of plumbing materials showed, that elastomeric
materials such as EPDM always resulted in the most extensive development of biofilms with
relatively high proportions of culturable cells (Rogers et al., 1994; Moritz et al., 2010; Waines
et al., 2011). The high accumulation of cells found in this study and in afore mentioned
comparative studies is an indication for a high availability of nutrients within the biofilms,
which can be attributed to leaching of biodegradable substances from the EPDM rubber
material. Rogers et al. (1994) demonstrated that elastomeric materials such as latex or
ethylene-propylene tend to release considerable amounts of organic carbon into the water
phase when exposed to water, which can support excessive biofilm growth. Typical
formulations of EPDM rubbers include filler, pigments, plasticizer, curing agents and
Discussion
162
additives. If these substances are biodegradable (e.g. plasticizers such as phthalates) biofilm
growth may be promoted (Rogers et al., 1994). Another indication for a rather elevated
organic load is the high ratio of HPC to total cell counts. A low proportion of HPC in relation
to total cell count is typical for drinking water distribution systems and was shown to range
between 0.0004 % to 3.5 % on 2 to 99 year old pipes (Wingender and Flemming, 2004). The
current study showed significantly higher proportions between 7.4 % and 43.6 %, which was
similar to findings by Kilb et al. (2003) for biofilms on EPDM rubber-coated valves, as well as
Bressler et al. (2009) for biofilms on the same EPDM material as applied in the current study,
and Moritz et al. (2010) for biofilm on EPDM meeting microbiological requirements for use
in the drinking water sector.
5.2.2 Dynamics of population diversity of drinking-water biofilms
Population diversity of drinking-water biofilms grown on EPDM was analyzed by DGGE of
PCR-amplified 16S rDNA fragments and monitored throughout cultivation periods of up to
28 d. DGGE analysis revealed a high diversity of microorganisms present in drinking-water
biofilms, showing a maximum of 66 bands for biofilms cultivated at plumbing system A, and
45 bands for biofilms cultivated at plumbing system C, each band ideally representing one
bacterial species. Similar diversity was obtained by Bressler et al. (2009), detecting 68 bands
in drinking-water biofilms cultivated for 14 d on a similar formulation of EPDM and
experimental setup. Initial colonization of the EPDM coupons was shown to be attributed to
a small number of organisms, the bands of which were detected in the biofilms in varying
intensities throughout the experimental run. The most significant increase in microbial
diversity occurred within the first 7 d and from then on remained relatively uniform
throughout the experimental run, which was reflected by a high similarity of 70 % to 93 %.
The dynamics of population diversity in drinking-water biofilms has been investigated only in
a small number of studies in literature. Similar results to those described in the current study
have been presented by Deines et al. (2010) for drinking-water biofilms cultivated for up to
11 d on polyethylene in a pilot-scale drinking water distribution system. Deines et al. (2010)
detected one species colonizing the surface of their model distribution system immediately
after its exposure to drinking water, which persisted in the biofilms throughout the
Discussion
163
experimental period. In their study the most significant increase in population diversity
occurred within the first 3 days. From then on population diversity remained relatively
constant showing similarities of DGGE band patterns of > 70 %, indicating low variation of
microbial composition of drinking-water biofilms with time. However, the similarity
coefficients calculated in the study by Deines et al. (2010), as well as in the present study
only consider presence or absence of bands, while variations of band intensity are not
regarded. Slight variations of band intensities of a number of bands were detected in both
studies in the progress of biofilm growth, demonstrating minor, but noticeable changes of
composition of drinking-water biofilm populations. Lee et al. (2005) on the other hand found
relatively low similarity of DGGE band patterns, of drinking-water biofilms cultivated on
galvanized iron wafer in a model drinking-water distribution system connected to a
laboratory tap. However, their DGGE profiles indicated relatively low population diversity,
showing a maximum of 11 bands. This may be attributed to the lower amount of PCR
product (approximately 200 ng) applied on the gels compared to the amount applied in the
present study (500 ng), or to the staining by ethidium bromide, which is generally less
sensitive compared to SybrGold applied here. Considerable changes in the composition of
bacterial biofilm populations have been shown in studies performed by Kalmbach et al.
(1997) on drinking-water biofilms cultivated on glass or polyethylene slides in a Robbins
device connected to domestic water distribution systems, using α-, ß- or γ-Proteobacteria
specific FISH probes. Their analysis of the distribution of the different classes of
Proteobacteria displayed fluctuations of abundance as well as dominance of certain groups
with increasing drinking-water biofilm age. Results of the current study indicate that during
the initial stages of biofilm formation of 5 d to 7 d a population composition is establishing.
Established drinking-water biofilms exhibit a stable composition of microbial communities
with only minor changes during biofilm maintenance. Hence, considering real drinking water
systems, the period directly after installation of materials into a drinking water system and
startup of operation is the most dynamic and amenable in respect to population diversity
during the formation of drinking-water biofilms.
Discussion
164
5.2.3 Biochemical composition of drinking-water biofilms
The biochemical composition of drinking-water biofilms and their EPS and the progress of
polymer formation throughout cultivation periods of up to 28 d at plumbing system A and
plumbing system C were quantitatively and qualitatively analyzed. Despite the
misconception in early biofilm studies that polysaccharides make up the entire extracellular
matrix, more recent studies, mostly dealing with activated sludge, have identified proteins as
major components of the EPS (Jahn and Nielsen, 1995; Frølund et al., 1996). The present
study shows that proteins are the dominant polymers within the total biofilm as well as the
EPS matrix, which was irrespective of biofilm age, followed by polysaccharides. eDNA, which
is considered to have structural functions within the biofilm matrix (Whitchurch et al., 2002;
Böckelmann et al., 2006), was also present in considerable amounts in the EPS of drinking-
water biofilms. The overall protein content calculated per surface area increased
continuously throughout the cultivation period in biofilms cultivated at plumbing system A
as well as plumbing system C. However, protein amounts considered per cell showed an
altered development. During the initial stages of biofilm formation protein contents
decreased until day 14 to 21 of cultivation. Once biofilms reached 14 d to 21 d of age protein
contents per cell increased again until the end of the experimental run. Carbohydrates
demonstrated different developments, depending on the drinking water source.
Carbohydrates of drinking-water biofilms cultivated at plumbing system A revealed a similar
progress throughout the cultivation period as was described for proteins. On the other hand,
carbohydrate concentrations of drinking-water biofilms cultivated at plumbing system C
remained constant once the biofilms reached 14 d of age. Furthermore, carbohydrate
concentrations from plumbing system C biofilms calculated per cell showed no further
increase, unlike protein concentrations per cell in biofilms > 14 d of age. DNA concentrations
also showed constant concentrations once biofilms reached 11 d (plumbing system C) or
21 d (plumbing system A) of age. This may either indicate a production stop of
carbohydrates and eDNA, once a mature biofilm was established, or an equilibrium between
production of carbohydrates and eDNA, and their degradation by hydrolytic enzymes,
expressed in higher quantities with increasing biofilm age. Furthermore, Whitchurch et al.
(2002) demonstrated, that eDNA is of major importance during the initial stages of
P. aeruginosa biofilm formation. The high eDNA concentrations per cell in the EPS during the
Discussion
165
initial stages of biofilm formation in the present study may also imply such a profound role
of eDNA for young biofilms. However, the role of eDNA requires further investigations.
Analysis of extracellular proteins in this study was performed by use of 2DE in order to
qualitatively analyze changes in the extracellular protein diversity throughout the cultivation
of drinking-water biofilms. Similarly to the increase in overall EPS protein concentration
throughout the cultivation run, also the diversity of EPS proteins increased for the initial 11 d
to 14 d. Further cultivation of biofilms, however, resulted in a significant decrease of the
diversity of proteins. The amount of proteins with high molecular weights, as well as those
with high pI disappeared with increasing biofilm age. This may indicate degradation and
turnover of proteins by proteases in situ or in the course of EPS isolation and clean-up. To
exclude degradation of proteins in the course of EPS isolation, a protease inhibitor cocktail
was added to drinking-water biofilms cultivated at plumbing system C immediately after
harvesting of biofilms from the coupons. This cocktail was chosen as it inhibits the action of a
variety of proteolytic enzymes, including serine, cysteine, aspartic and metalloproteases, as
well as aminopeptidases. However, this phenomenon was still observed after addition of the
protease inhibitor cocktail, indicating increased production of proteases once biofilms
reached an age of 14 d, degrading proteins within the established biofilm.
Increased production of proteases in drinking-water biofilms > 11 d of age was confirmed by
gel electrophoresis of total biofilm as well as EPS samples on zymogram gels. The gels
contained gelatin as substrate, which was not degraded during the initial stages of biofilm
formation. However, once biofilms reached 11 d of age, activity bands in the zymogram gels
appeared, indicating gelatin degradation by proteases. The diversity of activity bands on the
zymogram gels increased with increasing biofilm age, showing a maximum of 13 distinct
bands for the total biofilm sample and 9 bands in the EPS after 28 d of cultivation.
To demonstrate and quantify expression of cell-associated as well as extracellular enzymes
during the formation of drinking-water biofilms, activities of seven further groups of
enzymes were analyzed. A microtitre plate assay was designed in the present study to be
able to analyze all seven enzymes groups at once (Fig. 3.4). The enzyme groups included
peptidases, α-D-glucosidases, ß-D-glucosidases, N-acetyl-ß-D-glucosaminidases, lipases,
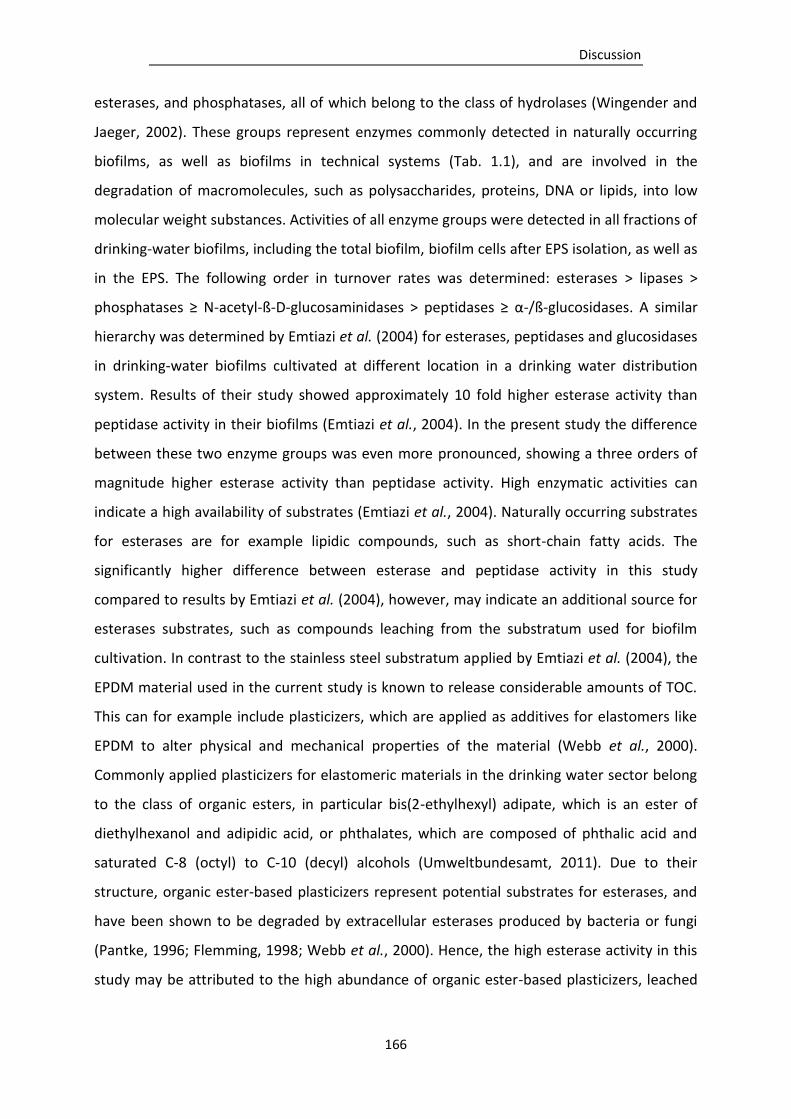
Discussion
166
esterases, and phosphatases, all of which belong to the class of hydrolases (Wingender and
Jaeger, 2002). These groups represent enzymes commonly detected in naturally occurring
biofilms, as well as biofilms in technical systems (Tab. 1.1), and are involved in the
degradation of macromolecules, such as polysaccharides, proteins, DNA or lipids, into low
molecular weight substances. Activities of all enzyme groups were detected in all fractions of
drinking-water biofilms, including the total biofilm, biofilm cells after EPS isolation, as well as
in the EPS. The following order in turnover rates was determined: esterases > lipases >
phosphatases ≥ N-acetyl-ß-D-glucosaminidases > peptidases ≥ α-/ß-glucosidases. A similar
hierarchy was determined by Emtiazi et al. (2004) for esterases, peptidases and glucosidases
in drinking-water biofilms cultivated at different location in a drinking water distribution
system. Results of their study showed approximately 10 fold higher esterase activity than
peptidase activity in their biofilms (Emtiazi et al., 2004). In the present study the difference
between these two enzyme groups was even more pronounced, showing a three orders of
magnitude higher esterase activity than peptidase activity. High enzymatic activities can
indicate a high availability of substrates (Emtiazi et al., 2004). Naturally occurring substrates
for esterases are for example lipidic compounds, such as short-chain fatty acids. The
significantly higher difference between esterase and peptidase activity in this study
compared to results by Emtiazi et al. (2004), however, may indicate an additional source for
esterases substrates, such as compounds leaching from the substratum used for biofilm
cultivation. In contrast to the stainless steel substratum applied by Emtiazi et al. (2004), the
EPDM material used in the current study is known to release considerable amounts of TOC.
This can for example include plasticizers, which are applied as additives for elastomers like
EPDM to alter physical and mechanical properties of the material (Webb et al., 2000).
Commonly applied plasticizers for elastomeric materials in the drinking water sector belong
to the class of organic esters, in particular bis(2-ethylhexyl) adipate, which is an ester of
diethylhexanol and adipidic acid, or phthalates, which are composed of phthalic acid and
saturated C-8 (octyl) to C-10 (decyl) alcohols (Umweltbundesamt, 2011). Due to their
structure, organic ester-based plasticizers represent potential substrates for esterases, and
have been shown to be degraded by extracellular esterases produced by bacteria or fungi
(Pantke, 1996; Flemming, 1998; Webb et al., 2000). Hence, the high esterase activity in this
study may be attributed to the high abundance of organic ester-based plasticizers, leached
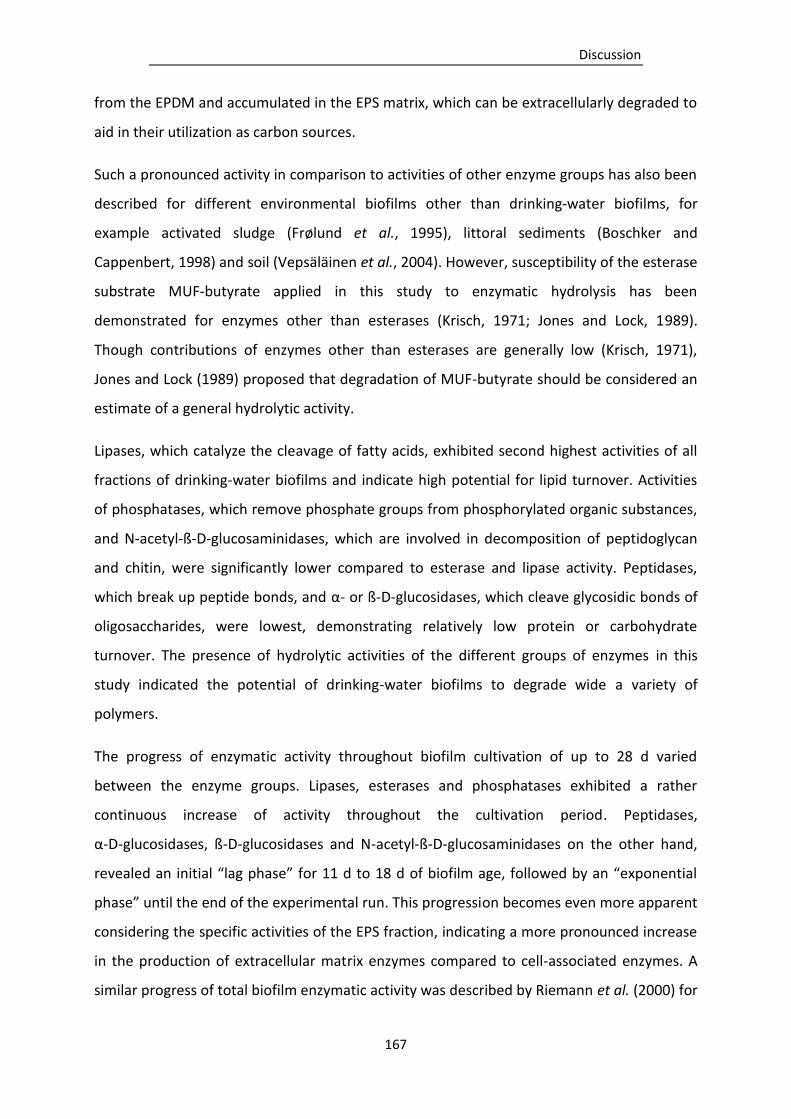
Discussion
167
from the EPDM and accumulated in the EPS matrix, which can be extracellularly degraded to
aid in their utilization as carbon sources.
Such a pronounced activity in comparison to activities of other enzyme groups has also been
described for different environmental biofilms other than drinking-water biofilms, for
example activated sludge (Frølund et al., 1995), littoral sediments (Boschker and
Cappenbert, 1998) and soil (Vepsäläinen et al., 2004). However, susceptibility of the esterase
substrate MUF-butyrate applied in this study to enzymatic hydrolysis has been
demonstrated for enzymes other than esterases (Krisch, 1971; Jones and Lock, 1989).
Though contributions of enzymes other than esterases are generally low (Krisch, 1971),
Jones and Lock (1989) proposed that degradation of MUF-butyrate should be considered an
estimate of a general hydrolytic activity.
Lipases, which catalyze the cleavage of fatty acids, exhibited second highest activities of all
fractions of drinking-water biofilms and indicate high potential for lipid turnover. Activities
of phosphatases, which remove phosphate groups from phosphorylated organic substances,
and N-acetyl-ß-D-glucosaminidases, which are involved in decomposition of peptidoglycan
and chitin, were significantly lower compared to esterase and lipase activity. Peptidases,
which break up peptide bonds, and α- or ß-D-glucosidases, which cleave glycosidic bonds of
oligosaccharides, were lowest, demonstrating relatively low protein or carbohydrate
turnover. The presence of hydrolytic activities of the different groups of enzymes in this
study indicated the potential of drinking-water biofilms to degrade wide a variety of
polymers.
The progress of enzymatic activity throughout biofilm cultivation of up to 28 d varied
between the enzyme groups. Lipases, esterases and phosphatases exhibited a rather
continuous increase of activity throughout the cultivation period. Peptidases,
α-D-glucosidases, ß-D-glucosidases and N-acetyl-ß-D-glucosaminidases on the other hand,
revealed an initial “lag phase” for 11 d to 18 d of biofilm age, followed by an “exponential
phase” until the end of the experimental run. This progression becomes even more apparent
considering the specific activities of the EPS fraction, indicating a more pronounced increase
in the production of extracellular matrix enzymes compared to cell-associated enzymes. A
similar progress of total biofilm enzymatic activity was described by Riemann et al. (2000) for
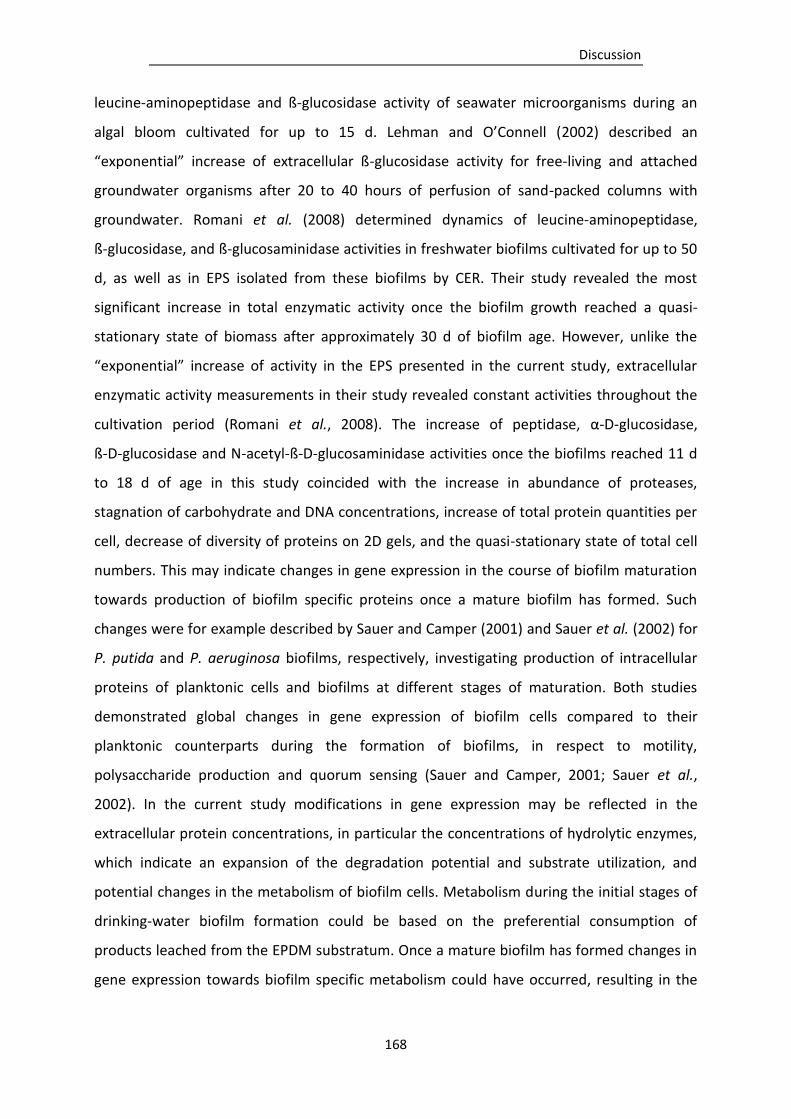
Discussion
168
leucine-aminopeptidase and ß-glucosidase activity of seawater microorganisms during an
algal bloom cultivated for up to 15 d. Lehman and O’Connell (2002) described an
“exponential” increase of extracellular ß-glucosidase activity for free-living and attached
groundwater organisms after 20 to 40 hours of perfusion of sand-packed columns with
groundwater. Romani et al. (2008) determined dynamics of leucine-aminopeptidase,
ß-glucosidase, and ß-glucosaminidase activities in freshwater biofilms cultivated for up to 50
d, as well as in EPS isolated from these biofilms by CER. Their study revealed the most
significant increase in total enzymatic activity once the biofilm growth reached a quasi-
stationary state of biomass after approximately 30 d of biofilm age. However, unlike the
“exponential” increase of activity in the EPS presented in the current study, extracellular
enzymatic activity measurements in their study revealed constant activities throughout the
cultivation period (Romani et al., 2008). The increase of peptidase, α-D-glucosidase,
ß-D-glucosidase and N-acetyl-ß-D-glucosaminidase activities once the biofilms reached 11 d
to 18 d of age in this study coincided with the increase in abundance of proteases,
stagnation of carbohydrate and DNA concentrations, increase of total protein quantities per
cell, decrease of diversity of proteins on 2D gels, and the quasi-stationary state of total cell
numbers. This may indicate changes in gene expression in the course of biofilm maturation
towards production of biofilm specific proteins once a mature biofilm has formed. Such
changes were for example described by Sauer and Camper (2001) and Sauer et al. (2002) for
P. putida and P. aeruginosa biofilms, respectively, investigating production of intracellular
proteins of planktonic cells and biofilms at different stages of maturation. Both studies
demonstrated global changes in gene expression of biofilm cells compared to their
planktonic counterparts during the formation of biofilms, in respect to motility,
polysaccharide production and quorum sensing (Sauer and Camper, 2001; Sauer et al.,
2002). In the current study modifications in gene expression may be reflected in the
extracellular protein concentrations, in particular the concentrations of hydrolytic enzymes,
which indicate an expansion of the degradation potential and substrate utilization, and
potential changes in the metabolism of biofilm cells. Metabolism during the initial stages of
drinking-water biofilm formation could be based on the preferential consumption of
products leached from the EPDM substratum. Once a mature biofilm has formed changes in
gene expression towards biofilm specific metabolism could have occurred, resulting in the
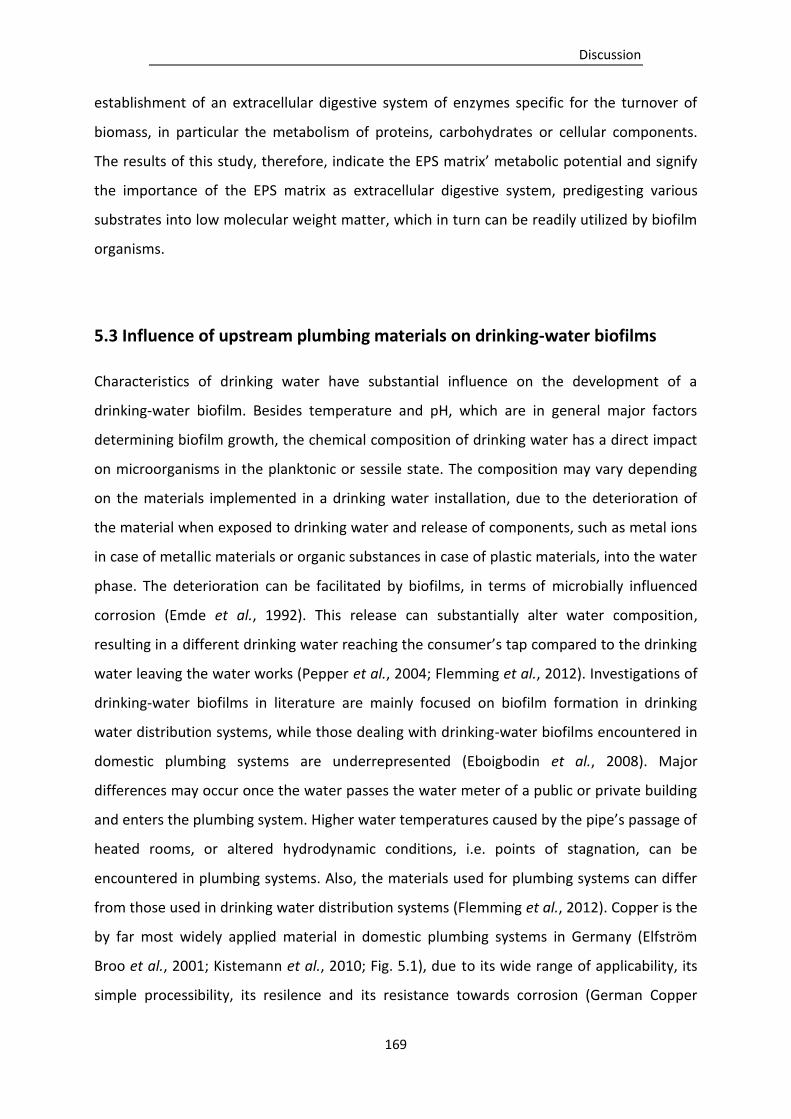
Discussion
169
establishment of an extracellular digestive system of enzymes specific for the turnover of
biomass, in particular the metabolism of proteins, carbohydrates or cellular components.
The results of this study, therefore, indicate the EPS matrix’ metabolic potential and signify
the importance of the EPS matrix as extracellular digestive system, predigesting various
substrates into low molecular weight matter, which in turn can be readily utilized by biofilm
organisms.
5.3 Influence of upstream plumbing materials on drinking-water biofilms
Characteristics of drinking water have substantial influence on the development of a
drinking-water biofilm. Besides temperature and pH, which are in general major factors
determining biofilm growth, the chemical composition of drinking water has a direct impact
on microorganisms in the planktonic or sessile state. The composition may vary depending
on the materials implemented in a drinking water installation, due to the deterioration of
the material when exposed to drinking water and release of components, such as metal ions
in case of metallic materials or organic substances in case of plastic materials, into the water
phase. The deterioration can be facilitated by biofilms, in terms of microbially influenced
corrosion (Emde et al., 1992). This release can substantially alter water composition,
resulting in a different drinking water reaching the consumer’s tap compared to the drinking
water leaving the water works (Pepper et al., 2004; Flemming et al., 2012). Investigations of
drinking-water biofilms in literature are mainly focused on biofilm formation in drinking
water distribution systems, while those dealing with drinking-water biofilms encountered in
domestic plumbing systems are underrepresented (Eboigbodin et al., 2008). Major
differences may occur once the water passes the water meter of a public or private building
and enters the plumbing system. Higher water temperatures caused by the pipe’s passage of
heated rooms, or altered hydrodynamic conditions, i.e. points of stagnation, can be
encountered in plumbing systems. Also, the materials used for plumbing systems can differ
from those used in drinking water distribution systems (Flemming et al., 2012). Copper is the
by far most widely applied material in domestic plumbing systems in Germany (Elfström
Broo et al., 2001; Kistemann et al., 2010; Fig. 5.1), due to its wide range of applicability, its
simple processibility, its resilence and its resistance towards corrosion (German Copper
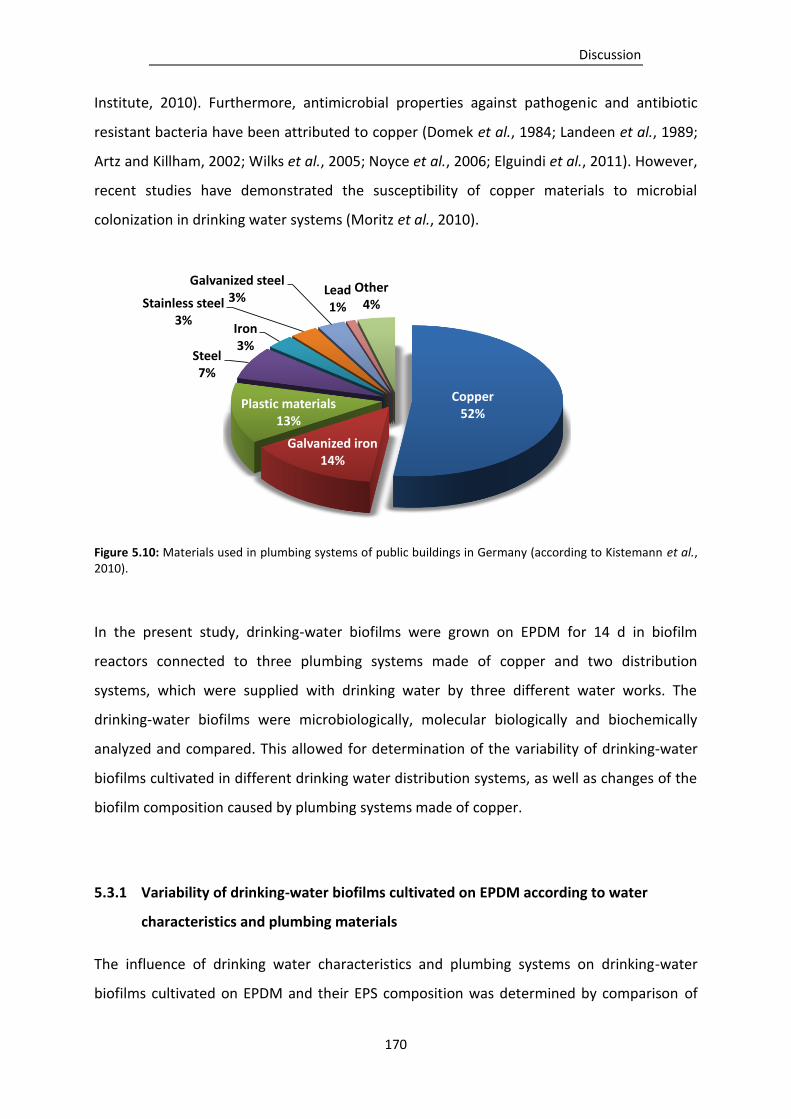
Discussion
170
Institute, 2010). Furthermore, antimicrobial properties against pathogenic and antibiotic
resistant bacteria have been attributed to copper (Domek et al., 1984; Landeen et al., 1989;
Artz and Killham, 2002; Wilks et al., 2005; Noyce et al., 2006; Elguindi et al., 2011). However,
recent studies have demonstrated the susceptibility of copper materials to microbial
colonization in drinking water systems (Moritz et al., 2010).
Figure 5.10: Materials used in plumbing systems of public buildings in Germany (according to Kistemann et al., 2010).
In the present study, drinking-water biofilms were grown on EPDM for 14 d in biofilm
reactors connected to three plumbing systems made of copper and two distribution
systems, which were supplied with drinking water by three different water works. The
drinking-water biofilms were microbiologically, molecular biologically and biochemically
analyzed and compared. This allowed for determination of the variability of drinking-water
biofilms cultivated in different drinking water distribution systems, as well as changes of the
biofilm composition caused by plumbing systems made of copper.
5.3.1 Variability of drinking-water biofilms cultivated on EPDM according to water
characteristics and plumbing materials
The influence of drinking water characteristics and plumbing systems on drinking-water
biofilms cultivated on EPDM and their EPS composition was determined by comparison of
Copper52%
Galvanized iron14%
Plastic materials13%
Steel7%
Iron3%
Stainless steel3%
Galvanized steel3%
Lead1%
Other4%
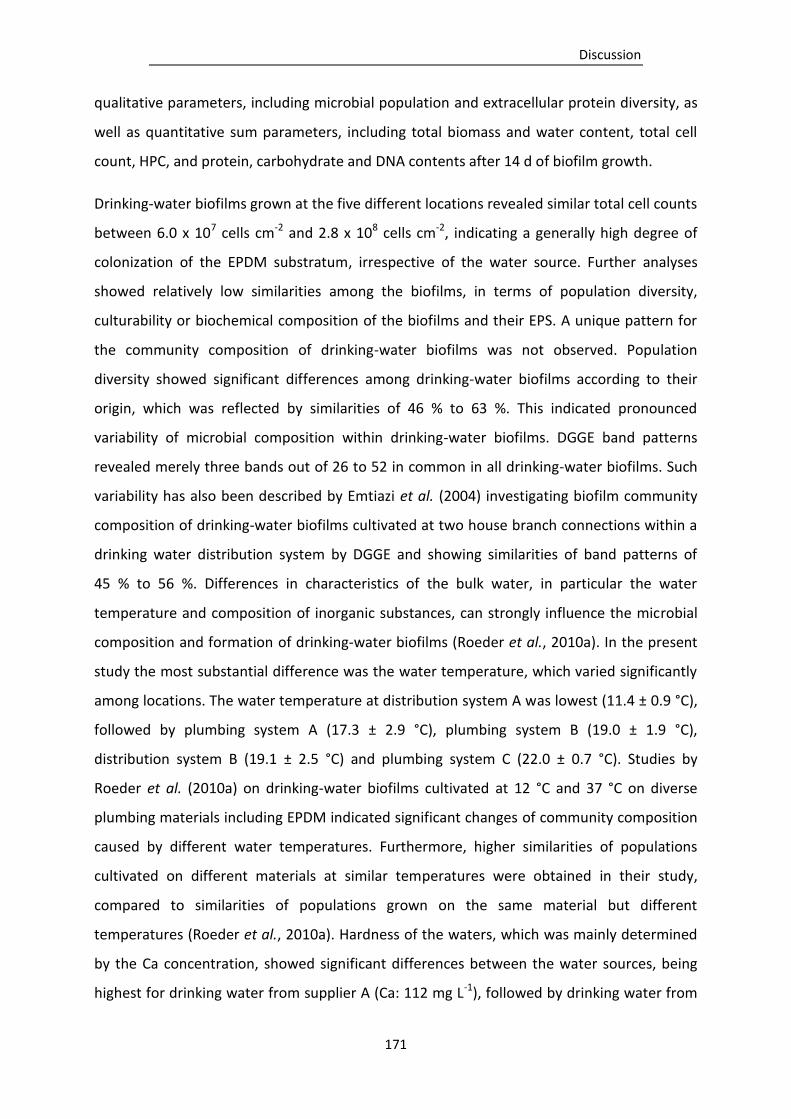
Discussion
171
qualitative parameters, including microbial population and extracellular protein diversity, as
well as quantitative sum parameters, including total biomass and water content, total cell
count, HPC, and protein, carbohydrate and DNA contents after 14 d of biofilm growth.
Drinking-water biofilms grown at the five different locations revealed similar total cell counts
between 6.0 x 10⁷ cells cm-2 and 2.8 x 10⁸ cells cm-2, indicating a generally high degree of
colonization of the EPDM substratum, irrespective of the water source. Further analyses
showed relatively low similarities among the biofilms, in terms of population diversity,
culturability or biochemical composition of the biofilms and their EPS. A unique pattern for
the community composition of drinking-water biofilms was not observed. Population
diversity showed significant differences among drinking-water biofilms according to their
origin, which was reflected by similarities of 46 % to 63 %. This indicated pronounced
variability of microbial composition within drinking-water biofilms. DGGE band patterns
revealed merely three bands out of 26 to 52 in common in all drinking-water biofilms. Such
variability has also been described by Emtiazi et al. (2004) investigating biofilm community
composition of drinking-water biofilms cultivated at two house branch connections within a
drinking water distribution system by DGGE and showing similarities of band patterns of
45 % to 56 %. Differences in characteristics of the bulk water, in particular the water
temperature and composition of inorganic substances, can strongly influence the microbial
composition and formation of drinking-water biofilms (Roeder et al., 2010a). In the present
study the most substantial difference was the water temperature, which varied significantly
among locations. The water temperature at distribution system A was lowest (11.4 ± 0.9 °C),
followed by plumbing system A (17.3 ± 2.9 °C), plumbing system B (19.0 ± 1.9 °C),
distribution system B (19.1 ± 2.5 °C) and plumbing system C (22.0 ± 0.7 °C). Studies by
Roeder et al. (2010a) on drinking-water biofilms cultivated at 12 °C and 37 °C on diverse
plumbing materials including EPDM indicated significant changes of community composition
caused by different water temperatures. Furthermore, higher similarities of populations
cultivated on different materials at similar temperatures were obtained in their study,
compared to similarities of populations grown on the same material but different
temperatures (Roeder et al., 2010a). Hardness of the waters, which was mainly determined
by the Ca concentration, showed significant differences between the water sources, being
highest for drinking water from supplier A (Ca: 112 mg L-1), followed by drinking water from
Discussion
172
supplier B (Ca: 50 mg L-1), and drinking water from supplier C (Ca: 38 mg L-1). The differences
in water temperature and water hardness very likely favored different biofilm flora in the
present study. A correlation between water temperature or hardness of the drinking waters
and the biochemical composition of drinking-water biofilms and their EPS was not evident.
Proteins, carbohydrates and DNA were detected in all drinking-water biofilms and in isolated
EPS. Proteins represented the major component of all drinking-water biofilms and their EPS,
followed by carbohydrates and DNA. This finding is in accordance to results by Kilb et al.
(2003), who quantified proteins and carbohydrates in 5 weeks to 4 years old drinking-water
biofilms grown on EPDM coated valves and their EPS isolated by stirring and centrifugation
in 10 different drinking water distribution systems. Protein and carbohydrate concentrations
in the total biofilm as well as in the EPS fraction in the present study were in the same range
as determined by Kilb et al. (2003), who showed significant variation among locations of
biofilm cultivation (total biofilm protein range: 20.9 to 281.1 µg cm-2; total biofilm
carbohydrate range: 6.8 to 131.1 µg cm-2; EPS protein range: 1.2 to 12.9 µg cm-2; EPS
carbohydrate range: 0.82 to 6.2 µg cm-2). Variations of the biochemical composition of the
biofilms and their EPS in the present study were lower compared to those determined by
Kilb et al. (2003). Their study, furthermore, showed protein : carbohydrate ratios of up to
6.2 : 1 for the total biofilm and up to 3.4 : 1 for the EPS fraction (Kilb et al., 2003), which
were similar to those determined in the present study. Results of the present study as well
as of the study by Kilb et al. (2003) therefore indicate a strong variability of biochemical
composition among drinking-water biofilms. Furthermore, both studies showed that
drinking-water biofilms in general represent a type of biofilms, in which proteins constitute
the most abundant component, irrespective of biofilm age or the type of drinking water.
All drinking-water biofilms cultivated in the present study exhibited similar characteristics in
respect to absorption and accumulation of considerable quantities of metal ions, in
particular heavy metals, within the biofilm matrix. The alkaline earth metals Ca and Mg were
accumulated to a minor degree within the biofilm compared to heavy metals. Maximally one
order of magnitude higher concentration of Ca and Mg were found within the biofilms
compared to the water phase. The heavy metals Fe, Cu, Zn, and Al, on the other hand, were
enriched by 2 to more than 3 orders of magnitude in the biofilm. Biofilms have been shown
to bind and concentrate heavy metals such as Cu, Zn or Cd from dilute aqueous solutions
Discussion
173
(White and Gadd, 1998; 2000; Gadd, 2000; 2010). Processes such as ion exchange, chelation
or complexation bind heavy metals and thus remove them from the water phase. These
processes have been known and exploited for decades in biotechnology, in particular for
metal removal in wastewater treatment. In the drinking water sector such processes can
cause severe problems, due to the potential precipitation and incrustation of wells or within
distribution pipes, obstructing the water flow, clogging pipes and offering microorganisms a
protected environment with large and porous surfaces (Emde et al., 1992; Loewenthal et al.,
2004)
The plumbing systems in this study, which in all cases were made of Cu, strongly influenced
Cu concentrations in the drinking water. More than one order of magnitude higher Cu
concentrations were detected in the drinking waters when collected from the plumbing
system, compared to the drinking waters taken from the distribution systems, while all other
determined inorganic substances remained unchanged. The increased Cu concentration in
the water phase in drinking waters from plumbing systems in turn resulted in more than one
magnitude higher Cu concentrations in the biofilms compared to those cultivated in the
distribution system. Biofilms cultivated at distribution systems on the other hand exhibited
higher Fe concentrations compared to their counterparts from plumbing systems. The
results of this study indicated changes in biofilm and EPS composition attributed to the
increased Cu content in drinking waters from the plumbing systems. Changes in population
diversity can be attributed to the plumbing material and accumulation of Cu released from
the material in the water phase and within the biofilm matrix, which can favor the growth of
certain Cu tolerant microorganisms. Cu in concentrations as detected in drinking water at
plumbing system C (0.14 ± 0.04 mg L-1), plumbing system A (0.067 ± 0.019 mg L-1) and
plumbing system B (0.037 ± 0.001 mg L-1) can cause inhibitory or toxic effects for certain
microorganisms (Thurman and Gerba, 1989; Straub et al., 1995; Artz and Killham, 2002; Kim
et al., 2002; Teitzel and Parsek, 2003; Lehtola et al., 2004; Teitzel et al., 2006; Moritz et al.,
2010; Dwidjosiswojo et al., 2011). Hence, Cu materials used in plumbing systems can
substantially alter the composition of and abundance among microbial populations within a
drinking-water biofilm, by increasing Cu concentrations in the drinking water, and thus,
inhibiting growth of Cu susceptible microorganisms, while favoring Cu tolerant species.
Discussion
174
In the present study, the effect of Cu on drinking-water biofilms was further evidenced by
determination of the culturability of biofilm cells on R2A medium. Cu can affect culturability
of cells by disturbing metabolic functions, disrupting structure and function of proteins,
displacing metal cofactors essential for proteins, or by formation of reactive oxygen species
causing oxidative stress or cell damage, or inducing a VBNC state (Teitzel et al., 2006; Moritz
et al., 2010; Dwidjosiswojo et al., 2011). Biofilms from plumbing systems contained
considerably lower proportions of culturable cells (8.5 % to 15.3 % of the total cell count),
compared to the proportions of culturable cells in biofilms from distribution system (46.8 %
to 50.5 % of the total cell count). The biofilm wet weight also varied significantly despite
similar total cell counts. Plumbing system A and B biofilms exhibited 3.2 fold and 2.1 fold
higher biofilm wet weights, respectively, compared to their counterparts cultivated at the
respective distribution system. Highest biofilm wet weight was observed for plumbing
system C biofilms, which was also exposed to highest Cu concentrations in the drinking
water. EPS, in particular hydrophilic polysaccharides and proteins, act hygroscopically
attracting and retaining water from the environment (Roberson and Firestone, 1992;
Flemming and Wingender, 2010). Exposure to high copper concentrations may have resulted
in altered production of EPS with different characteristics in terms of water retention, which
may explain higher water contents in plumbing system biofilms exposed to higher Cu
contents. An upregulation of EPS production due to Cu stress has been demonstrated by
Keith and Bender (1999) by means of increased alginate production in P. syringae exposed to
elevated Cu concentrations. The yields of isolated EPS, in particular polysaccharides and
proteins, varied considerably among biofilms. A decreasing trend of isolated EPS
components with increasing Cu concentrations in the drinking waters was observed. Biofilms
cultivated at plumbing system C, which contained highest concentrations of Cu, yielded
relatively low proportions of extracellular carbohydrates (11.3 %) and proteins (4.5 %)
isolated from the biofilm by CER treatment, followed by plumbing system A biofilms
(carbohydrates: 18.8 %; proteins: 6.1 %). Biofilms cultivated at plumbing system B or
distribution system B revealed relatively similar carbohydrate (33.8 % and 24.4 %,
respectively) or protein (18.1 % and 16.0 %, respectively) yields, while recovery of
carbohydrates (49.7 %) and proteins (34.6 %) from distribution system A biofilms was
highest (Fig. 4.27). The influence of Cu on biofilm cells and EPS production can only be
Discussion
175
speculated. The differences in EPS yields could for example indicate decreasing EPS
component production with increasing Cu content, due to lower activity of cells, which
would be contrary to results presented by Keith and Bender (1999). Alternatively, this may
demonstrate production of EPS components tightly bound to biofilm cells, which are
specifically produced to protect biofilm cells from Cu stress, and which are not readily
isolable by the EPS isolation procedure using CER. A further explanation could be a potential
complexation and immobilization of Cu by EPS constituents, rendering the EPS’ solubility and
susceptibility to isolation by CER.
Analysis of EPS proteins by 2DE in general displayed only a limited number of common
proteins in the EPS of the five drinking-water biofilms. However, the analysis identified three
clusters of proteins in common only in biofilms cultivated at plumbing systems, and
consequently, exposed to higher concentrations of Cu, which were not found in biofilms
cultivated at distribution systems. This included a protein with significant homology in MS-
spectra to a protein involved in the efflux apparatus of cells, i.e. a RND (resistance-
nodulation-cell division) family efflux transporter MFP (membrane fusion protein) subunit.
Efflux systems are required by microorganisms for example to cope with elevated and
potentially toxic concentrations of metals, by “flushing” the metals out of the cytoplasm and
through the cell membrane into the environment (Nies and Silver, 1995). Efflux systems for
the removal of Cu from the cytoplasm of cells have been described for various organisms, for
example involving the Cu resistence operon (cop) of P. aeruginosa, or the plasmid-borne Cu
resistance determinant (pco) in E. coli (Cooksey, 1994; Nies and Silver, 1995; Silver, 1996;
Teitzel and Parsek, 2003). Up-regulation of genes encoding for transport system components
under Cu stress has been demonstrated (Teitzel et al., 2006) and could play an important
role for the resistance of drinking-water biofilm organisms to the encountered elevated
copper concentrations in drinking waters and within drinking-water biofilms affected by Cu
plumbing materials. A further protein exhibited significant homology of MS-spectrum to a
two component response regulator or a two component LuxR family transcriptional
regulator. Transcriptional regulators can activate or silence gene expression. In
P. aeruginosa, for example, the two component transcriptional regulator AlgB is necessary
for high-level production of alginate (Wozniak and Ohman, 1991). In P. syringae the
response regulator AlgT (σ22) controls the activation of alginate production in response to
Discussion
176
heat, osmotic stress or oxidative stress, as well as in response to Cu stress (Keith and Bender,
1999). Such regulators may also be involved in Cu stress specific gene expression in drinking-
water biofilm cells cultivated in this study, to counteract detrimental effects of Cu.
These protein spot were not detected in the 2D gels of EPS proteins from drinking-water
biofilms exposed to low Cu contents at the distribution system A or B. Presence of these
proteins in biofilms grown at high Cu levels, therefore, may indicate the significance of these
proteins as stress response to the elevated Cu concentrations and upregulation of certain
genes for enhanced production of Cu stress specific cell components and EPS.
5.3.2 Incorporation of hygienically relevant microorganisms into drinking-water biofilms
The potential of drinking-water biofilms to accommodate hygienically relevant
microorganisms has been demonstrated in several studies, indicating a potential threat for
human health (Szewzyk et al., 2000; Flemming et al., 2002; Bressler et al., 2009; Moritz et al.
2010). In the present study, drinking-water biofilms were cultivated at plumbing system C for
14 d on EPDM and exposed to a pure culture of P. aeruginosa AdS in order to simulate a
potential contamination with a hygienically relevant microorganism. The aim was to assess
the influence of P. aeruginosa on the microbiological and biochemical composition of
drinking-water biofilms and their EPS.
Microbiological requirements for drinking water quality are based on cultivation on diverse
media, aiming at the determination of indicator parameters, such as colony counts of
heterotrophic microorganisms, or microbiological parameters, such as presence of
culturable coliform bacteria, Escherichia coli, or enterococci, as well as the facultative
pathogens P. aeruginosa or Legionella spec. within the water phase (TrinkwV, 2011). In the
current study, presence of P. aeruginosa in drinking-water biofilms before and after the
inoculation of the biofilm with the facultative pathogen was analyzed by determining colony
formation on the P. aeruginosa-selective CN agar medium and by the culture-independent
method FISH. The analysis of 14 d-old drinking-water biofilms by plating on CN agar or by
FISH both revealed no presence of P. aeruginosa in native drinking-water biofilms prior to
inoculation. The P. aeruginosa inoculum exhibited a culturability of 2.1 ± 0.7 x 10⁶ cfu ml-1 on
Discussion
177
CN agar prior to inoculation. Presence of P. aeruginosa in the biofilms after exposure of the
biofilms to the P. aeruginosa inoculum was not detected culturally on CN agar. This was
contrary to results obtained by FISH, which detected significant amounts of FISH-positive
P. aeruginosa cell counts incorporated into the drinking-water biofilm (1.2 x 10⁵ ± 5.9 x 10⁴
cells cm-2 24 h after inoculation; 2.6 x 10⁵ ± 2.8 x 10⁵ cells cm-2 7 d after inoculation).
Cultivation methods in general have major weaknesses. Cultivation media are selective for
certain microorganisms and, therefore, do not reflect the total population of a microbial
community (Amann et al., 1995; Moritz et al., 2010; Wingender, 2011; Wingender and
Flemming, 2011). Furthermore, the vast majority of microorganisms cannot be cultivated on
standard media, and, more importantly, adverse environmental conditions may induce the
transition of microorganisms into the VBNC state (Kalmbach et al., 1997; Oliver, 2005;
Wingender, 2011). The FISH oligonucleotide probe applied in this study specifically targets
intact 16S rRNA sequences, hence, can be applied to indicate viability of cells. However,
presence of complementary rRNA sequences from dead P. aeruginosa or those from lysed
bacteria retained in the EPS matrix cannot be excluded. Nevertheless, FISH results suggests a
successful incorporation of P. aeruginosa AdS into drinking-water biofilms. The high
discrepancy between culturability and FISH indicates possible transition of P. aeruginosa AdS
into the VBNC state. These results are in accordance with Moritz et al. (2010). Even though
in their study a proportion of culturable P. aeruginosa cells was observed, it was
considerably lower compared to the detected FISH-positive cell counts (Moritz et al., 2010).
Similar observations were described for L. pneumophila in drinking-water biofilms (Långmark
et al., 2005; Lehtola et al., 2007; Gião et al., 2009; Moritz et al., 2010). This effect could be
associated with the composition of the drinking water used for drinking-water biofilm
growth. Exposure of P. aeruginosa AdS to the drinking water used for the cultivation of
drinking-water biofilms resulted in a decrease of culturability by 5 orders of magnitude, even
when the drinking water was diluted 5 fold in deionized water. The decrease in culturability
could, to some extent, be correlated to the Cu concentrations in the drinking water.
Incubation of P. aeruginosa AdS in Cu solutions prepared in 6 mM phosphate buffer (pH 7.0)
with Cu concentrations of up to 4 µM showed unhindered culturability of P. aeruginosa for
Cu ion concentrations of up to 0.6 µM. Increasing Cu ion concentrations of ≥ 0.8 µM caused
a gradual decrease of culturability, resulting in 5 orders of magnitude lower colony counts
Discussion
178
when exposed to 4 µM Cu solutions. Dwidjosiswojo et al. (2011) described a similar decrease
of culturability of P. aeruginosa in response to incubation in different concentrations of Cu in
deionized water, and a successful resuscitation of P. aeruginosa once Cu ions were
complexed, and hence, rendered harmless. This indicates the transition of P. aeruginosa into
the VBNC state as stress response to Cu. The transition into the VBNC state in response to
exposure to elevated Cu concentrations has also been described for a variety of Gram-
negative bacteria, including Agrobacterium tumefaciens, Rhizobium leguminosarum
(Alexander et al., 1999), Xanthomonas campestris pv. campestris (Ghezzi and Steck, 1999),
Ralstonia solanacearum, E. coli (Grey and Steck, 2001a,b), Erwinia amylovora (Ordax et al.,
2006) and Xanthomonas axonopodis pv. citri (Del Campo et al., 2009). 5 fold diluted drinking
water, which resulted in a decrease of culturability by 5 orders of magnitude in the present
study, however, was equivalent to a Cu concentration of 0.44 µM, at which P. aeruginosa
should be culturable. This indicates that Cu in drinking water was most likely only one of the
causative agents inhibiting culturability of P. aeruginosa in this study. Free chlorine was not
detected in the drinking water, hence, effects of chlorine would be minimal or absent.
However, other heavy metals could aid in the transition of P. aeruginosa into the VBNC state
in drinking water, which in sum could be present in concentrations affecting P. aeruginosa
culturability. A potential candidate known for its toxicity is Zn, which could influence
P. aeruginosa culturability in combination with Cu (Teitzel and Parsek, 2003). Results of this
study, similarly to previous studies comparing culture dependent to culture independent
methods, indicate that under unfavorable conditions, culture dependent methods may
underestimate the presence of hygienically relevant microorganisms and, thus, potential risk
to human health.
The effect of a simulated contamination of drinking-water biofilms with P. aeruginosa on the
biochemical composition of the biofilms was determined by analyzing EPS composition 24 h
and 7 d after inoculation of the biofilms with P. aeruginosa AdS. The quantitative
biochemical composition of total biofilms and the EPS showed only slight variations. Analysis
of the extracellular proteome revealed a small number of differentially produced EPS
proteins. Concluding, exposure of drinking-water biofilms to P. aeruginosa in order to
simulate a contamination of drinking water with a hygienically relevant microorganism,
showed no significant alterations to the community or biochemical composition of the
Discussion
179
drinking-water biofilm. P. aeruginosa detected by FISH made up only 0.04 % to 0.05 % of the
total cell counts and were probably too few to produce significant alteration to the
established drinking-water biofilms. Slight variations could have been attributed by biofilm
to biofilm alterations, rather than the influence of P. aeruginosa.
The consequence of an incorporation of the facultative pathogen into drinking-water
biofilms, regarding hygienical relevance and potential threat to human health, remains
subject to speculation. The potential of P. aeruginosa to be incorporated into drinking-water
biofilms and its persistence in the biofilm environment has been shown, however, the
pathogen’s physiological state remains unknown. In the present study P. aeruginosa is
assumed to be in a VBNC state when incorporated into drinking-water biofilms, due to toxic
concentrations of heavy metals, in particular Cu, in the drinking water (Moritz et al.,
Dwidjosiswojo et al., 2011). The environmental conditions within a biofilm, however, are
drastically altered compared to the water phase, and can be advantageous or
disadvantageous to the pathogen. Biofilms in general are known to provide a safe haven for
microorganisms, due to their protective functions (Hall-Stoodley et al., 2004). However, in
this study drinking-water biofilms were shown to sequester and concentrate heavy metals
within the biofilm matrix by several orders of magnitude compared to the water phase.
Despite their potential complexation by EPS components or deposition as insoluble
precipitates in the biofilm matrix, which could alter their toxicity (Gadd, 2010), their effects
on P. aeruginosa within the biofilm matrix are unknown. Additionally, P. aeruginosa could
encounter antagonistic microorganisms, which have been described in marine environments
(Nithya et al., 2010; Rendueles and Ghigo, 2012), thus, increasing hostility of the biofilm
environment for P. aeruginosa and decreasing its chances of survival. The question what
happens, once incorporated P. aeruginosa are released from the biofilm into the bulk
solution, remains to be investigated.
Discussion
180
5.4 Identification and function of extracellular proteins in drinking-water
biofilms
Proteins in the EPS matrix are considered to have their major functions as enzymes, allowing
for metabolic turnover of diverse substrates accumulated in the EPS matrix, or as structural
components, providing mechanical stability to the biofilm (Wingender and Jaeger, 2002;
Flemming and Wingender, 2010). Despite their profound role in the EPS matrix of biofilms,
identification of extracellular proteins has been performed only in a small number of studies
found in literature, dealing with pure culture biofilms. Identification of EPS proteins from
drinking-water biofilms has never been attempted before.
For identification and in order to elucidate the function of EPS proteins present in drinking-
water biofilms, EPS were isolated from the biofilms by use of CER and subjected to
separation by 2DE and subsequent analysis by MALDI-TOF-MS. 2DE separates proteins
according to their isoelectric point (pI) in the first dimension and by their molecular weight
in the second dimension, and in an ideal case provides spot patterns with each spot
corresponding to a single protein. The EPS of drinking-water biofilms required additional
clean-up and optimization of the 2DE protocol in order to obtain distinct protein spots,
which was achieved in this study.
In the present study, identification of protein spots in most of the cases revealed significant
similarity of MS-spectra to more than one protein. The 2DE gels produced for subsequent
identification of proteins showed horizontal and vertical streaking, due to the increased
amount of proteins (400 µg) applied for 2D separation and potential overloading of the IPG
gels (Garfin and Heerdt, 2000). A high protein concentration was required for identification
to ensure sufficient protein amount per protein spot. Consequentially, separation of proteins
was not ideal and could have resulted in presence of multiple proteins per spot.
Alternatively, MS-spectra of analyzed proteins may have close homology to a variety of
proteins present in the database, resulting in multiple identifications for a single protein.
Information on molecular weight and estimated pI were examined as potential means to
validate protein identity. However, molecular weight and estimated pI of the identified
proteins only in a few cases corresponded to the location of the proteins on the gels. In
many cases molecular weight of identified protein was significantly higher compared to the
Discussion
181
location on the 2DE gel. This could indicate that only subunits of these proteins or
enzymatically degraded proteins were detected by 2DE. In some cases molecular weight of
identified protein was lower compared to its location on the 2DE gel. This may be attributed
to interactions of EPS components with proteins or their interference with 2DE.
Polysaccharides and DNA are known to disturb isoelectric focusing by clogging the pores of
the gels (Berkelman et al., 2000; Berkelman, 2008). Furthermore, EPS components can bind
to or entangle proteins (Wloka et al., 2004; Berkelman et al., 2000; Berkelman 2008;
Flemming and Wingender, 2010). The EPS solutions applied for 2DE in this study contained
considerable amounts of polysaccharides and potentially lipids. Associations of proteins with
other EPS components can influence the proteins’ mobility during 2DE and could have
substantially altered molecular weight and pI of EPS proteins visualized by 2DE in this study.
Consequentially, information on molecular weight and estimated pI could not be used as
means to help in the validation of the identity of proteins.
Allocation of proteins was predicted from their amino acid sequence. The majority of
identified proteins were predicted as intracellular or cell membrane associated. The
presence of intracellular proteins in the EPS may indicate lysis of cells in the course of biofilm
formation. Cell death and consequential lysis of cells allows for release of intracellular
material into the environment as response to environmental stress and is considered a
necessary element during the formation of biofilms (Rice et al., 2007; O’Connell, 2007).
Resulting discharge of intracellular proteins could have resulted in the retention and
implementation of these proteins within the EPS matrix of drinking-water biofilms in the
present study. Intracellular proteins have also been detected in the EPS of Bacillus subtilis
biofilms (Hirose et al., 2000), further indicating that intracellular proteins are generally
present in the EPS matrix. Cell lysis induced by the EPS isolation procedure by CER was not
detected by means of culturability or determination of activity of the strictly intracellular
enzyme G6PDH in the EPS. Contributions of intracellular proteins released due to CER
treatment are, therefore, considered minimal. The presence of membrane associated
proteins may also be attributed to lysis of cells in the course of biofilm development.
Alternatively, production of membrane vesicles, which has been shown for a variety of
Gram-negative bacteria (reviewed by Kuehn and Kesty, 2005) could contribute to the
presence of outer membrane proteins in the EPS matrix. In the case of membrane-bound
Discussion
182
proteins, in particular those located in the outer membrane, the EPS isolation treatment by
CER needs to be considered. Membrane-bound proteins are exposed to the shear imposed
by the CER treatment. Presence of membrane-associated proteins in the EPS might indicate
their shedding from the outer membrane during EPS isolation by CER, with no noticeable
effect on the cells’ viability. A total of 11 proteins present in the NCBI database, which were
predicted to be localized extracellularly, exhibited significant homology of MS-spectra to
proteins present in the EPS of drinking-water biofilms.
Identification of EPS proteins from drinking-water biofilms indicated presence of proteins
with diverse functions. The majority of proteins belonged to the functional classes involved
in metabolism, regulation or transport. These functions have also been described for EPS
proteins of pure culture biofilms of B. subtilis (Hirose et al., 2000; Antelmann et al., 2001),
E. coli (Nandakumar et al., 2005) and P. aeruginosa (Nouvens et al., 2003; Kim et al., 2005;
Waite et al., 2012).
The identification results suggest presence of a variety of hydrolytic enzymes involved in
metabolic functions, which are predicted to be cell-associated (e.g. spots no. 12, 18, 23, 26,
34, 35), or extracellularly localized (e.g. spot no. 6). The identified enzymes belong to the
enzyme groups proteases, peptidases, phosphatases, nucleases, kinases, or oxidoreductases.
Potential metabolic capabilities of drinking-water biofilms have been discussed by
Schmeisser et al. (2003), based on metagenome information obtained from drinking-water
biofilms on rubber coated valves in a drinking water distribution system, who matched
obtained gene sequences to known protein-coding sequences. Enzymatic activity
measurements (Section 4.4.6) and EPS protein identification results of the present study
further indicate the metabolic potential of drinking-water biofilms and, in particular, the EPS’
role as an external digestive system.
Similarity of MS-spectra to response regulatory proteins (spots no. 3, 9, 24, 32) or sensory
proteins (spots no. 3, 27) has been detected for a number of EPS proteins from drinking-
water biofilms. These proteins respond to environmental stimuli and effect stress response
under adverse conditions. In the presented study environmental stress on microorganisms
has been described in the form of Cu stress. Spots No. 3 and 32 have been found in clusters
of protein spots present only in the EPS of drinking-water biofilms cultivated in drinking-
Discussion
183
waters abstracted from plumbing systems made of Cu, and absent in those cultivated at Cu-
unaffected distribution systems. The gene sequence encoding for a two-component
response regulator protein, which had a significant homology of MS-spectrum to protein
spot No. 32 analyzed in this study, was found in an uncultured bacterium from a drinking-
water biofilm (Stoeckigt et al., unpublished; accession no. Q6JWS4). Presence of these
proteins in biofilms exposed to elevated concentrations of Cu indicates their significance as
regulator of gene expression towards enhanced production of Cu stress specific cell
components and EPS.
Transporter systems are essential for cell viability, importing nutrients from the environment
and exporting substances toxic to the cell (Davidson et al., 2008). Transporter proteins are,
furthermore, necessary for the establishment of a mature biofilm, due to their role in
translocation of polymers from the cytoplasm into the extracellular environment (Hinsa et
al., 2003). Secretory systems involve complex arrangements of numerous secretory proteins
bound to the inner or outer cell membrane or spanning across the periplasm, and which
form specific pathways for the transport of polymers across the membranes (Hueck, 1998;
Russel, 1998; Abdallah et al., 2007; Fronzes et al., 2009). A number of proteins analyzed in
the present study showed significant homology in MS-spectra to transporter proteins (spots
no. 5, 6, 7, 9, 13, 16, 18, 27, 31). Regarding spot no. 9, this protein was only found in
drinking-water biofilms exposed to elevated concentrations of Cu, and therefore, could be
involved in the Cu stress response mechanism. The majority of transporter proteins detected
in this study were predicted to be located in the outer membrane.
Proteins can also exhibit structural roles within the biofilm matrix (Higgins and Novak, 1997;
Dignac et al., 1998; Tielker et al., 2005; Larsen et al., 2007). Identification results indicated
low abundance of structural proteins in the EPS of drinking-water biofilms, showing only one
potential candidate (spot no. 6) with significant homology in MS-spectrum to laminin, beta 3.
A further type of proteins detected in the EPS of E. coli, B. subtilis and P. aeruginosa included
(Antelmann et al., 2001; Nouvens et al., 2003; Kim et al., 2005; Nandakumar et al., 2006;
Waite et al., 2012) are flagellar proteins. These proteins were not found in the EPS of
drinking-water biofilms in the present study. For a number of proteins analyzed in this study,
including 4 proteins which were predicted to be localized extracellularly, the function is
unknown.
Discussion
184
5.5 Outlook
The presented study provided insights into the composition, function and dynamics of
drinking-water biofilms and their EPS. The major challenge of this study was the low
concentration of the EPS, and thus, the establishment and adaptation of methods for the
cultivation of drinking-water biofilms, for EPS isolation, as well as methods for quantitative
and qualitative analyses of the biofilms and their EPS.
The experimental setup and EPDM material applied in this study proved to be suitable for
the cultivation of drinking-water biofilms, supporting extensive growth of biofilms and
resulting in macroscopically visible, multi-layered biofilms. Biofilm growth was supported by
nutrients leached from the EPDM material. Such extensive growth was necessary in this
study, to obtain sufficient biomass for EPS isolation and analysis. In the drinking water praxis
such an extensive biofilm formation would represent a worst-case scenario. However,
materials which support microbial growth are still used, mainly in plumbing systems.
Therefore, the experimental system has practical relevance.
The EPS isolation method by CER, which was miniaturized and optimized in the present
study, allowed for recovery of increased amounts of EPS from drinking-water biofilms and
for a broad range of biochemical analyses. Alternative procedures for EPS isolation, as
reported in literature, in particular chemical methods, showed limitations in terms of
interference with biochemical assays, potential cell lysis or chemical reactions with EPS
constituents.
Drinking-water biofilms were shown to be another type of biofilm, in which proteins
represent the main EPS component, irrespective of biofilm age and origin, followed by
polysaccharides and DNA. Prevalence of proteins has also been observed, e.g. in wastewater
biofilms. Establishment and optimization of analytical methods in the present study enabled
the determination of the role of extracellular proteins within drinking-water biofilms. EPS
proteins exhibited enzymatic functions and were shown to utilize a variety of diverse
substrates, indicating their role as an external digestive system. The optimized 2DE protocol
allowed for separation and subsequent identification of EPS proteins, which showed
metabolic, transport or regulatory functions. However, identification of proteins separated
Discussion
185
by 2DE and analyzed by MALDI-TOF-MS in most cases resulted in significant homologies of
MS-spectra to more than one protein recorded in the protein database per spot. Recently
developed approaches, such as the combination of metagenomics and proteomics,
represent potential tools to obtain more exact identifications of EPS proteins from drinking-
water biofilms as well as other environmental multi-species biofilms. This approach could
help to exclude improbable identities, and should be applied in future studies. Application of
2D-DIGE could, furthermore, allow for more precise detection of up- or down-regulation of
intra- or extracellular protein expression in drinking-water biofilms in response to
environmental changes or stress.
Polysaccharides and DNA were present in considerable proportions in the EPS of drinking-
water biofilms. Polysaccharides are structural elements of any biofilm and for a long time
considered the major constituent of biofilms. In this study polysaccharides were only
analyzed quantitatively. Qualitative analysis of the composition and structure of
polysaccharides will be necessary to determine the influence of polysaccharides on biofilm
structure and mechanical stability. Presence of eDNA was verified in all drinking-water
biofilms tested in this study, indicating its ubiquity in this type of biofilms. This raises the
question of its role within the EPS matrix. Whitchurch et al. (2002) demonstrated, that eDNA
is a structural component within the EPS of P. aeruginosa biofilms, and not merely debris
from lysed cells. Flemming et al. (2007) speculated about further potential functions of
eDNA, which have yet to be proven. The role of eDNA within drinking-water biofilms remains
subject to future investigations.
Finally, this study demonstrated the variability of drinking-water biofilms in terms of
microbial populations and EPS composition in the progress of biofilm formation, as well as in
response to differences in conditions among drinking water systems. Variations were in
particular evident comparing biofilms from distribution systems to those cultivated in copper
plumbing systems, with regard to population diversity and EPS composition. Copper was
shown to influence the culturability of some microorganisms and may be responsible for
population shifts within drinking-water biofilms. Furthermore, copper was shown to
decrease culturability of P. aeruginosa, which was used as model organism of hygienical
relevance, causing its transition into the VBNC state and potentially obstructing its detection
Discussion
186
during drinking water analysis. This signifies the need for further investigations of the effect
of copper on drinking-water biofilms and on hygienically relevant organisms.
References
187
6. REFERENCES
Abdallah, A. M., Gey van Pittius, N. C., DiGiuseppe Champion, P. A., Cox, J., Luirink, J., Vandenbroucke-Grauls, C. M. J. E., Appelmelk, B. J., Bitter, W. (2007). Type VII secretion - mycobacteria show the way. Nature Reviews Microbiology 5, 883 – 891.
Aguilera, A., Souza-Egipsy, V., San Martín-Úriz, P., Amils, R. (2008). Extraction of extracellular polymeric substances from extreme acidic microbial biofilms. Applied Microbiology and Biotechnology 78, 1079 – 1088.
Ahn, S. J., Costa, J., Emanuel, J. R. (1996). PicoGreen quantitation of DNA: effective evaluation of samples pre- or post-PCR. Nucleic Acid Research 24, 2623 – 2625.
Akpe San Roman, S., Facey, P. D., Fernandez-Martinez, L., Rodriguez, C., Vallin, C., Del Sol, R., Dyson, P. (2010). A heterodimer of EsxA and EsxB is involved in sporulation and is secreted by a type VII secretion system in Streptomyces coelicolor. Microbiology 156, 1719 – 1729.
Alexander, E., Pham, D., Steck, T. R. (1999). The viable-but-nonculturable condition is induced by copper in Agrobacterium tumefaciens and Rhizobium leguminosarum. Applied and Environmental Microbiology 65, 3754 – 3756.
Allesen-Holm, M., Barken, K. B., Yang, L., Klausen, M., Webb, J. S., Kjelleberg, S., Molin, S., Givskov, M., Tolker-Nielsen, T. (2006). A characterization of DNA release in Pseudomonas aeruginosa cultures and biofilms. Molecular Microbiology 59, 1114 – 1128.
Allison, D. G., Sutherland, I. W. (1984). A staining technique for attached bacteria and its correlation to extracellular carbohydrate production. Journal of Microbiological Methods 2, 93 – 99.
Allison, D. P., Kerper, P. S., Doktycz, M. J., Thundat, T., Modrich, P., Larimer, F. W., Johnson, D. K., Hoyt, P. R., Mucenski, M. L., Warmack, R. J. (1997). Mapping individual cosmid DNAs by direct AFM imaging. Genomics 41, 379 – 384.
Allison, D. G., Ruiz, B., SanJose, C., Jaspe, A., Gilbert, P. (1998). Extracellular products as mediators of the formation and detachment of Pseudomonas fluorescens biofilms. FEMS Microbiology Letters 167, 179 – 184.
Amann, R. I., Ludwig, W., Schleifer, K. H. (1995). Phylogenetic identification and in situ detection of individual microbial cells without cultivation. Microbiology and Molecular Biology Reviews 59, 143 – 169.
Angles, M. L., Marshall, K. C., Goodman, A. E. (1993). Plasmid transfer between marine bacteria in the aqueous phase and biofilms in reactor microcosms. Applied and Environmental Microbiology 59, 843 – 850.
Antelmann, H., Tjalsma, H., Voigt, B., Ohlmeier, S., Bron, S., van Dijl, J. M., Hecker, M. (2001). A proteomic view on genome-based signal peptide predictions. Genome Research 11, 1484 – 1502.
Appenzeller, B. M. R., Batté, M., Mathieu, L., Block, J.-C., Lahoussine, V., Cavard, J., Gate, D. (2001). Effect of adding phosphate in drinking water on bacterial growth in slightly and highly corroded pipes. Water Research 35, 1100 – 1105.
Artz, R. R. E., Killham, K. (2002). Survival of Escherichia coli O157:H7 in private drinking water wells: influences of protozoan grazing and elevated copper concentrations. FEMS microbiology letters 216, 117 – 122.
References
188
Azeredo, L., Lazarova, V., Oliveira, R. (1999). Methods to extract the exopolymeric matrix from biofilms, a comparative study. Water Science and Technology 39(7), 243 – 250.
Azeredo, J., Henriques, M., Sillankorva, S., Oliveira, R. (2003). Extraction of exopolymers from biofilms: the protective effect of glutaraldehyde. Water Science and Technology 47(5), 175 – 179.
Bagh, L. K., Albrechtsen, H.-J., Arvin, E., Ovesen, K. (2004). Distribution of bacteria in a domestic hot water system in a Danish apartment building. Water Research 38, 225 - 235.
Bai, X., Wu, F., Zhou, B., Zhi, X. (2010). Biofilm bacterial communities and abundance in a full-scale drinking water distribution system in Shanghai. Journal of Water and Health 8, 593-600.
Barbesti, S., Citterio, S., Labra, M., Baroni, M. D., Neri, M. G., Sgorbati, S. (2000). Two and three-color fluorescence flow cytometric analysis of immunoidentified viable bacteria. Cytometry 40, 214 – 218.
Batté, M., Appenzeller, B. M. R., Grandjean, D., Fass, S., Gauthier, V., Jorand, F., Mathieu, L., Boualam, M., Saby, S., Block, J. C. (2003). Biofilms in drinking water distribution systems. Reviews in Environmental Science and Biotechnology 2, 147 – 168.
Battin, T. J. (1997). Assessment of fluorescein diacetate hydrolysis as a measure of total esterase activity in natural stream sediment biofilms. Science of the Total Environment 198, 51 – 60.
Baty III, A. M., Eastburn, C. C., Diwu, Z., Techkarnjanaruk, S., Goodman, A. E., Geesey, G. G. (2000). Differentiation of chitinase-active and non-chitinase-active subpopulations of a marine bacterium during chitin degradation. Applied and Environmental Microbiology 66, 3566 – 3573.
Baty III, A. M., Diwu, Z., Dunham, G., Eastburn, C. C., Geesey, G. G., Goodman, A. E., Suci, P. A., Techkarnjanaruk, S., (2001). Characterization of extracellular chitinolytic activity in biofilms. Methods in Enzymology 336, 279 – 301.
Beccari, M., Mappelli, P., Tandoi, V. (1980). Relationship between bulking and physicochemical-biological properties of activated sludge. Biotechnology and Bioengineering 12, 969 – 979.
Beech, I. B. (1996). The potential use of atomic force microscopy for studying corrosion of metals in the presence of bacterial biofilms — an overview. International Biodeterioration and Biodegradation 37, 141 – 149.
Beech, I. B., Smith, J. R., Steele, A. A., Penegar, I., Campbell, S. A. (2002). The use of atomic force microscopy for studying interactions of bacterial biofilms with surfaces. Colloids and Surfaces B, Biointerfaces 23, 231 – 247.
Ben-Amor, K., Heilig, H., Smidt, H., Vaughan, E. E., Abee, T., de Vos, W. M. (2005). Genetic diversity of viable, injured, and dead fecal bacteria assessed by fluorescence-activated cell sorting and 16S rRNA gene analysis. Applied and Environmental Microbiology 71, 4679 – 4689.
Berkelman, T., Brubacher, M. G., Chang, H., Cross, T., Strong, W. (2000). Tips to prevent streaking on 2-D gels. Bio-Rad bulletin 3110.
Berkelman, T. (2008). Removal of interfering substances in samples prepared for two-dimensional (2-D) electrophoresis. Methods in Molecular Biology 424, 51 – 62.
Berney, M., Hammes, F., Bosshard, F., Weilenmann, H.-U., Egli, T. (2007). Assessment and interpretation of bacterial viability by using the Live/Dead
® BacLight kit in combination with flow cytometry. Applied and
Environmental Microbiology 73, 3283 – 3290.
Berry, D., Xi, C., Raskin, L. (2006). Microbial ecology of drinking water distribution systems. Current Opinion in Biotechnology 17, 297 – 302.
Beveridge, T. J., Makin, S. A., Kadurugamuwa, J. L., Li, Z. (1997). Interactions between biofilms and the environment. FEMS Microbiology Reviews 20, 291 – 303.
Birmingham, J. J., Hughes, N. P., Treloar, R. (1995). Diffusion and binding measurement within oral biofilms using fluorescence photobleaching recovery methods. Philosophical Transactions of the Royal Society of London. Series B, Biological Sciences 350, 325 – 343.
Bliss, J. M., Silver, R. P. (1996). Coating the surface: a model for expression of capsular polysialic acid in Escherichia coli K1. Molecular Microbiology 21, 221 – 231.
References
189
Block, J. C., Haudidier, K., Paquin, J. L., Miazga, J. and Levi, Y. (1993). Biofilm accumulation in drinking water distribution systems. Biofouling 6, 333 – 343.
Blumenkrantz, N., Asboe-Hansen, G. (1973). New method for quantitative determination of uronic acids. Analytical Biochemistry 54, 484 – 489.
Böckelmann, U., Manz, W., Neu, T. R., Szewzyk, U. (2000). Characterization of the microbial community of lotic organic aggregates ("river snow") in the Elbe River of Germany by cultivation and molecular methods. FEMS Microbiology Ecology 33, 157 – 170.
Böckelmann, U., Janke, A., Kuhn, R., Neu, T. R., Wecke, J, Lawrence, J. R., Szewzyk, U. (2006). Becterial Extracellular DNA forming a defined network-like structure. FEMS Microbiology Letters 262, 31 – 38.
Böckelmann, U., Lünsdorf, H., Szewzyk, U. (2007). Ultrastructural and electron energy-loss spectroscopic analysis of an extracellular filamentous matrix of an environmental bacterial isolate. Environmental Microbiology 9, 2137 – 2144.
Boe-Hansen, R., Albrechtsen, H.-J., Arvin, E., Jørgensen, C. (2002). Dynamics of biofilm formation in a model drinking water distribution system. Journal of Water Supply: Research and Technology - AQUA 51, 399 – 406.
Bonner, O. D., Smith, L. L. (1957). A selectivity scale for some divalent cations on Dowex 50. Journal of Physical Chemistry 61, 326 – 329.
Boschker, H. T., Cappenberg, T. (1998). Patterns of extracellular enzyme activities in littoral sediments of Lake Gooimeer, The Netherlands. FEMS Microbiology Ecology 25, 79 – 86.
Boyd, A., Chakrabarty, A. M. (1994). Role of alginate lyase in cell detachment of Pseudomonas aeruginosa. Applied and Environmental Microbiology 60, 2355 – 2359.
Bradford, M. M. (1976). A rapid and sensitive method for the quantitation of protein utilizing the principle of protein-dye binding. Analytical Biochemistry 72, 248 – 254.
Brecker, L., Ribbons, D. W. (2000). Biotransformations monitored in situ by proton nuclear magnetic resonance spectroscopy. Trends in Biotechnology 18, 197 – 202.
Breeveld, M. W., Zevenhuizen, T. M., Zehnder, A. J. B. (1990). Osmotically induced oligo- and polysaccharide synthesis by Rhizobium meliloti Su47. Journal of General Microbiology 136, 2511 – 2519.
Bressler, D. (2008). Einnistung von Pseudomonas aeruginosa in Trinkwasserbiofilme: Eine Frage der EPS? Dissertation, University of Duisburg-Essen, Germany.
Bressler, D., Balzer, M., Dannehl, A., Flemming, H.-C., Wingender, J., (2009). Persistence of Pseudomonas aeruginosa in drinking-water biofilms on elastomeric material. Water Science Technology: Water Supply 9, 81 – 87.
Broekman, S. (2009). Etablierung der Methodik zur Darstellung des extrazellulären Proteoms in Biofilmen eines mucoiden Stammes von Pseudomonas aeruginosa. Dissertation, University of Duisburg-Essen, Germany.
Brown, M. J., Lester, J. N. (1980). Comparison of bacterial extracellular polymer extraction methods. Applied and Environmental Microbiology 40, 179 – 185.
Brunk, C., Jones, K. C., James, T. W. (1979). Assay for nanogram quantities of DNA in cellular homogenates. Analytical Biochemistry 92, 497 – 500.
Buckmire, F. L. A. (1984). Influence of nutrient media on the characteristics of the exopolysaccharide produced by three mucoid Pseudomonas aeruginosa strains. Microbios 41, 49 – 63.
Burton, K. (1956). A study of the conditions and mechanism of the diphenylamine reaction for the colorimetric estimation of deoxyribonucleic acid. The Biochemical Journal 62, 315 – 323.
Busch, P. L., Stumm, W. (1968). Chemical interactions in the aggregation of bacteria bioflocculation in waste treatment. Environmental Science and Technology 2, 49 – 53.
Caldwell, D. E., Korber, D. R., Lawrence, J. R. (1992). Confocal laser scanning microscopy and digital image analysis in microbial ecology. Advances in Microbial Ecology 12, 1 – 67.
References
190
Cao, B., Shi, L., Brown, R. N., Xiong, Y., Fredrickson, J. K., Romine, M. F., Marshall, M. J., Lipton, M. S., Beyenal, H. (2011). Extracellular polymeric substances from Shewanella sp. HRCR-1 biofilms: characterization by infrared spectroscopy and proteomics. Environmental Microbiology 13, 1018 – 1031.
Catlin, B. W. (1956). Extracellular deoxyribonucleic acid of bacteria and a deoxyribonuclease inhibitor. Science 124, 441 – 442.
Cegelski, L., Pinkner, J. S., Hammer, N. D., Cusumano, C. K., Hung, C. S., Chorell, E., Åberg, V., Walker, J. N., Seek, P. C., Almqvist, F., Chapman, M. R., Hultgren, S. J. (2009). Small-molecule inhibitors target Escherichia coli amyloid biogenesis and biofilm formation. Nature Chemical Biology 5, 913 – 919.
Chandra, J., Kuhn, D. M., Mukherjee, P. K., Hoyer, L. L., McCormick, T., Ghannoum, M. A. (2001). Biofilm formation by the fungal pathogen Candida albicans: development, architecture, and drug resistance. Journal of Bacteriology 183, 5385 – 5394.
Chang, Y. C., Puil, M. L., Biggerstaff, J., Randall, A. A., Schulte, A., Taylor, J. S. (2003). Direct estimation of biofilm density on different pipe material coupons using a specific DNA-probe. Molecular and Cellular Probes 17, 237 – 243.
Chapman, M. R., Robinson, L. S., Pinkner, J. S., Roth, R., Heuser, J., Hammar, M., Normark, S., Hultgren, S. J. (2002). Role of Escherichia coli curli operons in directing amyloid fiber formation. Science 295, 851 – 855.
Characklis, W. G., Wilderer, P. A. (1989). Structure and function of biofilms. John Wiley & Sons, Inc., Chichester.
Chen, G., Palmer, R. J., White, D. C. (1997). Instrumental analysis of microbiologically influenced corrosion. Biodegradation 8, 189 – 200.
Chen, C. H., Clegg, D. O., Hansma, H. G. (1998). Structures and dynamic motion of laminin-1 as observed by atomic force microscopy. Biochemistry 37, 8262 – 8267.
Chen, L., Hu, B., Qian, G., Wang, C., Yang, W., Han, Z., Liu, F. (2009). Identification and molecular characterization of twin-arginine translocation system (Tat) in Xanthomonas oryzae pv. oryzae strain PXO99. Archives of Microbiology 191, 163 – 170.
Choo-Smith, L.-P., Maquelin, K., van Vreeswijk, T., Bruining, H. A., Puppels, G. J., Ngo Thi, N. A., Kirschner, C., Naumann, D., Ami, D., Villa, A. M., Orsini, F., Doglia, S. M., Lamfarraj, H., Sockalingum, G. D., Manfait, M., Allouch, P., Endtz, H. P. (2001). Investigating microbial (micro)colony heterogeneity by vibrational spectroscopy. Applied and Environmental Microbiology 67, 1461 – 1469.
Christensen, B. E., Kjosbakken, J., Smidsrød, O. (1985). Partial chemical and physical characterization of two extracellular polysaccharides produced by marine, periphytic Pseudomonas sp. strain NCMB 2021. Applied and Environmental Microbiology 50, 837 – 845.
Chung, Y.-C., Neethling, J. B. (1989). Microbial activity measurements for anaerobic sludge digestion. Journal of the Water Pollution Control Federation 61, 343 – 349.
Comte, S., Guibaud, G., Baudu, M. (2006a). Relations between extraction protocols for activated sludge extracellular polymeric substances (EPS) and EPS complexation properties. Part I. Comparison of the efficiency of eight EPS extraction methods. Enzyme and Microbial Technology 38, 237 – 245.
Comte, S., Guibaud, G., Baudu, M. (2006b). Relations between extraction protocols for activated sludge extracellular polymeric substances (EPS) and complexation properties of Pb and Cd with EPS. Part II. Consequences of EPS extraction methods on Pb
2+ and Cd
2+ complexation. Enzyme and Microbial Technology 38,
246 – 252.
Comte, S., Guibaud, G., Baudu, M. (2008). Biosorption properties of extracellular polymeric substances (EPS) towards Cd, Cu and Pb for different pH values. Journal of Hazardous Materials 151, 185 – 93.
Confer, D. R., Logan, B. E. (1998). Location of protein and polysaccharide hydrolytic activity in suspended and biofilm wastewater cultures. Water Research 32, 31 – 38.
Conrad, A., Suutari, M. K., Keinänen, M. M., Cadoret, A., Faure, P., Mansuy-Huault, L., Block, J. C. (2003). Fatty acid lipid fractions in extracellular polymeric substances of activated sludge. Lipids 38, 1093 – 1105.
Conti, E., Flaibani, A., O'Regan, M., Sutherland, I. W. (1994). Alginate from Pseudomonas fluorescens and P. putida: production and properties. Microbiology 140, 1125 – 1132.
References
191
Cooksey, D. A. (1994). Molecular mechanisms of copper resistance and accumulation in bacteria. FEMS Microbiology Reviews 14, 381 – 386.
Costerton, J. W., Geesey, G. G., Cheng, G. K. (1978). How bacteria stick. Scientific American 238, 86 – 95.
Costerton, J. W., Irvin, R. T., Cheng, K.-J. (1981). The bacterial glycocalyx in nature and disease. Annual Reviews in Microbiology 35, 299 – 324.
Costerton, J. W., Cheng, K. J., Geesey, G. G., Ladd, T. I., Nickel, J. C., Dasgupta, M., Marrie, T. J. (1987). Bacterial biofilms in nature and disease. Annual Review of Microbiology 41, 435 – 464.
Costerton, J. W. (1995). Overview of microbial biofilms. Journal of Industrial Microbiology 15, 137 – 140.
D’Abzac, P., Bordas, F., Joussein, E., van Hullebusch, E., Lens, P. N. L., Guibaud, G. (2010). Characterization of the mineral fraction associated to extracellular polymeric substances (EPS) in anaerobic granular sludges. Environmental Science and Technology 44, 412 – 418.
Danilatos, G. D. (1981). Design and construction of an atmospheric or environmental SEM (Part 1). Scanning, 4, 9 – 20.
Danilatos, G. D. (1983). A gaseous detector for an environmental SEM. Micron and Microscopica Acta 14, 307 – 318.
Das, T., Sharma, P. K., Busscher, H. J., van der Mei, H. C., Krom, B. P. (2010). Role of extracellular DNA in initial bacterial adhesion and surface aggregation. Applied and Environmental Microbiology 76, 3405 – 3408.
Davey, M. E., O’Toole, G. A. (2000). Microbial biofilms: from ecology to molecular genetics. Microbiology and Molecular Biology Reviews 64, 847 – 867.
Davidson, A. L., Dassa, E., Orelle, C., Chen, J. (2008). Structure, function, and evolution of bacterial ATP-binding cassette systems. Microbiology and Molecular Biology Reviews 72, 317 – 364.
Dazzo, F. B., Wright, S. F. (1996). Production of anti-microbial antibodies and their use in immunofluorescence microscopy. In: Molecular microbial ecology manual, 4.1.2, pp. 1 – 27. Akkermans, A. D. L., van Elsas, J. D., de Bruijn, F. J. (Eds.), Kluwer, Dordrecht.
de Beer, D., Stoodley, P., Roe F., Lewandowski, Z. (1994). Effects of biofilm structures on oxygen distribution and mass transport. Biotechnology and Bioengineering 43, 1131 – 1138.
De Rosa, S., Sconza, F., Volterra, L. (1998). Biofilm amount estimation by fluorescein diacetate. Water Research 32, 2621 – 2626.
Decho, A. W., Lopez, G. R. (1993). Exopolymer microenvironments of microbial flora: multiple and interactive effects on trophic relationships. Limnology and Oceanography 38, 1633 – 1645.
Decho, A. W. (2000). Microbial biofilms in intertidal systems: an overview. Continental Shelf Research 20, 1257 – 1273.
Declerck, P., Behets, J., Margineanu, A., van Hoef, V., De Keersmaecker, B., Ollevier, F. (2009). Replication of Legionella pneumophila in biofilms of water distribution pipes. Microbiology Research 164, 593 – 603.
Deines, P., Sekar, R., Husband, P. S., Boxall, J. B., Osborn, A. M., Biggs, C. A. (2010). A new coupon design for simultaneous analysis of in situ microbial biofilm formation and community structure in drinking water distribution systems. Applied Microbiology and Biotechnology 87, 749 – 756.
Del Campo, R., Russi, P., Mara, P., Mara, H., Peyrou, M., Ponce de León, I., Gaggero, C. (2009). Xanthomonas axonopodis pv. citri enters the VBNC state after copper treatment and retains its virulence. FEMS Microbiology Letters 298, 143 – 148.
Denkhaus, E., Meisen, S., Telgheder, U., Wingender, J. (2007). Chemical and physical methods for characterisation of biofilms. Microchim Acta 158, 1 – 27.
Dey, E. S., Szewczyk, E., Wawrzynczyk, J., Norrlöw, O. (2006). A novel approach for characterization of exopolymeric material in sewage sludge. Journal of Residuals Science and Technology 3, 97 – 103.
References
192
Di Poto, A., Sbarra, M. S., Provenza, G., Visai, L., Speziale, P. (2009). The effect of photodynamic treatment combined with antibiotic action or host defence mechanisms on Staphylococcus aureus biofilms. Biomaterials 30, 3158 – 3166. Elsevier Ltd.
Dignac, M. F., Urbain, V., Rybacki, D., Bruchet, A., Snidaro, D., Scribe, P. (1998). Chemical description of Extracellular polymers: implication on activated sludge floc structure. Water Science and Technology 38(8-9), 45 – 53.
Dillard, J. P., Seifert, H. S. (2001). A variable genetic island specific for Neisseria gonorrhoeae is involved in providing DNA for natural transformation and is found more often in disseminated infection isolates. Molecular Microbiology 41, 263 – 277.
Domek, M. J., LeChevallier, M. W., Cameron, S. C., McFeters, G. A. (1984). Evidence for the role of copper in the injury process of coliform bacteria in drinking water. Applied and Environmental Microbiology 48, 289 – 293.
Dominiak, D. M., Nielsen, J. L., Nielsen, P. H. (2011). Extracellular DNA is abundant and important for microcolony strength in mixed microbial biofilms. Environmental Microbiology 13, 710 – 721.
Donlan, R. M., Costerton, J. W. (2002). Biofilms: Survival mechanisms of clinically relevant microorganisms. Clinical Microbiology Reviews 15, 167 – 193.
Drummelsmith, J., Whitfield, C. (2000). Translocation of group 1 capsular polysaccharide to the surface of Escherichia coli requires a multimeric complex in the outer membrane. The EMBO Journal 19, 57 – 66.
Dubois, M., Gilles, K. A., Hamilton, J. K., Rebers, P. A., Smith, F. (1956). Colorimetric method for determination of sugars and related substances. Analytical Chemistry 28, 350 – 356.
DVGW (2007). Technische Regel W 270. Vermehrung von Mikroorganismen auf Werkstoffen für den Trinkwasserbereich – Prüfung und Bewertung. DVGW, Bonn.
Dwidjosiswojo, Z., Richard, J., Moritz, M. M., Dopp, E., Flemming, H.-C., Wingender, J. (2011). Influence of copper ions on the viability and cytotoxicity of Pseudomonas aeruginosa under conditions relevant to drinking water environments. International Journal of Hygiene and Environmental Health 214, 485 – 492.
Eboigbodin, K. E., Biggs, C. A. (2008). Characterization of the extracellular polymeric substances produced by Escherichia coli using infrared spectroscopic, proteomic, and aggregation studies. Biomacromolecules 9, 686 – 695.
Eboigbodin, K. E., Seth, A., Biggs, C. A. (2008). A review of biofilms in domestic plumbing. Journal AWWA 100, 131 – 138.
Eichler, S., Christen, R., Holtje, C., Westphal, P., Botel, J., Brettar, I., Mehling, A., Höfle, M. G. (2006). Composition and dynamics of bacterial communities of a drinking water supply system as assessed by RNA- and DNA-based 16S rRNA gene fingerprinting. Applied and Environvironmental Microbiology 72, 1858 – 1872.
Elfström Broo, A., Berghult, B., Hedberg, T. (2001). Pipe material selection in drinking water systems - a conference summary. Water Science Technology: Water Supply 1, 117 – 125.
Elguindi, J., Moffitt, S., Hasman, H., Andrade, C., Raghavan, S., Rensing, C. (2011). Metallic copper corrosion rates, moisture content, and growth medium influence survival of copper ion-resistant bacteria. Applied Microbiology and Biotechnology 89, 1963 – 1970.
Ellen, A. F., Albers, S.-V., Huibers, W., Pitcher, A., Hobel, C. F. V., Schwarz, H., Folea, M., Schouten, S., Boekema, E. J., Poolman, B., Driessen, A. J. M. (2009). Proteomic analysis of secreted membrane vesicles of archaeal Sulfolobus species reveals the presence of endosome sorting complex components. Extremophiles 13, 67 – 79.
Emde, K. M. E., Smith, D. W., Facey, R. (1992). Initial investigation of microbially influenced corrosion (MIC) in a low temperature water distribution system. Water Research 26, 169 – 175.
Emtiazi, F., Schwartz, T., Marten, S. M., Krolla-Sidenstein, P., Obst, U. (2004). Investigation of natural biofilms formed during the production of drinking water from surface water embankment filtration. Water Research 38, 1197 – 1206.
Engelberg-Kulka, H., Hazan, R. (2003). Cannibals defy starvation and avoid sporulation. Science 301, 467 – 468.
References
193
Engelberg-Kulka, H., Amitai, S., Kolodkin-Gal, I., Hazan, R. (2006). Bacterial programmed cell death and multicellular behavior in bacteria. PLoS Genetics 2, e135.
Erni, R., Rossell, M. D., Kisielowski, C., Dahmen, U. (2009). Atomic-resolution imaging with a sub-50-pm electron probe. Physical Review Letters 102, 096101.
Espeland, E. M., Wetzel, R. G. (2001). Effects of photosynthesis on bacterial phosphatase production in biofilms. Microbial Ecology 42, 328 – 337.
Evans, E., Brown, M. R. W., Gilbert, P. (1994). Iron chelator, exopolysaccharide and protease production in Staphylococcus epidermidis: a comparative study of the effects of specific growth rate in biofilm and planktonic culture. Microbiology 140, 153 – 157.
Fang, H. P., Jia, X. S. (1996). Extraction of extracellular polymers from anaerobic sludges. Biotechnology Techniques 10, 803 – 808.
Farag, A. M., Nimick, D. A., Kimball, B. A., Church, S. E., Harper, D. D., Brumbaugh, W. G. (2007). Concentrations of metals in water, sediment, biofilm, benthic macroinvertebrates, and fish in the Boulder River watershed, Montana, and the role of colloids in metal uptake. Archives of Environmental Contamination and Toxicology 52, 397 – 409.
Farrah, S. R., Unz, R. F. (1976). Isolation of exocellular polymer from Zoogloea strains MP6 and 106 and from activated sludge. Applied and Environmental Microbiology 32, 33 – 37.
Filisetti-Cozzi, T.M., Carpita, N.C. (1991). Measurement of uronic acids without interference of neutral sugars. Analytical Biochemistry 197, 157 – 162.
Fiume, L., Bucci Sabattini, M. A., Poda, G. (2005). Detection of Legionella pneumophila in water samples by species-specific real-time and nested PCR assays. Letters in Applied Microbiology 41, 470 – 475.
Flemming, H.-C. (1998). Relevance of biofilms for the biodeterioration of surfaces of polymeric materials. Polymer Degradation and Stability 59, 309 – 315.
Flemming, H.-C., Wingender, J. (2001). Biofilme - die bevorzugte Lebensform der Bakterien: Flocken, Filme und Schlämme. Biologie in unserer Zeit 31, 169 – 180.
Flemming, H.-C. (2002). Biofouling in water systems - cases, causes, countermeasures. Applied Microbiology and Biotechnology 59, 629 – 640.
Flemming, H.-C., Percival, S., Walker, J. T. (2002). Contamination potential of biofilms in drinking water distribution systems. Water Science and Technology: Water Supply 2, 271 – 280.
Flemming, H.-C., Wingender, J. (2002). Extracellular polymeric substances (EPS): structure, ecological and technical aspects. In: Encyclopedia of Environmental Microbiology, Vol. 3, pp. 1223 – 1231. Bitton, G. (Ed.), Wiley, New York.
Flemming, H.-C., Wingender, J. (2003). The crucial role of extracellular polymeric substances in biofilms. In: Biofilms in Wastewater Treatment: An Interdisciplinary Approach, pp. 178 – 210. Wuertz S., Bishop, P.L., Wilderer, P.A. (Eds.), IWA Publishing, London.
Flemming, H.-C., Neu, T. R., Wozniak, D. (2007). The EPS matrix: the „house of biofilm cells“. Journal of Bacteriology 189, 7945 – 7947.
Flemming, H.-C., Wingender, J. (2010). The biofilm matrix. Nature Reviews Microbiology 8, 623 – 633.
Flemming, H.-C. (2011). Microbial Biofouling: Unsolved problems, insufficient approaches, and possible solutions. In: Biofilm Highlights. Springer Series on Biofilms, Vol. 5, pp. 81 – 109. Flemming, H.-C., Wingender, J., Szewzyk, U. (Eds.), Springer Heidelberg, Berlin.
Flemming, H.-C., Bendinger, B., Exner, M., Kistemann, T., Schaule, G., Szewzyk, U., Wingender, J. (2012). The last meters before the tap: where drinking water quality is at risk. In: Microbial growth in drinking water distribution systems and tap water installations. van der Kooij, D., van der Wielen, P. (Eds.), IWA Publishing, in press.
Fletcher, M., Loeb, G. I. (1979). Influence of substratum characteristics on the attachment of marine pseudomonad to solid surfaces. Applied and Environmental Microbiology 37, 67 – 72.

References
194
Forster, C. F., Clarke, A. R. (1983). The production of polymer from activated sludge by ethanolic extraction and its relation to treatment plant operation. Water Pollution Control 82, 430 – 433.
Forster, C. F., Quarmby, J. (1995). The physical characteristics of anaerobic granular sludges in relation to their internal architecture. Antonie van Leeuwenhoek 67, 103 – 110.
Frings, C. S., Fendley, T. W., Dunn, R. T., Queen, C. A. (1972). Improved determination of total serum lipids by the sulfo-phospho-vanillin reaction. Clinical Chemistry 18, 673 – 674.
Frølund, B., Griebe, T., Nielsen, P. H. (1995). Enzymatic activity in the activated-sludge floc matrix. Applied Microbiology and Biotechnology 43, 755 – 761.
Frølund, B., Palmgren, R., Keiding, K., Nielsen, P.H. (1996). Extraction of extracellular polymers from activated sludge using a cation exchange resin. Water Research 30, 1749 – 1758.
Fronzes, R., Christie, P. J., Waksman, G. (2009). The structural biology of type IV secretion systems. Nature Reviews Microbiology 7, 703 – 714.
Fux, C. A., Costerton, J. W., Stewart, P. S., Stoodley, P. (2005). Survival strategies of infectious biofilms. Trends in Microbiology 13, 34 – 40.
Gaborieau, M., Castignolles, P. (2011). Size-exclusion chromatography (SEC) of branched polymers and polysaccharides. Analytical and Bioanalytical Chemistry 399, 1413 – 1423.
Gadd, G. M. (2000). Bioremedial potential of microbial mechanisms of metal mobilization and immobilization. Current Opinion in Biotechnology 11, 271 – 279.
Gadd, G. M. (2010). Metals, minerals and microbes: geomicrobiology and bioremediation. Microbiology 156, 609 – 643.
Garber, N., Guempel, U., Belz, A., Gilboa-Garber, N., Doyle, R. J. (1992). On the specificity of the D-galactose-binding lectin (PA-1) of Pseudomonas aeruginosa and its strong binding to hydrophobic derivatives of D-galactose and thiogalactose. Biochimica et Biophysica Acta 1116, 331 – 333.
Garcia-Contreras, R., Zhang, X.-S., Kim, Y., Wood, T. K. (2008). Protein translation and cell death: the role of rare tRNAs in biofilm formation and in activating dormant phage killer genes. PLoS ONE 3, e2394.
Garfin, D., Heerdt, L. (2000). 2-D electrophoresis for proteomics: A methods and products manual. Bio-Rad bulletin 2651.
Gaudy, E., Wolfe, R. S. (1962). Composition of an extracellular polysaccharide produced by Sphaerotilus natans. Applied Microbiology 10, 200 – 205.
Geesey, G.G. (1982). Microbial exopolymers: ecological and economic considerations. ASM News 48, 9 – 14.
Gehr, R., Henry, J. G. (1983). Removal of extracellular material: techniques and pitfalls. Water Research 12, 1743 – 1748.
Gehrke, T., Telegdi, J., Thierry, D., Sand, W. (1998). Importance of extracellular polymeric substances from Thiobacillus ferrooxidans for bioleaching. Applied Environmental Microbiology 64, 2743 – 2747.
Gerdes, K., Christensen, S. K., Løbner-Olesen, A. (2005). Prokaryotic toxin-antitoxin stress response loci. Nature Reviews Microbiology 3, 371 – 382.
German Copper Institute (2010). Die fachgerechte Kupferrohr-Installation. Informationsdruck i.158. Überarbeitete Auflage.
Ghezzi, J. I., Steck, T. R. (1999). Induction of the viable but non-culturable condition in Xanthomonas campestris pv. campestris in liquid microcosms and sterile soil. FEMS Microbiology Ecology 30, 203 – 208.
Gião, M. S., Wilks, S. A., Azevedo, N. F., Vieira, M. J., Keevil, C. W. (2009). Comparison between standard culture and peptide nucleic acid 16S rRNA hybridization quantification to study the influence of physico-chemical parameters on Legionella pneumophila survival in drinking water biofilms. Biofouling 25, 343 – 351.
Gilbert, P., Collier, P. J., Brown, M. R. W. (1990). Influence of growth rate on susceptibility to antimicrobial agents: biofilms, cell cycle, dormancy, and stringent response. Antimicrobial Agents and Chemotherapy 34, 1865 – 1868.
References
195
Goel, R., Mino, T., Satoh, H., Matsuo, T. (1998). Comparison of hydrolytic enzyme systems in pure culture and activated sludge under different electron acceptor conditions. Water Science and Technology 37(4-5), 335 – 343.
Görg, A., Weiss, W., Dunn, M. J. (2004). Current two-dimensional electrophoresis technology for proteomics. Proteomics 4, 3665 – 3685.
Grey, B. E., Steck, T. R. (2001a). The viable but nonculturable state of Ralstonia solanacearum may be involved in long-term survival and plant infection. Applied and Environmental Microbiology 67, 3866 – 3872.
Grey, B., Steck, T. R., (2001b). Concentrations of copper though to be toxic to Escherichia coli can induce the viable but nonculturable condition. Applied and Environmental Microbiology 67, 5325 – 5327.
Grossart, H. P., Steward, G. F., Martinez, J., Azam, F. (2000). A simple, rapid method for demonstrating bacterial flagella. Applied and Environmental Microbiology 66, 3632 – 3636.
Gruter, M., Leeflang, B. R., Kuiper, J., Kamerling, J. P., Vliegenthart, J. F. g. (1993). Structural characterisation of the exopolysaccharide produced by Lactobacillus delbrückii subspecies bulgaricus rr grown in skimmed milk. Carbohydrate research 239, 209 – 226.
Guibaud, G., Tixier, N., Bouju, A., Baudu, M. (2003). Relation between extracellular polymers’ composition and its ability to complex Cd, Cu and Pb. Chemosphere 52, 1701 – 1710.
Guibaud, G., van Hullebusch, E., Bordas, F., d’Abzac, P., Joussein, E. (2009). Sorption of Cd(II) and Pb(II) by exopolymeric substances (EPS) extracted from activated sludges and pure bacterial strains: Modeling of the metal/ligand ratio effect and role of the mineral fraction. Bioresource Technology 100, 2959 – 2968.
Gutierrez-Gonzalvez, M. G., Armas-Portela, R., Stockert, J. C. (1987). Differential staining of biological structures by ruthenium red. Journal of Microscopy 145, 333 – 340.
Gygi, S. P., Rist, B., Gerber, S. A., Turecek, F., Gelb, M. H., Aebersold, R. (1999). Quantitative analysis of complex protein mixtures using isotope-coded affinity tags. Nature Biotechnology 17, 994 – 999.
Hall-Stoodley, L., Costerton, J.W., Stoodley, P. (2004). Bacterial biofilms: from the natural environment to infectious diseases. Nature Reviews Micobiology 2, 95 – 108.
Han, D. K., Eng, J., Zhou, H., Aebersold, R. (2001). Quantitative profiling of differentiation-induced microsomal proteins using isotope-coded affinity tags and mass spectrometry. Nature Biotechnology 19, 946 – 951.
Hannig, C., Follo, M., Hellwig, E., Al-Ahmad, A. (2010). Visualization of adherent micro-organisms using different techniques. Journal of Medical Microbiology 59, 1 – 7.
Hansma, H. G., Pietrasanta, L. (1998). Atomic force microscopy and other scanning probe microscopies. Current Opinion in Chemical Biology 2, 579 – 584.
Harland, C. W., Botyanszki, Z., Rabuka, D., Bertozzi, C. R., Parthasarathy, R. (2009). Synthetic trehalose glycolipids confer desiccation resistance to supported lipid monolayers. Langmuir 25, 5193 – 5198.
Harris, R. F. (1981). Effect of water potential on microbial growth and activity. In: Water Potential Relations in Soil Microbiology. Soil Science Society of America Special Publication, Vol. 9, pp. 23 – 95. Parr., J. F., Gardner, W. R., Elliot, L. F. (Eds.), Soil Science Society of America, Madison.
Hausner, M., Wuertz, S. (1999). High rates of conjugation in bacterial biofilms as determined by quantitative in situ analysis. Applied and Environmental Microbiology 65, 3710 – 3713.
Hebbar, K. P., Gueniot, B., Heyraud, A., Colin-Morel, P., Heulin, T., Blandreau, J., Rinaudo, M. (1992). Characterization of exopolysaccharides produced by Rhizobacteria. Applied Microbiology and Biotechnology 38, 248 – 253.
Hejzlar, J., Chudoba, J. (1986). Microbial polymers in the aquatic environment - I: production by activated sludge microorganisms under different conditions. Water Research 20, 1209 – 1216.
Henrici, A. T. (1933). Studies of freshwater bacteria: I. A direct microscopic technique. Journal of Bacteriology 25, 277 – 287.
Higgins, M. J., Novak, J. T. (1997). Characterization of exocellular protein and its role in bioflocculation. Journal of Environmental Engineering 123, 479 – 485.
References
196
Hinsa, S. M., Espinosa-Urgel, M., Ramos, J. L., O’Toole, G. A. (2003). Transition from reversible to irreversible attachment during biofilm formation by Pseudomonas fluorescens WCS365 requires an ABC transporter and a large secreted protein. Molecular Microbiology 49, 905 – 918.
Hirose, I., Sano, K., Shioda, I., Kumano, M., Nakamura, K., Yamane, K. (2000). Proteome analysis of Bacillus subtilis extracellular proteins: a two-dimensional protein electrophoretic study. Microbiology 146, 65 – 75.
Hoefel, D., Monis, P. T., Grooby, W. L., Andrews, S., Saint, C. P. (2005). Profiling bacterial survival through a water treatment process and subsequent distribution system. Journal of Applied Microbiology 99, 175 – 186.
Hoekstra, D., van der Laan, J. W., de Leij, L., and Witholt, B. (1976). Release of outer membrane fragments from normally growing Escherichia coli. Biochimica et Biophysica Acta 455, 889 – 899.
Holloway, C. F., Cowen, J. P. (1997). Development of a scanning confocal laser microscopic technique to examine the structure and composition of marine snow. Limnology and Oceanography 42, 1340 – 1352.
Hood, M. A., Schmidt, J. M. (1996). The examination of Seliberia stellata exopolymer using lectin assays. Microbial Ecology 31, 281 – 290.
Hoppe, H. G. (1991). Microbial extracellular enzyme activity: A new key parameter in aquatic ecology. In: Microbial Enzymes in Aquatic Environments, pp. 60 – 83. Chróst, R. J. (Ed.), Springer-Verlag, New York.
Horan, N. J., Eccles, C. R. (1986). Purification and characterization of extracellular polysaccharide from activated sludges. Water Research 20, 1427 – 1432.
Huang, Z., You, W., Haugland, R. P., Paragas, V. B., Olson, N. A., Haugland, R. P (1993). A novel fluorogenic substrate for detecting alkaline phosphatase activity in situ. Journal of Histochemistry and Cytochemistry 41, 313 – 317.
Huang, C.-T., Xu, K. D., McFeters, G. A., Stewart, P. S. (1998). Spatial patterns of alkaline phosphatase expression within bacterial colonies and biofilms in response to phosphate starvation. Applied and Environmental Microbiology 64, 1526 – 1531.
Huang, W. E., Ude, S., Spiers, A. J. (2007). Pseudomonas fluorescens SBW25 biofilm and planktonic cells have differentiable Raman spectral profiles. Microbial Ecology 53, 471 – 474.
Hueck, C. J. (1998). Type III protein secretion systems in bacterial pathogens of animals and plants. Microbiology and Molecular Biology Reviews 62, 379 – 433.
Ivleva, N. P., Wagner, M., Szkola, A., Horn, H., Niessner, R., Haisch, C. (2010). Label-free in situ SERS imaging of biofilms. The Journal of Physical Chemistry B 114, 10184 – 10194.
Jahn, A., Nielsen, P.H. (1995). Extraction of extracellular polymeric substances (EPS) from biofilms using a cation exchange resin. Water Science and Technology 32(8), 157 – 164.
Jann, B., Shashkov, A. S., Kochanowski, H., Jann, K. (1994). Structure of the O16 polysaccharide from Escherichia coli O16:K1: an NMR investigation. Carbohydrate Research 264, 305 – 311.
Jann, K., Jann, B., Schmidt, M. A., Vann, W. F. (1980). Structure of the Escherichia coli K2 capsular antigen, a teichoic acid-like polymer. Journal of Bacteriology 143, 1108 – 1115.
Jia, X. S., Furumai, H., Fang, H. H. P. (1996). Yields of biomass and extracellular polymers in four aerobic sludges. Environmental Technology 17, 283 – 291.
Jiao, Y., D’haeseleer, P., Dill, B. D., Shah, M., Verberkmoes, N. C., Hettich, R. L., Banfield, J. F., Thelen, M. P. (2011). Identification of biofilm matrix-associated proteins from an acid mine drainage microbial community. Applied and Environmental Microbiology 77, 5230 – 5237.
Johnsen, A. R., Hausner, M., Schnell, A., Wuertz, S. (2000). Evaluation of fluorescently labelled lectins for noninvasive localization of extracellular polymeric substances in Sphingomonas biofilms. Applied and Environmental Microbiology 66, 3487 – 3491.
Jones, S. E., Lock, M. A. (1989). Hydrolytic extracellular enzyme activity in heterotrophic biofilms from two contrasting streams. Freshwater Biology 22, 289 – 296.
Jones, S. E., Lock, M. A. (1991). Peptidase activity in river biofilms by product analysis. In: Mcrobial Enzymes in Aquatic Environments, pp 144 – 154. Chróst, R. J. (Ed.), Springer-Verlag, New York.
References
197
Jorand, F., Zartarian, F., Thomas, F., Block, J. C., Bottero, J. Y., Villemin, G., Urbain, V., Manem, J. (1995). Chemical and structural (2D) linkage between bacteria within activated sludge flocs. Water Research 29, 1639 – 1647.
Juhna, T., Birzniece, D., Larsson, S., Zulenkovs, D., Sharipo, A., Azevedo, N. F., Menard-Szczebara, F., Castagnet, S., Feliers, C., Keevil, C. W. (2007). Detection of Escherichia coli in biofilms from pipe samples and coupons in drinking water distribution networks. Applied and Environmental Microbiology 73, 7456 – 7464.
Junelles, A. M., Kanouni, A. E., Petitdemange, H., Gay, R. (1989). Influence of acetic and butyric acid addition on polysaccharide formation by Clostridium acetobutylicum. Journal of Industrial Microbiology 4, 121 – 125.
Kadurugamuwa, J. L., Mayer, A., Messner, P., Sara, M., Sleytr, U. B., and Beveridge, T. J. (1998). S-layered Aneurinibacillus and Bacillus spp. are susceptible to the lytic action of Pseudomonas aeruginosa membrane vesicles. Journal of Bacteriology 180, 2306 – 2311.
Kalmbach, S., Manz, W., Szewzyk, U. (1997). Dynamics of biofilm formation in drinking water: phylogenetic affiliation and metabolic potential of single cells assessed by formazan reduction and in situ hybridization. FEMS Microbiology Ecology 22, 265 – 279.
Kang, D., Gho, Y. S., Suh, M., Kang, C. (2002). Highly sensitive and fast protein detection with Coomassie Brilliant Blue in sodium dodecyl sulfate-polyacrylamide gel electrophoresis. Bulletin of the Korean Chemical Society 23, 1511 – 1512.
Kaplan, J. B., Ragunath, C., Ramasubbu, N., Fine, D. H. (2003). Detachment of Actinobacillus actinomycetemcomitans biofilm cells by an endogenous ß-hexosaminidase activity. Journal of Bacteriology 185, 4693 – 4698.
Kaplan, J. B., Ragunath, C., Velliyagounder, K., Fine, D. H., Ramasubbu, N. (2004). Enzymatic detachment of Staphylococcus epidermidis biofilms. Antimicrobial Agents and Chemotherapy 48, 2633 – 2636.
Karapanagiotis, N. K., Rudd, T., Sterritt, R. M., Lester, J. N. (1989). Extraction and characterisation of extracellular polymers in digested sewage sludge. Journal of Chemical Technology and Biotechnology 44, 107 – 120.
Karatan, E., Watnick, P. (2009). Signals, regulatory networks, and materials that build and break bacterial biofilms. Microbiology and Molecular Biology Reviews 73, 310 – 347.
Karkhanis, Y. D., Zeltner, J. Y., Jackson, J. J., Carlo, D. J. (1978). A new and improved microassay to determine 2-keto-3-deoxyoctonate in lipopolysaccharide of Gram-negative bacteria. Analytical Biochemistry 85, 595 – 601.
Karlyshev, A. V., Wren, B. W. (2001). Detection and initial characterization of novel capsular polysaccharide among diverse Campylobacter jejuni strains using Alcian blue dye. Journal of Clinical Microbiology 39, 279 – 284.
Karthikeyan, S., Wolfaardt, G. M., Korber, D. R., Caldwell, D. E. (1999). Functional and structural responses of a degradative microbial community to substrates with varying degrees of complexity in chemical structure. Microbial Ecology 38, 215 – 224.
Kawaguchi, T., Decho, A. W. (2000). Biochemical characterization of cyanobacterial extracellular polymers (EPS) from modern marine stromatolites (Bahamas). Preparative Biochemistry and Biotechnology 30, 321 – 330.
Keith, L. M., Bender, C. L. (1999). AlgT (σ22
) controls alginate production and tolerance to environmental stress in Pseudomonas syringae. Journal of Bacteriology 181, 7176 – 7184.
Kennedy, A. F., Sutherland, I. W. (1987). Analysis of bacterial exopolysaccharides. Biotechnology and Applied Biochemistry 9, 12 – 19.
Kennedy, J. F., Palva, P. M. G., Corella, M. T. S., Cavalcanti, M. S. M., Coelho, L. C. B. B. (1995). Lectins, versatile proteins of recognition: a review. Carbohydrate Polymers 26, 219 – 230.
Kilb, B., Kuhlmann, B., Eschweiler, B., Preuß, G., Ziemann, E., Schöttler, U. (1998). Community structures of different groundwater habitats investigated using methods of molecular biology. Acta Hydrochimica et Hydrobiologia 26, 349 – 354.
References
198
Kilb, B., Lange, B., Schaule, G., Flemming, H.-C., Wingender, J. (2003). Contamination of drinking water by coliforms from biofilms grown on rubber-coated valves. International Journal of Hygiene and Environmental Health 206, 563 – 573.
Kim, C. W., Koopman, B., Bitton, G. (1994). INT-dehydrogenase activity test for assessing chlorine and hydrogen peroxide inhibition of filamentous pure cultures and activated sludge. Water Research 28, 1117 – 1121.
Kim, B. R., Andersson, J. E., Mueller, S. A., Gaines, W. A., Kendall, A. M. (2002). Literature review – efficacy of various disinfectants against Legionella in water systems. Water Research 36, 4433 – 4444.
Kim, E.-J., Wang, W., Deckwer, W.-D., Zeng, A.-P. (2005). Expression of the quorum-sensing regulatory protein LasR is strongly affected by iron and oxygen concentrations in cultures of Pseudomonas aeruginosa irrespective of cell density. Microbiology 151, 1127 – 1138.
Kimura, S., Kondo, T. (2002). Recent progress in cellulose biosynthesis. Journal of Plant Research 115, 297 – 302.
King, R. O., Forster, C. F. (1990). Effects of sonication on activated sludge. Enzyme and Microbial Technology 12, 109 – 115.
Kistemann, T., Schreiber, C., Völker, S. (2010). Vorkommen mikrobieller Trinkwasserkontaminationen in Hausinstallationen. In: Vermeidung und Sanierung von Trinkwasser-Kontaminationen durch hygienisch relevante Mikroorganismen aus Biofilmen der Hausinstallation, Vol. 54, pp. 31 – 100. Flemming, H.-C. (Ed.), IWW Schriftenreihe Band 54, Mülheim.
Knirel, Y. A. (1990). Polysaccharide antigens of Pseudomonas aeruginosa. Critical Reviews in Microbiology 17, 273 – 304.
Krisch K. (1971). Carboxylic ester hydrolases. In: The Enzymes, Vol. 5, pp. 43 – 69. Boyer, P. D. (Ed.), Academic Press, London.
Korber, D. R., Caldwell, D. E., Costerton, J. W. (1994). Structural analysis of native and pure-culture biofilms using scanning confocal laser microscopy. In: Proceedings of the National Association of Corrosion Engineers (NACE), pp. 347 – 353. Canadian Region Western Conference, Calgary.
Körstgens, V., Flemming, H.-C., Wingender, J., Borchard, W. (2001). Influence of calcium ions on the mechanical properties of a model biofilm of mucoid Pseudomonas aeruginosa. Water Science and Technology 43(6), 49 – 57.
Kuehn, M. J., Kesty, N. C. (2005). Bacterial outer membrane vesicles and the host-pathogen interaction. Genes and Development 19, 2645 – 2655.
Kuhn, D. M., Chandra, J., Mukherjee, P. K., Ghannoum, M. A. (2002). Comparison of biofilms formed by Candida albicans and Candida parapsilosis on bioprosthetic surfaces. Infection and Immununity 70, 878 – 888.
Lamont, H. C., Silvester, W. B., Torrey, J. G. (1987). Nile red fluorescence demonstrates lipid in the envelope of vesicles from N2-fixing cultures of Frankia. Canadian Journal of Microbiology 34, 656 – 660.
Landeen, L. K., Yahya, M. T., Gerba, C. P. (1989). Efficacy of copper and silver ions and reduced levels of free chlorine in inactivation of Legionella pneumophila. Applied and Environmental Microbiology 55, 3045 – 3050.
Langille, S. E., Weiner, R. M. (1998). Spatial and temporal deposition of Hyphomonas strain VP-6 capsules involved in biofilm formation. Applied and Environmental Microbiology 64, 2906 – 2913.
Långmark, J., Storey, M. V., Ashbolt, N. J., Stenstrom, T. A. (2005). Biofilms in an urban water distribution system: measurement of biofilm biomass, pathogens and pathogen persistence within the Greater Stockholm Area, Sweden. Water Science and Technology 52(8), 181 – 189.
Lapeña, M. A., Pardo, C., Gacto, M. (1987). Effect of trehalose and other compounds on the resistance to desiccation by Candida utilis cells. Anales de Biologia 14, 25 – 31.
Larsen, P., Nielsen, J. L., Dueholm, M. S., Wetzel, R., Otzen, D., Nielsen, P. H. (2007). Amyloid adhesins are abundant in natural biofilms. Environmental Microbiology 9, 3077 – 3090.
Larsen, P., Nielsen, J. L., Otzen, D., Nielsen, P. H. (2008). Amyloid-like adhesins produced by floc-forming and filamentous bacteria in activated sludge. Applied and Environmental Microbiology 74, 1517 – 1526.
References
199
Lasa, I., Penadés, J. R. (2006). Bap, a family of surface proteins involved in biofilm formation. Research in Microbiology 157, 99 – 107.
Laspidou, C. S., Rittmann, B. E. (2002). A unified theory for extracellular polymeric substances, soluble microbial products, and active and inert biomass. Water Research 36, 2711 – 2720.
Lattner, D., Flemming, H.-C., Mayer, C. (2003). 13
C-NMR study of the interaction of bacterial alginate with bivalent cations. International Journal of Biological Macromolecules 33, 81 – 88.
Laurent, P., Servais, P. (1995). Fixed bacterial biomass estimated by potential exoproteolytic activity. Canadian Journal of Microbiology 41, 749 – 752.
Lautenschlager, K., Boon, N., Wang, Y., Egli, T., Hammes, F. (2010). Overnight stagnation of drinking water in household taps induces microbial growth and changes in community composition. Water research 44, 4868 – 4877.
Lawrence, J. R., Neu, T. R., Swerhone, G. D. W. (1998a). Application of multiparameter imaging for the quantification of algal, bacterial and exopolymer components of microbial biofilms. Journal of Microbiological Methods 32, 253 – 261.
Lawrence, J. R., Wolfaardt, G. M., Neu, T. R. (1998b). The study of biofilms using confocal laser scanning microscopy. In: Digital analysis of microbes. Imaging, morphometry, fluorimetry and motility techniques and applications, pp. 431 – 465. Wilkinson, M. H. F., Schut, F. (Eds.), Modern microbiological methods series, Wiley, Sussex.
Lawrence, J. R., Neu, T. R. (2003). Microscale analyses of the formation and nature of microbial biofilm communities in river systems. Reviews in Environmental Science and Biotechnology 2, 85 – 97.
LeChevallier, M. W., Babcock, T. M., Lee, R. G. (1987). Examination and characterization of distribution system biofilms. Applied and Environmental Microbiology 53, 2714 – 2724.
LeChevallier, M. W., Norton, C. D., Camper, A., Morin, P., Ellis, B., Jones, W., Rompré, A., Prévost, M., Coallier, J., Servais, P., Holt, D., Delanoue, A., Colbourne, J. (1998). Microbial impact of biological filtration. American Water Works Association Research Foundation, USA.
Lee, D.-G., Lee, J.-H., Kim, S.-J. (2005). Diversity and dynamics of bacterial species in a biofilm at the end of the Seoul water distribution system. World Journal of Microbiology and Biotechnology 21, 155 – 162.
Leis, A., Flemming, H.-C. (2002). Carbon transformations and activity in biofilms. In: Encyclopedia of Environmental Microbiology, Vol. 1, pp. 81 – 92. Bitton, G. (Ed.), Wiley, New York.
Lehtola, M. J., Miettinen, I. T., Keinänen, M. M., Kekki, T. K., Laine, O., Hirvonen, A., Vartiainen, T., Martikainen, P. J. (2004). Microbiology, chemistry and biofilm development in a pilot drinking water distribution system with copper and plastic pipes. Water Research 38, 3769 – 3779.
Lehtola, M. J., Torvinen, E., Kusnetsov, J., Pitkanen, T., Maunula, L., von Bonsdorff, C.-H., Martikainen, P. J., Wilks, S. A., Keevil, C. W., Miettinen, I. T. (2007). Survival of Mycobacterium avium, Legionella pneumophila, Escherichia coli, and caliciviruses in drinking water-associated biofilms grown under high-shear turbulent flow. Applied and Environmental Microbiology 73, 2854 – 2859.
Lehman, R. M., O’Connell, S. P. (2002). Comparison of extracellular enzyme activities and community composition of attached and free-living bacteria in porous medium columns. Applied and Environmental Microbiology 68, 1569 – 1575.
Lemmer, H., Roth, D., Schade, M. (1994). Population density and enzyme activities of heterotrophic bacteria in sewer biofilms and activated sludge. Water Research 28, 1341 – 1346.
Leriche, V., Sibille, P., Carpentier, B. (2000). Use of an enzyme-linked lectinsorbent assay to monitor the shift in polysaccharide composition in bacterial biofilms. Applied and Environmental Microbiology 66, 1851 – 1856.
Lewandowski, Z., Altobelli, S. A., Majors, P. D., Fukushima, E. (1992). NMR imaging of hydrodynamics near microbially colonized surfaces. Water Science and Technology 26(3-4), 577 – 584.
Lewandowski, Z., Stoodley, P., Altobelli, S. (1995). Experimental and conceptual studies on mass transport in biofilms. Water Science and Technology 31(1), 153 – 162.
References
200
Li, X. , Logan, B. E. (2004). Analysis of bacterial adhesion using a gradient force analysis and colloid probe atomic force microscopy . Langmuir 20, 8817 – 8822.
Liu, H., Fang, H. P. (2002). Extraction of extracellular polymeric substances (EPS) of sludges. Journal of Biotechnology 95, 249 – 256.
Liu, H., Fang, H. P. (2003). Influences of extracellular polymeric substances (EPS) on flocculation, settling and dewatering of activated sludge. Critical Reviews in Environmental Science and Technology 33, 237 – 273.
Loewenthal, R. E., Morrison, I., Wentzel, M. C. (2004). Control of corrosion and aggression in drinking water systems. Water Science and Technology 49(2), 9 – 18.
Logan, S. M., Trust, T. J. (1982). Outer membrane characteristics of Campylobacter jejuni. Infection and Immunity 38, 898 – 906.
Lorenz, M. G., Gerjets, D., Wackernagel, W. (1991). Release of transforming plasmid and chromosomal DNA from two cultured soil bacteria. Archives of Microbiology 156, 319 – 326.
Lowry, O. H., Rosenbrough, N. J., Farr, A. L., Randall, R. J. (1951). Protein measurement with the Folin phenol reagent. Journal of Biological Chemistry 193, 265 – 275.
Madsen, J. S., Burmølle, M., Hansen, L. H., Sørensen, S. J. (2012). The interconnection between biofilm formation and horizontal gene transfer. FEMS Immunology and Medical Microbiology 65, 183 – 195.
Majors, P. D., McLean, J. S., Pinchuk, G. E., Fredrickson, J. K., Gorby, Y. A., Minard, K. R., Wind, R. A. (2005). NMR methods for in situ biofilm metabolism studies. Journal of Microbiological Methods 62, 337 – 344.
Mallet, C., Debroas, D. (2001). Regulation of ß- and α-glycolytic activities in the sediments of a eutrophic lake. Microbial Ecology 41, 106 – 113.
Manca, M. C., Lama, L., Improta, R., Esposito, E., Gambacorta, A., Nicolaus, B. (1996). Chemical composition of two exopolysaccharides from Bacillus thermoantarcticus. Applied and Environmental Microbiology 62, 3265 – 3269.
Manz, W., Amann, R., Ludwig, W., Wagner, M., Schleifer, K.-H. (1992). Phylogenetic oligodeoxynucleotide probes for the major subclasses of proteobacteria: problems and solutions. Systematic and Applied Microbiology 15, 593 – 600.
Manz, W., Szewzyk, U., Ericsson, P., Amann, R., Schleifer, K. H., Stenstron, T. A. (1993). In-situ identification of bacteria in drinking water and adjoining biofilms by hybridization with 16S ribosomal RNA directed and 23S ribosomal RNA directed fluorescent oligonucleotide probes. Applied Environmental Microbiology 59, 2293 – 2298.
Manz, W., Amann, R., Szewzyk, R., Szewzyk, U., Stenstrom, T. A., Hutzler, P., Schleifer, K. H. (1995). In situ identification of Legionellaceae using 16S rRNA-targeted oligonucleotide probes and confocal laser scanning microscopy. Microbiology 141, 29 – 39.
Manz, W., Wendt-Potthoff, K., Neu, T. R., Szewzyk, U., Lawrence, J. R. (1999). Phylogenetic composition, spatial structure, and dynamics of lotic bacterial biofilms investigated by fluorescent in situ hybridization and confocal laser scanning microscopy. Microbial Ecology 37, 225 – 237.
Manz, B., Volke, F., Goll, D., Horn, H. (2003). Measuring local flow velocities and biofilm structure in biofilm systems with magnetic resonance imaging (MRI). Biotechnology and Bioengineering 84, 424 – 432.
Marshall, K. C. (1992). Biofilms: an overview of bacterial adhesion, activity and control at surfaces. ASM News 58, 202 – 207.
Martiny, A. C., Jorgensen, T. M., Albrechtsen, H.-J., Arvin, E., Molin, S. (2003). Long-term succession of structure and diversity of a biofilm formed in a model drinking water distribution system. Applied and Environmental Microbiology 69, 6899 – 6907.
Mathieu, L., Bouteleux, C., Fass, S., Angel, E., Block, J. C. (2009). Reversible shift in the alpha-, beta- and gamma-proteobacteria populations of drinking water biofilms during discontinuous chlorination. Water Research 43, 3375 – 3386.
References
201
Matsushita, K., Adachi, O., Shinagawa, E., Ameyama, M. (1978). Isolation and characterization of outer and inner membranes from Pseudomonas aeruginosa and effect of EDTA on the membranes. Journal of Biochemistry 83, 171 – 181.
Mattila, K., Carpen, L., Hakkarainen, T., Salkinoja-Salonen, M. S. (1997). Biofilm development during ennoblement of stainless steel in baltic sea water: a microscopic study. International Biodeterioration and Biodegradation 40, 1 – 10.
May, T. B., Chakrabarty, A. M. (1994). Isolation and assay of Pseudomonas aeruginosa alginate. Methods in Enzymology 235, 295 – 304.
Mayansky, A. N., Chebotar, I. V., Rudneva, E. I., Chistyakova, V. P. (2012). Pseudomonas aeruginosa: characteristics of the biofilm process. Molecular Genetics, Microbiology and Virology 27, 1 – 6.
Mayer, C., Moritz, R., Kirschner, C., Borchard, W., Maibaum, R., Wingender, J., Flemming, H.-C. (1999). The role of intermolecular interactions studies on model systems for bacterial biofilms. International Journal of Biological Macromolecules 26, 3 – 16.
Mayer, C., Lattner, D., Schürks, N. (2001). 13
C NMR studies on selectively labeled bacterial biofilms. Journal of Industrial Microbiology and Biotechnology 26, 62 – 69.
McDougald, D., Rice, S. A., Barraud, N., Steinberg, P. D., Kjelleberg, S. (2012). Should we stay or should we go: mechanisms and ecological consequences for biofilm dispersal. Nature Reviews Microbiology 28, 39 – 50.
Measures, J. C. (1975). Role of amino acids in osmoregulation of non-halophilic bacteria. Nature 257, 398 – 400.
Meisen, S., Wingender, J., Telgheder, U. (2008). Analysis of microbial extracellular polysaccharides in biofilms by HPLC. Part I: Development of the analytical method using two complementary stationary phases. Analytical and Bioanalytical Chemistry 391, 993 – 1002.
Mikolay, A., Huggett, S., Tikana, L., Grass, G., Braun, J., Nies, D. H. (2010). Survival of bacteria on metallic copper surfaces in a hospital trial. Applied Microbiology and Biotechnology 87, 1875 – 1879.
Miksch, K. (1985). Auswahl einer optimalen Methodik für die Aktivitätsbestimmung des Belebtschlammes mit Hilfe des TTC-Test. Vom Wasser 64, 187 – 198.
Mistry, K., Krull, I., Grinberg, N. (2003). Size-exclusion capillary electrochromatographic separation of polysaccharides using polymeric stationary phases. Electrophoresis 24, 1753 – 1763.
Molecular Probes (2008). Handbook of fluorescent probes and research chemicals. 11th
edition. Eugene, OR: Molecular Probes.
Molin, S., Tolker-Nielsen, T. (2003). Gene transfer occurs with enhanced efficiency in biofilms and induces enhanced stabilisation of the biofilm structure. Current Oppinion in Biotechnology 14, 255 – 261.
Morgan, J. W., Forster, C. F., Evison, L. (1990). A comparative study of the nature of biopolymers extracted from anaerobic and activated sludges. Water Research 24, 743 – 750.
Moritz, M. M., Flemming, H.-C., Wingender, J. (2010). Integration of Pseudomonas aeruginosa and Legionella pneumophila in drinking water biofilms grown on domestic plumbing materials. International Journal of Hygiene and Environmental Health 213, 190 – 197.
Moritz, M. M. (2011). Integration of hygienically relevant bacteria in drinking water biofilms grown on domestic plumbing materials. Dissertation, University of Duisburg-Essen, Germany.
Morse, E. E. (1947). Anthrone in estimating low concentrations of sucrose. Analytical Chemistry 19, 1012 – 1013.
Murga, R., Forster, T. S., Brown, E., Pruckler, J. M., Fields, B. S., Donlan RM (2001). Role of biofilms in the survival of Legionella pneumophila in a model potable-water system. Microbiology 147, 3121 – 3126.
Murray, A. E., Hollibaugh, J. T., Orrego, C. (1996). Phylogenetic composition of bacterioplankton from two California estuaries compared by denaturing gradient gel electrophoresis of 16S rDNA fragments. Applied and Environmental Microbiology 62, 2676 – 2680.
References
202
Muto, Y., Goto, S. (1986). Transformation by extracellular DNA produced by Pseudomonas aeruginosa. Microbiology and Immunology 30, 621 – 628.
Muyzer, G., de Waal, E. C., Uitterlinden, A. G. (1993). Profiling of complex microbial populations by denaturing gradient gel electrophoresis analysis of polymerase chain reaction-amplified genes coding for 16S rRNA. Applied and Environmental Microbiology 59, 695 – 700.
Nandakumar, M. P., Cheung, A., Marten, M. R. (2006). Proteomic analysis of extracellular proteins from Escherichia coli W3110. Journal of Proteome Research 5, 1155 – 1161.
Naito, T., Kusano, K., Kobayashi, I. (1995). Selfish behavior of restriction-modification systems. Science 267, 897 – 899.
Nelson, R., Sawaya, M. R., Balbirnie, M., Madsen, A. Ø., Riekel, C., Grothe, R., Eisenberg, D. (2005). Structure of the cross-β spine of amyloid-like fibrils. Nature 435, 773 – 778.
Neu, T. R., Marshall, K. C. (1991). Microbial "footprints" – a new approach to adhesive polymers. Biofouling 3, 101 – 112.
Neu, T. R., Lawrence, J. R. (1997). Development and structure of microbial biofilms in river water studied by confocal laser scanning microscopy. FEMS Microbiology Ecology 24, 11 – 25.
Neu, T. R., Lawrence, J. R. (1999). Lectin-binding analysis in biofilm systems. Methods in Enzymology 310, 145 – 152.
Neu, T. R., Swerhone, G. D. W., Lawrence, J. R. (2001). Assessment of lectin-binding analysis for in situ detection of glycoconjugates in biofilm systems. Microbiology 147, 299 – 313.
Neu, T. R., Swerhone, G. D. W., Böckelmann, U., Lawrence, J. R. (2005). Effect of CNP on composition and structure of lotic biofilms as detected with lectin-specific glycoconjugates. Aquatic Microbial Ecology 38, 283 – 294.
Neurath, A. R. (1966). Interference of sodium ethylenediaminetetraacetate in the determination of proteins and its elimination. Experientia 22, 290.
Ng, F. M.-W., Dawes, E. A. (1973). Chemostat studies on the regulation of glucose metabolism in Pseudomonas aeruginosa by citrate. Biochememical Journal 132, 129 – 140
Nielsen, P. H., Frølund, B., Spring, S., Caccavo, F. (1997). Microbial Fe(III) reduction in activated sludge. Systematic and Applied Microbiology 20, 645 – 651.
Nielsen, P. H., Keiding, K. (1998). Disintegration of activated sludge flocs in presence of sulfide. Water Research 32, 313 – 320.
Nielsen, P. H., Jahn, A. (1999). Extraction of EPS. In: Microbial extracellular polymeric substances, pp. 49 – 72. Wingender, J., Neu, T.R., Flemming, H.-C. (Eds.), Springer Verlag, Berlin.
Nielsen, A. T., Tolker-Nielsen, T., Barken, K. B., Molin, S. (2000). Role of commensal relationships on the spatial structure of a surface-attached microbial consortium. Environmental Microbiology 2, 59 – 68.
Nies, D. H., Silver, S. (1995). Ion efflux systems involved in bacterial metal resistances. Journal of Industrial Microbiology and Biotechnology 14, 186 – 199.
Nishikawa, S., Kuriyama, M. (1968). Nucleic acid as a component of mucilage in activated sludge. Water Research 2, 811 – 812.
Nithya, C., Begum, M. F., Pandian, S. K. (2010). Marine bacterial isolates inhibit biofilm formation and disrupt mature biofilms of Pseudomonas aeruginosa PAO1. Applied Microbiology and Biotechnology 88, 341 – 358.
Nivens, D. E., Chambers, J. Q., Anderson, T. R., White, D. C. (1993). Long-term, on-line monitoring of microbial biofilms using a quartz crystal microbalance. Analytical Chemistry 65, 65 – 69.
Nocker, A., Sossa-Fernandez, P., Burr, M. D., Camper, A. K. (2007). Use of propidium monoazide for live/dead distinction in microbial ecology. Applied and Environmental Microbiology 73, 5111 – 5117.
References
203
Nouwens, A. S., Beatson, S. A., Whitchurch, C. B., Walsh, B. J., Schweizer, H. P., Mattick, J. S., Cordwell, S. J. (2003). Proteome analysis of extracellular proteins regulated by the las and rhl quorum sensing systems in Pseudomonas aeruginosa PAO1. Microbiology 149, 1311 – 1322.
Noyce, J. O., Michels, H., Keevil, C. W. (2006). Potential use of copper surfaces to reduce survival of epidemic meticillin-resistant Staphylococcus aureus in the healthcare environment. The Journal of hospital infection 63, 289 – 297.
Nybroe, O., Jørgensen, P. E., Henze, M. (1992). Enzyme activities in wastewater and activated sludge. Water Research 26, 579 – 584.
O’Connell, D. (2007). Biofilms to die for… . Nature Reviews Microbiology 5, 398.
O’Ferrell, P. H. (1975). High resolution two-dimensional electrophoresis of proteins. The Journal of Biological Chemistry 250, 4007 – 4021.
O’Toole, G., Kaplan, H.B., Kolter, R. (2000). Biofilm formation as microbial development. Annual Review of Microbiology 54, 49 – 79.
Okabe, S., Satoh, H., Watanabe, Y. (1999). In situ analysis of nitrifying biofilms as determined by in situ hybridization and the use of microelectrodes. Applied and Environmental Microbiology 65, 3182 – 3191.
Okabe, S., Kindaichi, T., Ito, T. (2005). Fate of 14
C-labeled microbial products derived from nitrifying bacteria in autotrophic nitrifying biofilms. Applied and Environmental Microbiology 71, 3987 – 3994.
Oliver, J. D. (2005). The viable but nonculturable state in bacteria. Journal of Microbiology 43 spec. issue, 93 –100.
Omar, A. S., Weckesser, J., Mayer, H. (1983). Different polysaccharides in the external layers (capsule and slime) of the cell envelope of Rhodopseudomonas capsulata Sp11. Archives of Microbiology 136, 291 – 296.
Omoike, A., Chorover, J. (2004). Spectroscopic study of extracellular polymeric substances from Bacillus subtilis: aqueous chemistry and adsorption effects. Biomacromolecules 5, 1219 – 1230.
Ordax, M., Marco-Noales, E., López, M. M., Biosca, E. G. (2006). Survival strategy of Erwinia amylovora against copper: induction of the viable-but-nonculturable state. Applied and Environmental Microbiology 72, 3482 – 3488.
Palmgren, R., Nielsen, P.H. (1996). Accumulation of DNA in the exopolymeric matrix of activated sludge and bacterial cultures. Water Science and Technology 34(5-6), 233 – 240.
Pamp, S. J., Gjermansen, M., Tolker-Nielsen, T. (2007). The biofilm matrix: a sticky framework. In: The Biofilm Mode of Life: Mechanisms and Adaptations, pp. 37 – 69. Kjelleberg, S. and Givskov, M. (Eds.), Horizon Scientific Press, London.
Panchaud, A., Hansson, J., Affolter, M., Bel Rhlid, R., Piu, S., Moreillon, P., Kussmann, M. (2008). ANIBAL, stable isotope-based quantitative proteomics by aniline and benzoic acid labeling of amino and carboxylic groups. Molecular and Cellular Proteomics 7, 800 – 812.
Pandey, D. P., Gerdes, K. (2005). Toxin-antitoxin loci are highly abundant in free-living but lost from host-associated prokaryotes. Nucleic Acids Research 33, 966 – 976.
Pantke, M. (1996). General aspects and test methods. In: Microbially Infiuenced Corrosion of Materials - Scientfic and Technological Aspects, pp. 379 – 392. E. Heitz, W. Sand, H.-C. Flemming (Eds.), Springer, Berlin.
Park, C., Novak, J. T. (2007). Characterization of activated sludge exocellular polymers using several cation-associated extraction methods. Water Research 41, 1679 – 1688.
Paul, J. H., Jeffrey, W. H. (1985). Evidence for separate adhesion mechanisms for hydrophilic and hydrophobic surfaces in Vibrio proteolytica. Applied and Environmental Microbiology 50, 431 – 437.
Pavissich, J. P., Vargas, I. T., González, B., Pastén, P. A., Pizarro, G. E. (2010). Culture dependent and independent analyses of bacterial communities involved in copper plumbing corrosion. Journal of Applied Microbiology 109, 771 – 782.
Pavoni, J. L., Tenney, M. W., Echelberger, W. F. (1972). Bacterial exocellular polymers and biological flocculation. Journal of the Water Pollution Control Federation 44, 414 – 431.
References
204
Pedersen, K. (1990). Biofilm development on stainless steel and PVC surfaces in drinking water. Water Research 24, 239 – 243.
Pelkonen, S., Häyrinen, J., Finne, J. (1988). Polyacrylamide gel electrophoresis of capsular polysaccharides of Escherichia coli and other bacteria. Journal of Bacteriology 170, 2646 – 2653.
Pepper, I. L., Rusin, P., Quintanar, D. R., Haney, C., Josephson, K. L., Gerba, C. P. (2004). Tracking the concentration of heterotrophic plate count bacteria from the source to the consumer's tap. International Journal of Food Microbiology 92, 289 – 295.
Percival, S. L., Knapp, J. S., Wales, D. S., Edyvean, R. G. J. (1999). The effect of turbulent flow and surface roughness on biofilm formation in drinking water. Journal of Industrial Microbiology and Biotechnology 22, 152 – 159.
Perkins, D. N., Pappin, D. J. C., Creasy, D. M., Cottrell, J., S. (1999). Probability-based protein identification by searching sequence databases using mass spectrometry data. Electrophoresis 20, 3551 – 3567.
Peterson, G. L. (1977). A simplification of the protein assay method of lowry et al. which is more generally applicable. Analytical Biochemistry 83, 346 – 356.
Peterson, G. L. (1979). Review of the Folin phenol protein quantitation method of Lowry, Rosebrough, Farr and Randall. Analytical Biochemistry 100, 201 – 220.
Petersen, F. C., Pecharki, D., Scheie, A. A. (2004). Biofilm mode of growth of Streptococcus intermedius favored by a competence-stimulating signaling peptide. Journal of Bacteriology 186, 6327 – 6331.
Pierre, G., Graber, M., Rafiliposon, B. A., Dupuy, C., Orvain, F., De Crignis, M., Maugard, T. (2012). Biochemical composition and changes of extracellular polysaccharides (ECPS) produced during microphytobenthic biofilm development (Marennes-Oléron, France). Microbial Ecology 63, 157 – 169.
Prévost, M., Rompré, A., Coallier, J., Servais, P., Laurent, P., Clément, B., Lafrance, P. (1998). Suspended bacterial biomass and activity in full-scale drinking water distribution systems: impact of water treatment. Water Research 32, 1393 – 1406.
Pietramellara, G., Ascher, J., Borgogni, F., Ceccherini, M. T., Guerri, G., Nannipieri, P. (2009). Extracellular DNA in soil and sediment: fate and ecological relevance. Biology and Fertility of Soils 45, 219 – 235.
Pinchuk, G. E., Ammons, C., Culley, D. E., Li, S.-M. W., McLean, J. S., Romine, M. F., Nealson, K. H., Fredrickson, J. K., Beliaev, A. S. (2008). Utilization of eDNA as a sole source of phosphorus, carbon and energy by Shewanella spp.: Ecological and physiological implications for dissimilatory metal reduction. Applied Environmental Microbiology 74, 1198 – 1208.
Platt, R.M., Geesey, G.G., Davis, J.D., White, D.C. (1985). Isolation and partial chemical analysis of firmly bound exopolysaccharide from adherent cells of a freshwater sediment bacterium. Canadian Journal of Microbiology 31, 675 – 680.
Potts, M. (1994). Desiccation tolerance of prokaryotes. Microbiology Reviews 58, 755 – 805.
Pozos, N., Scow, K., Wuertz, S., Darby, J. (2004). UV disinfection in a model distribution system: biofilm growth and microbial community. Water Research 38, 3083 – 3091.
Priester, J. H., Horst, A. M., van de Werfhorst, L. C., Saleta, J. L., Mertes, L. A. K., Holden, P. A. (2007). Enhanced visualization of microbial biofilms by staining and environmental scanning electron microscopy. Journal of Microbiological Methods 68, 577 – 587.
Qin, Z., Ou, Y., Yang, L., Zhu, Y., Tolker-Nielsen, T., Molin, S., Qu, D. (2007). Role of autolysin-mediated DNA release in biofilm formation of Staphylococcus epidermidis. Microbiology 153, 2083 – 2092.
Quarmby, J., Forster, C. F. (1995). An examination of the structure of UASB granules. Water Research 11, 2449 – 2454.
Quintero, E. J., Weiner, R. M. (1995). Evidence for the adhesive function of the exopolysaccharide of Hyphomonas strain MHS-3 in its attachment to surface. Applied and Environmental Microbiology 61, 1897 – 1903.
References
205
Rahman, M. M., Guard-Petter, J., Asokan, K., Carlson, R. W. (1997). The structure of the capsular polysaccharide from a swarming strain of pathogenic Proteus vulgaris. Carbohydrate Research 301, 213 – 220.
Ram, R. J., Verberkmoes, N. C., Thelen, M. P., Tyson, G. W., Baker, B. J., Blake II, R. C., Shah, M., Hettich, R. L., Banfield, J. F. (2005). Community proteomics of a natural microbial biofilm. Science 308, 1915 – 1920.
Ramaswamy, S., Dworkin, M., Downard, J. (1997). Identification and characterization of Myxococcus xanthus mutants deficient in Calcofluor White binding. Journal of Bacteriology 179, 2863 – 2871.
Ras, M., Girbal-Neuhauser, E., Paul, E. M., Sperandio, M., Lefebvre, D. (2008). Protein extraction from activated sludge: An analytical approach. Water Research 42, 1867 – 1878.
Rättö, M., Verhoef, R., Suihko, M.-L., Blanco, A., Schols, H. A., Voragen, A. G. J., Wilting, R., Siika-Aho, M., Buchert, J. (2006). Colanic acid is an exopolysaccharide common to many enterobacteria isolated from paper-machine slimes. Journal of Industrial Microbiology and Biotechnology 33, 359 – 367.
Read, R. R., Costerton, J. W. (1987). Purification and characterization of adhesive exopolysaccharides from Pseudomonas putida and Pseudomonas fluorescens. Canadian Journal of Microbiology 33, 1080 – 1090.
Rémy, A., Imam-Sghiouar, N., Poirier, F., Joubert-Caron, R. (2000). Focusing strategy and influence of conductivity on isoelectric focusing in immobilized pH gradients. Bio-Rad bulletin 2778.
Rendueles, O., Ghigo, J.-M. (2012). Multi-species biofilms: how to avoid unfriendly neighbors. FEMS Microbiology Reviews 36, 972 – 989.
Rice, K. C., Mann, E. E., Endres, J. L., Weiss, E. C., Cassat, J. E., Smeltzer, M. S., Bayles, K. W. (2007). The cidA murein hydrolase regulator contributes to DNA release and biofilm development in Staphylococcus aureus. Proceedings of the National Academy of Sciences 104, 8113 – 8118.
Rice, S. A., Tan, C. H., Mikkelsen, P. J., Kung, V., Woo, J., Tay, M., Hauser, A., McDougald, D., Webb, J. S., Kjelleberg, S. (2009). The biofilm life cycle and virulence of Pseudomonas aeruginosa are dependent on a filamentous prophage. ISME Journal 3, 271 – 282.
Richards, S. R., Turner, R. J. (1984). A comparative study of techniques for the examination of biofilms by scanning electron microscopy. Water Research 18, 767 – 773.
Riemann, L., Steward, G. F., Azam, F. (2000). Dynamics of bacterial community composition and activity during a mesocosm diatom bloom. Applied and Environmental Microbiology 66, 578 – 587.
Rippe, K., Guthold, M., von Hippel, P. H., Bustamante, C. (1997). Transcriptional activation via DNA-looping: visualization of intermediates in the activation pathway of E. coli RNA polymerase σ
54 holoenzyme by scanning
force microscopy. Journal of Molecular Biology 270, 125 – 138.
Roberson, E., Firestone, M. (1992). Relationship between desiccation and exopolysaccharide production in a soil Pseudomonas sp. Applied and Environmental Microbiology 58, 1284 – 1291.
Rode, A. (2004). Isolierung und Charakterisierung von bakteriellen extrazellulären polymeren Substanzen aus Biofilmen. Dissertation, Universty of Duisburg-Essen, Germany.
Rodriguez, G. G., Phipps, D., Ishiguro, K., Ridgway, H. F. (1992). Use of a fluorescent redox probe for direct visualization of actively respiring bacteria. Applied Environmental Microbiology 58, 1801 – 1808.
Roeder, R. S., Heeg, K., Tarne, P., Benölken, J. K., Schaule, G., Bendinger, B., Flemming, H.-C., Szewzyk, U. (2010a). Influence of materials, water qualities and disinfection methods on the drinking water biofilm community. Water Practice and Technology 5, published online.
Roeder, R. S., Lenz, J., Tarne, P., Gebel, J., Exner, M., Szewzyk, U. (2010b). Long-term effects of disinfectants on the community composition of drinking water biofilms. International Journal of Hygiene and Environmental Health 213, 183 – 189.
Rogers, J., Dowsett, A. B., Dennis, P. J., Lee, J. V., Keevil, C. W. (1994). Influence of plumbing materials on biofilm formation and growth of Legionella pneumophila in potable water systems. Applied and Environmental Environmental Microbiology 60, 1842 – 1851.
Romani, A. M., Sabeter, S. (1999). Effect of primary producers on the heterotrophic metabolism of a stream biofilm 41, 729 – 736.
References
206
Romani, A. M., Fund, K., Artigas, J., Schwartz, T., Sabater, S., Obst, U. (2008). Relevance of polymeric matrix enzymes during biofilm formation. Microbial Ecology 56, 427 – 436.
Romero, D., Aguilar, C., Losick, R., Kolter, R. (2009). Amyloid fibers provide structural integrity to Bacillus subtilis biofilms. Proceedings of the National Academy of Sciences 107, 2230 – 2234.
Rosen, H. (1957). A modified ninhydrin colorimetric analysis for amino acids. Archives of Biochemistry and Biophysics 67, 10 – 15.
Rosenzweig, R., Shavit, U., Furman, A. (2012). Water retention curves of biofilm-affected soils using xanthan as an analogue. Soil Science Society of America Journal 76, 61 – 69.
Ross, N. W., Levitan, R., Labelle, J., Schneider, H. (1991). Protein and other compositional differences of the extracellular material from slimy and non-slimy colonies of non-mucoid Pseudomonas aeruginosa. FEMS Microbiology Letters 81, 257 – 260.
Ross, P. L., Huang, Y. N., Marchese, J. N., Williamson, B., Parker, K., Hattan, S., Khainovski, N., Pillai, S., Dey, S., Daniels, S., Purkayastha, S., Juhasz, P., Martin, S., Bertlet-Joens, M., He, F., Jacobson, A., Pappin, D. J. (2004). Multiplexed protein quantitation in Saccharomyces cerevisiae using amine-reactive isobaric tagging reagents. Molecular and Cellular Proteomics 3, 1154 – 1169.
Ross, P., Mayer, R., Benziman, M. (1991). Cellulose biosynthesis and function in bacteria. Microbiological Reviews 55, 35 – 58.
Rudd, T., Sterritt, R. M., Lester, J. (1982). The use of extraction methods for the quantification of extracellular polymer production by Klebsiella aerogenes under varying cultural conditions. Applied Microbiology and Biotechnology 16, 23 – 27.
Rudd, T., Sterritt, R. M., Lester, J. N. (1983). Extraction of extracellular polymers from activated sludge. Biotechnology Letters 5, 327 – 332.
Russel, M. (1998). Macromolecular assembly and secretion across the bacterial cell envelope: type II protein secretion systems. Journal of Molecular Biology 279, 485 – 499.
Ryssov-Nielsen, H. (1975). Measurement of the inhibition of respiration in activated sludge by a modified determination of the TTC-dehydrogenase activity. Water Research 9, 1179 – 1185.
Samek, O., Al-Marashi, J. F. M., Telle, H. H. (2010). The potential of Raman spectroscopy for the identification of biofilm formation by Staphylococcus epidermidis. Laser Physics Letters 7, 378 – 383.
Sand, W., Gehrke, T. (2006). Extracellular polymeric substances mediate bioleaching/biocorrosion via interfacial processes involving iron(III) ions and acidophilic bacteria. Research in Microbiology 157, 49 – 56.
Sanford, B. A., Thomas, V. L., Mattingly, S. J., Ramsay, M. A., Miller, M. M. (1995). Lectin-biotin assay for slime present in in situ biofilm produced by Staphylococcus epidermidis using transmission electron microscopy (TEM). Journal of Industrial Microbiology 15, 156 – 161.
Sato, T., Ose, Y. (1984). Floc-forming substances extracted from activated sludge with ammonium hydroxide and EDTA solutions. Water Science and Technology 17(4-5), 517 – 528.
Sauer, K., Camper, A. K. (2001). Characterization of phenotypic changes in Pseudomonas putida in response to surface-associated growth. Journal of Bacteriology 183, 6579 – 6589.
Sauer, K., Camper, A. K., Ehrlich, G. D., Costerton, J. W., Davies, D. G. (2002). Pseudomonas aeruginosa displays multiple phenotypes during development as a biofilm. Journal of Bacteriology 184, 1140 – 1154.
Schauer, C., Hasselwander, H., Minar, A. (2008). Erfolgreiche Sanierung und Desinfektion einer komplexen Trinkwasseranlage. Energie Wasser-Praxis 4, 30 – 37.
Schaule, G., Flemming, H.-C., Ridgway, H. F. (1993b). The use of CTC in the quantification of respiratory active bacteria in biofilms. Applied and Environmental Microbiology 59, 3850 – 3857.
Schmeisser, C., Stöckigt, C., Raasch, C., Wingender, J., Timmis, K. N., Wenderoth, D. F., Flemming, H.-C., Liesegang, H., Schmitz, R. A., Jaeger, K.-E., Streit, W. R. (2003). Metagenome survey of biofilms in drinking-water networks. Applied and Environmental Microbiology 69, 7298 – 7309.
References
207
Schmidt, M. A., Jann, K. (1982). Phospholipid substitution of capsular (K) polysaccharide antigens from Escherichia coli causing extraintestinal infections. FEMS Microbiology Letters 14, 69 – 74.
Schmidt, J. E., Ahring, B. K. (1994). Extracellular polymers in granular sludge from different upflow anaerobic sludge blanket (UASB) reactors. Applied Microbiology and Biotechnology 42, 457 – 462.
Schmitt, J., Nivens, D., White, D. C., Flemming, H. (1995). Changes of biofilm properties in response to sorbed substances - an FTIR-ATR study. Water Science and Technology 32(8), 149 – 155.
Schneider, T., Riedel, K. (2010). Environmental proteomics: analysis of structure and function of microbial communities. Proteomics 10, 785 – 798.
Schooling, S. R., Beveridge, T. J. (2006). Membrane vesicles: an overlooked component of the matrices of biofilms. Journal of Bacteriology 188, 5945 – 5947.
Schramm, A., Larsen, L. H., Revsbech, N. P., Ramsing, N. B., Amann, R., Schleifer, K. H. (1996). Structure and function of a nitrifying biofilm as determined by in situ hybridization and the use of microelectrodes. Applied and Environmental Microbiology 62, 4641 – 4647.
Schürks, N., Wingender, J., Flemming, H.-C., Mayer, C. (2002). Monomer composition and sequence of alginates from Pseudomonas aeruginosa. International journal of biological macromolecules 30, 105 – 111.
Schwartz, T., Hoffmann, S., Obst, U. (2003). Formation of natural biofilms during chlorine dioxide and u.v. disinfection in a public drinking water distribution system. Journal of Applied Microbiology 95, 591 – 601.
Sesay, M. L., Özcengiz, G., Sanin, F. D. (2006). Enzymatic extraction of activated sludge extracellular polymers and implications on bioflocculation. Water Research 40, 1359 – 1366.
Seymour, J. D., Codd, S. L., Gjersing, E. L., Stewart, P. S. (2004). Magnetic resonance microscopy of biofilm structure and impact on transport in a capillary bioreactor. Journal of Magnetic Resonance 167, 322 – 327.
Sheng, G.-P., Yu, H.-Q., Yu, Z. (2005). Extraction of extracellular polymeric substances from the photosynthetic bacterium Rhodopseudomonas acidophila. Applied Microbiology and Biotechnology 67, 125 – 130.
Sheng, G.-P., Yu, H.-Q., Li, X.-Y. (2010). Extracellular polymeric substances (EPS) of microbial aggregates in biological wastewater treatment systems: A review. Biotechnology Advances 28, 882 – 894.
Sillankorva, S., Neubauer, P., Azeredo, J. (2010). Phage control of dual species biofilms of Pseudomonas fluorescens and Staphylococcus lentus. Biofouling 26, 567 – 575.
Silver, S. (1996). Bacterial resistances to toxic metal ions – a review. Gene 179, 9 – 19.
Singer, V. L., Jones, L. J., Yue, S. T., Haugland, R. P. (1997). Characterization of PicoGreen reagent and development of a fluorescence-based solution assay for double-stranded DNA quantitation. Analytical Biochemistry 249, 228 – 238.
Sinsabaugh, R. L., Repert, D., Weiland, T., Golladay, S. W., Linkins, A. E. (1991). Exoenzyme accumulation in epilithic biofilms. Hydrobiologia 222, 29 – 37.
Sizemore, R. K., Caldwell, J. J., Kendrick A. S. (1990). Alternate Gram staining technique using a fluorescent lectin. Applied and Environmental Microbiology 56, 2245 – 2247.
Skraber, S., Schijven, J., Gantzer, C., de Roda Husman, A. M. (2005). Pathogenic viruses in drinking-water biofilms: a public health risk. Biofouling 2, 105 – 117.
Smith, D. C., Simon, M., Alldredge, A. L., Azam, F. (1992). Intense hydrolytic enzyme activity on marine aggregates and implications for rapid particle dissolution. Nature 359, 139 – 142.
Smith, P. K., Krohn, R. I., Hermanson, G. T., Mallia, A. K., Gartner, F. H., Provenzano, M. D., Fujimoto, E. K., Goeke, N. M., Olson, B. J., Klenk, D. C. (1985). Measurement of protein using bicinchoninic acid. Analytical Biochemistry 150, 76 – 85.
Smith, C. J., Osborn, A. M. (2009). Advantages and limitations of quantitative PCR (Q-PCR)-based approaches in microbial ecology. FEMS Microbiology Ecology 67, 6 – 20.
Smithies, W. R., Gibbons, N. E. (1955). The deoxyribose nucleic acid slime layer of some halophilic bacteria. Canadian Journal of Microbiology 1, 614 – 621.
References
208
Smucker, R. A., Kim, C. K. (1991). Microbial extracellular enzyme activity: a new key parameter in aquatic ecology. In: Microbial enzymes in aquatic environments, pp. 60 – 83. R. J. Chrost (Ed.), Springer-Verlag, New York.
Späth, R., Flemming, H.-C., Wuertz, S. (1998). Sorption properties of biofilms. Water Science and Technology 37(4-5), 207 – 210.
Steele, A., Goddard, D. T., Beech, I. B. (1994). An atomic force microscopy study of the biodeterioration of stainless steel in the presence of bacterial biofilms. International Biodeterioration and Biodegradation 34, 35 – 46.
Steiner, A. E., McLaren, D. A., Forster, C. F. (1976). The nature of activated sludge flocs. Water Research 10, 25 – 30.
Stoeckigt, C., Schmeisser, C., Streit, W. R. (2003). Skimming the metagenome of a drinking water biofilm. Unpublished.
Stocks, S. M. (2004). Mechanism and use of the commercially available viability stain, BacLight. Cytometry Part A 61A, 189 – 195.
Stoodley, P., de Beer, D., Lewandowski, Z. (1994). Liquid flow in biofilm systems. Applied and Environmental Microbiology 60, 2711 – 2716.
Stoodley, P., Sauer, K., Davies, D.G., Costerton, J.W. (2002). Biofilms as complex differentiated communities. Annual Review of Microbiology 56, 187 – 209.
Strathmann, M., Wingender, J., Flemming, H.-C. (2002) Application of fluorescently labelled lectins for the visualization and biochemical characterization of polysaccharides in biofilms of Pseudomonas aeruginosa. Journal of Microbiological Methods 50, 237 – 248.
Straub, T. M., Gerba, C. P., Zhou, X., Price, R., Yahys, M. T. (1995). Synergistic inactivation of E. coli and MS-2 coliphage by chloramine and cupric chloride. Water Research 29, 811 – 818.
Suci, P. A., Mittelman, M. W., Yu, F. P., Geesey, G. G. (1994). Investigation of ciprofloxacin penetration into Pseudomonas aeruginoas biofilms. Antimicrobial Agents and Chemotherapy 38, 2125 – 2133.
Suci, P. A., Geesey, G. G., Tyler, B. J. (2001). Integration of Raman microscopy, differential interference contrast microscopy, and attenuated total reflection Fourier transform infrared spectroscopy to investigate chlorhexidine spatial and temporal distribution in Candida albicans biofilms. Journal of Microbiological Methods 46, 193 – 208.
Surman, S. B., Walker, J. T., Goddard, D. T., Morton, L. H. G., Keevil, C. W., Weaver, W., Skinner, A., Hanson, K., Caldwell, D., Kurtz, J. (1996). Comparison of microscope techniques for the examination of biofilms. Journal of Microbiological Methods 25, 57 – 70.
Sutherland, I.W. (1988). Bacterial surface polysaccharides: structure and function. International Review of Cytology 113, 187 – 231.
Sutherland, I.W. (1990). Exopolysaccharide structure. In: Biotechnology of microbial exopolysaccharides, Vol. 9, pp. 20 – 37. Sutherland, I.W. (Ed.), Cambridge University Press, Cambridge.
Sutherland, I.W. (2001). Biofilm exopolysaccharides: a strong and sticky framework. Microbiology 147, 3 – 9.
Szewzyk, U., Szewzyk, R., Manz, W., Schleifer, K. H. (2000). Microbiological safety of drinking water. Annual Review of Microbiology 54, 81 – 127.
Szewzyk, U., Szewzyk, R. (2003). Biofilms – die etwas andere Lebensweise. BIOspectrum 9, 253 – 255.
Tago, Y., Aida, K. (1977). Exocellular mucopolysaccharide closely related to bacterial floc formation. Applied and Environmental Microbiology 34, 306 – 314.
Tapia, J. M., Muñoz, J. A., González, F., Blázquez, M. L., Malki, M., Ballester, A. (2009). Extraction of extracellular polymeric substances from the acidophilic bacterium Acidiphilium 3.2Sup(5). Water Science and Technology 59(10), 1959 – 1967.
Taylor Eighmy, T., Bishop, P. L. (1985). Effect of reactor turbulence on the binding-protein-mediated aspartate transport system in thin wastewater biofilms. Applied and Environmental Microbiology 50, 120 – 124.
References
209
Teitzel, G. M., Parsek, M. K. (2003). Heavy metal resistance of biofilm and planktonic Pseudomonas aeruginosa. Applied and Environmental Microbiology 69, 2313 – 2320.
Teitzel, G. M., Geddie, A., De Long, S. K., Kirisits, M. J., Whiteley, M., Parsek, M. R. (2006). Survival and growth in the presence of elevated copper: transcriptional profiling of copper-stressed Pseudomonas aeruginosa. Journal of Bacteriology 188, 7242 – 7256.
Teng, F., Guan, Y. T., Zhu, W. P. (2008). Effect of biofilm on cast iron pipe corrosion in drinking water distribution system: Corrosion scales characterization and microbial community structure investigation. Corrosion Science 50, 2816 – 2823.
Teuber, M., Brodisch, K. E. U. (1977). Enzymatic activites of activated sludge. European Journal for Applied Microbiology 4, 185 – 194.
Thurman, R. B., Gerba, C. P. 1989. The molecular mechanisms of copper and silver ion disinfection of bacteria and viruses. Critical Reviews of Environmental Control 18, 295 – 315.
Thurnheer, T., Gmür, R., Guggenheim, B. (2004). Multiplex FISH analysis of a six-species bacterial biofilm. Journal of Microbiological Methods 56, 37 – 47.
Tielen, P. (2006). Einfluss extrazellulärer Enzyme auf die Struktur und die Eigenschaften von Biofilmen von Pseudomonas aeruginosa. Dissertation, University of Duisburg-Essen.
Tielker, D., Hacker, S., Loris, R., Strathmann, M., Wingender, J., Wilhelm, S., Rosenau, F., Jaeger, K.-E. (2005). Pseudomonas aeruginosa lectin LecB is located in the outer membrane and is involved in biofilm formation. Microbiology 151, 1313 – 1323.
Titus, S., Gaonkar, S. N., Srivastava, R. B., Karande, A. A. (1995). Exopolymer production by a fouling marine bacterium Pseudomonas alcaligenes. Indian Journal of Marine Sciences 24, 45 – 48.
Tonge, R., Shaw, J., Middleton, B., Rowlinson, R., Rayner, S., Young, J., Pognan, F., Hawkins, E., Currie, I., Davison, M. (2001). Validation and development of fluorescence two-dimensional differential gel electrophoresis proteomics technology. Proteomics 1, 377 – 396.
TrinkwV, (Trinkwasserverordnung, German Drinking Water Ordinance; 2011). Umsetzung des § 18 TrinkwV 2001 in der behördlichen Praxis. Bundesgesetzblatt Teil I Nr. 21, 748 – 774.
Troch, P., Philip-Hollingworth, S., Orgambide, G., Dazzo, F. B., Vanderleyden, J. (1992). Analysis of extracellular polysaccharides isolated from Azospirillum brasilense wild type and mutant strains. Symbiosis 13, 229 – 241.
Tseng, T.-T., Tyler, B. M., Setubal, J. C. (2009). Protein secretion systems in bacterial-host associations, and their description in the Gene Ontology. BMC Microbiology 9, S2.
Umweltbundesamt (2011). Leitlinie zur hygienischen Beurteilung von Elastomeren im Kontakt mit Trinkwasser (Elastomerleitlinie). Empfehlung des Umweltbundesamtes, 1 – 52.
Underwood, G. J. C., Paterson, D. M., Parkes, R. J. (1995). The measurement of microbial carbohydrate exopolymers from intertidal sediments. Limnology and Oceanography 40, 1243 – 1253.
Ünlü, M., Morgan, M. E., Minden, J. S. (1997). Difference gel electrophoresis: A single gel method for detecting changes in protein extracts. Electrophoresis 18, 2071 – 2077.
Urbain, V., Block, J. C., Manem, J. (1993). Bioflocculation in activated sludge: an analytic approach. Water Research 27, 829 – 838.
Van der Aa, B. C., Dufrêne, Y. F. (2002). In situ characterization of bacterial extracellular polymeric substances by AFM. Colloids and Surfaces B: Biointerfaces 23, 173 – 182.
Van Hullebusch, E. D., Zandvoort, M. H., Lens, P. N. L. (2003). Metal immobilisation by biofilms: Mechanisms and analytical tools. Reviews in Environmental Science and Biotechnology 2, 9 – 33.
Van Ommen Kloeke, F., Geesey, G. G. (1999). Localization and identification of populations of phosphatase-active bacterial cells associated with activated sludge flocs. Microbial Ecology 38, 201 – 214.
Veiga, M. C., Mahendra, K. J., Wu, W.-M., Hollingsworth, R. I., Zeikus, J. G. (1997). Composition and role of extracellular polymers in methanogenic granules. Applied and Environmental Microbiology 63, 403 – 407.
References
210
Vepsäläinen, M., Erkomaa, K., Kukkonen, S., Vestberg, M., Wallenius, K., Niemi, R. M. (2004). The impact of crop plant cultivation and peat amendment on soil microbial activity and structure. Plant and Soil 264, 273 – 286.
Vesy, C. J., Kitchens, R. L., Wolfbauer, G., Albers, J. J., and Munford, R. S. (2000). Lipopolysaccharide-binding protein and phospholipid transfer protein release lipopolysaccharides from Gram-negative bacterial membranes. Infection and Immunity 68, 2410 – 2417.
Vilain, S., Pretorius, J. M., Theron, J., Brözel, V. S. (2009). DNA as an adhesin: Bacillus cereus requires extracellular DNA to form biofilms. Applied and Environmental Microbiology 75, 2861 – 2868.
Vogt, M., Flemming, H.-C., Veeman, W. S. (2000). Diffusion in Pseudomonas aeruginosa biofilms: a pulsed field gradient NMR study. Journal of Biotechnology 77, 137 – 146.
Völker, S., Schreiber, C., Kistemann, T. (2010). Drinking water quality in household supply infrastructure – A survey of the current situation in Germany. International Journal of Hygiene and Environmental Health 213, 204 – 209.
Von Sengbusch, P., Mix, M., Wachholz, I., Manshard, E. (1982). FITC-labeled lectins and calcofluor white ST as probes for the investigation of the molecular architecture of cell surfaces. Studies on conjugatophycean species. Protoplasma 111, 38 – 52.
Vroom, J. M., De Grauw, K. J., Gerritsen, H. C., Bradshaw, D. J., Marsh, P. D., Watson, G. K., Birmingham, J. J., Allison, C. (1999). Depth penetration and detection of pH gradients in biofilms by two-photon excitation microscopy. Applied and Environmental Microbiology 65, 3502 – 3511.
Wagner, M., Assmus, B., Hartmann, A., Hutzler, P., Springer, N., Schleifer, K.-H. (1994). In situ analysis of microbial consortia in activated sludge using fluorescently labelled, rRNA-targeted oligonucleotide probes and scanning confocal laser microscopy. Journal of Microscopy 176, 181 – 187.
Wagner, M., Amann, R. (1997). Molecular techniques for determining microbial community structures in activated sludge. In: Microbial community analysis. IAWQ Scientific and Technical Report No. 5, pp. 61 – 72. Cloete, T. E., Muyima, N. Y. O. (Eds.), IWA Publishing.
Waines, P. L., Moate, R., Moody, A. J., Allen, M., Bradley, G. (2011). The effect of material choice on biofilm formation in a model warm water distribution system. Biofouling 27, 1161 – 1174.
Waite, R. D., Rose, R. S., Rangarajan, M., Aduse-Opoku, J., Hashim, A., Curtis, M. A. (2012). Pseudomonas aeruginosa possesses two putative Type 1 signal peptidases, LepB and PA1303, each with distinct roles in physiology and virulence. Journal of bacteriology, published online ahead of print.
Walsh, S., Lappin-Scott, H. M., Stockdale, H., Herbert, B. N. (1995). An assessment of the matabolic activity of starved and vegetative bacteria using two redox dyes. Journal Microbiological Methods 24, 1 – 9.
Wang, H., Hu, C., Hu, X., Yang, M., Qu, J. (2012). Effects of disinfectant and biofilm on the corrosion of cast iron pipes in a reclaimed water distribution system. Water Research 46, 1070 – 1078.
Watnick, P., Kotler, R. (2000). Biofilm, city of microbes. Journal of Bacteriology 182. 2675 – 2679.
Wawrzynczyk, J., Szewczyk, E., Norrlöw, O., Dey, E. S. (2007). Application of enzymes, sodium tripolyphosphate and cation exchange resin for the release of extracellular polymeric substances from sewage sludge. Characterization of the extracted polysaccharides/glycoconjugates by a panel of lectins. Journal of Biotechnology 130, 274 – 281.
Webb, J. S., Nixon, M., Eastwood, I. M., Greenhalgh, M., Robson, G. D., Handley, P. S. (2000). Fungal colonization and biodeterioration of plasticized polyvinyl chloride. Applied and Environmental Microbiology 66, 3194 – 3200.
Webb, J. S., Thompson, L. S., James, S., Charlton, T., Tolker-Nielsen, T., Koch, B., Givskov, M., Kjelleberg, S. (2003). Cell Death in Pseudomonas aeruginosa Biofilm Development. Journal of Bacteriology 185, 4585 – 4592.
Weiner, R., Langille, S., Quintero, E. (1995). Structure, function and immunochemistry of bacterial exopolysaccharides. Journal of Industrial Microbiology 15, 339 – 346.
References
211
Wellinghausen, N., Köthe, J., Wirths, B., Sigge, A., Poppert, S. (2005). Superiority of molecular techniques for identification of Gram-negative, oxidase-positive rods, including morphologically nontypical Pseudomonas aeruginosa, from patients with cystic fibrosis. Journal of Clinical Microbiology 43, 4070 – 4075.
Wentland, E. J., Stewart, P. S., Huang, C.-T., McFeters, G. A. (1996). Spatial Variations in growth rate within Klebsiella pneumoniae colonies and biofilms. Biotechnology Progress 12, 316 – 321.
Wetzel, R. G., Ward, A. K., Stock, M. (1997). Effects of natural dissolved organic matter on mucilaginous matrices of biofilm communities. Archives of Hydrobiology 139, 289 – 299.
Whitchurch, C. B., Tolker-Nielsen, T., Ragas, P. C., Mattick J. S. (2002). Extracellular DNA required for bacterial biofilm formation. Science 295, 1487.
White, C., Gadd, G. M. (1996). Mixed sulphate-reducing bacterial cultures for bioprecipitation of toxic metals: factorial and response-surface analysis of the effects of dilution rate, sulphate and substrate concentration. Microbiology 1452, 2197 – 2205.
White, C., Gadd, G. M. (1998). Accumulation and effects of cadmium on sulphate-reducing bacterial biofilms. Microbiology 144, 1407 – 1415.
White, C., Gadd, G. M. (2000). Copper accumulation by sulphate-reducing bacterial biofilms. FEMS Microbiology Letters 183, 313 – 318.
Wilén, B. M., Jin, B., Lant, P. (2003). The influence of key chemical constituents in activated sludge on surface and flocculation properties. Water Research 37, 2127 – 2139.
Wilks, S. A., Michels, H., Keevil, C. W. (2005). The survival of Escherichia coli O157 on a range of metal surfaces. International Journal of Food Microbiology 105, 445 – 454.
Wimpenny, J. (2000). An overview of biofilms as functional communities. In SGM symposium 59: Community structure and co-operation in biofilms, pp. 1 – 24. Allison, D., Gilbert, P., Lappin-Scott, H., Wilson, M. (Eds.), Cambridge University Press, Cambridge.
Wingender, J., Neu, T., Flemming, H.-C. (1999). What are bacterial extracellular polymeric substances? In: Microbial extracellular polymeric substances, pp. 1 – 19. Wingender, J., Neu, T. and Flemming, H.-C. (Eds.), Springer Heidelberg, Berlin.
Wingender, J., Strathmann, M., Rode, A., Leis, A., Flemming, H.-C. (2001). Isolation and biochemical characterization of extracellular polymeric substances from Pseudomonas aeruginosa. Methods in Enzymology 336, 302 – 314.
Wingender, J., Jaeger, K.-E. (2002). Extracellular enzymes in biofilms. In: Encyclopedia of Environmental Microbiology, Vol. 3, pp. 1207 – 1223. Bitton, G. (Ed.), Wiley, New York.
Wingender, J., Flemming, H.-C. (2004). Contamination potential of drinking water distribution network biofilms. Water Science and Technology 49(11-12), 277 – 286.
Wingender, J. (2011). Hygienically relevant microorganisms in biofilms of man-made water systems. In: Biofilm Highlights. Springer Series on Biofilms, Vol. 5, pp. 189 – 238. Flemming, H.-C., Wingender, J., Szewzyk, U. (Eds.), Springer Heidelberg, Berlin.
Wingender, J., Flemming, H.-C. (2011). Biofilms in drinking water and their role as reservoir for pathogens. International Journal of Hygiene and Environmental Health 214, 417 – 423.
Wloka, M., Rehage, H., Flemming, H.-C., Wingender, J. (2004). Rheological properties of viscoelastic biofilm EPS and comparison to the behavior of calcium alginate gels. Colloid and Polymer Science 282, 1067 – 1076.
Wolfaardt, G. M., Lawrence, J. R., Robarts, R. D., Caldwell, D. E. (1994). Multicellular organization in a degradative biofilm community. Applied and Environmental Microbiology 60, 434 – 446.
Wolfaardt, G. M., Lawrence, J. R., Robarts, R. D., Caldwell, D. E. (1998). In situ characterization of biofilm exopolymers involved in the accumulation of chlorinated organics. Microbial Ecology 35, 213 – 223.
Wood, P. J. (1980). Specificity in the interaction of direct dyes with polysaccharides. Carbohydrate Research 85, 271 – 287.
References
212
Wozniak, D. J., Ohman, D. E. (1991). Pseudomonas aeruginosa AlgB, a two-component response regulator of the NtrC family, is required for algD transcription. Journal of Bacteriology 173, 1406 – 1413.
Wrangstadh, M., Conway, P. L., Kjelleberg, S. (1986). The production and release of an extracellular polysaccharide during starvation of a marine Pseudomonas sp. and the effect thereof on adhesion. Archives of Microbiology. 145, 220 – 227.
Wu, J., Xi, C. (2009). Evaluation of different methods for extracting extracellular DNA from the biofilm matrix. Applied and Environmental Microbiology 75, 5390 – 5395.
Wuertz, S., Pfleiderer, P., Kriebitzsch, K., Späth, R., Griebe, T., Coello-Oviedo, D., Wilderer, P. A., Flemming, H.-C. (1998). Extracellular redox activity in activated sludge. Water Science and Technology 37(4-5), 379 – 384.
Wuertz, S., Spaeth, R., Hinderberger, A., Griebe, T., Flemming, H.-C., Wilderer, P. A. (2001). A new method for extraction of extracellular polymeric substances from biofilms and activated sludge suitable for direct quantification of sorbed metals. Water Science and Technology, 43(6), 25 – 31.
Wullings, B. A., van der Kooij, D. (2006). Occurrence and genetic diversity of uncultured Legionella spp. in drinking water treated at temperatures below 15°C. Applied and Environmental Microbiology 72, 157 – 166.
Wüthrich, K. (2001). The way to NMR structures of proteins. Nature Structural Biology 8, 923 – 925.
Xu, K. D., Stewart, P. S., Xia, F., Huang, C. T., McFeters, G. A. (1998). Spatial physiological heterogeneity in Pseudomonas aeruginosa biofilm is determined by oxygen availability. Applied and Environmental Microbiology 64, 4035 – 4039.
Yarmolinsky, M. B. (1995). Programmed cell death in bacterial populations. Science 267, 836 – 837.
Yu, J., Kim, D., Lee, T. (2010). Microbial diversity in biofilms on water distribution pipes of different materials. Water Science and Technology 61(1), 163 – 171.
Zhang, Z.-J., Chen, S.-H., Wang, S.-M., Luo, H.-Y. (2011). Characterization of extracellular polymeric substances from biofilm in the process of starting-up a partial nitrification process under salt stress. Applied Microbiology and Biotechnology 89, 1563 – 1571.
Zieske, L. R. (2006). A perspective on the use of iTRAQ reagent technology for protein complex and profiling studies. Journal of Experimental Botany 57, 1501 – 1508.
Zita, A., Hermansson, M. (1997). Determination of bacterial cell surface hydrophobicity of single cells in culture and in wastewater in situ. FEMS Microbiology Ecology 152, 299 – 306.
Appendix
213
APPENDIX
Publikationsliste
Referierte Publikationen
Michalowski, W. D., Flemming, H.-C., Wingender, J. (in prep.). Isolation and analysis of EPS from drinking-water biofilms - a critical assessment of common EPS isolation methods.
Vorträge
Alfer, B., Michalowski, W. D., Flemming, H.-C., Wingender, J. (2011). Dynamics of microbial populations and biochemical composition of drinking-water biofilms. Vortrag und Beitrag im Tagungsband der IWA Biofilms Conference 2011 - Processes in Biofilms, Shanghai/China.
Poster
Jachlewski, S., Michalowski, W. D., Mayer, B., Albers, S.-V., Wingender, J., Siebers, B. (2011). Hot Biofilms - EPS analysis of the archaeon Sulfolobus acidocaldarius. Poster und Beitrag im Tagungsband der IWA Biofilms Conference 2011 - Processes in Biofilms, Shanghai/China.
Alfer, B., Michalowski, W. D., Flemming, H.-C., Wingender, J. (2011). Dynamik der mikrobiellen Population und biochemischen Zusammensetzung von Trinkwasserbiofilmen. Poster und Beitrag im Tagungsband der Wasser 2011 - Jahrestagung der Wasserchemischen Gesellschaft, Norderney.
Michalowski, W. D., Flemming, H.-C., Wingender, J. (2010). Isolation of extracellular polymeric substances from drinking-water biofilms - a critical assessment of standard isolation methods. Poster und Beitrag im Tagungsband der Biofilms IV Konferenz, Winchester/UK.
Jachlewski, S., Michalowski, W. D., Wingender, J., Siebers, B. (2010). Hot Biofilms - EPS analysis of the archaeon Sulfolobus acidocaldarius. Poster und Beitrag im Tagungsband der Biofilms IV Konferenz, Winchester/UK.
Michalowski, W. D., Flemming, H.-C., Wingender, J. (2009). Isolation and analysis of extracellular polymeric substances from drinking-water biofilms. Poster und Beitrag im Tagungsband der 5th ASM Conference on Biofilms, Cancun/Mexico.
Michalowski, W. D., Bressler, D., Flemming, H.-C., Wingender, J. (2009). Proteine als Hauptbestandteile der EPS von Trinkwasserbiofilmen. Poster und Beitrag im Tagungsband der Wasser 2009 - Jahrestagung der Wasserchemischen Gesellschaft, Stralsund.
Michalowski, W. D., Bressler, D., Broekman, S., Flemming, H.-C., Wingender, J. (2008). Extracellular polymeric substances in drinking-water biofilms. Poster und Beitrag im Tagungsband der Biofilms III Konferenz in Garching/München.
Appendix
214
Lebenslauf
"Der Lebenslauf ist in der Online-Version aus Gründen des Datenschutzes nicht enthalten"
Appendix
215
Erklärung
Hiermit versichere ich, dass ich die vorliegende Arbeit mit dem Titel
„Composition, dynamics and function of extracellular polymeric substances in
drinking-water biofilms”
selbst verfasst und keine außer den angegebenen Hilfsmitteln und Quellen benutzt habe,
und dass die Arbeit in dieser oder ähnlicher Form noch bei keiner anderen Universität
eingereicht wurde.
Essen, im August 2012
(Witold Dariusz Michalowski)