components of genetic variation for cut-flower yield in the davis population of gerbera
TRANSCRIPT

Euphytica 34 (1985) 7599767
COMPONENTS OF GENETIC VARIATION FOR CUT-FLOWER YIELD IN THE DAVIS
POPULATION OF GERBERA
JAMES HARDING, DANA DRENNAN and T.G. BYRNE
Department of Environmental Horticulture, University of California, Davis, California 95616, USA
INDEX WORDS
Gerhrra hyhridrc, gerbera, heritability, additive variance, inbreeding depression, dominance ratio
SUMMARY
Genetic variances for cut-flower yield in Grrhera hyhridu were partitioned into additive and dominance components. Mean additive variance was 37.3 with a standard error of 12.9. Mean dominance variance was 12.7 with a standard error of 32.6. The dominance ratio was 0.34. Narrow sense heritability. estimated from these components of variance, averaged 0.42 with a standard error of 0.13. Heritabilities estimated from parent-offspring regression averaged 0.25. Gain from selection was less then expected; realized herita- bilities were approximately 0.20.
INTRODUCTION
Heritabilities of ca. 0.50 were reported for cut-flower yield in generations 1 through 3 of the Davis Population of gerbera (HARDING et al., 1981). These estimates were in genera1 agreement with heritability estimates for yield reported by MAURER & HORN (1967) and WRICKE & HORN (1971), and with general combining ability estimates re- ported by MUCENIECE et al. (198 1). Somewhat lower estimates of ca. 0.30 were reported by BORGHI & BALDI (1970) and DELEO & OTTAVIANO (1978). However, response to selection in these generations resulted in only 0.16 realized heritability. In addition, there was a 38 percent reduction in mean cut-flower yield following one generation of self-fertilization, suggesting that dominance variance is important.
The purposes of the present investigation of the Davis Population are 1) to partition genetic variability for cut-flower yield into additive and dominance components, 2) to evaluate response to selection for cut-flower yield, 3) to investigate possible changes over the 8 generations of selection and 4) to compare estimates of genetic parameters of cut-flower yield in gerbera to those for grain yield in maize.
THEDAVISPOPULATION
The genetic base upon which this population was founded and genera1 annual growing procedures were discussed in HARDING et al. (I 98 1). Demographic parameters of the Davis Population are summarized in Table 1. Selection intensity for cut-flower yield was 45 to 46 pecent during generations 1 through 3. Selected parents were pollinated
759

I. HAKUING, 0. DKtNNAN AND T. G. BYKNE
Table 1. Family structure, population size and selection practices for the Davis Population.
Generation Character Number of families Population selected size
half-sib full-sib
I yield 21 164 2 yield 31 185 3 yield 49 196 4 yield 49 245
5 yield and preference 47 124 248 yield only 29 61
6 yield and preference 50 127 261 yield only 22 44
7 yield and preference 47 107 299 yield only 22 44
8 yield and preference 49 138 394
with a randomly collected sample of mass pollen from those parents, producing a population of half-sib families. Cut-flower yield was recorded in each generation dur- ing the six-month period from September 1 to March 1.
From generations 4 through 8, one set of parents was selected for cut flower yield and one set of parents for consumer preference. The 30 plants with highest cut-flower yield were selected from the population; from the remaining plants, the 50 with highest consumer preference were selected. Preference was based on the evaluation of a con- sumer panel; details are presented in DRENNAN et al. (1983). Each parent selected for cut-flower yield was crossed to 5 randomly selected parents from among those selected for consumer preference. More parents were selected for consumer preference in order to maintain greater variability of inflorescence traits, such as color and form. Each yield parent was also crossed randomly to two other yield parents to create a sub- population (Population Y) in each generation that was selected only for yield. Yield evaluations were based on 6 months flower production for periods beginning in No- vember through December and ending in May through June. In this paper it will be assumed that the two selected characters, yield and preference, are independent; corre- lation coefficients for generations 4 through 7 were -0.08, + 0. I respectively.
0, -to.02 and -0.08,
METHODS OF ESTIMATION
The parents selected for yield will be termed selectdparents becau se they were selected for the trait under study. The parents selected for preference will be termed runrlom- purwts because they were selected for a trait that is uncorrelated with the trait under study. In each generation the 80 selected parents were randomly allocated to 10 pollina- tion sets; each set consisted of 3 selected-parents and 5 random-parents. Thus, the mating scheme was:
760

CUT-FLOWER YIELD OF GERBERA
Selected Random-parent parent
1 2 3 4 5 1 c,, c,: . . . 2 GI * Cl, * 3 . . . .
where C,, was the cross between selected-parent i and random-parent j. Generally, two full-sibs were grown from each C,,. Genetic expectations for this design were first presented by COMSTOCK & ROBINSON (I 948) and it has been called the North Carolina Design II (NCII). An analysis of variance of this design produces the following compo- nents of variance: 0; - the variance among selected-parents, a+ - the variance among random-parents, 6 -the interaction (selected- x random-parents) variance, and 0; - variance within full-sib families. These were computed according to the procedure of VAN VLECK (1982). These compo- nents can be equated to their genetic expectations and result in the following equations: a; = 1,4fJ;, af = l/40$ 4, = l/40;, 0; = l/2 0; + 314 0; + o;, where a: is the additive variance, a: the dominance variance and oZ, the environmental variance. The total phenotypic variance was the sum of these 4 components; 0: was estimated separately for selected- and random parents. This analysis was repeated on each of the 10 pollination sets of each generation. Note that negative estimates are possible for all components of variance including rrf (but not at). Note also that epistasis, linkage disequilibrium and maternal effects were assumed to be small and have been omitted from the model.
All estimates of variance components and heritabilities were based on crosses be- tween the selected- and random-parents that constitute the Davis Population. Popula- tion Y consisted of a single offspring per cross because it was intended to estimate response to selection and realized heritability, not components of variance.
EXPERIMENTALRESULTS
Additive variancr. Two additive components of variance were estimated from each pollination set, one for the random-parents and one for the selected-parents. There were a total of 40 estimates of each component from 10 pollination sets in each of 4 years. The distributions of the 40 additive components for selected- and random- parents were similar. The mean and standard deviation, respectively, for the random set are 30.90 and 124.91, and for the selected set are 43.68 and 106.99. Neither the means nor the variances are significantly different. Consequently, the estimates were combined to form one distribution of 80 estimates of 0:. This assumes no change
ifuph~~rica 34 (1985) 761

I. HARDING, Il. DRENNAN AND 7. G. BYRNE
ADDITIVE VARIANCE
Fig. 1. Distribution of 80 estimates of the additive component of variance for cut-flower yield in generations 4 through 8 of the Davis Population of gerbera. S.D. indicates standard deviation of estimates. Individual statistics are available from the authors upon request.
in cri over generations 5-S. The results appears in Figure 1; the mean additive variance is: C-J; = 37.3. The 90 percent confidence interval is 15.8 to 58.8, and the 99 percent confidence inter- val is 3.1 to 71.5.
Dominance variance. The component of variance due to interaction of random- and selected-parents was estimated for each of the 40 pollination sets. The dominance com- ponent of variance was estimated from each set and the resulting distribution of cri appears in Figure 2. Again, the assumption was made that no change in dominance occurred over generations 5-8. The mean dominance variance is: 0; = 12.7. The 90 percent confidence interval is -42.2 to 67.6 and the 99 percent confidence inter- val is -75.5 to 100.9.

CUT-FLOWER YIELD OF GERBEKA
. . . .; . .:. ;:::. .I.:.... .:::. . . . . . . . .
;:::. . . . . . . .:::. . . . ..I.1 .:::. . . . . . . .:::. . . . . . ..I .:::. . . . . . . .:::. .:::.
. . . . . ..I
. . . . . . . . .:::. . . . . . . .:::. .:::.
. . . . ..- .:::.
. . . . . . .:::.
. . . . . .
. . . . . . .:::. . . . ..I.1 .:::. . . . . . . 1:::. . . . ..I.1 .:::. . . . . . . .:::. . . . ..I.1 :::::v:. . . . . . . . .
. . . . . .
Mean = 12.7 S.D. = 206.0
9- .:::. .:.::: .:::. . . . . . . .:::. . . . . . . . . . . 1.1.1.:. ~.~.~.~./.~.~.~.- .:::.‘:::: .:::.‘:::: .:::.‘:::: ~.~.~.~.‘.~.~.~.~
6- ~:::.~:.‘:: ‘.‘.‘.‘.j.:.:.:.: .:::. . . . .::: .1::::
4- .,...... . . . . . . . .
.:::. :::: . . . . . . . . ,.,..... ~:::.::::
2- . . . .:::. .‘.‘.‘.‘,.‘.‘.~.~‘~.~.~.~. .:::.
.,..........,.,. . . ‘...‘...
. . . . . . . . . . . . . . . . . . . . . .:::. -:::. .:: : ,:p:::‘:‘::::.’ :.
1:::. ;::: .:::. ::::
. . . . . . .:::. .:::. .:::
1.1 ::::.
0 .I.:;:;.:. .::::::I .:::. .:::..
-500 -300 -,& 100 300 500 700 900
DOMINANCE VARIANCE
Fig. 2. Distribution of 40 estimates of the dominance component of variance for cut-flower yield in gencra- tions 4 through 8 of the Davis Population of gerbcra. S.D. indicates standard deviation of estimates. Individ- ual statistics are available from the authors upon request.
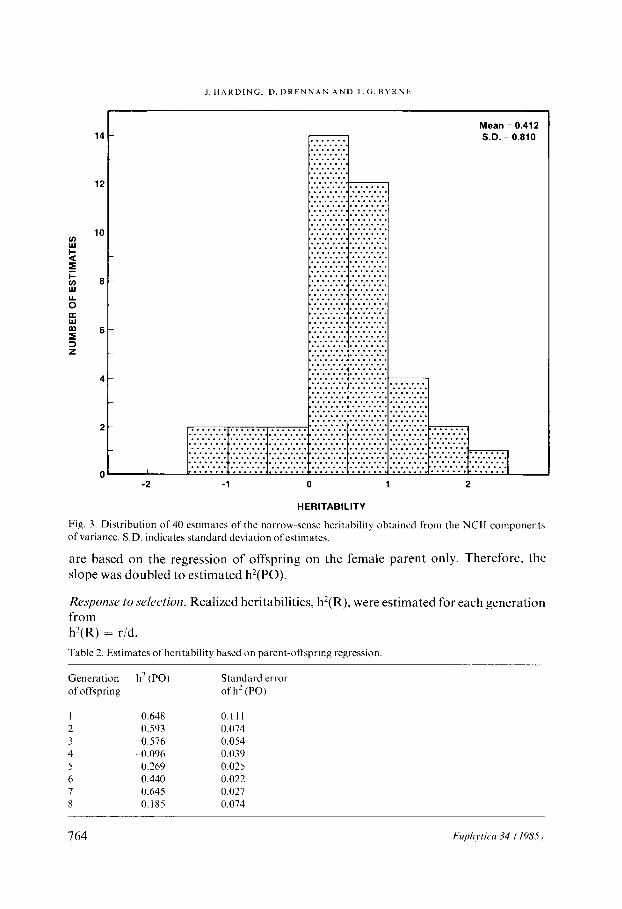
Heritahi/ir~*. There are 2 estimates of additive variance from each pollination set. These were averaged and divided by the phenotypic variance from each set to obtain an estimate of narrow-sense heritability. Although these are half-sib family estimates, they were obtained by a different method than h’(HSF) estimates from generations 1-4. Consequently, these will be designated h’(NCT1) after the design used. The result- ing distribution of the 40 estimates appears in Figure 3. The mean heritability is: h’(NCII) = 0.412. The 90 percent confidence interval is 0.196 to 0.628, and the 99 percent confidence interval is 0.065 to 0.759. Again, homogeneity over the 4 generations is assumed.
Narrow-sense heritability was also estimated from the regression of offspring on the mean of both parents. The slope of the regression is a direct estimate of heritability because the genetic covariance of offspring on the mean of both parents contains all the additive variance in those parents. This heritability is designated h’(P0). Estimates are presented in Table 2, which also includes estimates from generations 1 through 4 (HARDING et al.. 1981) for comparison. The estimates in generations 1 through 4
Euphyticu 34 (1985) 763
J. HAKDING. 0. DKENNAN AND T.G. BYRNE
-2 -1 0 1 2
HERITABILITY
Fig. 3. Distribution of 40 estimates of the narrow-sense heritability obtained from the NC11 components of variance. S.D. indicates standard deviation ofestimates.
are based on the regression of offspring on the female parent only. Therefore, the slope was doubled to estimated h2(PO).
Response to selection. Realized heritabilities, h’(R), were estimated for each generation from h?(R) = r/d, Table 2. Estimates of heritability based on parent-offspring regression
Generation of offspring
h2 (PO)
0.648 0.111 0.593 0.074 0.576 0.054
-0.096 0.039 -0.269 0.025
0.440 0.022 0.645 0.027 0.185 0.074
Standard error of h’(P0)
764
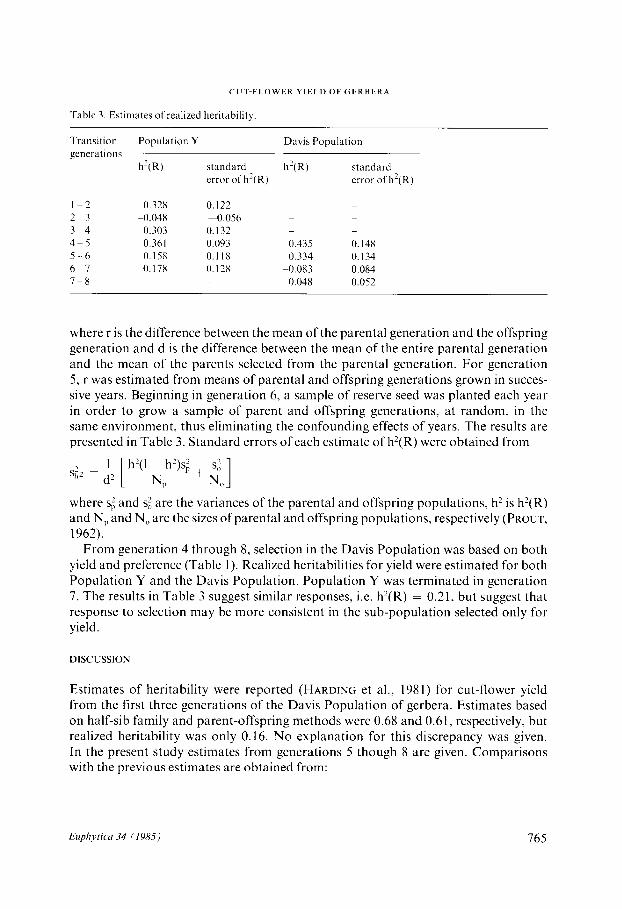
Table 3. Estimates of realized heritability.
Transition Population Y Davis Population generations
h’(R) standard h’(R) standard error of h’( R) error of h’(R)
l-2 0.328 0.122 2-3 -0.04x -0.056 - 3-4 0.303 0.132 4-5 0.361 0.093 0.435 0.148 5 -~ 6 0.158 0.118 0.334 0.134 6-I 0.178 0.12x -0.083 0.084 7-X 0.048 0.052
where r is the difference between the mean of the parental generation and the offspring generation and d is the difference between the mean of the entire parental generation and the mean of the parents selected from the parental generation. For generation 5, r was estimated from means of parental and offspring generations grown in succes- sive years. Beginning in generation 6, a sample of reserve seed was planted each year in order to grow a sample of parent and offspring generations, at random, in the same environment, thus eliminating the confounding effects of years. The results are presented in Table 3. Standard errors of each estimate of h’(R) were obtained from
1 $2 = d’
h’(l - h’)s; + g N,
NO 1 where sf and si are the variances of the parental and offspring populations, h? is h’(R) and N, and N, are the sizes of parental and offspring populations, respectively (PROUT, 1962).
From generation 4 through 8, selection in the Davis Population was based on both yield and preference (Table 1). Realized heritabilities for yield were estimated for both Population Y and the Davis Population. Population Y was terminated in generation 7. The results in Table 3 suggest similar responses, i.e. h?(R) = 0.21, but suggest that response to selection may be more consistent in the sub-population selected only for yield.
DISCUSSION
Estimates of heritability were reported (HARDING et al., 1981) for cut-flower yield from the first three generations of the Davis Population of gerbera. Estimates based on half-sib family and parent-offspring methods were 0.68 and 0.61, respectively, but realized heritability was only 0.16. No explanation for this discrepancy was given. In the present study estimates from generations 5 though 8 are given. Comparisons with the previous estimates are obtained from:
Euph.viicu 34 (1985) 765
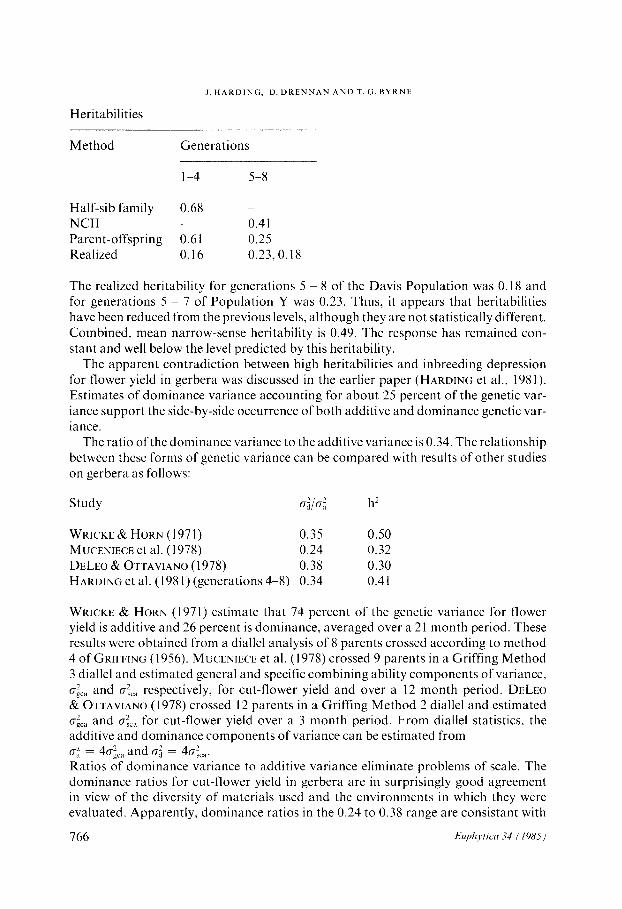
Heritabilities
Method
I. HARDING, D. DRENNAN AND T. G. BYRNE
Generations
l-4 5-8
Half-sib family 0.68 NC11 - 0.41 Parent-offspring 0.61 0.25 Realized 0.16 0.23,O. 18
The realized heritability for generations 5 ~ 8 of the Davis Population was 0.18 and for generations 5 - 7 of Population Y was 0.23. Thus, it appears that heritabilities have been reduced from the previous levels, although they are not statistically different. Combined, mean narrow-sense heritability is 0.49. The response has remained con- stant and well below the level predicted by this heritability.
The apparent contradiction between high heritabilities and inbreeding depression for flower yield in gerbera was discussed in the earlier paper (HARINNG et al., 1981). Estimates of dominance variance accounting for about 25 percent of the genetic var- iance support the side-by-side occurrence of both additive and dominance genetic var- iance.
The ratio of the dominance variance to the additive variance is 0.34. The relationship between these forms of genetic variance can be compared with results of other studies on gerbera as follows:
Study h’
WRICKE & HORN ( 197 1) 0.35 0.50 MUCENIECE et al. (1978) 0.24 0.32 DELE~ & OTTAVIAN~ (1978) 0.38 0.30 HARDING et al. (198 1) (generations 4-8) 0.34 0.41
WRICKE & HORN (1971) estimate that 74 percent of the genetic variance for flower yield is additive and 26 percent is dominance, averaged over a 21 month period. These results were obtained from a diallel analysis of 8 parents crossed according to method 4 of GRIFFrNG (1956). MUCENIECE et al. (1978) crossed 9 parents in a Griffng Method 3 diallel and estimated general and specific combining ability components of variance, &, and &, respectively, for cut-flower yield and over a 12 month period. DELEO & OTTAVIANO (1978) crossed 12 parents in a Griffing Method 2 diallel and estimated &, and r&, for cut-flower yield over a 3 month period. From diallel statistics. the additive and dominance components of variance can be estimated from a!’ = 4a’.. and gi = 4a!.. Ratios E;dominance Griance to additive variance eliminate problems of scale. The dominance ratios for cut-flower yield in gerbera are in surprisingly good agreement in view of the diversity of materials used and the environments in which they were evaluated. Apparently, dominance ratios in the 0.24 to 0.38 range are consistant with
766 EuphJ~tictr 34 i 1985)
CUT-FLOWER YIELD OF GERHhRA
the inbreeding depression also observed for cut-flower yield in gerbera. In the earlier paper (HARDING et al., 1981), we predicted that heritabilities for flower
yield would be high in populations of flower crops compared to heritabilities for grain yield in populations of agronomic crops. The heritabilities for flower yield in gerbera presented by a number of workers vary from 0.30 to 0.50 compared to an average value of 0.19 for grain yield in maize (HALLAUER & MIRANDA, 1981). The increase in additive variance results in dominance ratios averaging about 0.31 compared to an average of about 0.61 for maize (HALLAUER & MIRANDA, 1981). The mean narrow sense heritability of 0.49 suggests that simple mass selection will be an effective method to improve cut-flower yield in the Davis Population of gerbera. However, realized heritability was only 0.19.
ACKNOWLEDGMENT
We wish to express our gratitude to Dr. P. Stam for correcting our statistical model
REFERENCES
BORGHI, B. & V. BALM, 1970. Variabilita tra cloni di gerberd allcvati in diverse condizioni ambientali. Sementi clette 6.
COMSTOCK, R. E. & H. F. ROBINSON. 1948. The components ofgenetic variance in populations of bi-parental progenies and their use in estimating the average degree of dominance. Biometrics 4: 254-266.
DELE~ V. & OTTAVIANO, 197X. Genetic analysis of morphological traits in Gerbera jamesonii clonal and diallel families. Eucarpia pp. 179~191.
DR~NNA~. D., J. HARDIN<; & T. BYRNE. 1983. Heritability of consumer preference in Gerhercr. Euphytica 32: 465-474.
DRENNAN. D.. R. W. HODC;SON & J. HARDING, 1980. Methods for selecting flower quality based on consumer evaluation. Euphytica 29: 641-651.
GRIFFINC B. 1956. Concept of general and specific combining ability in relation to diallel crossing systems. Aust. J. Biol. Sci. 9: 463-93.
HAKDING. J., T. G. BYRNE & R. L. NELSON, 1981. Estimation of heritability and response to selection for cut-flower yield in Gerbera. Euphytica 30: 3 13-322.
HALLAUEK, A. R. & J. B. MIRANUA. 1981. Quantitative genetics in maize breeding. Iowa State University Press.
KEMPTHORNE, 0.. 1952. Design and analysis ofexperiments. John Wiley and Sons. New York. MAURER. J. & W. HORN. 1967. Ergebnissegenetisch-ztichterischer Untersuchungen bei Gerbera. Gartenwelt
67: 63-64. MUCENIECE. G. YA., I. D. RASCALS & V. YA DISLERS. 1978. Investigation of the inheritance of quantitative
characteristics ofgerbera in diallel crosses I. Productivity of plants. Genetica 14: 251-253. NEWER, J. & W. WASSERMAN. 1974. Applied linear statistical models. Richard D. Irwin, Inc.. Homewood.
Illinois. PROUT. T.. 1962. The error variance of the heritability estimate obtained from selectlon response. Biometrics
IX: 404407. VAN VLECK. D.. 1979. Summary of methods for estimating genetic parameters using simple statistical mo-
dels. Cornell University. WRICKE, G. & W. HORN, 1971. Genctische and ziichterischc Untersuchungen bci Gerber-a. Eucarpia. June
15~17,1971.
Euphyticu 34 (lVK5) 767