component analysis and discriminants
TRANSCRIPT

Component Analysis and Discriminants
x2
Reducing dimensionality when:1. Classes are disregarded
Principal Component Analysis (PCA)2. Classes are considered
Discriminant Analysis
x1

1
Component Analysis vs DiscriminantsTwo classical approaches for finding effective linear
transformationsPCA (Principal Component Analysis) “Projection that best represents data in least- square sense”
MDA (Multiple Discriminant Analysis) “Projection that best separates the data in a least-squares sense”
8

2
PCA: Linear Projections of DataExcessive dimensionality x= [x1, x2,… xd] causes
Computational difficultyVisualization issues
Solution: Combine features to reduce dimensionalityLinear combinations, e.g., 2x1+3x2+x3
are simple to compute and tractableProject high dimensional data onto a lower dimensional space
8

3
Projection to lower dimensional spaceAllow computer to search for interesting directions
x2
x1
Direction defined byx1 - x2 = 0
Direction:x1 + x2 = 0
Good separation
Poor Separation

4
Linear ProjectionEquation of line through origin: x1+ 2x2 + 4x3= 0
Projection of a point x along line with projection weights a is given by:
Example:
[ ] 042 4 2 1 321
3
2
1
=++=⎥⎥⎥
⎦
⎤
⎢⎢⎢
⎣
⎡xxx
xxx
x
∑=
=d
jj
T x1
jaxaDirection defined byx1 - x2 = 0or a =[1 -1]
(1,6)
Projection of (1,6) along [1 -1]: 1 - 6 = -5
Can be written as wtx = 0where w = [1 2 4]
Projection of (1,1) along [1 -1]: 1 - 1 = 0 (1,1)Projection of (1,-1) along [1 -1]: 1 + 1 = 2

5
Principal Components AnalysisWe will look at Data Matrix, Scatter Matrix and Covariance Matrix to arrive at best projection of data

6
Data MatrixLet X be a n x d data matrix of n samples
d variablesx(1)
x(i) is a d x 1column vector
Each row of matrixis of the form x(i)T
x(i)
x(n)
Assume X is mean-centered, so that the value of each variable issubtracted for that variable

7
Scatter Matrix
[ ][ ] [ ]dddddd
S tk
n
kk
x is x 11 x sincematrix x a
))((1
mxmx −−=∑=
Scatter Matrix is (n-1) times Covariance Matrix Relationship Between Data Matrix and Scatter Matrix:
mean zero has sincedata theofmatrix scatter theis
XddXXS t ×=
8
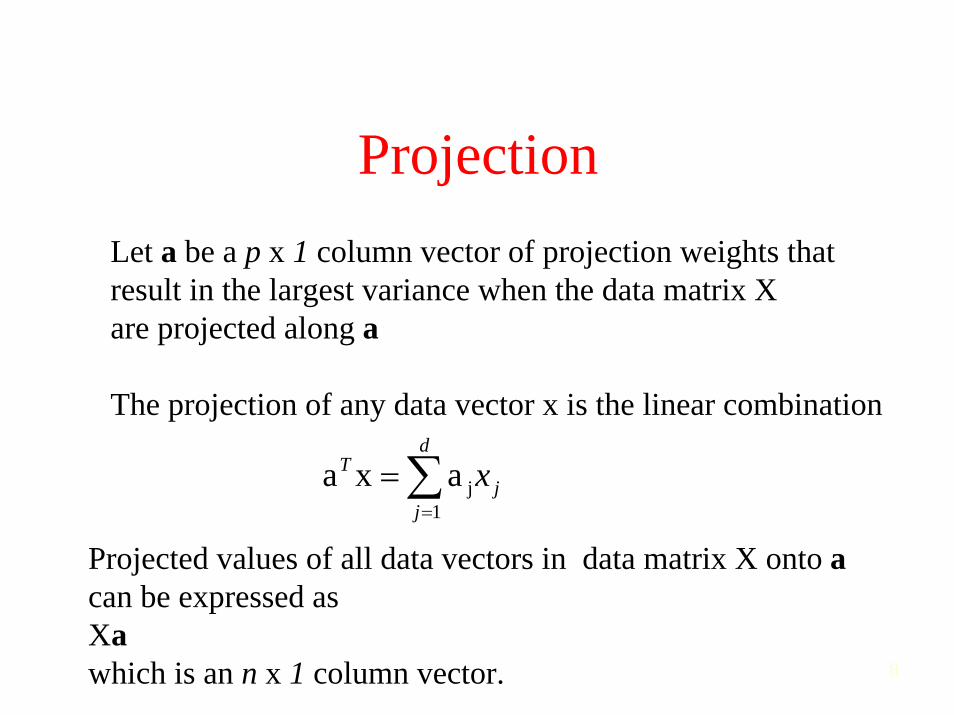
ProjectionLet a be a p x 1 column vector of projection weights thatresult in the largest variance when the data matrix X are projected along a
The projection of any data vector x is the linear combination
∑=
=d
jj
T x1
jaxa
Projected values of all data vectors in data matrix X onto acan be expressed asXawhich is an n x 1 column vector.
9
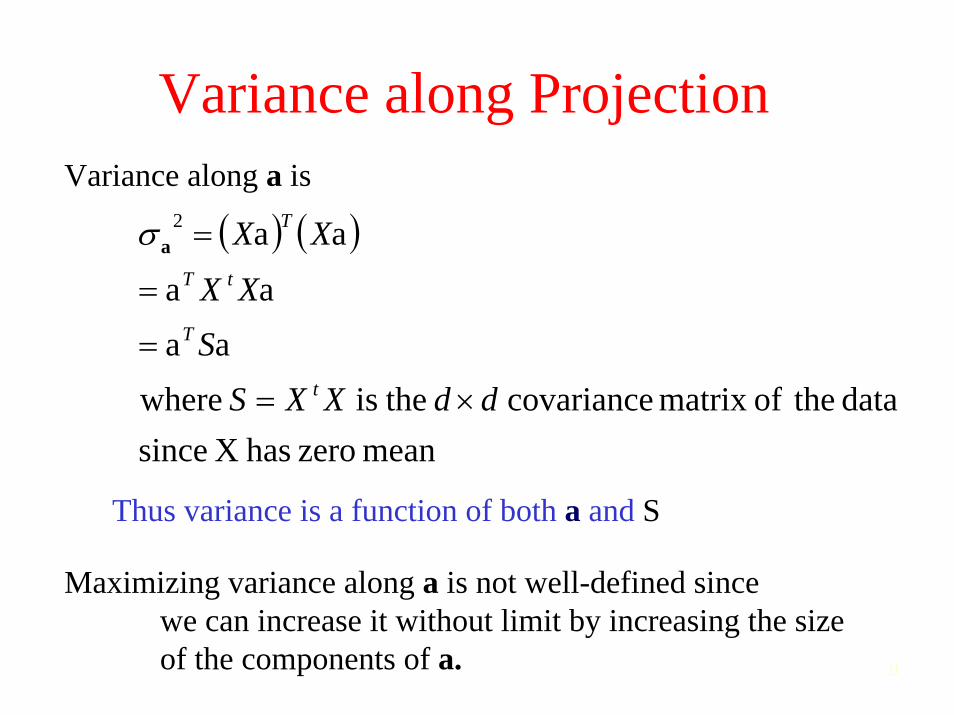
Variance along ProjectionVariance along a is
( ) ( )
meanzerohas X sincedata theofmatrix covariance theis where
aaaa
aa2
ddXXSS
XX
XX
t
T
tT
T
×=
=
=
=aσ
Thus variance is a function of both a and S
Maximizing variance along a is not well-defined since we can increase it without limit by increasing the size of the components of a.

10
Optimization ProblemImpose a normalization constraint on the a vectors such that
aTa = 1Optimization problem is to maximize
)1aa(aa −−= TT Su λVarianceCriterion
NormalizationCriterionWhere λ is a Lagrange multiplier.
Solution: Differentiating wrt a yields
0I)a-(S toreduceswhich
0a2a2a
=
=−=∂∂
λ
λSu
Characteristic Equation of S!

11
Characteristic EquationGiven a d x d matrix M, a very important class of linearequations is of the form
dxd dx1 dx1xMx λ=
which can be rewritten as 0I)x-(M =λ
If M is real and symmetric there are d possible solution vectors (vectors x that satisfy the charecteristic equation) called Eigen Vectors, e1, .., ed and associated Eigen values
dλλ ,...,1

12
First Principal ComponentThe matrix M is the Covariance matrix S,Characteristic Equation
0a)IS( =−λRoots are Eigen ValuesCorresponding Eigen Vectors are principal components
First principal component is the Eigen Vector associatedwith the largest Eigen value of S.

13
Other Principal ComponentsSecond Principal component is in direction orthogonal to firstHas second largest Eigen value, etc
First PrincipalComponent
x1
x2
SecondPrincipalComponent

14
Alternative Derivation of PCADHS Text gives another way to derive the fact that eigenvectors of scatter matrix are principal components By setting up the squared error criterion function of the data and the vector e that minimizes it satisfies the characteristic equationCan be generalized to from one-dimensional projection to a dimension d’ which are the eigen vectors of S forming the principal components

15
Projection into k Eigen Vectors
Variance of data projected into first k Eigen vectors is
Squared error in approximating true data matrix X using only first k Eigen vectors is
∑=
k
jj
1λ
∑
∑
=
+=p
ll
p
kjj
1
1
λ
λUsually 5 to 10 principalcomponents capture 90%of variance in the data

16
Scree Plot
Amount of varianceexplained by eachconsecutiveEigen value
CPU dataEigen values:63.2610.7010.306.685.232.181.310.34
Weights put by first componenton eight variables are:
0.199-0.365-0.399-0.336-0.331-0.298-0.421-0.423
CPU data (8 variables)
Eigen values of Correlation Matrix
Scatterplot Matrix for CPU data
Example of PCA
EigenVector

17
PCA using covariance matrixProportions ofvariation attributableto different components:96.023.930.040.010000
Scree Plots: (a) Eigen values from correlation matrix(b) Eigen values from covariance matrix

18
Graphical Use of PCA
First twoprincipal componentsof six dimensional data(17 pills:times at whichspecified proportionof pill has dissolved:10%,30%,50%,70%,75%,90%)
Pill 3 is very different
Projection onto first two principal componentsComponent 1
Com
pone
nt 2

19
Text Retrieval Application of PCARetrieving Documents based on Vector Space Model ( Key Words)Vector Space representation of documents
Query is represented as a vector, Distance is Cosine of angle between query and documentData Matrix is represented in terms of Principal Components using Singular Value Decomposition
database SQL index regression likelihood linearD1 24 21 9 0 0 3D2 32 10 5 0 3 0D3 12 16 5 0 0 0D4 6 7 2 0 0 0D5 43 31 20 0 3 0D6 2 0 0 18 7 16D7 0 0 1 32 12 0D8 3 0 0 22 4 2D9 1 0 0 34 27 25D10 6 0 0 17 4 23

20
Latent Semantic Indexing (LSI)Disadvantage of exclusive use of representing a document as a T-dimensional vector of term weights
Users may pose queries using terms different from terms used to index a documentE.g., term data mining is semantically similar to knowledge discovery

21
LSI methodApproximate the T-dimensional term space by kprincipal components directions in this space
Using the N x T document term matrix to estimate directionsResults in a N x k matrixTerms database, SQL, indexing etc are combined into a single principal component
22
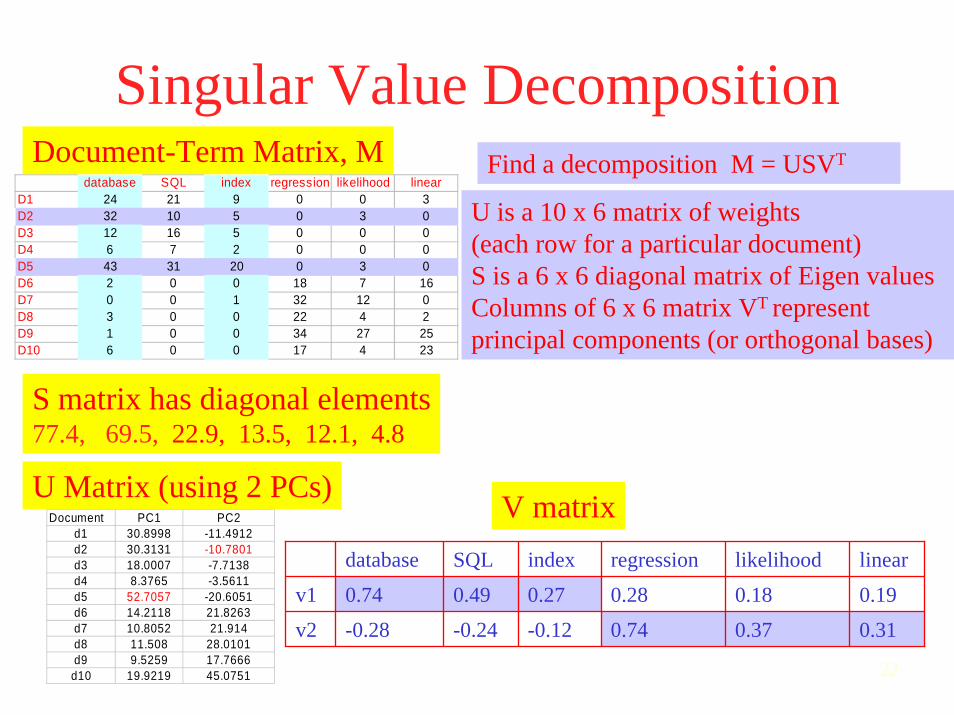
Singular Value Decompositiondatabase SQL index regression likelihood linear
D1 24 21 9 0 0 3D2 32 10 5 0 3 0D3 12 16 5 0 0 0D4 6 7 2 0 0 0D5 43 31 20 0 3 0D6 2 0 0 18 7 16D7 0 0 1 32 12 0D8 3 0 0 22 4 2D9 1 0 0 34 27 25D10 6 0 0 17 4 23
Document-Term Matrix, M Find a decomposition M = USVT
U is a 10 x 6 matrix of weights(each row for a particular document)S is a 6 x 6 diagonal matrix of Eigen valuesColumns of 6 x 6 matrix VT represent principal components (or orthogonal bases)
S matrix has diagonal elements77.4, 69.5, 22.9, 13.5, 12.1, 4.8
Document PC1 PC2d1 30.8998 -11.4912d2 30.3131 -10.7801d3 18.0007 -7.7138d4 8.3765 -3.5611d5 52.7057 -20.6051d6 14.2118 21.8263d7 10.8052 21.914d8 11.508 28.0101d9 9.5259 17.7666
d10 19.9219 45.0751
U Matrix (using 2 PCs) V matrixdatabase SQL index regression likelihood linear
v1 0.74 0.49 0.27 0.28 0.18 0.19
v2 -0.28 -0.24 -0.12 0.74 0.37 0.31

23
LSI Method: First Two Principal Components of Document Term Matrix
Database, SQL, index
Reg
ress
ion,
Like
lihoo
d,Li
near
D1: has database 50 timesD2: has SQL 50 timesNone of the other termsHave small distance in LSIWould be very differentin TF space
Projected locations of the 10 documents in two-dimensionalplane spanned by the first two principal components of document term matrix M
24
LSI Practical IssuesQuery is represented as a vector in PCA space and angle calculated
E.g., Query SQL is converted into pseudo vectorIn practice, computing PCA vectors directly is computationally infeasible.
Special purpose sparse SVD techniques for high-dimensions are used
Can also model Document-Term matrix probabilistically as a mixture of component distributions of terms conditioned on topics