completed genomes: bacteria and archaea monday, november 1, 2010 genomics 260.605.01 johns hopkins...
TRANSCRIPT

Completed Genomes:Bacteria and archaea
Monday, November 1, 2010
Genomics260.605.01
Johns HopkinsJ. Pevsner

Many of the images in this powerpoint presentationare from Bioinformatics and Functional Genomics(2nd edition) by J Pevsner. Copyright © 2009 by Wiley-Blackwell.
These images and materials may not be usedwithout permission from the publisher.
Visit http://www.bioinfbook.org
Copyright notice
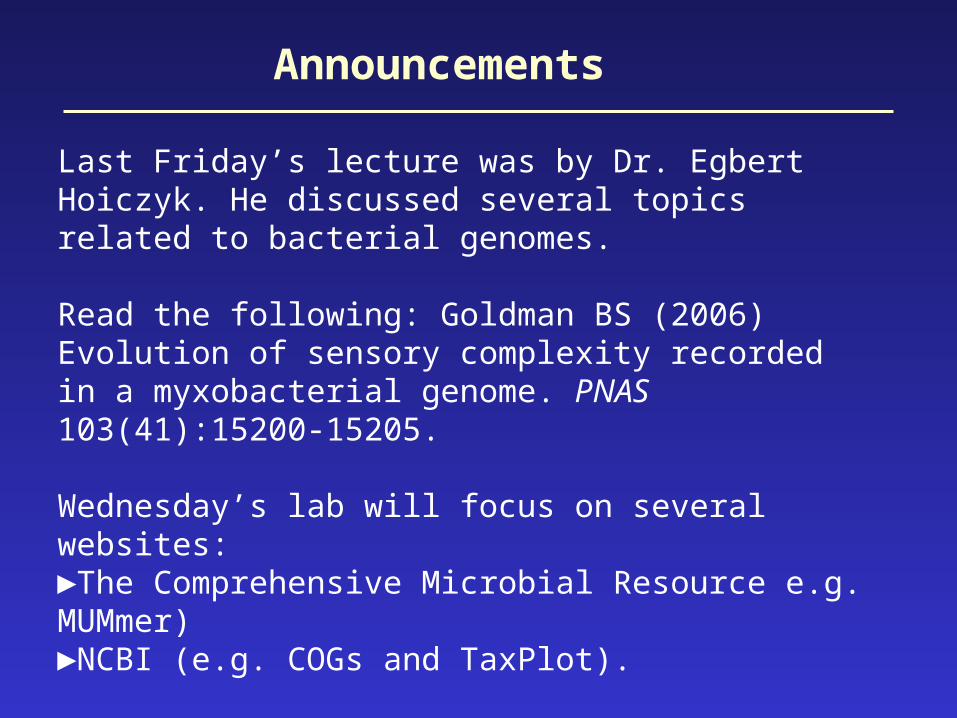
Last Friday’s lecture was by Dr. Egbert Hoiczyk. He discussed several topics related to bacterial genomes.
Read the following: Goldman BS (2006) Evolution of sensory complexity recorded in a myxobacterial genome. PNAS 103(41):15200-15205.
Wednesday’s lab will focus on several websites:►The Comprehensive Microbial Resource e.g. MUMmer) ►NCBI (e.g. COGs and TaxPlot).
Announcements

Introduction to bacteria and archaea (Chapter 15)Classification
…based on morphology…based on genome size…based on lifestyle…based on human disease relevance…based on rRNA or other sequences
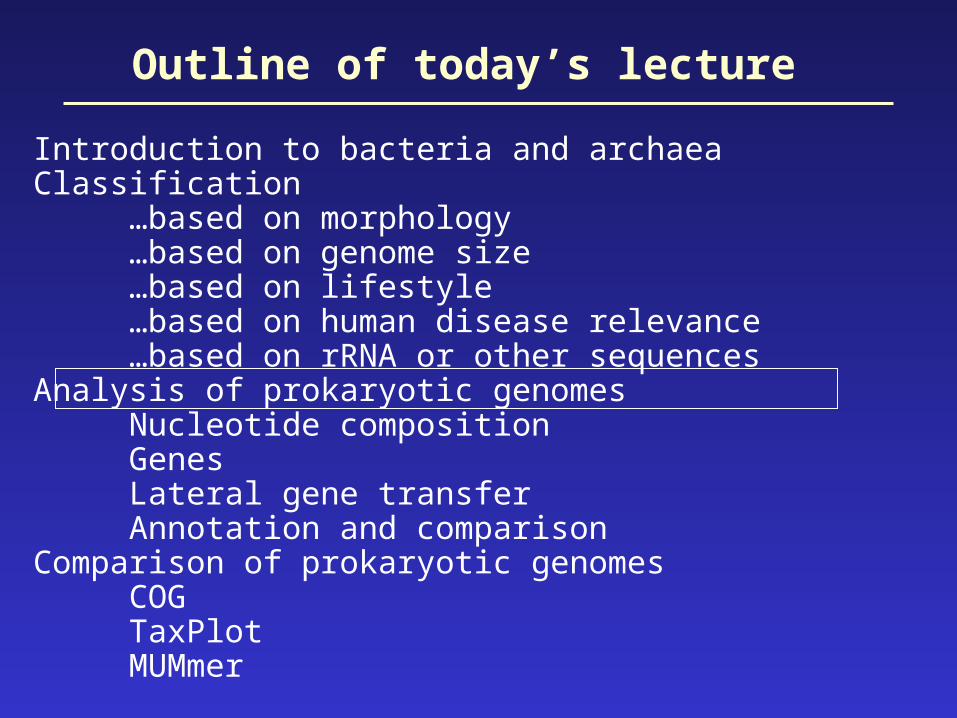
Analysis of prokaryotic genomesNucleotide compositionGenesLateral gene transferFunctional annotation and COGs
Comparison of prokaryotic genomesTaxPlotMUMmer
Outline of today’s lecture

Bacteria and archaea constitute two of the three mainbranches of life. Together they are the prokaryotes.
Prokaryotes are single-celled organisms (although some form colonies). They are characterized by a lack of a membrane-bound nucleus, a lack of extensive intracellular organelles, and lack of a cytoskeleton—features that are common to eukaryotes.
The word microbe refers to microorganisms that cause disease. These include both prokaryotes and a variety of eukaryotes (e.g. fungi and protozoa) that we will discuss later.
Bacteria and archaea: genome analysis
Page 598
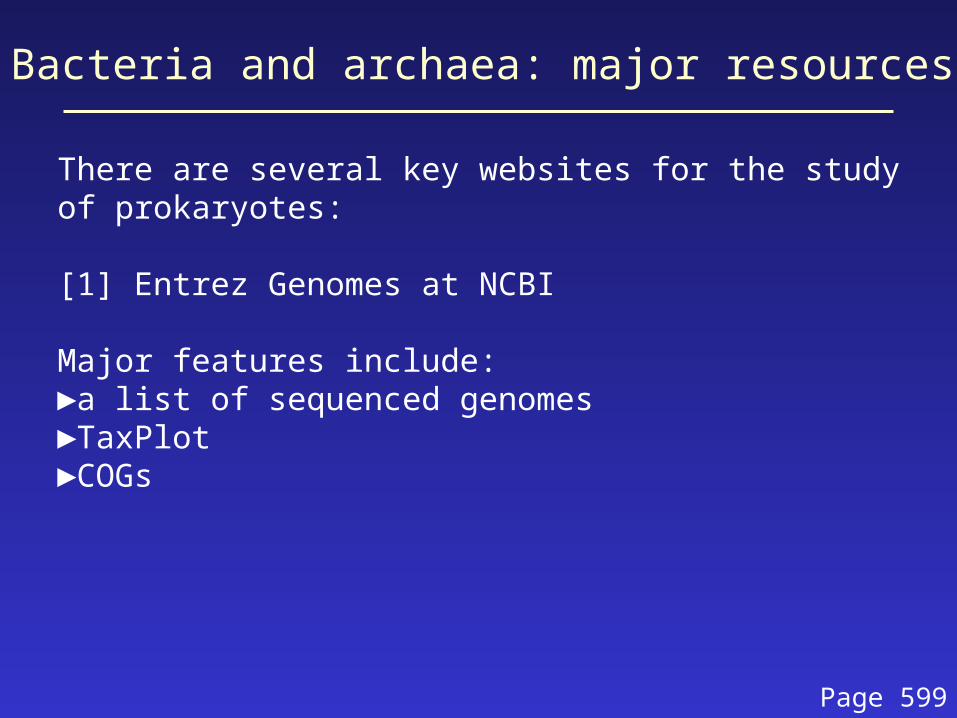
There are several key websites for the study of prokaryotes:
[1] Entrez Genomes at NCBI
Major features include:►a list of sequenced genomes►TaxPlot►COGs
Bacteria and archaea: major resources
Page 599

There are several key websites for the study of prokaryotes:
[2] The Comprehensive Microbial Resource (CMR) at the J. Craig Venter Institute (JCVI, formerly TIGR). Visit http://cmr.jcvi.org/.
Bacteria and archaea: major resources
Page 599current 10/09

[3] Integr8 at the European Bioinformatics Institute (EBI). Visit http://www.ebi.ac.uk/.
Bacteria and archaea: major resources
current 10/09
bacteria = 1455eukaryota = 80archaea = 73

Fig. 15.1Page 603

Introduction to bacteria and archaea Classification
…based on morphology…based on genome size…based on lifestyle…based on human disease relevance…based on rRNA or other sequences
Analysis of prokaryotic genomesNucleotide compositionGenesLateral gene transferAnnotation and comparison
Comparison of prokaryotic genomesCOGTaxPlotMUMmer
Outline of today’s lecture

We can classify prokaryotes based on six criteria:
[1] morphology[2] genome size[3] lifestyle[4] relevance to human disease[5] molecular phylogeny (rRNA)[6] molecular phylogeny (other molecules)
Bacteria and archaea: genome analysis
Page 599

The gram stain is absorbed by about half of all bacteria. (It reflects the protein and peptidoglycan composition of the cell wall.) Most bacteria can be classified in the following groups:
Type ExamplesGram-positive cocci † Staphylococcus aureusGram-positive rods Bacillus anthracis (anthrax)Gram-negative cocci NeisseriaGram-negative rods Escherichia coli, Vibrio choleraeOther Mycobacterium leprae (leprosy)
Borrelia burgdorferi (Lyme)Chlamydia trachomatisMycoplasma pneumoniae
† having a spherical shape
Prokaryotic classification: morphology
Page 601

Bacterial and archaeal genomes vary over a 25-fold range from ~0.5 megabases (Mb) to ~13 Mb.
Bacteria: typically ~0.5 Mb to 13.2 MbSmallest: Candidatus Carsonella ruddii PV (0.16 Mb)Largest: Solibacter usitatus Ellin6076 (10 Mb)
Archaea: ~0.5 Mb to ~6 MbSmallest: Nanoarchaeum equitans Kin4-M (0.49 Mb)Largest: Methanosarcina acetivorans C2A (5.75 Mb)
Prokaryotic classification: genome size
Page 602Updated 10/09

Genome size comparisons:
A Nanoarchaeum equitans 490,885 bp 582 genesB Mycoplasma genitalium 580,070 bp 506 genesV Mimivirus 1.2 Mb ~1200 genesB Streptomyces coelicolor 8.7 Mb 7800 genesB Myxococcus xanthus 9.14 Mb 7388 genesE Schizosaccharomyces pombe 13 Mb 4800 genes
Key:V=virusA=archeonB=bacteriumE=eukaryote
Prokaryotic classification: genome size
Page 602

Number of predicted protein-encoding genes versus genome size for 244 complete published genomes from bacteria and archaea. P. ubique has the smallest number of genes (1354 open reading frames) for any free-living organism. Giovannoni SJ (2005) Science 309:1242
Linear relationship between prokaryotic genome size and number of genes
geno
me
size

Page 604
M. genitalium hasone of the smallestbacterial genomesizes (578 kb).
View its genome atwww.jcvi.org

M. genitalium at JCVI

We may distinguish six prokaryotic lifestyles:[1] extracellular (e.g. E. coli)[2] facultatively intracellular (Mycobacterium tuberculosis)[3] extremophilic (e.g. M. jannaschi)[4] epicellular bacteria (e.g. Mycoplasma pneumoniae)[5] obligate intracellular and symbiotic (B. aphidicola)[6] obligate intracellular and parasitic (Rickettsia)
Prokaryotic classification: lifestyles
Page 607
These tend to have an extreme reduction in genome size
*
*

Vaccine-preventable bacterial diseases
Anthrax Bacillus anthracisDiarrheal disease (cholera)Vibrio choleraeDiphtheria Cornyebacterium diphtheriaeLyme disease Borrelia burgdorferiMeningitis Haemophilus influenzae type B
Streptococcus pneumoniae Neisseria meningitidis
Pertussis Bordetella pertussisTetanus Clostridium tetaniTuberculosis Mycobacterium tuberculosisTyphoid Salmonella typhi
Prokaryotic classification: disease relevance
Page 611

16S ribosomal RNA (rRNA) based trees by Woese and colleagues showed distinct superkingdoms of bacteria and archaea.
The following figure (adapted from Casjens, 1998) summarizes bacterial chromosome size and geometry. 23 major named bacterial phyla are shown. Geometry (circular or linear chromosomes) and genome sizes (in kb) are indicated. Branch lengths are not proportional to evolutionary distance.
Note that four phyla have been sampled most extensively: Proteobacteria, Firmicutes, Actinobacteria, and Bacteroidetes. These account for >90% of known bacteria.
Prokaryotic classification: rRNA phylogeny
Page 611

Fig. 15.1Page 603

Visit NCBI All databases Genome Projects for data on prokaryotic genome projects
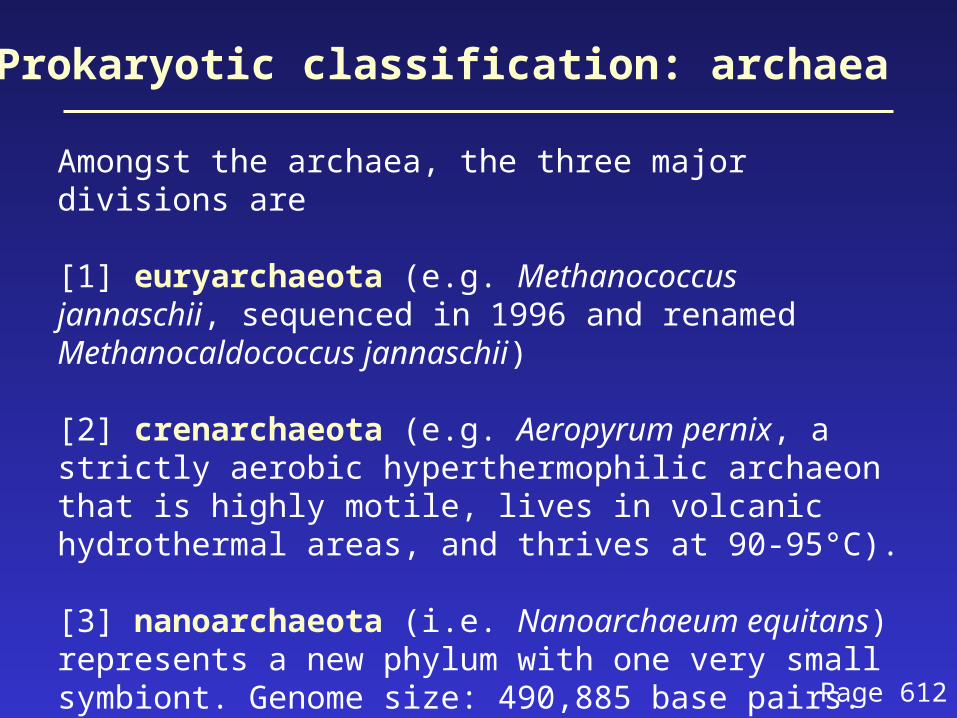
Amongst the archaea, the three major divisions are
[1] euryarchaeota (e.g. Methanococcus jannaschii, sequenced in 1996 and renamed Methanocaldococcus jannaschii)
[2] crenarchaeota (e.g. Aeropyrum pernix, a strictly aerobic hyperthermophilic archaeon that is highly motile, lives in volcanic hydrothermal areas, and thrives at 90-95°C).
[3] nanoarchaeota (i.e. Nanoarchaeum equitans) represents a new phylum with one very small symbiont. Genome size: 490,885 base pairs.
Prokaryotic classification: archaea
Page 612

Introduction to bacteria and archaeaClassification
…based on morphology…based on genome size…based on lifestyle…based on human disease relevance…based on rRNA or other sequences
Analysis of prokaryotic genomesNucleotide compositionGenesLateral gene transferAnnotation and comparison
Comparison of prokaryotic genomesCOGTaxPlotMUMmer
Outline of today’s lecture

We begin our discussion of the composition of prokaryoticgenomes with a sample paper describing a genome.
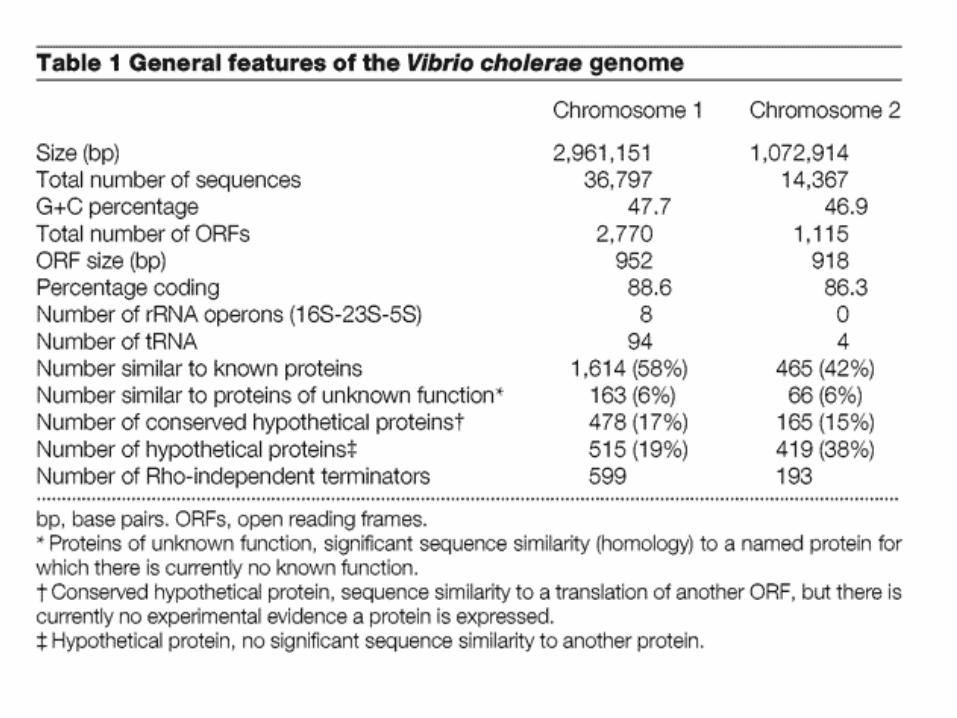
Heidelberg JF et al. DNA sequence of both chromosomes of the cholera pathogen Vibrio cholerae. Nature 406, 477- 483 (2000)
Cholera is an acute diarrheal disease endemic in India, parts of Africa and Southeast Asia. It is caused by V. cholerae, and in some cases leads to rapid death. The following slide shows the Nature article’s abstract.

Here we determine the complete genomic sequence of the gram negative, gamma-Proteobacterium Vibrio cholerae El Tor N16961 to be 4,033,460 base pairs (bp). The genome consists of two circular chromosomes of 2,961,146 bp and 1,072,314 bp that together encode 3,885 open reading frames. The vast majority of recognizable genes for essential cell functions (such as DNA replication, transcription, translation and cell-wall biosynthesis) and pathogenicity (for example, toxins, surface antigens and adhesins) are located on the large chromosome. In contrast, the small chromosome contains a larger fraction (59%) of hypothetical genes compared with the large chromosome (42%), and also contains many more genes that appear to have origins other than the gamma-Proteobacteria. The small chromosome also carries a gene capture system (the integron island) and host 'addiction' genes that are typically found on plasmids; thus, the small chromosome may have originally been a megaplasmid that was captured by an ancestral Vibrio species. The V. cholerae genomic sequence provides a starting point for understanding how a free-living, environmental organism emerged to become a significant human bacterial pathogen.

Eight circlesprotein-coding, + strandprotein-coding, - strandrecently duplicated genestransposon, phage-relatedtrinucleotide composition% GC in relation to meantRNArRNA

Metabolism and transport in V. cholerae.
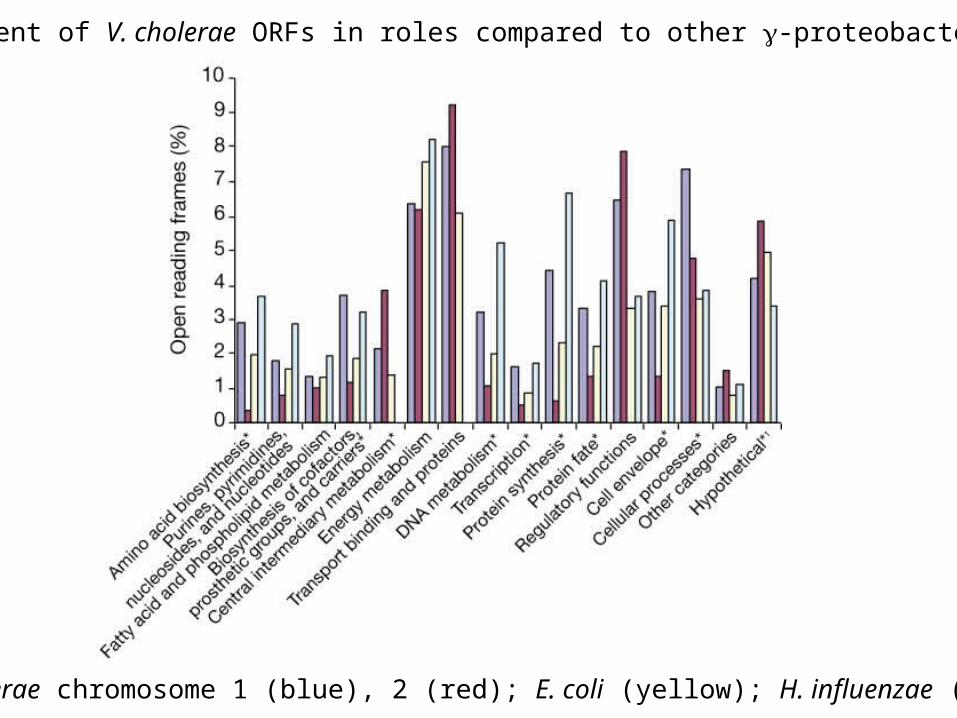
Percent of V. cholerae ORFs in roles compared to other -proteobacteria
V. cholerae chromosome 1 (blue), 2 (red); E. coli (yellow); H. influenzae (blue)
Introduction to bacteria and archaeaClassification
…based on morphology…based on genome size…based on lifestyle…based on human disease relevance…based on rRNA or other sequences
Analysis of prokaryotic genomesNucleotide compositionGenesLateral gene transferAnnotation and comparison
Comparison of prokaryotic genomesCOGTaxPlotMUMmer
Outline of today’s lecture

The guanine plus cytosine (GC) content in bacteria ranges from ~20% to 75% (in archaea from ~28% to 66%). GC content often correlates with bacterial phylum (see tree).
We will see in a later lecture that eukaryotic genomes have GC contents that often have a restricted range from ~35-50% (about 40%-45% in vertebrates).
Bacteria and archaea: nucleotide composition
Page 615

Fig. 15.6Page 616
GC content for 584 sequenced prokaryotic genomes
Updated 12/07

Fig. 15.6Page 616
GC content for 584 sequenced prokaryotic genomes
Updated 12/07
What is the consequence of extreme GC content on protein composition?

Fig. 15.1Page 603
40-60% GC
67-74% GC
~40%
~50%
~23-35%
~30-33%
~25-31%

Bacteria with low GC content (16% to 25%; NCBI, 11/08)
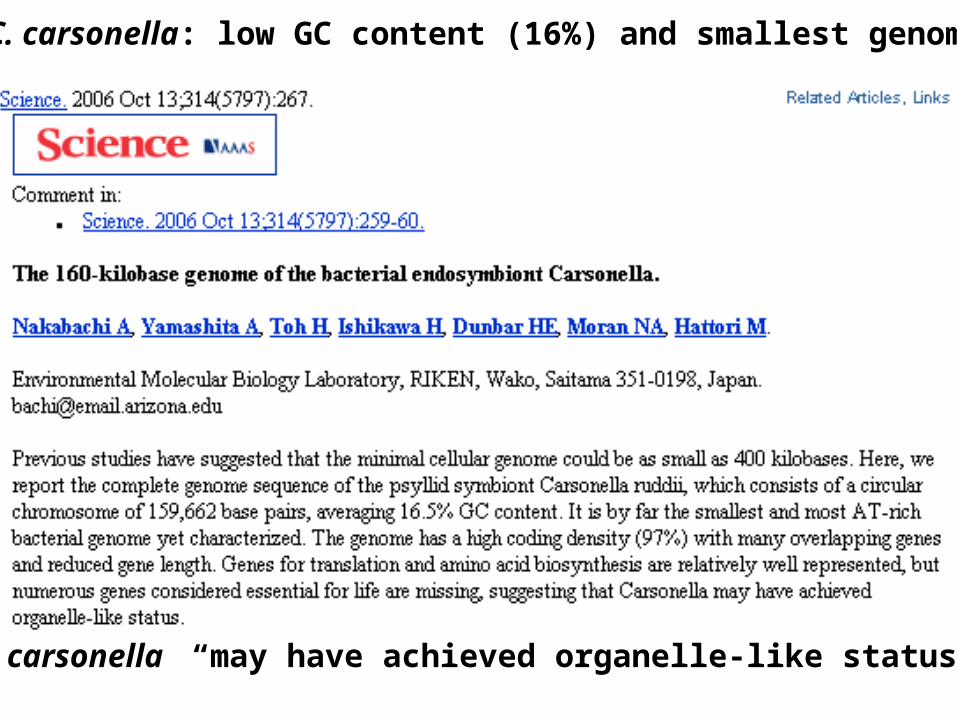
C. carsonella: low GC content (16%) and smallest genome
C. carsonella “may have achieved organelle-like status”
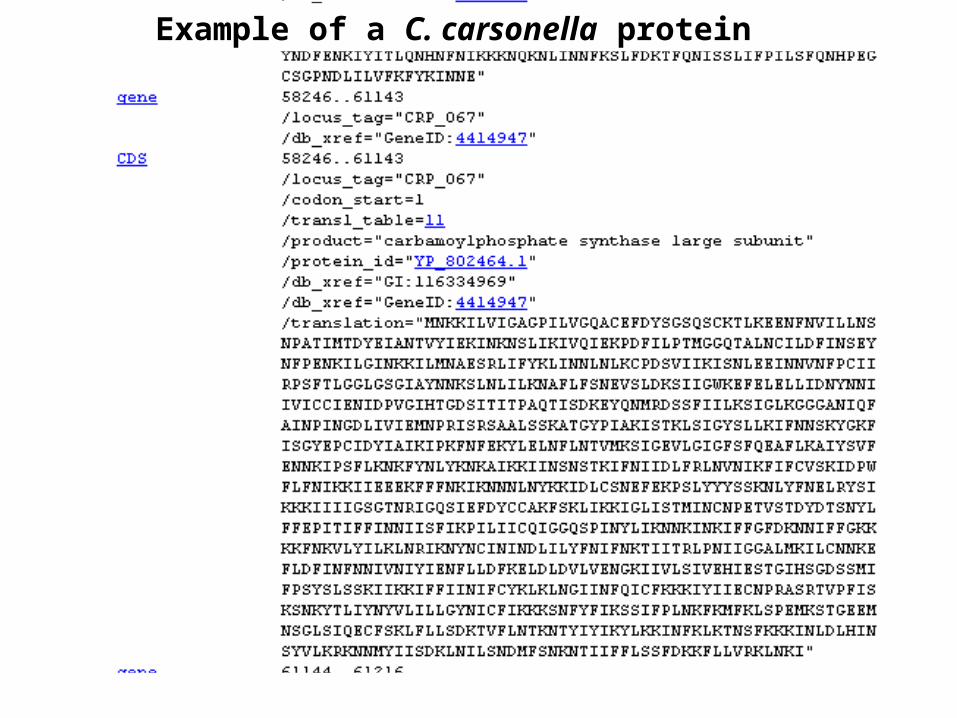
Example of a C. carsonella protein

Candidatus Carsonella ruddii PV159,662 nt NC_008512
Example of a C. carsonella contig (note AT richness)

NT_029490Homo sapiens chromosome 21 genomic contig

Bacteria with high GC content (NCBI 11/06)

Archaea with low GC content (NCBI 11/06)

Archaea with high GC content (NCBI 11/06)

Relationship between genome sizes and GC content of 358 complete genomes from Bacteria and Archaea: red indicates Carsonella; blue represents endosymbionts Buchnera, Blochmannia, Wigglesworthia, and Baumannia; yellow, other Bacteria; and green, Archaea. Nakabachi A (2006) Science 314:267.
(182 ORFs, most devoted to translationand amino acid metabolism. 97.3% gene-coding density)
Correlation between genome size and GC content

There are two main theories to account for the variation in GC content in prokaryotes (Li and Graur, 1991):
►Selectionist hypothesis. GC content is an adaptation to environmental conditions. GC-rich codons (encoding ala, arg) are more stable in hot environments; AT-rich codons (encoding ser, lys) are thermally unstable. TT dimers are sensitive to radiation, so soil- and air-exposed prokaryotes may have a higher GC content.
►Mutationist hypothesis. GC content is determined by biases in the mutation patterns.
Bacteria and archaea: nucleotide composition
(Page 616)

Genome annotation involves the identification of features such as protein-coding genes, noncoding genes, or regulatory elements.
For the annotation of genes, four main features of genomic DNA are useful. In particular, genes must be distinguished from randomly occurring open reading frames.[1] Open reading frame length. An ORF begins with a start codon (ATG or sometimes GTG or TTG in bacteria) and ends with a stop codon (TAA, TAG, TGA)[2] Consensus for ribosome binding (Shine-Dalgarno)[3] Pattern of codon usage[4] Homology of putative gene to other genes
Bacteria and archaea: finding genes
Page 617

Glimmer (Gene Locator and Interpolated Markov Modeler) uses interpolated Markov models (IMMs) to identify coding regions and distinguish them from noncoding DNA.
The Glimmer home page is:http://cbcb.umd.edu/software/glimmer/
Glimmer involves two steps:[1] Training the algorithm for a particular organism. This involves first identifying all ORFs, and sometimes also involves blast searching them against other organisms[2] Running the trained algorithm against the genome sequence.
Glimmer for prokaryotic gene finding
Page 618

Glimmer sequentially scans nucleotide sequences for particular kmers (e.g. the 5mer ATGGC) and estimates the probability of that pattern occurring in a real gene. The statistical model of a gene is then used to analyze the complete set of unknown genomic DNA. The ORFs that are analyzed by Glimmer must exceed some minimum length (e.g. 99 base pairs).
Glimmer uses a hidden Markov model (HMM) approach. HMMs are statistical models of the patterns of nucleotides comprising a gene. The HMM includes observed states (e.g. nucleotide sequence including a start or stop codon) and hidden states (genes in DNA).
Glimmer for prokaryotic gene finding
Page 618

Fig. 15.8Page 619
GLIMMER for gene-finding in prokaryotes (76,000 nucleotides of E. coli genomic DNA)
gene scoreframe
frame scores
list of identified genes

Lateral gene transfer (LGT), also called horizontal gene transfer (HGT), is a phenomenon in which a genome acquires a gene from another organism directly, but not by descent. The gene transfer is unidirectional (rather than involving a reciprocal exchange of DNA).
Bacteria and archaea: lateral gene transfer
Page 620

LGT may represent a major, “alternative” form of non-vertical evolution. It is a process that offers organisms the capacity to adopt novel functions. LGT is significant as a possible source of error in phylogenetic analyses.
LGT may be incorrectly ascribed when other mechanisms operate such as selection, variable evolutionary rates, and biased sampling (see JA Eisen [2000] Curr. Op. Genet. Devel. 10:606).
Lateral gene transfer: significance
Page 620
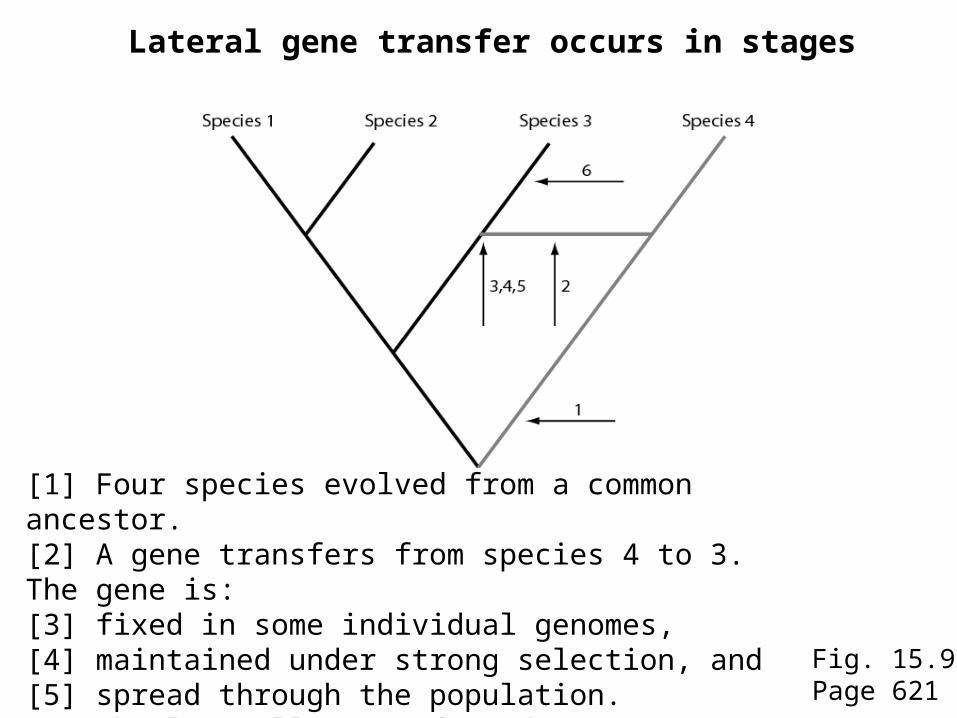
Fig. 15.9Page 621
Lateral gene transfer occurs in stages
[1] Four species evolved from a common ancestor. [2] A gene transfers from species 4 to 3. The gene is: [3] fixed in some individual genomes, [4] maintained under strong selection, and [5] spread through the population. [6] The laterally transferred gene continues to evolve.

There are many examples of LGT, both in many bacterial genomes, and between distantly related organisms.
►It has occurred in the parasitic amoeba Entamoeba histolytica. It may have received metabolic genes from bacterial co-habitants in the human gastrointestinal tract. (See Loftus B et al. (2005) Nature Feb. 24)
►Proteorhodopsin has been transferred between marine planktonic bacteria and archaea. In an upper water column of the ocean, archaea of the order Thermoplasmatales have proteorhodopsins that otherwise have been thought to be present in proteobacteria or other bacteria (Frigaard N-U et al. (2006) Nature 439:847).
Lateral gene transfer: examples
Page 622
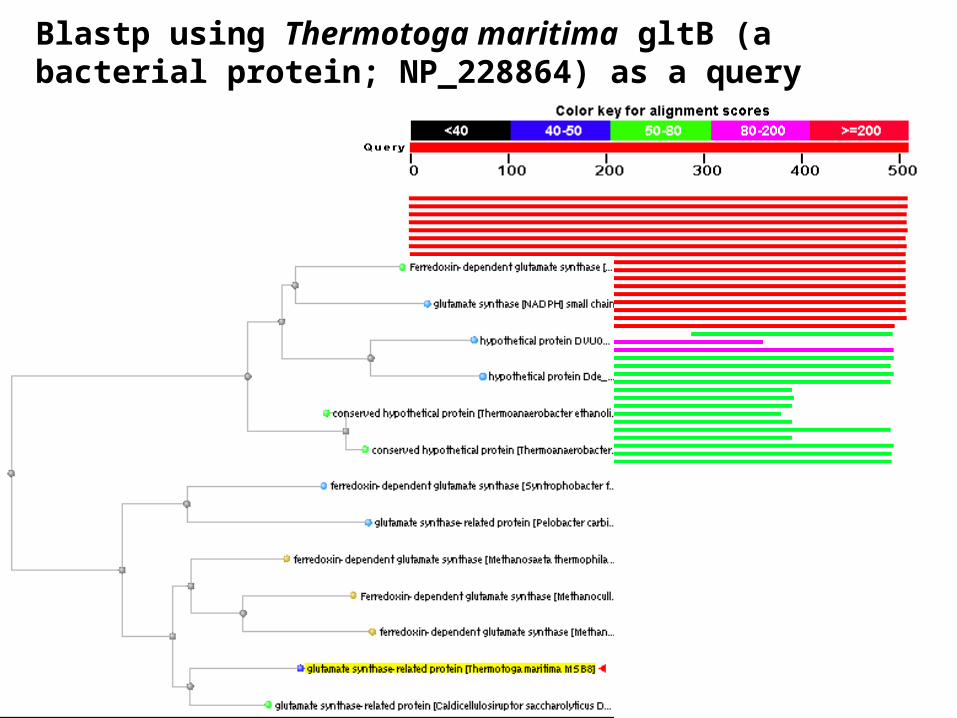
Blastp using Thermotoga maritima gltB (a bacterial protein; NP_228864) as a query

Blastp using Thermotoga maritima gltB (NP_228864) as a query results in close matches to many homologs
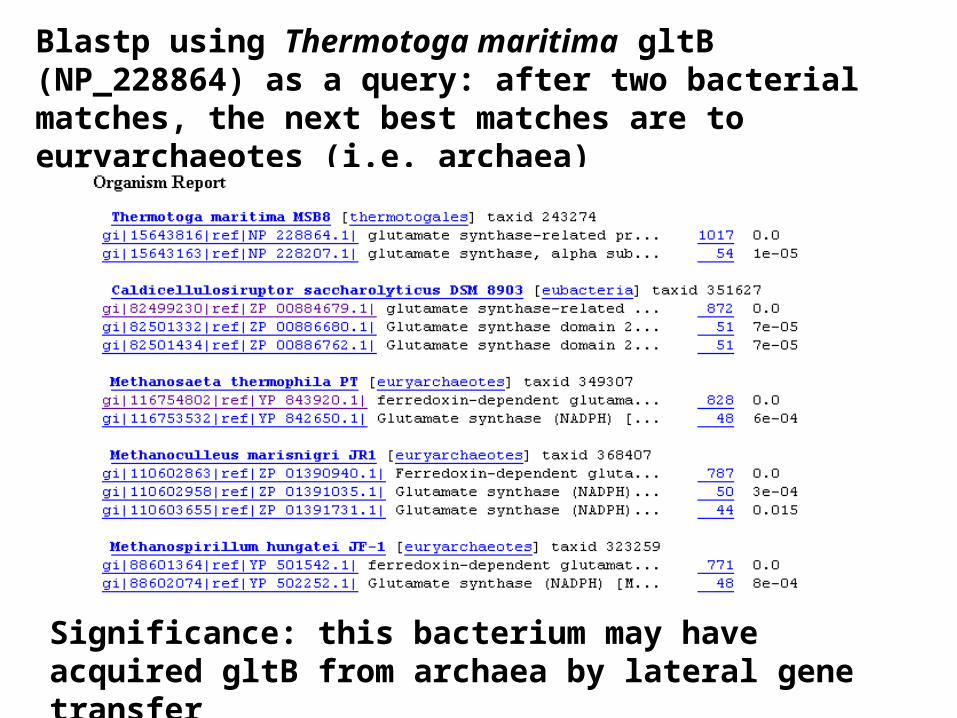
Blastp using Thermotoga maritima gltB (NP_228864) as a query: after two bacterial matches, the next best matches are to euryarchaeotes (i.e. archaea)
Significance: this bacterium may have acquired gltB from archaea by lateral gene transfer

Blastp using Thermotoga maritima myo-inositol-1-phosphate synthase-related protein (bacterial; NP_229219) as a query

Blastp using Thermotoga maritima myo-inositol-1-phosphate synthase-related protein (NP_229219) as a query…
…shows close matches to archaea

The COG project defines groups of orthologous genes in various prokaryotic (COGs) and eukaryotic (KOGs) species. The COG database provides a functional and phylogenetic classification of protein groups based on “best-hit” blast results.
Clusters of Orthologous Genes (COGs)
Page 622

Page 623

As an example click on code J…

For functional category J there are 245 COGs; some highly conserved (present in all prokaryotic species indicated…)
Page 624

Phyletic patterns of COGs. All, represented in all unicellular organisms included in the COG system; All archaea, All bacteria, All eukaryotes, represented in each species from the respective domain of life (and possibly in some species from other domains); All bacteria except the smallest, represented in all bacteria except, possibly, parasites with small genomes (mycoplasma, chlamydia, rickettsia, and spirochetes).
Tatusov RL et al. (2003) BMC Bioinformatics. 4: 41.

Tatusov RL et al. (2003) BMC Bioinformatics. 4: 41.
Phyletic patterns of KOGs. All, include representatives from each of the 7 analyzed species; All-Ec, include representatives from each of 6 species other than Encephalitozoon cuniculi; All animals, include representatives from three animal genomes only; All fungi, include representatives from two fungal genomes only.

Functional classification of prokaryotic (COGs) and eukaryotic (KOGs) clusters of orthologs. Designations of functional categories: A, RNA processing and modification (not used for prokaryotic COGs), B, chromatin structure and dynamics, C, energy production and conversion, D, cell cycle control and mitosis, E, amino acid metabolism and transport, F, nucleotide metabolism and transport, G, carbohydrate metabolism and transport, H, coenzyme metabolism, I, lipid metabolism, J, translation, K, transcription, L, replication and repair, M, cell wall/membrane/envelope biogenesis, N, Cell motility, O, post-translational modification, protein turnover, chaperone functions, P, Inorganic ion transport and metabolism, Q, secondary metabolites biosynthesis, transport and catabolism, T, signal transduction, U, intracellular trafficking and secretion, Y, nuclear structure (not applicable to prokaryotic COGs), Z, cytoskeleton (not applicable to prokaryotic COGs); R, general functional prediction only (typically, prediction of biochemical activity), S, function unknown. The numbers were obtained after subtracting the COGs that consisted entirely of proteins from unicellular eukaryotes from the COG collection.

Eukaryotic clusters in COG

Distribution of COGs across genomes
Some COGs are present in all prokaryotic genomes sampled
Some COGs are not phylogenetically distributed
Page 624

Introduction to bacteria and archaea (Chapter 15)Classification
…based on morphology…based on genome size…based on lifestyle…based on human disease relevance…based on rRNA or other sequences
Analysis of prokaryotic genomesNucleotide compositionGenesLateral gene transferAnnotation and comparison
Comparison of prokaryotic genomesCOGTaxPlotMUMmer
Outline of today’s lecture
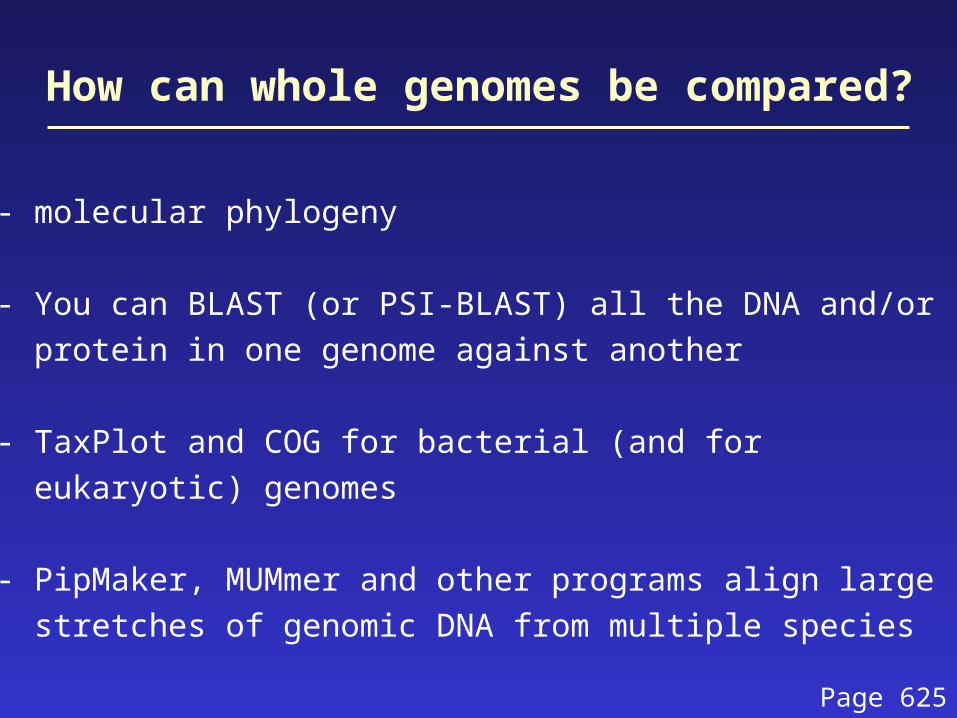
How can whole genomes be compared?
-- molecular phylogeny
-- You can BLAST (or PSI-BLAST) all the DNA and/or
protein in one genome against another
-- TaxPlot and COG for bacterial (and for
eukaryotic) genomes
-- PipMaker, MUMmer and other programs align large
stretches of genomic DNA from multiple species
Page 625

To use TaxPlot, select a query genome then select two more genomes for comparison. The tool plots blastp scores from the predicted proteins encoded by each genome. The shape of the output plot may reveal differences between two comparison genomes of interest. For example, one can explore which proteins differ in a pathogenic versus a benign strain of E. coli.
TaxPlot at NCBI
Page 626

Page 626
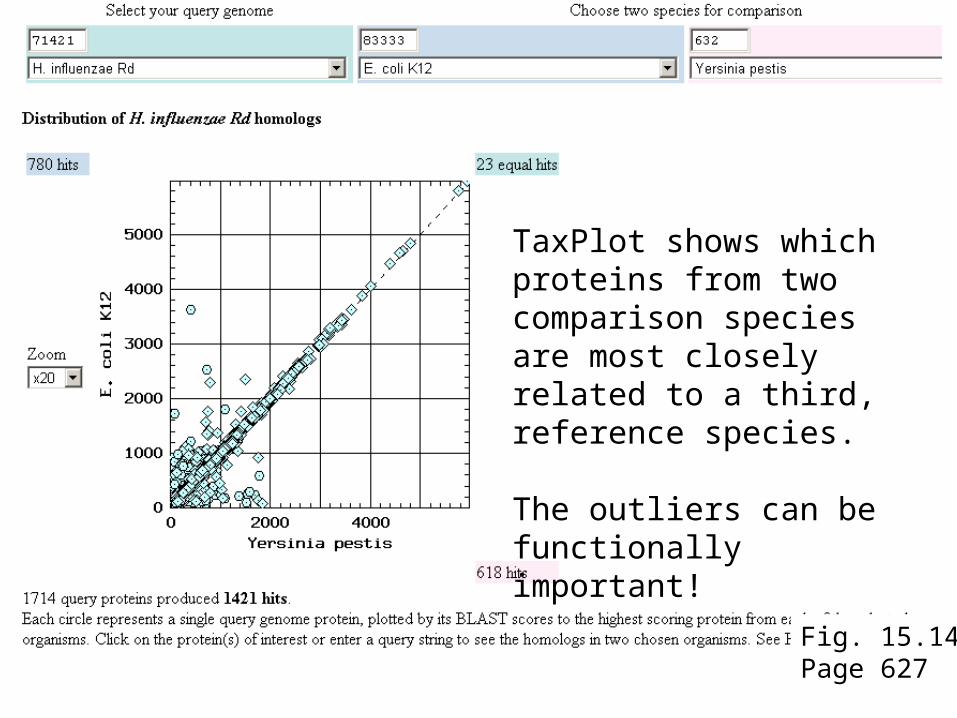
Fig. 15.14Page 627
TaxPlot shows which proteins from two comparison species are most closely related to a third, reference species.
The outliers can be functionally important!
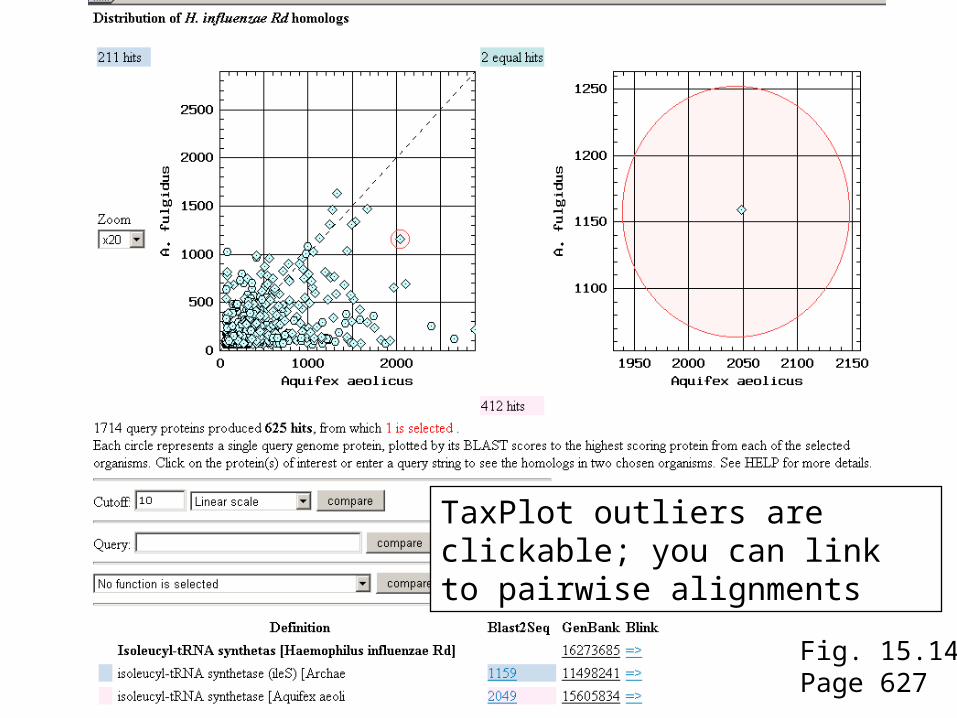
Fig. 15.14Page 627
TaxPlot outliers are clickable; you can link to pairwise alignments

TaxPlot options include log-log scale

MUMmer is a tool for DNA alignments of complete genomes (or of chromosomes). The algorithm uses a suffix tree approach to identify all exact matches of nucleotide subsequences that are at least some minimum length (e.g. 20 or 150 base pairs). In this way maximal unique matching subsequences (MUMs) are identified.
Aligning genomes: MUMmer
Page 628

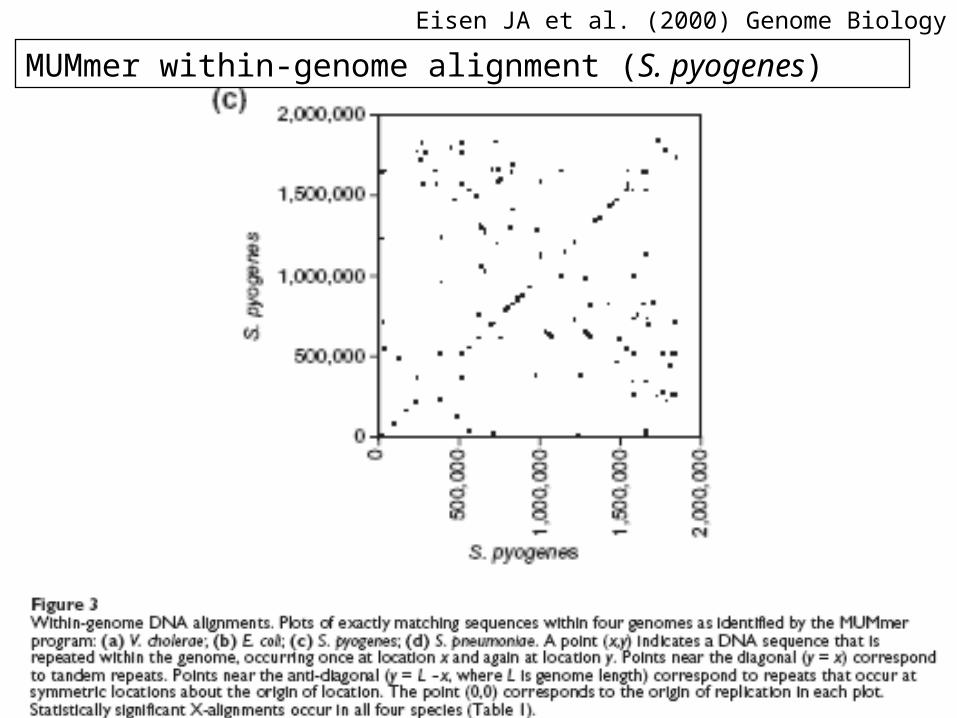
Eisen JA et al. (2000) Genome Biology 1(6)
MUMmer pairwise genome alignment: visualizing shared regions, inversions, translocations

Eisen JA et al. (2000) Genome Biology 1(6)
MUMmer pairwise genome alignment: comparisons within V. cholerae
Eisen JA et al. (2000) Genome Biology 1(6)
MUMmer within-genome alignment (S. pyogenes)


Fig. 15.15Page 629

Compare Mycobacterium tuberculosis and M. leprae

For a dot plot, the reference sequence is laid across the x-axis, while the query sequence is on the y-axis. Wherever the two sequences agree, a colored line or dot is plotted. The forward matches are displayed in red, while the reverse matches are displayed in green. If the two sequences were perfectly identical, a single red line would go from the bottom left to the top right. However, two sequences rarely exhibit this behavior, and in the plot below, multiple gaps and inversions can be identified between these two strains of Helicobacter pylori.
http://mummer.sourceforge.net/manual/

Running MUMmer there are three options:
MUMmer
NUCmer
PROmer
Aligning genomes: MUMmer

NUCmer (NUCleotide MUMmer) is the most user-friendly alignment script for standard DNA sequence alignment. It is a robust pipeline that allows for multiple reference and multiple query sequences to be aligned in a many vs. many fashion. For instance, a very common use for nucmer is to determine the position and orientation of a set of sequence contigs in relation to a finished sequence, however it can be just as effective in comparing two finished sequences to one another. Like all of the other alignment scripts, it is a three step process - maximal exact matching, match clustering, and alignment extension. It begins by using mummer to find all of the maximal unique matches of a given length between the two input sequences. Following the matching phase, individual matches are clustered into closely grouped sets with mgaps. Finally, the non-exact sequence between matches is aligned via a modified Smith-Waterman algorithm, and the clusters themselves are extended outwards in order to increase the overall coverage of the alignments. nucmer uses the mgaps clustering routine which allows for rearrangements, duplications and inversions; as a consequence, nucmer is best suited for large-scale global alignments, as is shown in the following plot.
http://mummer.sourceforge.net/manual/

http://mummer.sourceforge.net/manual/
Helicobacter pylori 26695
He
lico
bact
er
pylo
ri J
99
PROmer (PROtein MUMmer) is a close relative to the NUCmer script. It follows the exact same steps as NUCmer and even uses most of the same programs in its pipeline, with one exception - all matching and alignment routines are performed on the six frame amino acid translation of the DNA input sequence. This provides promer with a much higher sensitivity than nucmer because protein sequences tends to diverge much slower than their underlying DNA sequence. Therefore, on the same input sequences, promer may find many conserved regions that nucmer will not, simply because the DNA sequence is not as highly conserved as the amino acid translation.
Aligning genomes: PROmer
http://mummer.sourceforge.net/manual/

All of this is performed behind the scenes, as the input is still the raw DNA sequence and output coordinates are still reported in reference to the DNA, so the two programs (nucmer and promer) exhibit little difference in their interfaces and usability. Because of its greatly increased sensitivity, it is usually best to use promer on those sequences that cannot be adequately compared by nucmer, because if run on very similar sequences the promer output can be quite voluminous. This is because promer makes no effort to distinguish between proteins and junk amino acid translations, therefore a single highly conserved gene may have up to six alignments in promer output, one for each of the six amino acid reading frames, when only the correct reading frame would be sufficient. This makes promer ideally suited for highly divergent sequences that show little DNA sequence conservation, as is shown in the following two plots.
http://mummer.sourceforge.net/manual/

These dot plots represent two comparisons of Streptococcus pyogenes (x-axis) and Streptococcus mutans (y-axis), with forward matches colored red and reverse matches colored green. The graph generated with nucmer output is on the left, while the graph generated with promer output is on the right (both run with default parameters). It is clearly visible that promer has aligned the two genomes with a much greater sensitivity, thus demonstrating the effectiveness of comparing two divergent genomes on the amino acid level.
http://mummer.sourceforge.net/manual/

Wednesday Nov. 3: our first lab (bring a laptop to class)
Friday Nov. 5: The eukaryotic chromosome (Ch. 16)
Monday Nov. 8: the fungi (Ch. 17)
Wednesday Nov. 10: Jef Boeke (yeast functional genomics)
Next in the class