complete protection against aflatoxin b 1-induced liver ... · pdf filezebrafish, guppy,...
TRANSCRIPT

Complete Protection against Aflatoxin B1-induced Liver Cancer
with a Triterpenoid: DNA Adduct Dosimetry and Genotoxic Threshold
Bill D. Roebuck1, John D. Groopman2, and Thomas W. Kensler2,3
1Department of Pharmacology and Toxicology, The Geisel School of Medicine at Dartmouth,Hanover, New Hampshire
2Department of Environmental Health Sciences, Bloomberg School of Public Health,Baltimore, Maryland
3Department of Pharmacology and Chemical Biology, University of Pittsburgh, Pittsburgh, Pennsylvania

Natalie M. Johnson, Patricia A. Egner, Victoria K. Baxter, Michael B. Sporn, Ryan S. Wible, Thomas R. Sutter, John D. Groopman, Thomas W. Kensler, and Bill D. Roebuck
Complete Protection against Aflatoxin B1-Induced Liver Cancer with a Triterpenoid: DNA Adduct Dosimetry,
Molecular Signature, and Genotoxicity Threshold
Cancer Prevention Research 7:658-665, 2014
Baltimore, 1983
Collaborative efforts for nearly 4 decades
Groopman
Kensler
Roebuck

General Background of Aflatoxins as
Acute Hepatotoxin and Hepatocellular Carcinogen

Aflatoxins
• Discovered in UK ~1960 in moldy, toxic animal feed– Lethal protein component to poultry feed (“Turkey X disease”)
• Chemical and biological properties– Highly fluorescent, heat stable– Multiple forms - aflatoxin B1 most toxic/carcinogenic– Liver carcinogen in virtually all animals tested– Acute toxicant and carcinogen for humans
• Frequent contaminant of improperly stored food crops– Produced by strains of mold Aspergillus flavus
(A.flavus toxin = “Aflatoxin”)– Spores globally distributed in soil– Mold grows on food crops not properly dried
O
O
O
O
O
H
H
OCH3
Aflatoxin B1 (AFB1)
• Maize (corn)• Groundnuts
(peanuts)

AFB1 as Hepatocellular CarcinogenSensitive µg/kg/day Rainbow Trout
Pekin DuckFischer RatSprague-Dawley RatZebrafish, Guppy, Medaka
Intermediate Brook Trout, Tree ShrewHamsterSquirrel Monkey
? [Human] ? Rhesus, African Green, &Cynomolgus monkey
ChickenMouseAmphibians
Resistant mg/kg/day Channel Catfish, Salmon

Hepatic Carcinogenesis: Aflatoxins
Aflaxtoxins-induced liver cancer in rats: 1963 Rainbow trout (Salmo gairdneri) sensitive
Cheap & easy to use large numbers
Mouse resistant to aflatoxin Activates AFB1, but detoxifies efficiently
Fischer (F344 strain) very sensitive Carcinogenic response: males > females Hepatocellular carcinomas - 1 to 2 years 40 rats/arm: large & expensive experiment
World Cancer Report 2014, IARC
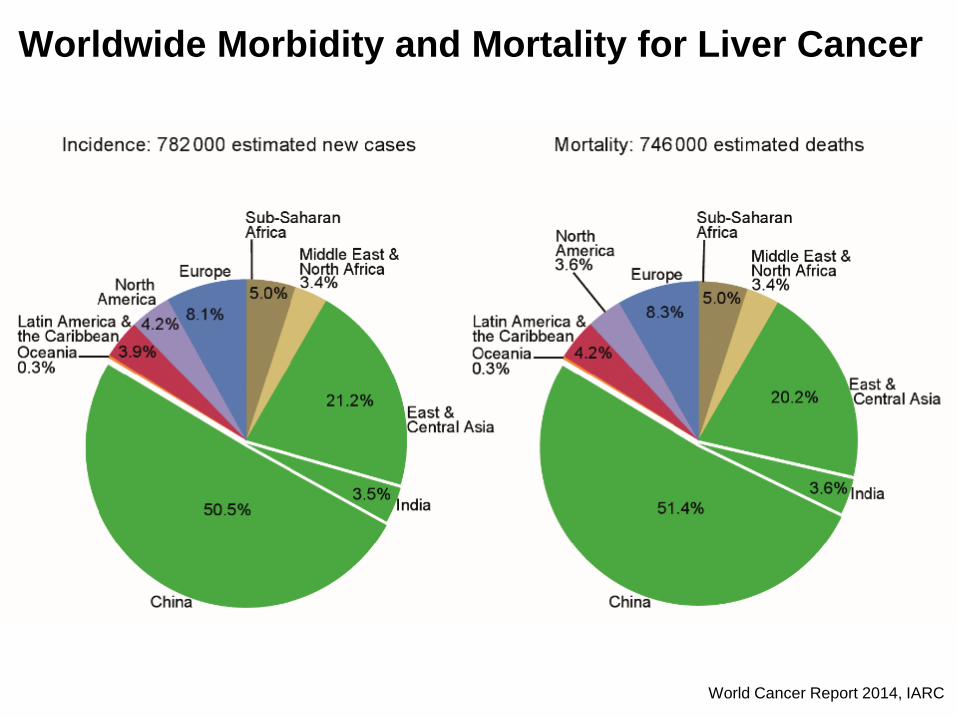
Worldwide Morbidity and Mortality for Liver Cancer

World Cancer Report 2014, IARC
Worldwide Morbidity and Mortality for Liver Cancer


Incidence of Hepatocellular Carcinoma in USA
Altekruse et al. Am. J. Gastro., 2014

Highly Reproducible and Quantitative Animal Model
for Aflatoxin B1-induced Hepatocellular Carcinogenesis

O O
O
O O
H
HOCH3
aflatoxin DNA adducts preneoplastic lesions liver cancer& metabolites
HOURS WEEKS MONTHS
500400300200100
76543210
5
A
15 25 35 45 55 65 75 85 95
B C D
E F
H
IDIOL
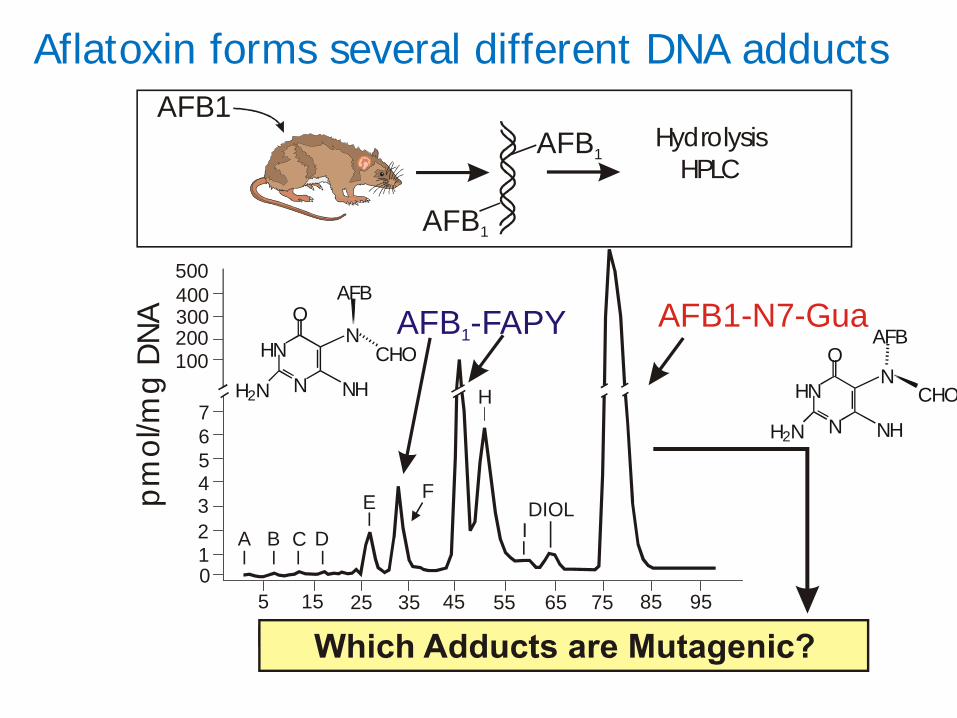
AFB -FAPY1
AFB1
AFB1
Fraction Number
pmol
/mg
DN
A AFB1-N7-Gua
AFB1Hydrolysis
HPLC
Aflatoxin forms several different DNA adducts
NH
HN
NH2N
OAFB
NCHO
NH
HN
NH2N
ON
AFB
CHO

O
DNA
AFB1-N7-Gua
O
O
O
OH
OH3C
O
O
HN
NH2N
ON
N
O3PO
O
OPO3
O3PO
O
OPO3
OH
AP Site
O3PO
O
OPO3O3PO
O
OPO3
NH
HN
NH2N
OAFB
NCHO
NH
HN
NH2N
ON
AFB
CHO
Other FAPYRotamers
FAPY-MinorFAPY-Major
AFB1-N7Guanine
Search for the Most Mutagenic Lesion
OO
O
OCH3
OO
Aflatoxin B1 (AFB1) AFB1-8,9-OxideO
O
O
OCH3
OO
8 9 P450
Smela et al., 2002

Multistage Carcinogenesis
Sequential steps1. Initiation
Rapid, DNA damage, mutations
2. Post-initiation events (promotion) Over relatively long time
3. Progression Late event

Quantitative Predictive Rat Model Rat: F344 or Sprague-Dawley
100 to 110 g at initial dose of AFB1
Physiologically cannot vomit
Caging: suspended wire mesh Diet: AIN 76A or AIN 93 series
Dietary acclimation
Foci analysis: weeks post-initiation Initially, 16 weeks Currently, 5 weeks

Quantitative Model (cont.) Putative preneoplastic lesions – enzymatic
positive foci gamma glutamyl transpeptidase positive adenosine triphosphatase deficiency glucose-6-phosphatase deficiency
3H-thymidine labeling Glutathione S-transferase (GST-P foci)
A fetal enzyme liver and placental form Immunohistochemical assay Acetone fixed tissue & paraffin imbedded

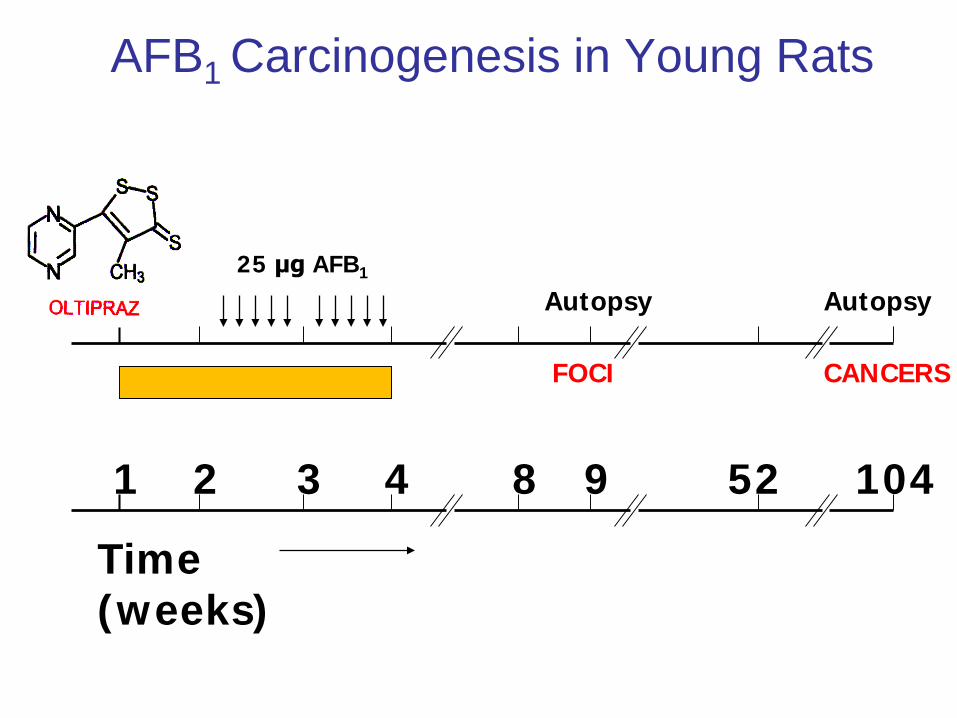
AFB1 Carcinogenesis in Young Rat
= 25 μg AFB1 Autopsy Autopsy
FOCI CANCERS
1 2 3 4 8 9 52 104
Time (weeks)

Weeks following initiationH & E stainFixed liver in paraffin
GST-P stained foci


Microscopic view of two-dimensional section of liver
Morphometric Transformation
•Mean Focal Diameter
•Number Foci/cm3
•Focal Volume %

Quantitative microscopy-morphometry
Observed (2-D) Tissue area
Number of transected foci
Area of transected focus
Focal classes
Calculated (3-D) Foci / unit volume Foci / liver Mean focal
diameter Volume % of liver
occupied by foci (tumor burden)

Two examples showing general utility of quantitative morphometric
analysis of AFB1-induced foci
for understanding chemical carcinogenesis and chemoprevention

Schsitosoma mansoniSchistosoma
mansoni

Aflatoxin M1(urine)
OO
O
O
O
H
H
OCH3
HO
HN
N
N
O
H2N N
DNA
OO
O
O
O
H
H
OCH3
HO
HN
N
N
O
H2N NO
O
O
O
O
H
H
OCH3
O
O
O
O
O
O
H
H
OCH3
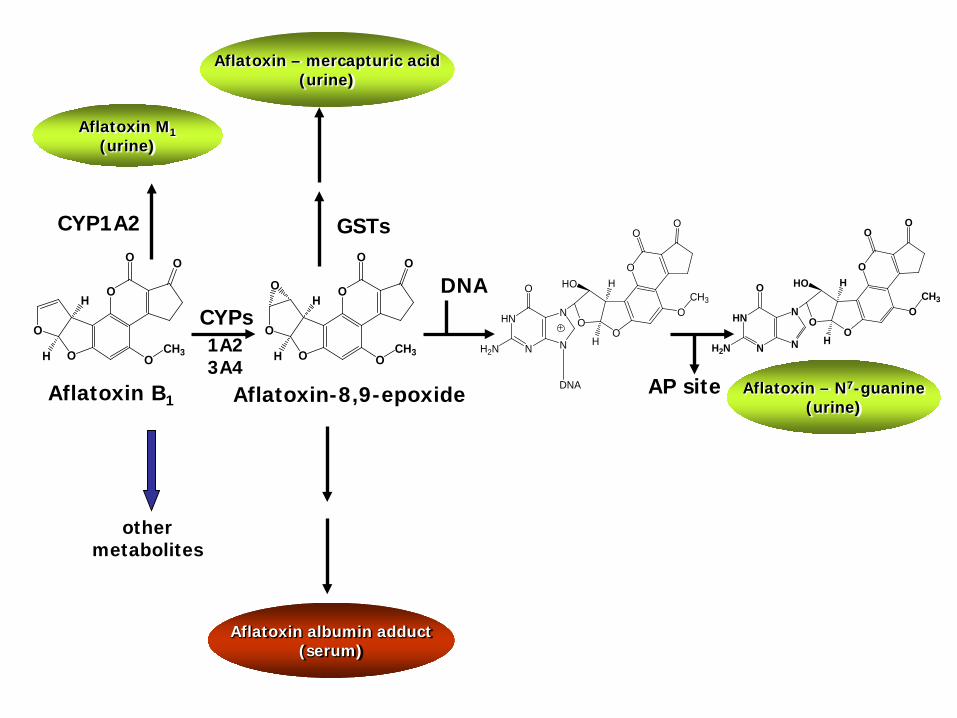
GSTs
Aflatoxin B1 Aflatoxin-8,9-epoxide AP site
DNA
CYP1A2
CYPs
Aflatoxin – N7-guanine(urine)
Aflatoxin – mercapturic acid(urine)
Aflatoxin albumin adduct(serum)
1A23A4
other metabolites
AFB1 Carcinogenesis in Young Rats
25 μg AFB1
Autopsy Autopsy
FOCI CANCERS
1 2 3 4 8 9 52 104
Time (weeks)

Inhibition of Hepatocellular Carcinogenesis with 10 doses of AFB1
Focal Incidence
Focal Volume % (mean ± SE)
HCC (%)
Aflatoxin 10/10 36 ± 17 5/45 (11)
Aflatoxin plus oltipraz
4/10 1 ± 1 0
Roebuck et al., 1991

Oltipraz Reduces Aflatoxin-DNA Adduct Formation in Rat Liver

Aflatoxin M1(urine)
OO
O
O
O
H
H
OCH3
HO
HN
N
N
O
H2N N
DNA
OO
O
O
O
H
H
OCH3
HO
HN
N
N
O
H2N NO
O
O
O
O
H
H
OCH3
O
O
O
O
O
O
H
H
OCH3
GSTs
Aflatoxin B1 Aflatoxin-8,9-epoxide AP site
DNA
CYP1A2
CYPs
Aflatoxin – N7-guanine(urine)
Aflatoxin – mercapturic acid(urine)
Aflatoxin albumin adduct(serum)
1A23A4
other metabolites

Oltipraz intervention: foci, adenomas and adenocarcinomas
TreatmentNumber of rats No lesions Foci Adenomas HCC
No intervention 41 1 (2.4) 4 (9.8) 2 (4.9) 34 (82.9)
Intervention 40 4 (10) 13 (32.5) 4 (10) 19 (47.5)*
Incidence (%)
*P<0.05, Fisher’s Exact Test

Oltipraz intervention: foci, adenomas and adenocarcinomas
TreatmentNumber of rats No lesions Foci Adenomas HCC
No intervention 41 1 (2.4) 4 (9.8) 2 (4.9) 34 (82.9)
Intervention 40 4 (10) 13 (32.5) 4 (10) 19 (47.5)*
Incidence (%)
*P<0.05, Fisher’s Exact Test
• Significant decrease in HCC• Shift toward less advanced lesions

WEEKS70 75 80 85 90 95
Prop
ortio
n Fr
ee o
f HCC
0.2
0.4
0.6
0.8
1.0
OltiprazControl
Extent of Protection22% delay in onset: p = 0.00242% reduction in incidence: p = 0.001
Chemoprevention by Reduction and DelayEffect of Oltipraz on Aflatoxin-induced HCC in
Rats
Kensler et al., CEBP . 6:603-610, 1997

Reduction in Hepatic AFB-DNA Adduct LevelsUNDERESTIMATES
Antitumorigenic Efficacy of Oltipraz
Kensler et al, CRT, 1999

Reduction in Hepatic AFB-DNA Adduct LevelsUNDERESTIMATES
Antitumorigenic Efficacy of Oltipraz
Kensler et al, CRT, 1999
50%↓ DNA adducts
90%↓ Foci Burden

Triterpenoids Synthetic analogs of oleanolic acid
with anti-inflammatory and antitumorigenic activity
Inhibit growth, induce cell cycle arrest, and induce apoptosis in breast cancer cell lines 1
Inhibit tumor growth in melanoma and leukemia mouse models 2
Potent inducers of phase 2 enzymes in vitro 3
Functions in part through Nrf2 signaling in vitro 3,4
CDDO-Imidazolide(TP235)
1Lapillonne et al. Cancer Res 20032Place et al. Clin Cancer Res 20033Dinkova-Kostova et al. PNAS 20054Liby et al. Cancer Res 2005
O
NCO
N
N
H
O

* 1, 3, 10, 30, or 100 µmol CDDO-Im/kg body weight by gavage
25 µg aflatoxin B1 per rat by gavage 6 h after CDDO-Im
Protocol for Evaluation of CDDO-Im as an Inhibitor of Aflatoxin-Induced Tumorigenesis in Male F344 Rats
Weeks of experiment0 1 2 3 7 8
* * * * * * * * *

CDDO-Im Inhibits Aflatoxin-DNA Adduct Formation in Rat Liver
CDDO-Im (µmol/kg body weight)
Afla
toxi
n-N
7 -gu
anin
e(p
mol
/mg
DN
A)
0
1
2
3
4
5
6
Vehicle 1 3 10 30 100
∗
∗∗
∗∗ ∗∗
∗∗
** P < 0.001* P < 0.02x ± SE (n=4)
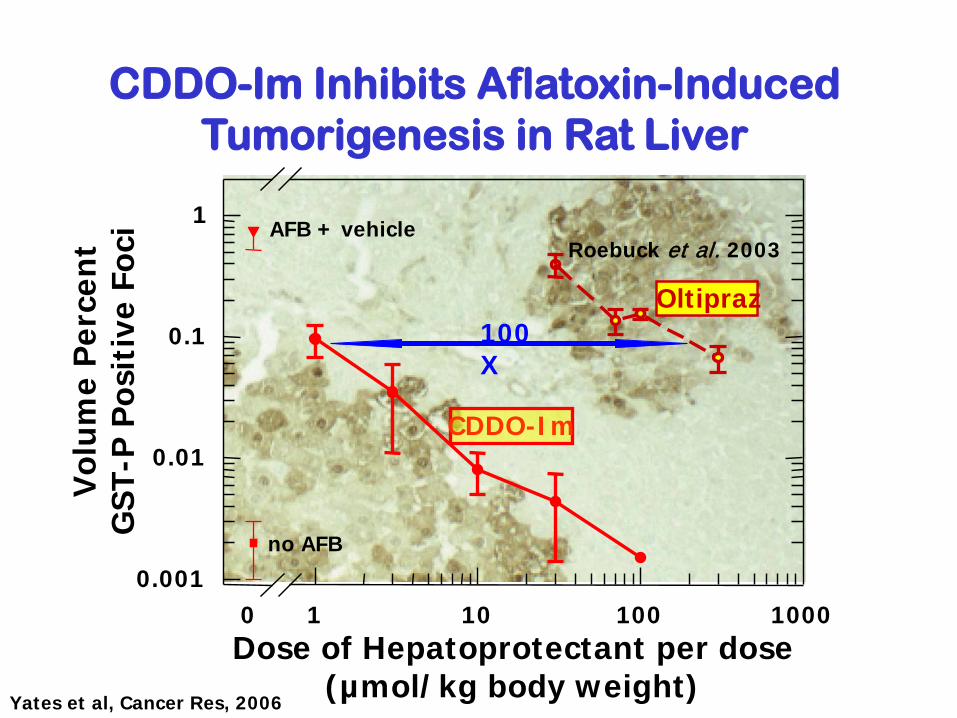
Dose of Hepatoprotectant per dose(µmol/kg body weight)
0 1 10 100 1000
Vol
ume
Per
cent
GST
-P P
osit
ive
Foci
0.001
0.01
0.1
1 AFB + vehicle
no AFB
CDDO-Im
CDDO-Im Inhibits Aflatoxin-Induced Tumorigenesis in Rat Liver
Roebuck et al. 2003
100X
Yates et al, Cancer Res, 2006
Oltipraz

Natalie M. Johnson, Patricia A. Egner, Victoria K. Baxter, Michael B. Sporn, Ryan S. Wible, Thomas R. Sutter, John D. Groopman, Thomas W. Kensler, and Bill D. Roebuck
Complete Protection against Aflatoxin B1-Induced Liver Cancer with a Triterpenoid: DNA Adduct Dosimetry,
Molecular Signature, and Genotoxicity Threshold Cancer Prevention Research 7:658-665, 2014
Paper for Today’s Webinar

Weeks of Age
5 6 7 8 9 10 12Bi-weekly
U U U U U U
* * * * * * * * * * * * * * *
Protocol for Induction of HCC with AFB1 in Rats
UrineAFB1CDDO-Im Lifetime
N=43
Sacrifice (N=6/timepoint)
A
B
* CDDO-Im (30µmol/kg)AFB1 (200µg/kg)

Weeks of Age20 40 60 80 100
Perc
ent F
ree
ofH
epat
ocel
lula
r Car
cino
ma
0
20
40
60
80
100
22/23
AFB1 + CDDO-Im 0/20
AFB1
Complete Protection Against Aflatoxin-HepatocarcinogenesisIn a Lifetime Bioassay by the Nrf2 Inducer CDDO-Im in Rats
Johnson et al. CAPR (2014)

122-926g 6.3x Solid

122-926f 6.3x cystic

Comparison of foci: AFB1 vs AFB1+CDDO-Im
Treatment
Age at death
(weeks)Foci
number
Observed Mean Diameter, mm
(range)
AFB1 35 5 1.30 (1.92-0.85)
AFB1 + CDDO-Im 93 9 0.43 (0.93-0.15)
95 2 1.12 (1.82-0.42)
111 1 0.32
12 0.53

Weeks of Age
5 6 7 8 9 10 12Bi-weekly
U U U U U U
* * * * * * * * * * * * * * *
Protocol for Induction of HCC with AFB1 in Rats
UrineAFB1CDDO-im Lifetime
N=43
Sacrifice (N=6/timepoint)
B
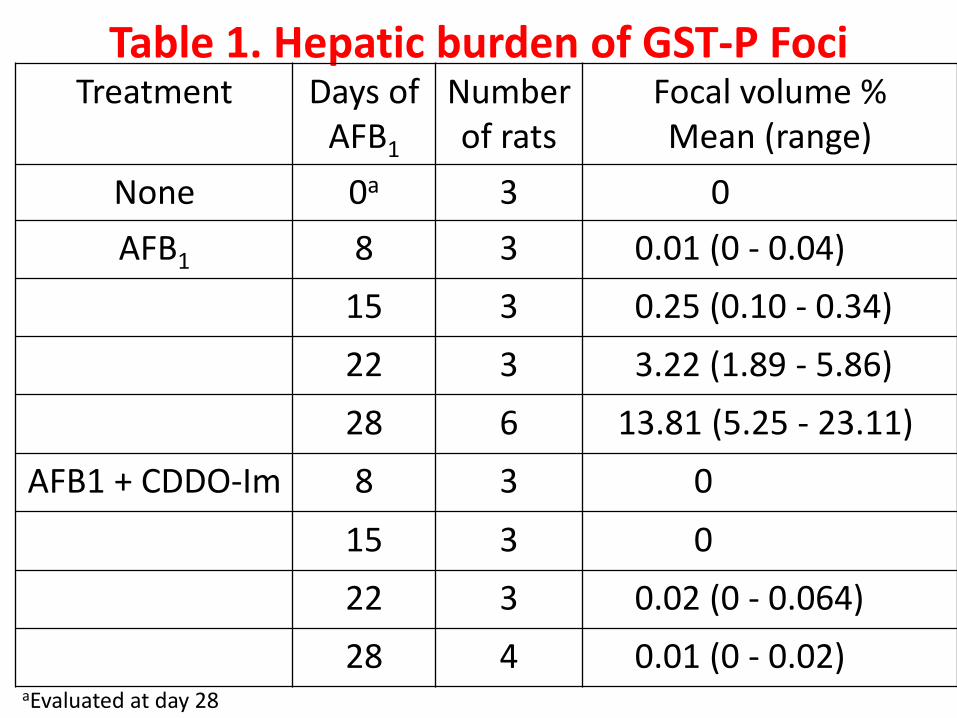
Table 1. Hepatic burden of GST-P FociTreatment Days of
AFB1
Numberof rats
Focal volume % Mean (range)
None 0a 3 0AFB1 8 3 0.01 (0 - 0.04)
15 3 0.25 (0.10 - 0.34)22 3 3.22 (1.89 - 5.86)28 6 13.81 (5.25 - 23.11)
AFB1 + CDDO-Im 8 3 0
15 3 0 22 3 0.02 (0 - 0.064)28 4 0.01 (0 - 0.02)
aEvaluated at day 28

Days of AFB1 Treatment
Afla
toxi
n-N
7-gu
anin
e Ex
cret
ion
(pm
ol/m
g cr
eatin
ine)
[
]
0
20
40
60
80
100
120
Average Dose of AFB
1( µg/day) [ ]
1 8 15 22 28
AFB1
AFB1 + CDDO-Im
* * * * *
40
30
20
10
0
There are lots of aflatoxin-DNA adducts in rats that never develop liver cancer!
THERE MUST BE A GENOTOXICITY THRESHOLD
URINE

Hep
atic
Afla
toxi
n-N
7-gu
anin
e (p
mol
/mg
DN
A) [
]
02468
10121416 H
epatic Aflatoxin-FAPyr(pm
ol/mg D
NA) [ ]
0246810121416
1 8 15 22 28
N7
FAPyr
notdone
Days of AFB1 Treatment
* *
*
*
*
*
*
*
LIVER
There are lots of aflatoxin-DNA adducts in rats that never develop liver cancer!
THERE MUST BE A GENOTOXICITY THRESHOLD

CONCLUSIONS• DNA adduct formation presumed NECESSARY for carcinogenesis by “genotoxic”
carcinogens (e.g., aflatoxin)
• Although DNA adducts may lead to mutations, an adduct is not equivalent to a mutation (and not all mutagens are carcinogens)
• Substantial aflatoxin-DNA damage is NOT SUFFICIENT for development of liver cancer
• Carcinogenesis is a multi-step, chronic process and adduct burden likely only accounts for a fraction of disease risk prediction
• Prevention of tumor development can occur with achievable reduction in DNA adduct levels.
• While a carcinogen-DNA adduct (genotoxic) threshold is demonstrable, and biologically plausible, it may not be actionable.