compilation of historical c-8 data dupont …
TRANSCRIPT

J)-I?xG - l l4+ Document 10 of 20
COMPILATION OF HISTORICAL C-8 DATA DUPONT WASHINGTON WORKS MAIN PLANT AND LANDFILLS
L .. c
-J
Date: January 2002 Project KO: D6WW7423
CORPORATE REMEDIATION GROUP An Alliance bofvmen
DuPont and URS Diamond
Barley Mill Plaza, Building 27 Wilrnington. Delaware 19805
EID168057
MAH000429
TABLE OF CONTENTS a 1.0 Introduction ........................................ 1 .................................................................... 1-1
1.1 Document Orgmzation ................................................................................. 1-1 1.2 C-8 Historical Laboratory Analysis ............................................................... 1-1 1.3 Physicochemical Data for Ammonium Perfluorooctanoate (C-8) ................. 1-2 1.4 References ...................................................................................................... 1-3
. .
2.0 Washington Works Main Plant ............................................................................... 2-1 2.1 2.2
2.3
2.4 2.5 2.6
Lntroduction .................................................................................................... 2-2 Environmental Setting ................................................................................... 2-3
2.2.2 Hydrology, Hydrogeology and Groundwater Flow .......................... 2-3 Water Quality ................................................................................................. 2-6 2.3.1 Surface Water Quality ...................................................................... 2-6 2.3.2 Groundwater Quality ........................................................................ 2-6 2.3.3 DrinkindTap Water Quality ............................................................. 2-7
Data Gaps ....................................................................................................... 2-8 References ...................................................................................................... 2-8
2.2.1 Geology ............................................................................................ 2-3
Sitc Conceptual Model ................................................................................... 2-7
3.0 Local Landfill .......................................................................................................... 3-1 3.1 Lntroduction .................................................................................................... 3-2 3.2 Environmental Setting ................................................................................... 3-2
3.2.1 Geology ............................................................................................ 3-2 3.2.2 Hydrology, Hydrogeology and Groundwater Flow .......................... 3-3
3.3.1 3.3 Water Quality ................................................................................................. 3-4
Surface Water Quality ...................................................................... 3-4 3.3.2 Groundwater Quality ........................................................................ 3-4 Site Conceptual Model ................................................................................... 3-5 3.4
3.5 Data Gaps ....................................................................................................... 3-6 3.6 References ...................................................................................................... 3-6
4.0 Letart Landfill ......................................................................................................... 4-1 4.1 Introduction .................................................................................................... 4-2 4.2 Environmental Setting ................................................................................... 4-2
4.2.1 Geology ............................................................................................ 4-2 4.2.2 Hydrology, Hydrogeology and Groundwater Flow .......................... 4-3
4.3.1 Surface Water Quality ...................................................................... 4-4 4.3.2 Groundwater Quality ........................................................................ 4-5
4.4 Site Conceptual Model ................................................................................... 4-6 4.5 Data Gaps ....................................................................................................... 4-7 4.6 References ...................................................................................................... 4-8
3.3 Water Quality ................................................................................... i ............. 4 4
EIDi68058
MAH000430
0
0
Main Plant and Landfills Table of Contents
5.0 Dry R u ~ Landfill ..................................................................................................... 5- I 5.i 5.2
5.3
5.4 5.5 5.6
Table 2.0
Table 2.1A
Table 2.1B
Table 2.1 C
Table 3.0
Table 3.1A
Table 3.1B
Table 4.0
Table 4.1A
Table 4.1B
Table 5.0
Table 5.1A
Table 5.1B
Figure 1.0
Figure 2.0
Figure 2.1
Figure 2.2
Figure 2.3
Figure 2.4A
Figure 2.4B
Figure 2.4C
Figure 2.4D
Introduction .................................................................................................... 5-2
5.2.1 Geology ............................................................................................ 5-2 5.2.2 Water Quality ................................................................................................. 5-4 5.3.1 Surface Water Quality ...................................................................... 5-4 5.3.2 Groundwater Quality ........................................................................ 5-4 Site ConceptuakModel ................................................................................... 5-5 Data Gaps ....................................................................................................... 5-6 References ...................................................................................................... 5-6
Environmental Setting ................................................................................... 5-2
Hydrology, Hydrogeology and Groundwater Flow .......................... 5-3
TABLES
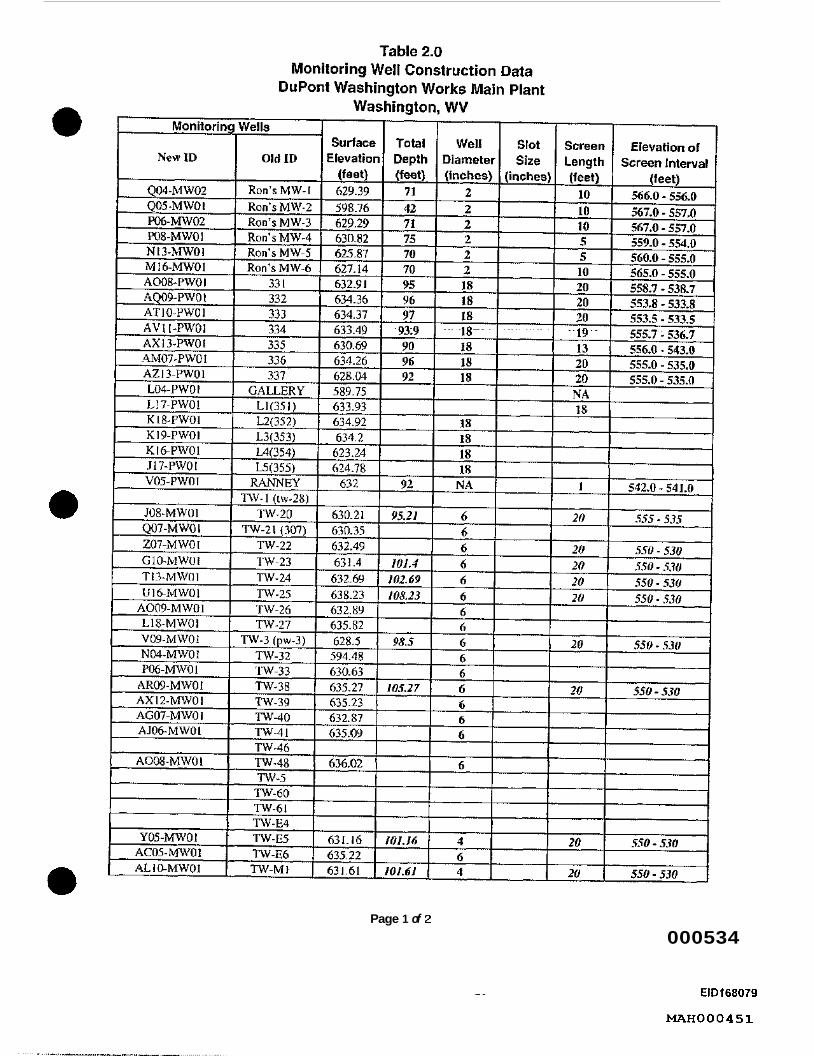
Washington Works Main Plant Monitoring Wells Construction Data
Washington Works Main Plant Analytical Data Table - Surface Water
Washington Works Main Plant Analytical Data Table - Groundwater
Washington Works Main Plant Analytical Data Table - Drinking Water
Local Landfill Monitoring Wells Construction Data Local Landfill Analyqical Data Tables - Surfacc Watcr
Local Landfill Analytical Data Tables - Groundwater
Letart Landfill Monitoring Wells Construction Data
Letart Landfill Analytical Data Tables - Surface Water
Letart Laridfill Analytical Data Tables - Groundwater
Dry Run Landfill Monitoring Wells Construction Data
Dry Run Landfill Analytical Data Tables - Surface Water
Dry Run Landfill Analytical Data Tables - Groundwater
FIGURES
Solubilities of C7FIs COOM in Water as a Function of Temperature
Washington Works Main Plant Location and SWMU Map
Washington Works Main Plant and Local Landfill 1 -mile Radius Map
Washington Works Main Plant Monitoring Well and Surface Water Sample Location Map
Washington Works Main Plant Cross Section Location Map
Washington Works Main Plant Cross Section A-A’
Washington Works Main Plant Cross Section B-B’ Washington Works Main Plant Cross Section C-C’
Washington Works Main Plant Cross Section D-D’
Compilation of history data Draft Z.doc Jan. 11 I 02 Wilmington. DE
ii

Main Plant and Landfills Table of Contents
Figure 2.4E
Figure 2.4F
Figure 2.5A
Figure 2.5B
Washington Works Main Plant Cross Section E-E’ Washington Works Main Plant Cross Section F-F’ Washington Works Main Plant Groundwater Elevation Map - November 2000
Washington Works Main Plant Groundwater Elevation Map - February 1999
Figure 2.5C
Figure 2.6A
Figure 2.6B
Figure 3.0
Figurc 3.1
Figure 3.2
Figure 3.3
Figure 3.4A
Figure 3.4B
Figure 3.5A
Figure 3.5B
Figurc 3.5C
Figure 3.5D
Figure 3.5E
Figure 3.5F
Figure 3.5G
Figure 3.6A
Figure 3.6B
Figurc 3.6C
Figure 3.6D
Figure 4.0
Figure 4.1
Figure 4.2
Figure 4.3
Figure 4.4A
Figure 4.4B
Washington Works Main Plant Groundwater Elevation Map - November 1998
Washington Works Main Plant C-8 Concentration Map - February 1999
Washington Works Main Plant C-8 Concentration Map - November 1998
Local Landfill Location Map Local Landfill and Washington Works Main Plant 1 -mile Radius Map
1,ocal Landfill Monitoring Well and Surface Water Sample Location Map
Local Landfill Cross Section Location Map
Local Landfill Cross Section A-A’
Local Landfill Cross Section B-B’
Local Landfill Groundwater Elevation Map - November 2001
Local Landfill Groundwater Elevation Map - December 2000
Local Landfill Groundwater Elevation Map - Novcmber I999
Local Landfill Groundwater Elevation Map - November 1998
Local Landfill Groundwater Elevation Map - November 1997
Local Landfill Groundwater Elevation Map - December 1996
Local Landfill Groundwater Elevation Map - December 1994
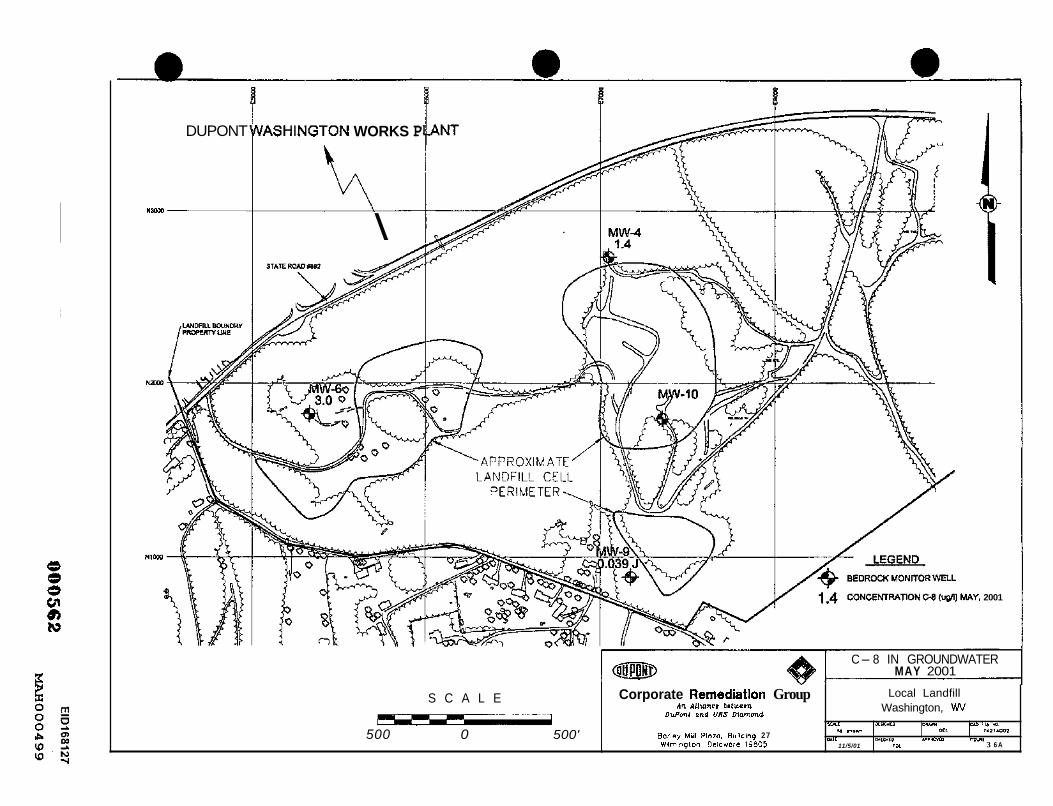
Local Landfill C-8 Concentration - May 200 1
Local Landfill C-8 Concentration - May 2000
Local Landfill C-8 Conccntration - May 1999
Local Landfill C-8 Concentration - May 1998
Letart Landfill Location Map
Letart Landfill 1-mile Radius Map
Letart Landfill Monitoring Well and Surface Water Sample Location Map
Letart Landfill Cross Section Location Map
Letart Landfill Cross Section A-A’
Letart Landfill Cross Section B-B’
Compilation of history data Draft 2.doc Jan. 14. 02 Wilmington. DE
i i i

Main Plant and Landfills Table of Contents
Figure 4.5A Figure 4.5B
Figure 4.5C
Figure 4.5D
Figure 4.5E
Figure 4.5F Figure 4.6A
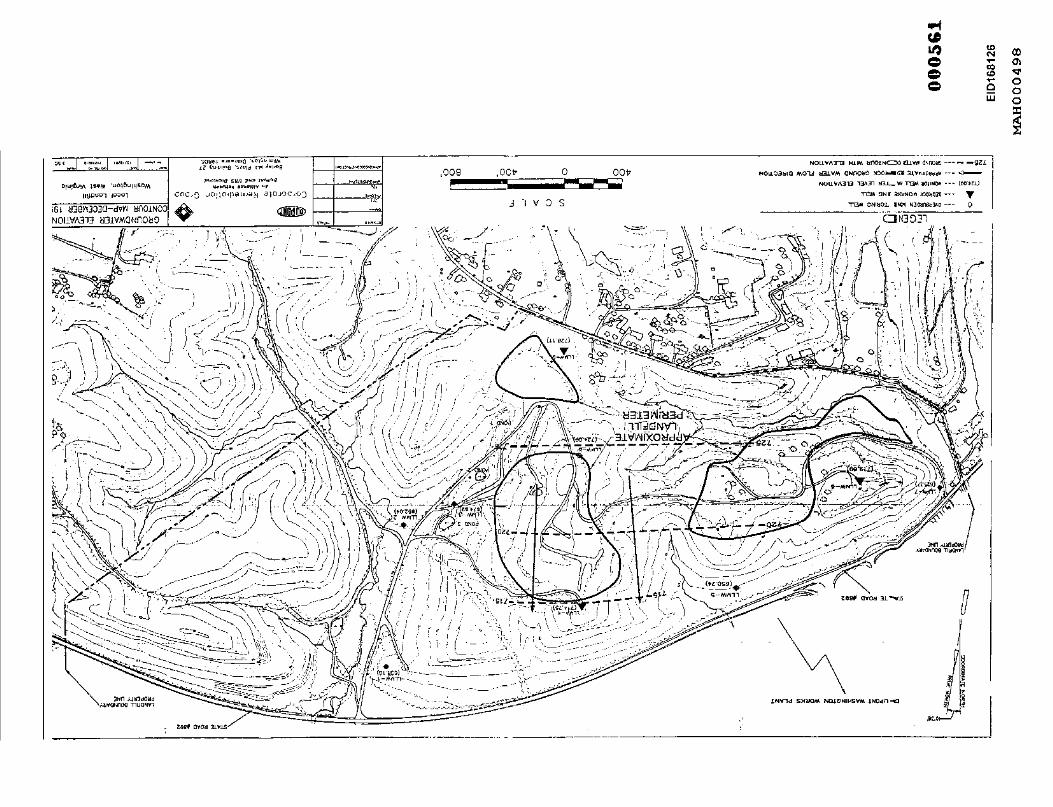
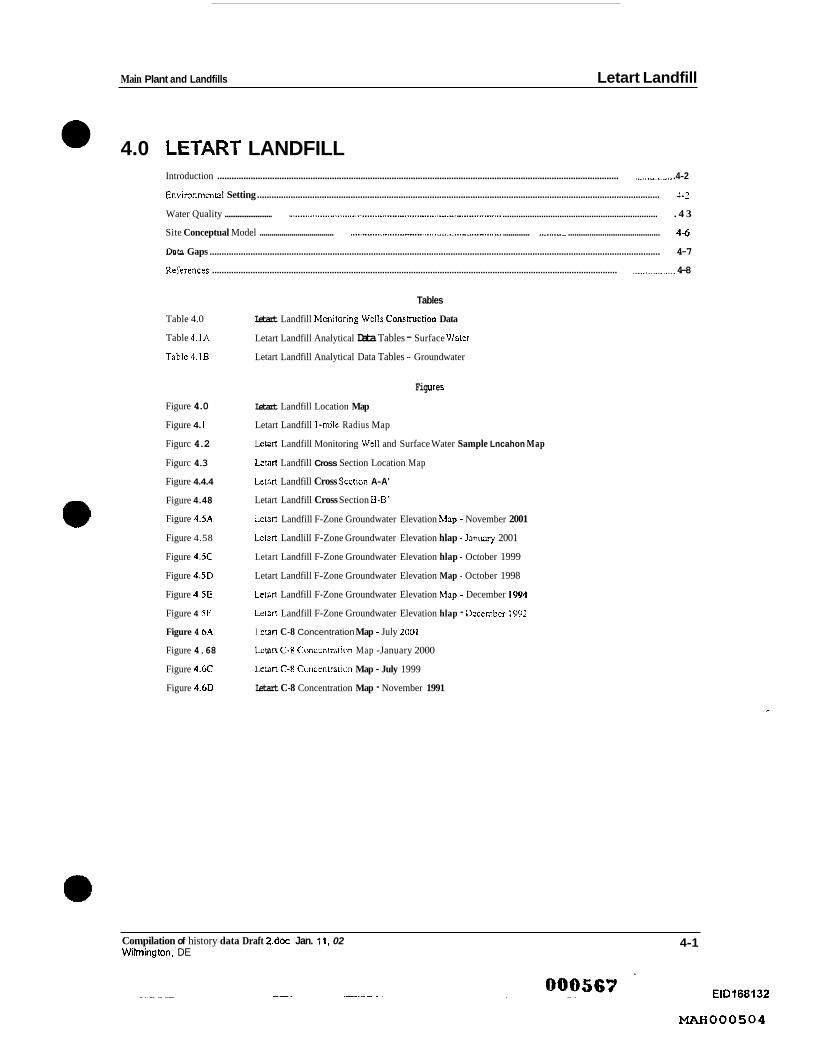
Letart Landfill F-Zone Groundwater Elevation Map - November 2001
Letart Landfill F-Zone Groundwater Elevation Map - January 2001
Letart Landfill F-Zone Groundwater Elevation Map - October 1999
Letart Landfill F-Zone Groundwater Elevation Map - October 1998
Letart Landfill F-Zone Groundwater Elevation Map - December 1994
Letart Landfill F-Zone Groundwater Elevation Map - December 1992
Letart C-8 Conccntration Map - July 2001
Figure 4.6B
Figure 4.6C
Figure 4.6D
Figure 5.0
Figure 5.1
Figure 5.2
Figure 5.3
Figure 5.4A
Figure 5.4B
Figure 5.5A
Figurc 5.5B
Figure 5.5C
Figure 5SD
Figure 5.5E Figure 5.6A
Figure 5.6B
Figure 5.6C
Figure 5.6D
Figure 5.6E
Figure 5.6F
Letart C-8 Concentration Map - January 2000
Letart C-8 Concentration Map - July 1999
Letart C-8 Concentration Map - November 1991
Dry Run Landfill Location Map
Dry Run Landfill 1 -mile Radius Map
Dry Run Landfill Monitoring Well and Surface Water Sample Location Map
Dry Run Landfill Cross Section Location Map
Dry Run Landfill Cross Section A-A’
Dry Run Landfill Cross Section B-B’
Dry Run Landfill Groundwater Elevation Map - Octobcr 2001
Dry Run Landfill Groundwater Elevation Map - October lY99
Dry Run T,andfill Groundwater Elevation Map - October 1998
Dry RLM Landfill Groundwater Elevation Map - October 1993
Dry Run Landfill Groundwater Elevation Map - April 1992
Dry Run C-8 Concentration Map Bedrock Wells - July 2000
Dry Run C-8 Concentration Map Bedrock Wells - July 1999
Dry Run C-8 Concentration Map Bedrock Wells - July 1997
Dry Run C-8 Concentration Map Overburden Wells - July 2000
Dry Run C-8 Conccntration Map Ovcrburden Wells - July 1999
Dry Run C-8 Concentration Map Overburden Wells - May 1998
APPENDIX Appendix 1 Consent Order
Compilation of history data Draft 2.doc Jan. 14.02 Wilrnington. DE
iv
EID168061 00049%
-000433

EIDl68062
W O O 0 4 3 4
Main Plant and Landfills Introduction
I .O INTRODUCTION A multi-media Consent Order was entered into between the West Virginia Departmcnt of Environmental Protection (WVDEP), the West Virginia Department of Health and Human Resources-Bureau for Public Health (WVDHHR-BPH) and DuPont on November 14,2001. A copy of the Consent Order (Order No. GWR-2001-019) is 'contained in Appendix 1. The Consent Order identified a series of requirements to be performed by the Parties (WVDEP, WVDHHR-BPH, and DuPont) in order to determine whether there has been any impact on human health and the environment as a result of releases of ammonium perfluorooctanoate (C-S), CAS Number 3825-26-1, to the environment from DuPont operations at the Washington Works main plant and the associated landfills (Local, Letart and Dry Run). The C-8 Groundwater Investigation Steering Team (GIST) was established in the Consent Order to oversee investigations and activities that will be conducted to assess the presence and extent of C-8 in drinking water, groundwater, and surface water at and around the main plant, and the Local, Letart and Dry Run Landfills.
Pursuant to Attachmcnt A of the Conscnt Order, three tasks will be performed by DuPont and evaluated by the GIST, Tasks A, B, and C. This report addressed Task B. The primary objective of Task B is to develop and implement a nionitoring plan that determines the presence and extent of C-8 in drinking water, groundwatcr and surface water in and around the main plant, and the Local, Letart and Dry Run Landfills, and to provide a compilation of available groundwater/surface water monitoring results and hydrogeologic characterization data for each location. This document was prepared to meet the data compilation objective.
I .I Document Organization
Sections 2.0, 3.0,4.0, and 5.0 present the historical data available for the main plant and the Local, the Letart and the Dry Run Landfills, respectively. Each section includes text, tables, and figures specific to the site being discussed in that section. At the end of each section, data gaps are identified. The same outline is used for each scction. Data presented in each section includes information (to the extent that information was available) as requested in Table A-1 of the Consent Order. In addition,supplemental information is provided as needed to develop and present a site conceptual model for the four locations discusscd.
1.2 C-8 Historical Laboratory Analysis of C-8
The analytical method, method detection limit, and laboratory utilized for C-8 analysis has changed over time. Prior to 1991 , DuPont performed C-8 analysis at the DuPont Experimental Station in Wilmington, Delaware. In 1991, when the RCRA Verification Investigation was conducted, the analysis was contracted to the CHzMHill Laboratory in Montgomery, Alabama. Both labs used a Gas Chromatographyhlass Spectrometry based analytical method with detection limits for C-8 that rangcd from 0.1 to 1 .O @I.
Compilation of history data Dran 2.doc Jan. 11.02 1-1 Wilmington, DE
EID168063
W O O 0 4 3 5

~
Main Plant and Landfills Introduction
1.3
CHzMHill conducted C-8 analysis for DuPont into the fall of 1998 when the laboratory ceased operation. At that time, DuPont had completed one round of analysis for the RCRA Facility Investigation (RFI). The analytical work was transferred to Lancaster Laboratories, Lancaster, PA, for the RFI second round analysis in February 1999. Lancaster Laboratories continued to conduct C-8 analysis using GC/MS for DuPont until October 2001, when development and testing was initiated on a new analytical method developed by Exygen Research, Inc. (located in State College, PA) that utilizes Liquid Chromatography/Tandem Mass Spectrometry (LCRMSIMS). DuPont adopted the use of LC/MS/MS €or C-8 analysis in November 2001.
DuPont intends to submit to WVDEPEPA all documentation relating to C-8 analysis using the LC/MS/MS. The analytical methodology, sampling methodology, and applicable quality controYquality assurance program will be documented in a Quality Assurance Project Plan (QMP) to be submitted to the Groundwater Investigation Steering Team (GIST) in carly 2002.
Physicochemical Data for Ammonium Perfluorooctanoate (C-8)
C-8, also identified as FC-143, is a fluorinated surfactant used in the fluropolymer manufacturing at the main plant. Figure 1.0 shows the solubilities of C7F1.2 COOM in water as a function of temperature (Figure 6.9 in Kissa, 1994). The following summary Iists the physicochemical data available for C-8 (Kissa, 1994):
Molecular Formula = CF3(CF&COOm+
Molccular weight = 43 1.098 $mole
LD50 acute oral rat = 680 mgkg
BCF = 1.8
pH - 5 (0.5% aqueous)
pKa = 2.8 (-COOH)
Melting Point = 56-53°C (-COOH) COD = 700 mg/kg
Koc = 25
Water Solubility > 1000 mg C-8/L
Vapor pressure (at 22°C) = 7.1 x
Kraft Point = 2.5 "C
Critical Micelle Concentration = 33 mnoVL
mm Hg
LDro: Leiha1 Dose SO - Dose having 50% probability of causing dcath DODN : Biochemical Oxygen Denland - Slanddrd measurmcni is made for 5 days ai 20 degrees C BCF: Bioconcenmtion Factor pKa: Negative log of the ionization constant - Meawre ofacidity or acid smngth COD: Chemical Oxygen Drmand Koc: Organic Carbon Partitioning Coefficient
1 -2 Compilation of history data Draft 2.doc Jan. 11. 02 Wilmington. DE
EIDl68064
W O O 0 4 3 6 060439

Main Plant and Landfills Introduction
I .4 References Kissa, E. 1994. Fluorinated Surfactants. New York: Marcel Dekker, Inc.
Compilation of history data DraR 2.doc Jan. 11. 02 Wilmington. DE
1-3
El D168065
W O O 0 4 3 7
FIGURES
I

35 25 IO 0 =c I I I I
\
\ A
\ 'A
l
..
.
I I f L I I
3.2 3.4 3.6
Figure 1.0 Solubilities of C7Fj5 COOM in
water as a function of temperature (Kissa, 1994).
0 0 0 5.i82
ElDl68067
W O O 0 4 3 9

000563
EID168068
MAH000440

Main Plant and Landfills Washington Works Main Plant
2.0 WASHINGTON WORKS MAIN PLANT In~oduction ........................................................................................................................................................................................ 2-2
Environmental Setting ........................................ .......................... ......................... 2-3
Water Quality .................................................... Site Conceptual Model .....................
Data Gaps .......................... ................................................................................................................................................................................. 2-8
Tables
Table 2.0
Table 2.1A
Table 2.IB
Table ?.IC
Washington Works Main Plant Monitoring Wclls Construction Data
Washington Works Main Plant Analytical Data Table - Surface Water
Washington Works Main Plmt Analytical Data Tablc - Groundnatcr
Washington Works Main Plant Analytical D3ta Table - Drinkinflap Water
Figure 2.0
Figurc 2.1
Figure 2.2
Figure 2.3
Figure 2.1A
Figure 2.40
Figure 2 4C
Figure 2.4D
Figlire 2.4E
Figure 2.4F
Figure 2.5A
Figure 2.5B
Figurc 2.5C
Figurc 2.6A
Figure 2.68
Figures
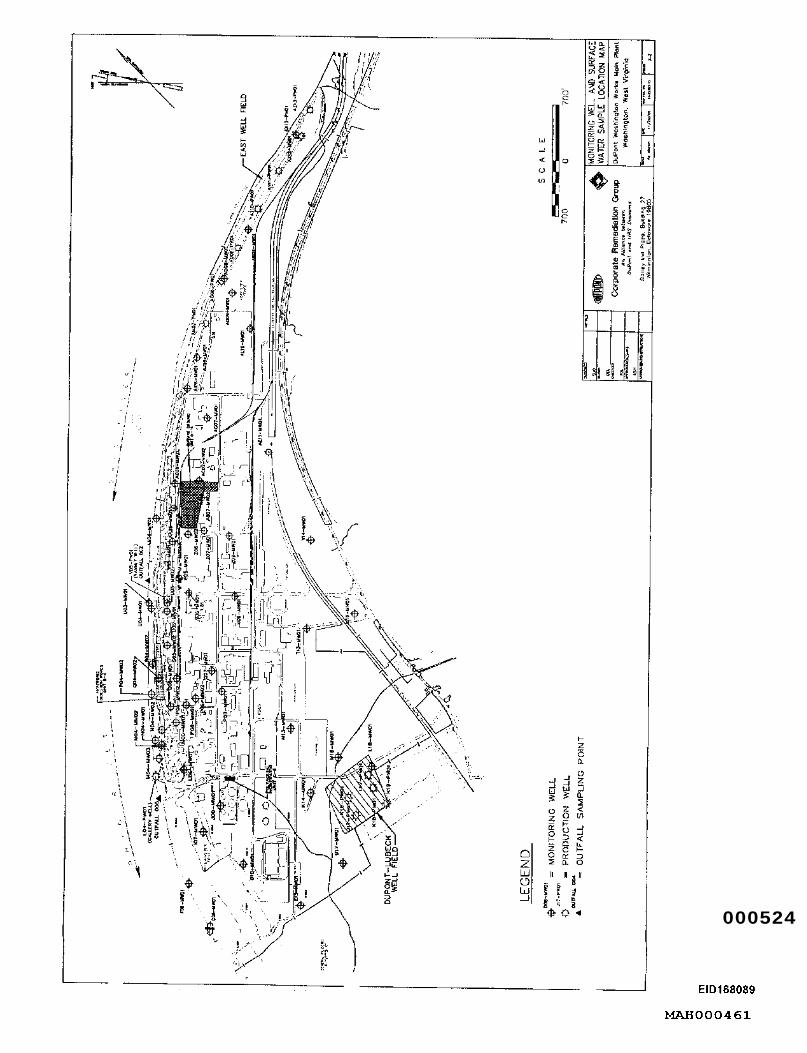
Washington Works Main Plant Location and SWMU Map
Washington Works hlain Plant and Local Laridfill I-mile Radius Map
Washington Works Main Plant Monitoring Well and Surface Water Sample Location Map
Washington Works Main Plant Cross Scction Location Map
Washington Works Main Plant Cross Section A-A'
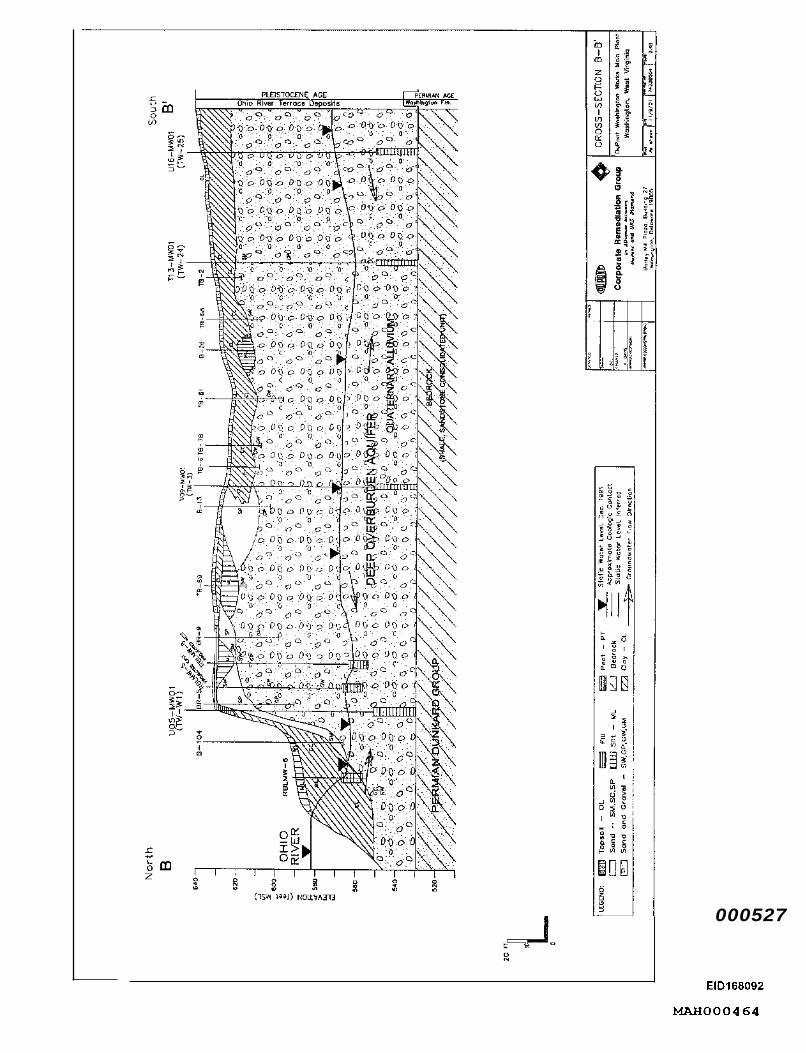
Washington Works Main Plant Cross Section B-B'
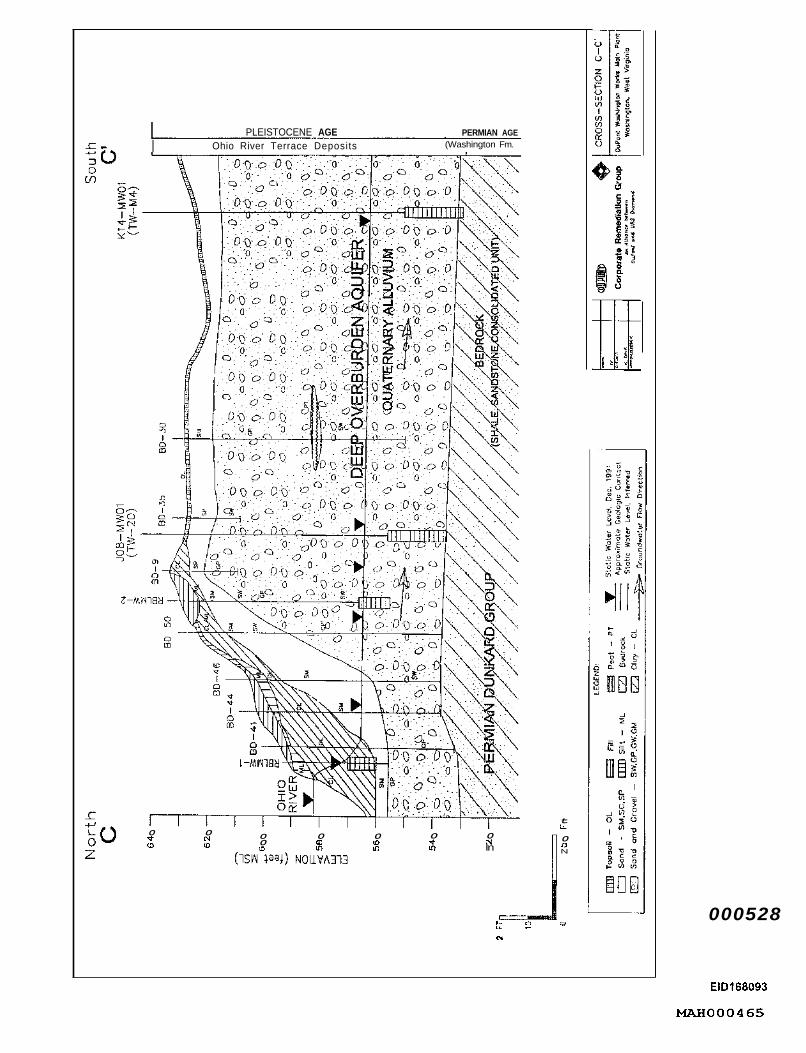
Washington Works Main Plant Cross Section C-C'
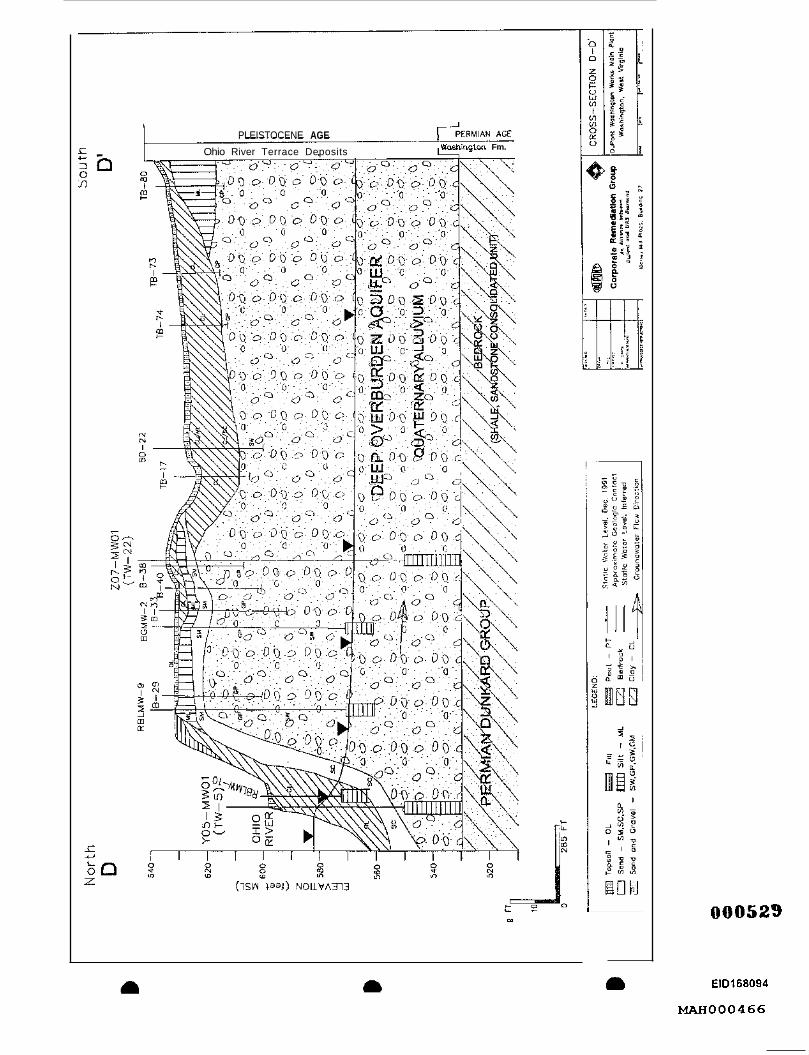
Washingon Works hlsin Plant Cross Section D-D'
Washington Works Main Plant Cross Section E-E'
Wxhingon Works Main Plant Cross Section F-F'
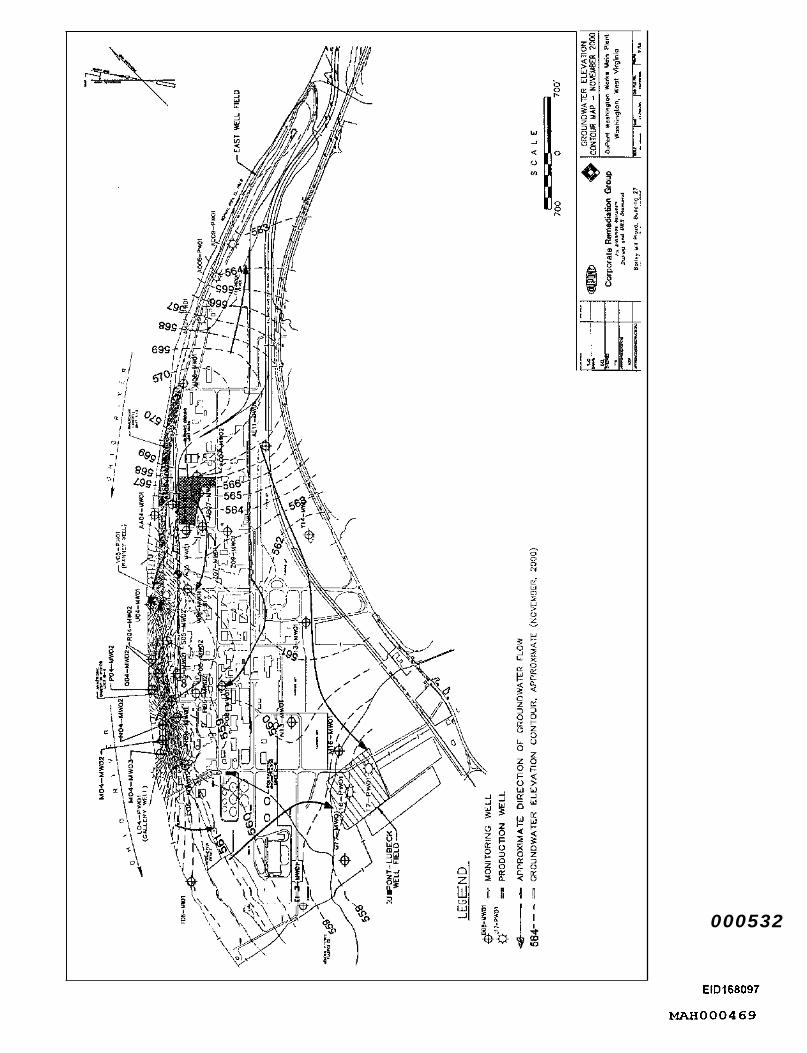
Washing~on Works Main Plant Cimundwater Elebation Map - November 2000
Washington Works htairr Plan1 Groundwater Elevation Map - February I999
Washington Works Main Plant Groundwater Elevation Map - Nuvember 1998
Washington Works Main Plant C-8 Concentration Map - February 1999
Washington Works Main Plant C-8 Concentration Map - November 1998
Compilation of hlstory data Draft 2 . d ~ Jan. 11, 02 2-1 Wilmington. DE
000504 ElD168069
MAH000441

Main Plant and Landfills Washington Works Main Plant
(I) 2.1 Introduction
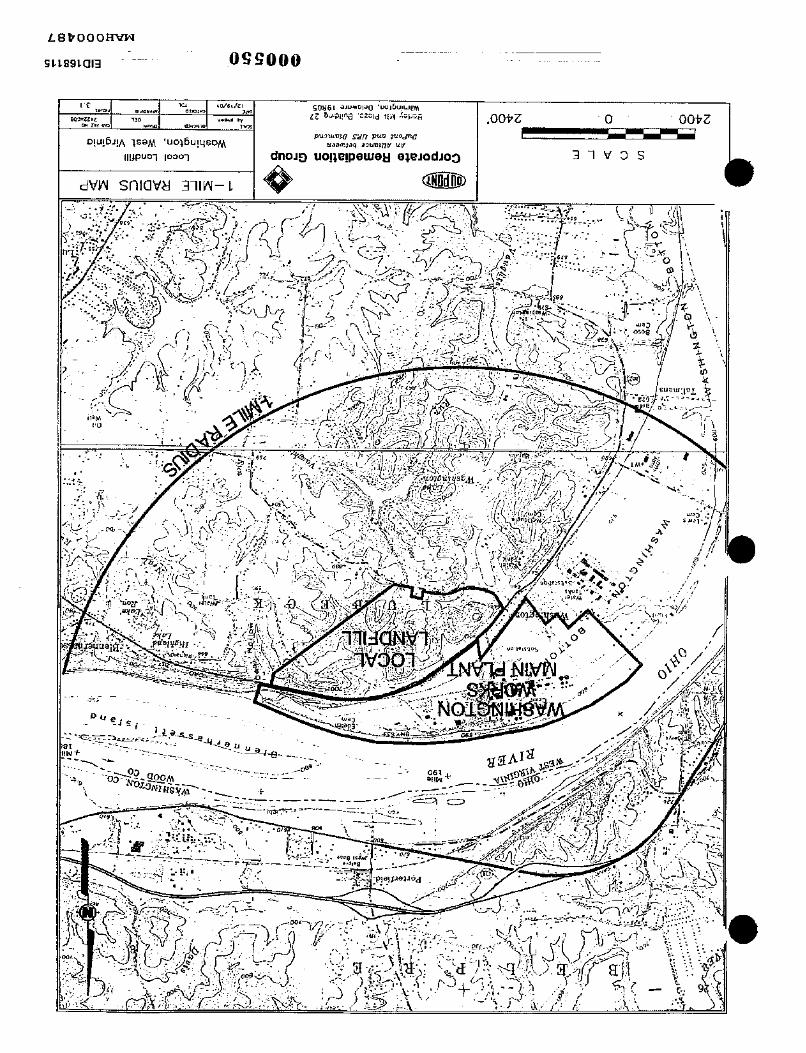
The Washington Works Main Plant (main plant) is located along the Ohio River in Washington, West Virginia, approximately-seven miles southwest of Parkersburg, West Virginia (Figure 2.0). A water use and well survey is currently being conducted for the area within a 1-mile radius of the main plant and Local Landfill property boundaries (Figure 2.1).
Significant historical hydrogeologic and groundwater quality data for C-8 at the main plant is available from previous investigations that have been conducted. The most significant study was a Resource Conservation and Recovery Act (RCRA) Facility Investigation ( S I ) conducted in the fall of 1998 on four Solid Waste Management Units (SWMUs) at the main plant to satisfy requirements of the RCRA Hazardous and Solid Waste Amendments (HSWA) Permit Number \?'vD 04-587-2591 (DuPont, 1999). A brief description of each of the SWMUs investigated is presented below. SWMU locations are shown on Figurc 2.0.
0 SWMU A-3, Riverbank Landfill: The Riverbank Landfill is about 4,500-feet long and lies along the northern edge of the site near the Ohio River. It was operated between 1948 and the late 1960s and received powerhouse ash, incineration ash, plastics, rubble, and plant trash. After closure, it was covered with 6 to 35 inches of soil. Currently, the Riverbank Landfill is covered with dense vegetation (on the sloped area) or by buildings and pavement in the manufacturing area.
c1 SWMU B-4, Anacrobic Digestion Ponds (Digestion Ponds): Three former digestion ponds are co-located within a portion of the Riverbank Landfill. One pond dates from the 1950s and two others from the 1970s. The ponds received waste from the fluorocarbon manufacturing process (including C-8) until 1388, when the pond contents and upper few feet of clay liner and pond berm material were removed and disposed of off-site. The pond area was backfilled and capped with topsoil, and the area is currently vegetated with grass.
CI SWMU C-6, Polyacetal Waste Incinerators (Waste Incinerators): The former Waste Lncinerators consisted of two brick-lined pits in the western portion of the manufacturing area. The Waste Incinerators operated between 1959 and 1990. Thc Waste Incincrators have been excavated and backfilled with clean soil.
0 SWMU H-14, Burning Ground: The Burning Ground is located in the central portion of the manufacturing area and was operated between 1948 and 1965. Since 1990, the Burning Ground has been leveled, backfilled with clean fill and gravel, and covered by buildings and asphalt.
A previous Verification Invcstigation (VI) found evidence of releases of C-8 to soil and groundwater at the Riverbank Landfill, Digestion Ponds, and Burning Ground (DuPont 1992). Little evidence of releases were found in soil at the site of the former Waste Incinerators. Further investigations and evaluations were performed during the RFI to determine the extent of releases in groundwater.
Compilation of history data Draft 2.doc Jan. 11. 02 Wilrnington. DE
0005.85
2 -2
ElDl68070
MAH000442

Main Plant and Landfills Washington Works Main Plant
2.2
2.2.1
2.2.2
Plant-wide groundwater sampling was also conducted during two separate monitoring events, the f i s t in November 1998 and the second in February 1999, during the RFI. The sampling events focused on evaluating groundwater quality at existing and newly installed wells associated with the Burning Ground and Riverbank Landfill/ Digestion Ponds SWMUs.
All plant wells sampled during the RFI were analyzed for C-8. C-8 was detected in all groundwatcr samples. C-8 concentrations and the extent in groundwater is discussed in Section 2.3 Water Quality.
E nvi ronmen tal Setting
Geology
The geology of the main plant is shown on six geologic cross-sections developed during the VI (DuPont, 1992) and revised based on additional findings fi-om the RFI. The locations of the geologic cross-sections are shown in Figure 2.3. Two east-wcst cross- sections, A-A' and F-F', are shown on Figures 2.4A and 2.4F. Four north-south cross- sections, B-B', C-C', D-D', and E-E' are shown on Figures 2.4B, 2.4C, 2.4D and 2.4E, respectively. The cross-sections were developed from detailed geologic logs recorded during the VI and RFI, and from less detailed llistoric geologic logs from test and production wells and geotechcal borings drilled in the late 1950s through the early 1980s. Some monitoring wells shown in Figure 2-3 were later abandoned. The current site map (Figurc 2.2) shows thc monitoring wells that currently exist at the site.
The main plant rests on Quaternary alluvial terrace deposits in the Ohio River Valley. The alluvial terrace is topographically flat and lies approximately 50 fcct above thc Ohio River, which flows east to west past the main plant (see Figure 2.0). The alluvial terrace is underlain by a flat, river-scoured bedrock surface of the Dunkard Series that rises steeply and outcrops in the southern edge of the site to form the valley wall.
The Quaternary alluvium ranges from 60 to 100 feet in depth and consists of coarsening downward unconsolidated river deposits of poorly to well-sorted, brown and gray sand, silts, clay and gravel. The Dunkard Series bedrock consists primarily of red and varicolored sandy shale; gray, green and brown sandstone; and minor beds of coal, claystone, black carbonaceous shale, and limestone.
The average river watcr clcvation is about 580 feet above Mean, Sea Level (MSL) and the elevation of the Ohio River terrace deposits under the main plant are about 630 feet above MSL. Due to riverbank undercutting, some slumping of clay and silt exists along the northern boundary of the main plant along the river's edge. Figure 2.4C shows an example of the relationship of fill and clay layers along the riverbank.
Hydrology, Hydrogeology and Groundwater Flow
H y d rol og y Regional water needs are primarily satisfied by the Ohio River and Little Kanawha River ncar Parkersburg. These sources provide water to the cities of Parkersburg,
Compilation of history data Drafl2.doc Jan. 11.02 Wilmington, DE
2 -3
~- EID168071 000506 MAH000443
Main Plant and Landfills Washington Works Main Plant
West Virginia and Belpre, Ohio. In less populated areas (Le., near the main plant), the local communities receive water 6-om small local water companies that obtain their water from production wells screened in the Quatcmary nvcr alluvium.
Surface water at the main plant discharges through drains and storm sewers, and drainage swales. Seeps located along the riverbank may originate from precipitation that has infiltrated topsoil or fill and that flows along the top of the underlying shallow clay and discharges along the riverbank. Two drainage swales, one Iocated in the facility’s -southwest comer, and the other located on the extreme eastern end of the facility, convey surface runoff during rainy weather to thc Ohio River. During dry weather, the drainage swales are dry.
Hydrogeology Regional groundwater supplies are obtained &om the Dunkard Group bedrock and Ohio River alluvial terrace deposits. The saturated portion of the Ohio River alluvial terrace dcposits comprise the principal rcgional aquifer used for water supply purposes. Production wells completed in this aquifer have been known to yield up to 500 gallons per minute (gpm) (Schultz, 1984). Based on these high yields, numerous industrial and commercial water supply companies obtain water from the alluvial aquifer. The yield from alluvial aquifer wells is related to the well’s position with respect to the river, as wcll as formation grain size and thickness.
The Ohio River alluvial terrace deposits contain a single key aquifer underlying the main plant. The water table occurs at a depth of about 60 to 70 feet below ground surface in the main plant area. The saturated zone is approximately 30 to 40 feet [hick, extending to the surface of the underlying Dunkard Group. The on-site production water wells completed in the site aquifer yield 200 to 450 gpm. The underlying Dunkard Group is not a major aquifer. The upper zone of the Dunkard Group (Washington Formation), which consists primarily of shale and silt, likely bounds the lower extent of the site aquifer. In addition, regional groundwater conmiunication between the Ohio River and bedrock will likely result in upward gradients to the alluvial aquifer.
Groundwater quality in the alluvium in this region tends to be naturally poor, having thc highest median chloride, sulfate, hardness (as calcium carbonate), iron, and manganese conccntrations of all hydrogeologic units in the region (Schultz 1984). Water from the alluvium generally is a calcium bicarbonate type, with near neutral pH and high dissolved solids content.
Natural recharge to the alluvial aquifer comes from various sources, including:
m
0 Infiltration of precipitation falling directly on the alluvium
0 Lateral movement of the river water through the alluvium via permeable sand and gravel z o n a
0 Sccpage from stream tributaries that discharge to the Ohio River
The maximum amount of water available to the alluvium depends on the degree of hydraulic connection to the river. The degree of hydraulic connection is a function of the permeability and thickness of the riverbed, permeability and thickness of the alluvium, and hydraulic gradient bctween the groundwater and the river. Pumping of on-site active 0
Compilation of history data Drafl2.doc Jan. 11, 02 2-4 Wilrnington, DE
EID168072
MAH000444

Main Plant and Landfills Washington Works Main Plant
well fields near and parallel to the river (i.e., the Ranney Well, the DuPont-Lubeck Well Field, and the East Well Field shown in Figure 2.2) lowers the groundwater level in the alluvial aquifer to below river stage. This induces water from the river to flow into the alluvium toward the wells, which replaces water pumped from storage in the aquifer, and helps sustain high-yield pumping wells.
-
Groundwater Flow Groundwater generally flows to the south-southwest in the alluvial aquifer. However, groundwater elevations, flow directions, and flow rates on-site are strongly influenced by the Ohio River and by pumping of on-site production wells. The on-site production wells include the Ranney Well, a radial collector well which pumps 800 to 1,000 gpm; the sewn wells in the East Well Field, which pump a combined average rate of 2,000 gpm; and the five DuPont-Lubeck wells, which pump about 700 gpm combined.
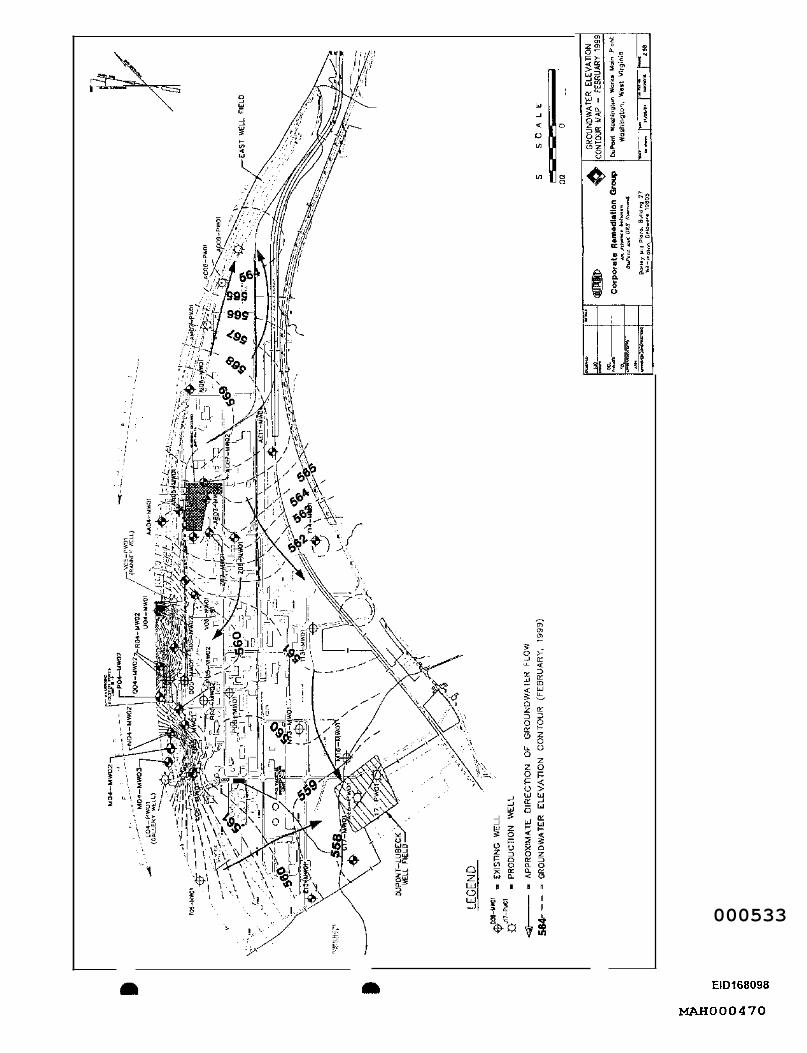
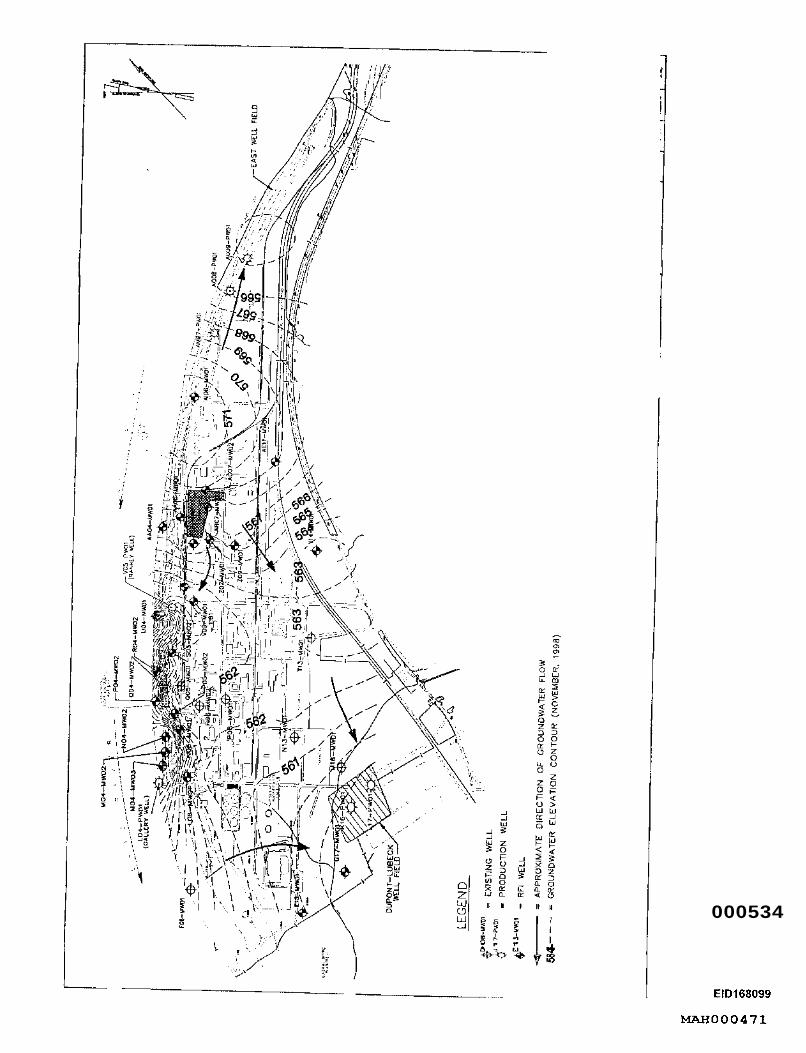
Groundwater elevation contour maps for the alluvial aquifer developed from data measured in November 2000, February 1999, and November 1998 are presented as Figures 2.5A, B, and C, respectively. The direction of groundwater flow is indicated by the flow arrows. As shown on the groundwater elevation contour maps, groundwater flow in the northeast part of the site is toward the East Well Field wells. In the north- central portion of the site, groundwater flow is toward the Ranney Well. In the central and western portion of the site, groundwater flow is south-southwest towards the DuPont- Lubeck Well Field. Pumping of the production wclls (Ranney Well, East Wcll Field, and the DuPont-Lubeck Well Field) eliminates off-site migmtion of impacted groundwater that may originate from thc S \ W arcas. Additional groundwater elevation data was obtained from the General Electric (GE) property located to the west of the main plant. Data from thc main plant and GE were used in calibrating the Washington Works groundwater model (DuPont, 1999). The groundwater model conclusions indicated that groundwater from the main plant area is contained to the DuPont property by operation of the site production wells.
In a 1990 hydrogeologic assessment, production wcll specific capacity testing of the DuPont-Lubeck Well Field and the East Well Field was conducted. The results were uscd to calculate the transmissivity and the hydraulic conductivity of the alluvial aquifer (DuPont 1990). In the vicinity of the DuPont-Lubeck Well Field, transmissivity values ranged between 1 14,900 and 127,500 gallons per day per square foot (gpd / f r2 ) . In the vicinity of the East Well Field, the transmissivity values ranged between 16,050 and 50,000 gpd/ft2. Hydraulic conductivity values were calculated from the transmissivity values for the East Well Ficld. For Wells AX13-PWOI and AZ13-PW01, the hydraulic conductivity values ranged from 0.01 3 to 0.055 centimeters/second (cdsec) and from 0.01 to 0.049 cdsec , respectively.
Using the hydraulic conductivity values from the 1990 study and the hydraulic gradient values determined from groundwater clcvations measured in 1990 and assuming an effective porosity value for sand and gravel of 35 %, the groundwater flow velocity for several well pairs was calculated. The groundwater flow velocity was estimated at 5 feelMay (Wd) between monitoring wells T13-MWOl and L18-MWO1 in the southwest portion of the site. A groundwater flow velocity of 3 A/d was estimated between monitoring wells P06-MWO1 and K14-MWO1 in the western central portion of the site.
Compilation of history data Draft 2.doc Jan. 11.02 Wilrnington. DE
2-5
____. 000508 EIDl68073
MAH000445
Main Plant and Landfills Washington Works Main Plant
2.3
2.3.1
2.3.2 a
In the eastern portion of the site, a groundwater flow velocity of 2.5 fUd was estimated for the site aquifer between monitoring wells ALlO-MWOl and A009-MW01.
Groundwater seeps at the Riverbank Landfill were identified and sampled during the VI (DuPont 1992). An active French-Drain pundwater colIection has been in operation at the Riverbank Landfill since 1991. The RFI verified that the collection system effectively captures water at the seep area.
Water Quality
Surface Water Quality
Historical surface water C-8 concentrations are presented in Table 2.1A. Surface water sample locations are shown on Figure 2.2. Surface water C-8 concentrations were measured in 2000 and 2001 at two outfalls, 002 and 005 and at two river locations. The outfalls have been sampled monthly since February 2001. Outfall 005 C-8 concentrations have ranged from I .43 ug/l to 199 ug/l, while Outfall 002 C-8 concentrations overall have been much lower, ranging fkom 0.436 ugA to 8.54 ug/l. In general, Outfall C-8 concentrations have significantly declined in 2001. This is the result of installation of a carbon adsorption trcatmcnt systcm in the fluropolymers process. The system is designed to remove a major percentage of C-8 from the process wastewater.
Groundwater Quality
Concentrations of C-8 in groundwater sampled at the main plant have been evaluated since 1991 (Table 2.1B), however, the wells sampled and the sampling frequency has been variable. Some wells have been monitorcd annually since 1996 and others have been monitored quarterly starting in January 2001. Two plant-wide goundwater- sampling evcnts wcrc conducted as part of the RFI (November 1998 and Febniary 1999) and are discussed below. The sampling events focused on evaluating groundwater quality from existing and newly installed wells associated with the Burning Ground and Riverbank LandfilVDigestion Ponds SWMUs.
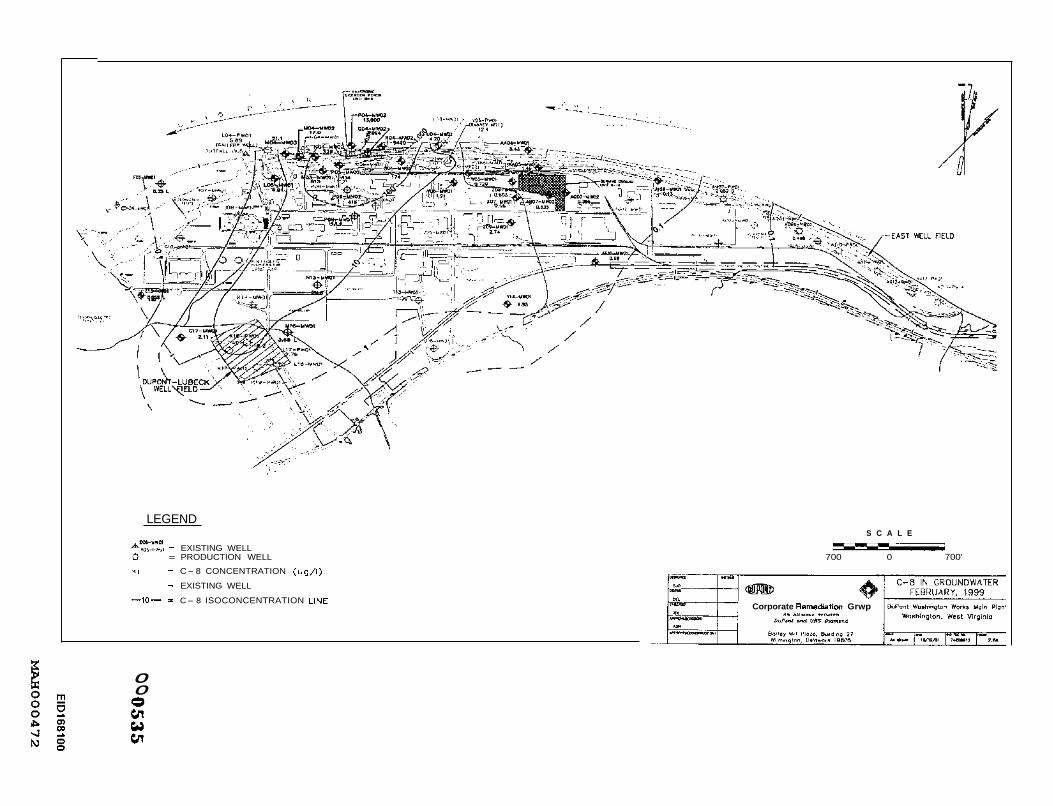
All plant wells sampled during the RFI were analyzed for C-8. At the Rivcrbank LandfilVDigestion Ponds area (in the western portion of the Riverbank Landfill), C-8 was detected in groundwater and previous seep samples. Figurcs 2.6C and 2.6D depict the well localions and results for C-8. Measured concentrations ranged from ~ 0 . 1 to 13,600 pg/L. Conccntrations werc bclow 40 pg/L in 28 of the 37 wells sampled; in the other 9 wells. maximum concentrations ranged from 380 to 13,600 pg/L. The highest concentrations were measured in monitoring wells P04-MW02 and R04-MW02, near the Digestion Ponds area.
The RFI C-8 concentration values wcrc utilized for contouring. Isoconcentration maps were prepared and are presented in Figures 2.6A and 2.6B.
2-6 Compilation of history data Draft 2.doc Jan. 11.02 Wilrninglon. DE
W O O 0 4 4 6
Main Plant and Landfills Washington Works Main Plant
2.3.3 Drinkingnap Water Quality
Production Well AM07-PW01 (historically known as well 336) supplies potable water to the main plant. C-8 concentrations in drinkingltap water have been measured at four distribution points on the plant periodically since May 1999 (Table 2. IC). Concentrations ranged fiom 0.213 ug/l lo 0.589 ugk C-8 concentrations detected at three sampling points in the distribution system on October 11,2001 were 0.507,0.45, and 0.423 ug/l, respectively. No obvious trends are seen in the data.
2.4 Site Conceptual Model The main plant site conceptual model describes the potential exposure routes for current and future human and ecological receptors. Potential exposure routes were evaluated and classified as complete or incomplete.
Direct exposure to C-8 bearing materials contained within the SWMUs is minimal or non-existent, because these materials have been removed and regraded or paved (Burning Ground, Wastc Incincrators, and Digestion Ponds) or covered and vegetated. Therefore, contact with these materials is considered to be an incomplete exposure pathway.
A large portion of the plant site is covercd with asphalt and concrete. Hcnce surface water contact with C-8 impacted soils or groundwater is not likely in these areas. Therefore, surface water contacting C-8 impacted soils is Considered to be an incomplete exposure pathway. Much of the precipitation falling on site is routed toward drains and stonn sewers, which ultimately discharge into the Ohio River. Precipitation falling on the riverbank slope either percolates into the soil or runs off to thc river. The sccps that occur in places along the riverbank are probably caused by percolated water that accumulates above the slumped, low-permeability clay and silt of the Ohio River deposits that underlie topsoil and f i l l along the riverbank. Contact with impacted seep water is considered to be an incomplete exposure pathway due to the active fiench-drain groundwater colIection system.
Direct exposure to groundwater impacted by C-8 is also considered to bc an incomplete pathway because groundwater is located at about 60 feet bgs. The only potential contact route for groundwater is via contact with water pumpcd from production wells. Water pumped fiom production wells is used for two purposes, supplying drinking water and providing industrial process water.
Well AM07-PWOl is one of three production wells that provides drinking water to the main plant. Other wells are A008-PW01 and AQ09-PWO1. AMO7-PWO1 was sampled eight times. Measured concentrations of C-8 in this well suggested that this exposure pathway is considered to be complete. However, average conccntrations of C-8 in drinking water at point of use (which is a mixture of water fiom the three wells) will be lower than the maximum concentrations detected in any single well. Contact with impacted drinkingltap water is a complete exposure pathway.
C-8 was detected in production wells providing industrial process water (K16-PWO1, VOS-PWOl, and L04-PWOl). The maximum concentration of C-8 was detected in well K16-PWOI (16.2 ug/l). Water from these wells is not used for drinking, but rather for industrial processes including non-contact and contact cooling water, fire water, process 0
Compilation of hislwy data Draft 2 . d ~ Jan. 11, 02 Wilmington. DE
2-7
EID168075
MAH000447

Main Plant and Landfills Washington Works Main Plant
water, conversion to demineralized water to generate steam, and/or consumption in the manufacturing processes. There is a potential for limited contact, however, this contact is expected to be minimal. Average concentrations of C-8 in process water at the point of use (which is a mixture of water from several production wells) will be lower than maximum concentrations detected in any single well. Therefore, while this exposure pathway is complete, it is considered to be minimal.
The RFI ecological evaluation focused on identifying whether significant ecological resources may be exposed to site-related constituents released from the S W s . This evaluation conchded that surface soil at the Riverbank LandfilVDigestion Ponds is the only potential ecological exposure medium within the RFI study area. Surface water contact with C-8 impacted soils or groundwater is not likely because the Waste Incinerators and Burning Ground SWMUs are covered with gravel, asphalt, or buildings and do not provide ecological habitat. Subsurface soil (greater than 2 feet) and groundwater are not exposure media of concern for ecological receptors, and groundwater does not discharge to sufacc water at the site.
2.5 Data Gaps The following data gaps were identified for thc main plant:
0 Additional monitoring wells are needed to further delineate C-8 concentrations in groundwater and to evaluate groundwater flow directions, particularly for groundwater flow in the bedrock below the unconfined alluvial aquifer.
0 Continued refinement of the groundwater model for the main plant is required to reevaluate that groundwater capture by the pumping wells is occurring at the site and that no off-site migration of C-8 impacted groundwater is occurring.
D Surface water quality in the Ohio River should be evaluated. A separate work plan is currently being designed to address this issuc.
Activities to fil l the data gaps will be proposed and discussed in the work plan.
2.6 References DuPont. 1990. Washirigtori Works 1990 PreZiniinuty Hydrogeologic Assessment. Solid
Waste & Geological Engineering Department.
. 1992. Verification Investigation E.I. DuPont de Neniours Co. Washington Works April 1992. (Vol. 1).
. 1999. RCRA FaciZiiy Investigation Report, DiiPont Wasliington Works, June 30, 1999. Corporate Remediation Group.
HaskelI Laboratory. 1991. Ammonium Perfluoroactanoate (FC- 143).
Cornpilalion of history daIa Draft 2.doc Jan. 11.02 2-8 Wilrnington. DE
. . EID168076
MAH000448
Main Plant and Landfills Washington W Main Plant
Schultz, R.A. 1984. Groundwater Hydro2q-y of the Minor Triinijary-the Ohio River, West Virginia
Compilation of history data Draft 2.doc Jan. 11, 02 Wilmington, DE
2-9
MAH000449
TABLES
000513
a
0 Page 1 of 2
000534
-EID168079
MAH000451

Table 2.0 Monitoring Well Construction Data
DuPont Washington Works Main Plant
Red and Italics -- approximate -- taken off cross-section Bold -- Taken from RFI WP
Page 2 of 2
000515
EIDl68080
MAH000452
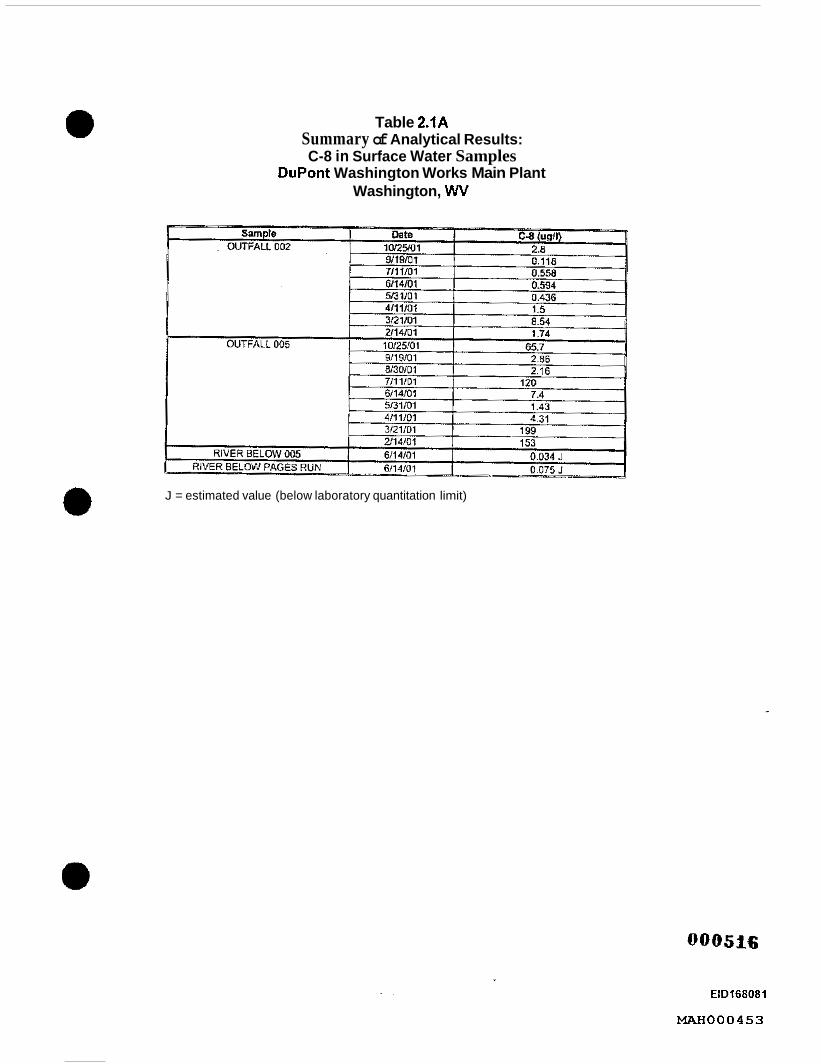
Table 2.1A Summary of Analytical Results: C-8 in Surface Water Samples
DuPont Washington Works Main Plant Washington, WV
J = estimated value (below laboratory quantitation limit)
000516
EID168081
MAH000453

Table 2.1 B Summary of Analytical Results:
C-8 in Groundwater DuPont Washington Works Main Plant
Washington, WV
000517
EIDl68082
MAEX000454

Table 2.1 B Summary of Analytical Results (con?.):
C-8 in Groundwater DuPont Washington Works Main Plant, Washington, WV
e
000518
EIDl68083 ._ _ _ _
W O O 0 4 5 5

Table 2.1 B Summary of Analytical Results (con’t.):
C-8 in Groundwater DuPont Washington Works Main Plant, Washington, W
R = unusable data result (relative to W Q C ) J = estimated value (below laboratory quantification lirnlt) L = posslble low bias result (relative to W Q C ) B= compound detected in QC blank e Non-delect at slated laboratory method detection limit
000319
EIDl68084
M O O 0 4 5 6

Table 2.1 C Summary of C-8 Analytical Results:
DrinkinglTap Water Samples DuPont Washington Works Main Plant
Washington, W
EID168085
MAH000457

FIGURES
000322
86 - --
W O O 0 4 5 8

Washington, West Virginia An A U W m behueen h 9 a 3 O n d U R S D l o m a d
Barley Mlll Plaza Bunding 27 O I O N I O . -I1I yu
M - m 74-1 MbltD.od. on Source: MAP TAKDJ FROM THE UWEW wy USGS W A D R A N G E
Wlrnington. Delaware 19805 O/Z'Ml Y-I r+rrm nmn 2.0

-- - _ _ -000523 EID168088
MAH000460
000524
EID168089
MAH000461

3
m m
000525
EID168090
-000462

c LL _tl 0 0 N
m m
000526
EIDl68091
W O O 0 4 6 3
000527
EID168092
MAH000464
PLEISTOCENE AGE PERMIAN AGE
Ohio River Terrace Deposits (Washington Fm. I
t LL
0 0 t N ul In
0 0 0 0 m 0 (D 0 n
0 0 t N (D ro
0 0 N
c
0 N
L L 0 O 000528
ElDl68093
MAH000465
Washinqton Fm. PLEISTOCENE AGE
Ohio River Terrace Deposits
0 N 000529
EIDi68094
M O O 0 4 6 6

I PLEISTOCENE AGE
I- LL
000530
ElDl68095
MAH000467

c
$L w . -
4 3 m II
c c LL 0 0 cn
0
0 N 000531
EIDl68096
MAH000468
000532
ElDl68097
MAH000469
0 0 F.
w
V :I: VI F.
000533
EIDl68098
MAH000470
000534
I EIDl68099
MAH000471
LEGEND S C A L E
$(xlbywo' = EXISTING WELL w S*OS-'*' = PRODUCTION WELL 700 0 700'
*c I = C- 8 CONCENTRATION (ug/i)
= EXISTING WELL
Corporate Remediation Grwp -10- = C- 8 ISOCONCENTRATION LINE
In "lh*nr. b.Nr.."
0 0

W c3 l.0 0 0 0
.OOL 0 OOL -
000537
EIDl68 102
MAH000474
Main Plant and Landfills Local Landfill
a 3.0 LOCAL LANDFILL
Environmcntal Setting ......................................................................................................................................................... 3-2
Water Quality ............................................................................................. ...................................... 3 1
Site Conceptual Model ............................................................................................................. ........ 3-5
................................................................................................................................................................................ 3-6
References ............................. ................ .................................................... 3-6
Table 3.0
Table 3.1 A
'Table 3. I B
Figure 3.0
Figure 3.1
Figure 3.2
Figure 3.3
Figure 3.4X
Figure 3.48
Figure 3.5A
Figure 3.58
Figure 3.5C
Figure 3.5D
Figure 3.SE
Figure 3.5F
Figure 3.5G
Figure 3.6A
Figure 3.6B
Figure 3.6C
Figure 3.6D
Tables
Local Landfill Monitoring Well Construcbon Data
Local Landfill Analytical Data Tables - Surface Water
Local Landfill Analytical Data Tables -Groundwater
Figures
Local Landfill Location Map
Local Landfill and Washington Works Main Plant I -milt Radius Map
Local Landtill Monitoring Well and Surface Watcr Samplc Location Map
Local Landfill Cross Section Location Map
Local Land611 Cross Section A-K
Local Landtill Cross Section B-B'
Local Landtill Groundwater Elevation Map ~ November 2001
Local Landtill Groundwater Elevation Map - December 2000
Local Landfill Groundwater Elevation Map - November 1999
Local Landfill Groundwater Elevation Map - November 1998
Local I andfill Groundwater Elevation Map - November I997
Local Landfill Grosndwarcr Elevation Map - December 1996
Local Landfill Ciroundwwcr Elevation Map - December 1994
Local Landtill C-8 Concentntion - May 2001
Local Landfill C-8 Concmnation -May 2000
Local Landfill C-8 Concentration - May I999
Local Landfill C-8 Conccirtration - May I998
Compilation of history data Draft 2.doc Jan. 11, 02 3-1 Wilmington. DE
000538 .. EID168103
MAH000475
Main Plant and Landfills Local Landfit1
3. I
3.2
3.2.1
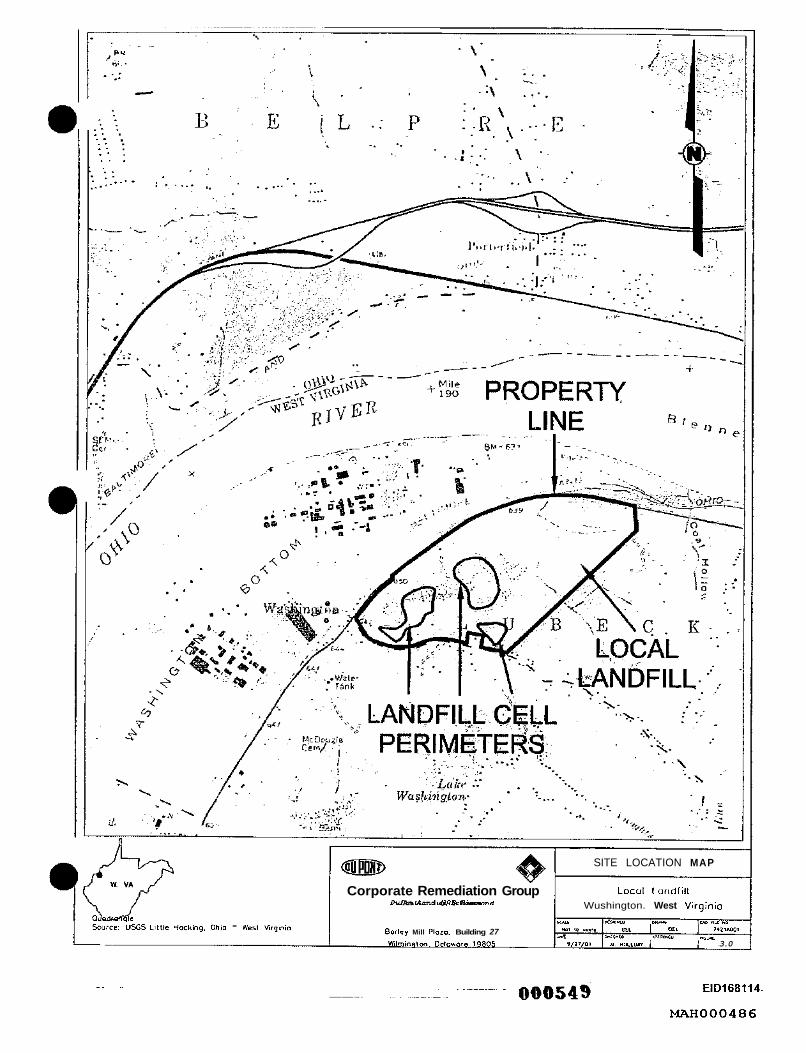
Introduction The Local Landfill is located immediately adjacent to the main plant off the southern perimeter (Figure 3.0). The landfill and plant are located along the Ohio River in Washington, West Virginia, approximately seven miles southwest of Parkersburg, West Virginia. A water use and well survey is currently being conducted for the area within a I-mile radius of the landfill perimeter (Figure 3.1).
The Local Landfill consists of three separate closed cells located on the heavily wooded 250-acre site. The cells were operated from 1964 to the middle 1380s under West Virginia/National Pollutant Discharge Elimination System (WVNPDES) Permit No. 0076538. The permit is currcntly undergoing renewal and is expected to be effective in January 2002. The permit requires monthly surface water sampling and semi-annual groundwater monitoring.
Materials landfilled included scrap product, scrap metal, wood pallets and bins, and Powerhouse ash. Approximately 144 tons of waste per year wcre disposed in the landfill. Powerhouse ash comprised about 70 percent of the total waste. The specific source of C- 8 in historical groundwater and surface water samples collected kom on-site locations has not yet been determined. The cells were closed and covered with approximately two feet of low permeability soil.
Figure 3.2 shows the location of the three cells, monitoring wells, and surface water sampling points. The cells havc no compactcd or synthetic bottom liners. However, a hydrogeologic evaluation indicated that the natural soil present under the cell materials is cornposcd of reddish brown clay and weathered shale having a very low hydraulic conductivity of about 5 X c d s e c (DuPont, 1990) and ranges from 3.5 to 19.5 feet in thickness.
Environmental Setting
Geology
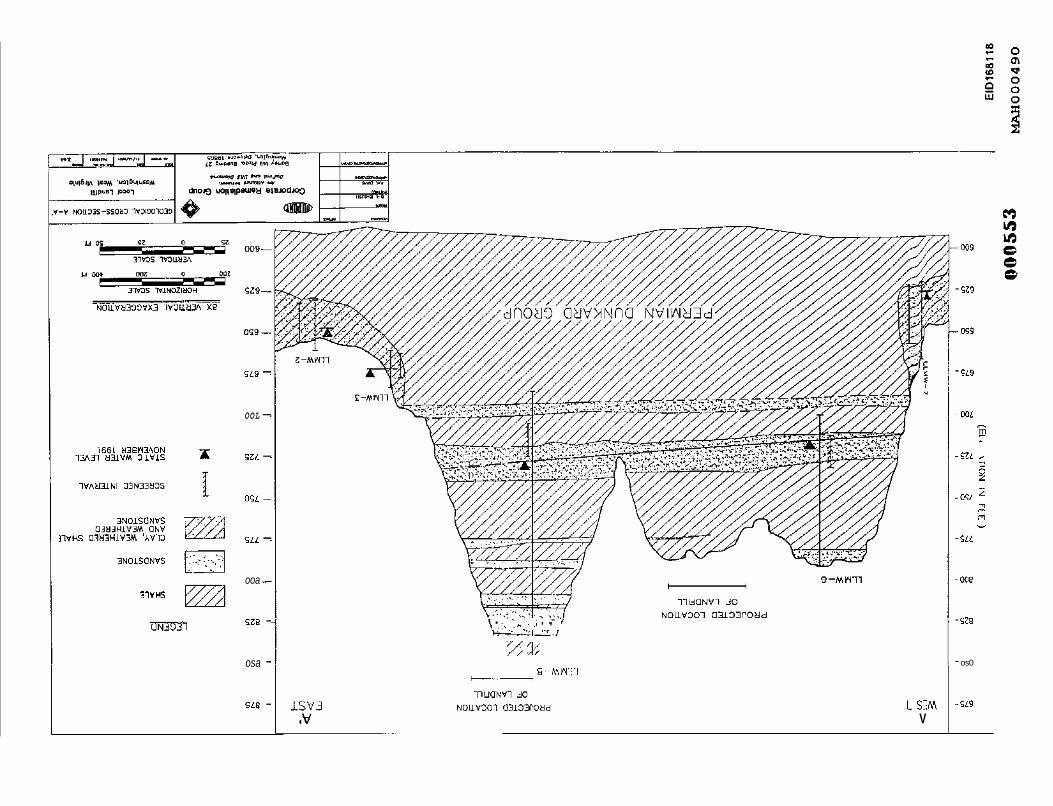
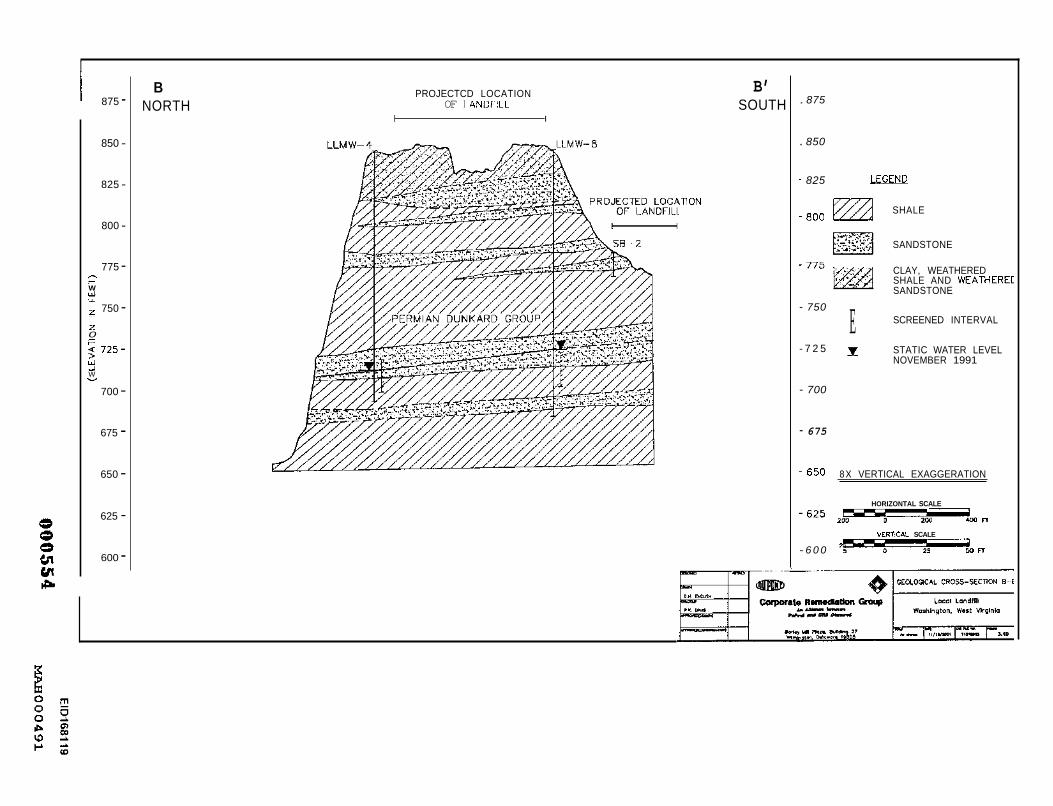
The Local Landfill is situated in a hilly area with relief of approximately 30 to 40 feet. The slopes appcar to be a combination of natural topography with terraced outcrops of massive sandstone and siltstone underlying varying amounts of soil cover and man-made landfill plateaus. The locations of two cross-sections developed for the Local Landfill are shown in Figure 3.3. The hvo cross-sections, A-A’ and B-B’, are shown in Figures 3.4A and 3.4B, respectively.
A shallow tight clay layer starting at ground surface ranges from three to 25 feet thick. The clay contains some minor sandy and silty zones, and some pebbles and fragments of sandstone in some locations. The clays are of low plasticity and appear to be well compactcd, often displaying a laminar structure (DuPont, 1990). Underlying the shallow clay layer is weathered shale ranging from 10 to 35,feet thick. Below this compctcnt bedrock is present at depths ranging from 21 to 40 feet below ground surface.
Compilation of history data Draft 2.doc Jan. 11.02 Wilrnington. DE
3-2
000539 EIDl68104
W O O 0 4 7 6
Main Plant and Landfills Local Landfill
The bedrock at the Local Landfill consists of intcr-bedded red and varicolorcd sandy or calcareous shale, and gray, green, and brown sandstone of the Permian age Dunkard Group. The maximum thickness of the Dunkard Group in this region is 570 feet. The cross-sections show that the sandstone layers dip gently towards the north. Most of the sandstone layers located in the upper portion of the stratigraphic section are lenticular and laterally discontinuous. Two laterally continuous sandstone layers arc located in the lower stratigraphic section.
3.2.2 Hydrology, Hydrogeology and Groundwater Flow
Hydrology In general, infiltration of precipitation is limited due to the very low hydraulic conductivity (5 x weathered bedrock (DuPont, 1992). In addition, infiltration of precipitation into the cells is limited by approximately 2-feet of low permeability soil and vegetative cover capping of the cells. Leachate froin the southern cell and the eastern cell flows from the seeps in the steep valley walls to leachate collection ponds, Pond 1, 2 and 3 (Figure 3.2). Leachate from these ponds is discharged into a pipeline and conveyed to the main plant where it passes through storm water Outfall no. 001 into the Ohio River. Monitoring of combined pond effluent conveyed in the pipeline is conducted at Outlet 101.
Hydrogeology Groundwater underlying the Local Landfill occurs in hvo zones. The discontinuous upper zone coiisists of the clays and underlying weathered bedrock and has a very low hydraulic conductivity (DuPont, 1992). Thc lowcr zone consists of the continuous and discontinuous sandstone 1ayers.having low permeability of 1 x 10’ c d s e c . The sandstonc layers are separated by laterally continuous shale layers. Well yields from the sandstone layers are very low, ranging from ~ 0 . 5 gpm to 1.5 gpm (DuPont, 1332). The upper (and thicker) of the two laterally continuous sandstone layers located in the lower zone at elevations between 710-740 feet above Mean Sea Level (Figures 3.4A and 3.4B) has been designated as the “underlying significant aquifer” and is currently monitored semiannually as required by thc permit.
In 1989, eight monitoring wells were installed at the Local Landfill by Tetra Tech Richardson (LLMW-I through 8). However, five of these monitor wells (LLMW-1, -2, - 3 : -5: and -7) were closed in 1996 because they were screened in the discontinuous shallow clays and underlying weathered bedrock. LLMW-8, a bedrock well, was closed in 1997 because it was dry. Two additional bedrock wells, LLMW-9 and -10 were installed in 1995 and 1997, respectively. LLMW-9 was installed as a background well. These wells are screened within the significant underlying aquifer. Table 3.0 summarizes the well construction data for the existing monitoring wells.
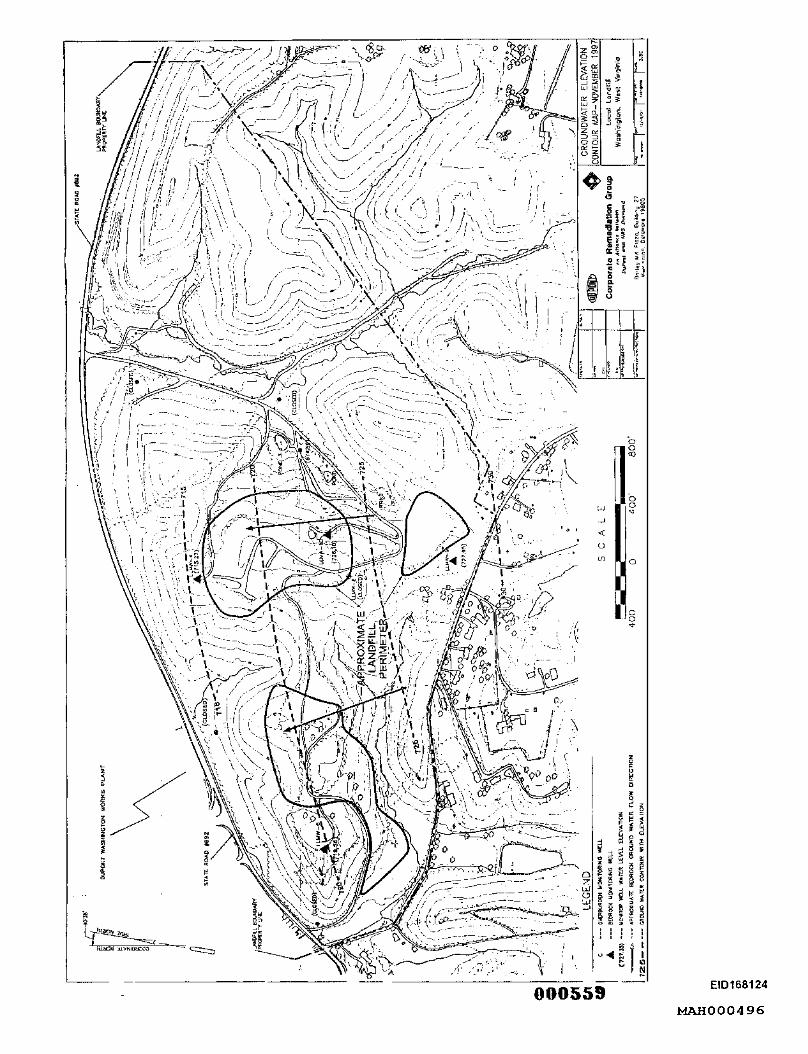
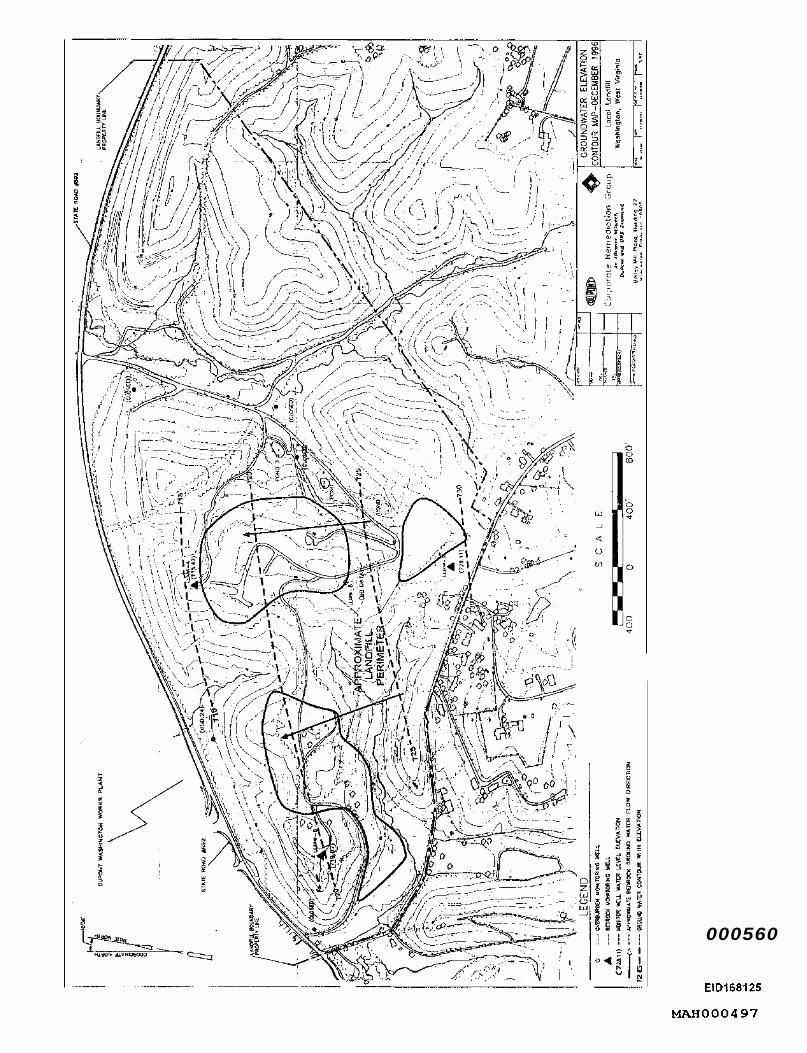
Groundwater Flow Groundwater elevations have been measured semiannually since 1994. Groundwater elevation contour maps for the significant underlying aquifer have been prepared fiom this data as required by the WVNPDES Permit No. 0076538. Figures 3.5A through 3.5G present maps for 2001 through 1996 and 1994. The groundwater contours were
c d s e c ) of the surficial clays (where these clays exist) and the
Compilation of history data Draft 2 . d ~ Jan. 11.02 3-3 Wilmington, DE
000540 EID168105
MAH000477

Main Plant and Landfills Local Landfill
transferred from the original maps submitted for the permit to the updated Local Landfill base map.
Evaluation of limited groundwater elevation data for the closed wells (based on well installation information) indicates a downward vertical gradient between the upper discontinuous water bearing zone and the lower sandstone layers containing the underlying significant aquifer. IR addition, C-8 present in the underlying significant aquifer provides M c r support for a downward vertical gradient.
The groundwater contour maps for the underlying significant aquifer show that flow is from the south to the north towards the plant. The sandstones of the underlying significant aquifer outcrop in the valley walls where discharge may occur as seeps. However, groundwater may also flow downslope within the fractured rocks of the valley walls and ultimately enter the alluvial terrace deposit on the main plant. Groundwater discharging to seeps ultimately migratcs to the plant through a number of pathways. It can discharge downward to leachate collection ponds and pipes to the main plant where it enters storm sewers and discharges to the Ohio River. Groundwater also can seep to small streams draining the property to the north and flowing to the Quaternary alluvial terrace unconfined aquifer where pumping of on-site active well fields controls groundwater flow. Groundwater flow in the alluvial aquifer, adjaccnt to the valley walls of the Local Landfill, is towards the pumping wells located near and parallel to the Ohio River. The pumping of these wcll fields also lowers the groundwater level to below river stage, inducing surface water from the river to flow into the alluvium towards the pumping wells. Water from the pumping wells is used for non-contact cooling purposes and ultimately is discharged to the Ohio River.
3.3 Water Quality
3.3.1 Surface Water Quality
Table 3.1A prcscnts the historical C-8 concentration data available for surface water. Figure 3.2 shows the surface water sampling locations, if the location currently exists. Samples from two outfalls, four outlets: two streams, and one leachate sampling location have been collected periodically since 1994. C-S conccntrations in the outfalls and outlets range from c0.2 ug/l to 80 ug/l. Stream sample C-8 concentrations ranged from 4.12 ug/l to 15 ug/l. The leachate sample, collected in the pipe from the leachate ponds, had a concentration of 31 ug/l (February 1994). For sample locations having more than two sampling events, the concentration of C-S is decreasing with time although it is difficult to accurately identify trends in samples with the limited data set. The C-8 concentration at Outlet 101, located at the northeastern portion of the side, have decreased from 54 ug/l to 12 ug/l over the course of three sampling events.
3.3.2 Groundwater Quality
Analysis of C-8 in groundwater has been conducted annually on a voluntary basis since 1996. Table 3.1B presents the data available for C-8 in Local Landfill monitoring wells. Groundwater was sampled annually in 1996, and 1998 through 2001 for three wells, LLMW-4, -6, and -9. LLMW-IO was sampled twice in 1998 and 1999. The limited
0 Compilation of history data Draft 2.doc Jan. 11.02 3-4 Wilrnington. DE
000541 EIDl68106
MAH000478

Main Plant and Landfills Local Landfill
amount of data makes it difficult to develop concentration contour maps. In addition, the monitoring wells are located at three separate areas (cells) of the landfill; therefore, annual data for the past four years is posted in Figures 3.6A through 3.6D but is not contoured.
C-8 concentrations in LLMW-9 and -10 range from non-detectable to 0.22 ug/l. The other two wells, LLMW-4 and -6, have the highest concentrations, ranging from 1.4 to 39 ug/l and from 1.32 to 15 ug/l respectively. Although there is limited data, the data shows a distinct reduction in C-8 concentration over time for wells L L W - 4 , -6, and -9.
3.4 Site Conceptual Model
The Local Landfill site conceptual model describes the potential exposure routes for current and future human and ecological receptors. Potential exposure routes were evaluated and classified as complete or incomplete.
Access to the Local Landfill is restricted by electronic and locked gates at the road entrances, However, a posted nature trail has been established on the east side of the landfill property. The trail loops around the eastern part of the landfill starting and ending near the landfill‘s electrically operated gate. The nature trail is a marked trail and docs not cross the cells. Access to the site from surrounding roads is possible but is discouraged due to the heavily wooded nature of the property and the hilly terrain.
The three cells at the Local Landfill are covered with a low permcability soil and vegetative cover. This cover prevents human and ecological receptors’ exposure to the landfilled materials and to thc soils potentially impacted by the landfill materials. However, these materials could potentially be exposed by extensive digging or rooting in the soil by animals or unauthorized people. Therefore this pathway is considered to be potentially complete but minimal.
An additional potentially complete exposure pathway exists if the soil and vegctative cap is eroded by precipitation. Pennit WOO76538 requires that the landfill surface will be inspected quarterly for evidence of cracking or erosion (which could allow surface water to enter the solid waste deposit) and evidence of settling of solid waste (causing ponding of surface water). Per Condition (3-16 of the permit, a stormwater erosion inspection is conducted annually. Therefore, this potentially complete pathway is considered to be minimal.
At the landfill, precipitation is expected to take one of two paths. It may infiltrate downward through the vcgctated soil cover and into the cells. However, the low permeability of the soil cover reduces the amount of infiltration. If the precipitation infiltrates the soil cover, it will possibly encounter the landfill materials and will continue downwards. It may be prevented from further downward migration by the low permeability clays and weathered bedrock. However, if this water migrated Grther downward, it should encounter the sandstones and shale layers. Groundwater flowing through the sandstone layers that outcrop in the valley walls located above the plant site’s southern edge would be exposed at the surface in seeps, if seeps exist. The existence and location of seeps at some places on the property have been observed, particularly those mentioned near the leachate collection ponds. Much of the site remains unexplored,
Compilation of history data Draft 2.doc Jan. 11. 02 Wilmington, DE
000542:
~
3-5
EIDi68107
MAH000479
Main Plant and Landfills Local Landfill
therefore, complete evaluation of this potential exposure pathway (surface water to groundwater to surface water) is currently not available.
Another possible migration route for precipitation is direct flow as surface water via overland flow downslope. In this case the water would not encounter the fill materials at any point it time. This potential exposurc pathway is considered incomplete.
Contact with groundwater impacted by C-8 is another potential exposure route for current and future human and ecological receptors. However, contact with groundwater under the landfill is limited, although, contact with leachate that has reached the ground surface via seeps is possible in the vicinity of Pond 1, near the southern most cell. Ponds are open and accessible to limited number of DuPont employees. As stated previously, groundwater flowing through the sandstone layers that outcrop in the valley walls located above the plant site’s southern edge would be a possible contact location. However, because seeps in this area are not evident, it is likely that groundwater flows downslope within the fractured rocks of the valley walls and discharges to the main plant alluvial tcrracc. Determining the existence and location of seeps on the property has not been completed therefore, this potential exposure pathway cannot be fully evaluated.
.
3.5 Data Gaps The following data gaps were identified for the Local Landfill:
Ll Identify the locations of szcps in the valley walls a i d determine water quality with respect Lo C-8 concentration.
0 Determine the C-8 concentration in streams and other surface water bodies.
D Acquire additional geological data to refine the Site Conceptual Model.
0 Install additional monitoring wells to provide additional groundwater flow data and groundwater quality data.
c1 Gather additional C-8 concentration data from monitoring wells for plume delineation.
Activities to f i l l the data gaps will be proposed and discussed in the work plan.
3.6 References DuPont. 1990. JVushirigton Works 1990 Preliniinury Hydrogeologic Assessment. Solid
Waste & Geological Engineering Department.
. 1992. Verificatim Investigatiori E.I. DuPont de Nemotrrs Co- Washington Works April 1992. (Vol. 1).
Cornpilalion of hislory data Drafl Z.doc Jan. 11.02 Wilmington, DE.
3-6
. - . . 000543 EID168108
MAH000480
TABLES
I
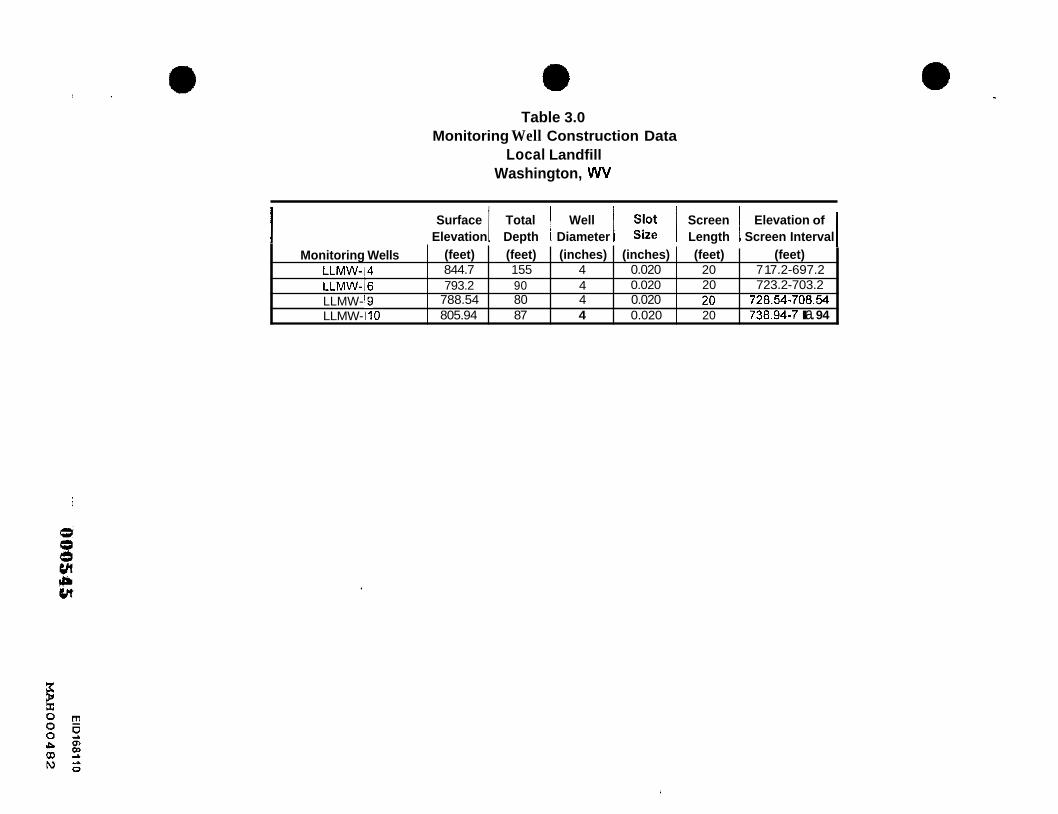
Table 3.0 Monitoring Well Construction Data
Local Landfill Washington, WV
Monitoring Wells LLMW-I4
LLMW- 19 LLMW- I 10
LLMW-16
I Surface I Total I Well I N3; I Screen 1 Elevation of Elevation Depth Diameter Length Screen Interval
(feet) (feet) (inches) (inches) (feet) (feet) 844.7 155 4 0.020 20 7 1 7.2-697.2
0.020 20 723.2-703.2 793.2 90 4 788.54 80 4 0.020 20 728.54-708.54 805.94 87 4 0.020 20 738.94-7 I a. 94

0
Table 3.1A Summary of Analytical Results: C-8 in Surface Water Samples
Local Landfill Washington, WV
4/2/1996 61 I OUTLET 002 512911997 c0.2
4/2/1996 72 23 OUTLET 003 32911 997
OUTLET 101 Yt l 4 l L U U U I L
^^
I I C
STREAM 1
STREAM 2 ,-._
. EIDi68111_
MAH000483

Table 3.1B Summary of Analytical Results:
C-8 in Groundwater Local Landfill
Washington, WV
Sample LLMW-4
LLMW-6
Dale C-8 ( u d ) 5/16/2001 1.4 5/11/2000 10 511 911 999 16.2 512711 998 26 4/1111996 39 5/16/2001 3 5/10/2000 1.42 5/19/1999 1.32
000547 EIDi68112
MAH000484

FIGURES
0
000548
_ - . - . . . . . - . . - - . . . . .
SITE LOCATION MAP
Corporate Remediation Group W o n 1 An Alliance and LIRS between Ciamond
Locul I oridfill
Wushington. West Vyrginio
71. VA
yw -*m De"L C M "< no
am D X - I D "-e- nc3.L Not I@ %ow EL DCL 7121MO Barley Mill Ploro. Building 27 %Jrce: USGS Little locking. Ohio - We51 Vlrgmm
Wilrninqloo. Oclawcre 18805 9/27/01 U. HOC'LDLI 3.0
.:r Quodranqle
EID168114.
MAH000486

EIDl68116
MAH000488

000552
1 ElDl68 1 17
MAH000489
OO- 3FMS WINOZIYOH
NOUVU333VX3 7 V 3 1 1 8 3 X8
L66L 838WMON 1 3 3 1 tl3lVM 311VlS
1VAt l l lN I 03N3383S
3NOlSONVS
fVHS O3H3HlV3M h V l 3 ~ ~ I ~ H L V ~ M , aNv
3NOlSONVS
31VHS
m
SL9 -
OOL -
SZL -
OSL -
SLL -
ooa -
628 -
osa -
SL0 -
L: ,. .. I . . . . ., I . ,; ;. .;,- , .. .. . - '
. ..
.. I.. ..:
,J 1.' 8-MWl l -
L S!M V
- SZ9
- SL9
-001
m
-SZL i. 3
F
P - -0SL =
T Tp m 9 v
- SLL
-ma
- sz0
- os0
- SLB
I
875 -
850 -
825 -
800 -
775 - h + W
2 750 - z
z 0 2 725- w -1 W v
700 -
675 -
650 -
625 -
600 -
B NORTH
PROJECTCD LOCATION OF I ANDFILL
I I
B’ SOUTH
,TION
. 875
. 850
- 825 LEGENO
- aoo m SHALE
- 775 1 . . ...
- 750 E - 7 2 5
SANDSTONE
CLAY, WEATHERED SHALE AND WEAMEREC SANDSTONE
SCREENED INTERVAL
STATIC WATER LEVEL NOVEMBER 1991
- 700
- 675
- 650 8X VERTICAL EXAGGERATION
HORIZONTAL SCALE
-625 20-i n VERTICAL SCALE
- 6 0 0 ’’ -i n

EID 1 68 120
MAH000492

EIDl68121
MAH000493


000538 EIDl68123
MAH000495
EID168124
MAH000496
000560
EIDl68125
MAH000497
DUPONT
N3WO
Corporate Remediation Group An A l l m c e belweea
DuPonl and URS h m m d
Bo'ley Moil Plo70. Eltiilcinq 2 7 Wtlmlngton Deiowore 19805
rlASHlNGTON WORKS P
Local Landfill Washington, WV
S W C U%UuI ou*l OD C8U *a
MIC A4 ,*em DEL 74>1UJ!J7
3 6 A 01tuto -PMO n ~ w l
11/5/01 raL
\
S C A L E
1 500 0 500'
I ,MAY. 2001
C-8 IN GROUNDWATER MAY 2001

0-000563 EIDl68128
MAH000500

DUPONT
NlMo
S C A L E - 500 0 500'
t Corporate Remediation Group Local Landfill
An Alturnca be1III-n Washington, WV DuPont and URS D l m n d
Barley Mill PIo2a. Building 27
WN) IP cm iwuw EYI - n u *
WT - - - h shnn
3.6C w Immqlon, Delaware 19R05 12/8/01 lVL

DUPONT
Corporate Remediation Group A n A l l ~ m e betwren
S C A L E DuPonf and URS Dtamond
B o r e y Mill Plozo, pudding 27 P
Wdnmglon. Delaware 19805 500 0 500'
LANDFILL EWNDRY / PRWEWYUNC
Local Landfill Washington, WV
Lr h" m 74zit.m
12/8/01 TDL
w - a m Uancm
mK - - f w a 3.60
1
4
000566 EID168131
MAH000503
Main Plant and Landfills Letart Landfill
4.0 LETART LANDFILL Introduction ........................................................................................................................................................................ .4-2
Environmental Setting ........................................................................................................................................................................ 4-2
Water Quality .......................... .................................................................... . 4 3
Site Conceptual Model ..................................... .............. ........................................... 4-6
Dam Gaps ........................................................................................................................................................................................... 4-7
Keferences ......................................................................................................................................................................... 4-8
Table 4.0
Table 4.IA
Table4.1B
Figure 4.0
Figure 4. I
Figurc 4.2
Figurc 4.3
Figure 4.4.4
Figure 4.48
Figure 4.5A
Figure 4.58
Figure 4.5C
Figure 4.5D
Figure 4.5E
Figure 4 SF
Figure 4 6.4
Figure 4.68
Figure 4 . K
Figure 4.6D
Tables
Letart Landfill Mcnitoring Wells Construction Data
Letart Landfill Analytical Data Tables - Surface Water
Letart Landfill Analytical Data Tables - Groundwater
Fig u I e s
Letart Landfill Location Map
Letart Landfill I-mile Radius Map
Lckn Landfill Monitoring Well and Surface Water Sample Lncahon Map
Lctart Landfill Cross Section Location Map
Leort Landfill Cross Scction A-A'
Letart Landfill Cross Section B-B'
Lemrt Landfill F-Zone Groundwater Elevation Map - November 2001
Leiart Landlill F-Zone Groundwater Elevation hlap -January 2001
Letart Landfill F-Zone Groundwater Elevation hlap - October 1999
Letart Landfill F-Zone Groundwater Elevation Map - October 1998
Letart Landfill F-Zone Groundwater Elevation hl3p - December 1094
Lotart Landfill F-Zone Groundwater Elevation hlap - Dccernber 1992
I ,elart C-8 Concentration Map ~ July 2001
L~ta r i C-8 Concentxition Map -January 2000
hur t C-8 Concentratiun Map - July 1999
Letart C-8 Concentration Map - November 1991
Compilation of history data Draft 2 . d ~ Jan. 11. 02 4-1 Wilmington, DE
EIDi68132
MAH000504

Main Plant and Landfills Letart Landfill
4. I
4.2
4.2.1
Introduction The Letart Landfill is located just north of the town of Letart in Mason County, West Virginia (Figure 4.0). A water use and well survey is being completed for the area within a I-mile radius from the landfill perimeter (Fibwe 4.1).
The landfill covers approximately 17-acres of a 205-acre parcel of land owned by DuPont Washington Works. It was in operation firom the early 1960s to 1995. The landfill was operated and closed under West Virginia Solid Waste /National Pollutant Discharge Elimination System Permit No. WV 0076066. This permit requires quarterly groundwater monitoring, outfall and surface water monitoring and engineered cap maintenance.
Figure 4.2 shows the landfill extent, orientation, topography, and monitoring well locations. The landfill was constructed within a natural ravine and has no compacted or synthetic bottom liners. Howevcr, a hydrogeologic evaluation indicated that the natural soil present under the landfill material is composed of highly plastic clay and silt having a pcrmcability of about 10'' c d s e c (DuPont, 1993). The soil thickness ranges from 4 to 14 feet, averaging about 8 feet in thickness.
Letart Landfill received waste was from the Fluoropolymcr manufacturing process at the plant that consisted primarily of scrap product, scrap metal, wood pallets and bins, and miscellaneous trash. Approximately 5,000,000 pounds of waste per year were disposed in the landfill. This waste is believed to be the source of C-8 in the historical groundwatcr and surface water samples collected fiom on-site locations.
The Letart Landfill was permanently closed by installing an engineered multi-layer geosynthetic and soil cap (DuPont, 2001). Included in the closurc activities wcre the installation of a leachate collection system, erosion and drainage control measures and chain-link fencing. Thc cap construction was completed in April 2001.
Environmental Setting
Geology
Thc Lctart Landfill is situated on a heavily dissected plateau consisting of several steep V-shaped valleys. Residual soil covers most landfill areas. In general, the soil at the site has been described as residual in nature, consisting primarily of heavy clays derived from the weathering of bedrock. At most landfill areas, thc soil is less than ten feet thick, with a maximum thickness of 20.5 feet.
The underlying bedrock at the Letart Landfill consists of inter-bedded red and varicolored sandy or calcareous shale, and gay , green, and brown sandstone of the Permian age Dunkard Group. The maximum thickness of the Dunkard Group in this region is 570 feet. Thc location of two cross-sections, A-A' and B-By, crossing the landfill are shown in Figure 4.3. The two cross-sections of the underlying geology are shown on Figures 4.4A and 4.4B.
Compilation of history data Drafl 2 . d ~ Jan. 11.02 4-2 Wilmington, DE
000568 - EIDl68133
MAH000505
Main Plant and Landfills Letart Landfill
Geologic investigations conducted at the Letart Landfill identified six stratigraphic water- bearing zones that were designated as Zone A through Zone F, with Zone A being the shallowest zone and Zone F the deepest. These zones consist of massive, very fine to fine grained crystalline sandstone with occasional shale lenses. Zones A through F are separated by locally continuous shale unitsthat are generally ten feet or greater in thickness. Zones A through D E are discontinuous. Zone F is the first laterally continuous zone under the landfill. Zones A, C, DE and F outcrop on the valley sidcs .and along the Ohio River near the southern end of the landfill.
4.2.2 Hydrology, Hydrogeology and Groundwater Flow
Hydrology The Letart Landfill engineered cap system prevents surface water from contacting landfilled materials. Precipitation falling on the engineered cap system takes one of two paths. It may infiltrate downward through the vegetatcd soil and encounter the impermeable geomembrane and then flow laterally downslope on top of the geomembrane. Alternatively, precipitation may flow via overland flow on top of the vegetative layer downslope. In either situation, this surface water does not contact the landfilled materials and migrates downslope towards drainage ditches constructed in or adjacent to the cap system. Precipitation falling on the northwest side of thc upper part of the cap flows downslope towards the southwest, away f7om the landfill, into a drainage ditch that flows to a sediment trap near LMW-6. Precipitation falling on the remaining portions of the cap flow downslope and towards the south in drainage ditches.
Hydrogeology Hydraulic conductivity testing [Le., slug tests (Zone A) and borehole packer tests (Zones C, D/E and F)] of the bedrock zones indicates that these zones display low hydraulic conductivity (Tetra Tech Richardson, 1990). Zone A hydraulic conductivity is low, ranging from lo4 cm/sec to less than lo-’ cdsec . (There are no wells monitoring Zonc B, therefore, it was not tested.) Zones C and F have very low hydraulic conductivities ranging from IO‘(‘ c d s e c to less than 10-8cm/sec. Zonc DIE hydraulic conductivities are also very low and range 6om i o 5 cm/sec to IO-’ cm/sec.
Zone F has been designated the “underlying significant aquifer” as defined by to the West Virginia Solid Waste Management Regulations because it is laterally continuous under the landfill and is thought to be hydraulically connected to the Ohio Rivcr south of the landfill. Most current groundwater monitoring is conducted in Zone F. The low hydraulic conductivity can be attributed to the very fine-grained nature of the watcr-bcaring units. Ln addition, many sandstone units in the region typically display effective porosity as low as 1 percent. This low porosity results from pore space being filled in by authigenic minerals (e.g. kaolinite) sometime after original sediment deposition.
Zone F groundwater average linear velocities were calculated for flow from the north to the southwest and from the north to the southeast (DuPont, 2000). These values are relatively low, 0.01 and 0.003 Wday rcspcctively. The low velocities calculated in the F zone indicate that groundwater flow beneath the landfill is very slow, attributable to the
Compilation of history data Draft 2.doc Jan. 1 I, 02 4-3 Wilmington. DE
000569 EID168134
MAH000506
Main Plant and Landfills Letart Landfill
low hydraulic conductivity present in the F zone and all the overlying units as well. Low vertical hydraulic conductivities in the overlying shallow zones limit infiltration and recharge down to the F zone.
The saturated thickness of Zone F ranges from 22 feet in the upgradient well (LMW-2A) to between 2 and 8 feet in five downgradient wells (LMW-SA, -6, -9, -10, and -1 1). In many instances, the monitoring wells at the landfill cannot be sampled until 48 hours (or longer) after purging, when a sufficient quantity of groundwater has recovered in the well screen interval.
Groundwater Flow Thirteen monitoring wells have been installed at the Letart Landfill in thc Zone A, C, D/E, and F sandstone units (Tetra Tech Richardson, 1989; 1990). Two of these wells, LMW-10 and LMW-I 1, were installed in October 2001 to provide additional data from Zone F to the north and south of the landfill. Table 4.0 lists the wells monitoring each zone and provides well construction information. Water level measurements and calculated groundwater elevations have been measured quarterly. Figures 4.5A through 4.5F provide available annual groundwater elevation contour maps for Zone F as required for the permit. This data was transferrcd fiom thc original maps submitted for the permit to the updated Letart Landfill base map.
The location and limited number of monitoring wells within Zones A, C and D/E prevents determination of groundwater flow directions within these zones. However, elevations measured in the monitoring wells indicate ;1 downward vertical gradient within the site groundwater system. Within Zone F, a groundwater divide exists under the center of the landfill in a north-south direction. Groundwatcr cast of thc divide flows southeast towards the Ohio River. Groundwater west of the divide flows towards the west and southwest. Groundwater elevation data, including the newly installed LMW-I I , the most northern monitoring well, indicates a slight component of northward groundwater flow in Zone F in this area.
Rapid decreases in the observed volume of water discharging from the leachate collection system in 200 I indicate that groundwatcr flow under the landfill is being greatly reduced in response to the installation of the engineered cap system. In addition, this reduction indicates that a new equilibrium state for groundwater flow has not yet been reached. Continued monitoring of groundwater elevations of Zones A through F is required to evaluate long-term changes in groundwater f low resulting from closure-activities.
4.3 Water Quality
4.3.1 Surface Water Quality
Voluntary surface water sampling for C-8 has been performed periodically since 1991. This data is presented in Table 4.1 A. The two locations sampled most frequently, the Upper and Lower ponds, no longer exist. During construction of the engineered cap system, these ponds werc de-watered and the sediments underlying the ponds were excavated and placed in low areas of the landfill prior to the installation of the cap. Currently, only two surface water locations still exist (due to landfill cap construction)
Compilation of history data Draft 2 . d ~ Jan. 11. 02 4-4 Wilmington. DE
ElDl68 135
MAH000507 000570

Main Plant and Landfills Letart Landfill
and are being sampled. These locations include the leachate &om the landfill [location 002(leachate basin)] and the stream locatcd slightly east of the property line along Rt. 33. The locations of these surface water-sampling points are shown in Figure 4.2.
0 4.3.2 Groundwater Quality
Groundwater from the monitoring wells has also been voluntarily sampled and analyzed for C-8 periodically since 1991. However, sampling did not take place on an annual basis until 1996 and quarterly sampling began the second half of 1999, when C-8 was added to the permit as a monitoring parameter. Table 4.1B presents all historical analysis available for C-8 fiom monitoring wells at the Letart Landfill. The limited data set makes contouring the values difficult, therefore, the values were posted on maps and not contoured. Figures 4.6A through 4.6D present the C-8 concentration values for July 2001, January 2000, July 1999, and Novcmbcr 1991, respectively.
An initial examination of the groundwater data does not show any obvious overall concentration trends (Table 4.1B). For wells having data fiom 1991 through 2001, it appears that the concentrations measured in 1991 were the lowest. From 1991, the concentrations in ell wells increased. Currently, concentrations are now decreasing again in the most recent sampling events. However, identifying trends in the data is complicated by the fact that three different analytical laboratories have been contracted to perform the analyses between 1991 and 2001. In addition, the effects ofthe installation of the engineered cap system (preventing fkrther surface water infiltration) may or may not be observable in the limited recent data.
For the most recent sampIing cvcnt and analysis (October 2001), the sampling and analytical procedures, and the analytical instrumentation used were modified to gain better accuracy in the C-8 analytical results. These modified procedures will be utilized for all future analysis of groundwater samples for C-8. Continued monitoring of C-8 concentrations in groundwater is required to accurately evaluate lhu long-term trends in groundwater quality.
I f i t is assumed that impacted groundwater flows from Zone A downward to Zone F and ultimately migrates to the Ohio River, the C-8 historical mean for LMW-5B (Table 4.1 B) can be used along with the estimated groundwater flux to calculate the C-8 loading to the river. The following assumptions were made in this calculation.
0 The saturated thickness is 25 !I at LMW-5B. This is higher than thc most recent groundwater elevation measurement and therefore, is a conservative value.
0 The length of the aquifer discharging to the Ohio River is 1000 ft based on the geologic cross-sections.
0 The historical mean value of 855 ug/l for LMW-SB, a downgradient well, represents the concentration of C-8 in the aquifer.
0 The velocity of groundwater in the aquifer is 0.01 Wday. Groundwater average linear velocities for the F zone are calculated to be 0.01 A/day fiom the north to the southwest and 0.003 Wday from the north to thc southcast (DuPont, 2000).
Using these assumptions, the calculation for loading to the Ohio River i s shown below: a Compilation of history data Draft 2.doc Jan. 11, 02 4-5 Wilmington. DE
Q@1)571 ~. ~. . . EIDl68136
MAH000508 . . . . . . . ._ ..... . . . . . . . . ........... . . . - - . . . - - - . - .... - . . . - . - . - . - . - .
Main Plant and Landfills Letart Landfill
4.4
A = Area = 1000 R length x 25 ft saturated thickness for Zone F = 25,000 fl* V = Velocity = 0.01 ft/day (estimated)
Q = flux = A x V = (25,000 ft2) x (0.01 Wday) x (7.48 gaVft3) x (365 day/yr.)
= 682,550 gaVyr
Mass = (855 ugA) x (Ig/109ug) x (lkg/1000g) x (1 Ib/2.205 kg) x (4.785 Vgal) = 1 . 4 7 ~ 1 0 ' ~ Ib/gal x 682,550 gaVyr
= iX 1 0 " ~ ~
Estimated annual loading to the Ohio River is very low based on the calculated mass and should result in a very low C-8 conccntration in the Ohio River. The low calculated mass is reasonable given the low hydraulic conductivities and low average linear velocities observed in the F zone.
Site Conceptual Model
The Letart Landfill site concephial model describes the potential exposure routes Tor current and future human and ecological receptors. Potential exposure routes wcre evaluated and cIassified as complete or incomplete.
The Letart Landfill closure was completed in April 2001 with the installation of an engineered cap system. The engineered cap system prevents human and ecological contact with the landfilled materials. Contact with landfilled materials would only be possible if the cap system were to be intentionally breached by workers or trespassers or by extensive, vigorous digging by animals. However, dense vegetation and appropriately installed fencing restricts access by unauthorized individuals and animals. Therefore, direct exposure to landfilled materials is a potentially complete but very limited exposure pathway.
Exposure of landfilled material because of erosion of the engineered cap system due to storm runoff is also a potential human and ecological exposure pathway. However, cap system drainage controls were designed to convey the runoff from the landfill cap to a designated discharge point and to eliminate the potential for runoff-related erosion of the cap. In addition, the landfill cap is required to be inspected at least quarterly (permit requirement C.12.A) for evidence of erosion as part of the site Storm Water Pollution Prevention Plan. Therefore, this potential exposure pathway is also a potentially complete but minimal exposure pathway.
The Letart Landfill engineered cap system prevents surface water from contacting land filled materials. Surface water migrates towards drainage ditches constructed in the cap system and is discharged ai the southern edge of the landfill. Because this surface water does not contact the landfilled materials, it is not impacted by C-8. Therefore, contact with this surface water is an incomplete exposure pathway.
Groundwater contacting the landfilled material has been impacted by C-8. Contact with this impacted groundwater presents a possible human and ecological exposure pathway due to groundwater flow patterns. Groundwater flow under the landfill has showi that prior to the installation of the engineered cap, surface water impinging on the landfill
Compilation of history data Draft 2.doc Jan. 11,02 Wilrnington. DE
4 -6
EIDl68137
MAH000509
Main Plant and Landfills Letart Landfill
migrated downward through the landfill material. These waters continued to flow as groundwater downward towards Zone F where it then flowed laterally to the west and south. Currently, the engineered cap prevents surface water fiom contacting the landfilled materials although groundwater migrating laterally and vertically underneath the landfill may still contact the landfilled materials. Groundwater under the engineered cap migrates to the leachate collection system. Discharge fiom the leachate collection system is piped to an outfall [002(leachate basin)] where it enters a small, shaIlow, wet weather stream that flows approximately 400 feet before it discharges to the Ohio River. Contact with leachatc is a potential pathway exposure route for current and future human and ecological receptors, however, this pathway is considered complete but limited due to the restricted access to the area.
Zones D E and F occur at elevations lower than the leachate collection system. Groundwater flowing from these zones to the south discharges to the Ohio River. Contact with this water is limited 10 the areas where these zones may outcrop on the valley walls. However, in general, groundwater flows downslope within the shallow soil, colluvium, and fractured rocks of the valley walls and would only be exposed at the surface if seeps exist. Currently, there is no data available on the existence or location of seeps on the slopes adjacent to the landfill or along the Ohio Rivcr. Therefore, evaluation of this potential pathway exposure route for current and hture human and ecological rcceptors is not possible at this time.
Groundwater that flows to the west fiom Zone F is likely to discharge to nearby valley drainage systems and to ultimately migrate to the Ohio River. Again, groundwatcr flows downslope within the fractured rocks of the valley walls and would only be exposed at the surface if seeps exist. Currcntly, there is no data available on the existence or location of seeps in the valleys south of the landfill. Therefore, evaluation of this potcntial pathway exposurc route for current and f h r e human and ecological receptors is not possible 31 this time.
4.5 Data Gaps
The following data gdps were identified for the Letart Landfill:
ci Identify the locations of seeps in the valley walls, particularly in the steep valley wall along the Ohio River, and determine water quality with respect to C-8 concentration.
P Determine the C-8 concentration in the Ohio River.
0 Determine the (2-8 concentration in streams and other surface water bodies.
0 Acquire additional geological data to refine the Site Conceptual Model.
0 Install additional monitor welIs to provide additional groundwater flow data and groundwater quality data.
0 Gather additional C-8 conccntration data fiom monitoring wells for plume delineation.
Activities to fill the data gaps will be proposed and discussed in the work plan. e 4-7 Compilation of history data Draft 2.doc Jan. 11.02
Wilrnington. DE
EIDi68138-
MAH000510

Main Plant and Landfills Letart Landfill
4.6 References DuPont. 1993. Letart Landfill Hjtdrogeologic Evaluation, July 1993. Corporate
Remediation Group.
a . 2000. Letart Landfiil Groundwater Proieciion Plan SWLVPDES Permit No. W0076066, January 7,2000. Corporate Remediation Group.
. 2001. Certification Report Letart Landjill Cap Constructiou, June 2001. Corporate Remediation Group.
Tetra Tech Richardson. 1989. Monitoring Well Installation Program, October 1989.
. 1990. Moniloring Well Installation Program ai Letart Land$il- Summary Report, August 1990.
Compilation of hMory data Draft 2.doc Jan. 11,02 Wilmington, DE
4-8
000574 ~~ EIDI68139
MAH000511

TABLES
I
000575

Table 4.0 Monitoring Well Construction Data
Letart Landfill Letart, WV
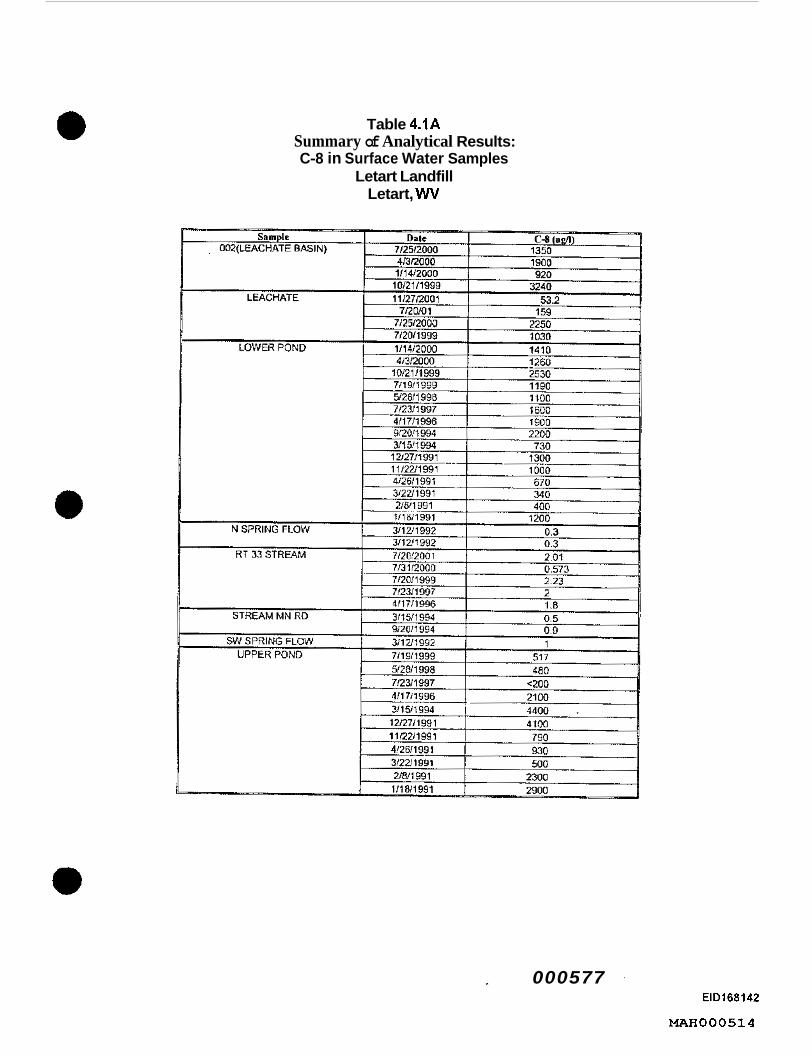
Table 4.1A Summary of Analytical Results: C-8 in Surface Water Samples
Letart Landfill Letart, WV
000577 EID168142
MAH000514

Table 4.1 B Summary of Analytical Results:
C-8 in Groundwater Letart Landfill
Letart, W
J = estimated value (below laboratory quantitation limit).
000378 EID168143
MAH000515

Table 4.1B Summary of Analytical Results (Con’t): C-8 in Groundwater
Letart Landfill Letart, W
000579 ElDl68144
W O O 0 5 1 6

Table 4.18 Summary of Analytical Results:
C-8 in Groundwater Letart Landfill
Letart, WV
J = cstimated value (below laboratory quantitatlon limit).
000580 ElDl68145
MAH000517
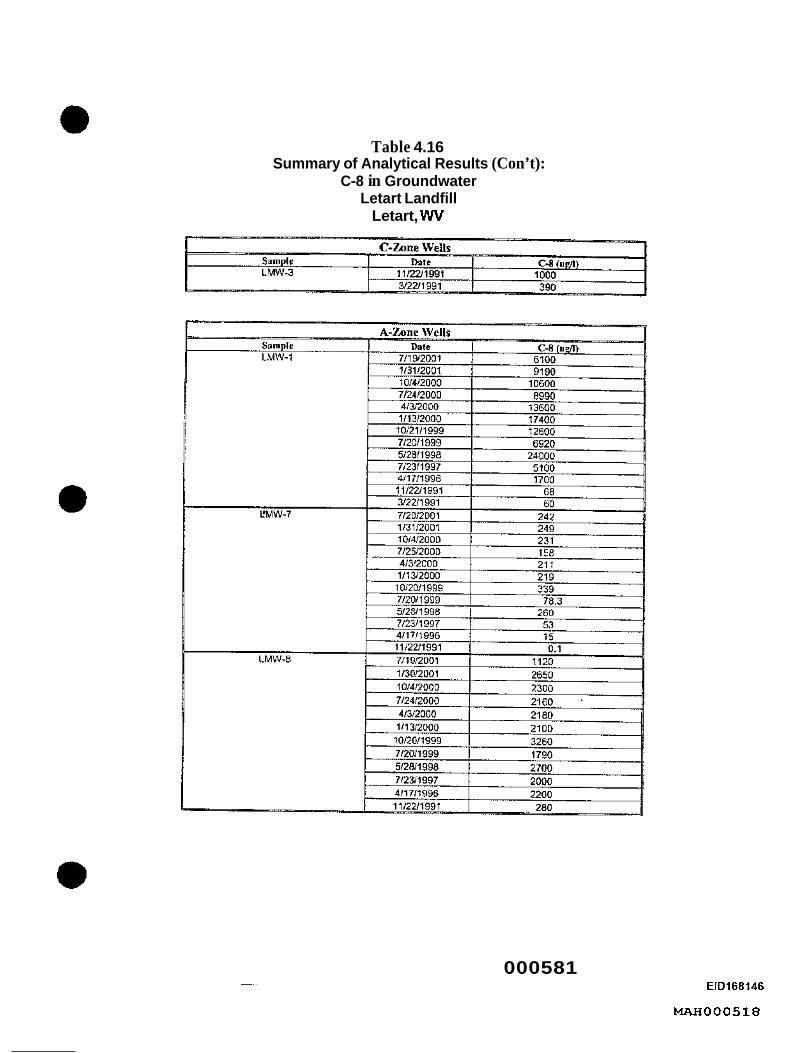
Table 4.16 Summary of Analytical Results (Con’t):
C-8 in Groundwater Letart Landfill
Letart, W
000581 EIDl68146
MAH000518
FIGURES
I
000582

1
n S C A L E -
2000 0 2000'
I I
SITE LOCATION MAP
Corporate Remediation Group " I An AUxtnce betweem W o n 1 -d The I l -C DtamDnd Croup I Letort Landfill Site
Letart. WV
EID168148
MAH000520

. . 1 ' .
1-MILE LANDFILL RADIUS MI
Letart Landfill Site Letart. West Virginia
a@iJB S C A L E Corporate Remediation Group
An Alliance between D u P o r i l and URS Diumond
Barley 111111 PIcza. Buddmg 27 Wilminqloi Delurore 19805
m "Y ro n*:*o D r y I I l
0.CC.LO y)nTLw rriA
y.u
n.m
1 *r Mc-n DEL 7'2WOI
I Y/I */a3 rci 4 1
1600 0 1600' .OIIRCL; yrp TAW t ~ c y mc VSGS wn~m w ZF¶R QUO(W(QL
EID168149
MAH000521

000585 EID168150
MAH000522

000586
EID168151
MAH000523

1-
8
I EID168152
W O O 0 5 2 4

095
OBC
009
029
olr9
099
009
OOL
OZL
O*L
0%
08L
J.3 002 001 0
A 3NOZ
3/a ~ N O Z
3 3NOZ
I - I
.......... .. .... :la*.. . ..:-.-::.2:.*7 . . - ........ . . . . . . . . . . -
* . z . x
..- P-MNl
E-MWl YE-MWl
lSV'3 '9
V 3NOZ
lS3M a
-09s
-08s
-009
-029
-0P9
-099 2 s -ow Q
3 0 z
vf I- - -0OL
-0ZL
-0PL
-09L
-oaL
I

000589
EIDl68154
MAH000526
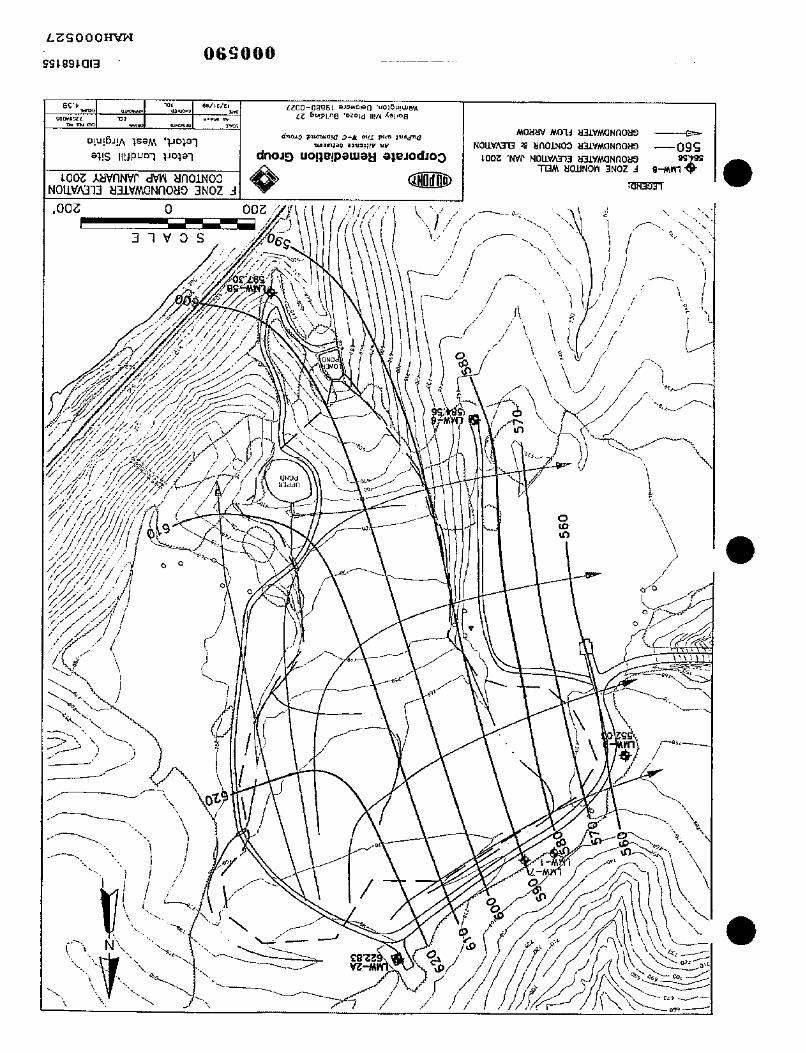
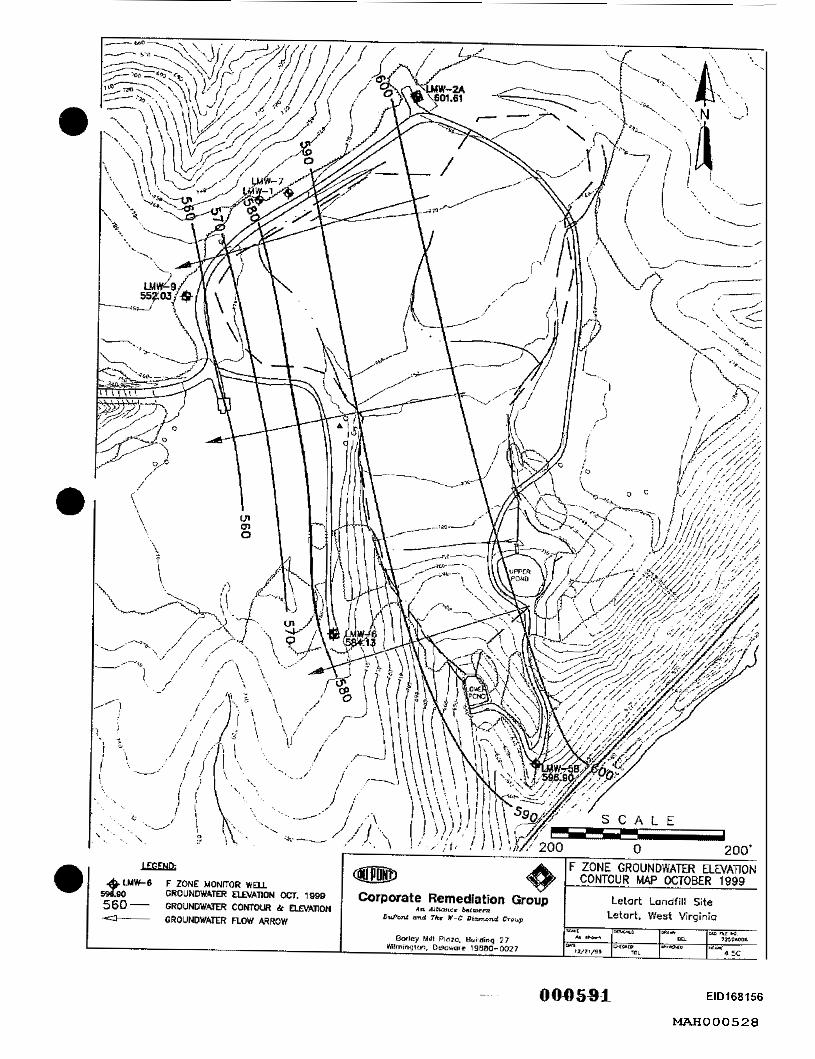
EIDl68156
MAH000528
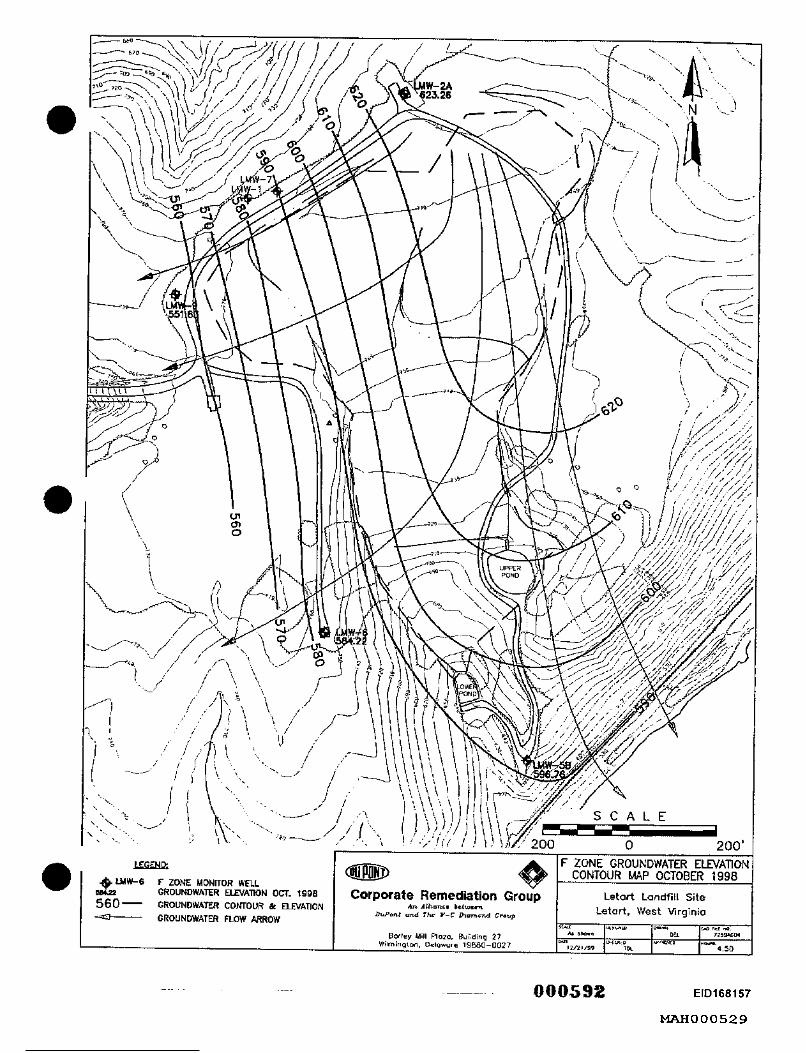
EID168157
W O O 0 5 2 9

LEmQ 0 s - . W - 8 F ZONE MONKOR W E U GROUNDWATER w A m N OEC. 1994
GROUNDWATER FLOW ARROW d 560- GROUNDWATER CONTOUR k ELEVATION
EIDl68158
MAH000530 - 000593 -
F ZONE GROUNDWATER ELEVATION @PiiJD e . CONTOUR MAP DECEMBER 1994
Corporate Remediation Group Letart Landfill Site Letort, West Virginio A n All-e b e b o r n
D u P a l and Tkhr W-C Diamond Croup w Diy."m -.- -Jo N "l
DLZ UL-r. -- -.c AI Dh7-n OLL 7 2 5 9 m 7
Barley Mtb Plazo. Llddmq 27 Wilrnmgton. Odaware 19880-0027 I2/2 I / ¶ 9 lR 4 5E
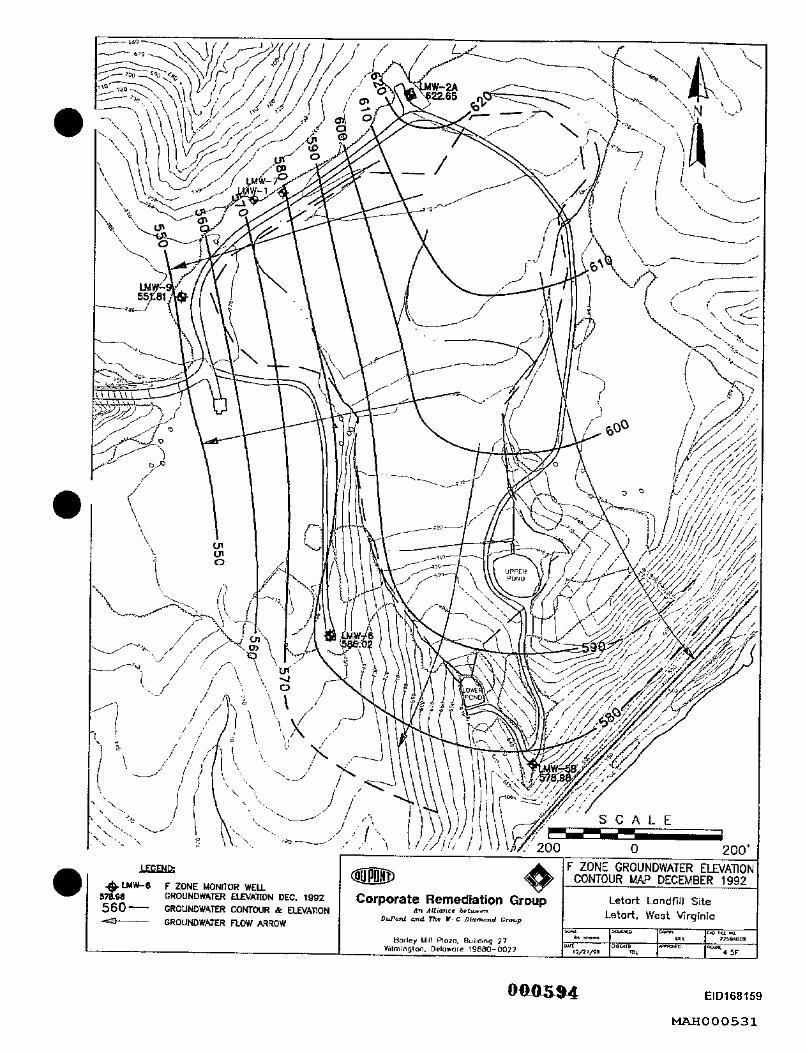
OQ=% EIDl68159
MAH000531

000595
EIDl68 160
MAH000532
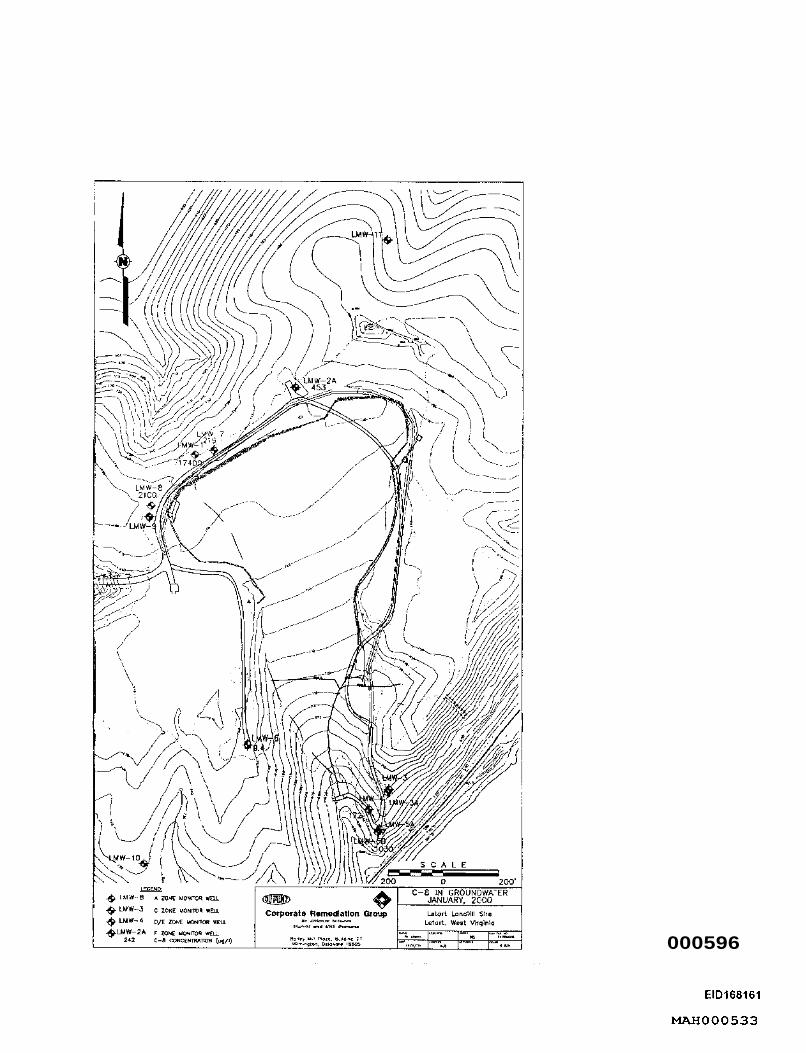
000596
EIDl68161
-000533

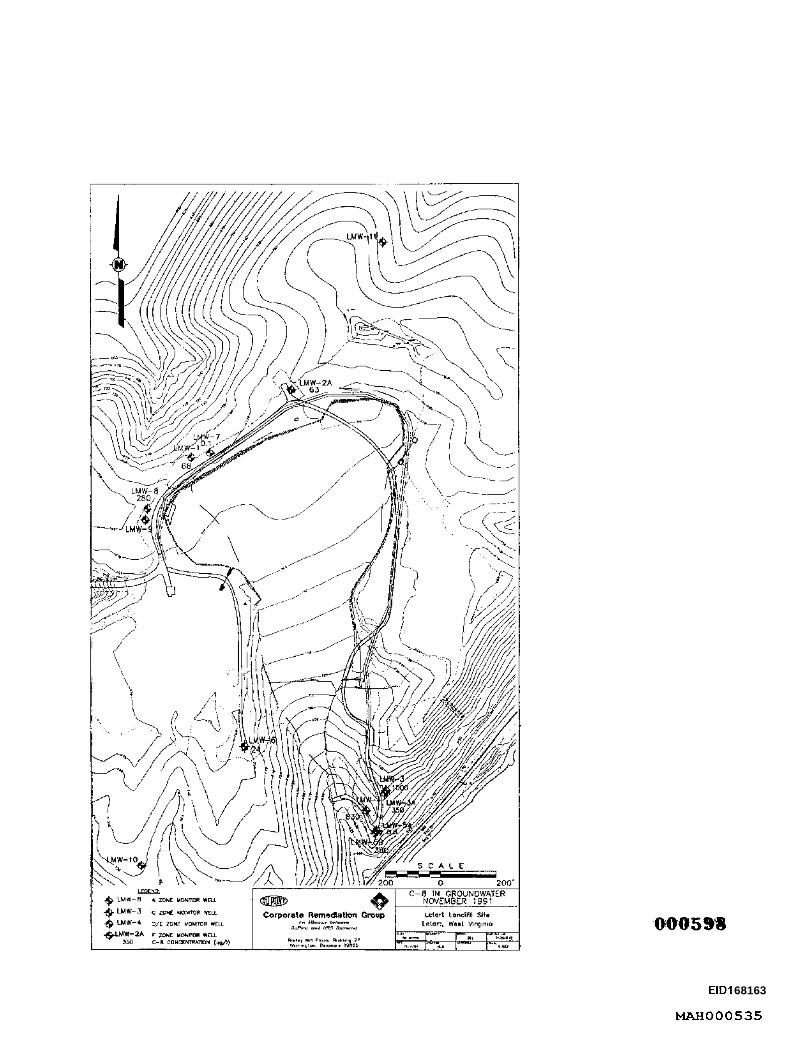
EIDI 68163
MAH000535

EIDl68164
MAH000536
Main Plant and Landfills w n Landfill
5.0 DRY RUN LANDFILL e .___ ........................................................................ .... 5-2
____.____..._I ____. . .5-2
1..1... . ................----....--.. I ......-.- . .-.-..-.-....-.-... _I..__ ,-..__.... 5-4
.---.~--..-...̂ ..-._... .. _..- .......___.... 5-5
Data Gaps .................................................................-.....................-._.--....-......_..-..._.............-.--....--...---.... 5.6
References ........................................................-.--.........-......-..---..---..........-.......--..............-........-.-.--...---.....
..._ - .. ..........--.... - . -...--_..... .......
Site Conceptual Model ....................................._..-....-..........--.....-..---_-..
5-6
Table 5.0
Table5.lA
Table 5.1B
Figure 5.0
Figure 5.1
Figure 5.2
Figure 5.3
Figure 5.4A
Figure 5.4B
Figure 5%
Figure 5.5B
Figure 5.5C
Figure 5.5D
Figure 5 5E
Figure 5.6h
Figure 5.hB
Figure 5.6C
Figure 5.6D
Figure 5.6E
Figure 5.6F
Tables Dry Run Landfill Monitoring Wells Construction Data
Dry Run Landfill Anslytical DataTables - Surface Water
Dry Run Landfill Analytical DataTables -Groundwater
Figures
Dry Run Landfill Location Map
Dry Run Landfill 1-rnilc Radius Map
Dry Run Landfill Monitoring Well and Surfacc Wata Sample Location Map
Dry Run Landfill Cross Scction Location Map
Dry Run Landfill Cross Scdion A-A'
Dry Run Landfill Cross Section 8-8'
Dry Run Landfill Groundwater Elevation Map - Ocfobcr 2001
Dry Run Lrtndiill Groundwater Elevation Map - October 1W
Lky Run bndfill Groundwater Elevation Map - October 1998
Dry Run Landfill tiroundwater Elevation Map - October 1993
Dry Run Landfill Groundwater Elevation Map -April lYY2
Dry Run C-8 Concentration Map Bedrock Wells -July 2000
Dry Run C-8 Concentration Map Bedrock Wells - July 1999
Dry Run C-R Concentration Map Bedrock Wells - July 1997
Dry Run C-8 Concentration Map Overburden Wells - July 2000
Dry Run C-8 Concentration Map Owrhurden Wells - July 1999
Dry Run C-8 Coiicrntntion Map Owrburdcn Wclls - May 1998
Compilation of history data Draft 2.doc Jan. 11.02 Wilmington. DE
5-1
OOOGOO EID168165
MAH000537
Main Plant and Landfills Dry Run Landfill
5.1
5.2
5.2.1
Introduction The Dry Run Landfill is located west of the town of Lubeck, in Wood County, West Virginia (Figure 5.0) and is about eight miles southwest of the Washington Works main plant and the Local Landfill. A water use and well survey search is being complcted for the area within a 1 -mile radius From the Dry Run Landfill perimeter (Figure 5.1).
The Dry Run Landfill covers approximately 17-acres of a 535-acre parcel of land owned by DuPont. The landfill began operation in 1986 and is still active at present. The landfill is operated under West Virginia Solid Waste /National Pollutant Discharge Elimination System Permit No.WV 0076244. This permit requires quarterly groundwater monitoring and monthly outfall surface water monitoring.
Figure 5.2 shows the location of the landfill, monitoring wells and surface water sampling points. The landfill was constructed within the drainage basin of Dry Run, a tributary of the North Fork of Lee Creek, which is a tributary of the Ohio River. The Dry Run Landfill has no compacted or synthetic bottom liners. However, natural soil present under the landfill material is composed of clay and weathered shale.
The Dry Run Landfill receives waste from the main plant consisting of non-hazardous waste including scrap product, scrap metal, wood pallets, fly ash and bins, and miscellaneous trash. Approximately 50,000,000 pounds of wastc pcr year have been disposed in the landfill. Currently, the C-8 source is believed to be the sludges from the closure of thc main plant anaerobic digestion ponds that were landfilled at Dry Run in 1988. The Dry Run Landfill remaining capacity calculations for 2001 show 4.4 years of remaining life on the existing cell based on a 128,000 yd3/yr net fill volume consumption (DuPont 2000).
Environmental Setting
Geology
The Dry Run Landfill is situated on a heavily dissected plateau consisting of several steep V-shaped valleys. Residual soil covers most landfill areas. In general, the soil at the site has been described as residual in nature, consisting primarily of heavy clays derived from the weathering of shale.
A geotechnical investigation for the Dry Run Landfill was completed by DuPont ( 1 996). The investigation consisted of advancing soil test borings, test pits, laboratory testing of soil physical properties, stability analyses, and settlement analyses. DuPont (1 996) determined that the natural residual soil underlying the landfilled materials consisted of stiff to very hard silty clay and clayey silt with occasional rock fragments and a trace of sand. The thickness of this natural soil ranged from 12 to 28 feet in the test borings within thc landfilled area. A 1989 monitoring well installation program, prepared by Tetra Tech Richardson Inc., indicated similar silty clay and weathered shale overburden. Four
Compilation of history data Draft 2 . d ~ Jan. 11. 02 5 -2 Wilmington, DE
ElDl68166
MAH000538
Main Plant and Landfills DN Run Landfill
overburden wells @RMW I2A, 12B, 13A, 6A) were installed to depths ranging from 1 1 to 17 feet. The underlying bedrock at the Dry Run Landfill consists of inter-bedded red and varicolored sandy or calcareous shale, and gray, green, and brown sandstone of the Permian age Dunkard Group (Tetra Tech Richardson, 1989). The maximum thickness of the Dunkard Group in this region is 570 feet. The location of two cross-sections, A-A' and B-B', crossing the landfill and downgradient of the landfill are shown in Figure 5.3. The two cross-sections are shown in Figures 5.4A and 5.4B. There are only a limited numbcr of deep monitoring wells around and upgradient from the landfill (DRMW- 14). Dashed geologic contact lines were drawn on cross-section A- A' (Figure 5.4A) because there is not sufficient data to confidently extrapolate between DRMW-14, the upgradient well, and DRMW-13, the downgradient well. More geological data is available (DRMW-6; -1 I , - 12, and -13) and was used in developing the downgradient cross-section, B-B' (Figure 5.4B) with more confidence. Cross-section B- B' supports the interpretations made in cross-section A-A' of rather flat lying stratigraphic units of sandstone layers separated by shale layers.
5.2.2 Hydrology, Hydrogeology and Groundwater Flow
Hydrology The Dry Run Landfill is situated on a heavily dissected plateau consisting of several steep V-shapcd valleys. Dry Run drains the valley in which the landfill is located. Many sinall tributaries discharge from the nearby valleys into Dry Run before it joins up with the North Fork of Lee Creek.
Potesta & Associates, Inc. (19S9) completed a hydrologic and hydraulic analysis of the receiving stream below the Dry Run Landfill. They dctcrmined that thc watershed soils are split between hydrologic soil groups (HSG) C and D and estimated the flow capacity at 481 cubic fcct pcr sccond (that is greater than the 100-year 24-hour storm). Potesta (1989) also evaluated the 24-hour precipitation amount that would result in full flow conditions at the location where the capacity was estimated. Potesta determined that precipitation values between 5.25-5.99 inches in 24 hours would result in full flow.
The installation of a leachate collcction systcm at the Dry Run Landfill encompassing the inactive lower half of the landfill was completed by Potesta & Associates Inc. in 1999. Lcachate from the landfill discharges into a leachate collection sump located northwest of the landfill (Figure 5.2) through perforated pipes buried at the low edge of the f i l l area. The leachate is pumped fiom the collection sump to a 50,000-gallon collection tank located at the top of the hill. Leachate is pumped fiom the coIlcction tank to a tanker truck, which is then hauled to the main plant for treatment in the site's wastewater treatment plant.
Hydrogeology Groundwater is found in the overburden and the underlying bedrock aquifer. The bedrock aquifer is considered the underlying significant aquifcr for "DES permit required groundwater monitoring. A total of 15 monitoring wells have been installed at Dry Run to monitor the overburdcn and bedrock aquifers. At this time, four overburden
Compilation of history data Draft 2.doc Jan. 11, 02 Wilmington. DE
5-3
EID 1681 67
MAH000539
Main Plant and Landfills Dry Run Landfill
5.3
5.3.1
5.3.2
wells @RMW-6A, -12A, -12B, and 13A), and four bedrock wells (DRh4W-12, -13, -14, and -1 5) stili exist. The other seven wells were abandoned in 1999 by Potesta & Associates, Inc. as required by the permit because they were not being utilized for quarterly monitoring (Potesta, 1999). Table 5.0 provides the well construction data for existing monitoring wells.
Groundwater Flow Watcr levels measured in November 2001 indicated overburden groundwater was encountered between 4 and 6 feet below ground surface. Although 3 of the 4 wells completed in the overburden monitor the same hydrogeologic unit, well DRMW-6A is completed at a relatively higher zone, which is discontinuous at lower topographic areas. No groundwater flow maps were prepared for the shallow water encountered in the overb-wden section.- -
Annual groundwater elevation maps for the underlying significant aquifer were available for the years 1992- 1994, and 1998-2001. These maps are presented in Figures 5.5A through 5.5G. The groundwater contours were transferred from the original maps submitted for the permit to the updated Dry Run Landfill base map. These maps show that groundwater in the bedrock aquifer flows from the southeast towards the northwest. The groundwater elevations measured for nested wells (DRMW-I 2, -12A, and 12B, and DRMW-13 and -13A) are similar and the screened zones are constructed relatively close to each other, indicating that the overburden and bedrock aquifers may be in hydraulic communication downgradient of the landfill.
Water Quality
Surface Water Quality
Historical surface watcr C-8 concentrations arc prcscnted in Table 5.1 A for six sampling points. Sampling location for surface water sampling points still in existence can be found on Figurc 5.2. Surfacc water samples have been collected periodically fiom these locations since 1996 and have been collected consistently for three locations (DKLeachate, Outlet 001 and at the property boundary) since 1998. The concentration of C-8 in the leachate samples have been decreasing over time (fiom 62 ug/l down to 27.4 ug/l) while concentration from the other locations are variable and do not indicate a clear trend (Table 5.1 A).
Groundwater Quality
Historical groundwater sampling began in 1996. For wells that currently exist, sampling continues (DRMW-6 was abandoned in 1999; Potesta, 1999). C-8 concentration were contoured for some of the sampling events for the overburden and bedrock wells. These concentration contours can be found in Figures 5.6A through 5.6 F. Data shown in Figure 5.6E was plotted but not contoured due to the data spread. The data for DRMW 12-B and DRMW 13-A for July 1999 appeai.s anomalous compared to the other data for these two wells. The contour maps show that the highest concentration of C-8 exists in monitoring wells 13 and 13A, bedrock and overburden wells, respectively.
Cornprlalion of history data Draft 2.doc Jan. 11. 02 5-4 Wilrnington. DE
000603 . ElDl68168
MAH000540 -

Main Plant and Landfills Dry Run Landfill
5.4
These two wells are located downgradient from the central axis of the landfill. For the majority of the sampling events for most of the other wells, both overburden and bedrock, the C-8 concentration has been less than 1 ug/l. The C-8 concentration for the 1999 sampling event in D W - 1 4 was higher than other values measured for this well. Given that this well is an open bedrock well, and is relatively close to the landfill, this higher concentration may indicate communication of surface or shallow aquifer waters through the open well, pa~%cularly because groundwater flow in the underlying significant bedrock aquifer flows fkom DRMW-14 north west toward the landfill area as opposed to groundwater flowing from the landfill toward the DRMW-14 well.
Site Conceptual Model
The Dry Run site conceptual model describes the potential exposure routes for current and future ecological receptors. Potential exposure routes were evaluated and classified as complete or incomplete.
Access to the Dry Run Landfill by is controlled by electronic gates on the major roads and locked gates on smaller roads. In addition, because the landfill is active, there is a crew ofworkers on the landfill area during normal working hours. The daily activity discourages trespassers on the site. Therefore, direct contact with landfilled materials is a complete but minimal cxposure route, limited to the workers in active portions of the landfill. Direct contact with landfill materials in the inactive, lower half of the landfill is incomplete due to the leachate collection system’s geotexlile and geomernbrane cover. Contact with leachate at the landfill (or at thc main plant whcrc the leachate is treated) is considered a potentially complete but limited exposure route for the landfill and plant workcrs and samplers.
Currently, the inactive lower half of the landfill is covered by geotextiles and geomembranes of the leachate collection system. Thereforc, precipitation falling on this portion of the landfill does not come in contact with the landfilled materials. This precipitation flows downslope via ovcrland flow and discharges into storm water drainage ditches and eventually reaches Dry Run Creek. Therefore, this potential exposure route is considered incompletc.
Precipitation falling in the upper half of the landfill may also flow via overland flow down slope to the drainage ditches, again, an incomplete exposure route. Alternatively, this precipitation may infiltrate and come in contact with the landfilled materials as it migrates downgradient. However, this impacted water flowing within the landfill may be collected by the leachate collection system. If this impacted water migrates downward through the landfilled materials, it may evcntually come in contact with the underlying shales and sandstone of the bedrock and migrate downgradient within the bedrock aquifer. Contact with impacted groundwatcr is a potentially complete exposure route although currently, not enough hydrogeologic data exists to accurately evaluate this exposure pathway.
Plans are underway for the expansion of the leachate collection system and for a final capkover system. These activities in the fiture will further reduce precipitation infiltrating and contacting landfilled materials.
Compilation of history data Drafl 2.doc Jan. 11. 02 5-5 Wilmington, DE
000694 El D l 681 69
. __ . - __ - -. . - -. . . - . . . . . . . - -. . . . . . . . . . . . . . . . . . . . . . . . . . . . . . . . . . . . . . . . . . . . . . . . . . . . . . . . . . . . . . . . . . . .
MAH000541
Main Plant and Landfills Dry Run Landfill
Data Gaps
The following data gaps were identified for the Dry Run Landfill:
c3
0
. P
c3
L3
Identify the locations of seeps in the valley walls and determine water quality with respect to C-8 concentration.
Determine the C-8 concentration in streams and other surface water bodies.
Acquire additional geological data to more accurately dcvclop the Site Conceptual Model.
Install additional monitor wells to provide additional groundwater flow data and groundwater quality data.
Gather additional C-8 concentration data from monitoring wells for plume - delineation.
Activities to fill the data gaps will be proposed and discussed in the work plan,
References DuPont. 1996. Report of Geosechnical Investigation Dry Run Landfill, Washington
Works Main Plant, Parkershurg, WV. GeotechnicaI Group, Civil Engineering Systems, DuPont Engineering. April 23, 1996.
. 2000. 2000 Dry Run Landfill Opcrational Rcport. Submitted January 26,2001.
Potcsta & Associates, Inc. 1989. Hydrologic and Hydraulic Annlysis of Dry Run. Area No. 1. October 9, 1989. Letter from D. Mark Kiser to Dan Weber.
. 1999. Mouitoring JVclIs A4W-I, MJV-IA, MW-4, MW-#A, MU7-6. MW-I 0. MW- 10 Abandoiirnent Report, Dry Run Landfill, DuPont Washington Works. March ! 999.
Tetra Tcch Richardson. 1989. Monitoring Well Installation Program, October 1989.
Compilation of hislory data Draft 2.doc Jan. 11.02 Wilmington. DE
5-6
ElDl68l70
MAH000542
_ _ - 000605
TABLES
I
000606

Table 5.0 Monitoring Well Construction Data
Dry Run Landfill Lubeck, W
Surface Elevation
Monitoring Wells (feet) DRMW-(14 936.14 DRMW-I13 720.6
Total Well Slot Screen Elevation of Depth Diameter Size Length Screen Interval (feet) (inches) (inches) (feet) (feet) 260 IO NA NA NA 35 4 0.010 15 700.6-685.6
DRMW- DRMW- DRMW- DRMW- DRMW- DRMW-
I
13A 720.3 11 4 0.010 5 71 4.3-709.3 12 730.5 35 4 0.010 15 710.5-695.5 12A 730.3 17 4 0.010 5 7 1 8.3-7 1 3.3 128 730.5 15 4 0.010 10 725.5-71 5.5 6A 744.93 12.2 2 15 730.87 45 2 0.010 20 705.87-685.87

Table 5.1A Summary of Analytical Results: C-8 in Surface Water Samples
Dry Run Landfill Lubeck; WV
000608
EIDl68 173
MAH000545
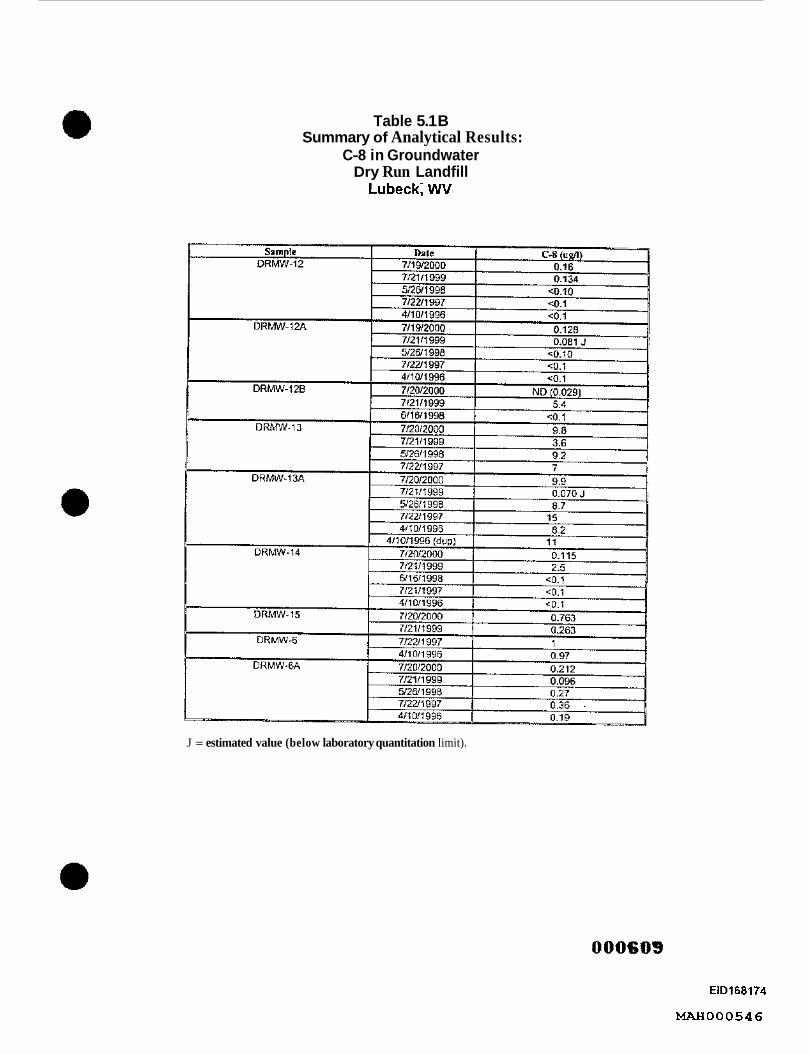
Table 5.1 B Summary of Analytical Results:
C-8 in Groundwater Dry Run Landfill
Lubeck; WV
J = estimated value (below laboratory quantitation limit).
000609
EID168174
W O O 0 5 4 6

0
FIGURES
I

8 3
000611
EIDl68176
MAH000548

I I
1-MILE RADIUS MAP
Lubeck, West Virginia
a@JD S C A L E
Corporate Remedlatlon Group An Al l iance b e I w e n
Dupont and URS D i a m o n d 1610 0 1610'
UL) I*L w. Y L W - sw
DIL cm- LI Ira." o n /1zuO10 - P.2-
Borley MDI Plaza. Building 27 Wilmirgton. Odowarc 19805 1 a / i 9/Qi IDL 5.1
HAP TAKEN FROM THE LUBECK, W USGS WANDRANGE
EID168177
MAH000549

a 280'
MONITORING WELL AND SURFACE
Corporate Remedlatlon Group Dry Run Londfill Lubeck, West Virginia
DRWH '0 OEL
cnfc"m
'DL A n A l l i a n c e b e h e e n DuF'mtf and URS hu-d \IWOVCDIOFSK?4)
000613 EID168178
MAH000550
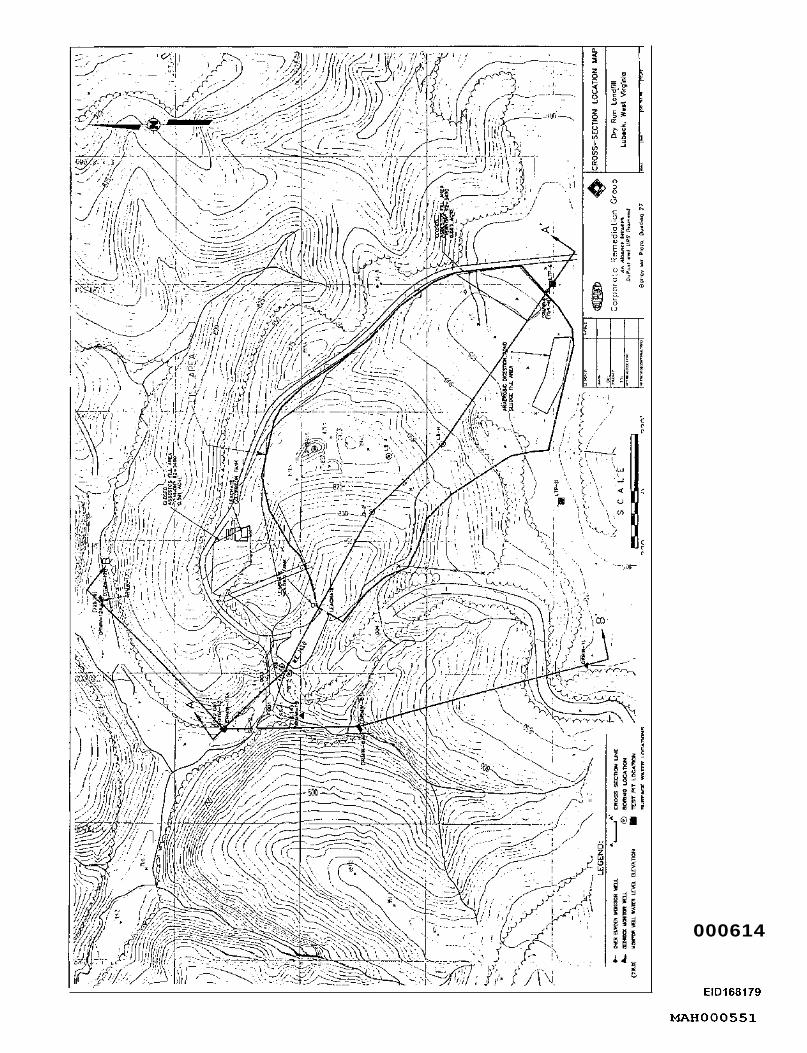
000614
EIDl68179
MAH000551

ORTIWEST A +I I SOUTHEAST
9 5 7
LEGEND:
FILL MATERIAL
SILTY CLAY
SHALE/WEATHERED SHALE [m SILT
SANDSTONE
e SILTSTONE
I MONITORING INTERVAL
GROUNDWATER ELEVATION (Nov. 2001) c1 GROLJNDWATER FLOW DIRECTION
SECTION A-A'
2 .4X VERTICAL EXAGGERATION
HORIZONTAL SCALE
VERTICAL SCALE
*n "LL..".. *.lv.n D.son1 d ORs ha.nm.3
1914 Buiiding 77

E 0 0 0 VI Ln w
SOUTH NORTH
B B'
95(
9oC
8M
nw
750
703
650-
1440 1560 l&O lsbo le20 2040 2160
SECTION B- B'
SILTY CLAY
SHALE/WEATHERED SHALE SILT
SANDSTONE 2 4X VERTICAL EXAG_GEKATION SILTSTONE HOSIZONTAL SCAILE
MONITORING INTERVAL - GROUNDWATER FLOW DIRECTION - 160 0 160 320 fl
VFRTlCAl SCALE GROUNDWATER ELEVATION (Nov 2001)
66 0 66 122 Fr

N
f
000617
ElDl68182
MAH000554
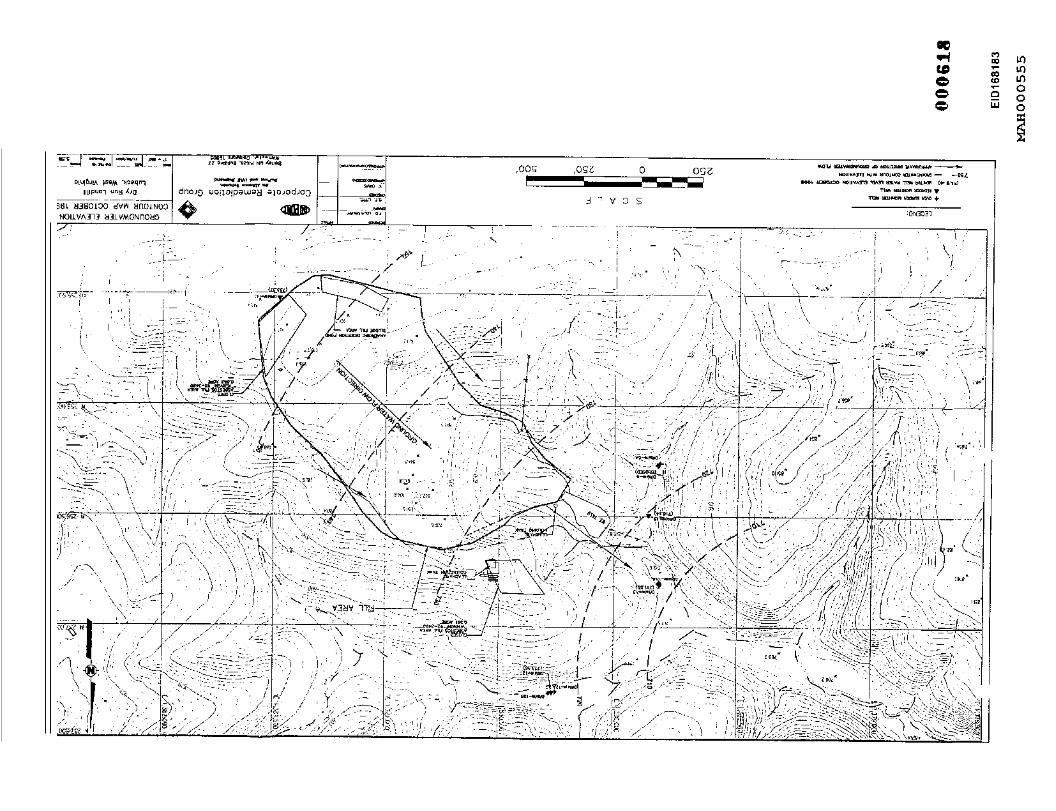
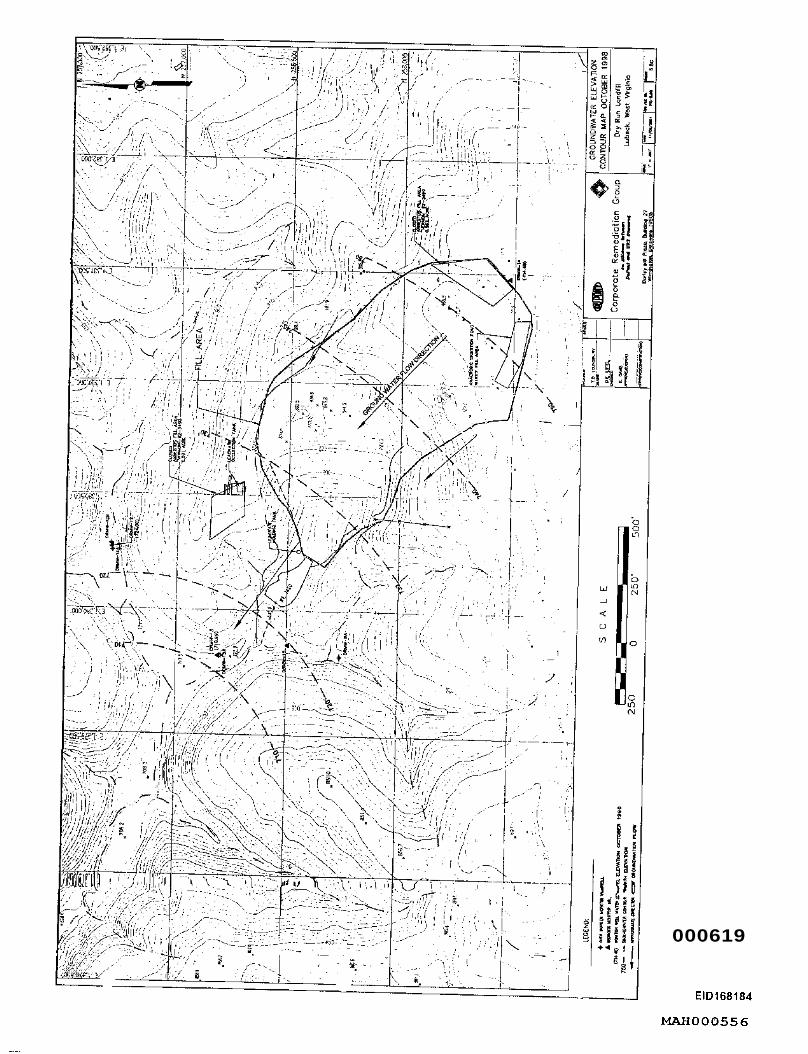
000619
ElDl68184
MAH000556

0 e4 W 0 0 0
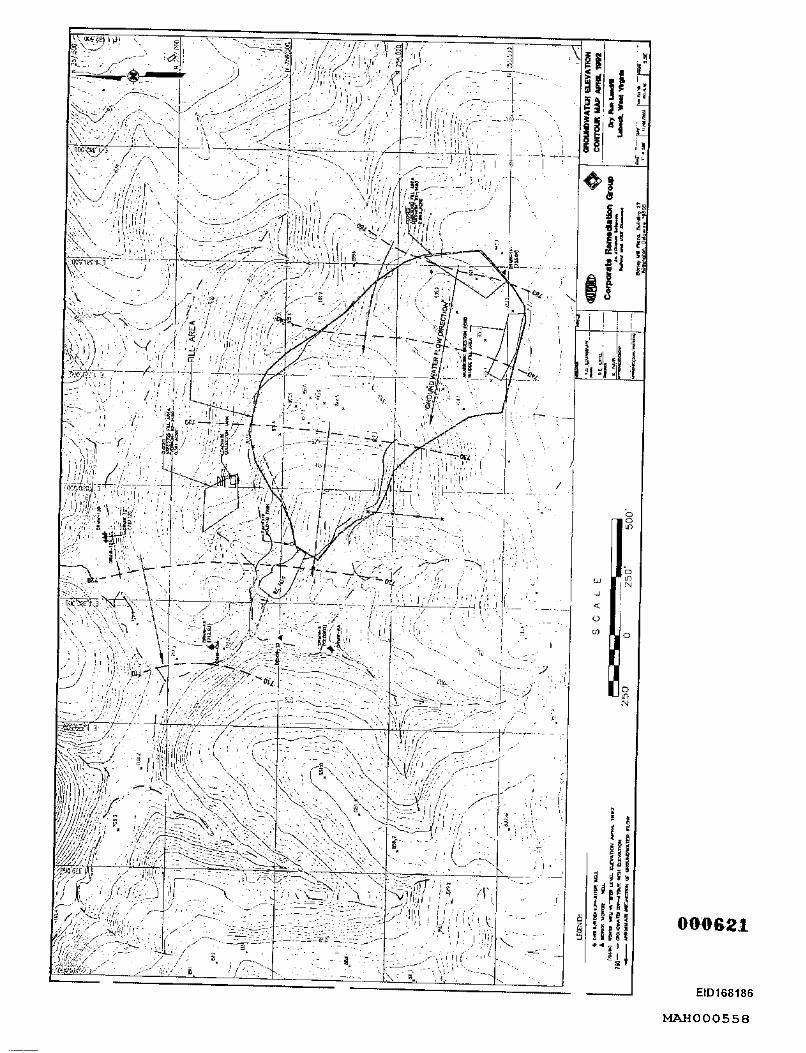
ElDi68186
MAH000558

005'1Sc'L 3
WS'BLC'L 3
4 2 (3
0
0 0 0 hl
EIDl68187
MAH000559
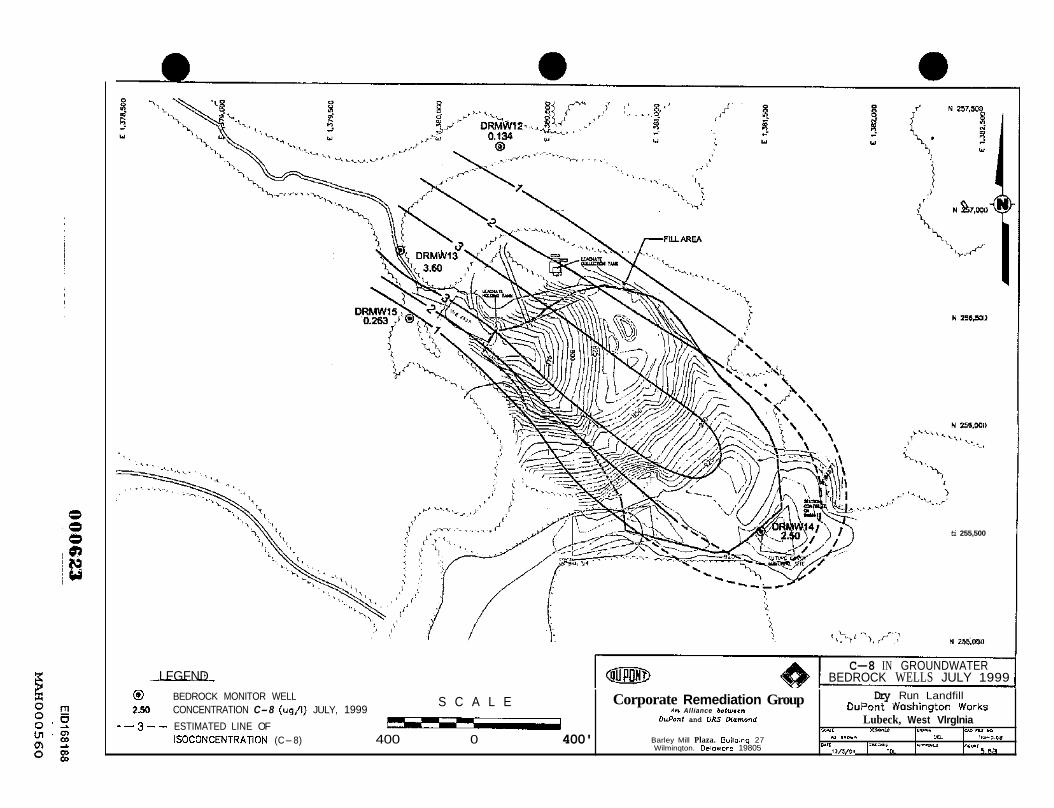
I
S C A L E @ BEDROCK MONITOR WELL 2- CONCENTRATION C-8 (Ug/l) JULY, 1999
- - 3 - - ESTIMATED LINE OF - ISOCONCENTRATION (C-8) 400 0 400'
ti 255,500
Dry Run Landfill
Lubeck, West Vlrglnia
3Z/J/OI roL 5.68
Corporate Remediation Group Washington Works A n Alliance between
DvPonl and URS Dinmond Y C r C 0CyL.LD 0-1" C I D R I . 0
P R C * C U c D .rs.c..va "SU, &l ,nom VEL rlG-5.68 Barley Mill Plaza. Building 27
Wilminqton. Deionorc 19805
LFGFND
..
C-8 IN GROUNDWATER BEDROCK WELLS JULY 1999
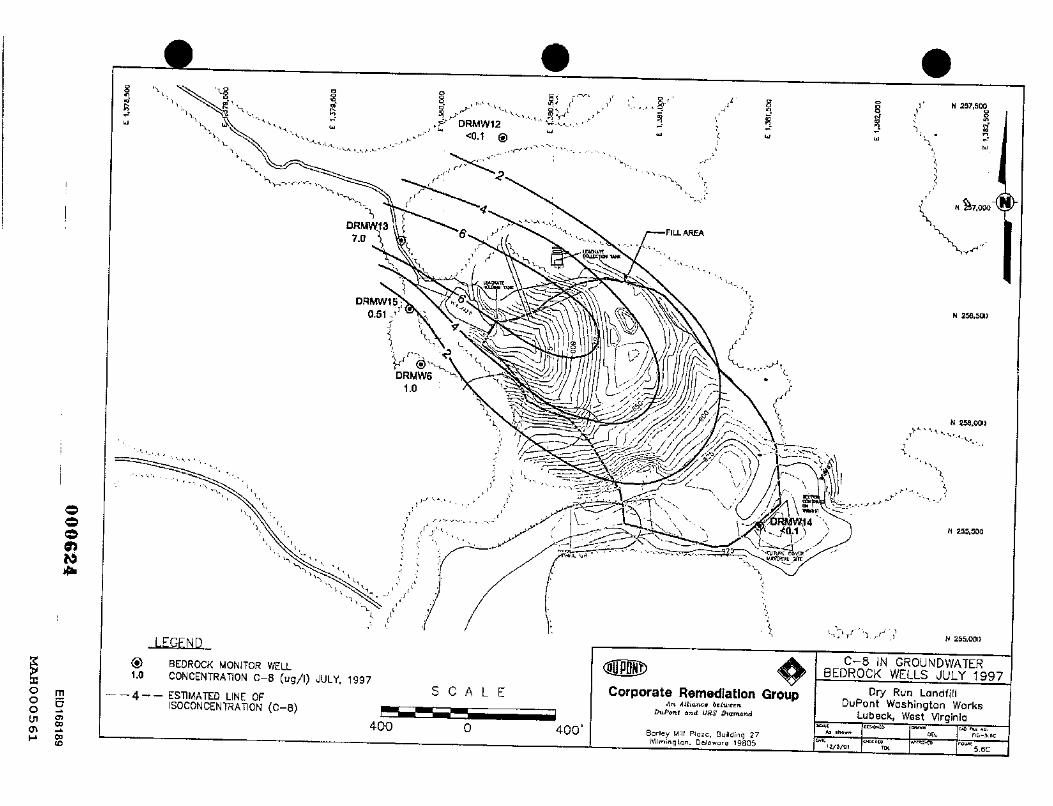
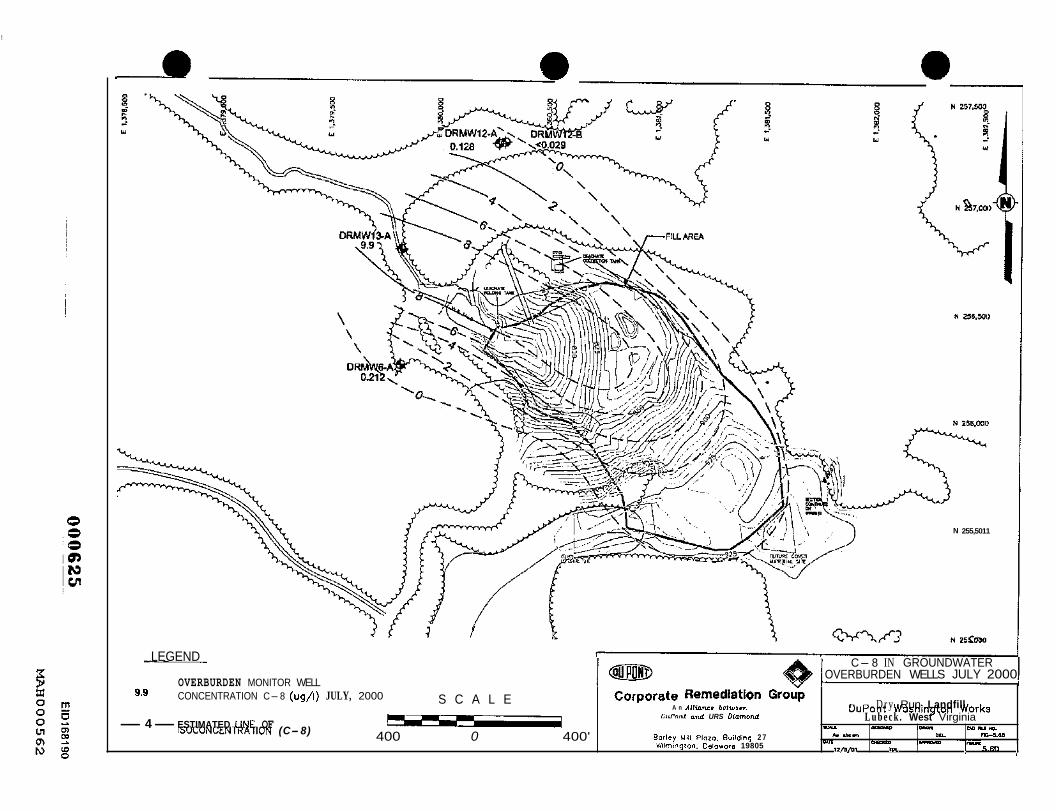
a 0
S C A L E 9.9 CONCENTRATION C-8 (ug/l) JULY, 2000
-4- ESTIMATED LINE OF - 400 0 400' ISOCONCENTRATION (C-8)
/ LEGEND
OVERBURDEN MONITOR WELL " Remediation Group DuPont D r y Washington Run Landfill Works
L u b e c k . West Virginia A n A l lmnce bottuaan
OuPanl nnd URS Diamond
w ? u m - D D I
D B W - I U R
UL
mm #A .horn on m-S.C-2 Eorlcy Mill Plaza, Bvddlng 2 7
Vhirnmglon. Oelowore 19805
N
12n/01 mi 1 5.6D 1
255,5011
C-8 IN GROUNDWATER OVERBURDEN WELLS JULY 2000

LEGEND
OMRBURDEN MONITOR WELL CONCENTRATION C-8 (ug/l) JULY, 1999 5.4
S C A L E - 400 0 400'
OWmt and llRS DiDmond
C--8 IN GROUNDWATER OVERBURDEN WELLS, JULY, 1999
Lubeck. West Wrglnla K A T iD'%G"Ln 1M.w I_ r u .a
Dry Run Landfill I DuPont Washington Works Corporate Remediation Group
An All iDneP b e t w o n
Boric:, Mill Plozo. Building 27 Wilrnmgton, Celawore 19805
~~ - . *r lh0.n OEL fIG-S.Er
UyI '*LCK'O W m M O K W 1 I / S / C I TO L 5.6C
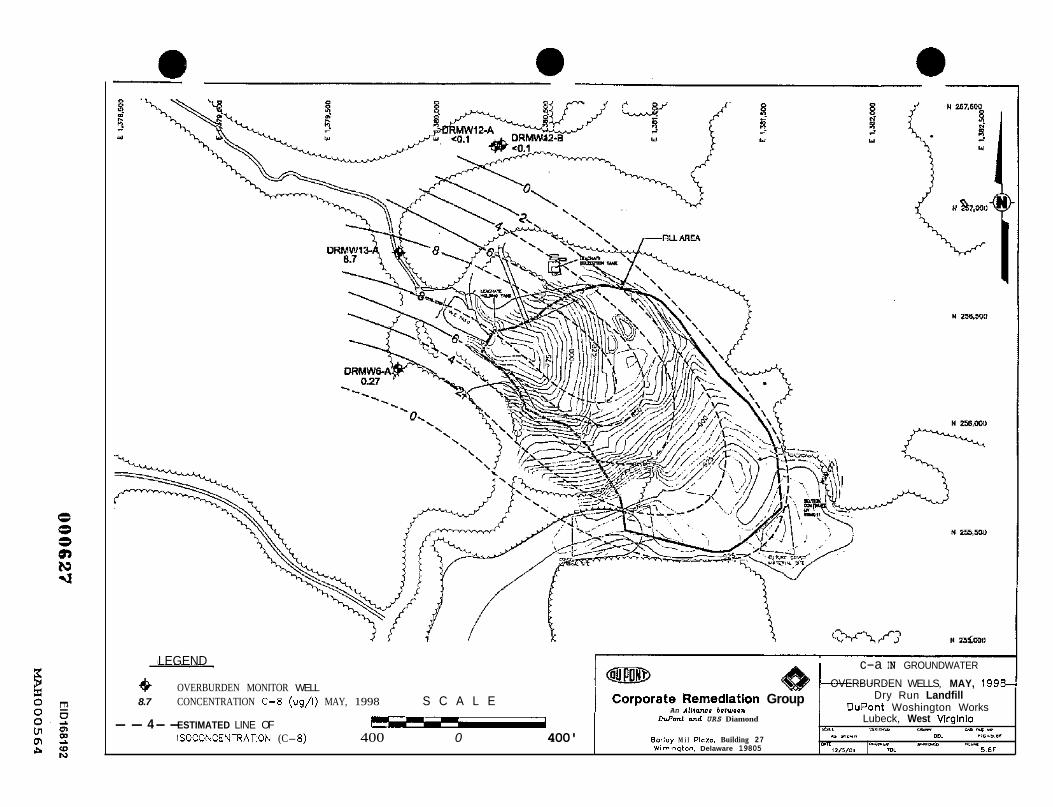
LEGEND
DuPanl ond URS Diamond -- 4-- ESTIMATED LINE OF I Barley M i l PIczo, Building 2 7 Wtlmington. Delaware 19805
ISOCONCENTRATION (C- 8) 400 0 400'
OVERBURDEN MONITOR WELL 8.7 CONCENTRATION C-6 (ug/l) MAY, 1998 S C A L E
Lubeck, West Virglnlo a, CIllOao CRAW m N I w
DR Cnram l* laM nc"- b4 *O." DLL flG-5.ar
f2/5/01 m1 5.6F
c-a IN GROUNDWATER 6 I OVERBURDEN WELLS, MAY, 1998 I Corporate Remediation Group Dry Run Landfill " 1 DuPont Woshington Works An Alliancr batween

000628 EIDl68193
MAH000565

APPENDIX I
CONSENT ORDER (ORDER NO. GWR-2001-019)
000623

CONSENT ORDER ISSUED PURSUANT TO ARTICLES 5 and 12, CHAPTER 22 AND ARTICLE 1, CHAPTER 16
OF THE WEST VIRGINIA CODE.
TO: E. I. DU PONT DE NEMOURS AND COMPANY DATE: November 14,2001
West Virginia Department of Environmental Protection West Virginia Departmcnt of Health and Human Resources
Order No. GWR-2001-019
This CONSENT ORDER is issued by the Director of the Division of Water Resources and Director of the Division of Air Quality, West Virginia Department of Environmental Protection, and the Commissioner of the Bureau for Public Health, West Virginia Department of Health and Human Rcsources, pursuant to the authority set forth in more detail below.
1. INTRODUCTION OF PARTIES.
This Consent Order is entered into by and between the West Virginia Department of Environmcntal Protection [ WVDEP], the West Virginia Department of Health and Human Resources - Bureau for Public Health [WVDHHR-BPH], and E. I. du Pont de Nemours and Company [DuPont][collectively referred to as the “Parties”].
@
11. PURPOSE OF CONSENT ORDER.
This Consent Order sets forth a series of tasks to be performed by the Parties in order to detennine whrther there has been any impact on human health and the environment as a result of rclcascs of ammonium perfluorooctanoate [C8], CAS Number 3825-26-1, to the environment from DuPont operations. C8 is a material used by DuPont in its fluoroproducts manufacturing process at its Washington Works facility located at Washington, Wood County, West Virginia. C8 is not identified as a hazardous substance, hazardous waste or otherwise specifically regulated under West Virginia or federal statute or regulation.
This Consent Order has been negotiated in good faith and the actions undertaken by DuPont pursuant to this Consent Order do not constitute an admission of any liability on its part. DuPont retains the right to controvert in any other proceedings, other than proceedings to
implement or enforce this Consent Order, the validity of the findings of fact and conclusions of law set forth herein. DuPont agrees to coniply with and be bound by the terms of this Consent Order and further agrees in any procecding to implcmcnt or enforce this Consent Order that it
1
00063’18. EIDl68195
MAH000567
0 will not contest the validity of this Consent Order or the jurisdiction of WVDEP and WVDHHR- BPH to issue it.
111. DEFINITIONS.
Whenever the terms identified below are used in the Consent Order or in any exhibit or attachment hereto, the following definitions shall apply:
1. “The Agencies” shall mean the Department of Health and Human Resources, Bureau for Public Health and the Department of Environmental Protection, including the Divisions of Air Quality and Water Resources.
2. “C8” shall mean the chemical compound ammonium perfluorooctanoate.
3. “Detection Limit” means the lowest analytical lcvel that can be reliably achieved within specified limits of precision and accuracy under routine laboratory conditions for a spccified matrix. It is based on quantitation, precision and accuracy under normal operation of a laboratory and the practical need in a compliance-monitoring program to have a sufficient number of laboratories available to conduct the analyses.
4. “Effective Date” shall mean thc date sct forth in Section XVLI of this Consent Order.
5. “EPA” shall mean thc United States Environmental Protection Agency.
6. “Force Majeure” shall mean conditions or circumstances beyond the reasonable control of DuPont which could not have been overcome by due diligence and shall include, without limitation, acts of God, action or inaction of governmental agcncics, or administrative or judicial tribunals or other third parties, or strikes or labor disputes (provided, however, DuPont shall not be requircd to conccdc to any labor demands), which prevent or delay DuPont from complying with the work plan.
7. “Groundwatcr Monitoring Well” shall mean any cased excavation or opening into the ground made by digging, boring, drilling, driving, jetting, or other methods for the purpose of determining the physical, chemical, biological, or radiological properties of groundwater. The term “monitoring well” includes piczometcrs and observation wells, which are installed for purposes other than those listed above, but does not include wells whose primary purpose is to provide a supply of potable water.
8. “Groundwater Well” or “Well” shall mean any drilled or excavated groundwater collection system that supplies water for public, private, industrial, or agricultural use and shall include drinking water wells. As used in this Consent Order, this term applies only to wells
0 2
EIDl68196
MAH000568
0 located in West Virginia.
9. “Reimbursable Costs” shall mean costs attributable (on an hourly basis) to the work of Dee Ann Staats, PbD. in the negotiation and implementation of this Consent Order, the costs attributable to any other participants on the C8 Assessment of Toxicity Team, as described in Attachment C to this Consent Order, who are serving in that position as contractors to WVDEP, costs incurred by WVDEP in connection with the public meetings described in Attachment C, and costs attributable to any contractor retained at the direction of the Groundwater Investigation Steering Team (GIST).
10. “Washington Works” shall mean the manufacturing facility owned by DuPont and located in Washin@;“loii, W O G ~ County, West Virgiiia, as depicted on Exhibit 1 to this Consent Order.
1 1. “The Facilities” shall mcan thc Washington Works and the Local Landfill, depicted on Exhibit 1, the Letart Landfill, depicted on Exhibit 2, and the Dry Run Landfill, depicted on Exhibit 3.
12. “Reference Dose” or “RfD” shall mean an estimate (with unccrtainty spanning perhaps an order of magnitude or greater) of a daily exposure level for the human population, including sensitive subpopulations, that is likely to be without an appreciable risk of deleterious effects during a lifetime. Chronic RfDs are specifically developed to bc protcctivc for long-term exposure to a compound.
@ 13. “Screening LeveI” shall mean the concentration in a spccific media such as air,
water, or soil, that is likely to be without an appreciable risk of deleterious effects during a lifetime in the human population.
IV. WAIVER OF RIGHTS.
DuPont waives any and all rights i t may have to appeal or challenge the validity or requirements of this Consent Order, and shall not challenge the jurisdiction ofthe Agencies to issue this Consent Order.
This Consent Order applies to and is binding upon the Parties, and their successors and assigns.
V. FINDINGS OF FACT.
1. C8 is a chemical substance which has no establishcd statc or fcderal effluent or emission standards.
2. C8 is a perfluorinated surfactant manufactured by the 3M Company and others.
3
000632 EIDl68197
W O O 0 5 6 9
0 Since the early 1950’s CS has been used by DuPont in its fluoropolymer-related manufacturing processes at its Washington Works facility, located in Wood County, West Virginia.
3. Residues containing C8 from fluoropolymer manufacturing processcs at Washington Works are or have been released to the air, discharged to the Ohio River, disposed of at the Facilities, and otherwise shipped off-site for destruction and/or disposal. DuPont also captures for recycle a significant portion of used C8.
4. No permits issued to DuPont authorizing releases of pollutants to the environment contain specific limitations on the amount of C8 that may be released to the environment. Howcvcr, C8 releases are addressed more generally in WVDEP Division of Air Quality permits as particulate matter, PMlo (particulate matter with an aerodynamic diameter less than or equal to 10 microns), or as a volatile organic compound.
5 . Since as early as 1990, DuPont has performed regular, voluntary water sampling to detect the presence and level of C8 in and around certain of its Facilities in West Virginia and has rcported the results of this sampling to various government agencies. Currently, DuPont also samples and reports C8 concentrations in water as required by permits issued by LVVDEP and EPA.
6. As a result of DuPont’s sampling, C8 has been detected in varying concentrations in and around certain of its Facilities in West Virginia, including private drinking water wells and public water supplies. 0
7 . Analyses of water samples have reported levels of C8 in the Lubeck Public Service District (“LPSD”) drinking water supply.
8 . DuPont. by and through its use of C8 in the fluoropolymer manufacturing process, is the likely source of C8 presence in and around certain of its Facilities in West Virginia.
9. Along with environmcntal sampling for C8, DuPont has performed and participated in multiple studies examining the potential effects of C8 exposure on human health and the environment.
IO. Studies performed by DuPont and 3M have determined that C8 in sufficient doses. Le., considering both amount and duration of exposure, is toxic to animals through ingestion, inhalation and dermal contact. Studies have also found that C8 is persistent in humans and the environment.
1 1. Although DuPont has collected a large amount of data on the presence of C8 in the environment, the Agencies believe that additional information will assist them in delineating the extent and concentrations of C8 in the environment at or near the Facilities. Available data collected by DuPont indicates that C8 is present in the surface and groundwater at the Letart and
4 e
EIDl68198
MAH000570

0 Dry Run Landfills and at or near the Washington Works facility.
12. WVDEP and WVDHHR-BPH have determined that it is desirable to ascertain the source of drinking water for persons potentially exposed to C8 in groundwatcr or surface waters in the area of the Facilities.
13. EPA, WVDEP, and WVDHHR-BPH, in consultation and cooperation with one another, have requested, and DuPont has submitted, information and documents relating to the detection and presence of C8 in and around the Facilities and documents with respect to the human health studies being performed related to C8 cxposure.
14. Based upon information submitted by DuPont and reviewed to date by EPA, WVJIEP1 and WVDHHR-BPH, the Agencies believe that additiona1 data would assist in their evaluation of whether the ground and surface waters now containing C8 have a complete cxposurc pathway to humans and whether persons in and around the Facilities are at risk of adverse health effects fiom C8 exposure.
15. There have been no independent govenunental or non-industrial studies performed on the human health effects of C8 exposurc for the purpose of establishing an exposure standard for C8 applicable to the general public.
16. The Agencies have concluded that full site and hcalth asscssments are necessary @ to ascertain the extent and level of C8 concentrations in the environment and to assist them in determining whcther CS prcsents any possible danger to the public. DuPont has agreed to participate and assist in this effort.
17. The fluoropolymers industry has committed to EPA to reduce total actual C8 emissions for either the year 1999 or the year 2000 by 50 pcrccnt within three to five years of each company’s commitment date. DuPont committed to this goal in 2000.
18. DuPont installed, in March 2001, a filtcr and carbon treatment system at its Washington Works facility that is demonstrating removal efficiency of 90-95% of the C8 in its major C8-containing wastewater stream.
VI. AUTHORITY TO ISSUE CONSENT ORDER
1. The WVDEP is the state agency vested with the authority to protect thc environment in West Virginia.
2. Article 12, Chapter 22 of the West Virginia Code, the Groundwater Protection Act, grants to the WVDEP the authority to protect the State’s groundwater from any contaminant
000634
MAH000571

and, where contaminated groundwater is found, to institute a civil action or issue an order requiring that groundwater be remediated.
3. Article 5, Chapter 22 of the West Virginia Code, the Air Pollution ControI Act, grants to the WVDEP the authority to protect the State’s air &om pollutants and to institute a civil action or issue orders to enforce the statute.
4. The WVDHHR-BPH is the state agency vested with the authority to regulate and protect drinking water supplies in West Virginia.
5. Article 1, Chapter 16 of the West Virginia Code, grants to the WVDHHR-BPH the authority to protect the public drinking water supply of thc state and to perform all investigation necessary to assure its purity and safety, and further grants to the WVDHHR-BPH the authority to institute actions and issue orders to restore the purity of said water supply.
VII. REQUIREMENTS OF CONSENT ORDER.
The Agencies have concluded that it is of great importance to have sufficient data upon which to determine the scope and potential risk of the presence of C8 in the environment in and around the Facilities. Therefore, the Agencies requirc the following:
A. Establishment of Groundwater Investigation Steering Team.
1. A “Groundwater Investigation Steering Team” (GIST) shall be established with membcrs of the team consisting of WVDEP, WVDHHR-BPH, EPA Region m, and DuPont. The WVDEP representative will be the team leader. Thc objectivcs and specific tasks of the team are set forth in full in Attachment A of this Consent Order. However, the primary purpose of the GIST will be to oversee an expeditious, phased approach to fulfilling the majority of the requirements set forth in Sections A through C. Thc work pcrformed with oversight from the GIST shall be funded by DuPont in accordance with Section VILI of this Consent Order.
2. Upon conclusion of key milestoncs in thc tasks set forth in Attachment A, the GIST shall issue interim or final reports setting forth findings of fact and conclusions regarding background data, groundwater monitoring, and plume identification as described in Attachment A. Any groundwater monitoring plan developed pursuant to Attachment A shall survive the termination of this Consent Order and shall be incorporated as a minor permit modification for the Facilities. DuPont reserves the right to request modification of the plans upon renewal of the Facilities’ permits.
B. National Pollutant Discharge Elimination System Requirements.
6
00063s El0168200
MAH000572

1. Except as occasioned by no-flow conditions, DuPont shall perform monthly sampling for C8 at the Local Landfill at certain outfalls identified in West Virginia/National Pollutant Discharge Elimination System (“W NPDES”) Pcnnit No. 0076538 as Outfalls 101, 004 and 005.
2. Except as occasioned by no-flow conditions, DuPont shall perform monthly sampling for C8 at the Washington Works facility at certain outfalls identified in WV NPDES Permit No. WOO01279 as Outfalls 001,002,003,005,007, and 105.
3. Except as occasioned by no-flow conditions, DuPont shall pcrform monthly sampling for C8 at Dry Run Landfill at all outfalls identified in its WV “DES Permit No. WV0076244.
4. Except as occasioned by no-flow conditions, DuPont shall perform monthly sampling for C8 at Letart Landfill at all outfalls identified in its WV NPDES Pennit No. WV0076066.
5. With respcct to the requirements of paragraphs VII.B. 1 through VII.B.4, all sampling shall be performed pursuant to established EPA guidelines, wherc applicable, and results shall be delivered to the WVDEP within thirty days ofreceiving such results. DuPont shall record and rcport all attempts to sample under no-flow conditions.
6. Within 90 days of the Effective Date of this Consent Order, DuPont agrees to obtain a samplc fiom each surface or alluvial water intake for public water supplies along the Ohio River in the area extending ten river miles downstrcam of thc Washington Works facility and one river mile upstream of the Washington Works facility. If concentrations of C8 above the Dctection Limit are found in any sampled public water supply within the upstream or downstream segments initially sampled, thc scgmcnts within which intakes are to be sampled shall be extended to twenty river miles downstream or hvo river miles upstream, as appropriatc. If concentrations above the Detection Limit are found in any segment so extended, additional sampling will be performed on water intakes within thirty river miles downstream or three river miles upstream, as appropriate.
7 . The additional monitoring requircments contained in this subsection shall be incorporated into the Facilities’ West VirginidNational Pollutant Discharge Elimination System permits by minor modification. DuPont reserves the right to request a modification of these requirements upon renewal of the permits.
C. Toxicological and Human Health Assessmcnt.
1. DuPont agrees to fund the various tasks set ‘forth below as a part of this Consent Order by establishing an escrow account at a bank agrccd to by the Parties, or by some other
7
000636 . EIDl68201
MAH000573
means agreed to by the Parties. Disbursements fiom said escrow shall be authorized by the C8 Toxicity Team Leader and DuPont representative jointly as described below.
2. A C8 Assessment of Toxicity Team (“CAT Team”) shall be established with members of the team consisting of representatives of
WVDEP WVDHHR-BPH EPA Region Dl NICS ATSDR DuPont
3. The WVDEP representative shall be the Team Leader.
4. The individual team members, the tasks of the team, and the team objectives are set forth in full in Attachment C of this Consent Order.
5. Upon conclusion of all the tasks sct forth in Attachment C, the CAT Teani shall issue a final report setting forth findings of fact and conclusions as to what extent there may be health risks associated with CS 31 the Facilities.
D. Emission Modeling Assessment.
1. (“DAQ”) within 30 days of the Effective Date except where a different deadline is provided in this subscction:
The following information shall be submitted to the Division of Air Quality
a. A complete and accurate list of building dimension parameters for all structures located within the Washington Works facility that have a significant impact on the dispersion of C8 emissions. Significant impact for each structure on the sitc shall be determined based on the “area of building wake effects” as defined in the EPA User’s Guide to the Building Profile Input Program (EPA-454/R-93-038 Revised Feb. 8, 1995).
b. A complete and accurate list of DuPont’s current permitted allowable emission rates and confirmed actual C8 emission rates in pounds per year for the year 2000 for all sources located within the Washington Works facility. Each emission point shall be listed according to its stack I.D. and corresponding permit number. For each stack identified above as emitting CX DuPont shall list all relevant stack parameters to be used in air dispersion modeling.
c. shall be supplied:
For each emission point (stack) emitting C8, the following information
8
0006337 EIDl68202
MAH000574
i. Phase of C8 (solid, vapor or aqueous solution) at stack conditions.
ii. The particle characterization to be used for modeling including the particle size distribution (microns), the mass fraction of C8 in each particle size category, and the particle density (g/cm3).
... 111. For particulate emissions, scavenging coefficients (hr/s-mm) for
both liquid and cozen precipitation to be used for wet deposition modeling based upon the particle size distribution and the EPA’s Industrial Source Complex, Version 3 Model Guidance (EPA-454B-95-003b Sept. 1995) (“ISC Guidance”). DuPont may submit, within 30 days of the Effective Date, information to support the use of the normalized scavenging coefficient in the ISC Guidance (Figure 1 1 of ISC Guidance) for C8’s scavenging coefficients. DAQ shall approve or disapprove with justification in writing, DuPont’s submission. Should DAQ disapprove, DuPont shall have the right, within seven days, to request a meeting with DAQ and USEPA to addrcss the deficiencies set forth in DAQ’s letter and to request reconsideration of DAQ’s decision. Following a meeting of the parties, DAQ shall issue a dccision letter regarding C8’s scavenging coefficients within seven days of the meeting. DAQ reserves the right to require measurement of C8’s scavenging coefficients in its decision and DuPont reserves the right to assert a claim of confidentiality in the event such a mcasuremcnt is made.
iv. For gaseous emissions, scavenging coefficients (hr/s-mm) for both liquid and frozen precipitation to be used for wet deposition modcling will be provided as a function of droplet size using formulae in the open literature based on the physical properties of CS and consistent with Section 1.4 ofthe ISC Guidance. DuPont may submit, within 30 days of the Effective Date, information to support the proposed scavenging coefficient for gaseous emissions including information on the percentage of C8 emissions that would be in gaseous form. DAQ shall approve or disapprove with justification in writing, DuPont’s submission. Should DAQ disapprove, DuPont shall have the right, within sevcn days, to request a meeting with DAQ and USEPA to address the deficiencies set forth in DAQ’s letter and to request reconsidcration of DAQ’s decision. Following a meeting of the parties, DAQ shall issue a decision letter regarding C8’s scavenging coefficients within scvcn days of the meeting. DAQ reserves the right to require measurement of C8’s scavenging coefficients in its decision and DuPont rcscrvcs the right to assert a claim of confidentiality i n the event such a measurement is made.
d. To the extent that the phases exist, a solid, liquid and vapor phase (7’-P) diagram for C8 with respect to pressure and ternpcrature. The temperature and pressure ranges shall be representative of exhaust gas conditions before and aAer control equipment. Estimates of C8’s critical properties shall be provided along with measured ranges of phase transition temperatures.
9
000638 . EIDl68203
MAH000575

e. In lieu of a binary phase (T-x-y) diagram representing the vapor-liquid equilibrium between water and C8, the solubility and Kraffi Point of C8 in aqueous solutions, measured pK value for C8 dissociation in aqueous solutions, and measurements of C8 concentrations or related acids observed when testkd in a head spacc GC at various concentrations, temperatures, and pHs representative of the ranges observed during actual operating conditions. Furthermore a discussion regarding the volatility of C8 in aqueous solutions as a function of pH will be provided. The information in this paragraph shall be submitted to the DAQ within 60 days of the Effective Date.
f. Henry’s law coefficient for C8 and a discussion of its dependence on pH. The coefficient shall be defined at various temperatures covcring the range observed during actual operations.
g. Any carbon adsorption data in the form of isotherms for C8 adsorption.
DAQ will provide DuPont an opportunity to comment on modeling mcthodology and assumptions prior to finalizing the modeling results.
-. 3 Any expenses incurred as a result of accurately supplying the information requested above shall be covered by DuPont.
3. Upon submission of the information required by this Subsection VIl.D, DAQ @ reserves the riglit to disapprove my data if the analytical methodolog or quality control procedurcs arc deemed inappropriate.
VIII. REIMBURSEMENT OF COSTS.
1. DuPont agrees to establish an escrow account to fund Reimbursable Costs under this Consent Ordcr. Expenditures from this account shall be made upon joint approval by a duly designated representative of the WVDEP and of DuPont (“designated representativcs”). Writtcn notice of such designation shall be sent to the persons identified pursuant to Section XVI of this Conscnt Order. Prior to the execution of this Consent Order, WVDEP has provided DuPont with an cstirnate of Reimbursable Costs that WVDEP expects to incur under this Conscnt Order.
_. 7 Within 10 business days of the Effective Date, DuPont shall deposit in thc cscrow account funds in the amount of fifty thousand dollars (S50,OOO). Each expenditure from the escrow account must be supported by an itcmized accounting, including invoices and receipts. Said escrow account shall be replenished with additional hnds whenever the balance is less than tcn thousand dollars (SlO,OOO), or as agreed to by the designated representatives. Any unexpended amount rcmaining in the escrow account at the conclusion of the work to be performed under this Consent Order shall be returned to DuPont.
3. DuPont’s obligation to pay Reimbursable Costs under this Consent Order shall
10
EIDl68204
MAH000576
0 not exceed two hundred and fifty thousand dollars ($250,000). Except as to Reimbursable Costs which are addressed separately in this section, all other costs incurred by DuPont in carrying out its obligations under Consent Order shall be the sole responsibility and obligation of DuPont.
IX. QUALITY ASSURANCE/QUALITY CONTROL.
A11 sampling and analyses~performed pursuant to this Consent Order shall conform to EPA guidance regarding quality assurance/quality control, data validation, and chain of custody procedures. The laboratory performing the analyses shall be approved by the Parties prior to sampling.
X. CS REDUCTION PROGRAM.
1 . Notwithstanding current pemiitted emission levels, DuPont agrees to limit overall CS emissions to the air to no more than actual calendar year 2000 levels on a calendar year basis and shall fbrther provide to the WVDEP monthly emissions reports regarding C8. The reporting requirement contained herein shall be modified to quarterly reports upon the issuance of a Scrccning Level derived following the procedures set out in Attachment C.
2. DuPont agees to reduce emissions to the air and discharges to the water of C8 collectively by 50% from actual 1999 levels by December 3 1,2003.
3 . DuPont shall operate and maintain the filter and carbon bed treatment system at its Washington Works facility with the goal of achieving 90-95% C8 removal efficiency in its major CS-containing wastewater stream.
4. DuPont shall conduct thc following construction projects and abide by the specified dates:
a. DuPont shall install an improved scrubber filter to replace recovery device T61ZC on permit R13-815D. Construction shall begin no later than February 28,2002. Initial operation shall begin no later than the date of start up after the April shutdown; or June 28,2002, whichever is earlier.
b. DuPont shall modify the stack for emission point T6IZCE so that the emission point elevation is 170 feet above grade. The stack diametcr, velocity, and flow rate shall be sized to provide effective dispersion of particulate emissions according to 45 Code of State Rules, Series 20 (Good Engineering Practice as Applicable to Stack Heights). Construction shall begin no later than February 28,2002. Initial operation shall begin no later than the date of start up after the April shutdown, or June 28,2002, whichever is earlier. At times when device T 6 E C is not operating, permitted emissions from scrubber T6tFC shall be emitted to emission point
11 a
OOU6418 . - EIDl68205
W O O 0 5 7 7 - . .
T6IZCE.
5. DuPont shall conduct a scrubber optimization and rccovery improvement program that shall consist of a study of scrubber operation for device C2DWC2 on permit R13-614A. The study shall be complete by the end of March 2002. Provided the results are encouraging, the company shall implement identified irnprovemcnts for this device and similar improvements for units C2DTC2 on permit R13-614A, C2EHC2 on permit R13-1953, and ClFSC2 on proposed permit for R13-2365A. Implementation of the improvements for the latter devices will be complete no later than the end of November 2002.
XI. COMPLIANCE WITH SCREENING LEVELS.
1. The following requirements shall apply only if the procedures set out in Attachment C have been followed:
a. No later than 60 days after receipt of notification 6om the Agencies that data or information developed pursuant to this Consent Order or other information that is recent and valid demonstrates that DuPont's opcrations have resultcd in CS exposures above the Screening Levels derived following the procedures set out in Attachment C, DuPont shall submit a plan for review and approval by the Agencies that is designed to reduce such exposures to levels below the Scrcening Levels within a reasonable time (the "Remedial Plan" or "the Plan").
b. Within 30 days of receipt of the Remedial Plan submitted by DuPont, the WVDEP shall, upon consultation with the WVDHHR-BPH and based upon accuracy, quality, and completeness, either approve or disapprove the Plan. If the WVDEP disapproves thc Rcmcdial Plan, the WVDEP shall notify DuPont in writing that the Remedial Plan has been disapproved and shall specifjr the reasons for such disapproval. DuPont shall resubmit the Remedial Plan as revised to address the deficiencies identified in the notice. DuPont's failure to submit an approvable Remedial Plan shall be deemed a violation of this Consent Order.
2. In the event EPA or the WVDEP develops and finalizes a rcfcrcnce dose/scrccning level for C8 in accordance with applicable statutory and regulatory requirements ("the Regulatory EPA Standard") that would he applicable to Dupont's activities or the Facilities.independent of this Consent Order, DuPont's obligations under this Section shall be determined with reference to the Regulatory EPA Standard. DuPont reserves all r i gh t s i t may have to comment upon, object to, or appcal the Regulatory EPA Standard in proceedings separate and apart from this Consent Order.
MI. COMI'1,E'IION OF CONSENT ORDER.
1 . Except as to DuPont's obligations under Section XI, this Consent Order and DuPont's obligations hereunder shall terminatc upon issuance of a completion letter(s) From the Secretary of the WVDEP or his designee and from the Commissioner of the WVDHHR-BPH to
12 e
00064% ~ EIDl68206
MAH000578

0 DuPont. In a timely manner following receipt of a written request from DuPont the respective Agencies shall issue the completion letter(s) to DuPont or shall issue a letter to DuPont detailing the obligations and work that have not been completed in accordance with this Consent Order. The Parties agree that the Agencies’ obligation to issue -this letter shall be deemed a non-discrctionary duty.
2. DuPont’s obligation to achieve and maintain compliance with the Screening Levels as provided in Section XI of this Consent Order shall survive the termination of this Consent Order. Such obligation shall tcrminate only as provided in Section XI or upon agreement of the Parties.
XIII. ADDITIONAL ACTIONS.
The Agencies, individually or collcctivcly, pursuant to their statutory duty and authority, may determine that additional action, beyond the tasks set forth in this Consent Order, is necessary to protect human health andor the environment. Nothing in this Consent Order shall be construed as rcstraining or prevcnting the Agencies from taking such actions. Nothing in this Consent Order constitutes a satisfaction of or release from any claim or cause of action against DuPont for any liability it may have pursuant to the federal Clean Water Act, the federal Clean Air Act, the federal Safe Drinking Water Act, the West Virgnia Groundwater Protection Act, the West Virginia Air Pollution Control Act, other statutes applicable to this mattcr, or Wcst Virginia common law. Nothing in this Consent Order in any way constitutes a modification or waiver of statutory requirements of DuPont and nothing in this Consent Order shall obligate DuPont to undertake any actions not specified herein.
0
XIV. EN1;OIlCEMENT.
Enforcement of this Consent Order may be had by the filing of a civil action by any of the Agencies in the Circuit Court of Wood County, Wcst Virginia. Violation of the terms and conditions of this Consent Order by DuPont is a violation of the West Virginia Code and may result in enforcement action being taken, including a request for civil penalties ip set forth by law. DuPont shall not be liable for violations of this Consent Ordcr due to any “Force Majeure” condition.
XV. CONTENTS OF CONSENT ORDER/MODIFICATION.
The entirety of this Consent Order consists of the terms and conditions sct forth herein and in any attachments or exhibiis referenced herein. Modification of the terms and conditions of this Consent Ordcr including any modification of timefkames or’deadlines established in this Consent Order shall be made only by agreement of the Parties in writing, except that modifications to any
13 0
000642 . ____ ~ EIDl68207
W O O 0 5 7 9
0 requirement set out in the attachments to this Consent Order may be made upon consensus of the members of the GIST or the CAT Team, as appropriate.
XVI. ADDRESSES FOR ALL CORRESPONDENCE
All documents, including reports, approvals, notifications, disapprovals, and other correspondence, to be submitted under this Consent Order shall be sent by certified mail, return receipt requested, hand delivery, overnight mail or by courier service to the following addresses or to such addresses DuPont or WVDEP may designate in writing.
Documents to be submitted to WVDEP should be sent to:
WV Department of Environmental Protection 1356 I-lansford Street Charleston, West Virginia 25301
Attention: Armando Benincasa, Esq. Attention: Dee Ann Staats, Ph.D. Phone No.: (304) 558-2508
Documents to bc submitted to WVDHHR-BPH should be sent to:
LW Department of Health and Human Resources Burcau for Public Hcalth 815 Quarrier Street, Suite 418 Charleston, West Virginia 25301
Attention: William Toomey, Manager of Source Water Assessnicnt Program Phone No.: (304) 558-298 1
Documents to be submitted to DuPont should be sent to:
E. I. du Pont de Nemours and Company Washington Works P.O. Box 1217 Parkersburg, Wcst Virginia 26 I02
Attention: Paul Bossert Phone No.: (304) 863-4305
and
14
MAH000580

E. I. du Pont de Nemours and Company Legal Department, Suite D-71 1007 Market Street Wilmington, Delaware I9898
Attention: Bernard J. Reilly, Esq. Phone No.: (302) 774-5445
XVII. AUTHORIZED SIGNATORIES/NON-ADMISSION.
The undersigned representatives state that they have had full and fair opportunity to review this Consent Order and have had opportunity to allow for their counsel to do the same, and therefore enter this Consent Order freely and with f i l l knowledge of its terms and conditions.
The undersigned do hereby confirm that they have the authority to enter into this Consent Order and have the authority to bind their respcctive party.
Neither the terms of this Consent Order, nor execution thereof shall constitute an admission by DuPont of any fact or of any legal liability. DuPont expressly reserves all rights and defenses that may be availablc in any proceeding involving third parties or involving WVDEP and WVDHHR-BPH in any other matter.
of all the Parties below (“Effective Date”). This Consent Order may be signed in counterparts and shall be effective upon signature
@
Entered this day of ,2001, by:
WEST VIRGINIA DEPARTMENT OF ENVIRONMENTAL PROTECTION
BY:
WILLLAM E. ADAMS, DEPUTY SECRETARY Wcst Virginia Dcpartment of Environmental Protection 1356 Hansford Street Charleston, West Virginia 25301
Entered this day of ,2001, by:
15
000644 .
ElD168209
W O O 0 5 8 1

@ WEST VIRGINIA DWJSION OF HEALTH AND HUMAN RESOURCES - BUREAU FOR PUBLIC HEALTH
BY:
DR. HENRY TAYLOR, COMMISSIONER Bureau for Public Health West Virginia Department of Health and Human Resources Diamond Building, Room 702 350 Capitol Street Charleston, West Virginia 25301
Entered this day of ,2001, by:
E. I. DU PONT DE NEMOURS AND COMPANY
BY: a PAUL BOSSERT, PLANT MANAGER
16
0001645 EIDl68210
-000582

Attachment A
CS GROUNDWATER INVESTIGATION STEERING TEAM
A team of scientists shall be assembledto assess the presence and extent of C8 in drinking water, groundwater and surface water at and around the DuPont Washington Works facility, and the Local, Letart, and Dry Run Landfills. The Groundwater Investigation Steering Team (GIST) shaIl include scientists fiom WVDEP, WVDHHR- BPH, EPA Region HI, and DuPont. DuPont shall find the GIST via an escrow account as provided in Section VIII of the attached Consent Order (“the Consent Order”). Disbursements tkom this account shall be authorized jointly by the WVDEP GIST leader, and the DuPont representative, Andrew S. Hartten.
A schedule summarizing key GIST tasks, submittals, start and end dates is provided at the end of this document.
GIST Member Organizations/Represcn tatives/GeneraI Functions
David Watkins -Groundwater Protection- GIST teani leader; escrow finds
George Dasher-advisor and technical review Dee Ann Staats, Ph.D.-advisor
disbursement oversight; project management and coordination
EPA Region I11
Garth Connor-science advisor Jack C. Hwang - Hydrogeologist Roger Rheinhart-Environmental Engineer
DuPont
Andrew Hartten-Principal Project Leader/H ydrogeologist-technical review, project management and coordination of field investigation activities; escrow finds disbursement oversight.
WVDHHR-BPH
William Toomey-Manager, Source Waler Assessment Program- Bureau for Public Heallh advisor
A- 1 0 0 0.64 6
EID168211
MAH000583

GIST Team Objectives and Efforts
The primary objective of the GIST is to efficiently review and direct groundwater and surface water monitoring and investigation activities as prescribed in the Consent Order and in this Attachment. The GIST will utilize a phased approach and employ rapid team decision making toward meeting the requirements in an efficient and timely manner. Unless otherwise directcd by the GIST, the tasks outlined below shall be performed by DuPont or its representatives.
The GIST will issue a final report(s) with findings and conclusions regarding groundwater quality in and around the Facilities, and the extent of groundwater contamination in and around the Facilities. The GIST final report shall further make recommendations regarding the need for any hrther work or actions that need to be taken to assure protection of groundwater quality and human health into the hture.
The tasks sct forth below and in the Consent Order are the minimum tasks to be performed by DuPont and the GIST pursuant to the Consent Order. Additional tasks may be necessary to assure the goals [full groundwater assessment and C8 impact, plume identification, and receptor identification] of the GIST and the Consent Order are met. Those tasks shall be agreed upon by the GIST.
Key Tasks of GIST
0 Task A: Groundwater Use and Well Survey/Croundwater Monitoring
Objectives: Conduct a distance-phased groundwater well and water use survey within a 1-mile (and possibly 2 and 3-mile) radial distance or directionally focuscd distance of the Washington Works and Local, Letart, and Dry Run Landfills.’ Summary: l h e phased approach to the water and groundwater well use survey will allow the GIST to focus efforts along established C8 impact transport pathways and cease activities in directions where impacts are not present or where there are minimal concentrations. Data rcsults tablcs will be generated in a timely manner to allow the GIST to meet, evaluate the data, and determine the next course of action. The GIST will determine when the final groundwater well use survey shall be re1 eased.
DuPont agrees to perform, under the supervision of the GIST and through an agreed-to third party, a groundwater usc and well survey identifying and sampling all groundwater wells within a 1-mile radius ofthe three landfills set forth above and the Washington Works facility. The phased approach may be amended by the GIST should field conditions require, e.g., lack of sampling wells in the 1-mile radius, lack of quality sampling points within the I-mile radius.
Sampling shall be performed with the specific purpose of finding and measuring the C8 concentration in water. Should concentrations of C8 found in groundwater wells exceed 1 pg/l within the I-mile radius, thc GIST will determine
The water use survey should be in substantially thc same format as Attachment B.
ED16821 2
MAH000584
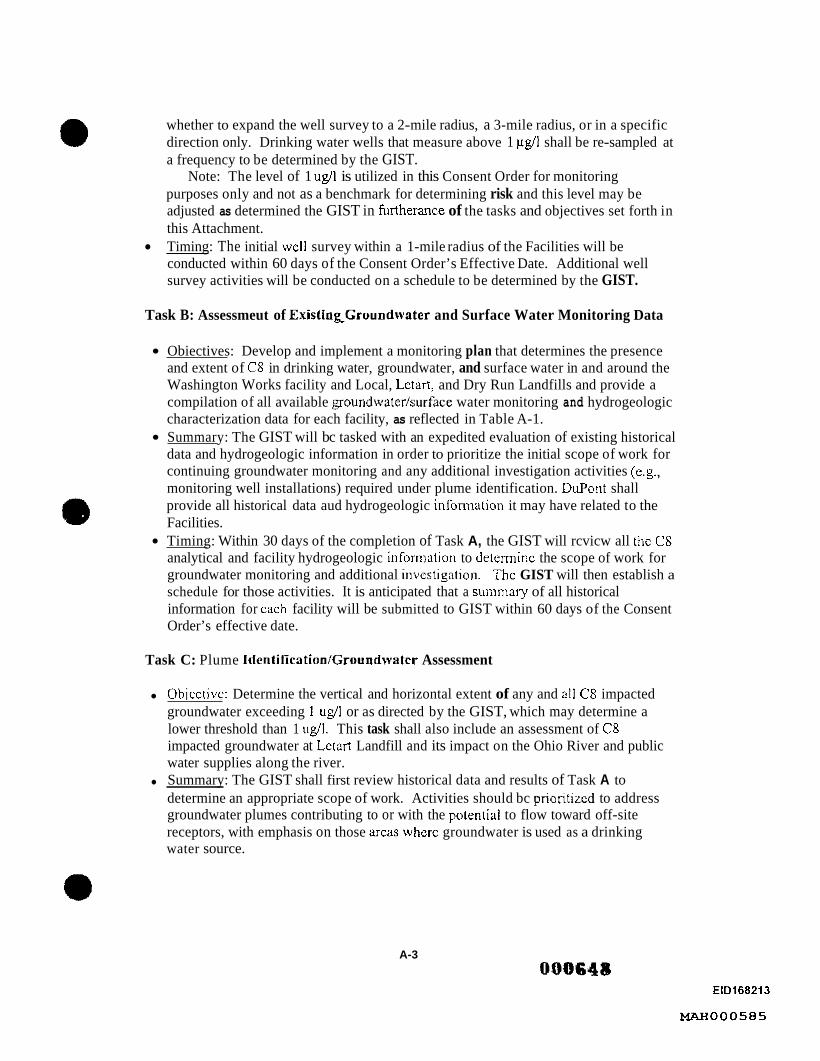
whether to expand the well survey to a 2-mile radius, a 3-mile radius, or in a specific direction only. Drinking water wells that measure above 1 p8/1 shall be re-sampled at a frequency to be determined by the GIST.
Note: The level of 1 ug/l is utilized in this Consent Order for monitoring purposes only and not as a benchmark for determining risk and this level may be adjusted as determined the GIST in hrtherance of the tasks and objectives set forth in this Attachment. Timing: The initial well survey within a 1-mile radius of the Facilities will be conducted within 60 days of the Consent Order’s Effective Date. Additional well survey activities will be conducted on a schedule to be determined by the GIST.
Task B: Assessmeut of ExistingGroundwater and Surface Water Monitoring Data
Obiectives: Develop and implement a monitoring plan that determines the presence and extent of C8 in drinking water, groundwater, and surface water in and around the Washington Works facility and Local, Lctart, and Dry Run Landfills and provide a compilation of all available groundwater/surface water monitoring and hydrogeologic characterization data for each facility, as reflected in Table A-1. Summary: The GIST will bc tasked with an expedited evaluation of existing historical data and hydrogeologic information in order to prioritize the initial scope of work for continuing groundwater monitoring and any additional investigation activities (e.g., monitoring well installations) required under plume identification. DuPont shall provide all historical data aud hydrogeologic infomiation it may have related to the Facilities. Timing: Within 30 days of the completion of Task A, the GIST will rcvicw all thc C8 analytical and facility hydrogeologic inforniation to determine the scope of work for groundwater monitoring and additional invcstigation. Thc GIST will then establish a schedule for those activities. It is anticipated that a summary of all historical information for cach facility will be submitted to GIST within 60 days of the Consent Order’s effective date.
Task C: Plume Identification/Groundwater Assessment
Objcctivc: Determine the vertical and horizontal extent of any and all C8 impacted groundwater exceeding 1 ugA or as directed by the GIST, which may determine a lower threshold than 1 ug/l. This task shall also include an assessment of C8 impacted groundwater at Letart Landfill and its impact on the Ohio River and public water supplies along the river. Summary: The GIST shall first review historical data and results of Task A to determine an appropriate scope of work. Activities should bc prioritizcd to address groundwater plumes contributing to or with the polential to flow toward off-site receptors, with emphasis on those arcas wherc groundwater is used as a drinking water source.
A-3 00.0648
EID168213
W O O 0 5 8 5
Upon completion of investigation activities, DuPont shall provide the GTST with predicted groundwater flow and contaminant transport models to assess hture plume migration.
0 Timing: Upon review of all available information and on a schcdule to be determined by the GIST, the GIST will complete an initial evaluation of data to determine and prioritize plume identification.
other activities will be on a schedule established by the GIST. Further investigatory activities needed and agreed to by the GIST to cany out the goals of the GIST shall be performed by DuPont on a schedule established by the GIST.
The timing of the initial phase of plume identificatiodinvestigation activities and
Modeling Any and all modeling performed pursuant to this attachment and the Consent Order shall use Groundwater Modeling System, or some other model as approved by the GIST.
A-4 OUU6U3 EID168214
MAH000586
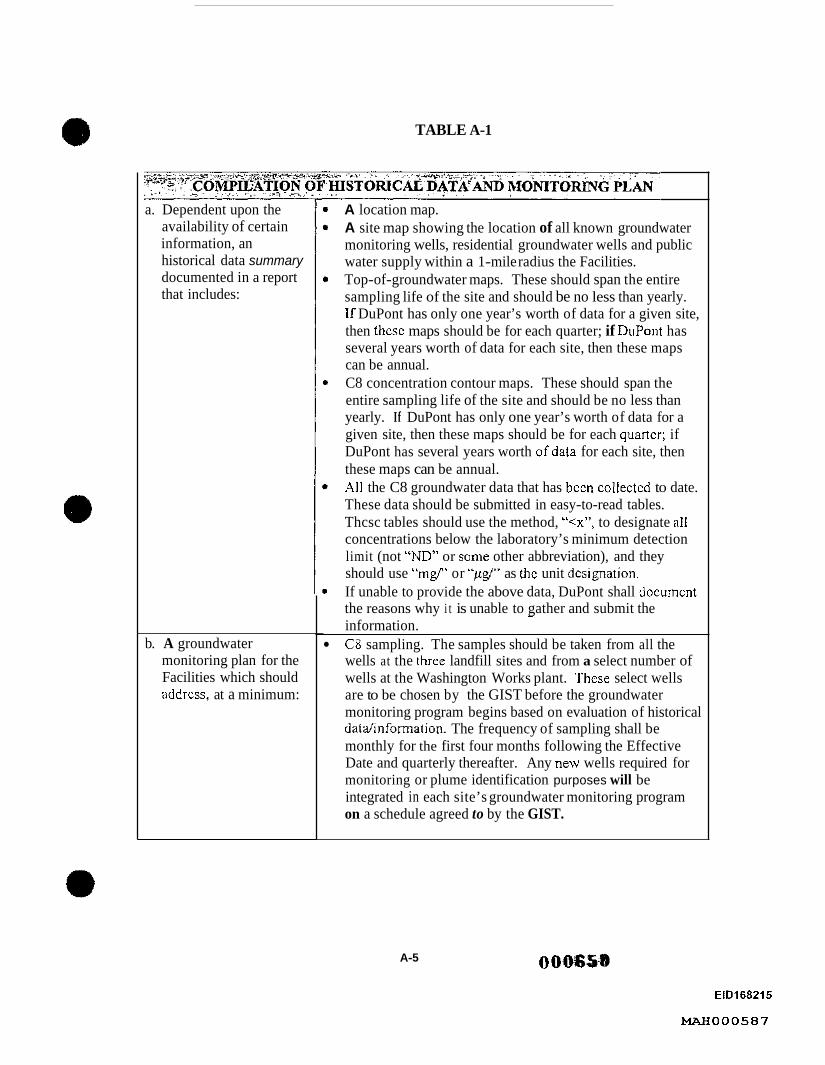
TABLE A-1
a. Dependent upon the availability of certain information, an historical data summary documented in a report that includes:
b. A groundwater monitoring plan for the Facilities which should addrcss, at a minimum:
A location map. A site map showing the location of all known groundwater monitoring wells, residential groundwater wells and public water supply within a 1-mile radius the Facilities. Top-of-groundwater maps. These should span the entire sampling life of the site and should be no less than yearly. Jf DuPont has only one year’s worth of data for a given site, then these maps should be for each quarter; if DtPont has several years worth of data for each site, then these maps can be annual. C8 concentration contour maps. These should span the entire sampling life of the site and should be no less than yearly. If DuPont has only one year’s worth of data for a given site, then these maps should be for each quartcr; if DuPont has several years worth ofdata for each site, then these maps can be annual. All the C8 groundwater data that has been collectcd to date. These data should be submitted in easy-to-read tables. Thcsc tables should use the method, ‘‘<x”, to designate all concentrations below the laboratory’s minimum detection limit (not “ND” or some other abbreviation), and they should use “mg/” or ‘‘pg’” as thc unit dcsignation. If unable to provide the above data, DuPont shall documcnt the reasons why i t is unable to gather and submit the - information. C8 sampling. The samples should be taken from all the wells at the three landfill sites and from a select number of wells at the Washington Works plant. ’I’hese select wells are to be chosen by the GIST before the groundwater monitoring program begins based on evaluation of historical datdinformation. The frequency of sampling shall be monthly for the first four months following the Effective Date and quarterly thereafter. Any new wells required for monitoring or plume identification purposes will be integrated in each site’s groundwater monitoring program on a schedule agreed to by the GIST.
A-5
ElDl68215
MAH000587

P Report of Rcsults. Reporting should be quarterly and to the WVDEP Groundwater Program at the following address.
WVDEP Division of Water Resources Groundwater Program 1201 Greenbrier Street Charleston, West Virginia 253 1 1 Re: DuPonVC8 monitoring.
Each report should include the following: 1
(a) A site location map.
(b) A site map showing the groundwater monitoring well locations.
(c) A top-of-groundwater map.
(d) A C8 concentration map.
(e) Groundwater elevation and well screen data.
( f ) A table of all the historical C8 sampling data. Note: where available information allows, abbreviations should not be ised to designate No Detect concentrations and the units “ppb” md “ppm” should not bc used.
(8) Laboratory analysis sheets.
(h) Chain of custody records.
A-6
0006bYI. . ~~ EIDl68216
W O O 0 5 8 8
. .

Attachment B 0 GROUNDWATER WELL USE SURVEY
Name :
Address:
Phone:
Best Time to Contact Owner:
1. Do you have onc or more water well(s) on this property? (It need not be in use currently.) If no, stop now and return survey. No - Yes
County Water We11 Permit No.
2. Is the well(s) currently (circle one) used unused or filled in?
3. is the well(s) used for drinking water? Yes 0 No
4. Is this well(s) used for other purposes? If yes, please specify uses below:
5. What is the approximate frequency of use? Circle One:
Daily Weekly Monthly Summer
6. Date last used?
7. Is there a pump in the wcll? Yes No -
8. system? Yes
Is there a conditioner, softener, chlorinator, filter, or other form of treatment for the No -
If so, what is the form of treatment?
000652
- EID168217
MAH000589
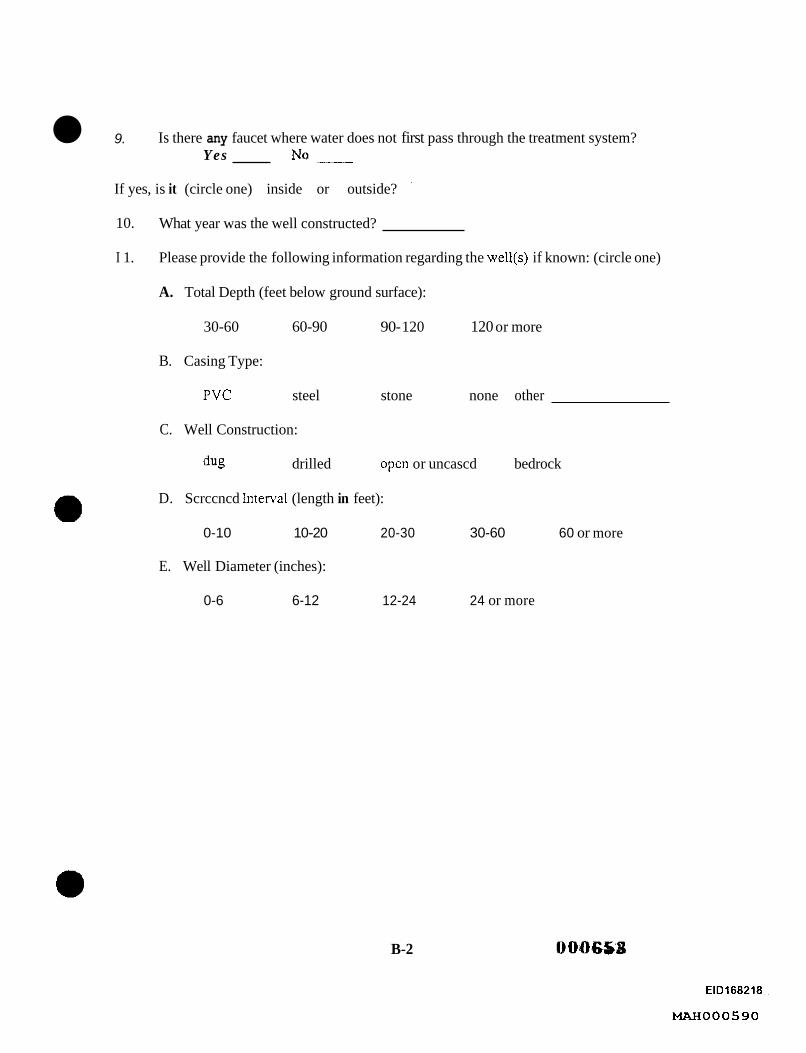
9. Is there any faucet where water does not first pass through the treatment system? No - Yes
If yes, is it (circle one) inside or outside?
10.
I 1.
What year was the well constructed?
Please provide the following information regarding the well(s) if known: (circle one)
A. Total Depth (feet below ground surface):
30-60 60-90 90- 120 120 or more
B. Casing Type:
PVC steel stone none other
C. Well Construction:
dug drilled open or uncascd bedrock
D. Scrccncd Interval (length in feet):
0-10 10-20 20-30 30-60 60 or more
E. Well Diameter (inches):
0-6 6-12 12-24 24 or more
B-2 0006-61
EIDl68218.-
MAH000590
Attachment C
C8 ASSESSMENT OF TOXICITY TEAM
A team of scientists shall be assembled to assess the toxicity and risk to human health and the environment associated with exposure to ammonium perfluorooctanoate (C8) releases from DuPont's activities. The C8 Assessment of Toxicity Team (CAT Team) shall include scientists from academia, government, non-profit organizations, and industry. The CAT Team also shall include the WVDEP Environmental Advocate, Pam Nixon, as a representative of West Virginia's citizens.
The WVDEP, utilizing funds from an escrow account fknded by DuPont, shall contract with a non-profit organization, the National Institute for Chemical Studies (NICS), for &he services described herein. Point of contact for the NICS shall be Jan Taylor, Ph.D. The NICS shall subcontract with Marshall University's Center for Rural and Environmental Health for scrviccs in risk communication provided by James Becker, M.D. and his staff. Dr. Becker shall familiarize himself with the toxicity of C8, the work performed by TERA as described herein, and attend public meetings to provide expertise in risk communication. The NICS shall subcontract with the non-profit scientific organization, Toxicology Excellence for Risk Assessment (TERA) whose point of contact is Joan Dollarhide, Ph.Z). The TERA shall provide services in toxicology and risk assessment. Work ass iments . tasks. and deliverables are described below.
CAT Team Member Organizations/ Representatives'/ General Functions
WVDEP
Dee Ann Staats, Ph.D. - Science Advisor - team leader; escrow funds disbursement oversight; project management and coordination; toxicology/risk assessment and communication;
Pam Nixon - Environmental Advocate - advisor;
NICS Jan Taylor, Ph.D. -contractor administrative oversight;
James Becker, M.D. (Marshall University) - consultant in risk communication;
TERA (point of contact: Joan Dollarhidc, Ph.D.)- consultant in toxicology/risk assessment;
0 ' The parties may, in their discretion, elect to substitute their representatives with persons of similar qualifications.
c- 1 000654 .
EIDl68219
MAH000591

DuPont
Gerald Kennedy, Director of Applied Toxicology and Health, Haskell Laboratory - reviewer toxicology; escrow finds disbursement oversight;
John Whysner, M.D. - toxicology/risk assessment and communications;
Paul Bossert - Washington Works Plant Manager - communications;
The following members of the CAT Team shall act as reviewers or advisors.
WV Department of Health and Human Resources - Bureau for Public Health (WVDHHR-BPH)
William Toorney - Manager, Source Water Assessment Program - advisor; Barbara Taylor - Director, Office of Environmental Health Services - advisor; Local representative - advisor;
Environmental Protection Agency (E PA)
I Ieadquarters - Jennifer Seed - rcviewer and advisor toxicology; Region I11 Philadelphia -
Samuel Rotenbers, Ph.D. - reviewer and advisor toxicology/ risk
Garth Connor - advisor hydrogeology; Roger Reinhart -reviewer and advisor Safe Drinking Water Act;
asscssmcnt;
Cincinnati - John Cicmanec, DVM - reviewer and advisor toxicology;
Agency for Toxic Substances and Disease Registry (ATSDR) Atlanta - John Wheeler, Ph.D. - reviewer and advisor in toxicology/ risk
Philadelphia - Lora Werner - coordinator for ATSDR; assessment;
Non-CAT Team Efforts
Other efforts are currently underway which may produce information for the CAT Team to utilize. The CAT Team will coordinate and communicate closely with these other efforts. These include:
1. Dupont’s air modeling of CS emissions from the Washington Works plant;
2. WVDEP’s air modeling of C8 emissions from the Washington Works plant;
000655 e-2
EID168220
MAH000592
@ 3. USEPA Draft Hazard Assessment which summarizes the available toxicity information regarding C8, to the extent completed prior to the assessment contemplated herein;
4. ATSDR’s Health Consultation that estimates the risk to the community associated with C8 in drinking water from the Lubeck Public Service District, to the extent completed prior to the assessment contemplated herein.
5. Existing C8 concentrations in Lubeck Public Service District data.
6. Groundwater C8 Analysis (see GIST activities described in Attachment A) and Well Use Survey (see example survey in Attachment B) at the residences in the area of the 3 landfills and the Washington Works Plant.
Tasks of CAT Team
The tasks to be performed by the CAT Team are described briefly in Table 1 , and in more detail below. These tasks are discussed beIow withn the context of a Scope of Work for both Dr. Becker and for TERA as well.
Tasks of the CAT Team shall bc organized into thrcc phases. Phase I includes those tasks necessary to prepare for and hold the first public meeting. In Phase 11, TERA shall conduct such scientific tasks as: reviewing available toxicity and epidemiological studies; developing Provisional Reference Doses and Screening Levels for protection of human health; evaluating existing information relative to ecological health; and conducting one general risk assessment involving comparisons of cxposure concentrations to Screening Levels, for the three landfills and the Washington Works Plant, and the Lubeck Public Service District. TERA shall prepare a report on their findings. Phase 111 includes those tasks necessary to prepare for and hold the second public meeting. The results of the CS groundwater analysis and risk assessment shall be presented in the second public meeting.
0
No communication between Dupont representatives and NICS, Dr. Becker, or TERA shall be permitted without the participation of Dr. Staats. All information will be provided to Dr. Becker and TERA by WVDEP; thus, all information contributed to the effort by Dupont shall be sent in triplicate to Dr. Staats for fonvarding to Dr. Becker and TERA.
Phase I TASK A- 1 : First Public .Meeting
Two public meetings are anticipated for this project. The First Public Meeting shall occur in Phase I for the purposes of introducing the CAT Team and other involved parties to the public; relating historical information on previous concentrations of C8 in Lubeck Public Service District water supply; informing the citizens of the ensuing activities; and inviting the public to participate by cooperating with sampling and survey efforts in the Groundwater C8 Analysis and Well Use Survey. In order to prepare for the @
000656 c-3
EIDl68221
MAH000593
First Public Meeting, CAT Team members shall familiarize themselves with the available toxicological information concerning C8.
A CAT Team meeting shall be held irrpnediately prior to the first public meeting to: (1) conduct a site visit to the three landfills and the Washington Works Plant, and surrounding residcntial areas; (2) discuss the toxicity of C8 and other pertinent data; (3) prepare an agenda for the public meeting; (4) coordinate and prepare for the public . meeting. Finally, the First Public Meeting will be held and public questions and comments will be recorded by WVDEP.
TABLE 1. TASKS OF CAT TEAM
Task A: Public Meetings (two mectings are anticipated) Objective: to inform the local citizens of the following: (in Meeting #1) intent to perform a groundwater well usc survey and analysis for C8; intent to develop Screening Levels; and to ask for their cooperation in conducting the water use survey; and (in Mecting #2) results of survey, chemical analysis, and risk assessment. Note that an interim public meeting may be required should six months pass from the first public meeting and the CAT Team Findl Report has not been issued. Primary Responsibility: Staats Task B: Development of Provisional Refcrcnce Doses Objective: to develop Provisional References Doses for C8 for the inhalation and ingcstion (and dcrmal, if possible) routes of exposure. Primary Responsibility: TERA Task C : Development of Screening Levels Based on Protection of Human Health Objcctive: to utilize thc Provisional Reference Doses to develop human health risk-based Screening Levels for C8 in air, water, and soil. Note a determination of thc potential carcinogenicity of C8 will be conducted as well. Primary Responsibility: TERA Task D: Ecological Data Review Objective: to rcview available information to determine whether sufficient studies have been performed and data have been collected to develop screening critcria for ccological receptors. Primary Responsibility: TERA Task E: Draft Report and Final Report Objective: to present and discuss the results of the above tasks. Primary Responsibility: TERA
Phase I1 Tasks B. C. D. and E Develoument of Provisional Reference Doses and ScreeninP Levels. and Risk Assessment
In Phase 11, TERA shall conduct the toxicological and risk assessment activities. AAer having rcviewed the toxicological information regarding C8 provided by WVDEP, TERA shall consult with toxicologists on the CAT Team, as coordinated by Dr. Staats, regarding its proposed approach for this project. Following such consultation, TERA
000657 c-4
EIDl68222 -~
MAH000594
shall develop Provisional Reference Doses for C8 for the oral, inhalation, and dermal (if possible) routes of exposure. Then TERA shall calculate Screening Levels for water, soil and air based on the risk factors they have estimated. TERA shall perform one general risk assessment involving comparison of expoyre concentrations to Screening Levels for the three landfills and the Washington Works Plant, and the Lubeck Public Service District water supply, that focuses on current risk to human health, including workers and residents. This risk assessment shall include: ( I ) identification of reasonably anticipated land use, surface water and groundwater use; (2) identification of receptors; (3) identification of exposure pathways; (4) identification of exposure concentrations; and ( 5 ) comparison of exposure concentrations to appropriate Screening Levels. TERA shall utilize data obtained from the other efforts discussed above such as air modeling; groundwater C8 concentrations in residential and public wells; residential groundwater well use survey; the USEPA’s Draft Hazard Assessment; and ATSDR’s Health Consultation (if available). TERA also shall review available information to determine whethcr sufficient studies have been performed and data have been collected to develop screening criteria for protection of ecological health, particuIarly aquatic Iifc. TERA shall prepare a draft and a final document that discusses the results of their efforts and summarizes the data utilized from othcr cfforts. As thc tasks of the CAT Team and other involved parties’ progress, data gaps and research recommendations may become evident. Thesc shall bc included in TERA’s report as suggestions for further research to elucidate the toxicity of C8.
Phase I11 Second Public Meeting
The purpose of the Second Public Meeting is to present to the citizenry the results of the efforts of the GIST and CAT Teams including C8 concentrations in groundwater from rcsidcntial wells and public wells the screening levels and the general risk assessment. Air modeling results of the efforts of WVDEP and Dupont will be discusscd also. The WVDEP will address any fkrther actions that may be necessary.
c-5 000658
E10168223
MAH000595

.-
SCOPE OF WORK FOR JAMES BECKER, M.D.
Dr. Becker is a medical doctor specializing in environmental health at the Marshall University School of Medicine Center for Rural and Environmental Health. He will be assisting the WVDEP in his specialty area of risk communication at the two anticipated public meetings. The specific tasks assigned to Dr. Becker are described below.
Phase I Task A-1: First Public Meeting
Dr Becker will assist in preparation for the first public meeting, and attend the meeting providing expertise in risk communication . He will familiarize himself with the available toxicological data, which will be provided to him by WVDEP, with particular cmphasis on the cpidemiological studies. Note that the toxicological data already has been summarized in the Draft Hazard Assessment prepared by USEPA. No literaturc search or document retrieval will be required. Specific subtasks required in Phase I to prepare for the first public meeting are described below:
Subtask 1 - Familiarization with toxicological data provided by WVDEP including but not limited to:
a. 8 compact discs of information provided to USEPA undcr TSCA by 3M Corp (note only a small portion of this information concerns CS); b. DraA Hazard Asscssmcnt document from USEPA; c. ACGM Threshold Limit Value (TLV). d. Journal articles and other information provided by WVDEP.
Subtask 2 - Attend a iiieeting prior to the first public meeting to:
a. conduct a site visit of the 3 landfills and the Washington Works Plant, and local residential areas;
b. discuss and prepare an agenda; c. discuss the toxicology and risks associated with C8 with the other CAT Team
members.
Subtask 3 - Attend First Public Meeting
Phase 111 Task A-2 Second Public Meeting
Dr Becker will assist in preparation for the second public meeting, and attend the meeting providing expertise in risk communication. The following subtasks will be required:
Subtask 1 - Familiarization with the toxicological and risk assessment report 0 prcpared by TERA;
C-6 000653
EIDl68224
MAH000596
Subtask 2 - Attend a meeting prior to the second public meeting to: a.
b.
discuss the toxicology and risks associated with C8 with the other CAT Team members; discuss and prepare an agenda.
Subtask 3 - Attend Second Public Meeting
Note that the second public meeting is assumed to be the final public meeting; however, rcsults of data collection may warrant additional public meetings and an expansion of the Scope of Work.
000668 c-7
EID168225
MAH000597

SCOPE OF WORK FOR TERA
TER4 (Toxicology Excellence for Risk Assessment) is a non-profit organization that applies sound toxicological data to the risk assessment process to find common ground between environmental, industry, and government groups. TERA will be providing services in toxicology and risk assessment. TERA scientists will be developing risk factors and screening criteria; and conducting one general risk assessment for the 3 landfills, Lubeck Public Service District water supply and the Washington Works Plant. The spccific tasks assigned to TERA are described below.
Phase 11 Tasks B, C, D, and E: Development of Provisional Reference Doses and Screening Levels, and General Assessment of Risk
Subtask 1 - TERA staff will familiarize themselves with the toxicological data provided to by WVDEP. No literature search or document retrieval will be required. Toxicological data to be provided to TERA shall include but is not limited to the following:
a. 8 compact discs of information provided to USEPA under TSCA by 3M Corp (note only a small portion of this information concerns C8);
b. USEPA DraA Hazard Assessment for C8; c. Journal articles and other information submitted to WVDEP by
DuPont.
Subtask 2 - TERA staff will:
a. identify all possible critical toxicological studies suitable for developing Reference Doses for the oral, inhalation, and dermal (if possible) routes of exposurc; outline methodology for developing said Reference Doses and for dcveloping Screening Levels for air, water, and soil based 011 said Reference Doses corresponding to each critical study identified in subtask 2-a;
c. convene a meeting at the TERA facility in Cincinnati, Ohio, to prcsent their findings in subtask 2-a and 2-b, and consult with C-AT Team toxicologists as coordinated by Dr. Staats;
d. finalize Reference Doses and Screening Levels based on recommcndations of thc CAT Team toxicologists as coordinated by Dr. Staats.
b.
Subtask 3 - TERA shall conduct one general risk assessment for the three landfills and Washington Works Plant, and the Lubeck Public Service District water supply based on current risk to human health. This risk assessment shall include:
a) identification of reasonably anticipated land use, surface water and groundwater uses;
c-8
-
0006611
EIDl68226
MAH000598
b) identification of receptors; c) identification of exposure pathways; d) identification of exposure concentrations; e) comparison of exposure concentrations to appropriate Screening
Levels;
TERA shall utilize the following data in the risk assessment process:
a) air modeling data from DuPont; b) air modeling data fiom WVDEP; c) water use data from the Well Use Survey; d) groundwater data from the Groundwater Well Analysis of C8 for residcntial
wells; e) drinking water data from Lubeck Public Service District wells; 0 any available ATSDR Health Consultation that assesses potential health
effects from cxposurc to C8 in public supply drinking water.
Subtask 4 - TERA shall review the ecological data and determine whether there is sufficient information to support the developrncnt of a C8 Screening Level for protection of ecological health
Subtask 5 - TERA shall compile and discuss the results of the above tasks into a comprehensive report (draft and final versions), which also refers to and provides a brief 0 summary of the following:
a) USEPA’s Draft Hazard Assessment of C8; b) DuPont’s air modeling data; c) WVDEP’s air modeling data; d) groundwater data from the Groundwater CS Analysis and Well Use Survey of
Local Residents, and Lubeck Public Service District; e) ATSDR Health Consultation that assesses potential health effects from
exposure to C8 in public supply drinking water, if available.
Additionally, TERA shall include in the report any insights or recommendations for future research gleaned during this process that would further elucidate-the toxicity of C8. Also, TEIW shall provide in the report of a summary discussion of the relevance the carcinogenicity of C8 in rats to humans.
c-9
EIDl68227
MAH000599