competitive alternatives, 2014
TRANSCRIPT

Competitive
Alternatives
KPMG’s Guide to International
Business Location Costs
Volume II Report – 2014 Edition
competitivealternatives.com
Corporate Sponsors

KPMG LLP, in association with MMK Consulting Inc., has conducted an analysis of the relative costs of doing business in 10 countries in North America, Europe, and Asia Pacific. This report was made possible through the support of our research contributors and sponsors, as identified in this report.
The analysis in this publication is based on cost information collected primarily between July 2013 and January 2014. Taxes reflect tax rates in effect on January 1, 2014, and also incorporate any announced changes at that time to take effect at specified later dates. Exchange rates and other cost factors will, of course, change over time. Tax rates and other tax-related information are also subject to change as a result of new legislation, judicial decisions, and administrative pronouncements.
All information provided is of a general nature and is not intended to address the circumstances of any particular individual or entity. Although we endeavor to provide accurate and timely information, there can be no guarantee that such information is accurate as of the date it is received or that it will continue to be accurate in the future. No one should act upon such information without appropriate professional advice after a thorough examination of the particular situation.
© 2014 MMK Consulting Inc. All rights reserved.
No part of this publication may be reproduced, reprinted, stored in a retrieval system, or transmitted, in part or whole, in any form or by any means, electronic, mechanical, photocopying, recording, or otherwise, without the prior written permission of the authors.
Electronic copies of this report, as well as additional information in respect of this report, are available at CompetitiveAlternatives.com.
Competitive Alternatives
KPMG’s Guideto
International Business Location Costs
2014 Edition
Volume II: Appendices

Appendices
A. Details of Study Methodology...........................................................A.1 to A.6Discusses the study methodology and key business model assumptions underlying the analysis contained in this report.
B. Tax Assumptions and Comparisons..................................................B1. to B.22Presents the tax rate assumptions used for each location in the comparative analysis, along with summary measures of tax burden resulting from the analysis.
C. Other Competitiveness Factors: Regional Data and Data Source Notes..............................................................................C.1 to C.8Contains detailed regional and local data, along with detailed data source notes to support the analysis of other competitiveness factors presented in Chapter 6 of the study report.
D. Selected Bibliography and Sources of Data.....................................D.1 to D.15Contains a listing of sources used in respect of each city to gather recent data for input to this study.
Appendix ADetails of Study Methodology
© 2014 KPMG LLP, a Canadian limited liability partnership and a member firm of the KPMG network of independent member firms affiliated with KPMG International Cooperative (“KPMG International”), a Swiss entity. All rights reserved.
The value of any major study depends on the quality of the study design, the data assembled, and the analytical methodology. This appendix provides further details of the methodology of the Competitive Alternatives study, including:
� Design of the Competitive Alternatives Cost Model
� Identification of the key location-sensitive cost components
� Definition of the standard business operations
� Specification of common business model assumptions
� Methodology for estimating labor costs
� Methodology for estimating transportation/distribution costs for each operation
� Methodology for estimating taxes.
Competitive Alternatives
Cost Model
This report utilizes the Competitive Alternatives Cost Model, a proprietary model which can analyze costs for businesses in many different types of business operations across multiple geographic locations.
The model uses two streams of information:
� Standardized operating specifications for each business operation
� Current business investment and operating cost data for each location.
By combining this information for each operation and location, the model produces pro forma estimates of annual costs and cash flows for a new business facility in each location. Outputs from the Cost Model include standard financial and project evaluation reports including:
� Ten-year income statements
� Ten-year balance sheets
� Ten-year cash flow statements
� Net present value of cash flows
� Corporate income tax calculations.
These reports form the basis of the cost comparisons contained in this report. The result is a snapshot of business costs in each location, scaled relative to the significance of each cost item during the establishment, ramp-up, and full operation phases of a new business operation, over ten years.
Standard Business Operations
As described in Chapter 4, 19 industry-specific standard business operations were specified for analysis in this report. These business operations have been defined according to a number of standard investment and operating specifications, including:
� Land and building requirements
� Machinery and equipment requirements
� Inventory
� Financing (debt/equity) and working capital requirements
� Annual sales revenues
� Workforce requirements
� Raw material and component inputs
� Research and development expenditures
� Electricity and natural gas requirements
� Product distribution requirements.
Summaries of the standardized parameters for each of the 19 industry-specific business operations can be found online at CompetitiveAlternatives.com/industries.
Competitive Alternatives, 2014 EditionA . 2
Key Location-sensitive Costs
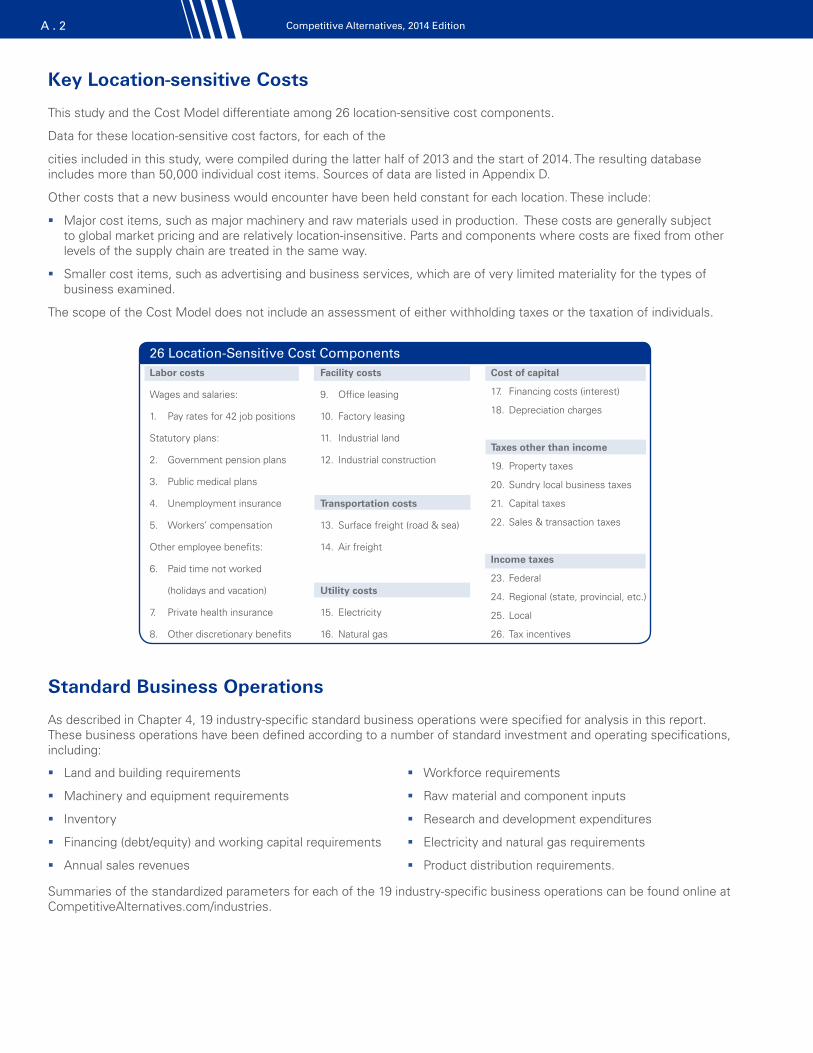
This study and the Cost Model differentiate among 26 location-sensitive cost components.
Data for these location-sensitive cost factors, for each of the
cities included in this study, were compiled during the latter half of 2013 and the start of 2014. The resulting database includes more than 50,000 individual cost items. Sources of data are listed in Appendix D.
Other costs that a new business would encounter have been held constant for each location. These include:
� Major cost items, such as major machinery and raw materials used in production. These costs are generally subject to global market pricing and are relatively location-insensitive. Parts and components where costs are fixed from other levels of the supply chain are treated in the same way.
� Smaller cost items, such as advertising and business services, which are of very limited materiality for the types of business examined.
The scope of the Cost Model does not include an assessment of either withholding taxes or the taxation of individuals.
Standard Business Operations
As described in Chapter 4, 19 industry-specific standard business operations were specified for analysis in this report. These business operations have been defined according to a number of standard investment and operating specifications, including:
26 Location-Sensitive Cost ComponentsLabor costs
Wages and salaries:
1. Pay rates for 42 job positions
Statutory plans:
2. Government pension plans
3. Public medical plans
4. Unemployment insurance
5. Workers’ compensation
Other employee benefits:
6. Paid time not worked
(holidays and vacation)
7. Private health insurance
8. Other discretionary benefits
Facility costs
9. Office leasing
10. Factory leasing
11. Industrial land
12. Industrial construction
Transportation costs
13. Surface freight (road & sea)
14. Air freight
Utility costs
15. Electricity
16. Natural gas
Cost of capital
17. Financing costs (interest)
18. Depreciation charges
Taxes other than income
19. Property taxes
20. Sundry local business taxes
21. Capital taxes
22. Sales & transaction taxes
Income taxes
23. Federal
24. Regional (state, provincial, etc.)
25. Local
26. Tax incentives
� Land and building requirements
� Machinery and equipment requirements
� Inventory
� Financing (debt/equity) and working capital requirements
� Annual sales revenues
� Workforce requirements
� Raw material and component inputs
� Research and development expenditures
� Electricity and natural gas requirements
� Product distribution requirements.
Summaries of the standardized parameters for each of the 19 industry-specific business operations can be found online at CompetitiveAlternatives.com/industries.
KPMG’s Guide to International Business Location Costs A . 3
Business Model Assumptions
Common Assumptions: Startup Phase � All figures are shown in current US dollars, unless
another currency is specified.
� For each type of facility, the following items are assumed to be identical in each location: - Physical requirements for buildings and land - Machinery and equipment investments - Working capital requirements, including inventory
levels - Cost of equity capital - Debt-to-equity ratio at start-up.
� Expenditures for land (if any) occur in Year 0. Real estate transfer taxes are capitalized in the cost of land.
Common Assumptions: Operating Phase � All figures are shown in current US dollars, unless
another currency is specified.
� There is a ramp-up period of up to four years before operations reach full capacity.
� For each type of facility, the following items are assumed to be identical in each location: - Volume of output - Staffing requirements - Industrial and/or office leasing requirements - Electricity and natural gas requirements - Research and development activities - Cost of equity capital.
� All of the firm’s business income is related to operations.
� For profit center operations, sales revenue is held constant for all locations. For cost center operations, revenue is determined using a “cost-plus” markup approach; with the markup percentage held constant for all locations.
� All revenues earned and expenses incurred in a given period are collected and paid in the same period.
� Net cash flow from operations is added to cash on the balance sheet.
� Additional capital expenditures for retooling are undertaken as required by the type of business operation.
� Costs for materials and other location-insensitive costs are based on a predetermined percentage of sales, split between direct and indirect costs in accordance with general accounting principles. These percentages vary with the business type. For cost center operations, where revenue is a function of costs, location-insensitive costs are fixed in US$ per annum for all locations.
� The firm is a start-up, stand-alone, limited company.
� For the purposes of apportionment of taxable income in North America, the firm is assumed to be eligible to apportion income among states, but not to maintain a substantial portion of its physical business operations in any location other than the location being examined. The firm is also assumed not to be subject to a material level of taxation in any jurisdiction other than its main location.
� For North American operations, the company does not qualify as an S-Corporation in the United States or a Canadian-Controlled Private Corporation in Canada, and does not receive the preferential tax treatment accorded to those categories of company.
� For the purposes of net present value calculations, at the end of Year 10, residual value is measured as: - Current assets (including inventory), at cost; plus - Land, at historical cost; plus - Buildings, at depreciated historical cost; less - All liabilities at face value.
� Machinery and equipment are assumed to have zero scrap value, and no taxable capital gains are realized on the sale of capital assets.
� Calculations over the 10 years of operation are made on the basis of current (2013-14) price levels, exchange rates, tax structures, and cost factors. However, where future tax changes have been announced, such future changes are reflected in the calculations.
� Four depreciable asset classes are recognized: buildings, machinery and equipment, office equipment, and R&D equipment. Major initial investments in all asset classes are made in Year 0.
� An initial investment in inventory is made in Year 0. Average inventory levels are assumed to remain steady over the 10-year period.
� The initial investment is partially financed with debt. Debt servicing costs are treated as expenses in the year incurred. No net principal payments are assumed during the 10-year period, so the level of debt remains constant.
Competitive Alternatives, 2014 EditionA . 4
Transportation/Distribution Costs
A product distribution pattern has been developed for each relevant operation to reflect the characteristics of, and markets for, the goods produced. Product distribution has been based on global, continental, national, or regional markets.
Overseas exports are assumed to be transported by sea freight, except in the case of higher value products with shorter life cycles, in which case air freight may be used.
Food Processing OperationIn developing the product distribution model for the food processing industry, the tendency for food product markets to be somewhat country-specific due to different taste preferences among regions has been considered. As a result, this model assumes that 50 percent of product is sold to distributors in the region in which it is produced, with the remainder being distributed to global markets.
Advanced Batteries, Auto Parts, Metal Machining, Plastic Products, and Precision Components OperationsPlants manufacturing advanced battery systems, auto parts, metal components, plastic products, and precision components are generally producing for industrial customers who will use these components in further value-added manufacturing. Production of such components have become increasingly globalized over the last decade, but still with a tendency for producers to locate close to one or more of their major customers.
In the distribution models for these operations, output is assumed to be distributed to customers globally. Global sales are weighed using Gross Fixed Capital Formation as a proxy for industrial capacity and demand in each country. To allow for the local presence of major customers, this measure is double-weighted on favor of the region of production.
Electronics Assembly, Medical Devices, Pharmaceuticals, Specialty Chemicals, and Telecom Equipment OperationsMarkets for these products tend to be continent-wide, as a minimum, with many firms selling on a global basis In the distribution models for these operations, output is assumed to be distributed to customers globally. Global sales are weighted by a combination of population (to reflect personal consumption demand) and Gross Fixed Capital Formation (to reflect industrial consumption demand). To allow for the local presence of major customers, this measure is double-weighted in favor of the region of production.
Aircraft Parts OperationMarkets for these products tend to be focused on the regions surrounding major aircraft assembly plants, such as the North American Boeing plants in Seattle and Wichita, and Bombardier plant in Montreal; the European Airbus plants in Toulouse, Hamburg, and Broughton; and the Brazilian Embraer plant near Sao Paulo.
Distribution for aircraft parts is assumed to occur on the following basis:
� 60 percent to major aircraft assembly plants in Europe (25 percent), North America (25 percent), and South America (10 percent)
� 40 percent exported equally among eight broad global regions, as parts used by maintenance, repair and overhaul operations.
Other OperationsThe remaining operations are all services operations and have no physical product distribution requirements:
� Biomedical R&D
� Clinical trials management
� Electronics systems testing
� International financial services
� Shared services center
� Software development
� Video game production.
General Product Distribution AssumptionsThe following general assumptions apply to each of the product distribution patterns outlined above:
� The model firms do not have any in-house distribution capability, so all freight movements are handled by third-party logistics providers
� Each firm is able to maximize the efficiency of its distribution patterns, delivering product to its customers in full truckload and/or container-load quantities, or as standardized less-than-load shipments
� The model firms are not selling to customers requiring just-in-time (JIT) or just-in-order (JIO) deliveries
� Intra-continental distribution is by road and/or rail freight (based on the most economical option), except where the use of sea freight is required between countries in Asia (e.g. between Japan and mainland Asia).

KPMG’s Guide to International Business Location Costs A . 5
Labor Costs
To estimate annual labor costs for each facility, employees from different industries and operations have been grouped into a range of generic job positions, based on common levels of skill and responsibility. This approach reflects the nature of data available from different wage surveys, and the number of positions that can be comparably costed across a wide range of locations. By grouping employees into generic positions, the diversity of salary levels that would be encountered in a typical operation has been built into the calculation of annual labor costs. This study uses 42 generic job positions:
� Eight management positions
� Eight production positions
� Five scientific/technical positions
� Ten information technology positions
� Nine sales and administrative positions
� Two facility maintenance positions.
Based on individual job descriptions, typical salary and wage levels have been collected for each position in each city studied. Statutory and employer-sponsored benefits have also been calculated individually, according to the average pay for each job.
Facilities Costs
Facility requirements have been developed based on actual firm data during the process of defining the standard operating parameters for each business operation:
� For service operations, facilities costs include the cost of leasing suitable Class A office space, generally in a suburban area for most business operations but in a downtown location for the International Financial Services operation
� For manufacturing operations, facility costs include the cost of leasing a suitable modern industrial facility in a suburban area.
Costs for land purchase and building construction, and lease capitalization rates are used in some instances to refine values for industrial leasing and property valuation for local tax purposes.
Costs for land purchase, building construction, industrial leasing, and/or office leasing were collected by Colliers International real estate professionals in each local market.
Energy Costs
Energy requirements have been developed based on actual firm and industry average data during the process of defining the standard operating parameters for each business operation. For manufacturing operations, both electricity and natural gas requirements have been considered. For service operations, where energy requirements are far less significant, only electricity requirements have been considered. Based on the identified energy requirements, costs were calculated based on published schedule rates of relevant energy suppliers or reported statistical rate data for industrial and commercial users, as available in each location.
Taxation Costs
Refer to Appendix B for details of taxation methodology.
Interpretation of Results
While great care has been taken in performing this analysis and developing the findings, the resulting comparisons are of a general nature. All cost factors examined in this study are subject to change over time, due to changes in local laws, regulations, and/or market conditions.
The results of this study should not be interpreted as a definitive or final opinion on the merits of locating any specific facility in one jurisdiction over another. Further analysis is required to determine the best site for a specific facility or operation.

Competitive Alternatives, 2014 EditionA . 6
(This page is intentionally blank)

Appendix BTax Assumptions and Comparisons
This appendix presents the tax rate assumptions used in the comparative analysis, along with summary measures of tax burden resulting from the analysis.
In this study, income taxes have been calculated on the “tax payable” basis. Deferred income tax balances (both positive and negative) have been excluded, since these accounting book entries are generally not relevant for location decision making.
All tax rates listed here are current as at January 1, 2014, based on latest information available as at that date. Taxes are grouped based on substance rather than legal form, and legislated names of specific taxes in certain jurisdictions differ from the generic titles used in this study.
Given the broad scope of this assignment, a number of simplifying assumptions have been made with respect to specific taxes. Any simplifying assumptions made are consistent with the business model assumptions set out in Appendix A.
Payroll taxes have been incorporated into statutory benefit costs shown in this report, but are not presented in this table.
These data should not be used to draw definitive conclusions regarding the relative position of any particular jurisdiction with respect to a particular element of taxation. In all circumstances, professional advice should be sought to address any specific taxation issues in any jurisdiction.

Competitive Alternatives, 2014 EditionB . 2
Federal, regional, and local tax rates – In percent
Adelaide Brisbane Melbourne Sydney Footnotes
Corporate Income Tax a a Percentage of taxable income. Minor adjustments required in the calculation of taxable income in each jurisdiction are not individually disclosed. Tax rates shown in this exhibit are for the size of entity examined in this study. Many jurisdictions offer lower income tax rates for small businesses.
b Manufacturing tax rate reductions may reduce on a pro-rata basis where a significant component of a company’s payroll or capital assets are not devoted to manufacturing or processing operations.
c The effective income tax rates for the overall average (services and manufacturing) in this study vary from the combined nominal income tax rates in each location due to the impact of adjustments to taxable income and income tax credits.
d Percentage of taxable capital, determined on the general basis indicated. In many jurisdictions, the general tax base indicated here is subject to minor adjustment.
e Percentage of sales price.
f General rate. Other rates may apply to specified articles.
g The Property Tax category includes all property-based taxes, including the property-based component of multi-base local business taxes. Property tax rates relate to the suburban or urban areas identified in the real estate research for this study as offering sites suitable for the types of operation being examined.
h Percentage of current market value, incorporating current tax rates, assessment factors, base-year price equalization factors, and rental yields (estimated where required).
i Percentage of depreciated value. Special depreciation rates may apply for property tax purposes.
j Percentage of cost.
k Total property-based taxes in US $ per square foot of building space. Property taxes include taxes levied on the value of land and buildings, machinery and equipment, inventory, and other physical assets. For services operations (occupying leased office space), property taxes on facilities are typically levied on the landlord. The amount of tax passed by the landlord to the tenant as part of total rent is captured in leasing costs in this study, but is not separately identifiable.
l Percentage of gross sales.
m Percentage of gross payroll.
n Tax per employee.
o Includes both state land tax (3.70%) and local council rates (0.76%). Land tax represents top marginal rate. Lower rates apply on the first AUD $1.05 million of land value.
p Includes both state land tax (2.00%) and local council rates (0.91%). Land tax represents top marginal rate. Lower rates apply on the first AUD $5 million of land value.
q Includes both state land tax (2.25%) and local council rates (0.92%). Land tax represents top marginal rate. Lower rates apply on the first AUD $3 million of land value.
r Includes both state land tax (2.00%) and local council rates (0.79%). Land tax represents top marginal rate. Lower rates apply on the first AUD $2.48 million of land value.
s State payroll tax of 4.95% (for Adelaide), 4.75% (for Brisbane), 4.90% (for Melbourne) and 5.45% (for Sydney) is not shown here as it is included under statutory plans in the labor analysis.
Federal 30.00 30.00 30.00 30.00
Regional – – – –
Local – – – –
Combined income tax rate 30.00 30.00 30.00 30.00
Manufacturing tax reduction b
Federal – – – –
Regional – – – –
Combined mfg tax rate 30.00 30.00 30.00 30.00
Effective income tax rate, overall average c 24.86 24.30 25.24 24.23
Capital Tax d
Tax based on:
Capital stock – – – –
Net equity – – – –
Total assets – – – –
Debt/borrowings – – – –
Sales Tax e
Refundable GST/VAT:
Federal f 10.00 10.00 10.00 10.00
Regional f – – – –
Non-refundable sales tax:
Regional f – – – –
Local f – – – –
Property Tax g
Land h 4.46o 2.91p 3.17q 2.79r
Buildings h 0.76 – 0.92 –
Machinery & equipment i – – – –
Inventory j – – – –
Total property-based taxes:
Mfg avg (12 operations) k $2.12 $1.75 $1.60 $2.16
Services avg (7 operations) k – – – –
Local Business Taxes
Taxes based on:
Gross receipts l – – – –
Salaries m –s –s –s –s
Employees n – – – –
Australia
KPMG’s Guide to International Business Location Costs B . 3
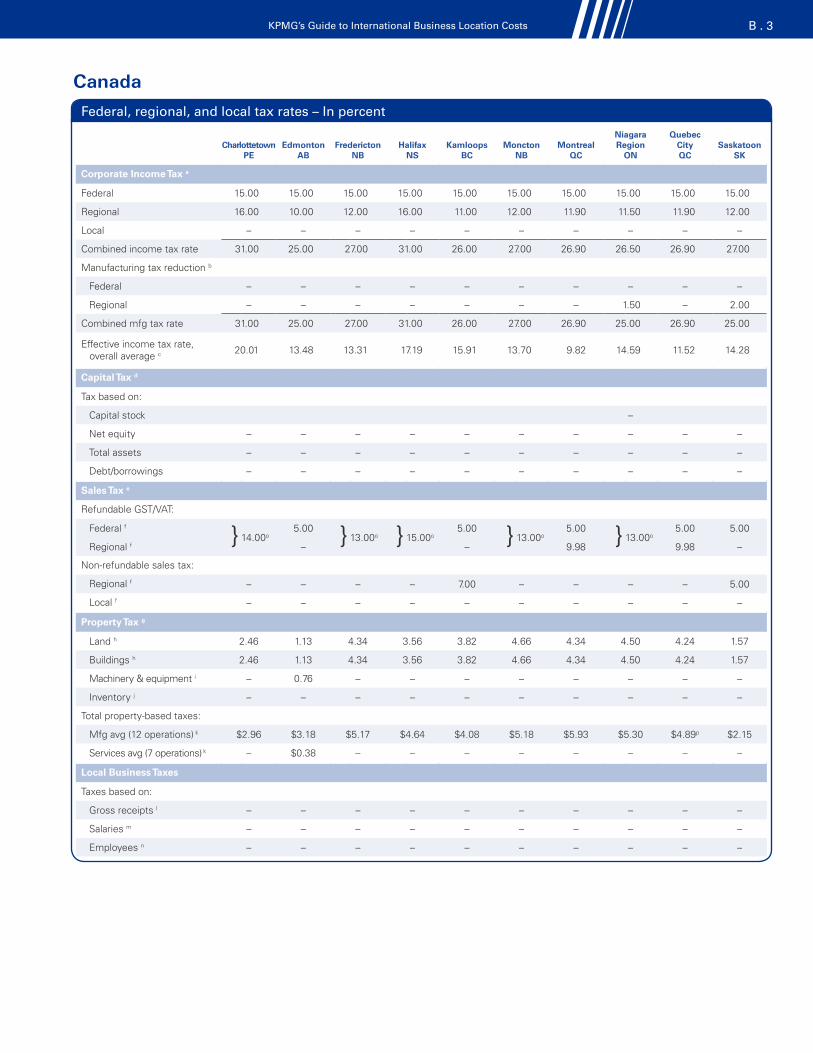
Federal, regional, and local tax rates – In percent
Charlottetown PE
Edmonton AB
Fredericton NB
Halifax NS
Kamloops BC
Moncton NB
Montreal QC
Niagara Region
ON
Quebec City QC
Saskatoon SK
Corporate Income Tax a
Federal 15.00 15.00 15.00 15.00 15.00 15.00 15.00 15.00 15.00 15.00
Regional 16.00 10.00 12.00 16.00 11.00 12.00 11.90 11.50 11.90 12.00
Local – – – – – – – – – –
Combined income tax rate 31.00 25.00 27.00 31.00 26.00 27.00 26.90 26.50 26.90 27.00
Manufacturing tax reduction b
Federal – – – – – – – – – –
Regional – – – – – – – 1.50 – 2.00
Combined mfg tax rate 31.00 25.00 27.00 31.00 26.00 27.00 26.90 25.00 26.90 25.00
Effective income tax rate, overall average c 20.01 13.48 13.31 17.19 15.91 13.70 9.82 14.59 11.52 14.28
Capital Tax d
Tax based on:
Capital stock –
Net equity – – – – – – – – – –
Total assets – – – – – – – – – –
Debt/borrowings – – – – – – – – – –
Sales Tax e
Refundable GST/VAT:
Federal f
} 14.00o5.00 } 13.00o } 15.00o
5.00 } 13.00o5.00 } 13.00o
5.00 5.00
Regional f – – 9.98 9.98 –
Non-refundable sales tax:
Regional f – – – – 7.00 – – – – 5.00
Local f – – – – – – – – – –
Property Tax g
Land h 2.46 1.13 4.34 3.56 3.82 4.66 4.34 4.50 4.24 1.57
Buildings h 2.46 1.13 4.34 3.56 3.82 4.66 4.34 4.50 4.24 1.57
Machinery & equipment i – 0.76 – – – – – – – –
Inventory j – – – – – – – – – –
Total property-based taxes:
Mfg avg (12 operations) k $2.96 $3.18 $5.17 $4.64 $4.08 $5.18 $5.93 $5.30 $4.89p $2.15
Services avg (7 operations) k – $0.38 – – – – – – – –
Local Business Taxes
Taxes based on:
Gross receipts l – – – – – – – – – –
Salaries m – – – – – – – – – –
Employees n – – – – – – – – – –
Canada
Competitive Alternatives, 2014 EditionB . 4
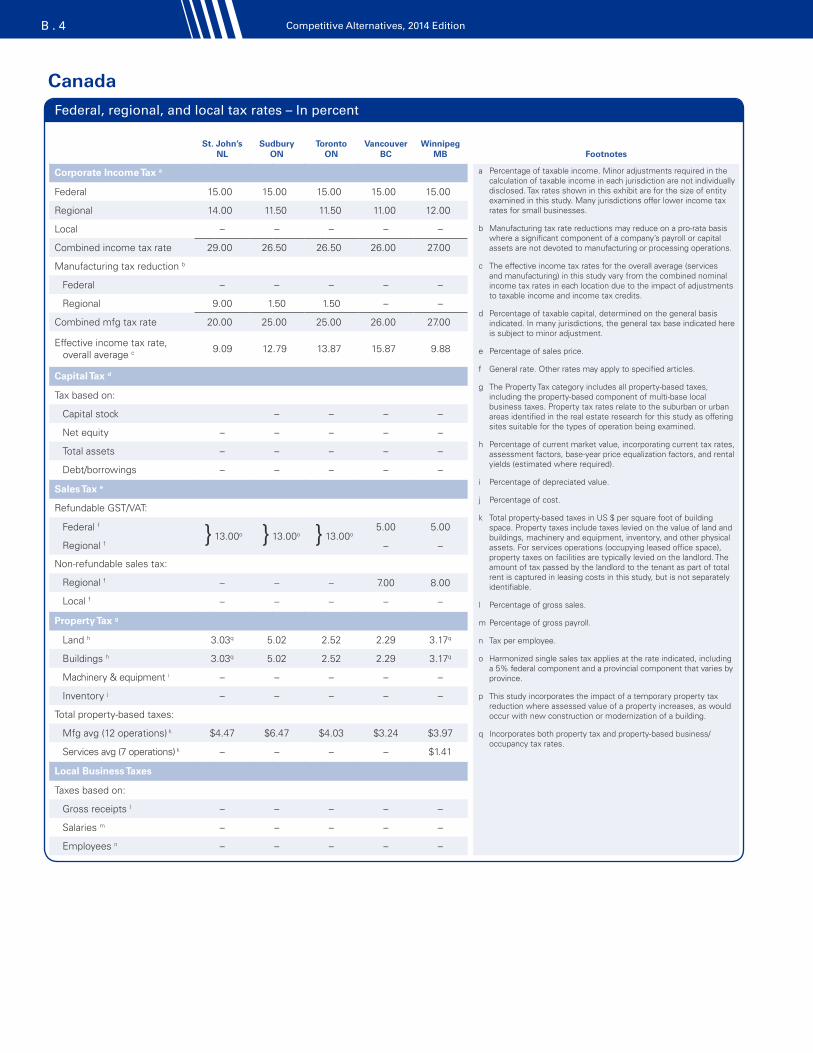
Federal, regional, and local tax rates – In percent
St. John’s NL
Sudbury ON
Toronto ON
Vancouver BC
Winnipeg MB Footnotes
Corporate Income Tax a a Percentage of taxable income. Minor adjustments required in the calculation of taxable income in each jurisdiction are not individually disclosed. Tax rates shown in this exhibit are for the size of entity examined in this study. Many jurisdictions offer lower income tax rates for small businesses.
b Manufacturing tax rate reductions may reduce on a pro-rata basis where a significant component of a company’s payroll or capital assets are not devoted to manufacturing or processing operations.
c The effective income tax rates for the overall average (services and manufacturing) in this study vary from the combined nominal income tax rates in each location due to the impact of adjustments to taxable income and income tax credits.
d Percentage of taxable capital, determined on the general basis indicated. In many jurisdictions, the general tax base indicated here is subject to minor adjustment.
e Percentage of sales price.
f General rate. Other rates may apply to specified articles.
g The Property Tax category includes all property-based taxes, including the property-based component of multi-base local business taxes. Property tax rates relate to the suburban or urban areas identified in the real estate research for this study as offering sites suitable for the types of operation being examined.
h Percentage of current market value, incorporating current tax rates, assessment factors, base-year price equalization factors, and rental yields (estimated where required).
i Percentage of depreciated value.
j Percentage of cost.
k Total property-based taxes in US $ per square foot of building space. Property taxes include taxes levied on the value of land and buildings, machinery and equipment, inventory, and other physical assets. For services operations (occupying leased office space), property taxes on facilities are typically levied on the landlord. The amount of tax passed by the landlord to the tenant as part of total rent is captured in leasing costs in this study, but is not separately identifiable.
l Percentage of gross sales.
m Percentage of gross payroll.
n Tax per employee.
o Harmonized single sales tax applies at the rate indicated, including a 5% federal component and a provincial component that varies by province.
p This study incorporates the impact of a temporary property tax reduction where assessed value of a property increases, as would occur with new construction or modernization of a building.
q Incorporates both property tax and property-based business/occupancy tax rates.
Federal 15.00 15.00 15.00 15.00 15.00
Regional 14.00 11.50 11.50 11.00 12.00
Local – – – – –
Combined income tax rate 29.00 26.50 26.50 26.00 27.00
Manufacturing tax reduction b
Federal – – – – –
Regional 9.00 1.50 1.50 – –
Combined mfg tax rate 20.00 25.00 25.00 26.00 27.00
Effective income tax rate, overall average c 9.09 12.79 13.87 15.87 9.88
Capital Tax d
Tax based on:
Capital stock – – – –
Net equity – – – – –
Total assets – – – – –
Debt/borrowings – – – – –
Sales Tax e
Refundable GST/VAT:
Federal f
} 13.00o } 13.00o } 13.00o5.00 5.00
Regional f – –
Non-refundable sales tax:
Regional f – – – 7.00 8.00
Local f – – – – –
Property Tax g
Land h 3.03q 5.02 2.52 2.29 3.17q
Buildings h 3.03q 5.02 2.52 2.29 3.17q
Machinery & equipment i – – – – –
Inventory j – – – – –
Total property-based taxes:
Mfg avg (12 operations) k $4.47 $6.47 $4.03 $3.24 $3.97
Services avg (7 operations) k – – – – $1.41
Local Business Taxes
Taxes based on:
Gross receipts l – – – – –
Salaries m – – – – –
Employees n – – – – –
Canada

KPMG’s Guide to International Business Location Costs B . 5
Federal, regional, and local tax rates – In percent
Marseille Paris Footnotes
Corporate Income Tax a a Percentage of taxable income. Minor adjustments required in the calculation of taxable income in each jurisdiction are not individually disclosed. Tax rates shown in this exhibit are for the size of entity examined in this study. Many jurisdictions offer lower income tax rates for small businesses.
b Manufacturing tax rate reductions may reduce on a pro-rata basis where a significant component of a company’s payroll or capital assets are not devoted to manufacturing or processing operations.
c The effective income tax rates for the overall average (services and manufacturing) in this study vary from the combined nominal income tax rates in each location due to the impact of adjustments to taxable income and income tax credits.
d Percentage of taxable capital, determined on the general basis indicated. In many jurisdictions, the general tax base indicated here is subject to minor adjustment.
e Percentage of sales price.
f General rate. Other rates may apply to specified articles.
g The Property Tax category includes all property-based taxes, including the property-based component of multi-base local business taxes. Property tax rates relate to the suburban or urban areas identified in the real estate research for this study as offering sites suitable for the types of operation being examined.
h Percentage of current market value, incorporating current tax rates, assessment factors, base-year price equalization factors, and rental yields (estimated where required).
i Percentage of depreciated value. Special depreciation rates may apply for property tax purposes.
j Percentage of cost.
k Total property-based taxes in US $ per square foot of building space. Property taxes include taxes levied on the value of land and buildings, machinery and equipment, inventory, and other physical assets. For services operations (occupying leased office space), property taxes on facilities are typically levied on the landlord. The amount of tax passed by the landlord to the tenant as part of total rent is captured in leasing costs in this study, but is not separately identifiable.
l Percentage of gross sales.
m Percentage of gross payroll.
n Tax per employee.
o One-time tax on share issuance.
p Includes both Tax on Developed Properties (TFPB) and Contribution for Enterprise Land Value (CFE), both of which are based on property rental value. CFE is levied directly on the lessee of leased properties.
q Contribution for Enterprise Value Added (CVAE), top marginal rate. Lower rates apply to companies with sales turnover of less than €50 million per annum. Tax base is value added, which is calculated as gross receipts less limited specified deductions.
r Total CFE plus CVAE is capped at 3% of value added as assessed for CVAE.
Federal 33.33 33.33
Regional – –
Local – –
Combined income tax rate 33.33 33.33
Manufacturing tax reduction b
Federal – –
Regional – –
Combined mfg tax rate 33.33 33.33
Effective income tax rate, overall average c 16.65 12.71
Capital Tax d
Tax based on:
Capital stock 0.10o 0.10o
Net equity – –
Total assets – –
Debt/borrowings – –
Sales Tax e
Refundable GST/VAT:
Federal f 20.00 20.00
Regional f – –
Non-refundable sales tax:
Regional f – –
Local f – –
Property Tax g
Land h 3.93p 1.68p
Buildings h 3.93p 1.68p
Machinery & equipment i – –
Inventory j – –
Total property-based taxes:
Mfg avg (12 operations) k $3.82r $1.78r
Services avg (7 operations) k $7.69r $10.46r
Local Business Taxes
Taxes based on:
Gross receipts l 1.50q 1.50q
Salaries m – –
Employees n – –
France
Competitive Alternatives, 2014 EditionB . 6
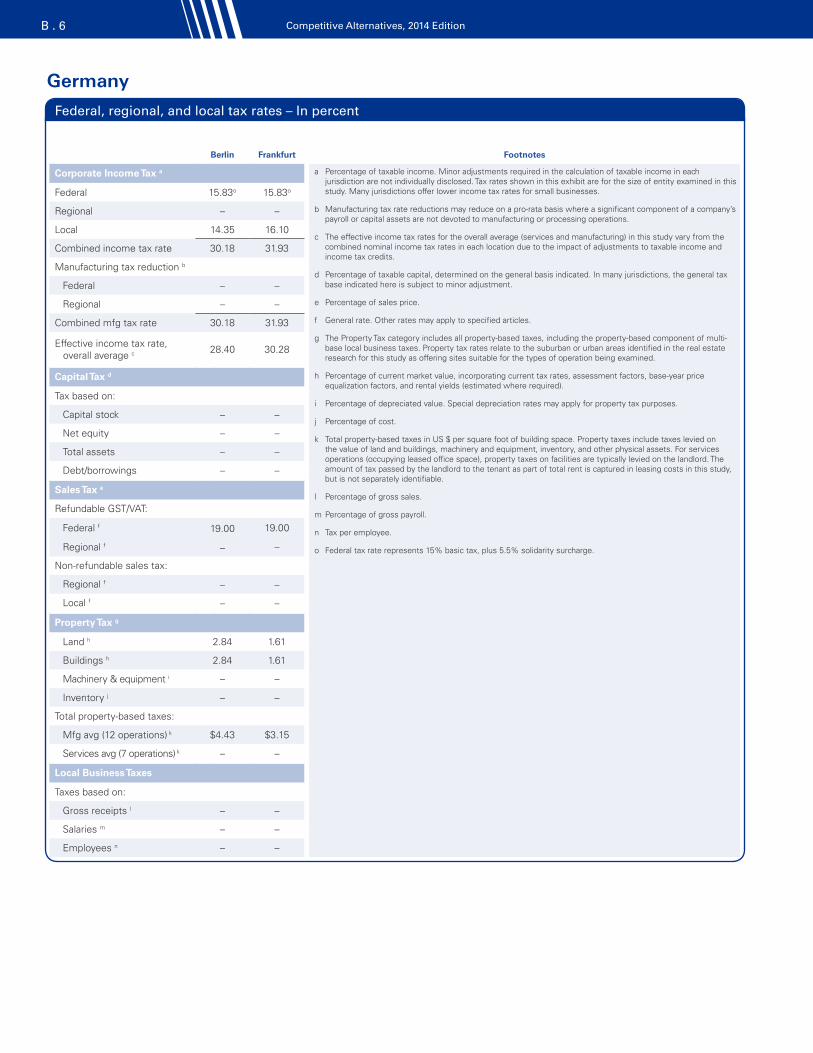
Federal, regional, and local tax rates – In percent
Berlin Frankfurt Footnotes
Corporate Income Tax a a Percentage of taxable income. Minor adjustments required in the calculation of taxable income in each jurisdiction are not individually disclosed. Tax rates shown in this exhibit are for the size of entity examined in this study. Many jurisdictions offer lower income tax rates for small businesses.
b Manufacturing tax rate reductions may reduce on a pro-rata basis where a significant component of a company’s payroll or capital assets are not devoted to manufacturing or processing operations.
c The effective income tax rates for the overall average (services and manufacturing) in this study vary from the combined nominal income tax rates in each location due to the impact of adjustments to taxable income and income tax credits.
d Percentage of taxable capital, determined on the general basis indicated. In many jurisdictions, the general tax base indicated here is subject to minor adjustment.
e Percentage of sales price.
f General rate. Other rates may apply to specified articles.
g The Property Tax category includes all property-based taxes, including the property-based component of multi-base local business taxes. Property tax rates relate to the suburban or urban areas identified in the real estate research for this study as offering sites suitable for the types of operation being examined.
h Percentage of current market value, incorporating current tax rates, assessment factors, base-year price equalization factors, and rental yields (estimated where required).
i Percentage of depreciated value. Special depreciation rates may apply for property tax purposes.
j Percentage of cost.
k Total property-based taxes in US $ per square foot of building space. Property taxes include taxes levied on the value of land and buildings, machinery and equipment, inventory, and other physical assets. For services operations (occupying leased office space), property taxes on facilities are typically levied on the landlord. The amount of tax passed by the landlord to the tenant as part of total rent is captured in leasing costs in this study, but is not separately identifiable.
l Percentage of gross sales.
m Percentage of gross payroll.
n Tax per employee.
o Federal tax rate represents 15% basic tax, plus 5.5% solidarity surcharge.
Federal 15.83o 15.83o
Regional – –
Local 14.35 16.10
Combined income tax rate 30.18 31.93
Manufacturing tax reduction b
Federal – –
Regional – –
Combined mfg tax rate 30.18 31.93
Effective income tax rate, overall average c 28.40 30.28
Capital Tax d
Tax based on:
Capital stock – –
Net equity – –
Total assets – –
Debt/borrowings – –
Sales Tax e
Refundable GST/VAT:
Federal f 19.00 19.00
Regional f – –
Non-refundable sales tax:
Regional f – –
Local f – –
Property Tax g
Land h 2.84 1.61
Buildings h 2.84 1.61
Machinery & equipment i – –
Inventory j – –
Total property-based taxes:
Mfg avg (12 operations) k $4.43 $3.15
Services avg (7 operations) k – –
Local Business Taxes
Taxes based on:
Gross receipts l – –
Salaries m – –
Employees n – –
Germany

KPMG’s Guide to International Business Location Costs B . 7
Federal, regional, and local tax rates – In percent
Milan Rome Footnotes
Corporate Income Tax a a Percentage of taxable income. Minor adjustments required in the calculation of taxable income in each jurisdiction are not individually disclosed. Tax rates shown in this exhibit are for the size of entity examined in this study. Many jurisdictions offer lower income tax rates for small businesses.
b Manufacturing tax rate reductions may reduce on a pro-rata basis where a significant component of a company’s payroll or capital assets are not devoted to manufacturing or processing operations.
c The effective income tax rates for the overall average (services and manufacturing) in this study vary from the combined nominal income tax rates in each location due to the impact of adjustments to taxable income and income tax credits.
d Percentage of taxable capital, determined on the general basis indicated. In many jurisdictions, the general tax base indicated here is subject to minor adjustment.
e Percentage of sales price.
f General rate. Other rates may apply to specified articles.
g The Property Tax category includes all property-based taxes, including the property-based component of multi-base local business taxes. Property tax rates relate to the suburban or urban areas identified in the real estate research for this study as offering sites suitable for the types of operation being examined.
h Percentage of current market value, incorporating current tax rates, assessment factors, base-year price equalization factors, and rental yields (estimated where required).
i Percentage of depreciated value. Special depreciation rates may apply for property tax purposes.
j Percentage of cost.
k Total property-based taxes in US $ per square foot of building space. Property taxes include taxes levied on the value of land and buildings, machinery and equipment, inventory, and other physical assets. For services operations (occupying leased office space), property taxes on facilities are typically levied on the landlord. The amount of tax passed by the landlord to the tenant as part of total rent is captured in leasing costs in this study, but is not separately identifiable.
l Percentage of gross sales.
m Percentage of gross payroll.
n Tax per employee.
o Deductions for payroll and interest costs are limited for Italian Regional Tax on Productive Activities (IRAP). This results in a higher taxable income base for IRAP purposes than for most other income taxes listed in this Appendix.
p In calculating the combined tax rate, regional tax paid is deductible for federal tax calculations to the extent that regional tax liability reflects non-deductible labor costs. The actual percentage federal deduction for regional tax paid varies by company and by year. The combined tax rate shown assumes a 50 percent federal deduction for regional tax paid. Therefore, the regional tax rate has been reduced by (1 - (federal tax rate x 50%)) to determine the combined rate.
q One-time tax on issuance of medium and long term loans.
r Local tax on immovable property tax (IMU) is intended to be repealed and replaced by alternative forms of local tax as of January 2014. However, as at January 2014 the form of such new taxes is subject to significant uncertainty, so this analysis continues to reflect the IMU tax in effect for 2013. IMU is based on imputed income value of a property as determined by the Immovable Property Registry. The rates shown here represent the estimated tax rate as a percentage of property fair market value, based on the assumption that for owned facilities imputed income represents 1.495% of fair market value. For leased facilities, imputed income is assumed to equal actual lease payments.
Federal 27.50 27.50
Regional 3.90o 4.82o
Local – –
Combined income tax rate 30.86p 31.66p
Manufacturing tax reduction b
Federal – –
Regional – –
Combined mfg tax rate 30.86 31.66
Effective income tax rate, overall average c 27.84 31.07
Capital Tax d
Tax based on:
Capital stock – –
Net equity – –
Total assets – –
Debt/borrowings 0.25q 0.25q
Sales Tax e
Refundable GST/VAT:
Federal f 22.00 22.00
Regional f – –
Non-refundable sales tax:
Regional f – –
Local f – –
Property Tax g
Land h 1.06r 1.06r
Buildings h 0.89r 1.08r
Machinery & equipment i – –
Inventory j – –
Total property-based taxes:
Mfg avg (12 operations) k $1.04 $1.90
Services avg (7 operations) k $3.29 $3.43
Local Business Taxes
Taxes based on:
Gross receipts l – –
Salaries m – –
Employees n – –
Italy
Competitive Alternatives, 2014 EditionB . 8
Federal, regional, and local tax rates – In percent
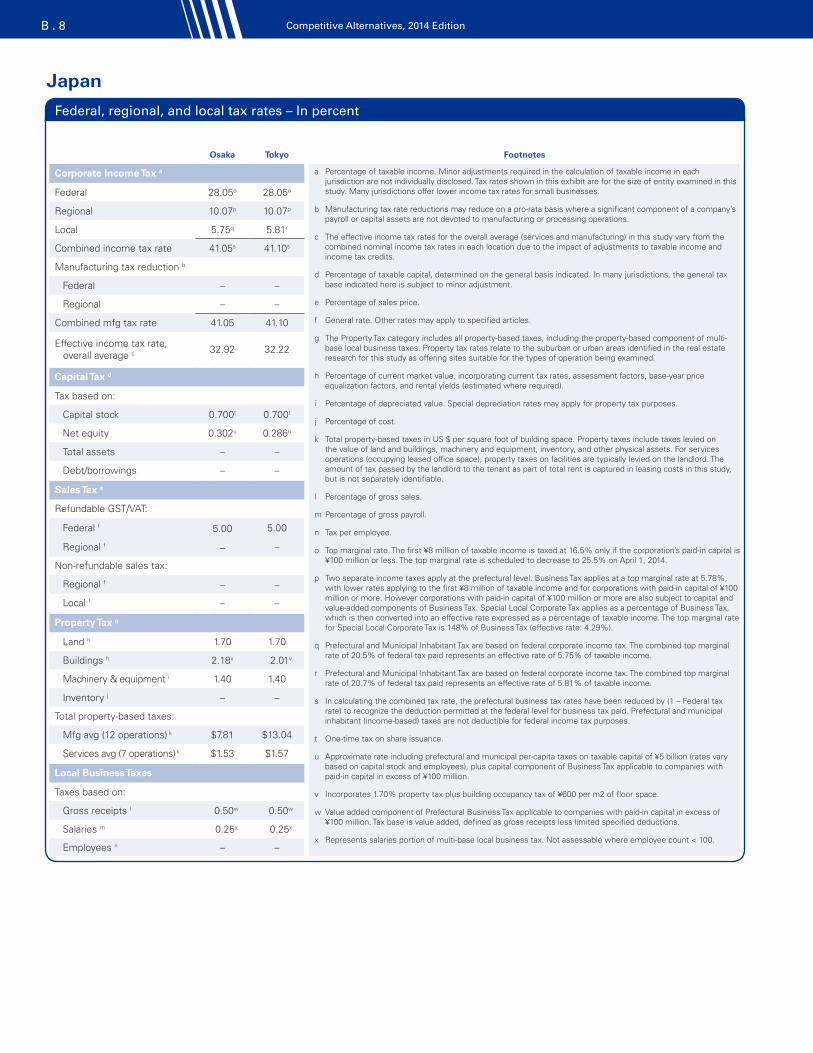
Osaka Tokyo Footnotes
Corporate Income Tax a a Percentage of taxable income. Minor adjustments required in the calculation of taxable income in each jurisdiction are not individually disclosed. Tax rates shown in this exhibit are for the size of entity examined in this study. Many jurisdictions offer lower income tax rates for small businesses.
b Manufacturing tax rate reductions may reduce on a pro-rata basis where a significant component of a company’s payroll or capital assets are not devoted to manufacturing or processing operations.
c The effective income tax rates for the overall average (services and manufacturing) in this study vary from the combined nominal income tax rates in each location due to the impact of adjustments to taxable income and income tax credits.
d Percentage of taxable capital, determined on the general basis indicated. In many jurisdictions, the general tax base indicated here is subject to minor adjustment.
e Percentage of sales price.
f General rate. Other rates may apply to specified articles.
g The Property Tax category includes all property-based taxes, including the property-based component of multi-base local business taxes. Property tax rates relate to the suburban or urban areas identified in the real estate research for this study as offering sites suitable for the types of operation being examined.
h Percentage of current market value, incorporating current tax rates, assessment factors, base-year price equalization factors, and rental yields (estimated where required).
i Percentage of depreciated value. Special depreciation rates may apply for property tax purposes.
j Percentage of cost.
k Total property-based taxes in US $ per square foot of building space. Property taxes include taxes levied on the value of land and buildings, machinery and equipment, inventory, and other physical assets. For services operations (occupying leased office space), property taxes on facilities are typically levied on the landlord. The amount of tax passed by the landlord to the tenant as part of total rent is captured in leasing costs in this study, but is not separately identifiable.
l Percentage of gross sales.
m Percentage of gross payroll.
n Tax per employee.
o Top marginal rate. The first ¥8 million of taxable income is taxed at 16.5% only if the corporation’s paid-in capital is ¥100 million or less. The top marginal rate is scheduled to decrease to 25.5% on April 1, 2014.
p Two separate income taxes apply at the prefectural level. Business Tax applies at a top marginal rate at 5.78%, with lower rates applying to the first ¥8 million of taxable income and for corporations with paid-in capital of ¥100 million or more. However corporations with paid-in capital of ¥100 million or more are also subject to capital and value-added components of Business Tax. Special Local Corporate Tax applies as a percentage of Business Tax, which is then converted into an effective rate expressed as a percentage of taxable income. The top marginal rate for Special Local Corporate Tax is 148% of Business Tax (effective rate: 4.29%).
q Prefectural and Municipal Inhabitant Tax are based on federal corporate income tax. The combined top marginal rate of 20.5% of federal tax paid represents an effective rate of 5.75% of taxable income.
r Prefectural and Municipal Inhabitant Tax are based on federal corporate income tax. The combined top marginal rate of 20.7% of federal tax paid represents an effective rate of 5.81% of taxable income.
s In calculating the combined tax rate, the prefectural business tax rates have been reduced by (1 – Federal tax rate) to recognize the deduction permitted at the federal level for business tax paid. Prefectural and municipal inhabitant (income-based) taxes are not deductible for federal income tax purposes.
t One-time tax on share issuance.
u Approximate rate including prefectural and municipal per-capita taxes on taxable capital of ¥5 billion (rates vary based on capital stock and employees), plus capital component of Business Tax applicable to companies with paid-in capital in excess of ¥100 million.
v Incorporates 1.70% property tax plus building occupancy tax of ¥600 per m2 of floor space.
w Value added component of Prefectural Business Tax applicable to companies with paid-in capital in excess of ¥100 million. Tax base is value added, defined as gross receipts less limited specified deductions.
x Represents salaries portion of multi-base local business tax. Not assessable where employee count < 100.
Federal 28.05o 28.05o
Regional 10.07p 10.07p
Local 5.75q 5.81r
Combined income tax rate 41.05s 41.10s
Manufacturing tax reduction b
Federal – –
Regional – –
Combined mfg tax rate 41.05 41.10
Effective income tax rate, overall average c 32.92 32.22
Capital Tax d
Tax based on:
Capital stock 0.700t 0.700t
Net equity 0.302u 0.286u
Total assets – –
Debt/borrowings – –
Sales Tax e
Refundable GST/VAT:
Federal f 5.00 5.00
Regional f – –
Non-refundable sales tax:
Regional f – –
Local f – –
Property Tax g
Land h 1.70 1.70
Buildings h 2.18v 2.01v
Machinery & equipment i 1.40 1.40
Inventory j – –
Total property-based taxes:
Mfg avg (12 operations) k $7.81 $13.04
Services avg (7 operations) k $1.53 $1.57
Local Business Taxes
Taxes based on:
Gross receipts l 0.50w 0.50w
Salaries m 0.25x 0.25x
Employees n – –
Japan

KPMG’s Guide to International Business Location Costs B . 9
Federal, regional, and local tax rates – In percent
Mexico City Monterrey Footnotes
Corporate Income Tax a a Percentage of taxable income. Minor adjustments required in the calculation of taxable income in each jurisdiction are not individually disclosed. Tax rates shown in this exhibit are for the size of entity examined in this study. Many jurisdictions offer lower income tax rates for small businesses.
b Manufacturing tax rate reductions may reduce on a pro-rata basis where a significant component of a company’s payroll or capital assets are not devoted to manufacturing or processing operations.
c The effective income tax rates for the overall average (services and manufacturing) in this study vary from the combined nominal income tax rates in each location due to the impact of adjustments to taxable income and income tax credits.
d Percentage of taxable capital, determined on the general basis indicated. In many jurisdictions, the general tax base indicated here is subject to minor adjustment.
e Percentage of sales price.
f General rate. Other rates may apply to specified articles.
g The Property Tax category includes all property-based taxes, including the property-based component of multi-base local business taxes. Property tax rates relate to the suburban or urban areas identified in the real estate research for this study as offering sites suitable for the types of operation being examined.
h Percentage of current market value, incorporating current tax rates, assessment factors, base-year price equalization factors, and rental yields (estimated where required).
i Percentage of depreciated value. Special depreciation rates may apply for property tax purposes.
j Percentage of cost.
k Total property-based taxes in US $ per square foot of building space. Property taxes include taxes levied on the value of land and buildings, machinery and equipment, inventory, and other physical assets. For services operations (occupying leased office space), property taxes on facilities are typically levied on the landlord. The amount of tax passed by the landlord to the tenant as part of total rent is captured in leasing costs in this study, but is not separately identifiable.
l Percentage of gross sales.
m Percentage of gross payroll.
n Tax per employee.
o Exemption of 45% applies for new companies for the first year of operation. A further 25% exemption applies in any future year where the number of employees increases by at least 25% compared to the prior year.
p Full exemption applies for new companies for the first four years of operation.
Federal 30.00 30.00
Regional – –
Local – –
Combined income tax rate 30.00 30.00
Manufacturing tax reduction b
Federal – –
Regional – –
Combined mfg tax rate 30.00 30.00
Effective income tax rate, overall average c 30.91 30.81
Capital Tax d
Tax based on:
Capital stock – –
Net equity – –
Total assets – –
Debt/borrowings – –
Sales Tax e
Refundable GST/VAT:
Federal f 16.00 16.00
Regional f – –
Non-refundable sales tax:
Regional f – –
Local f – –
Property Tax g
Land h 0.15 0.20
Buildings h 0.15 0.20
Machinery & equipment i – –
Inventory j – –
Total property-based taxes:
Mfg avg (12 operations) k $0.08 $0.10
Services avg (7 operations) k – –
Local Business Taxes
Taxes based on:
Gross receipts l – –
Salaries m 2.50o 3.00p
Employees n – –
Mexico

Competitive Alternatives, 2014 EditionB . 10
Federal, regional, and local tax rates – In percent
EindhovenTwente Region Footnotes
Corporate Income Tax a a Percentage of taxable income. Minor adjustments required in the calculation of taxable income in each jurisdiction are not individually disclosed. Tax rates shown in this exhibit are for the size of entity examined in this study. Many jurisdictions offer lower income tax rates for small businesses.
b Manufacturing tax rate reductions may reduce on a pro-rata basis where a significant component of a company’s payroll or capital assets are not devoted to manufacturing or processing operations.
c The effective income tax rates for the overall average (services and manufacturing) in this study vary from the combined nominal income tax rates in each location due to the impact of adjustments to taxable income and income tax credits.
d Percentage of taxable capital, determined on the general basis indicated. In many jurisdictions, the general tax base indicated here is subject to minor adjustment.
e Percentage of sales price.
f General rate. Other rates may apply to specified articles.
g The Property Tax category includes all property-based taxes, including the property-based component of multi-base local business taxes. Property tax rates relate to the suburban or urban areas identified in the real estate research for this study as offering sites suitable for the types of operation being examined.
h Percentage of current market value, incorporating current tax rates, assessment factors, base-year price equalization factors, and rental yields (estimated where required).
i Percentage of depreciated value. Special depreciation rates may apply for property tax purposes.
j Percentage of cost.
k Total property-based taxes in US $ per square foot of building space. Property taxes include taxes levied on the value of land and buildings, machinery and equipment, inventory, and other physical assets. For services operations (occupying leased office space), property taxes on facilities are typically levied on the landlord. The amount of tax passed by the landlord to the tenant as part of total rent is captured in leasing costs in this study, but is not separately identifiable.
l Percentage of gross sales.
m Percentage of gross payroll.
n Tax per employee.
o Top marginal rate. The first €200,000 of taxable income is taxed at 20%.
p The benefits provided under the Netherlands’ R&D employee wage tax withholding program are netted into the calculation of effective income tax rate.
q Incorporates real estate taxes levied on both property owners and property occupants.
Federal 25.00o 25.00o
Regional – –
Local – –
Combined income tax rate 25.00 25.00
Manufacturing tax reduction b
Federal – –
Regional – –
Combined mfg tax rate 25.00 25.00
Effective income tax rate, overall average c 18.52p 18.45p
Capital Tax d
Tax based on:
Capital stock – –
Net equity – –
Total assets – –
Debt/borrowings – –
Sales Tax e
Refundable GST/VAT:
Federal f 21.00 21.00
Regional f – –
Non-refundable sales tax:
Regional f – –
Local f – –
Property Tax g
Land h 0.32q 0.54q
Buildings h 0.32q 0.54q
Machinery & equipment i – –
Inventory j – –
Total property-based taxes:
Mfg avg (12 operations) k $0.43 $0.62
Services avg (7 operations) k $0.22 $0.36
Local Business Taxes
Taxes based on:
Gross receipts l – –
Salaries m – –
Employees n – –
Netherlands

KPMG’s Guide to International Business Location Costs B . 11
Federal, regional, and local tax rates – In percent
London Manchester Footnotes
Corporate Income Tax a a Percentage of taxable income. Minor adjustments required in the calculation of taxable income in each jurisdiction are not individually disclosed. Tax rates shown in this exhibit are for the size of entity examined in this study. Many jurisdictions offer lower income tax rates for small businesses.
b Manufacturing tax rate reductions may reduce on a pro-rata basis where a significant component of a company’s payroll or capital assets are not devoted to manufacturing or processing operations.
c The effective income tax rates for the overall average (services and manufacturing) in this study vary from the combined nominal income tax rates in each location due to the impact of adjustments to taxable income and income tax credits.
d Percentage of taxable capital, determined on the general basis indicated. In many jurisdictions, the general tax base indicated here is subject to minor adjustment.
e Percentage of sales price.
f General rate. Other rates may apply to specified articles.
g The Property Tax category includes all property-based taxes, including the property-based component of multi-base local business taxes. Property tax rates relate to the suburban or urban areas identified in the real estate research for this study as offering sites suitable for the types of operation being examined.
h Percentage of current market value, incorporating current tax rates, assessment factors, base-year price equalization factors, and rental yields (estimated where required).
i Percentage of depreciated value. Special depreciation rates may apply for property tax purposes.
j Percentage of cost.
k Total property-based taxes in US $ per square foot of building space. Property taxes include taxes levied on the value of land and buildings, machinery and equipment, inventory, and other physical assets. For services operations (occupying leased office space), property taxes on facilities are typically levied on the landlord. The amount of tax passed by the landlord to the tenant as part of total rent is captured in leasing costs in this study, but is not separately identifiable.
l Percentage of gross sales.
m Percentage of gross payroll.
n Tax per employee.
o Top marginal tax rate applies where taxable income exceeds £1.5 million. If taxable income is below £300,000, the tax rate is 20%, while a pro-rated tax rate of between 20% and 23% applies if taxable income is between £300,000 and £1.5 million.
p The top marginal rate is scheduled to decrease by 2% to 21% on April 1 2014, and then by a further 1% to 20% on April 1 2015.
Federal 23.00o,p 23.00o,p
Regional –
Local – –
Combined income tax rate 23.00 23.00
Manufacturing tax reduction b
Federal – –
Regional – –
Combined mfg tax rate 23.00 23.00
Effective income tax rate, overall average c 12.70 16.36
Capital Tax d
Tax based on:
Capital stock – –
Net equity – –
Total assets – –
Debt/borrowings – –
Sales Tax e
Refundable GST/VAT:
Federal f 20.00 20.00
Regional f – –
Non-refundable sales tax:
Regional f – –
Local f – –
Property Tax g
Land h 4.75 4.71
Buildings h 4.75 4.71
Machinery & equipment i – –
Inventory j – –
Total property-based taxes:
Mfg avg (12 operations) k $9.48 $4.58
Services avg (7 operations) k – –
Local Business Taxes
Taxes based on:
Gross receipts l – –
Salaries m – –
Employees n – –
United Kingdom

Competitive Alternatives, 2014 EditionB . 12
Federal, regional, and local tax rates – In percent
Albuquerque NM
Anchorage AK
Atlanta GA
Austin TX
Baltimore MD
Bangor ME
Baton Rouge
LABeaumont
TXBillings
MTBoise
ID
Corporate Income Tax a
Federal 34.00o 34.00o 34.00o 34.00o 34.00o 34.00o 34.00o 34.00o 34.00o 34.00o
Regional 7.30s 9.40s 6.00q 0.98q,v 8.25q 8.93q,s 8.00q,s 0.98q,v 6.75 7.40
Local – – – – – – – – – –
Combined income tax rate 38.29z,aa 40.20z 37.60z,aa 34.64z 39.45z 39.89z 36.56z,ac 34.64z 38.46z 38.88z
Manufacturing tax reduction b
Federal 2.85p 2.77p 3.06p 3.06p 3.06p 3.06p 2.82p 3.06p 2.85p 2.83p
Regional 0.61p 0.85p – – – – 0.72p – 0.61p 0.67p
Combined mfg tax rate 34.82 36.59 34.54 31.58 36.39 36.83 33.02 31.58 34.99 35.38
Effective income tax rate, overall average c 23.31 40.30ad 25.20 27.36 28.48 28.89 19.23 27.66 31.59 30.88
Capital Tax d
Tax based on:
Capital stock – – – – – – – – – –
Net equity – – 0.030af – – – – – – –
Total assets – – – – – – 0.300ap – – –
Debt/borrowings – – – – – – – – – –
Sales Tax e
Refundable GST/VAT:
Federal f – – – – – – – – – –
Regional f – – – – – – – – – –
Non-refundable sales tax:
Regional f 5.13 – 4.00 6.25 6.00 5.50 4.00 6.25 – 6.00
Local f 1.88 – 2.75 2.00 – – 5.00 2.00 – –
Property Tax g
Land h 1.73 1.56 1.37 2.41 1.55 1.97 1.06 2.69 1.22 1.82
Buildings h 1.73 1.56 1.37 2.41 1.55 1.97 1.59bk 2.69 1.22 1.82
Machinery & equipment i 1.73 1.56 1.37 2.41 3.43bq 1.97at 1.59bk 2.69 1.22 1.82
Inventory j – 1.56 1.37bp 2.41bp – – 1.59br 2.69bp – –
Total property-based taxes:
Mfg avg (12 operations) k $4.97 $6.30 $3.85 $6.77 $1.92 $2.39 $1.17 $7.47 $3.60 $5.29
Services avg (7 operations) k $0.88 $0.79 $0.70 $1.22 $1.20 $0.12 $0.80 $1.37 $0.62 $0.93
Local Business Taxes
Taxes based on:
Gross receipts l – – – – – – – – – –
Salaries m – – – – – – – – – –
Employees n – – – – – – – – – –
United States

KPMG’s Guide to International Business Location Costs B . 13
Federal, regional, and local tax rates – In percent
Boston MA
Buffalo NY
Burlington VT
Cedar Rapids
IA
Champaign- Urbana
ILCharleston
WVCharlotte
NCCheyenne
WYChicago
ILCincinnati
OH
Corporate Income Tax a
Federal 34.00o 34.00o 34.00o 34.00o 34.00o 34.00o 34.00o 34.00o 34.00o 34.00o
Regional 8.00 7.10q,r 8.50s 12.00q,s 9.50t 6.50 6.00q,bh – 9.50t –
Local – – – – – – – – – 1.50bo
Combined income tax rate 39.28z 38.69z 39.61z 39.88z,ab 40.27z 38.29z 37.96z 34.00 40.27z 34.99z
Manufacturing tax reduction b
Federal 3.06p 3.06p 2.80p 2.69p 2.77p 3.06p 3.06p 3.06p 2.77p 3.06p
Regional – 1.20bc 0.77p 1.08p 0.86p – – – 0.86p –
Combined mfg tax rate 36.22 34.43 36.05 36.11 36.65 35.23 34.90 30.94 36.65 31.93
Effective income tax rate, overall average c 28.97 29.34 31.50 27.95 31.84 29.01 28.99 27.88 30.31 25.96
Capital Tax d
Tax based on:
Capital stock – – – – 0.100ah – – – 0.100ah –
Net equity – 0.150r – – – 0.100bi – – – –
Total assets 0.260ag – – – – – 0.150bd 0.020 – –
Debt/borrowings – – – – – – – – – –
Sales Tax e
Refundable GST/VAT:
Federal f – – – – – – – – – –
Regional f – – – – – – – – – –
Non-refundable sales tax:
Regional f 6.25 4.00 6.00 6.00 6.25 6.00 4.75 4.00 6.25 5.75
Local f – 4.75 0.67 1.00 2.50 0.50 2.50 2.00 2.31 0.88
Property Tax g
Land h 2.86 3.52 1.87 3.91 2.76 1.73 1.33 0.89 3.12 2.38
Buildings h 2.86 3.52 1.87 3.91 2.76 1.73 1.33 0.89 3.12 2.38
Machinery & equipment i 2.86ar – 1.87 – – 1.73 1.33 0.89 – –
Inventory j – – – – – 1.73 – – – –
Total property-based taxes:
Mfg avg (12 operations) k $3.51 $3.87 $5.54 $3.78 $2.99 $6.10 $3.68 $2.63 $4.21 $2.12
Services avg (7 operations) k $1.45 – $0.95 – – $0.88 $0.68 $0.45 – –
Local Business Taxes
Taxes based on:
Gross receipts l – – – – – 1.00ax – – – 0.26u
Salaries m – – – – – – – – – –
Employees n – – – – – – – – – –
United States
Competitive Alternatives, 2014 EditionB . 14
Federal, regional, and local tax rates – In percent
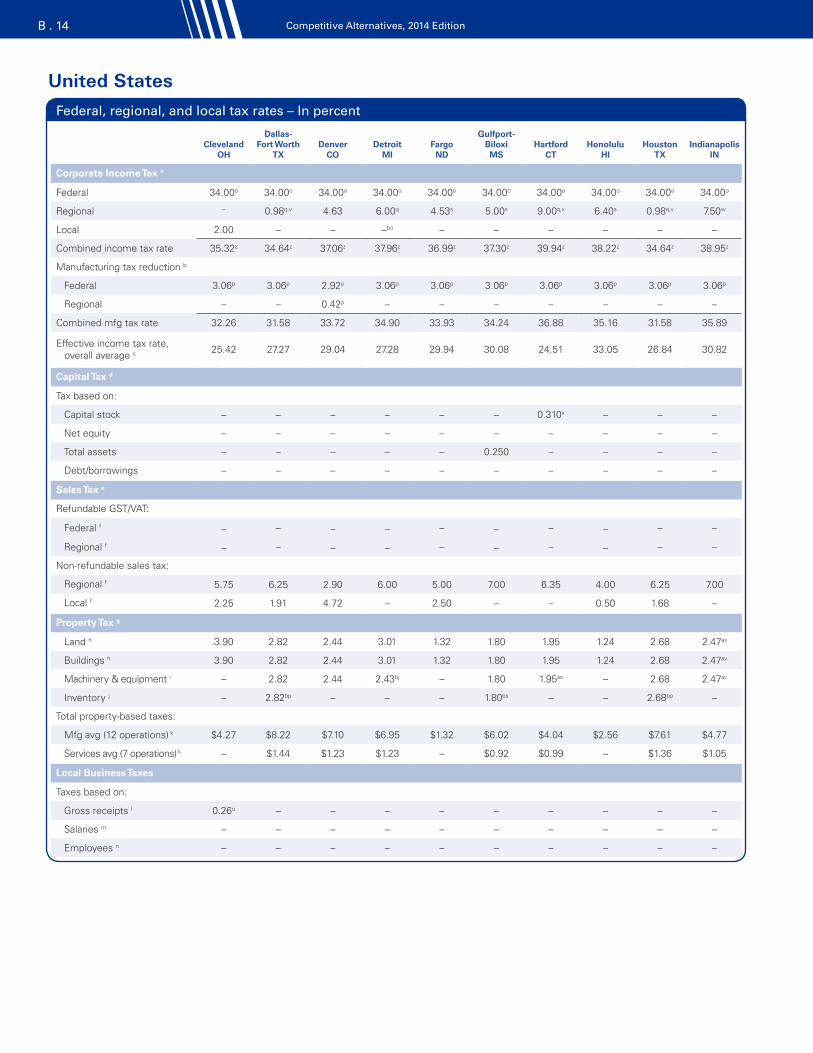
Cleveland OH
Dallas- Fort Worth
TXDenver
CODetroit
MIFargo
ND
Gulfport- Biloxi MS
Hartford CT
Honolulu HI
Houston TX
Indianapolis IN
Corporate Income Tax a
Federal 34.00o 34.00o 34.00o 34.00o 34.00o 34.00o 34.00o 34.00o 34.00o 34.00o
Regional – 0.98q,v 4.63 6.00q 4.53s 5.00s 9.00q,x 6.40s 0.98q,v 7.50w
Local 2.00 – – –bo – – – – – –
Combined income tax rate 35.32z 34.64z 37.06z 37.96z 36.99z 37.30z 39.94z 38.22z 34.64z 38.95z
Manufacturing tax reduction b
Federal 3.06p 3.06p 2.92p 3.06p 3.06p 3.06p 3.06p 3.06p 3.06p 3.06p
Regional – – 0.42p – – – – – – –
Combined mfg tax rate 32.26 31.58 33.72 34.90 33.93 34.24 36.88 35.16 31.58 35.89
Effective income tax rate, overall average c 25.42 27.27 29.04 27.28 29.94 30.08 24.51 33.05 26.84 30.82
Capital Tax d
Tax based on:
Capital stock – – – – – – 0.310x – – –
Net equity – – – – – – – – – –
Total assets – – – – – 0.250 – – – –
Debt/borrowings – – – – – – – – – –
Sales Tax e
Refundable GST/VAT:
Federal f – – – – – – – – – –
Regional f – – – – – – – – – –
Non-refundable sales tax:
Regional f 5.75 6.25 2.90 6.00 5.00 7.00 6.35 4.00 6.25 7.00
Local f 2.25 1.91 4.72 – 2.50 – – 0.50 1.68 –
Property Tax g
Land h 3.90 2.82 2.44 3.01 1.32 1.80 1.95 1.24 2.68 2.47av
Buildings h 3.90 2.82 2.44 3.01 1.32 1.80 1.95 1.24 2.68 2.47av
Machinery & equipment i – 2.82 2.44 2.43bj – 1.80 1.95as – 2.68 2.47av
Inventory j – 2.82bp – – – 1.80bs – – 2.68bp –
Total property-based taxes:
Mfg avg (12 operations) k $4.27 $8.22 $7.10 $6.95 $1.32 $6.02 $4.04 $2.56 $7.61 $4.77
Services avg (7 operations) k – $1.44 $1.23 $1.23 – $0.92 $0.99 – $1.36 $1.05
Local Business Taxes
Taxes based on:
Gross receipts l 0.26u – – – – – – – – –
Salaries m – – – – – – – – – –
Employees n – – – – – – – – – –
United States

KPMG’s Guide to International Business Location Costs B . 15
Federal, regional, and local tax rates – In percent
Jackson MS
Kansas City MO
Las Vegas
NVLexington
KY
Little Rock AR
Los Angeles
CAMadison
WIManchester
NHMemphis
TNMiami
FL
Corporate Income Tax a
Federal 34.00o 34.00o 34.00o 34.00o 34.00o 34.00o 34.00o 34.00o 34.00o 34.00o
Regional 5.00s 6.25q – 6.00q,s 6.50s 8.84 7.90q 8.50 6.50q 5.50q,s
Local – 1.00 – 2.75 – – – – – –
Combined income tax rate 37.30z 37.72z,ab 34.00 39.78z 38.29z 39.83z 39.21z 39.61z 38.29z 37.63z
Manufacturing tax reduction b
Federal 3.06p 2.87p 3.06p 2.88p 3.06p 3.06p 3.06p 3.06p 3.06p 2.89p
Regional – 0.56p – 0.54p – – – – – 0.50p
Combined mfg tax rate 34.24 34.29 30.94 36.36 35.23 36.77 36.15 36.55 35.23 34.24
Effective income tax rate, overall average c 30.03 26.78 27.12 31.89 30.08 28.96 30.25 31.92 30.20 28.57
Capital Tax d
Tax based on:
Capital stock – – – – 0.300 – – – – –
Net equity – – – – – – – – – –
Total assets 0.250 0.013ao – – – – – – 0.250bd –
Debt/borrowings – – – – – – – – – –
Sales Tax e
Refundable GST/VAT:
Federal f – – – – – – – – – –
Regional f – – – – – – – – – –
Non-refundable sales tax:
Regional f 7.00 4.23 6.85 6.00 6.50 7.50 5.00 – 7.00 6.00
Local f – 3.59 1.25 – 2.50 1.50 0.50 – 2.25 1.00
Property Tax g
Land h 2.61 3.28 1.17 1.16 1.35 1.33 2.33 2.44 3.11 2.16
Buildings h 2.61 3.13 1.17 1.16 1.35 1.33 2.33 2.44 3.11 2.16
Machinery & equipment i 2.61 3.21 1.17 0.15 1.35 1.33 – – 2.33 2.16
Inventory j 2.61bs – – 0.49 1.35 – – – – –
Total property-based taxes:
Mfg avg (12 operations) k $8.79 $9.36 $3.48 $1.72 $4.59 $4.50 $2.47 $2.61 $7.21 $6.72
Services avg (7 operations) k $1.33 $1.63 $0.60 $0.07 $0.69 $0.68 – – $1.19 $1.09
Local Business Taxes
Taxes based on:
Gross receipts l – 0.08bt – – – – – – – –
Salaries m – – 1.05 – – – – 0.75bg – –
Employees n – – – – – – – – – $4.50ae
United States

Competitive Alternatives, 2014 EditionB . 16
Federal, regional, and local tax rates – In percent
Minneapolis MN
Mobile AL
Montgomery AL
Nashville TN
New Orleans
LA
New York City NY
North Virgina (Metro DC)
VA
Oklahoma City OK
Omaha NE
Orlando FL
Corporate Income Tax a
Federal 34.00o 34.00o 34.00o 34.00o 34.00o 34.00o 34.00o 34.00o 34.00o 34.00o
Regional 9.80q 6.50 6.50 6.50q 8.00q,s 7.10q,r 6.00q 6.00 7.81q,s 5.50q,s
Local – – – – – –bo – – – –
Combined income tax rate 40.47z 36.08z,ac 36.08z,ac 38.29z 36.56z,ac 38.69z 37.96z 37.96z 38.54z,aa 37.63z
Manufacturing tax reduction b
Federal 3.06p 2.86p 2.86p 3.06p 2.82p 3.06p 2.88p 2.88p 2.84p 2.89p
Regional – 0.59p 0.59p – 0.72p 1.20bc 0.54p 0.54p 0.65p 0.50p
Combined mfg tax rate 37.41 32.63 32.63 35.23 33.02 34.43 34.54 34.54 35.06 34.24
Effective income tax rate, overall average c 26.19 28.89 29.19 30.54 17.98 27.84 27.94 29.93 22.93 29.15
Capital Tax d
Tax based on:
Capital stock – – – – – – – – 0.150an –
Net equity – – – – – 0.150r – 0.125al – –
Total assets 0.025ak 0.175ai 0.175ai 0.250bd 0.300ap – – – – –
Debt/borrowings – – – – – – – – – –
Sales Tax e
Refundable GST/VAT:
Federal f – – – – – – – – – –
Regional f – – – – – – – – – –
Non-refundable sales tax:
Regional f 6.88 4.00 4.00 7.00 4.00 4.00 4.30 4.50 5.50 6.00
Local f – 6.50 6.00 2.50 4.88 4.63 1.70 3.88 1.50 0.50
Property Tax g
Land h 3.47 1.27 0.73 1.41 1.11 5.34 1.26 1.29 2.20 1.96
Buildings h 3.47 1.27 0.73 1.41 1.66bk 5.34 1.26 1.29 2.20 1.96
Machinery & equipment i – 1.27 0.73 1.06 1.66bk – 2.00 1.62bf 2.20 1.96
Inventory j – – – – 1.66br – – 1.62bp – –
Total property-based taxes:
Mfg avg (12 operations) k $4.02 $3.41 $1.98 $3.22 $1.28 $8.88 $5.38 $2.65 $2.85 $5.65
Services avg (7 operations) k – $0.64 $0.37 $0.54 $0.84 – $1.12 $0.25 $1.12 $1.00
Local Business Taxes
Taxes based on:
Gross receipts l – – – – – – 0.21az – – –
Salaries m – – – – – – – – – –
Employees n – – – – – – – – – $6.16aj
United States

KPMG’s Guide to International Business Location Costs B . 17
Federal, regional, and local tax rates – In percent
Philadelphia PA
Phoenix AZ
Pittsburgh PA
Porland OR
Providence RI
Raleigh NC
Riverside-San Bernardino
CASacramento
CASaginaw
MI
Salt Lake City UT
Corporate Income Tax a
Federal 34.00o 34.00o 34.00o 34.00o 34.00o 34.00o 34.00o 34.00o 34.00o 34.00o
Regional 9.99q 6.50q,bn 9.99q 7.60s 9.00y 6.00q,bh 8.84 8.84 6.00q 5.00q
Local –bo – – 1.45bo – – – – –bo –
Combined income tax rate 40.59z 38.29z 40.59z 39.97z 39.94z 37.96z 39.83z 39.83z 37.96z 37.30z
Manufacturing tax reduction b
Federal 2.75p 2.86p 2.75p 3.06p 3.06p 3.06p 3.06p 3.06p 3.06p 2.91p
Regional 0.90p 0.59p 0.90p – – – – – – 0.45p
Combined mfg tax rate 36.94 34.84 36.94 36.91 36.88 34.90 36.77 36.77 34.90 33.94
Effective income tax rate, overall average c 27.11 27.62 28.03 31.89 28.64 28.84 29.86 29.28 27.86 28.88
Capital Tax d
Tax based on:
Capital stock 0.067am – 0.067am – 0.025y – – – – –
Net equity – – – – – – – – – –
Total assets – – – – – 0.150bd – – – –
Debt/borrowings – – – – – – – – – –
Sales Tax e
Refundable GST/VAT:
Federal f – – – – – – – – – –
Regional f – – – – – – – – – –
Non-refundable sales tax:
Regional f 6.00 5.60 6.00 – 7.00 4.75 7.50 7.50 6.00 4.70
Local f – 2.20 1.00 – – 2.00 0.50 1.00 – 2.15
Property Tax g
Land h 2.47 2.43 2.34 1.28 2.15 0.94 1.12 1.14 2.66 1.55
Buildings h 2.47 2.43 2.34 1.28 2.15 0.94 1.12 1.14 2.66 1.55
Machinery & equipment i – 2.43 – 1.92 2.98au 0.94 1.12 1.14 1.95bj 1.55
Inventory j – – – – – – – – – –
Total property-based taxes:
Mfg avg (12 operations) k $3.00 $7.08 $2.75 $5.11 $2.71 $2.71 $3.49 $3.52 $5.21 $4.62
Services avg (7 operations) k – $1.13 – $0.98 $1.51 $0.48 $0.57 $0.58 $0.99 $0.78
Local Business Taxes
Taxes based on:
Gross receipts l 0.142be – – – – – – – – –
Salaries m – – – – – – – – – –
Employees n – – – – – – – – – –
United States

Competitive Alternatives, 2014 EditionB . 18
Federal, regional, and local tax rates – In percent
San Antonio
TX
San Diego
CA
San Francisco
CASeattle
WAShreveport
LA
Sioux Falls SD
Spartanburg SC
Spokane WA
St. Louis MO
Tampa FL
Corporate Income Tax a
Federal 34.00o 34.00o 34.00o 34.00o 34.00o 34.00o 34.00o 34.00o 34.00o 34.00o
Regional 0.98q,v 8.84 8.84 – 8.00q,s – 5.00q – 6.25q 5.50q,s
Local – – – – – – – – –bo –
Combined income tax rate 34.64z 39.83z 39.83z 34.00 36.56z,ac 34.00 37.30z 34.00 37.06z,ab 37.63z
Manufacturing tax reduction b
Federal 3.06p 3.06p 3.06p 3.06p 2.82p 3.06p 3.06p 3.06p 2.87p 2.89p
Regional – – – – 0.72p – – – 0.56p 0.50p
Combined mfg tax rate 31.58 36.77 36.77 30.94 33.02 30.94 34.24 30.94 33.63 34.24
Effective income tax rate, overall average c 27.70 29.23 27.66 26.06 19.70 28.11 28.56 27.54 26.06 28.95
Capital Tax d
Tax based on:
Capital stock – – – – – – – – – –
Net equity – – – – – – 0.100 – – –
Total assets – – – – 0.300ap – – – 0.013ao –
Debt/borrowings – – – – – – – – – –
Sales Tax e
Refundable GST/VAT:
Federal f – – – – – – – – – –
Regional f – – – – – – – – – –
Non-refundable sales tax:
Regional f 6.25 7.50 7.50 6.50 4.00 4.00 6.00 6.50 4.23 6.00
Local f 2.00 0.50 1.50 2.93 4.60 2.00 – 2.20 4.20 1.00
Property Tax g
Land h 3.49 1.07 1.21 1.41 1.71 1.81 4.96aq 1.37 3.26 2.05
Buildings h 3.49 1.07 1.21 1.41 2.56bk 1.81aw 4.96aq 1.37 3.26 2.05
Machinery & equipment i 3.49 1.07 1.21 1.41 2.56bk – 4.96aq 1.37 3.34 2.05
Inventory j 3.49bp – – – 2.56br – – – – –
Total property-based taxes:
Mfg avg (12 operations) k $9.60 $3.58 $4.31 $4.53 $1.72 $1.22 $12.17 $4.17 $9.79 $5.78
Services avg (7 operations) k $1.78 $0.55 $0.62 $0.72 $1.30 – $2.18 $0.70 $1.69 $1.04
Local Business Taxes
Taxes based on:
Gross receipts l – 0.035ba – 1.500bb 0.100ay – – 1.500bb – –
Salaries m – – – – – – – – – –
Employees n – – – – – – – – – –
United States

KPMG’s Guide to International Business Location Costs B . 19
Federal, regional, and local tax rates – In percent
Trenton NJ
Wichita KS
Wilmington DE
Youngstown OH Footnotes
Corporate Income Tax a a Percentage of taxable income. Minor adjustments required in the calculation of taxable income in each jurisdiction are not individually disclosed. Tax rates shown in this exhibit are for the size of entity examined in this study. Many jurisdictions offer lower income tax rates for small businesses.
b Manufacturing tax rate reductions may reduce on a pro-rata basis where a significant component of a company’s payroll or capital assets are not devoted to manufacturing or processing operations.
c The effective income tax rates for the overall average (services and manufacturing) in this study vary from the combined nominal income tax rates in each location due to the impact of adjustments to taxable income and income tax credits.
d Percentage of taxable capital, determined on the general basis indicated. In many jurisdictions, the general tax base indicated here is subject to minor adjustment.
e Percentage of sales price.
f General rate. Other rates may apply to specified articles.
g The Property Tax category includes all property-based taxes, including the property-based component of multi-base local business taxes. Property tax rates relate to the suburban or urban areas identified in the real estate research for this study as offering sites suitable for the types of operation being examined.
h Percentage of current market value, incorporating current tax rates, assessment factors, base-year price equalization factors, and rental yields (estimated where required).
i Percentage of depreciated value. Special depreciation rates may apply for property tax purposes.
j Percentage of cost.
k Total property-based taxes in US $ per square foot of building space. Property taxes include taxes levied on the value of land and buildings, machinery and equipment, inventory, and other physical assets. For services operations (occupying leased office space), property taxes on facilities are typically levied on the landlord. The amount of tax passed by the landlord to the tenant as part of total rent is captured in leasing costs in this study, but is not separately identifiable.
l Percentage of gross sales.
m Percentage of gross payroll.
n Tax per employee.
o Marginal tax rate applies if earnings exceed US $335,000 and are less than US $10 million. All US taxable income in excess of US $75,000 is taxed at marginal rates of 34% to 39%. Lower marginal rates (15% to 25%) apply to the first US $75,000 of taxable income.
p Effective impact of 9% tax deduction for Qualified Production Activities Income (QPAI). Benefit at the federal level is reduced where a state also permits the QPAI deduction, as this reduces the federal deduction for state income tax paid. However, in these instances, the effective value of the saving at the state level is also shown, resulting in a higher total rate reduction than in states that do not permit the QPAI deduction. Effective rates shown are further adjusted to reflect the impact of state deductibility of federal and/or state taxes as relevant, to be consistent with the presentation of combined income tax rate.
q Interstate and export sales from this state are not attributed back to the state-of-origin for the purpose of allocating income between states (no “sales throwback” and/or attribution of services to where the “benefit of the services is received by the client” instead of where the “income producing activities are performed”). For companies with a single main location for operations (as is assumed in this study), this may result in a portion of taxable income not being subject to state income tax. The extent of this benefit depends on the weighting given to the sales factor in each state’s interstate income apportionment formula.
Federal 34.00o 34.00o 34.00o 34.00o
Regional 9.00q,s 7.00s 8.70q –
Local – – – 1.00bo
Combined income tax rate 39.94z 38.62z 39.74z 34.66z
Manufacturing tax reduction b
Federal 2.78p 2.85p 2.79p 3.06p
Regional 0.81p 0.63p 0.78p –
Combined mfg tax rate 36.35 35.14 36.17 31.60
Effective income tax rate, overall average c 15.54 31.88 29.52 25.92
Capital Tax d
Tax based on:
Capital stock – – 0.035bl –
Net equity – – – –
Total assets – – – –
Debt/borrowings – – – –
Sales Tax e
Refundable GST/VAT:
Federal f – – – –
Regional f – – – –
Non-refundable sales tax:
Regional f 7.00 6.15 – 5.75
Local f – 1.00 – 1.00
Property Tax g
Land h 2.84 3.02 1.32 2.08
Buildings h 2.84 3.02 1.32 2.08
Machinery & equipment i – – – –
Inventory j – – – –
Total property-based taxes:
Mfg avg (12 operations) k $3.81 $2.62 $1.49 $2.13
Services avg (7 operations) k – – – –
Local Business Taxes
Taxes based on:
Gross receipts l – – 0.402bm 0.260u
Salaries m – – – –
Employees n – – – –
United States

Competitive Alternatives, 2014 EditionB . 20
Footnotes
r New York State franchise tax is calculated as the greater of 7.1% of taxable income or 0.15% of taxable capital. Where tax is based on capital, maximum annual tax is US $350,000.
s Top marginal tax rate. Lower rates of tax apply to the first US $10,000 to US $10,000,000 of income, depending on the state. Tax calculations in this study reflect the benefit of lower marginal tax rates as appropriate.
t Illinois corporate income tax rate is scheduled to decrease from 9.50% to 7.75% in 2015.
u For Ohio commercial activity tax on gross receipts, all sales to customers located outside Ohio are exempt.
v Texas franchise tax is based on “net margin” tax base, as defined for Texas franchise tax purposes. The standard franchise tax rate of 1% has been temporarily reduced to 0.975% for 2014 and 2015.
w Indiana corporate income tax rate is scheduled to decrease to 7% in 2015 and 6.5% in 2016.
x Connecticut business tax is calculated as the greater of tax on income or tax on capital. Tax on income is 9.0% for 2014 and 2015 only for companies with gross income in excess of US $100 million or filing unitary or combined returns, or 7.5% in all other cases. Tax on capital is 0.31% of taxable capital, with a maximum tax of US $1 million.
y Rhode Island income tax rate may be reduced by up to 6.00%, subject to the level of new employment created. Tax paid is the greater of tax on taxable income and tax on taxable capital.
z In calculating the combined tax rate, the regional and local tax rates have been reduced by (1-Federal tax rate) to recognize the deduction permitted at the federal level for regional/local income taxes paid.
aa In calculating the combined tax rate, the regional tax rate has been reduced by (1-Regional tax rate) to recognize the deduction permitted at the regional level for regional taxes paid.
ab In calculating the combined tax rate, the federal tax rate has been reduced by (1 - 50% x Regional tax rate) to recognize the 50% deduction permitted at the regional level for federal income taxes paid.
ac In calculating the combined tax rate, the federal tax rate has been reduced by (1-Regional tax rate) to recognize the deduction permitted at the regional level for federal income taxes paid.
ad Overall effective income tax rate for all operations is not reflective of true tax rates due to marginal profitability for some operations, combined with the effects of Alternative Minimum Tax. Results shown represent the support services operation, as an operation with a reasonable net income before tax and no special tax provisions.
ae Miami-Dade business tax per employee. Rate varies by industry. This rate applies to manufacturing and many types of service operations.
af For Georgia capital tax, rate shown is approximate rate for firms with US $1 million to US $20 million of taxable capital. Actual rates vary based on amount of taxable capital. Maximum annual tax is US $5,000.
ag Massachusetts excise tax on capital effectively applies only to inventory and supplies, not total assets. For manufacturing firms, excise tax also applies to machinery and equipment, in lieu of local property tax.
ah Illinois franchise tax, maximum annual tax is US $2 million.
ai Alabama business privilege tax, top marginal rate. Lower rates apply where taxable capital is less than US $2.5 million. Maximum annual tax is US $15,000.
aj Orlando local business tax comprises two flat amounts determined from tables of values based on ranges of employees and space occupied. This complex, minor tax is approximated in the analysis as $6.16 per employee to a maximum annual tax of US $2,000.
ak Minnesota tax is based on inventory, tangible property, payroll and in-state sales. Tax is a flat amount based on ranges of taxable value. Rate shown is an approximation. Maximum annual tax is US $5,000.
al Oklahoma franchise tax. Maximum annual tax is US $20,000.
am Pennsylvania capital stock tax applies to the average of 75% of capital stock and average book profits for the previous five years. The first US $125,000 of taxable value is exempt. Manufacturing and research firms are both exempt from capital stock tax. This tax is scheduled to decrease to 0.045% in 2015 and be eliminated in 2016.
an Nebraska tax on paid-in capital is a bi-annual tax. The rate has been halved to show the effective rate on an annualized basis. Effective maximum annual tax is US $11,995.
ao Missouri business franchise tax on capital is scheduled to reduce to 0.0067% in 2015 and be eliminated in 2016. First US $1 million of taxable capital exempt. Tax may be based on capital stock if this exceeds total assets less investments.
ap Louisiana taxable capital is the greater of total fixed assets, or capital plus retained earnings plus 44% of debt. Rate shown is top marginal rate. The first US $300,000 is taxed at half this rate.
aq For Spartanburg, this study incorporates a five year exemption for new manufacturing establishments from a portion of county-level property taxes. Firms are still subject to full city and school taxes.
ar In Massachusetts, machinery and equipment of manufacturing and processing firms are exempt from local property tax.
as For Connecticut, this study incorporates a five-year automatic property tax exemption for new in-state manufacturing equipment.
at For Maine, this study incorporates an automatic 90% property tax exemption for virtually all new in-state business equipment.
au In Rhode Island, manufacturing equipment is exempt from property tax.
av For Indiana, this study incorporates a one year full abatement and a five year tax phase-in for property taxes on new in-state real and personal property of manufacturing and R&D operations.
aw For Sioux Falls, this study incorporates a one year full abatement and a five year tax phase-in for property taxes on new industrial buildings.
ax Charleston business and occupation tax on gross receipts. Rate shown is for services companies. Rate for manufacturers is 0.3%.
ay Shreveport occupational license tax on gross receipts. Rate shown is for services firms, manufacturers are exempt. Maximum annual tax is $6,200.
az Virginia business license tax on gross receipts. Rates vary by type of business. Rate shown is applicable to many types of business services. Manufacturers are exempt.
ba Carlsbad (suburban San Diego) business license fee based on gross receipts. Rate shown is for services companies. Rate for manufacturers is 0.020%.
bb Washington State business and occupation tax. Rate shown is the general rate for services companies. General rate for manufacturing companies is 0.484%. Specific rates apply to certain industries.
bc New York State franchise tax rate for manufacturers incorporates the effect of a 1.2% tax rate reduction. This reduction is scheduled to increase to 1.4% in 2015, 1.6% in 2016, and 2.225% in 2018.
bd For North Carolina and Tennessee, the capital/franchise tax base is the greater of net worth or real and tangible property.
be In Greater Philadelphia, the applicability of gross receipts tax varies by municipality. The rate shown is reflective of more central locations in the metro area and is applied to the services operations modeled. Many outer suburban locations do not have a gross receipts tax, and no tax has been applied to the manufacturing operations modeled.
United States

KPMG’s Guide to International Business Location Costs B . 21
Footnotes
bf For Oklahoma, this study incorporates a five-year property tax exemption for new in-state machinery and equipment.
bg New Hampshire business enterprise tax applies to salaries and interest paid.
bh North Carolina corporate income tax rate is scheduled to decrease to 5% in 2015. Subsequent reductions to 4% in 2016 and 3% in 2017 have been incorporated into this analysis, but are contingent upon state tax revenue collections exceeding required targets in 2014/15 and 2015/16.
bi West Virginia business franchise tax on capital is scheduled to be eliminated in 2015.
bj In Michigan, this study incorporates a state exemption for a portion of property tax paid on manufacturing machinery and equipment.
bk For Louisiana, this study incorporates a 10 year full abatement on buildings and machinery for new in-state manufacturing operations.
bl Delaware capital tax, maximum annual tax is $180,000.
bm Delaware gross receipts tax rate shown is for professional/business services companies on gross receipts in excess of US $1.2 million. For manufacturers, tax is 0.189% on gross receipts over US $15 million.
bn Arizona corporate income tax rate is scheduled to decrease to 6.0% in 2015, 5.5% in 2016, and 4.9% in 2017.
bo Local income tax rates shown reflect suburban locations. Higher local income tax rates apply to downtown operations in Cincinnati (2.10%), Detroit (2.00%), New York City (8.85%), Philadelphia (6.45%), Portland (3.65%), Saginaw (1.50%), St. Louis (1.00%), and Youngstown (2.75%).
bp Freeport exemptions apply to manufacturers’ inventory in Georgia, Oklahoma, and Texas.
bq In Baltimore, a property tax abatement applies to all manufacturing and R&D machinery and equipment.
br In Louisiana, manufacturers, wholesalers, and retailers receive a refundable income tax credit equal to the amount of property tax paid on inventory.
bs In Mississippi, manufacturers, wholesalers, and retailers receive a non-refundable income tax credit equal to the lesser of property tax paid on inventory or US $10,000.
bt Kansas City business license fee based on gross receipts. Actual rates vary based on receipts. Rate shown is approximate rate for services firms with receipts greater than US $1 million. Approximate rate for manufacturing firms with receipts greater than US $1 million is 0.07%.
United States

Competitive Alternatives, 2014 EditionB . 22
(This page is intentionally blank)

Appendix COther Competitiveness Factors
Regional Data and Data Source Notes
In support of the analysis of other competitiveness factors presented in Chapter 6 of the Competitive Alternatives 2014 report, this Appendix contains:
� Regional data for a number of the competitiveness measures presented at the national level in Chapter 6
� Detailed data source notes for the data presented in Chapter 6.
A. Regional Competitiveness Data
Differing data collection standards and practices in the study countries limit the range of other competitiveness factors that can be compared across or within the countries. This appendix presents data on other competitiveness factors for each of the 107 cities featured in Competitive Alternatives 2014, covering nine main topics that were analyzed at the national level in Chapter 6:
� Macro-economic conditions: - GDP growth rates - GDP per capita
� Labor markets: - Economic activity (labor force participation) rates - Unemployment rates - Educational attainment rates
� Population: - Elderly dependency rate
� Innovation: - Expenditure on R&D as a percentage of GDP
� Quality of life - Doctors per 100,000 inhabitants - Housing affordability
In most instances, data can be compared across all locations studied. However, in some instances data definitions differ among the study countries and this prevents comparability. In these cases, data are presented as national indices, with each country scaled to 100 and indices for each location indicating whether it lies above or below the national average for its country. These national indices are clearly labeled, and such indices cannot be used to compare regions in different countries.
National data presented in this appendix may differ from national data presented in the relevant exhibits in Chapter 6, due to the need to choose a different reporting year or data definition to match national data to the data presented for various jurisdictions within the country.
Data in this appendix is labeled based on the 107 cities featured in Competitive Alternatives 2014. However, it should be noted that all data represent state, provincial, or regional data, unless specifically identified as being city data. Detailed footnotes provide further details on data definitions, data sources and reporting dates.

Competitive Alternatives, 2014 EditionC . 2
Regional Data for Other Competitiveness Factors1
General Business Environment Labor Markets Innovation Quality of Life
Relates to Chapter 6: Page 43 Page 46 Page 47 Page 48 Page 50 Page 56 Page 57
Green columns are national or European indices that can only be compared within each color-shaded group. Refer to column footnotes for details.
GDP GrowthGDP Per Capita Labor Market Activity
Population Structure
Education Attainment
Gross Expenditure
on R&D HealthcareHousing
Affordability
Years as noted below
EU and National Indices2
Economic Activity
Rate
Unemployment Rates
Elderly Dependency
Rate3
EU and National Indices4 % of GDP
Doctors per 100,000 inhabitants
Median Multiple5
Region/State/
Province City
2011 2012 2013 2013
Australia 2.2 3.6 2.6 100.0 65.0 5.7 n/a 21.6 100.0 2.21 266 7.0
Adelaide 2.3 1.8 1.3 85.2 62.9 6.3 6.4 25.5 94.2 2.38 294 6.5
Brisbane 0.9 4.4 3.6 95.9 67.4 5.9 5.6 20.5 98.9 1.59 245 5.8
Melbourne 2.2 2.8 1.6 88.2 65.9 5.8 6.0 21.8 102.6 2.44 271 7.5
Sydney 2.3 2.4 1.8 96.3 65.9 5.6 5.4 23.0 100.1 2.05 273 8.3
2010 2011 2012 2012
Canada 3.4 2.5 1.7 100.0 66.5 7.1 n/a 19.7 100.0 1.74 209 4.1
Charlottetown, PE 2.2 1.0 1.5 70.6 69.3 11.5 n/a 21.6 95.9 1.21 177 2.9
Edmonton, AB 4.5 5.2 3.8 155.2 73.1 4.6 5.5 16.1 101.3 0.95 274 3.7
Fredericton, NB 2.0 0.3 (1.1) 77.8 63.2 10.4 n/a 19.6 93.7 0.94 184 2.3
Halifax, NS 3.0 0.6 (0.1) 79.7 63.8 9.0 6.9 24.5 97.3 1.32 322 3.5
Kamloops, BC 3.3 2.7 1.5 96.2 64.1 6.6 n/a 23.7 104.7 1.38 169 n/a
Moncton, NB 2.0 0.3 (1.1) 77.8 63.2 10.4 7.6 20.9 93.7 0.94 232 2.3
Montreal, QC 2.3 1.8 1.5 84.6 65.2 7.6 8.0 21.3 96.4 2.28 336 5.1
Niagara Region, ON 3.4 2.2 1.3 96.6 66.4 7.5 8.9 28.6 101.6 2.23 190 3.5
Quebec City, QC 2.3 1.8 1.5 84.6 65.2 7.6 4.7 23.9 96.4 2.28 341 3.9
Saskatoon, SK 4.2 5.0 1.9 112.7 70.0 4.0 4.2 17.3 97.8 0.75 263 4.3
St. John's, NL 5.9 2.9 (4.4) 109.5 61.2 11.4 5.9 17.8 92.5 0.89 262 3.6
Sudbury, ON 3.4 2.2 1.3 96.6 66.4 7.5 6.8 23.5 101.6 2.23 168 3.2
Toronto, ON 3.4 2.2 1.3 6.6 66.4 7.5 8.5 18.1 101.6 2.23 470 5.9
Vancouver, BC 3.3 2.7 1.5 96.2 64.1 6.6 6.4 19.0 104.7 1.38 428 9.5
Winnipeg, MB 2.6 1.7 2.6 91.4 68.7 5.4 5.8 20.5 95.7 1.24 266 3.6
2009 2010 2011 2011
EU-27 Country Average 100.0 100.0
France (3.7) 4.7 3.4 108.7 56.6 10.3 n/a 26.9 97.7 2.24 327 n/a
Marseille (2.5) 5.2 3.9 103.2 53.0 11.9 10.1 32.4 96.0 2.10 408 n/a
Paris (4.3) 7.2 3.7 181.0 61.4 8.5 8.5 19.5 99.3 2.99 402 n/a
Germany (7.3) 8.3 5.6 122.2 60.1 5.5 n/a 31.2 116.3 2.82 373 n/a
Berlin (2.8) 6.5 3.9 112.3 60.4 10.6 10.6 27.6 114.2 3.47 454 n/a
Frankfurt (8.6) 5.9 5.0 160.7 61.1 4.7 4.7 30.1 116.2 3.54 368 n/a
Italy (6.0) 3.5 2.0 101.2 49.3 10.7 n/a 31.6 77.1 1.26 392 n/a
Milan (6.8) 5.9 1.9 131.7 54.3 8.0 7.5 31.3 80.9 1.33 346 n/a
Rome (3.7) 2.3 1.9 116.3 51.2 9.5 10.8 30.6 90.7 1.76 485 n/a
Netherlands (7.0) 2.9 2.9 129.0 65.2 5.3 n/a 24.4 98.9 1.82 292 n/a
Eindhoven (6.5) 4.3 3.3 130.6 65.4 4.8 4.7 26.4 97.0 2.41 205 n/a
Twente Region (4.9) 1.8 2.8 112.7 64.6 5.1 5.1 24.1 99.3 1.53 214 n/a
United Kingdom (7.4) 0.9 1.0 104.8 62.7 7.9 n/a 25.9 105.0 1.77 271 6.3
London (7.5) 1.1 3.4 180.2 66.0 8.8 8.8 16.3 111.7 1.03 348 7.8
Manchester (3.6) (0.5) (1.9) 89.7 62.0 8.8 10.2 26.1 100.1 1.02 275 4.8
2008 2009 2010 2010
Japan (4.2) (3.9) 0.9 100.0 59.3 4.0 n/a 38.4 100.0 3.39 213 n/a
Osaka (0.0) (0.1) 0.0 95.4 57.3 4.4 n/a 38.6 102.1 n/a 243 n/a
Tokyo (0.0) (0.0) (0.0) 116.1 61.4 4.1 n/a 33.1 106.2 n/a 277 n/a
2010 2011 2012 2010
Mexico 5.2 3.8 3.9 100.0 60.9 5.0 n/a 9.7 n/a n/a 196 n/a
Mexico City 4.4 3.9 4.3 217.7 n/a 6.2 6.3 11.4 n/a n/a 131 n/a
Monterrey 9.0 6.3 4.5 183.1 n/a 5.6 5.8 9.0 n/a n/a 163 n/a

KPMG’s Guide to International Business Location Costs C . 3
Regional Data for Other Competitiveness Factors1
General Business Environment Labor Markets Innovation Quality of Life
Relates to Chapter 6: Page 43 Page 46 Page 47 Page 48 Page 50 Page 56 Page 57
Green columns are national indices that can only be compared within each color-shaded group. Refer to column footnotes for details.
GDP GrowthGDP Per Capita Labor Market Activity
Population Structure
Education Attainment
Gross Expenditure
on R&D HealthcareHousing
Affordability
Years as noted belowNational Indices2
Economic Activity
Rate
Unemployment Rates
Elderly Dependency
Rate3National Indices4 % of GDP
Doctors per 100,000 inhabitants
Median Multiple5
Region/State/
Province City
2010 2011 2012 2012
United States 2.4 1.6 2.5 100.0 63.7 8.1 n/a 19.8 100.0 2.61 273 3.5
Albuquerque, NM 0.8 (0.4) 0.2 79.2 58.9 6.9 7.3 20.7 97.4 8.01 243 3.8
Anchorage, AK (1.7) 1.7 1.1 142.9 68.3 7.0 6.0 11.5 106.6 0.72 225 3.7
Atlanta, GA 1.4 2.1 2.1 88.1 64.2 9.0 8.8 16.2 98.5 1.36 216 2.0
Austin, TX 4.1 3.6 4.8 108.7 65.2 6.8 5.8 15.8 94.4 1.59 216 3.6
Baltimore, MD 3.3 1.6 2.4 109.2 67.9 6.8 7.2 18.3 103.1 6.23 423 3.8
Bangor, ME 1.8 0.4 0.5 80.9 65.2 7.3 7.1 24.2 105.9 0.95 278 n/a
Baton Rouge, LA 5.8 (2.6) 1.5 100.8 59.6 6.4 6.4 18.7 95.9 0.53 267 3.4
Beaumont, TX 4.1 3.6 4.8 108.7 65.2 6.8 10.1 15.8 94.4 1.59 216 2.9
Billings, MT 2.1 2.4 2.1 77.6 64.0 6.0 4.4 22.8 107.3 1.07 219 n/a
Boise, ID 1.6 0.0 0.4 74.7 64.8 7.1 6.9 19.8 103.5 3.20 171 3.2
Boston, MA 3.8 1.7 2.2 124.4 65.1 6.7 6.1 20.4 104.0 5.36 474 5.2
Buffalo, NY 4.0 1.2 1.3 124.0 61.6 8.5 8.5 20.1 99.1 1.51 394 2.8
Burlington, VT 5.6 1.3 1.2 89.3 69.6 5.0 4.0 21.9 106.5 1.75 372 4.7
Cedar Rapids, IA 1.9 2.2 2.4 98.7 68.6 5.2 5.3 22.9 105.9 2.00 189 2.6
Champaign-Urbana, IL 1.8 2.1 1.9 107.9 66.0 8.9 8.0 18.9 101.6 2.46 283 3.5
Charleston, WV 3.3 1.9 3.3 71.0 54.1 7.3 6.9 24.3 97.8 0.93 236 3.3
Charlotte, NC 2.3 0.5 2.7 94.2 63.0 9.5 9.5 19.8 98.8 2.05 257 3.2
Cheyenne, WY (1.3) (2.4) 0.2 126.9 68.8 5.4 6.1 18.9 107.1 0.29 187 n/a
Chicago, IL 1.8 2.1 1.9 107.9 66.0 8.9 8.9 18.9 101.6 2.46 283 3.2
Cincinnati, OH 2.1 2.9 2.2 88.1 63.7 7.2 7.1 21.5 103.0 2.16 271 2.5
Cleveland, OH 2.1 2.9 2.2 88.1 63.7 7.2 7.1 21.5 103.0 2.16 271 2.6
Dallas-Fort Worth, TX 4.1 3.6 4.8 108.7 65.2 6.8 6.7 15.8 94.4 1.59 216 2.9
Denver, CO 2.2 1.7 2.1 108.1 68.8 8.0 7.9 16.4 105.0 2.42 260 4.3
Detroit, MI 4.9 3.5 2.2 82.5 59.8 9.1 10.5 21.0 103.6 4.00 258 1.5
Fargo, ND 7.2 7.8 13.4 129.1 72.0 3.1 3.6 21.5 105.8 1.32 250 3.0
Gulfport-Biloxi, MS 2.0 (1.1) 2.4 67.7 59.2 9.2 8.6 19.7 94.9 0.89 179 2.8
Hartford, CT 1.2 (0.1) (0.1) 128.4 66.1 8.4 8.4 21.4 103.8 3.35 380 3.6
Honolulu, HI 3.1 2.1 1.6 103.9 61.1 5.8 5.2 22.1 105.0 1.02 371 9.3
Houston, TX 4.1 3.6 4.8 108.7 65.2 6.8 6.8 15.8 94.4 1.59 216 3.0
Indianapolis, IN 6.4 2.2 3.3 91.3 62.6 8.4 7.8 19.8 101.6 2.34 217 2.6
Jackson, MS 2.0 (1.1) 2.4 67.7 59.2 9.2 7.3 19.7 94.9 0.89 179 3.4
Kansas City, MO 1.9 0.3 2.0 86.0 64.1 6.9 6.6 21.4 101.9 3.79 247 2.7
Las Vegas, NV (0.4) 1.8 1.5 95.9 64.7 11.1 11.2 18.5 98.4 0.75 188 2.8
Lexington, KY 5.0 2.0 1.4 78.3 61.4 8.2 6.6 20.2 96.5 0.93 234 3.0
Little Rock, AR 2.6 0.7 1.3 74.4 59.9 7.3 6.5 22.4 97.4 0.57 204 3.0
Los Angeles, CA 0.3 1.2 3.5 107.6 63.0 10.5 10.1 17.1 94.4 4.39 271 6.2
Madison, WI 3.1 1.3 1.5 91.9 68.0 6.9 5.0 20.7 105.2 2.18 262 3.5
Manchester, NH 3.3 2.2 0.5 100.4 69.6 5.5 5.5 20.3 106.6 3.53 289 3.2
Memphis, TN 2.5 2.4 3.3 87.1 62.0 8.0 9.0 20.5 98.3 1.56 266 2.7
Miami, FL 0.3 0.9 2.4 81.3 60.6 8.6 8.5 27.1 100.1 1.09 252 4.5
Minneapolis, MN 2.8 1.6 3.5 109.9 70.9 5.6 5.5 19.6 107.2 2.75 297 2.8
Mobile, AL 2.7 1.0 1.2 76.2 57.5 7.3 8.4 21.0 96.6 2.16 218 2.6
Montgomery, AL 2.7 1.0 1.2 76.2 57.5 7.3 7.5 21.0 96.6 2.16 218 2.8
Nashville, TN 2.5 2.4 3.3 87.1 62.0 8.0 6.6 20.5 98.3 1.56 266 3.2
New Orleans, LA 5.8 (2.6) 1.5 100.8 59.6 6.4 6.5 18.7 95.9 0.53 267 3.5
New York City, NY 4.0 1.2 1.3 124.0 59.9 8.5 8.8 20.1 99.1 1.51 394 6.2
North Virginia, Metro DC, VA
3.8 1.1 1.1 110.2 66.6 5.9 5.6 18.2 101.7 2.38 278 4.1

Competitive Alternatives, 2014 EditionC . 4
Regional Data for Other Competitiveness Factors1
General Business Environment Labor Markets Innovation Quality of Life
Relates to Chapter 6: Page 43 Page 46 Page 47 Page 48 Page 50 Page 56 Page 57
Green columns are national indices that can only be compared within each color-shaded group. Refer to column footnotes for details.
GDP GrowthGDP Per Capita Labor Market Activity
Population Structure
Education Attainment
Gross Expenditure
on R&D HealthcareHousing
Affordability
Years as noted belowNational Indices2
Economic Activity
Rate
Unemployment Rates
Elderly Dependency
Rate3National Indices4 % of GDP
Doctors per 100,000 inhabitants
Median Multiple5
Region/State City
2010 2011 2012 2012
United States 2.4 1.6 2.5 100.0 63.7 8.1 n/a 19.8 100.0 2.61 273 3.5
Oklahoma City, OK 0.6 1.9 2.1 84.7 62.3 5.2 4.8 20.8 100.5 0.70 175 3.1
Omaha, NE 3.9 1.9 1.5 105.0 72.3 3.9 4.4 20.7 105.5 1.03 251 2.6
Orlando, FL 0.3 0.9 2.4 81.3 60.6 8.6 8.4 27.1 100.1 1.09 252 2.9
Philadelphia, PA 2.3 1.9 1.7 93.6 63.9 7.9 8.6 23.3 103.1 2.34 307 3.8
Phoenix, AZ (0.2) 1.7 2.6 82.3 60.6 8.3 7.3 21.9 99.8 2.22 213 3.0
Pittsburgh, PA 2.3 1.9 1.7 93.6 63.9 7.9 7.2 23.3 103.1 2.34 307 2.7
Portland, OR 5.7 3.5 3.9 112.4 63.4 8.7 8.2 21.3 103.8 2.89 281 4.3
Providence, RI 1.0 0.0 1.4 97.4 66.3 10.4 10.3 21.5 98.7 2.96 382 4.0
Raleigh, NC 2.3 0.5 2.7 94.2 63.0 9.5 7.7 19.8 98.8 2.05 257 3.1
Riverside-San Bernardino, CA 0.3 1.2 3.5 107.6 63.0 10.5 12.1 17.1 94.4 4.39 271 3.7
Sacramento, CA 0.3 1.2 3.5 107.6 63.0 10.5 10.4 17.1 94.4 4.39 271 3.2
Saginaw, MI 4.9 3.5 2.2 82.5 59.8 9.1 8.6 21.0 103.6 4.00 258 2.1
Salt Lake City, UT 2.3 2.8 3.4 91.5 66.8 5.7 5.5 14.3 105.6 2.70 212 3.7
San Antonio, TX 4.1 3.6 4.8 108.7 65.2 6.8 6.5 15.8 94.4 1.59 216 3.3
San Diego, CA 0.3 1.2 3.5 107.6 63.0 10.5 8.9 17.1 94.4 4.39 271 6.4
San Francisco, CA 0.3 1.2 3.5 107.6 63.0 10.5 8.1 17.1 94.4 4.39 271 7.8
Seattle, WA 2.3 2.0 3.6 110.2 64.7 8.2 7.4 18.6 104.9 4.87 271 4.8
Shreveport, LA 5.8 (2.6) 1.5 100.8 59.6 6.4 6.4 18.7 95.9 0.53 267 3.7
Sioux Falls, SD 0.0 4.4 0.2 100.9 70.4 4.4 4.1 22.2 105.1 0.71 224 2.7
Spartanburg, SC 2.5 2.3 2.7 74.5 59.2 9.1 9.0 21.1 98.1 1.47 228 3.1
Spokane, WA 2.3 2.0 3.6 110.2 64.7 8.2 8.6 18.6 104.9 4.87 271 3.5
St. Louis, MO 1.9 0.3 2.0 86.0 64.1 6.9 7.6 21.4 101.9 3.79 247 2.5
Tampa, FL 0.3 0.9 2.4 81.3 60.6 8.6 8.8 27.1 100.1 1.09 252 3.1
Trenton, NJ 1.5 0.2 1.3 115.5 65.9 9.5 7.8 20.4 102.6 3.70 315 3.9
Wichita, KS 2.6 3.2 1.4 96.0 68.4 5.7 6.8 20.3 104.5 1.58 228 2.4
Wilmington, DE 0.3 0.9 0.2 143.0 61.7 7.1 8.6 22.1 102.1 3.70 246 3.8
Youngstown, OH 2.1 2.9 2.2 88.1 63.7 7.2 8.1 21.5 103.0 2.16 271 2.0
Summary Footnotes1 Refer to the following section “Detailed Data Source Notes for Exhibit C.1” for full data definitions, data sources and reporting dates.
2 Indices represent a measure of GDP per capita for the region/state/province where each city is located relative to the national GDP per capita of its country (national GDP per capita = 100), or in the case of the European countries, the EU-27 average (EU-27 GDP per capita=100). Indices can only be compared between jurisdictions within each country and not between the countries (except within the EU).
3 Represents a ratio of population 65 and over to the working age population (15-64).
4 Indices represent a measure of education attainment (high school completion) for the region/state/province where each city is located relative to the national level of education attainment (national education attainment rate = 100) ), or in the case of the European countries, the EU-27 average (EU-27 education attainment rate =100). Indices can only be compared between jurisdictions within each country and not between the countries (except within the EU) due to different age cut-offs for measuring attainment.
5 Housing affordability median multiple: median house price as a multiple of median household income.
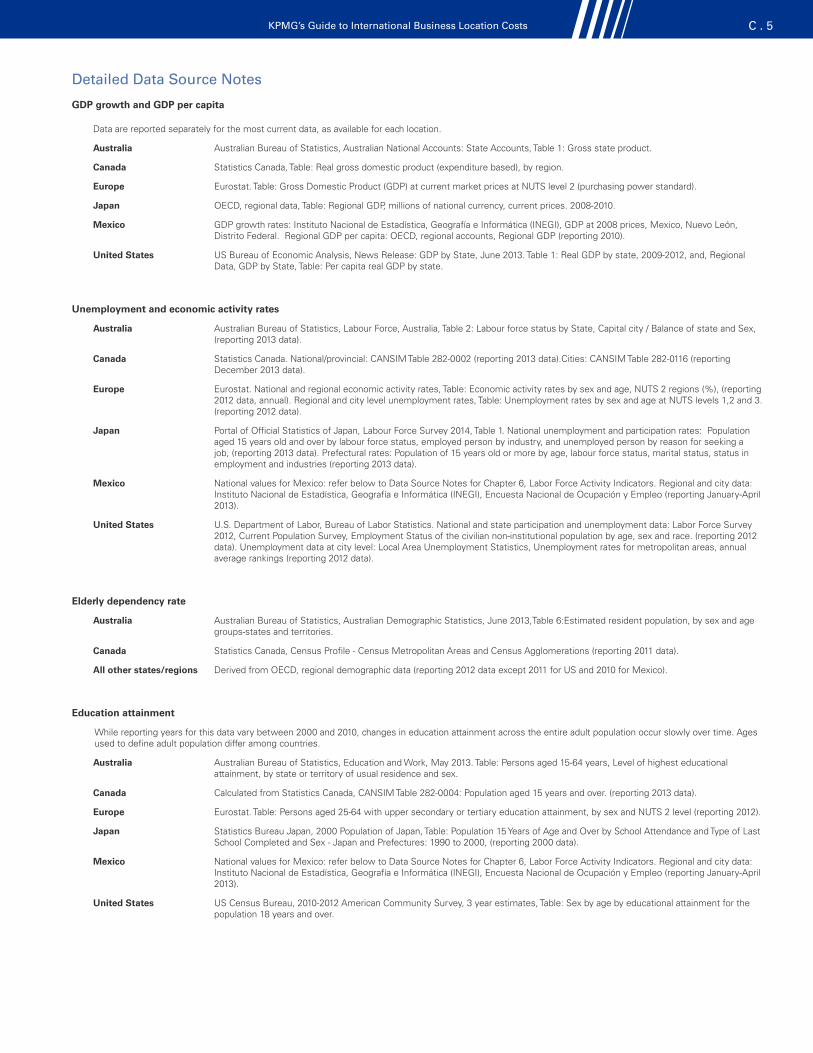
KPMG’s Guide to International Business Location Costs C . 5
Detailed Data Source Notes
GDP growth and GDP per capita
Data are reported separately for the most current data, as available for each location.
Australia Australian Bureau of Statistics, Australian National Accounts: State Accounts, Table 1: Gross state product.
Canada Statistics Canada, Table: Real gross domestic product (expenditure based), by region.
Europe Eurostat. Table: Gross Domestic Product (GDP) at current market prices at NUTS level 2 (purchasing power standard).
Japan OECD, regional data, Table: Regional GDP, millions of national currency, current prices. 2008-2010.
Mexico GDP growth rates: Instituto Nacional de Estadística, Geografía e Informática (INEGI), GDP at 2008 prices, Mexico, Nuevo León, Distrito Federal. Regional GDP per capita: OECD, regional accounts, Regional GDP (reporting 2010).
United States US Bureau of Economic Analysis, News Release: GDP by State, June 2013. Table 1: Real GDP by state, 2009-2012, and, Regional Data, GDP by State, Table: Per capita real GDP by state.
Unemployment and economic activity rates
Australia Australian Bureau of Statistics, Labour Force, Australia, Table 2: Labour force status by State, Capital city / Balance of state and Sex, (reporting 2013 data).
Canada Statistics Canada. National/provincial: CANSIM Table 282-0002 (reporting 2013 data).Cities: CANSIM Table 282-0116 (reporting December 2013 data).
Europe Eurostat. National and regional economic activity rates, Table: Economic activity rates by sex and age, NUTS 2 regions (%), (reporting 2012 data, annual). Regional and city level unemployment rates, Table: Unemployment rates by sex and age at NUTS levels 1,2 and 3. (reporting 2012 data).
Japan Portal of Official Statistics of Japan, Labour Force Survey 2014, Table 1. National unemployment and participation rates: Population aged 15 years old and over by labour force status, employed person by industry, and unemployed person by reason for seeking a job, (reporting 2013 data). Prefectural rates: Population of 15 years old or more by age, labour force status, marital status, status in employment and industries (reporting 2013 data).
Mexico National values for Mexico: refer below to Data Source Notes for Chapter 6, Labor Force Activity Indicators. Regional and city data: Instituto Nacional de Estadística, Geografía e Informática (INEGI), Encuesta Nacional de Ocupación y Empleo (reporting January-April 2013).
United States U.S. Department of Labor, Bureau of Labor Statistics. National and state participation and unemployment data: Labor Force Survey 2012, Current Population Survey, Employment Status of the civilian non-institutional population by age, sex and race. (reporting 2012 data). Unemployment data at city level: Local Area Unemployment Statistics, Unemployment rates for metropolitan areas, annual average rankings (reporting 2012 data).
Elderly dependency rate
Australia Australian Bureau of Statistics, Australian Demographic Statistics, June 2013,Table 6:Estimated resident population, by sex and age groups-states and territories.
Canada Statistics Canada, Census Profile - Census Metropolitan Areas and Census Agglomerations (reporting 2011 data).
All other states/regions Derived from OECD, regional demographic data (reporting 2012 data except 2011 for US and 2010 for Mexico).
Education attainment
While reporting years for this data vary between 2000 and 2010, changes in education attainment across the entire adult population occur slowly over time. Ages used to define adult population differ among countries.
Australia Australian Bureau of Statistics, Education and Work, May 2013. Table: Persons aged 15-64 years, Level of highest educational attainment, by state or territory of usual residence and sex.
Canada Calculated from Statistics Canada, CANSIM Table 282-0004: Population aged 15 years and over. (reporting 2013 data).
Europe Eurostat. Table: Persons aged 25-64 with upper secondary or tertiary education attainment, by sex and NUTS 2 level (reporting 2012).
Japan Statistics Bureau Japan, 2000 Population of Japan, Table: Population 15 Years of Age and Over by School Attendance and Type of Last School Completed and Sex - Japan and Prefectures: 1990 to 2000, (reporting 2000 data).
Mexico National values for Mexico: refer below to Data Source Notes for Chapter 6, Labor Force Activity Indicators. Regional and city data: Instituto Nacional de Estadística, Geografía e Informática (INEGI), Encuesta Nacional de Ocupación y Empleo (reporting January-April 2013).
United States US Census Bureau, 2010-2012 American Community Survey, 3 year estimates, Table: Sex by age by educational attainment for the population 18 years and over.

Competitive Alternatives, 2014 EditionC . 6
Gross expenditure on R&D
Reporting years for this data for all countries are relatively close, being between 2005 and 2008.
Australia Australian Bureau of Statistics, Research and Experimental Development, All Sector Summary, GERD as proportion of GDP and GSP, (reporting 2008-2009 data).
Canada Calculated from Statistics Canada CANSIM Tables 358-0001 (GERD) and 384-0038 (GDP) (reporting 2011 data).
Europe Eurostat. Table: Total intramural R&D expenditure (GERD) by sector and NUTS2 regions (reporting 2010 data except 2009 Germany and the Netherlands).
Japan OECD, Science, Technology and Industry Scoreboard 2013. Figure: Gross domestic expenditure on R&D, 2011.
United States National Science Board, Science and Engineering Indicators 2014, State Indicators, R&D as a percentage of GDP by state (reporting 2010 data).
Number of doctors per 100,000 inhabitants
Australia Australian Bureau of Statistics, Australian Social Trends Data Cube, Table: Health, State Summary 2012 (reporting 2008-2010 data).
Canada Canadian Institute for Health Information, Health Indicators 2013, (reporting 2011 city data).
Europe Eurostat, Table: Health personnel by NUTS 2 region (reporting 2010 data except 2009 data for the Netherlands).
Japan Ministry of Health, Labor and Welfare, Japan. Health Statistics in Japan 2010, Table: Number of physicians practicing in health care facilities per 100,000 population by prefecture, 2008.
Mexico Derived from World Health Organisation, World Health Statistics 2013, (reporting 2005-2011 data) and Instituto Nacional de Estadística, Geografía e Informática (INEGI), Cuaderno de Información Oportuna Regional, Table 1.1.3 (reporting 2011 data).
United States US Census Bureau, Statistical Abstract of the United States: 2012. Active physicians and nurses, by state: 2009.
Housing affordability median multiple
All countries Demographia, 7th Annual International Housing Affordability Survey, 2013 (reporting data for Q3-2012).
B. Data Source Notes for Chapter 6
Set out below are detailed data sources and notes for the other competitiveness factor data presented in Chapter 6. Notes are categorized based upon the order of the exhibits in Chapter 6.
Site Selection Factors, by Indicated Importance, and Quality of Life Factors, by Indicated Importance
Area Development (www.areadevelopment.com), Site and Facility Planning, 28th Annual Corporate Survey, 2013 and 24th Annual Corporate Survey, 2011.
National Finance Indicators
Gross Government Debt, Gross National IMF, World Economic Outlook database, September 2013 edition. Reporting data or estimates for 2012. Savings & Current Account Balance as %GDP
Credit Rating Standard and Poor’s website, January 2014.
Growth and Inflation Indicators
GDP Growth Rate IMF, World Economic Outlook database, October 2013 edition. Annual percentages of constant price GDP are year-on-year changes.
GDP/capita (US$, PPP) IMF, World Economic Outlook database, October 2013 edition, (reporting 2013 data. Estimates UK).
Inflation Rate OECD, Consumer Prices (MEI), percentage change on the same period of the previous year, 2012 data.
Institutional Effectiveness Indicators
Government Effectiveness and Rule of Law World Bank, World Governance Indicators, 2012. The original results were presented on a -2.5 to +2.5 scale, where -2.5=least effective and +2.5=most effective. The results were re-scaled to a scale 0-10, where 0=least effective and 10= most effective to make it comparable to other indices in this exhibit.
Policy Adaptability to Economic Change World Competitiveness Yearbook (WCY) copyright © 2013, IMD International, Switzerland, World Competitiveness Center, www.imd.ch/wcc. Executive opinion survey based on the statement: Adaptability of government policy to changes in the economy is high, where 0=low and 10=high.
Corruption Transparency International, Corruption Perceptions Index, 2013, where 0=highly corrupt and 10=highly clean.
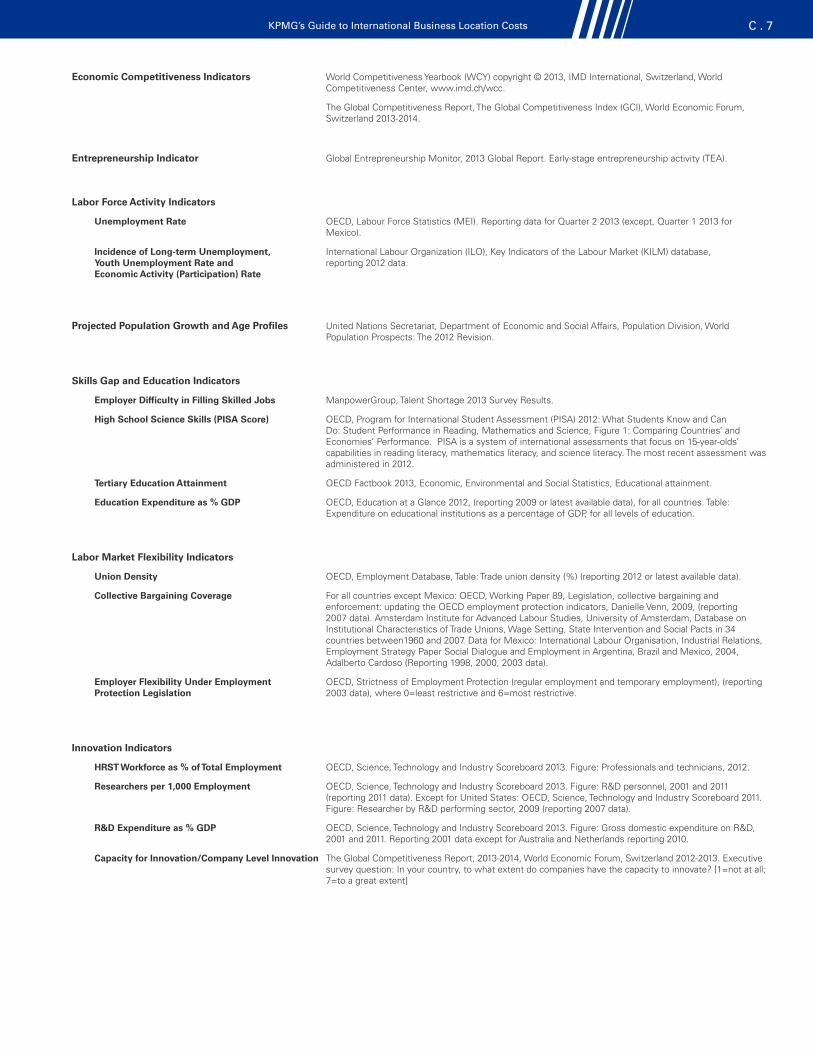
KPMG’s Guide to International Business Location Costs C . 7
Economic Competitiveness Indicators World Competitiveness Yearbook (WCY) copyright © 2013, IMD International, Switzerland, World Competitiveness Center, www.imd.ch/wcc.
The Global Competitiveness Report, The Global Competitiveness Index (GCI), World Economic Forum, Switzerland 2013-2014.
Entrepreneurship Indicator Global Entrepreneurship Monitor, 2013 Global Report. Early-stage entrepreneurship activity (TEA).
Labor Force Activity Indicators
Unemployment Rate OECD, Labour Force Statistics (MEI). Reporting data for Quarter 2 2013 (except, Quarter 1 2013 for Mexico).
Incidence of Long-term Unemployment, International Labour Organization (ILO), Key Indicators of the Labour Market (KILM) database, Youth Unemployment Rate and reporting 2012 data. Economic Activity (Participation) Rate
Projected Population Growth and Age Profiles United Nations Secretariat, Department of Economic and Social Affairs, Population Division, World Population Prospects: The 2012 Revision.
Skills Gap and Education Indicators
Employer Difficulty in Filling Skilled Jobs ManpowerGroup, Talent Shortage 2013 Survey Results.
High School Science Skills (PISA Score) OECD, Program for International Student Assessment (PISA) 2012: What Students Know and Can Do: Student Performance in Reading, Mathematics and Science, Figure 1: Comparing Countries’ and Economies’ Performance. PISA is a system of international assessments that focus on 15-year-olds’ capabilities in reading literacy, mathematics literacy, and science literacy. The most recent assessment was administered in 2012.
Tertiary Education Attainment OECD Factbook 2013, Economic, Environmental and Social Statistics, Educational attainment.
Education Expenditure as % GDP OECD, Education at a Glance 2012, (reporting 2009 or latest available data), for all countries. Table: Expenditure on educational institutions as a percentage of GDP, for all levels of education.
Labor Market Flexibility Indicators
Union Density OECD, Employment Database, Table: Trade union density (%) (reporting 2012 or latest available data).
Collective Bargaining Coverage For all countries except Mexico: OECD, Working Paper 89, Legislation, collective bargaining and enforcement: updating the OECD employment protection indicators, Danielle Venn, 2009, (reporting 2007 data). Amsterdam Institute for Advanced Labour Studies, University of Amsterdam, Database on Institutional Characteristics of Trade Unions, Wage Setting, State Intervention and Social Pacts in 34 countries between1960 and 2007. Data for Mexico: International Labour Organisation, Industrial Relations, Employment Strategy Paper Social Dialogue and Employment in Argentina, Brazil and Mexico, 2004, Adalberto Cardoso (Reporting 1998, 2000, 2003 data).
Employer Flexibility Under Employment OECD, Strictness of Employment Protection (regular employment and temporary employment), (reporting Protection Legislation 2003 data), where 0=least restrictive and 6=most restrictive.
Innovation Indicators
HRST Workforce as % of Total Employment OECD, Science, Technology and Industry Scoreboard 2013. Figure: Professionals and technicians, 2012.
Researchers per 1,000 Employment OECD, Science, Technology and Industry Scoreboard 2013. Figure: R&D personnel, 2001 and 2011 (reporting 2011 data). Except for United States: OECD, Science, Technology and Industry Scoreboard 2011.Figure: Researcher by R&D performing sector, 2009 (reporting 2007 data).
R&D Expenditure as % GDP OECD, Science, Technology and Industry Scoreboard 2013. Figure: Gross domestic expenditure on R&D, 2001 and 2011. Reporting 2001 data except for Australia and Netherlands reporting 2010.
Capacity for Innovation/Company Level Innovation The Global Competitiveness Report, 2013-2014, World Economic Forum, Switzerland 2012-2013. Executive survey question: In your country, to what extent do companies have the capacity to innovate? [1=not at all; 7=to a great extent]
Competitive Alternatives, 2014 EditionC . 8
Business Regulatory Environment Indicators
Commercial Real Estate Transparency Index Jones Lang LaSalle, LaSalle Investment Management, Global Real Estate Transparency Index, Global Foresight Series 2012, where 1=strong, 5=weak.
Market Access Index The Global Enabling Trade Report, the Enabling Trade Index 2012, World Economic Forum, Switzerland 2012. Market Access Subindex measures the extent to which to which the policy framework of the country welcomes foreign goods into the economy and enables access to foreign markets for its exporters. The original scale where 1=weak and 7=strong was inverted to 1=strong and 7=weak in order to make it consistent with other scales in Exhibit 6.17.
Ease of Doing Business Ranking World Bank, Doing Business Report June 2013.
Environmental Performance and Regulation Indicators
Environmental Performance Yale Center for Environmental Law and Policy (YCELP) of Yale University and the Center for International Earth Science Information Network (CIESIN) of Columbia University, in collaboration with the World Economic Forum and the Joint Research Centre of the European Commission. 2014. Environmental Performance Index, where 0=low, 100=high.
Environmental Laws and Competitiveness World Competitiveness Yearbook (WCY) copyright © 2013, IMD International, Switzerland, World Competitiveness Center, www.imd.ch/wcc. Executive opinion survey based on the statement: Environmental laws and compliance do not hinder the competitiveness of businesses, where 0=hinder, 10=do not hinder. This has been re-scaled to a 0-100 scale in order to make the results more easily comparable with the Environmental Performance Index.
Energy Indicators International Energy Association, Key World Energy Statistics, 2013. Calculated based on energy balances and selected indicators for 2011, expressed in million tonnes of oil equivalent (mtoe) on a net calorific value basis.
Quality of Infrastructure Indicators
ICT Development Index-Access International Telecommunications Union, Measuring the Information Society, 2013, Table, ICT Development Indiex (IDI) where 1=low and 10=high (reporting 2012 data). The original scale where 1=low and 10=high was rescaled to 0=low and 10=high in order to make it consistent with the scale of Quality of Distribution Infrastructure indicator.
Quality of Distribution Infrastructure World Competitiveness Yearbook (WCY) copyright © 2013, IMD International, Switzerland, World Competitiveness Center, www.imd.ch/wcc. Executive opinion survey based on the statement: The distribution infrastructure of goods and services is generally efficient, where 0=inefficient and 10=efficient.
Safety and Crime Indicators
Homicides per 100,000 Population United Nations Office on Drugs and Crime, International homicide, count and rate per 100,000 population. Reporting data from 2011 except Netherlands, 2010.
Police Reliability and Business Cost of Crime The Global Enabling Trade Report, the Enabling Trade Index 2012, Reducing Supply Chain Barriers , World Economic Forum, Switzerland, 2012.
Question regarding reliability of police services: To what extent can police services be relied upon to enforce law and order in your country? [1=cannot be relied upon at all; 7=can always be relied upon].
Question regarding business cost of crime and violence: Does the incidence of crime and violence impose costs on businesses in our country? [1=significant costs; 7= no costs]
The original scale where 1=negative and 7=positive was inverted to 1=positive and 7=negative in order to make it consistent with the scale of Homicides per 100,000 Population indicator.
Healthcare Indicators World Health Organisation, World Health Statistics 2013, (reporting data 2005-2011).
Housing Affordability
Housing Affordability (median multiple) Demographia, International Housing Affordability Survey, 2013. Based on an average of 4 local markets surveyed in Australia, 15 in Canada, 2 in the UK, 71 in the US using median multiple=median house price/median household income.

Appendix DSelected Bibliography and
Sources of Data
For the purposes of this study, a wide variety of sources in each city and country were contacted to gather recent and accurate statistical data for input to the industry models. These sources are listed on the following pages. Where only the name of an organization is listed, data were sourced either from the organization’s website or custom prepared reports. Document titles are included where data were sourced from a specific, publicly-available publication.
A. Location, Population, Local Industry, and Transportation
Australia All cities Australian Bureau of Statistics
Adelaide City of Adelaide, Economic Development
Department of Trade and Economic Development, South Australia
Brisbane Brisbane City Council
Brisbane Investment
Site Selection Online
Melbourne City of Melbourne
Melbourne Development Board
Melbourne Port Corporation
Sydney New South Wales Department of State and Regional Development
City of Sydney
Canada All cities Statistics Canada
Belleville-Quinte West City of Belleville, City of Quinte West
Brandon Economic Development Brandon
Manitoba Trade & Investment
Charlottetown Innovation PEI
Atlantic Canada Opportunities Agency
Chatham-Kent Chatham-Kent Economic Development Services
Edmonton Alberta Treasury Board and Enterprise
Edmonton Economic Development Corporation
Fredericton Enterprise Fredericton
Grand Prairie City of Grande Prairie
Halifax Greater Halifax Partnership
Kamloops Venture Kamloops
Kelowna Central Okanagan Economic Development Commission
Kingston Kingston Economic Development
Lethbridge Economic Development Lethbridge
Lloydminster Lloydminster Economic Development Corporation
Moncton Enterprise Greater Moncton
Atlantic Canada Opportunities Agency
Montreal Montreal International
Invetissement Québec
Moose Jaw City of Moose Jaw
Enterprise Saskatchewan
Nanaimo Nanaimo Economic Development
Niagara Region Niagara Economic Development

Competitive Alternatives, 2014 EditionD . 2
Prince Albert Enterprise Saskatchewan
Quebec City Québec International
Red Deer City of Red Deer
Regina Regina Regional Opportunities Commission
Saint John Enterprise Saint John
Saskatoon Saskatoon Regional Economic Development Authority
St. John’s Newfoundland and Labrador, Department of Innovation, Business and Rural Development
City of St. John’s
Atlantic Canada Opportunities Agency
Sudbury City of Sudbury
Greater Sudbury Development Corporation
Sydney Enterprise Cape Breton Corporation
Toronto City of Toronto
Truro Nova Scotia Economic and Rural Development and Tourism
Vancouver Metro Vancouver
Vancouver Economic Commission
Windsor-Essex Windsor-Essex Economic Development Corporation
Winnipeg Economic Development Winnipeg Inc.
Manitoba Entrepreneurship, Training & Trade
France All Cities Institut National de la Statistique et des Études Économiques
Marseille Ville de Marseille
Paris Paris Regional Development Agency
Germany Berlin Berlin Partner GmbH
Frankfurt Frankfurt Economic Development GmbH
Italy All Cities Istituto Nazionale di Statistica
Milan Milano Metropoli
Rome Sviluppo Lazio
Japan Osaka City of Osaka
Tokyo Tokyo Metropolitan Government
Mexico All cities ProMexico
Instituto Nacional de Estadística Geografía e Informática (INEGI)
US Trade Department
Mexico City Government of Distrito Federal
Monterrey Government of the State of Nuevo León
Monterrey Ciudad Internacional del Conocimiento
Monterrey Technology Park
Netherlands All Cities Statistics Netherlands
Eindhoven BOM Foreign Investments
Twente Region East Netherlands Development Agency
United Kingdom All Cities UK Office for National Statistics
London Government Office for the South East
London Development Agency
South London Chamber of Commerce & Industry

KPMG’s Guide to International Business Location Costs D . 3
Manchester Manchester City Council
Manchester Training and Enterprise Council
Manchester Chamber of Commerce and Industry
Manchester Business Link
Manchester Investment & Development Agency Services
United States All Cities US Census Bureau
InfoUSA
www.city-data.com
Albuquerque City of Albuquerque
Alexandria Louisiana Economic Development
City of Alexandria
Anchorage Anchorage Economic Development Corporation
Atlanta Metro Atlanta Chamber of Commerce
Austin The Greater Austin Chamber of Commerce
Baltimore City of Baltimore
Emerging Technology Centers
Baltimore Development Corporation
Bangor Bangor Region Development Alliance
Baton Rouge East Baton Rouge Parish
Beaumont City Town Info, Beaumont, Texas
Bellingham City of Bellingham
Billings City of Billings
Boise Boise Area Chamber of Commerce
Boston Greater Boston Chamber of Commerce
Buffalo Buffalo Niagara Enterprise
Burlington Greater Burlington Industrial Corporation
Cedar Rapids Cedar Rapids Area Chamber of Commerce
Champaign-Urbana Illinois Department of Commerce and Economic Opportunity
Charlotte Charlotte Regional Partnership
Charleston Charleston Area Alliance
Cheyenne The Cheyenne-Laramie County Corporation for Economic Development
Chicago City of Chicago
Cincinnati Cincinnati Ohio Economic Development
Cleveland City of Cleveland
Dallas-Fort Worth Greater Dallas Chamber
Texas Department of Economic Development
Denver Metro Denver Economic Development Corporation
Detroit Wayne County Economic Development
Fargo Great Fargo Moorhead Economic Development Corporation
Gulfport-Biloxi Harrison County Development Commission
Hartford Greater Hartford Chamber of Commerce
Honolulu City and County of Honolulu, Economic Development
Houma Louisiana Economic Development
Terrebonne Economic Development Authority
Houston Greater Houston Partnership Research Department
Indianapolis Indianapolis Private Industry Council
Jackson Metro Jackson Economic Development Alliance
Kansas City Economic Development Corporation of Kansas City
Lafayette Louisiana Economic Development
Lafayette Economic Development Authority

Competitive Alternatives, 2014 EditionD . 4
Lake Charles Louisiana Economic Development
SWLA Chamber-Economic Development Alliance
Las Vegas City of Las Vegas
Las Vegas Chamber of Commerce
Lexington Lexington-Fayette Urban County Government
Little Rock Little Rock Chamber of Commerce
City of Little Rock
Los Angeles Los Angeles County Economic Development
San Gabriel Valley Economic Partnership
Madison City-Data.com
Manchester City of Manchester
Memphis Memphis Economic Development
Miami City of Miami
Miami Dade County
Minneapolis Greater Minneapolis Chamber of Commerce
Mobile Mobile Area Chamber of Commerce
Monroe Louisiana Economic Development
University of Louisiana at Monroe
Montgomery Montgomery Area Chamber of Commerce
Nashville Nashville Area Chamber of Commerce
New Orleans Louisiana Economic Development; City of New Orleans
New York City Hoover’s Online
City of New York
North Virginia (Metro DC) Northern Virginia Economic Development Coalition
Oklahoma City Greater Oklahoma City Chamber of Commerce
Omaha City of Omaha
Omaha Economic Development Corporation
Orlando Metro Orlando Economic Development Commission
Philadelphia Philadelphia Economic Development
Greater Philadelphia Chamber of Commerce
Phoenix Greater Phoenix Chamber of Commerce
Pittsburgh Urban Redevelopment Authority of Pittsburgh
Portland Portland Metropolitan Chamber of Commerce
Providence Rhode Island Economic Development Corporation
Raleigh Greater Raleigh Chamber of Commerce
Research Triangle Park
Riverside-San Bernardino California Employment Development Department
Inland Empire Economic Partnership
City of Riverside
City of San Bernardino
Sacramento City of Sacramento
Saginaw City of Saginaw, Assessor’s Office
Salem City of Salem
Salt Lake City City of Salt Lake City
Salt Lake City Chamber of Commerce
San Antonio City of San Antonio
San Antonio Economic Development Foundation
San Diego San Diego Regional Economic Development Corporation
San Francisco City and County of San Francisco
San Francisco Center for Economic Development
KPMG’s Guide to International Business Location Costs D . 5
Seattle Seattle Chamber of Commerce
Economic Development Council of Seattle and King County
Shreveport Shreveport Chamber of Commerce
Sioux Falls Sioux Falls Area Chamber of Commerce
Spartanburg City of Spartanburg
Greater Greenville Chamber of Commerce
Spokane Spokane Area Economic Development Council
Washington State Labor Market Information
St. Louis The Alliance of Edwardsville & Glen Carbon (economic development)
Tampa Greater Tampa Chamber of Commerce
Trenton New Jersey Economic Development Association
Wichita Wichita Office of Economic Development
Wilmington Wilmington Economic Development Corporation
Youngstown Youngstown Warren Regional Chamber
General City Populations Online – http://www.citypopulation.de
Google Maps
The World Factbook, Central Intelligence Agency, 2013
B. Land Prices, Construction Costs, and Facility Lease Costs
All countries Colliers International
C. Wages and Salaries, Statutory Plans, and Benefits
Wages & Salaries All countries Mercer (customized report)
Mercer, Total Employment Costs Report 2013
North America ERI Economic Research Institute, Salary Assessor Database, 2013
Mercer, Canada and US Geographic Salary Differentials, 2013
Robert Half, Accounting and Finance Salary Guide, Canada and US, 2013
Statutory Benefits All countries Mercer, Total Employment Costs Report, 2013
North America Tax Facts, KPMG Canada
Canada Revenue Agency
Internal Revenue Service
State Employment and/or Labor Commissions, as required
State/provincial Workers’ Compensation Boards or private insurers, as required
Other Benefits All countries Mercer, Total Employment Costs Report, 2013
Mercer, Worldwide Benefit and Employment Guidelines, 2013
Canada Hewitt Associates (customized report)
United States US Bureau of Labor Statistics, Employer Costs for Employee Compensation, September 2013

Competitive Alternatives, 2014 EditionD . 6
D. Electricity Costs
Australia Adelaide Power Direct, QEnergy
Brisbane Click Energy, Ergon
Melbourne Click Energy, Origin
Sydney Origin
Canada Belleville-Quinte West Veridian Connections
Ontario Energy Board
Brandon Manitoba Hydro
Charlottetown Maritime Electric Company Limited
Chatham-Kent Entergus Powerlines
Edmonton EPCOR
Fredericton New Brunswick Power Corporation
Grand Prairie ATCO, Direct Energy
Halifax Nova Scotia Power
Kamloops BC Hydro
Kelowna BC Hydro
Kingston Kingston Hydro Corporation
Lethbridge City of Lethbridge Electric Utility
ENMAX
Lloydminster ATCO, Direct Energy
Moncton New Brunswick Power Corporation
Montreal Hydro Quebec
Moose Jaw SaskPower
Nanaimo BC Hydro
Niagara Region Horizon
Prince Albert SaskPower
Quebec City Hydro Quebec
Red Deer ENMAX
Regina SaskPower
Saint John New Brunswick Power Corporation
Saskatoon SaskPower
St. John’s Newfoundland Power
Sudbury Greater Sudbury Hydro
Sydney Nova Scotia Power
Toronto Toronto Hydro
Ontario Energy Board
Truro Nova Scotia Power
Vancouver BC Hydro
Windsor-Essex EnWin Utilities
Ontario Energy Board
Winnipeg Manitoba Hydro
Europe All cities EuroStat
International Energy Agency, Energy Prices and Taxes, Q3 2013
Japan All cities International Energy Agency, Energy Prices and Taxes, Q3 2013
Mexico All cities Comision Federal de Electricidad
International Energy Agency, Energy Prices and Taxes, Q3 2013
United States All Cities US Energy Information Administration

KPMG’s Guide to International Business Location Costs D . 7
E. Natural Gas Costs
Australia Adelaide AGL, Energy Australia, Origin
Brisbane Origin
Melbourne AGL, Origin
Sydney AGL, Origin
Canada Alberta ATCO Gas
British Columbia Terasen Gas
Manitoba Manitoba Hydro
New Brunswick Enbridge Gas
Newfoundland Imperial Oil
Petro-Canada
Nova Scotia Imperial Oil
Heritage Gas
Petro-Canada
Ontario Enbridge Gas
Union Gas
Prince Edward Island Imperial Oil
Petro-Canada
Quebec Gaz Métro
Saskatchewan TransGas Limited
Europe All cities EuroStat
International Energy Agency, Energy Prices and Taxes, Q3 2013
Japan All Cities International Energy Agency, Energy Prices and Taxes, Q3 2013
Mexico All Cities Pemex
United States All States US Energy Information Administration
H. Road Transportation Costs
Australia KPMG Australia
F. Sea Transportation Costs
All countries Galaxy Transport Corp. and its agents
G. Air Transportation Costs
All countries Galaxy Transport Corp. and its agents
Competitive Alternatives, 2014 EditionD . 8
Canada & United States North American Inland Freight Model 2013, MMK Consulting,
Model sources include:
American Trucking Association American Trucking Trends 2013
American Trucking Association ATA Driver Compensation Study, 2011
American Trucking Association Motor Carrier Annual Report 2011
BC Ferries
US Energy Information Administration, 2013 data
Fuel Costs, 2013 data: Kent Marketing Services Ltd.
http://www.truckmiles.com
Federation of Tax Administrators
Marine Atlantic
International Registration Plan, Inc.
Matson Lines
Transport Canada, Operating Cost of Trucking and Surface Intermodal Transportation in Canada 2010
Taylor Study, The U.S.-Canada Border: Cost Impacts, Causes, and Short to Long Term Management Options 2003
Worktruckonline.com, Medium Duty Operating Costs Increase in 2008-CY
US Department of Labor, Bureau of Labor Statistics 2012
Galaxy Transport Corp. and its agents
Mexico Cosmex International
I. National and Regional Taxes
Australia All cities KPMG Australia
Canada All cities KPMG Canada, Tax Facts 2013-2014
Revenue Canada
Provincial Revenue/Tax Departments as required
France All cities Fidal (KPMG France)
Germany All cities KPMG Germany
Italy All cities K Studio Associate (KPMG Italy)
Japan All cities KPMG Japan
Mexico All cities KPMG Mexico
Cosmex International
Netherlands All cities KPMG Netherlands
United Kingdom All cities KPMG United Kingdom
United States All cities CCH, 2013 State Tax Handbook
State Revenue/Tax Departments as required
Albuquerque State of New Mexico Taxation & Revenue
Alexandria Louisiana Department of Revenue
Anchorage Alaska Department of Revenue

KPMG’s Guide to International Business Location Costs D . 9
Atlanta Georgia Department of Revenue
Austin Texas Comptroller of Public Accounts
Baltimore Maryland Department of Revenue
Bangor Maine Department of Revenue
Baton Rouge Louisiana Department of Revenue
Beaumont Texas Comptroller of Public Accounts
Bellingham Washington State Department of Revenue
Billings Montana Department of Revenue
Boise Idaho State Tax Commission
Boston Massachusetts Department of Revenue
Buffalo New York State Department of Taxation and Finance
Burlington Vermont Department of Taxes
Cedar Rapids Iowa Department of Revenue
Champaign-Urbana Illinois Department of Revenue
Charleston West Virginia State Tax Department
Charlotte North Carolina Department of Revenue
Cheyenne Wyoming Department of Revenue
Chicago Illinois Department of Revenue
Cincinnati Ohio Department of Taxation
Cleveland Ohio Department of Taxation
Dallas-Fort Worth Texas Comptroller of Public Accounts
Denver Colorado Department of Revenue
Detroit Michigan Department of Treasury
Fargo North Dakota State Tax Department
Gulfport-Biloxi Missouri Department of Revenue
Hartford State of Connecticut, Department of Revenue Services
Honolulu Hawaii Department of Taxation
Houma Louisiana Department of Revenue
Houston Texas Comptroller of Public Accounts
Indianapolis Indiana Department of Revenue
Jackson Mississippi State Tax Commission
Kansas City Missouri Department of Revenue
Lafayette Louisiana Department of Revenue
Lake Charles Louisiana Department of Revenue
Las Vegas Nevada Department of Taxation
Lexington Kentucky Department of Revenue
Little Rock Arkansas Department of Finance and Administration
Los Angeles California Franchise Tax Board
Madison Wisconsin Department of Revenue
Manchester New Hampshire Department of Revenue Administration
Memphis Tennessee Department of Revenue
Miami Florida Department of Revenue
Minneapolis Minnesota Revenue
Mobile Alabama Department of Revenue
Monroe Louisiana Department of Revenue
Montgomery Alabama Department of Revenue
Nashville Tennessee Department of Revenue
New Orleans Louisiana Department of Revenue
New York City New York State Department of Taxation and Finance
North Virginia (Metro DC) Virginia Department of Taxation
Oklahoma City Oklahoma Tax Commission
Omaha Nebraska Department of Revenue
Competitive Alternatives, 2014 EditionD . 10
Orlando Florida Department of Revenue
Philadelphia Pennsylvania Department of Revenue
Phoenix Arizona Department of Revenue
Pittsburgh Pennsylvania Department of Revenue
Portland Oregon Department of Revenue
Providence Rhode Island Division of Taxation
Raleigh North Carolina Department of Revenue
Riverside-San Bernardino California Franchise Tax Board
Sacramento California Franchise Tax Board
Saginaw Michigan Department of Treasury
Salem Oregon Department of Revenue
Salt Lake City Utah State Tax Commission
San Antonio Texas Comptroller of Public Accounts
San Diego California Franchise Tax Board
San Francisco California Franchise Tax Board
Seattle Washington State Department of Revenue
Shreveport Louisiana Department of Revenue
Sioux Falls South Dakota Department of Revenue
Spartanburg South Carolina Department of Revenue
Spokane Washington State Department of Revenue
St. Louis Missouri Department of Revenue
Tampa Florida Department of Revenue
Trenton New Jersey Division of Taxation
Wichita Kansas Department of Revenue
Wilmington Delaware Division of Revenue
Youngstown Ohio Department of Taxation
J. Local Taxes
Australia All cities KPMG Australia
Local city councils
Canada All Cities Provincial Revenue/Tax Departments as required
Belleville-Quinte West City of Belleville
City of Quinte-West
Brandon City of Brandon
Charlottetown Town of Stratford
Chatham-Kent Municipality of Chatham-Kent
Edmonton City of Edmonton
Fredericton City of Fredericton
Grande Prairie City of Grande Prairie
Halifax Halifax Regional Municipality, Tax Division
Kamloops City of Kamloops
Kelowna City of Kelowna
Lethbridge City of Lethbridge
Lloydminster City of Lloydminster
Moncton Business Moncton, Property Taxes
Montreal City of Laval, Tax Department
Moose Jaw City of Moose Jaw, City Hall
Nanaimo City of Nanaimo, Finance Department
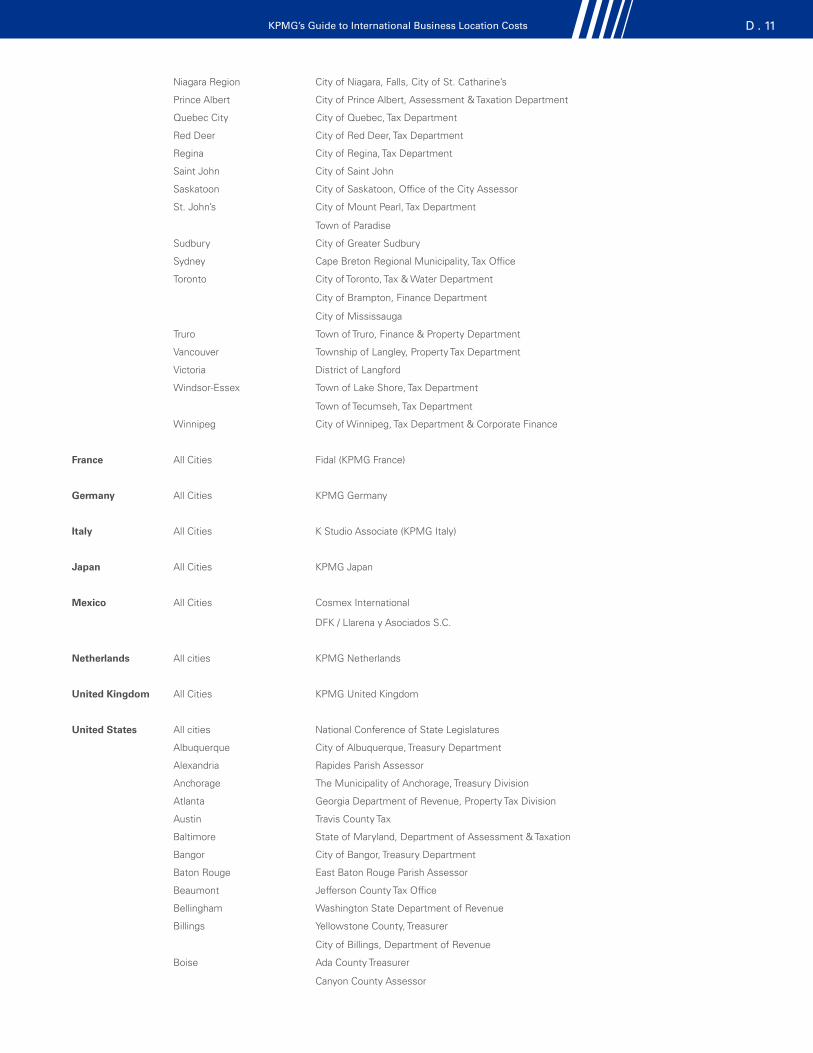
KPMG’s Guide to International Business Location Costs D . 11
Niagara Region City of Niagara, Falls, City of St. Catharine’s
Prince Albert City of Prince Albert, Assessment & Taxation Department
Quebec City City of Quebec, Tax Department
Red Deer City of Red Deer, Tax Department
Regina City of Regina, Tax Department
Saint John City of Saint John
Saskatoon City of Saskatoon, Office of the City Assessor
St. John’s City of Mount Pearl, Tax Department
Town of Paradise
Sudbury City of Greater Sudbury
Sydney Cape Breton Regional Municipality, Tax Office
Toronto City of Toronto, Tax & Water Department
City of Brampton, Finance Department
City of Mississauga
Truro Town of Truro, Finance & Property Department
Vancouver Township of Langley, Property Tax Department
Victoria District of Langford
Windsor-Essex Town of Lake Shore, Tax Department
Town of Tecumseh, Tax Department
Winnipeg City of Winnipeg, Tax Department & Corporate Finance
France All Cities Fidal (KPMG France)
Germany All Cities KPMG Germany
Italy All Cities K Studio Associate (KPMG Italy)
Japan All Cities KPMG Japan
Mexico All Cities Cosmex International
DFK / Llarena y Asociados S.C.
Netherlands All cities KPMG Netherlands
United Kingdom All Cities KPMG United Kingdom
United States All cities National Conference of State Legislatures
Albuquerque City of Albuquerque, Treasury Department
Alexandria Rapides Parish Assessor
Anchorage The Municipality of Anchorage, Treasury Division
Atlanta Georgia Department of Revenue, Property Tax Division
Austin Travis County Tax
Baltimore State of Maryland, Department of Assessment & Taxation
Bangor City of Bangor, Treasury Department
Baton Rouge East Baton Rouge Parish Assessor
Beaumont Jefferson County Tax Office
Bellingham Washington State Department of Revenue
Billings Yellowstone County, Treasurer
City of Billings, Department of Revenue
Boise Ada County Treasurer
Canyon County Assessor

Competitive Alternatives, 2014 EditionD . 12
Boston Massachusetts Department of Revenue, Division of Local Services
Buffalo City of Buffalo, Assessor’s Office
Erie County Clerk
Burlington City of South Burlington, Department of Assessment Administration
Town of Williston
Town of Colchester
Cedar Rapids Linn County Assessor
Iowa Department of Revenue and Finance
Champaign-Urbana County of Champaign Treasury
Charleston Kanawha County, Assessor & County Clerk
Putnam County Assessor
Charlotte North Carolina, Department of Revenue
City of Charlotte
Mecklenburg County
Cheyenne Laramie County Assessor
Chicago Will County Recorder Office
Will County Clerk’s Office, Tax Extension
Illinois Department of Revenue
Cincinnati Hamilton County Auditor; Butler Country Treasurer
Cleveland Cuyahoga County Treasurer's Office
Dallas-Fort Worth Dallas County, Central Appraisal District
Tarrant County, Tax Assessment
Denver Denver Assessor’s Office
Detroit City of Romulus Assessor’s Office
Wayne County Register of Deeds
Fargo North Dakota State Tax Commissioner
Cass County Assessor
Gulfport-Biloxi Harrison County Tax Assessor
Hartford State of Connecticut, Tax Collector & Real Estate Conveyance Tax
Town of Newington, Town Clerk
Town of Southington, Town Clerk & Assessor
Town of Cheshier, Town Clerk
Town of Wolcott, Town Clerk
Town of Enfield, Town Clerk & Assessor
Town of Somers, Town Clerk
Honolulu City of Honolulu, Real Property Assessment Division
State of Hawaii, Department of Taxation
Houma Terrebonne Parish Assessor
Houston Harris County, Tax Assessor/Collector
Indianapolis Hendricks County, Auditor’s Office
Jackson Hinds County, Tax Assessor
Kansas City City of Kansas City
Missouri Department of Revenue
Clay County, Jackson County, Platte County
Lafayette Lafayette Assessor
Lake Charles Calcasieu Parish Sheriff’s Office
Las Vegas Nevada Department of Taxation
Clark County Treasurer
Lexington Lexington-Fayette Urban County Government, County Clerk
PVD Network
Kentucky Department of Revenue

KPMG’s Guide to International Business Location Costs D . 13
Little Rock Pulaski County Treasurer
Los Angeles County of Los Angeles, Department of Auditor-Controller
Madison Dane County; Department of Revenue, Wisconsin
Manchester City of Manchester, Tax Collector’s Office
Memphis Tennessee Department of Revenue
Shelby County, Assessor of Property
Miami Miami Dade County Property Appraisal Department
Minneapolis Minnesota House Research Department
Dakota County Treasurer, Auditor Department
Mobile Alabama Department of Revenue, Property Tax Division
Montgomery State of Alabama, Revenue Department
Nashville Tennessee Comptroller of the Treasury, Division of Property Assessments
New Orleans Orleans and Jefferson Parish Assessors
New York City City of New York, Finance Department
New York State, Office of Real Estate Property Services
Nassau County
North Virginia (Metro DC) Prince William County, Tax Administration
State of Virginia, Deeds Office
Oklahoma City Oklahoma County Assessor
Omaha Douglas County Treasurer
Orlando Orange County Property Appraiser
Philadelphia Montgomery County Assessor
Bucks County Board of Assessment
Pennsylvania Department of Community & Economic Development Services, Governor’s Centre for Local Government Services
State Tax Equalization Board
Phoenix Maricopa County, Finance Department
Pittsburgh County Allegheny Treasurer
Portland Multnomah County, Assessment & Taxation & Recorder’s Office
Oregon Department of Revenue – Statistics
Providence Rhode Island Economic Development Corporation
Rhode Island Tax Department
State of Rhode Island Municipal Affairs, Department of Administration
Rhode Island Economic Development Corporation
Raleigh Wake County Department of Revenue & Register of Deeds
North Carolina Department of Revenue, Property Tax Division
Riverside-San Bernardino Riverside County Auditor
San Bernardino County Auditor
Sacramento Sacramento County Auditor
Saginaw Saginaw County, Register of Deeds
State of Michigan, Department of Treasury
Salem Marion County Assessor Office
Salt Lake City Salt Lake County, Auditor
San Antonio Bexar County, Tax Assessor-Collector
San Diego County of San Diego Assessor, Recorder, County Clerk & Property Tax Services
San Francisco County of Alameda, Auditor-Controller
County of San Mateo, Controller
Seattle King County, Department of Assessments
Pierce County
Kent Economic Development
Washington State Department of Revenue

Competitive Alternatives, 2014 EditionD . 14
Shreveport Caddo Parish Tax Division
City of Shreveport Revenue Division
Louisiana Tax Commission
Sioux Falls South Dakota Department of Revenue and Regulation, Business Tax Division
County of Minnehaha, Register of Deeds
Sioux Falls Development Foundation
Spartanburg South Carolina Department of Commerce & Tax Department
County of Spartanburg, Auditor
Spokane Spokane County Assessor
Spoke County Treasurer
Washington State Department of Revenue
St. Louis St Louis County, Collector of Revenue & Department of Taxes
Missouri Department of Revenue
Tampa Hillsborough County
Polk County Tax Controller
Tampa Bay Economic Development
Greater Tampa Chamber of Commerce
Trenton Mercer County Taxation Department
New Jersey Division of Taxation, Realty Transfer Fees
Wichita Sedgwick County, Clerk’s Office
Wilmington Delaware Division of Revenue
Newcastle County Recorder of Deeds
State of Delaware, Property Taxes
Youngstown Trumbull County Auditor
Ohio Department of Taxation

KPMG’s Guide to International Business Location Costs D . 15
(This page is intentionally blank)