analysis of transmission alternatives for competitive ...€¦ · analysis of transmission...
TRANSCRIPT

Analysis of Transmission Alternatives for
Competitive Renewable Energy Zones in Texas
ERCOT System Planning
December, 2006
Attachment A
ANALYSIS OF TRANSMISSION ALTERNATIVES FOR COMPETITIVE RENEWABLE ENERGY ZONES IN TEXAS
EXECUTIVE SUMMARY
ERCOT has performed an independent evaluation, with input from its stakeholders and the
Southwest Power Pool, of the potential for wind generation development in Texas and of the
transmission improvements necessary to deliver a portion of this new wind generation capacity
to electric customers in ERCOT. This study was conducted to support the Public Utility
Commission of Texas (PUCT) in meeting its requirements under the Public Utility Regulatory Act
of 2005, Section 39.904 (g), to designate competitive renewable energy zones (CREZs).
Report Findings
There is significant potential for development of wind resources in Texas.
There are currently 2,508 Megawatts (MW) of wind generation in-service in ERCOT. At least 4,850 MW of wind resources are likely to be in-service by the end of 2007, and around 17,000 MW of wind generation has requested interconnection analysis. Much of that current wind generation development is in West Texas.
Studies indicate that the existing transmission network is fully utilized with respect to wind transfers from West Texas to the remainder of ERCOT. Thus, new bulk transmission lines are needed to support significant transfers of additional wind generation from the West Texas area.
From a transmission planning perspective, there are four general areas of wind capacity expansion: the Gulf Coast; the McCamey area, central-western Texas, and the Texas Panhandle. Transmission solutions for each of these areas are described in this report which provide an incremental plan for each area and form the basis of transmission solutions to support combinations of wind development between two or more areas.
Some common projects will be needed to mitigate the impact of the new CREZ-related generation on existing wind generation. Even with these projects, existing wind generation facilities will be more susceptible to curtailment due their generally higher shift factors on the remaining system constraints.
This study does not attempt to capture all of the benefits and costs associated with the designation of CREZs, but focuses primarily on the direct costs and benefits related to the electric power system.
The production cost savings per kW of new wind generation varies little between the different areas.
The Coastal area has lower annual capacity factor sites than the other areas but the wind output is somewhat more coincident with the ERCOT electrical load.
The Panhandle area has more resources with high annual capacity factors.
The Coastal area requires the least transmission investment per MW of installed new wind capacity.
ERCOT Competitive Renewable Energy Zone Study 12/1/2006 Executive Summary
ES-2
The transmission cost per MW is higher for the Panhandle area; the higher annual capacity factor of the resources in this area does not offset this higher cost.
The first level solution for the Central and McCamey areas use the same bulk transmission addition, so the designation of CREZs and addition of resources in these areas must be generally considered in conjunction.
While transmission solutions were generally developed that provided 1,000 MW incremental steps for each area, the second step for the McCamey level is larger, in terms of both cost and MW of wind generation supported; although the cost per MW of supported wind is similar to the other levels for McCamey and Central areas.
ERCOT will be performing an analysis of the impact of significant additional wind generation on the level of the different ancillary services that it procures to maintain system reliability. In addition, further ERCOT analysis of several issues is needed once a specific set of CREZs is designated by the PUCT and wind generation developers have indicated specific locations. These additional analyses include reactive support needs, dynamic stability analyses, optimization of the “on-ramps” within the CREZs and analysis of the specific projects or operational procedures needed to mitigate curtailments of existing wind generation.
Study Overview
To complete this study, ERCOT first solicited input from wind developers and other stakeholders
about the areas of the state (by county) in which they were interested in developing wind
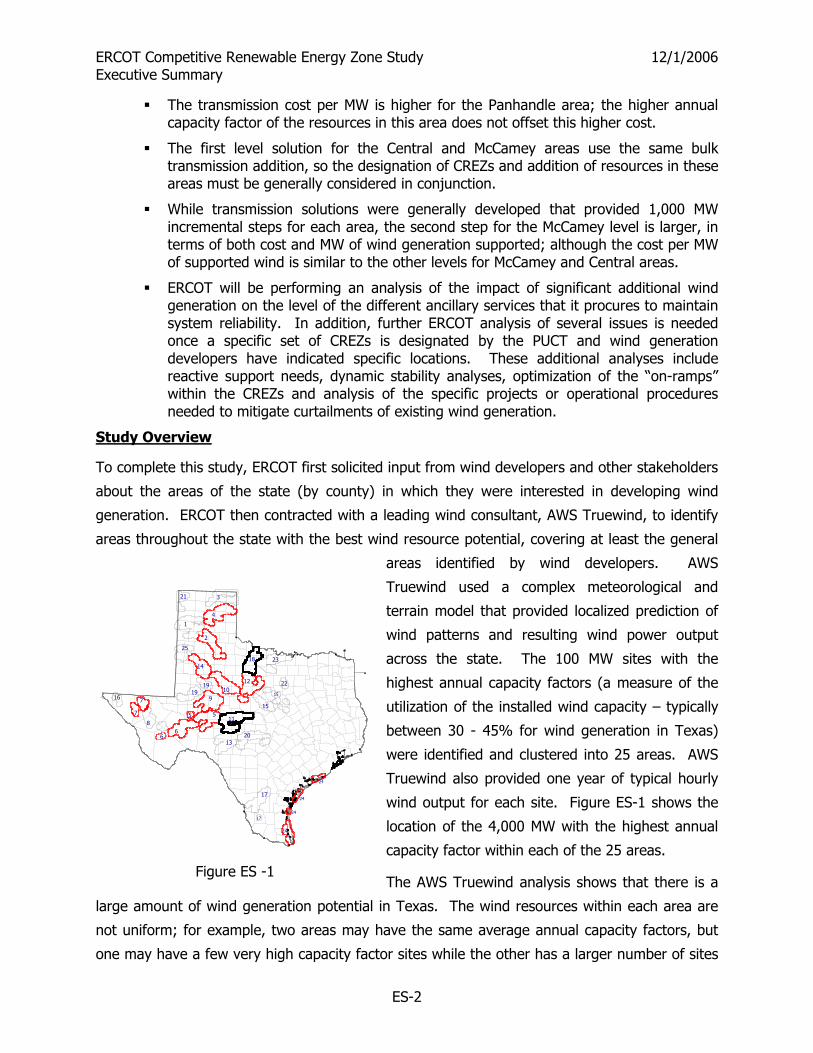
generation. ERCOT then contracted with a leading wind consultant, AWS Truewind, to identify
areas throughout the state with the best wind resource potential, covering at least the general
areas identified by wind developers. AWS
Truewind used a complex meteorological and
terrain model that provided localized prediction of
wind patterns and resulting wind power output
across the state. The 100 MW sites with the
highest annual capacity factors (a measure of the
utilization of the installed wind capacity – typically
between 30 - 45% for wind generation in Texas)
were identified and clustered into 25 areas. AWS
Truewind also provided one year of typical hourly
wind output for each site. Figure ES-1 shows the
location of the 4,000 MW with the highest annual
capacity factor within each of the 25 areas.
The AWS Truewind analysis shows that there is a
large amount of wind generation potential in Texas. The wind resources within each area are
not uniform; for example, two areas may have the same average annual capacity factors, but
one may have a few very high capacity factor sites while the other has a larger number of sites
21 3
4
1
2
25
1418
12
23
22
15
10199
511
16 7
7
86
5
6
15
1320
17
24
24
24
24
17
19
Figure ES -1
ERCOT Competitive Renewable Energy Zone Study 12/1/2006 Executive Summary
ES-3
Existing
PendingSigned IA
NA
Existing
PendingSigned IA
Existing
PendingSigned IA
NA
with lower capacity factors. In addition, the time of year and time of day that the wind blows
were found to vary significantly across some areas (for example between the areas closer to the
Gulf Coast and west Texas). All of these characteristics of the potential wind power output in
the different areas were taken into account in the subsequent transmission analysis.
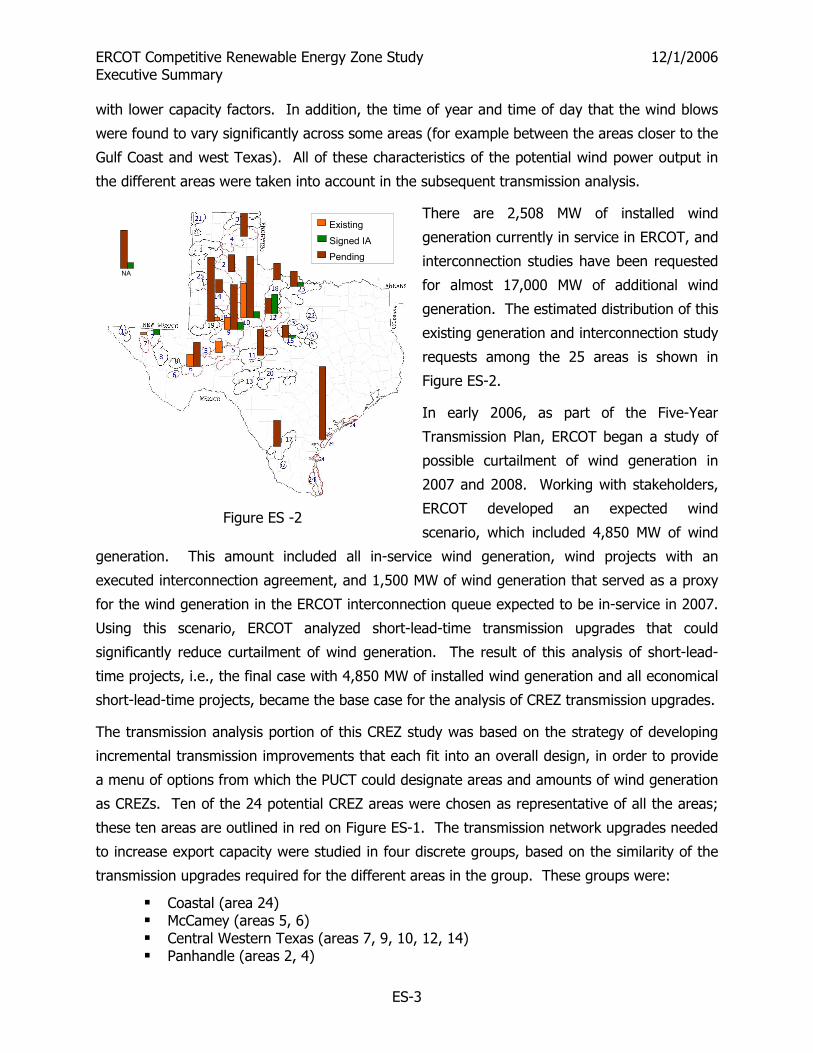
There are 2,508 MW of installed wind
generation currently in service in ERCOT, and
interconnection studies have been requested
for almost 17,000 MW of additional wind
generation. The estimated distribution of this
existing generation and interconnection study
requests among the 25 areas is shown in
Figure ES-2.
In early 2006, as part of the Five-Year
Transmission Plan, ERCOT began a study of
possible curtailment of wind generation in
2007 and 2008. Working with stakeholders,
ERCOT developed an expected wind
scenario, which included 4,850 MW of wind
generation. This amount included all in-service wind generation, wind projects with an
executed interconnection agreement, and 1,500 MW of wind generation that served as a proxy
for the wind generation in the ERCOT interconnection queue expected to be in-service in 2007.
Using this scenario, ERCOT analyzed short-lead-time transmission upgrades that could
significantly reduce curtailment of wind generation. The result of this analysis of short-lead-
time projects, i.e., the final case with 4,850 MW of installed wind generation and all economical
short-lead-time projects, became the base case for the analysis of CREZ transmission upgrades.
The transmission analysis portion of this CREZ study was based on the strategy of developing
incremental transmission improvements that each fit into an overall design, in order to provide
a menu of options from which the PUCT could designate areas and amounts of wind generation
as CREZs. Ten of the 24 potential CREZ areas were chosen as representative of all the areas;
these ten areas are outlined in red on Figure ES-1. The transmission network upgrades needed
to increase export capacity were studied in four discrete groups, based on the similarity of the
transmission upgrades required for the different areas in the group. These groups were:
Coastal (area 24) McCamey (areas 5, 6) Central Western Texas (areas 7, 9, 10, 12, 14) Panhandle (areas 2, 4)
Figure ES -2

ERCOT Competitive Renewable Energy Zone Study 12/1/2006 Executive Summary
ES-4
For each group, many transmission solutions were studied (over 60 different solutions were
studied for the McCamey area alone). The solution that allowed the connection of the highest
amount of high annual capacity factor wind generation into the system with limited curtailment
of total wind generation at the lowest capital cost was identified for each grouping individually.
This analysis was repeated at several different levels of installed wind capacity and distribution
of that capacity among the areas within each group. Finally, the same process was repeated
with the new wind generation installed in two or more areas (e.g. Central and McCamey). The
previously identified transmission solutions for each grouping were analyzed in different
combinations and with different distributions of wind capacity between these areas. The goal
was to evaluate how much total wind generation could be supported by that combination if the
generation were distributed among the areas in such a way as to maximize the supported wind
generation. For example, a solution might accommodate 2,000 MW in Central and 1,000 MW in
McCamey or 2,500 MW in Central and 800 MW in McCamey.
A simulation of the hourly security-constrained economic dispatch of all of the generators in
ERCOT to serve the total ERCOT system load for a year was performed for each scenario and
compared to a similar simulation without any new CREZ wind generation and associated
transmission. In these simulations, the wind generation was modeled using the hourly outputs
developed by AWS Truewind. Since the marginal cost of the wind generators are near zero, the
output of each wind site in a particular hour would be equal to the hourly output provided by
AWS Truewind, so long as it is not curtailed due to transmission limitations. An equivalent
amount of output from the thermal generation having the highest marginal costs on the system
would be displaced, also respecting the reliability limits of the transmission system. The cost
savings associated with this displaced thermal generation were calculated, as well as the
change in total generator revenues (based on marginal costs), for each scenario.
Figure ES-3 provides a summary of the preferred solutions for each area, as well as several
combinations. While the analysis performed for this study provides the PUCT with the data
necessary to judge the relative costs and benefits of potential CREZ designations, ERCOT will
need to perform several additional analyses once the PUCT has designated a specific set of
CREZs; it was not feasible to perform these analyses on every option within the allotted
timeframe. Specific terminations of the transmission lines will need to be evaluated based on
feedback from Transmission Owners on the feasibility of connections to specific substations,
particularly in the Hill Country and Fort Worth areas. Once wind developers have indicated
specific geographic locations at which they will site new wind generation, an additional analysis
of the appropriate “on-ramps” (lines and substations to most efficiently connect the wind

ERCOT Competitive Renewable Energy Zone Study 12/1/2006 Executive Summary
ES-5
generation into the CREZ-related bulk transmission system) must be performed. An analysis of
the reactive support devices necessary to maintain system voltages within appropriate levels
will be needed. A study of the dynamic response of the system to critical contingencies will
need to be performed to determine if the level of wind generation allowed in selected CREZs
should be reduced due to dynamic reliability criteria. Finally, since the overall wind curtailment
allowed under each CREZ transmission solution may inordinately affect the existing wind
generation that is connected to the existing lower voltage transmission system, additional
analysis of the projects needed to mitigate these effects will be needed. Some upgrades of this
type were included in the present study, but the actual system upgrades which are ultimately
needed will depend on the location and amount of wind generation development that occurs.
ERCOT is also currently initiating a study, to be completed in 2007, of the potential need for
additional ancillary services to maintain system reliability with increased levels of wind
generation.
Detailed descriptions of input assumptions, analysis methodology, and study results are
provided in the complete report.
Figure ES -3
Scenario
New
Wind Capacity (M
W)
Transmission Capital
Cost ($M)
Annual System
Production Cost Savings ($M
/Yr)
Annual System
Generator R
evenue Reductions ($M
/Yr)
New
Wind Average
Capacity Factor (%)
New
Wind G
enerator Capital Cost ($M
)
Average New
Wind
Generator R
evenue ($/M
Wh)
Annual System
Production Cost Savings per kW
New
Wind
($/kW-Yr)
Annual System
Generator R
evenue Reductions per kW
New
W
ind ($/kW-Yr)
Transmission Capital
Cost per kW N
ew W
ind ($/kW
)
Ratio of All Investm
ent Costs to Production Cost
Savings
Coastal Projects A B C D E C/A D/A B/A (E+B)/C Coastal Level 1 1,000 15 129 221 38.3 1,000 43.1 129 221 15 7.90 Coastal Level 2 2,000 75 262 437 37.1 2,000 40.7 131 218 38 7.93 Coastal Level 3 3,000 320 383 713 37.0 3,000 33.3 128 238 107 8.68 Central Western Texas Projects Level 1 2,000 376 276 464 40.1 2,000 29.9 138 232 188 8.62 Level 2 3,000 723 406 727 39.0 3,000 29.6 135 242 241 9.18 Level 3 3,800 1,019 495 963 39.3 3,800 28.9 130 253 268 9.74 McCamey Projects Level 1 1,500 320 198 406 40.5 1,500 32.3 132 271 213 9.21 Level 2 3,800 861 506 1,069 41.0 3,800 30.2 133 281 227 9.22 Panhandle Projects Level 1 800 265 112 247 43.2 800 33.2 139 309 331 9.55 Level 2 1,800 645 249 474 43.3 1,800 32.8 138 263 358 9.84 Level 3 2,400 715 297 620 42.8 2,400 26.2 124 258 298 10.50 Level 4 4,600 1,515 587 1,250 42.5 4,600 27.1 128 272 329 10.42 Combination Projects
Central Level 2 with New Wind in Central (2,000 MW) and McCamey (1,250 MW) 3,250 863 443 796 39.8 3,250 30.0 136 245 266 9.29
Central Level 3 with New Wind in Central (3,000 MW) and McCamey (1,000 MW) 4,000 1,159 520 992 39.0 4,000 29.1 130 248 290 9.92
Central Level 2 and Coastal Level 2 with New Wind in Central (2,000 MW), McCamey (1,250 MW) and Coastal (2,000 MW)
5,250 938 705 1,278 38.8 5,250 31.9 134 243 179 8.78
New Wind Capacity for each scenario is the level of new installed wind generation that results in ~2% overall wind energy curtailment Transmission Capital Cost for each scenario does not include the cost of projects that may be needed to mitigate the impact of the added CREZ generation on existing resources (as described in Section IV (I) of the report).
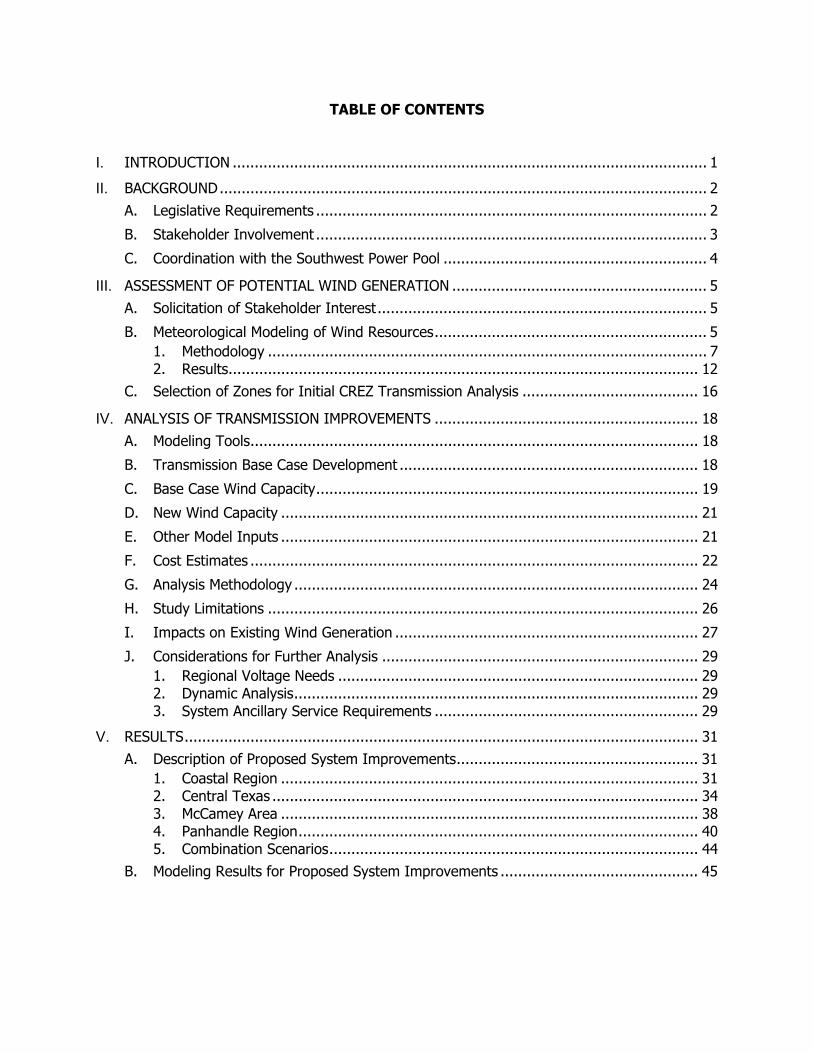
TABLE OF CONTENTS
I. INTRODUCTION ............................................................................................................ 1 II. BACKGROUND............................................................................................................... 2
A. Legislative Requirements ......................................................................................... 2 B. Stakeholder Involvement ......................................................................................... 3 C. Coordination with the Southwest Power Pool ............................................................ 4
III. ASSESSMENT OF POTENTIAL WIND GENERATION .......................................................... 5 A. Solicitation of Stakeholder Interest........................................................................... 5 B. Meteorological Modeling of Wind Resources.............................................................. 5
1. Methodology .................................................................................................... 7 2. Results........................................................................................................... 12
C. Selection of Zones for Initial CREZ Transmission Analysis ........................................ 16
IV. ANALYSIS OF TRANSMISSION IMPROVEMENTS ............................................................ 18 A. Modeling Tools...................................................................................................... 18 B. Transmission Base Case Development .................................................................... 18 C. Base Case Wind Capacity....................................................................................... 19 D. New Wind Capacity ............................................................................................... 21 E. Other Model Inputs ............................................................................................... 21 F. Cost Estimates ...................................................................................................... 22 G. Analysis Methodology ............................................................................................ 24 H. Study Limitations .................................................................................................. 26 I. Impacts on Existing Wind Generation ..................................................................... 27 J. Considerations for Further Analysis ........................................................................ 29
1. Regional Voltage Needs .................................................................................. 29 2. Dynamic Analysis............................................................................................ 29 3. System Ancillary Service Requirements ............................................................ 29
V. RESULTS..................................................................................................................... 31 A. Description of Proposed System Improvements....................................................... 31
1. Coastal Region ............................................................................................... 31 2. Central Texas ................................................................................................. 34 3. McCamey Area ............................................................................................... 38 4. Panhandle Region........................................................................................... 40 5. Combination Scenarios.................................................................................... 44
B. Modeling Results for Proposed System Improvements ............................................. 45
TABLE OF CONTENTS (Cont.)
VI. DISCUSSION ............................................................................................................... 48 A. Comparison of Alternatives .................................................................................... 48 B. Economic Considerations ....................................................................................... 49 C. Impact of Wind Curtailment ................................................................................... 49 D. Additional Wind Added to the System..................................................................... 52 E. Other Considerations............................................................................................. 53
1. System Upgrades Using 765-kV Circuits ........................................................... 53 2. Comanche Switch Circuit Upgrade ................................................................... 54
F. Future Steps ......................................................................................................... 55
VII. CONCLUSIONS ............................................................................................................ 57
APPENDICES
Appendix A
Wind Generation Potential by Wind Energy Zone
Appendix B
List of Common Projects
Appendix C
Economic Modeling Results
LIST OF FIGURES
Figure 1: Areas of Interest as Expressed by ERCOT Stakeholders
Figure 2: Map of Wind Resources Zones
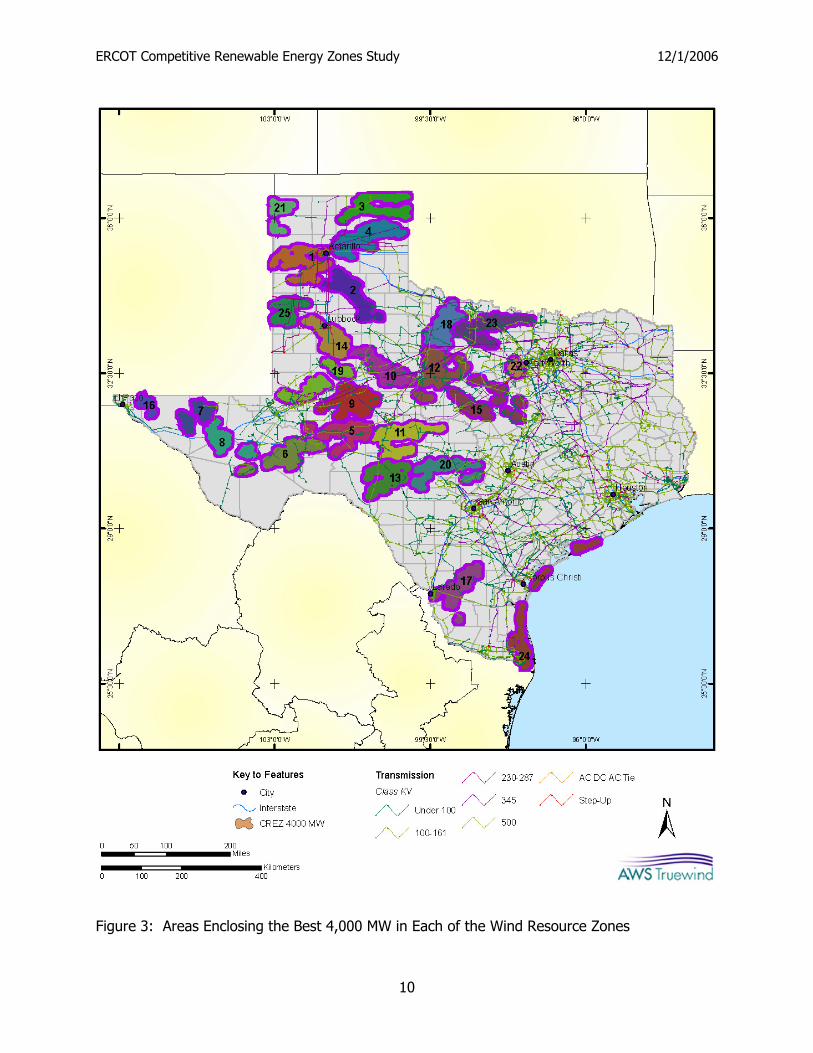
Figure 3: Areas Enclosing the Best 4,000 MW in Each of the Wind Resource Zones
Figure 4: Areas Enclosing the Best 1,000 MW in Each of the Wind Resource Zones
Figure 5: Typical Monthly Average Capacity Factors for Several Zones
Figure 6: Typical Average Hourly Wind Generation in April
Figure 7: Typical Average Hourly Wind Generation in July
Figure 8: Wind Zones Selected for Initial Transmission Analysis
Figure 9: Comparison of Capacity Factor and Total Energy Price for Wind Capacity
Figure 10: Initial Transmission Solution for Wind Zone 24
Figure 11: Second Level of Transmission Solution for Wind Zone 24
Figure 12: Third Level of Transmission Solution for Wind Zone 24
Figure 13: Red Creek to Hill Country Option
Figure 14: Paint Creek to Fort Worth Option
Figure 15: Bluff Creek to Bosque Option
Figure 16: First Option for New Wind Resources in the McCamey Area
Figure 17: Second Option for New Wind Resources in the McCamey Area
Figure 18: First Level of Transmission Solution for Panhandle Wind Resources
Figure 19: Second Level of Transmission Solution for Panhandle Wind Resources
Figure 20: Third Level of Transmission Solution for Panhandle Wind Resources
Figure 21: Fourth Level of Transmission Solution for Panhandle Wind Resources
Figure 22: Curtailment of Wind Resources
Figure 23: Wind Energy Curtailment by Unit
ERCOT Competitive Renewable Energy Zones Study 12/1/2006
1
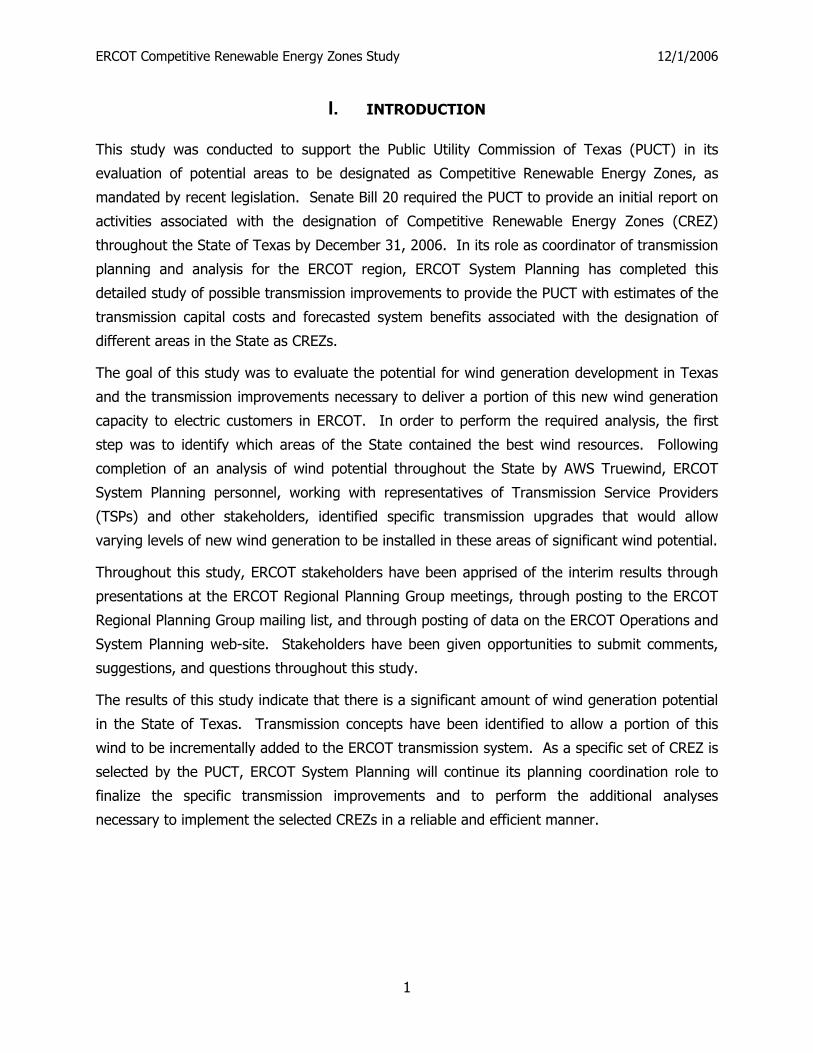
I. INTRODUCTION
This study was conducted to support the Public Utility Commission of Texas (PUCT) in its
evaluation of potential areas to be designated as Competitive Renewable Energy Zones, as
mandated by recent legislation. Senate Bill 20 required the PUCT to provide an initial report on
activities associated with the designation of Competitive Renewable Energy Zones (CREZ)
throughout the State of Texas by December 31, 2006. In its role as coordinator of transmission
planning and analysis for the ERCOT region, ERCOT System Planning has completed this
detailed study of possible transmission improvements to provide the PUCT with estimates of the
transmission capital costs and forecasted system benefits associated with the designation of
different areas in the State as CREZs.
The goal of this study was to evaluate the potential for wind generation development in Texas
and the transmission improvements necessary to deliver a portion of this new wind generation
capacity to electric customers in ERCOT. In order to perform the required analysis, the first
step was to identify which areas of the State contained the best wind resources. Following
completion of an analysis of wind potential throughout the State by AWS Truewind, ERCOT
System Planning personnel, working with representatives of Transmission Service Providers
(TSPs) and other stakeholders, identified specific transmission upgrades that would allow
varying levels of new wind generation to be installed in these areas of significant wind potential.
Throughout this study, ERCOT stakeholders have been apprised of the interim results through
presentations at the ERCOT Regional Planning Group meetings, through posting to the ERCOT
Regional Planning Group mailing list, and through posting of data on the ERCOT Operations and
System Planning web-site. Stakeholders have been given opportunities to submit comments,
suggestions, and questions throughout this study.
The results of this study indicate that there is a significant amount of wind generation potential
in the State of Texas. Transmission concepts have been identified to allow a portion of this
wind to be incrementally added to the ERCOT transmission system. As a specific set of CREZ is
selected by the PUCT, ERCOT System Planning will continue its planning coordination role to
finalize the specific transmission improvements and to perform the additional analyses
necessary to implement the selected CREZs in a reliable and efficient manner.
ERCOT Competitive Renewable Energy Zones Study 12/1/2006
2
II. BACKGROUND
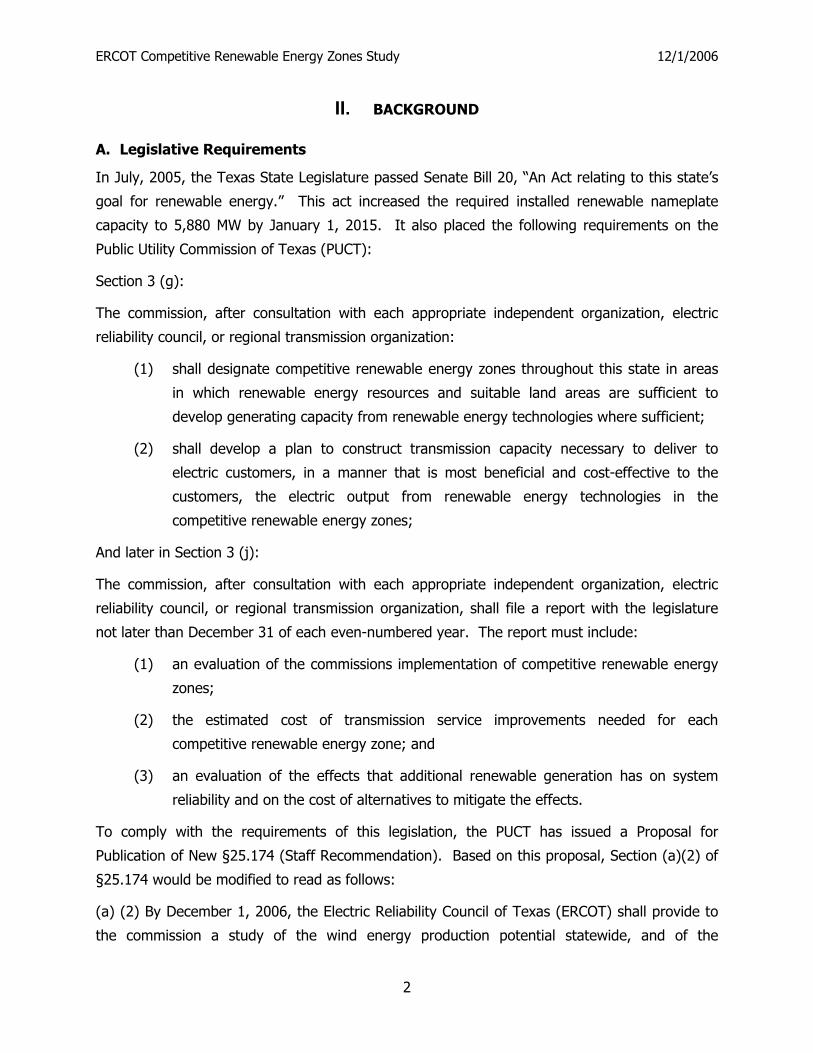
A. Legislative Requirements
In July, 2005, the Texas State Legislature passed Senate Bill 20, “An Act relating to this state’s
goal for renewable energy.” This act increased the required installed renewable nameplate
capacity to 5,880 MW by January 1, 2015. It also placed the following requirements on the
Public Utility Commission of Texas (PUCT):
Section 3 (g):
The commission, after consultation with each appropriate independent organization, electric
reliability council, or regional transmission organization:
(1) shall designate competitive renewable energy zones throughout this state in areas
in which renewable energy resources and suitable land areas are sufficient to
develop generating capacity from renewable energy technologies where sufficient;
(2) shall develop a plan to construct transmission capacity necessary to deliver to
electric customers, in a manner that is most beneficial and cost-effective to the
customers, the electric output from renewable energy technologies in the
competitive renewable energy zones;
And later in Section 3 (j):
The commission, after consultation with each appropriate independent organization, electric
reliability council, or regional transmission organization, shall file a report with the legislature
not later than December 31 of each even-numbered year. The report must include:
(1) an evaluation of the commissions implementation of competitive renewable energy
zones;
(2) the estimated cost of transmission service improvements needed for each
competitive renewable energy zone; and
(3) an evaluation of the effects that additional renewable generation has on system
reliability and on the cost of alternatives to mitigate the effects.
To comply with the requirements of this legislation, the PUCT has issued a Proposal for
Publication of New §25.174 (Staff Recommendation). Based on this proposal, Section (a)(2) of
§25.174 would be modified to read as follows:
(a) (2) By December 1, 2006, the Electric Reliability Council of Texas (ERCOT) shall provide to
the commission a study of the wind energy production potential statewide, and of the
ERCOT Competitive Renewable Energy Zones Study 12/1/2006
3
transmission constraints that are most likely to limit the deliverability of electricity from wind
energy resources. ERCOT shall consult with other regional transmission organizations,
independent organizations, independent system operators, or utilities in its analysis of regions
of Texas outside the ERCOT power region. At a minimum, the study submitted by ERCOT shall
include:
(A) a map and geographic descriptions of regions that can reasonably accommodate at
least 1,000 megawatts (MW) of new wind-powered generation resources;
(B) an estimate of the maximum generating capacity (in MW) that each zone can
reasonably accommodate and an estimate of the zone’s annual production
potential;
(C) a description of the improvements necessary to provide transmission service to the
region, a preliminary estimate of the cost, and identification of the transmission
service provider (TSP) or TSPs whose existing transmission facilities would be
directly affected;
(D) an analysis of any potential combinations of zones that, in ERCOT’s estimation,
would result in significantly greater efficiency if developed together; and
(E) the amount of generating capacity already in service in the zone, the amount not in
service but for which interconnection agreements have been executed, and the
amount under study for interconnection.
This report, along with the analysis described, has been completed in order to comply with
these requirements.
B. Stakeholder Involvement
ERCOT, as the Independent Organization for the ERCOT region, conducts planning studies in a
manner that is unbiased and seeks to achieve a balance among the various stakeholder
interests. The ERCOT Planning Charter states, in part, that ERCOT will accomplish its mission
through “An open and collaborative process involving electric industry members, customers and
regulators.” Following these guidelines, ERCOT System Planning has completed this study in
consultation with Transmission Service Providers (TSPs), wind developers, and representatives
of all interested stakeholder organizations through the Regional Planning process. Project
status updates have been provided at regularly scheduled ERCOT Regional Planning Group
meetings throughout the 2006 calendar year. Stakeholder comments have been solicited, and
all comments that have been received have been carefully reviewed. Presentations from these
ERCOT Competitive Renewable Energy Zones Study 12/1/2006
4
meetings, along with other project documentation and data, have been posted on the
Operations and System Planning Data page at the ERCOT web-site.
In addition, ERCOT System Planning personnel have participated in numerous one-on-one
meetings, telephone calls, and email correspondence with representatives of various
stakeholder organizations throughout the course of this study.
Most notably, a significant effort was made at the beginning of the study to compile the level of
wind generation development interest in different regions of the state from all stakeholders,
and from representatives of wind development companies in particular. Prior to this project,
ERCOT System Planning had only generation interconnection requests to inform its analysis and
these requests may be significantly influenced by the perceived availability of existing
transmission capacity. ERCOT did not have data regarding where the significant wind resources
were located in Texas, how much difference existed between the best wind resources in the
State and areas with lesser resources, or the possible impediments to actual development of
these wind resources. The input from stakeholders was used to determine which areas should
initially be included for evaluation in the study.
C. Coordination with the Southwest Power Pool
ERCOT System Planning has coordinated the work conducted as part of this study with
representatives of the Southwest Power Pool (SPP). As the Regional Transmission Organization
for portions of Texas in the Panhandle and in eastern Texas (as well as areas outside of Texas),
SPP is responsible for transmission planning in those areas. Through numerous telephone
conferences, meetings, and participation of SPP representatives at ERCOT Regional Planning
Group meetings, transmission plans for the two regions were shared as they evolved, and
possible efficiencies and synergies for delivery of wind generation to loads in ERCOT were
explored. The results of this effort are described later in this document.

ERCOT Competitive Renewable Energy Zones Study 12/1/2006
5
III. ASSESSMENT OF POTENTIAL WIND GENERATION
A. Solicitation of Stakeholder Interest
The overall goal of this study is to assess the wind resource potential throughout the state of
Texas, and then to analyze the need and certain costs and benefits of transmission to integrate
wind resources from different areas into the existing transmission infrastructure. However,
even before an analysis of wind potential could be conducted, it was important that the interest
of wind developers be assessed for different parts of the state, in order to ensure both that
areas with significant developer interest were considered in the study, and that areas with little
or no interest on the part of wind developers were assessed in that light. As there are
numerous factors that are significant to wind developers that are not within the scope of this
study, factors such as opposition by local landowners, difficulty of construction due to local
topography, and impacts of wind turbines on local avian or bat populations, the appropriate first
step in assessing wind potential was to solicit from wind development companies the areas in
which they had specific interests.
During February, 2006, ERCOT System Planning solicited information from all stakeholders
regarding areas in which there was market interest in developing wind resources. Information
was received from stakeholders through emails and through meetings between representatives
of wind development companies and ERCOT staff. The information received is depicted in the
map provided as Figure 1. This information was used to ensure that the areas of the State with
market interest were adequately considered in this study.
B. Meteorological Modeling of Wind Resources
In order to obtain a qualified, independent analysis of wind resources throughout the State of
Texas, ERCOT System Planning solicited proposals from outside consultants who specialized in
meteorological modeling and wind generation analysis. ERCOT reviewed the proposals that
were received and selected AWS Truewind of Albany, New York, to provide the requested
services.
ERCOT stakeholders were notified of the selection of AWS Truewind by an announcement sent
to the Regional Planning Group electronic mailing list on May 4, 2006. ERCOT System Planning
also requested that stakeholders contact AWS Truewind directly if they were willing to share, on
a confidential basis, any of their proprietary wind speed data to help benchmark the modeling
results.

6
Figure 1: Areas of Interest as Expressed by ERCOT Stakeholders
Areas of Stakeholder Interest
ERCOT Stakeholder Input on
Competitive Renewable Energy
Zones
ERCOT Competitive Renewable Energy Zones Study 12/1/2006
7
1. Methodology
AWS Truewind conducted its analysis of wind generation potential using a proprietary model
called Mesomap. This model is an integrated set of atmospheric models, computer systems,
and meteorological and geophysical databases. The two main models are a mesoscale
numerical weather prediction model (MASS) and a mass-conserving microscale wind flow model
(WindMap). The main source of meteorological data is the reanalysis database produced by the
National Centers for Environmental Prediction (NCEP); reanalysis data provide a snapshot of
global weather conditions (including temperature, pressure, wind, atmospheric moisture, and
other parameters) every 6 hours at multiple levels above the earth’s surface. In its normal
mode of operation, MesoMap simulates wind conditions in a region for a sample of 366 days
from 1989 to 2004 at a resolution of 200 m. Aside from wind speed maps, MesoMap generates
hourly wind speed, direction, temperature, and other weather parameters, which can be used
to calculate turbine output for specific turbine models. The system runs on a distributed
computer network consisting of about 130 processors.
As part of this study, AWS Truewind benchmarked its modeling results against wind data from
existing tall towers in the state of Texas. Some of these data are publicly available, and some
were provided on a confidential basis by ERCOT stakeholders. In addition, land use patterns
were analyzed to determine the amount of land available for wind development. Land-use data
included roads, administrative boundaries, designated federal and state forests and parks,
military reserves, water bodies, populated areas, and topography. All of these data except
elevations, residential, and water bodies were provided by ESRI, Inc. Elevation data were
obtained from the 30-meter National Elevation Dataset, and water bodies and populated areas
are from the 30-meter National Land Cover Database (NLCD 2001).
The initial step in the wind generation resource modeling process was to produce a map of
potential wind project sites and a summary of their basic characteristics (e.g., location, rated
capacity, mean speed, net capacity factor, distance to nearest road and transmission line, and
cost of energy). The wind speed map and speed and temperature distributions generated by
MesoMap were combined to create a map of expected gross capacity factors for a generic large
wind turbine (1.5-2.5 MW class). Typical losses were applied to convert from gross to net unit
output. Exclusion zones, including national and state parks and forests, other wilderness or
protected areas, military reservations, areas within one mile of an inhabited area, water bodies,
and terrain with a slope greater than 20% were then identified and mapped.
Using this geographical information system data, specific sites that had sufficient available land
to support 100 MW of installed wind generation and a capacity factor above a specified

ERCOT Competitive Renewable Energy Zones Study 12/1/2006
8
minimum value were selected. Capacity factor is a measure of the level of utilization of the
wind generators on the site. The term capacity factor means the amount of energy produced
by a generator over the period of a year, as a percentage of the product of the generator’s
nameplate capacity multiplied by the number of hours in a year (8,760). In other words, the
capacity factor is the percentage of energy actually produced by a unit compared to the amount
it would have produced if it ran at its nameplate rating over an entire year. The minimum
capacity factor was adjusted until a sufficient number of potential sites in diverse parts of
Texas, covering at least the logical portion of each of the areas for which wind development
interest had been identified by ERCOT stakeholders, were located.
Once these sites were located, they were grouped into 25 zones based on similarity of wind
resource (as characterized by mean speed and seasonal/diurnal patterns). A map depicting the
location of these initial 25 zones is provided as Figure 2. The numbering of these zones run
generally from left to right, as they had not been ranked in any way at this stage.
For each zone, a generation supply curve was developed, based on the amount of developable
land in each zone, the existing wind resources, and the output power curve of a generic large
wind turbine (1.5 - 2.5 MW class). These generation supply curves are provided in Appendix A.
These initial results were presented at the Regional Planning Group meeting on June 2, 2006.
The generation supply curves in Appendix A were made available on the ERCOT Operations and
System Planning Data web-site at that time.
Using the results of the MesoMap model, AWS Truewind selected the 40 best 100-MW wind
sites in each zone, based on annual average wind-speed, for a total of 4,000 MW in each zone.
For each of the sites, an hourly pattern of wind speeds and air density representative of an
average weather year was developed, using weather data derived from 15 years of actual
meteorological data. An appropriate class of wind turbine was assigned to each of these sites
based on maximum wind speeds, and then hourly generation patterns were calculated using
generic power curves representing a mix of commercially available wind turbines. The results
were hourly generation patterns for each of these modeled sites that could used to represent
likely hourly wind output from existing and future wind generation projects.
The boundaries of the areas enclosing the best 4,000 MW of generation from each of the zones
are depicted on the map provided as Figure 3. The zones in this map have been ordered
generally by the quality and quantity of wind generation, with zone 1 having the strongest
overall wind resources and zone 25 the weakest. A similar map depicting areas that enclose
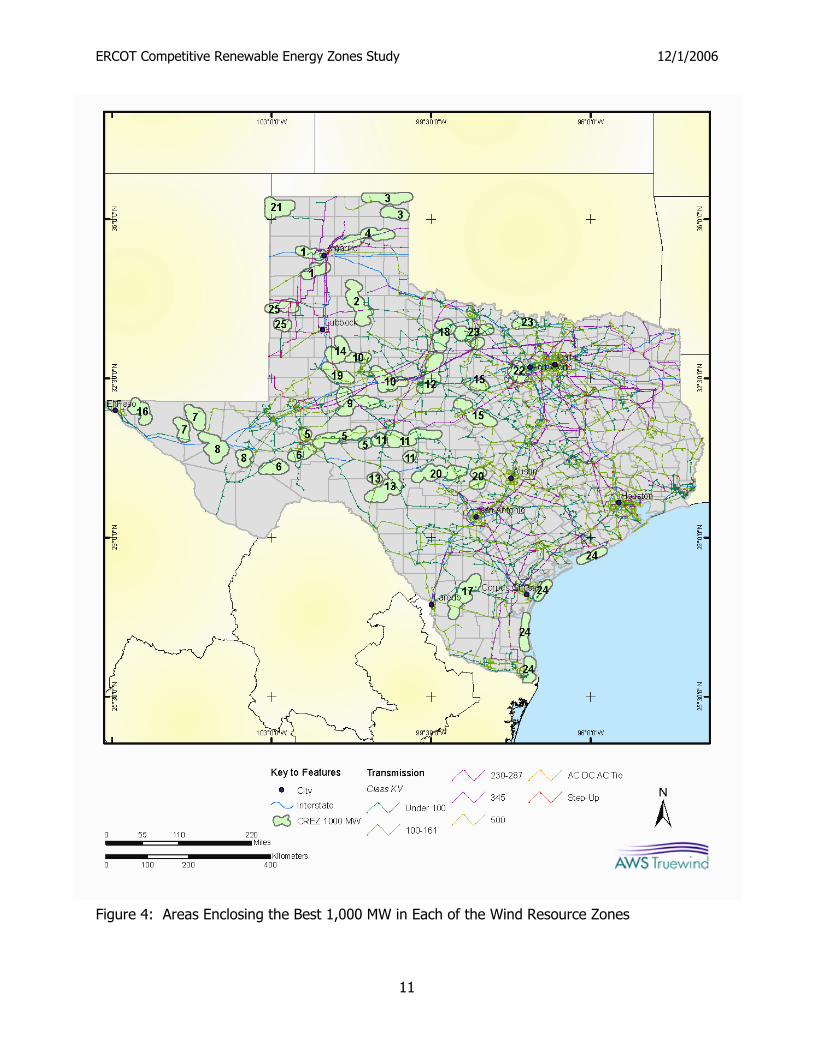
the best ten 100-MW wind generation sites from the 25 zones is provided in Figure 4.

9
Figure 2: Map of Wind Resources Zones
ERCOT Competitive Renewable Energy Zones Study 12/1/2006
10
Figure 3: Areas Enclosing the Best 4,000 MW in Each of the Wind Resource Zones
ERCOT Competitive Renewable Energy Zones Study 12/1/2006
11
Figure 4: Areas Enclosing the Best 1,000 MW in Each of the Wind Resource Zones

ERCOT Competitive Renewable Energy Zones Study 12/1/2006
12
Note that, although the areas extend beyond the land boundaries of Texas, only on-shore sites
within the administrative boundaries of the State were considered. The hourly generation data
produced by AWS Truewind were presented at the Regional Planning Group meeting on July 21,
2006. The hourly generation data were also made available that day on the ERCOT Operations
and System Planning Data web-site.
After the modeling results had been released to stakeholders, several parties indicated that they
had site-specific wind measurement data that was not consistent with the output of the AWS
Truewind model. The areas of concern to these stakeholders were primarily located in the
upper panhandle and along the coast. Although these stakeholders had not provided these
data following ERCOT’s earlier request, due to the discrepancies between the model results and
their data, these parties felt that it would be beneficial to provide the data at this point and
allow AWS Truewind to adjust their model to reflect the additional information.
As a result, representatives of AWS Truewind reviewed and normalized the additional data that
was provided, and, if appropriate in their professional judgment, modified some of the
parameters of the Mesomap model, and recomputed the generation supply curves and the
hourly energy data for several of the wind zones. The revised results were posted on the
ERCOT Operations and System Planning web-site as they were completed by AWS Truewind.
2. Results
As has previously been noted, the two primary results of the AWS Truewind study were the
delineation of areas in the State of Texas where wind resources were sufficient to be evaluated
as potential Competitive Renewable Energy Zones, and the development of modeled hourly
energy patterns for representative sites in these high wind areas. The data developed by AWS
Truewind represented the output of a wind farm built with a generic wind turbine, i.e., one
based on a composite power curve developed from a mix of several different currently
commercially available wind turbines. The hourly output data also represented the output
during an average weather year. In order to develop an average weather year, the weather
patterns from 24-hour periods (from hour 0 to hour 23 Greenwich Mean Time) from different
years were selected and placed in chronological order by day and by month.
An initial analysis of the AWS Truewind data output was presented at the Regional Planning
Group meeting on July 21, 2006. Three aspects of the data were reviewed: monthly capacity
factors, average hourly output, and diversity.
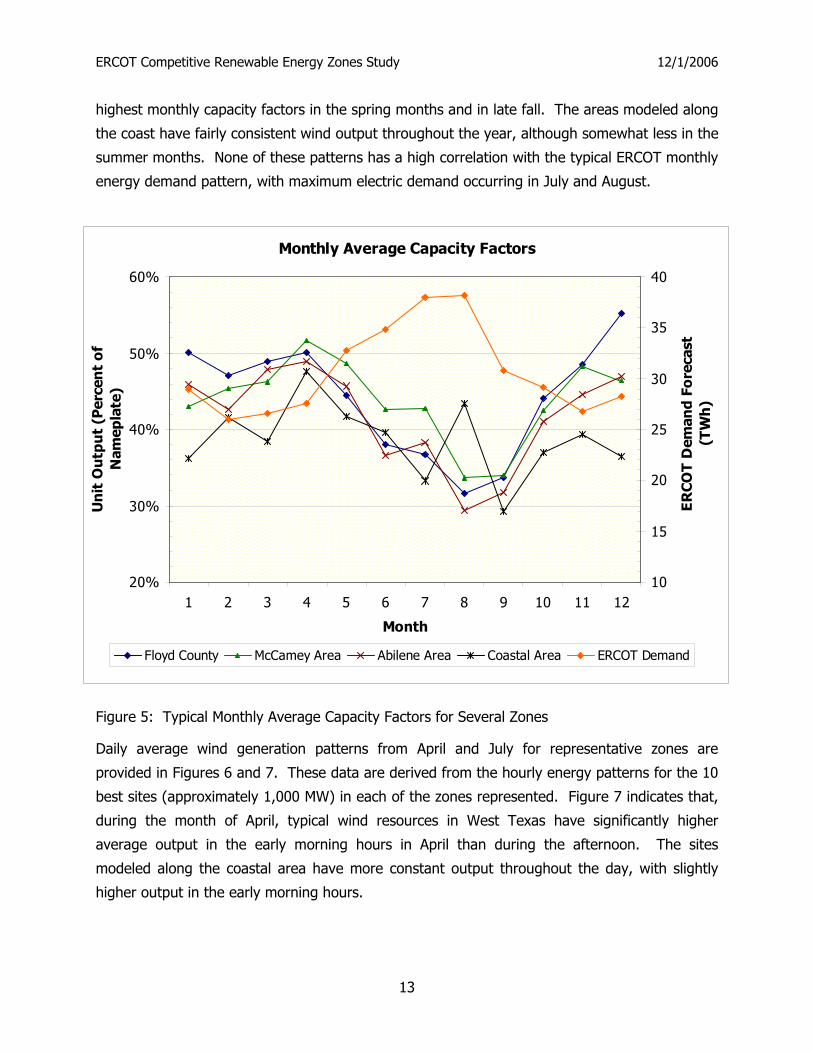
Monthly average capacity factors for several zones are depicted in Figure 5. This chart also
depicts the forecasted ERCOT energy demand by month in gold (with scale provided along the
secondary y axis). These data indicate that the representative areas in West Texas have their
ERCOT Competitive Renewable Energy Zones Study 12/1/2006
13
highest monthly capacity factors in the spring months and in late fall. The areas modeled along
the coast have fairly consistent wind output throughout the year, although somewhat less in the
summer months. None of these patterns has a high correlation with the typical ERCOT monthly
energy demand pattern, with maximum electric demand occurring in July and August.
Figure 5: Typical Monthly Average Capacity Factors for Several Zones
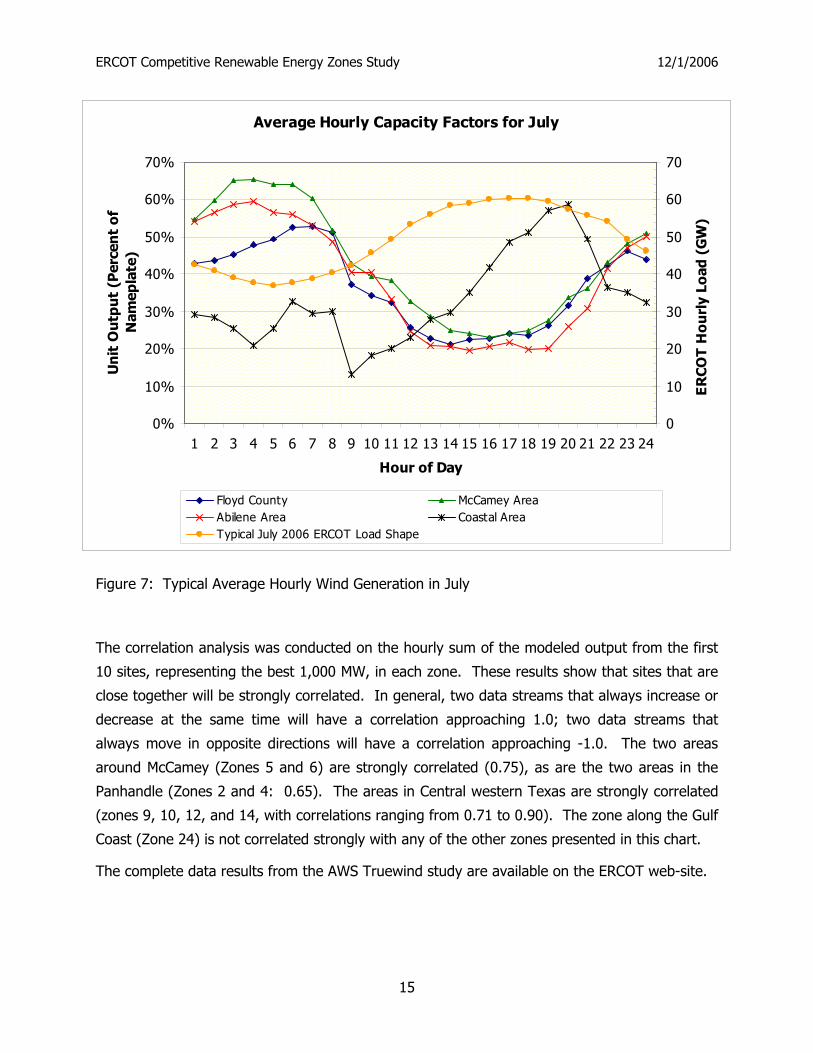
Daily average wind generation patterns from April and July for representative zones are
provided in Figures 6 and 7. These data are derived from the hourly energy patterns for the 10
best sites (approximately 1,000 MW) in each of the zones represented. Figure 7 indicates that,
during the month of April, typical wind resources in West Texas have significantly higher
average output in the early morning hours in April than during the afternoon. The sites
modeled along the coastal area have more constant output throughout the day, with slightly
higher output in the early morning hours.
Monthly Average Capacity Factors
20%
30%
40%
50%
60%
1 2 3 4 5 6 7 8 9 10 11 12
Month
Un
it O
utp
ut
(Per
cen
t o
f N
amep
late
)
10
15
20
25
30
35
40
ER
CO
T D
eman
d F
ore
cast
(T
Wh
)
Floyd County McCamey Area Abilene Area Coastal Area ERCOT Demand

ERCOT Competitive Renewable Energy Zones Study 12/1/2006
14
Figure 6: Typical Average Hourly Wind Generation in April
Similarly, the AWS Truewind modeling data for July, as depicted in Figure 8, indicates that
typical wind generation in West Texas peaks in the early morning hours. Wind generation from
the coastal area, on the other hand, increases throughout the afternoon to a maximum average
output at 8 or 9 PM. Figure 8 also shows a typical ERCOT hourly load pattern for July in gold.
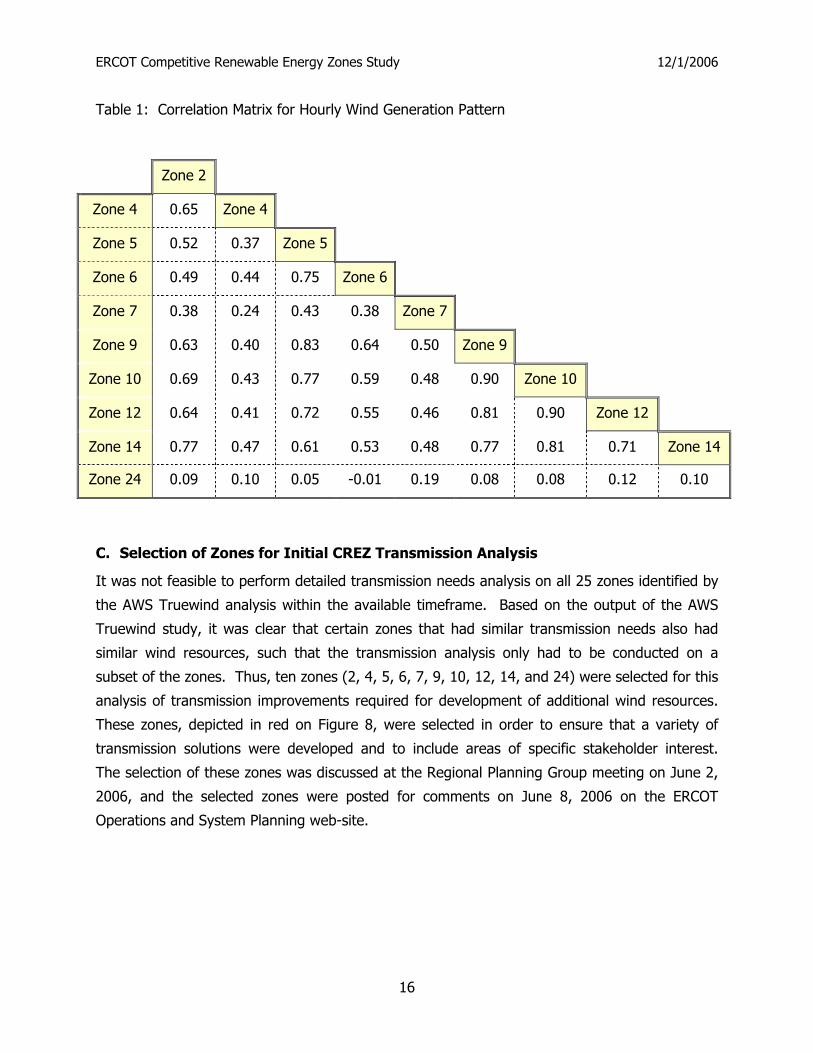
Table 1 presents the results of a correlation analysis of the zones presented in Figures 5
through 7, as well other representative zones. The locations of these zones are depicted in
Figure 4. Zones 2 and 4 are in the Texas Panhandle (Floyd County is in Zone 2); Zones 5 and 6
are in and around McCamey, Texas; Zone 7 is in the vicinity of Culberson County, Texas; Zones
9, 10, 12, and 14 are in the central western portion of the State, and Zone 24 is along the Gulf
Coast.
Average Hourly Capacity Factors for April
20%
30%
40%
50%
60%
70%
1 2 3 4 5 6 7 8 9 10 11 12 13 14 15 16 17 18 19 20 21 22 23 24
Hour of Day
Ave
rag
e U
nit
Ou
tpu
t (P
erce
nt
of
Nam
epla
te)
Floyd County McCamey Area Abilene Area Coastal Area
ERCOT Competitive Renewable Energy Zones Study 12/1/2006
15
Figure 7: Typical Average Hourly Wind Generation in July
The correlation analysis was conducted on the hourly sum of the modeled output from the first
10 sites, representing the best 1,000 MW, in each zone. These results show that sites that are
close together will be strongly correlated. In general, two data streams that always increase or
decrease at the same time will have a correlation approaching 1.0; two data streams that
always move in opposite directions will have a correlation approaching -1.0. The two areas
around McCamey (Zones 5 and 6) are strongly correlated (0.75), as are the two areas in the
Panhandle (Zones 2 and 4: 0.65). The areas in Central western Texas are strongly correlated
(zones 9, 10, 12, and 14, with correlations ranging from 0.71 to 0.90). The zone along the Gulf
Coast (Zone 24) is not correlated strongly with any of the other zones presented in this chart.
The complete data results from the AWS Truewind study are available on the ERCOT web-site.
Average Hourly Capacity Factors for July
0%
10%
20%
30%
40%
50%
60%
70%
1 2 3 4 5 6 7 8 9 10 11 12 13 14 15 16 17 18 19 20 21 22 23 24
Hour of Day
Un
it O
utp
ut
(Per
cen
t o
f N
amep
late
)
0
10
20
30
40
50
60
70
ER
CO
T H
ou
rly
Load
(G
W)
Floyd County McCamey AreaAbilene Area Coastal AreaTypical July 2006 ERCOT Load Shape
ERCOT Competitive Renewable Energy Zones Study 12/1/2006
16
Table 1: Correlation Matrix for Hourly Wind Generation Pattern
Zone 2
Zone 4 0.65 Zone 4
Zone 5 0.52 0.37 Zone 5
Zone 6 0.49 0.44 0.75 Zone 6
Zone 7 0.38 0.24 0.43 0.38 Zone 7
Zone 9 0.63 0.40 0.83 0.64 0.50 Zone 9
Zone 10 0.69 0.43 0.77 0.59 0.48 0.90 Zone 10
Zone 12 0.64 0.41 0.72 0.55 0.46 0.81 0.90 Zone 12
Zone 14 0.77 0.47 0.61 0.53 0.48 0.77 0.81 0.71 Zone 14
Zone 24 0.09 0.10 0.05 -0.01 0.19 0.08 0.08 0.12 0.10
C. Selection of Zones for Initial CREZ Transmission Analysis
It was not feasible to perform detailed transmission needs analysis on all 25 zones identified by
the AWS Truewind analysis within the available timeframe. Based on the output of the AWS
Truewind study, it was clear that certain zones that had similar transmission needs also had
similar wind resources, such that the transmission analysis only had to be conducted on a
subset of the zones. Thus, ten zones (2, 4, 5, 6, 7, 9, 10, 12, 14, and 24) were selected for this
analysis of transmission improvements required for development of additional wind resources.
These zones, depicted in red on Figure 8, were selected in order to ensure that a variety of
transmission solutions were developed and to include areas of specific stakeholder interest.
The selection of these zones was discussed at the Regional Planning Group meeting on June 2,
2006, and the selected zones were posted for comments on June 8, 2006 on the ERCOT
Operations and System Planning web-site.

ERCOT Competitive Renewable Energy Zones Study 12/1/2006
17
Figure 8: Wind Zones Selected for Initial Transmission Analysis
21 3
4
1
2
25
1418
12
23
22
15
10199
511
16 7
7
86
5
6
15
1320
17
24
24
24
24
17
19
ERCOT Competitive Renewable Energy Zones Study 12/1/2006
18
IV. ANALYSIS OF TRANSMISSION IMPROVEMENTS
A. Modeling Tools
The analysis for this study was conducted using the models UPlan (LCG Consulting, Version
7.4.6.2), Powerworld (Powerworld Corp., Version 12) and PSS™E (Siemens PTI, Version 30.2).
Powerworld and PSS™E are tools for analyzing transmission system power flows under steady-
state conditions. UPlan is an hourly security-constrained unit-commitment and economic-
dispatch model that can be used to forecast changes in system operations on an annual basis.
The UPlan model is configured to determine an optimal unit commitment and dispatch based on
the assumption that units will be bid into a nodal market at their variable cost of generation
production (including their cost of SO2 and NOX emissions).
B. Transmission Base Case Development
The underlying transmission topology for these analyses was developed from the work of the
ERCOT Steady State Working Group (SSWG). This group of Transmission Owner
representatives compiles changes to the existing transmission topology and develops projected
topologies for five years into the future.
In 2006, ERCOT began what will henceforth be an annual stakeholder study of the forecasted
transmission topologies of the Steady State Working Group, to develop a comprehensive and
coordinated Five-Year Transmission Plan for the ERCOT System, revising and adding specific
projects to meet established reliability and economic benefit criteria. The analysis of
transmission projects for CREZ designation used the latest case that was available through the
Five-Year Transmission Plan development at the start of the CREZ study, which was the 2009
case.
The analysis described in this report was completed using this 2009 case as the base case.
Several additional projects that have been endorsed by the ERCOT Board of Directors but will
not be completed prior to the peak season of 2009 were added to this case. The most notable
of these are the 345-kV improvements associated with new rights-of-way connecting the Clear
Springs and Salado substations, as well as the 345-kV improvements between the San Miguel
electrical generating facility and the new Lobo substation near Laredo.
Several additional significant projects that were included in the Five-Year Plan to meet reliability
or economic criteria were also incorporated into the base case. However, not all of the projects
included in the Five-Year Plan were included in this analysis due to time constraints.
ERCOT is also leading a Long-Term System Assessment (LTSA) of the needs for generation and
transmission of the ERCOT system for 10 years into the future. Although it was originally
ERCOT Competitive Renewable Energy Zones Study 12/1/2006
19
proposed to stakeholders that this CREZ analysis would be studied in the same timeframe
(2016) as the LTSA, the complexities of extending the transmission planning horizon an
additional five years into the future, including forecasting future load growth, future generation
additions, and lower-voltage transmission projects to meet reliability criteria, delayed the
development of a workable 2016 base case to the point that this CREZ analysis had to be
conducted using the Five-Year Plan case for 2009 in order to meet the regulatory deadline.
C. Base Case Wind Capacity
As part of the Five-Year Plan development, a review was made of wind generation projects
under development. It was noted that, at the time, approximately 12,000 MW of wind
generation projects were in the ERCOT interconnection request queue, in addition to the
approximately 3,200 MW of wind generation projects that were either in-service or had an
executed interconnection agreement. (Additional interconnection agreements have since been
signed, and at the time of the drafting of this report, the total wind capacity in-service and with
signed interconnection agreement is 4,068.5 MW.) Following previous ERCOT planning
procedures, the generating units with a signed interconnection agreement were included in
future planning model cases, but none of the other units in the interconnection queue were
represented.
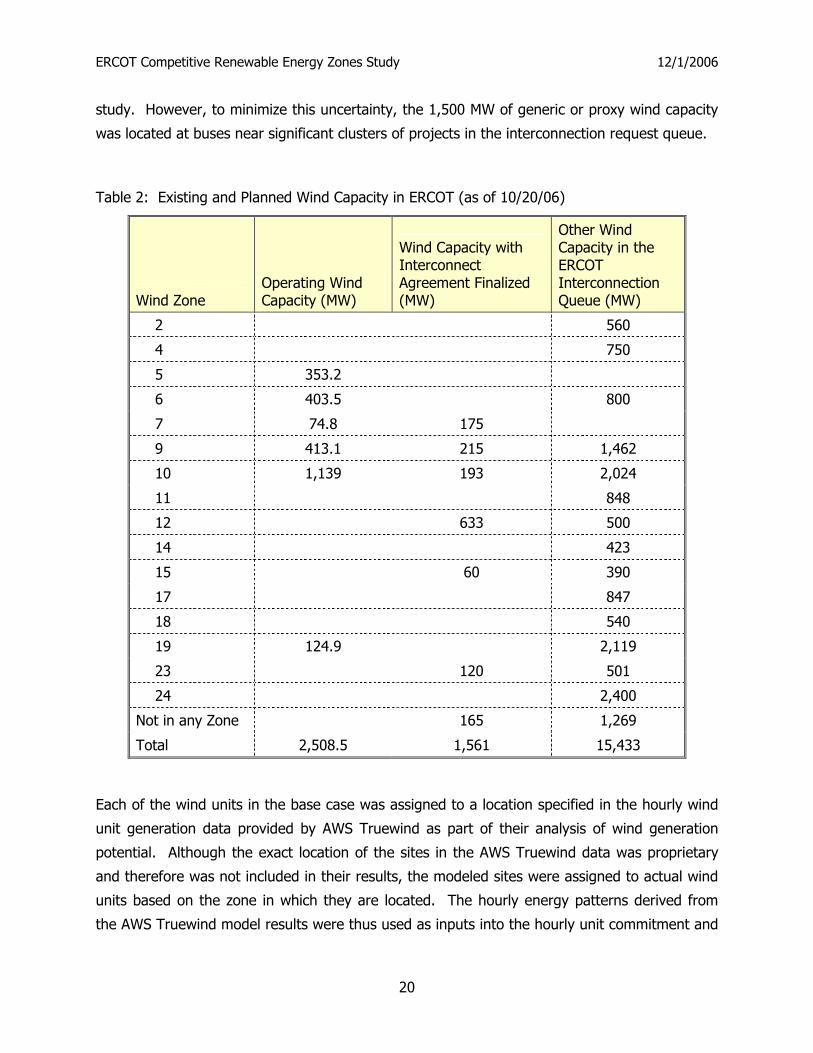
Table 2 lists the total operating and proposed wind capacity by wind zone (as of October 20,
2006). While a significant portion of the wind generation projects in the interconnection queue
may not be built, it was generally agreed by stakeholders that including only the units with a
executed interconnection agreement would underestimate the amount of transmission
congestion, especially in West Texas, and would likely lead to incorrect assessments of the need
for specific transmission system improvements. Since several of these projects appeared likely
to be completed prior to the end of 2007, ERCOT System Planning personnel proposed to
stakeholders that some additional wind generation capacity be included in the Five-Year Plan
analysis of the needs for 2007. These proxy wind projects would be representative of the
amount of wind generation capacity in the interconnection queue that was expected to be
completed in 2007. ERCOT System Planning proposed that approximately 1,500 MW of
additional wind, for a total installed wind generation capacity of 4,850 MW, be added to the
2007 and subsequent years’ planning model cases.
As a result, the 2009 planning model case for the CREZ evaluation contained 4,850 MW of wind
capacity, of which 1,500 MW of wind were included above the amount that was either in-service
or for which there was a signed interconnection agreement. The actual interconnection points
of this additional wind capacity may not be at the same electrical bus locations modeled in the
ERCOT Competitive Renewable Energy Zones Study 12/1/2006
20
study. However, to minimize this uncertainty, the 1,500 MW of generic or proxy wind capacity
was located at buses near significant clusters of projects in the interconnection request queue.
Table 2: Existing and Planned Wind Capacity in ERCOT (as of 10/20/06)
Wind Zone Operating Wind Capacity (MW)
Wind Capacity with Interconnect Agreement Finalized (MW)
Other Wind Capacity in the ERCOT Interconnection Queue (MW)
2 560
4 750
5 353.2
6 403.5 800
7 74.8 175
9 413.1 215 1,462
10 1,139 193 2,024
11 848
12 633 500
14 423
15 60 390
17 847
18 540
19 124.9 2,119
23 120 501
24 2,400
Not in any Zone 165 1,269
Total 2,508.5 1,561 15,433
Each of the wind units in the base case was assigned to a location specified in the hourly wind
unit generation data provided by AWS Truewind as part of their analysis of wind generation
potential. Although the exact location of the sites in the AWS Truewind data was proprietary
and therefore was not included in their results, the modeled sites were assigned to actual wind
units based on the zone in which they are located. The hourly energy patterns derived from
the AWS Truewind model results were thus used as inputs into the hourly unit commitment and
ERCOT Competitive Renewable Energy Zones Study 12/1/2006
21
dispatch model UPlan. For existing wind sites that had a nameplate capacity greater than one
of the modeled sites, sufficient sites from the AWS Truewind output were aggregated to
represent adequately the existing facility.
A direct result of the AWS Truewind method of developing a representative average weather
year was that the unit output data were discontinuous at the boundary between hour 23 and
the proceeding hour 0, since the weather pattern used to develop these two hours often came
from different years. The selection of days to develop the average weather pattern was
consistent across all zones, so the output of a site in one zone could be directly compared to
the output of a site from another zone. However, in order to use these data in a chronological
unit commitment model, the discontinuity between hours 23 and hours 0 required smoothing.
Prior to development of the actual energy patterns that were used to define a wind projects
hourly generation in the UPlan model, the data from hours 22, 23, 0, and 1 were replaced by
three-hour rolling averages. In this way, the shift in output from hours 23 to hours 0 were
spread over several hours, but the actual amount of energy produced was not significantly
altered.
D. New Wind Capacity
A similar process was used to assign hourly energy patterns to proxy wind generation units
used to represent new CREZ-related wind generation located in the wind zones being studied.
New substations were created in the model database, and models for the proxy wind
generation units were created and connected to new substations. Each of these new units was
assigned to a unique hourly energy pattern from the AWS Truewind data.
E. Other Model Inputs
ERCOT System Planning maintains a database of generating plant efficiency ratings, operating
costs and unit constraints. Some of the generating unit data were provided by stakeholders,
and some are generically set by generating unit type. In the study, for model reasons, all wind
generators were modeled as having a small variable cost of 25 cents per megawatt-hour
($0.25/MWh).
To coincide with the use of the 2009 transmission topology, the 2009 load forecast and
generation resources expected to be on-line in 2009 were included in the model inputs. ERCOT
System Planning personnel maintain an updated annual peak load and demand forecasts based
on econometric modeling of the electricity market in ERCOT. This load forecast is distributed to
specific buses using ratios inherent in the Steady State Working Group cases.

ERCOT Competitive Renewable Energy Zones Study 12/1/2006
22
Fuel forecasts for this study were developed through a review of current fuel fundamental
market dynamics. Similarly, emissions allowance forecasts were determined based on a review
of likely future scenarios. Table 3 provides the nominal price forecasts that were used for this
study.
Table 3: Fuel And Emission Forecasts
Forecast Parameter 2009 Price Forecast
Natural Gas $7.00/MMBtu
Sub-bituminous Coal $1.70/MMBtu
Lignite $1.28/MMBtu
SO2 Emissions Allowance $600/Ton
NOX Emissions Allowance $1,500/Ton
Unit emission rates were based on data from the Environmental Protection Agency Clean Air
Markets Program (available at http://www.epa.gov/airmarkets/). SO2 emissions were included
in unit economic commitment and dispatch decisions due to the current requirements of the
Federal Acid Rain program. NOX emissions were included in unit commitment and dispatch
decisions due to the expected implementation of the Clean Air Interstate Rule in 2009.
F. Cost Estimates
For the purposes of developing capital cost estimates for transmission system improvements
where specific project costs had not been developed and for wind capacity improvements, the
generic base component cost estimates listed in Table 4 were used. These cost estimates were
reviewed with all stakeholders.

ERCOT Competitive Renewable Energy Zones Study 12/1/2006
23
Table 4: Capital Cost Estimates
Component 2009 Capital Cost
Forecast
New 345-kV Right of Way (single circuit) $1 million/mile
New 345-kV Right of Way (double circuit) $1.3 million/mile
New 345-kV substation $15 million
New 345/138-kV autotransformer $6 million
New wind generating project $1,000/kW
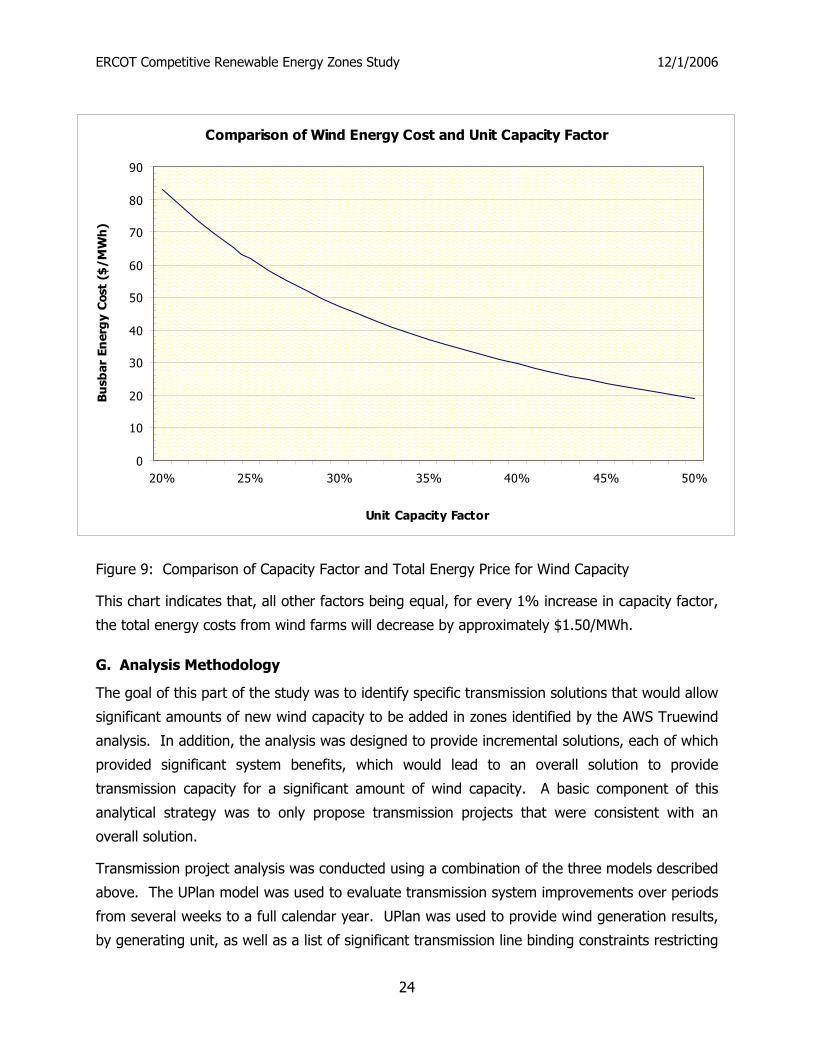
The cost of wind energy is another factor that has an impact on the designation of wind energy
zones. Figure 9 depicts the relationship between the total cost of energy produced by a wind
farm and the project’s average capacity factor. The term capacity factor means the amount of
energy produced by the project over the period of a year, as a percentage of the product of the
project’s nameplate capacity multiplied by the number of hours in a year (8,760). In other
words, the capacity factor is the percentage of energy actually produced by a unit compared to
the amount it would have produced if it ran at its nameplate rating over an entire year. For
wind units, typical capacity factors are in the 30% to 45% range.
These results are based on a generic pro forma analysis, using average input assumptions for
construction costs ($1,000/kW), fixed operating costs ($19/kW-yr), weighted average cost of
capital (9.1%), inflation (2.5%), and marginal tax rate (38%). The analysis also includes an
assumption that the project receives a Production Tax Credit from the Federal government (1.7
cents/kWh), and that the company that owns the project can use these tax credits to reduce
their overall tax burden.
Actual project costs will vary from these results due to site- and company-specific conditions.
The purpose of this chart is not to indicate the energy value of specific projects, but rather to
indicate the value of being able to locate wind projects in areas with higher average capacity
factors.
ERCOT Competitive Renewable Energy Zones Study 12/1/2006
24
Figure 9: Comparison of Capacity Factor and Total Energy Price for Wind Capacity
This chart indicates that, all other factors being equal, for every 1% increase in capacity factor,
the total energy costs from wind farms will decrease by approximately $1.50/MWh.
G. Analysis Methodology
The goal of this part of the study was to identify specific transmission solutions that would allow
significant amounts of new wind capacity to be added in zones identified by the AWS Truewind
analysis. In addition, the analysis was designed to provide incremental solutions, each of which
provided significant system benefits, which would lead to an overall solution to provide
transmission capacity for a significant amount of wind capacity. A basic component of this
analytical strategy was to only propose transmission projects that were consistent with an
overall solution.
Transmission project analysis was conducted using a combination of the three models described
above. The UPlan model was used to evaluate transmission system improvements over periods
from several weeks to a full calendar year. UPlan was used to provide wind generation results,
by generating unit, as well as a list of significant transmission line binding constraints restricting
Comparison of Wind Energy Cost and Unit Capacity Factor
0
10
20
30
40
50
60
70
80
90
20% 25% 30% 35% 40% 45% 50%
Unit Capacity Factor
Bu
sbar
En
erg
y C
ost
($/M
Wh
)
ERCOT Competitive Renewable Energy Zones Study 12/1/2006
25
wind unit output. By exporting the transmission system model for a specific hour from the
UPlan results database, these line constraints under contingency were analyzed using the
steady-state models Powerworld and PSS™E. Most of the analysis for this study relied on a DC
approximation to the actual AC power flows; however, an AC solution was developed using
PSS™E for some of the scenarios. .
Using the steady-state models, the impacts of potential transmission solutions on the limiting
elements of the system were reviewed under contingency conditions specified by the UPlan
output. Although the transmission system database included constraints on 69-kV, 138-kV, and
345-kV lines, the goal of this investigation was to select new corridors for 345-kV (and above)
transmission improvements.
Revised transmission solutions were analyzed using the UPlan model, and the cycle of analysis
continued for each scenario until a significant amount of wind had been added to the case and
additional line improvements did not provide significant relief to the resulting system
constraints.
Following discussions with system engineers and representatives of Transmission Service
Providers, it was agreed that the new system improvements should not have any single point of
failure that would result in the loss of more than 1,500 MW of generation capacity to the
system. As an example, it would be within the thermal limitations of the wire to connect
approximately 3,400 MW of generation to a double-circuit radial 345-kV transmission line.
However, if there was a loss of that line on a windy day, the overall power system might be
forced to respond to an instantaneous loss of over 3,000 MW of generation. Currently, there
are no other single points of failure that can result in this extensive a loss of generation. The
largest single point of failure on the system is the loss of a generating unit with a maximum
output of 1,250 MW. The amount of responsive reserve required to be present on the system
at all times was derived based on the risk associated with an instantaneous loss of generating
capacity. Allowing the largest single point of failure to increase to 1,500 MW may require a
minimal increase in the level of responsive reserves required, but the system should not be
designed in such a manner as to allow a larger MW impact of a single point of failure until the
potential effects are evaluated.
Hundreds of possible solutions were analyzed as part of this study. Over 60 scenarios were
analyzed for new generation capacity in the McCamey area alone. The results presented in this
report do not represent all of the possible transmission improvements studied. Rather, they are
the solutions that resulted in the most wind generation capacity being added to the system with
a reasonable range of wind generation curtailment.
ERCOT Competitive Renewable Energy Zones Study 12/1/2006
26
H. Study Limitations
As was noted above, most of the analysis conducted as part of the study utilized a DC
approximation to AC power flows. Although this type of power flow approximation is widely
accepted in the industry for many applications, it cannot show the benefits of certain significant
system improvements in areas where under-voltage issues can potentially occur following
certain contingencies, nor can it be used to select the optimal bus connections in these same
areas. In addition, this type of analysis cannot be used to evaluate reactive support
requirements, which may require additional expenditures associated with significant changes to
the system.
An analysis of transient stability was not included in this study. Dynamic transmission system
analysis is an extremely detailed and time-consuming process. Given the number of scenarios
that were analyzed, and the fact that many of these scenarios will not be included in future
CREZ proposals, it was not reasonable to perform transient stability analysis for each of these
scenarios within the given timeframe. This study may indicate that exports from the west zone
to the north and south zones of ERCOT cannot exceed a limit which is less than the thermal
limits of the actual transmission lines under contingency. Although additional high voltage
connections between west Texas and the other ERCOT zones like those described in this study
will generally improve transient stability as well as thermal limits, it is still possible that the
limits from the transient stability analysis will be more stringent than the limitations specified in
this report. It is not anticipated that this analysis, when accomplished, would change the
relative costs associated with different potential CREZs, but might change the magnitude of the
wind capacity at a given level of curtailment that can be accommodated by each.
In addition, ERCOT System Planning is currently engaging a consultant to provide an analysis of
increased ancillary service needs resulting from additional wind capacity of the magnitude
modeled in this study. It is not known at this time if this study of ancillary services
requirements will indicate that additional costs will be required in order to increase the amount
of wind capacity on the system above a specific level, or if there is in fact a limit to the amount
of wind that can be safely absorbed by the system given specific load and thermal generating
unit conditions. The effects of any additional responsive or regulation reserve services which
may be indicated at the completion of the ancillary services study were not included in the
present study.
It should also be noted that no routing analysis has been conducted as part of this study.
ERCOT System Planning has worked with representatives of TSPs to develop feasible

ERCOT Competitive Renewable Energy Zones Study 12/1/2006
27
transmission upgrade solutions. However, until detailed routing studies are completed, it is not
known if the specific connections modeled as part of this study are achievable.
I. Impacts on Existing Wind Generation
The purpose of this study is to develop transmission solutions that allow a significant amount of
new wind generation to be installed in various zones with a minimal amount of aggregate wind
curtailment. Over the course of the study, it was noted that in many scenarios the wind
generation that was initially curtailed by increasing amounts of new wind generation capacity in
a specific zone was not the new wind generation connected to proposed new system upgrade,
but rather it was the existing wind units, often connected to the system on lower voltage
circuits. The reason for this is that the overall transfer of wind energy from generation pocket
to load is limited, under contingency of the new proposed line, by the thermal limits on the
existing system. In many scenarios the limiting constraint is a 138-kV line, such as the circuits
that connect the San Angelo and Gillespie substations, or the circuit that runs from Brownwood
to Lampasas connection, or from the South Abilene to Selden substations. In order to relieve
such a constraint, the UPlan model (as will the proposed ERCOT nodal market) will reduce the
output from the system in the most cost-effective manner. All of the wind units in our database
are modeled with the same variable cost (25 cents per Megawatt-hour), so, if needed, the
model will reduce the output of the unit with the highest shift factor on the limiting element.
This would most likely be an existing wind generating facility that is more directly connected to
the specific limiting element.
In some scenarios, it was determined that the output of one or a small number of existing wind
units was being disproportionately affected by transmission constraints on the system. In these
cases, the least cost solution to improving the average curtailment of all wind units in the
aggregate was to make a small system improvement in the immediate vicinity of the existing
wind generators being affected. In some of these cases, these modeled improvements had a
similar function as operational protection schemes currently in place (schemes that are difficult
to model in an economic unit commitment and dispatch model). In other cases, these small
system improvements were used to alleviate constraints around some of the proxy units that
were included in the base case in order to represent the likely amount of wind capacity present
on the system at the end of 2007.
Certain projects of this type were included into most of the scenarios from this study (they were
not needed in the scenarios that included only new wind from the coastal area). These projects
are listed in Appendix B.
ERCOT Competitive Renewable Energy Zones Study 12/1/2006
28
These potential projects were developed through an iterative process, based on an analysis of
the binding contingencies included in the outputs of the planning models. They represent the
types of projects that will be needed to alleviate the impacts of transmission congestion on
existing wind generation. They vary considerably in scale and certainty. Some are straight-
forward and already under discussion by ERCOT stakeholder groups, but there may be better
operational solutions for others. In particular, some may require Certificates of Convenience
and Necessity (CCNs) with challenging new rights-of-way (ROWs). This list includes 110 new
circuit miles, the upgrade of 73 existing circuit miles, one new autotransformer, and three new
substations. The additional cost of these system improvements, beyond those found to be
economically justified in the Five-Year Plan, is estimated to be $180 million.
Prior to designation of specific CREZ by the PUCT, and prior to completion of interconnection
agreements for additional wind generation already in the ERCOT interconnection queue, it
cannot be determined which of these projects will provide sufficient system benefits to be
economically justified. While specific proxy projects were included in the present analysis,
based on the input assumptions for this study, the actual projects that are ultimately needed
may vary from those contained in this list. It is clear that some projects to reduce the impact of
congestion on many of the existing (base-case) wind generators will be needed, and analysis of
these types of projects will need to be continued following the CREZ designations by the PUCT,
as part of the ERCOT annual Five-Year Plan.
One possible solution may be to sectionalize some of the existing weak circuits. As additional
high-voltage circuits are added to the system in West Texas, the existing underlying 69-kV and
138-kV lines will remain the limiting elements. The results of this study indicate that the
following circuits will continue to cause significant constraints on the system:
1. Contingency or non-contingency overloads of the 138-kV and 69-kV paths between San Angelo and Gillespie.
2. Contingency or non-contingency overloads of the 138-kV and 69-kV paths between Brownwood and Lampasas.
3. Contingency or non-contingency overloads of the 138-kV and 69-kV paths between South Abilene and Stephenville.
These three weak west-central ties are well understood by the TSPs to have no easy or
inexpensive solutions or incremental upgrades. However, after at least two new high-voltage
west-central transmission ties have been energized, it may be possible to open specific
elements in the existing system and significantly reduce the impact of these existing circuits on
transfer capacity. Such a solution could significantly reduce the impact of these system
constraints on existing wind generation. Analysis of operational solutions to these constraints is
needed and will be performed in the future.
ERCOT Competitive Renewable Energy Zones Study 12/1/2006
29
J. Considerations for Further Analysis
1. Regional Voltage Needs
Three areas, the Hill Country, the area west of Killeen, and the Valley, have current voltage
needs that can be alleviated by projects identified as part of this study. The Hill Country area is
served by four hydro-power generating plants, the Ferguson gas steam plant, the 345-kV
Kendall substation, and an extensive 138-kV network running generally from the 345-kV
corridor east of I-35. New 345-kV lines in the Hill Country may be required in the future to
alleviate local under-voltage conditions, as well as to serve increasing load in the area. The
Killeen substation has a single 345/138-kV autotransformer and a single 345-kV line to Temple
(this line will connect first at Salado starting in 2010) to support the entire area from Belton to
Lampasas. The closest power stations are Sandow, and Lake Creek. A second 345-kV source
would improve reliability in this area. Similarly, the Rio Grande Valley has import limitations due
to local voltage support requirements.
2. Dynamic Analysis
As noted above, there are particular stability concerns whenever a large generator is connected
to the system by a single transmission line. During very light-load conditions, a single large
generator such as Comanche Peak may represent a significant portion of the thermal resources
on the network. A transient stability analysis of the system with increased levels of wind
generation is needed to investigate any changes in responsive reserve levels that may be
needed in response to higher levels of wind generation.
A dynamic (transient stability) analysis of West Texas based on the Five-Year Plan is scheduled
to be completed in December 2006 by ERCOT System Planning. However, as more wind
generation is interconnected to the system, and as new circuits in West Texas are approved,
the dynamics of the system will change, and additional analyses will be required. These
analyses could result in export limitations that are more restrictive than the thermal limitations
described in this study.
3. System Ancillary Service Requirements
ERCOT System Planning is currently engaging a consultant to provide an analysis of ancillary
service requirements at different levels of wind connected to the ERCOT transmission system.
This study, to be completed in 2007, will also quantify any system benefits from incorporating
wind resources from different wind zones.
The results of this study will likely indicate a relationship between the amount of wind
generation output on the system and the amount and operational characteristics of thermal
generation resources required to balance the system reliably over different timeframes from

ERCOT Competitive Renewable Energy Zones Study 12/1/2006
30
instantaneous to several hours. The increased cost associated with the higher ancillary services
requirements could alter the economic benefits of wind resources described in this study. It is
generally believed that the differential ancillary services requirements between the different
potential CREZs will be less significant than the overall higher level of ancillary services that will
be required as the level of wind generation penetration increases. In addition, the impact of
increased wind generation on some types of ancillary services may be minimized if the total
wind capacity is spread over more areas, due to diversity in the instantaneous changes in wind.
However, the specific impacts will not be known until the ancillary services study is complete.
ERCOT Competitive Renewable Energy Zones Study 12/1/2006
31
V. RESULTS
A. Description of Proposed System Improvements
The analyses from this study indicate that, from the perspective of ERCOT transmission system
upgrades, there are generally four discrete areas of wind generation development: the Gulf
Coast region; the southwest region (including the McCamey area); the central-western Texas
region (running generally along the existing 345-kV circuits from Abilene to Odessa, and
including areas south to San Angelo, north to Scurry and Garza counties and as far west as
Culberson County); and the Texas Panhandle region. The results of this study represent
building blocks of transmission upgrades that can be used to connect wind capacity in these
regions. These building blocks can be implemented individually or in combinations to provide
different levels of additional transmission capacity. The individual transmission solutions are
described in the following paragraphs. The results of economic analyses of these solutions, as
well as several combinations, are provided in Section V (B).
1. Coastal Region
Three levels of transmission solutions have been identified for new wind resources along the
Gulf Coast of Texas (Zone 24, depicted on Figure 5). These solutions are cumulative.
Significantly less capital investment is required to connect additional wind capacity in the Gulf
Coast region than in West Texas because there currently are no wind resources in this region.
In fact, the first 1,000 MW of wind resources can be connected to the existing 345-kV circuit
that runs between the Sharpe to the Rio Hondo substations.
The second level of transmission solution involves construction of a new 345-kV substation on
the circuit from Lon C. Hill to North Edinburg, and a new double circuit transmission line
connecting this new substation and the Armstrong 345-kV substation.
The third level of transmission solution consists of a new 345-kV circuit from the planned Lobo
substation near Laredo, to a new substation west of the existing North Edinburg substation,
with additional connections to both the North Edinburg and the Frontera substations. A new
345/138-kV autotransformer would be required near the existing Frontera substation.
These system improvements are depicted in Figures 6, 7, and 8. The new 345-kV circuit from
Lobo to the Valley may be needed to maintain system security as load grows in the Valley area,
regardless of wind interconnections.
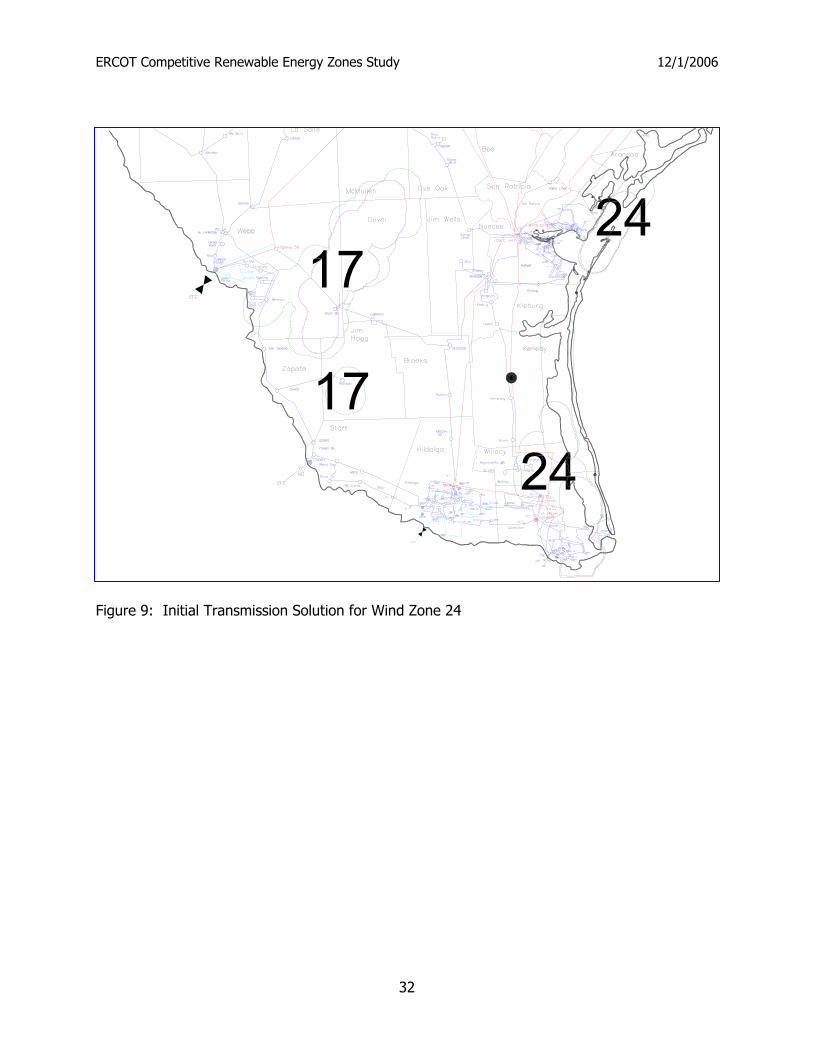
ERCOT Competitive Renewable Energy Zones Study 12/1/2006
32
Figure 9: Initial Transmission Solution for Wind Zone 24
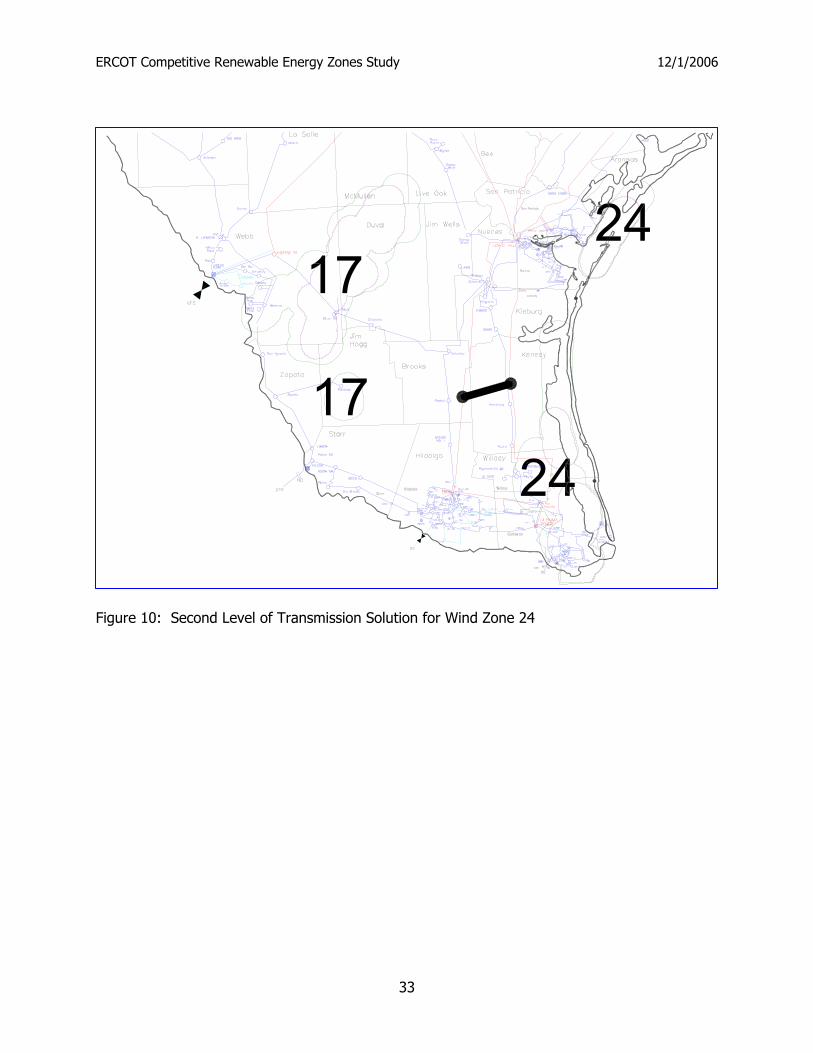
ERCOT Competitive Renewable Energy Zones Study 12/1/2006
33
Figure 10: Second Level of Transmission Solution for Wind Zone 24
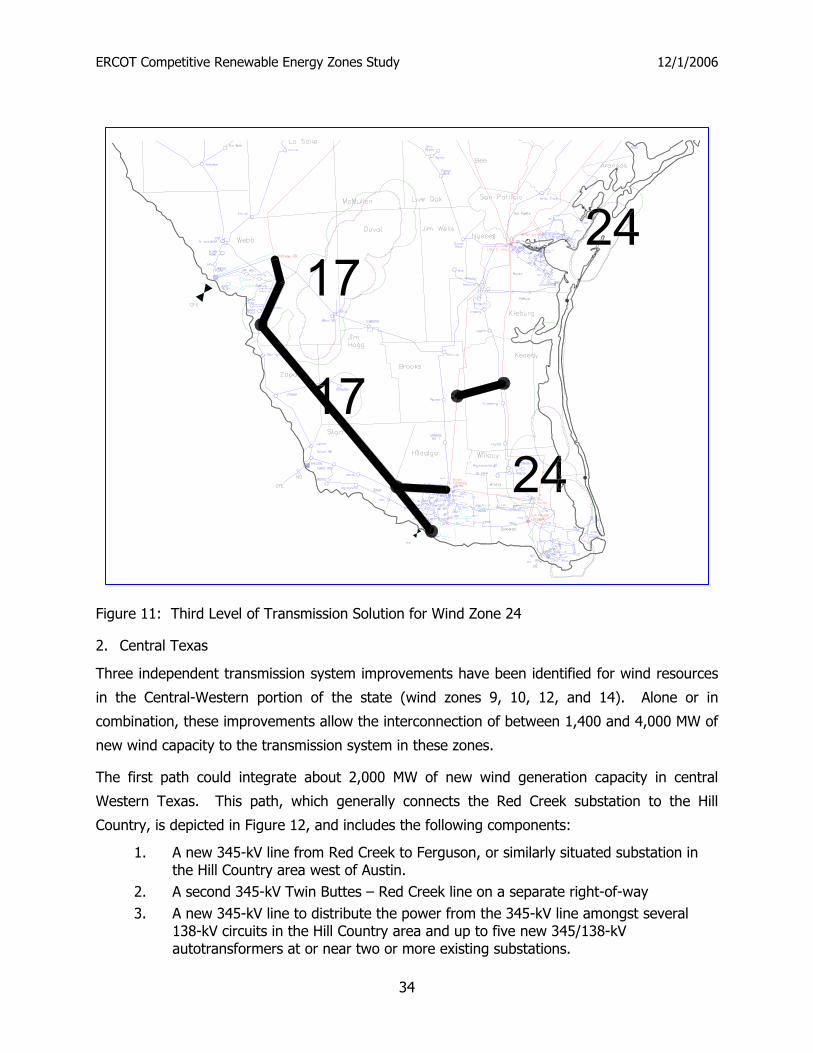
ERCOT Competitive Renewable Energy Zones Study 12/1/2006
34
Figure 11: Third Level of Transmission Solution for Wind Zone 24
2. Central Texas
Three independent transmission system improvements have been identified for wind resources
in the Central-Western portion of the state (wind zones 9, 10, 12, and 14). Alone or in
combination, these improvements allow the interconnection of between 1,400 and 4,000 MW of
new wind capacity to the transmission system in these zones.
The first path could integrate about 2,000 MW of new wind generation capacity in central
Western Texas. This path, which generally connects the Red Creek substation to the Hill
Country, is depicted in Figure 12, and includes the following components:
1. A new 345-kV line from Red Creek to Ferguson, or similarly situated substation in the Hill Country area west of Austin.
2. A second 345-kV Twin Buttes – Red Creek line on a separate right-of-way 3. A new 345-kV line to distribute the power from the 345-kV line amongst several
138-kV circuits in the Hill Country area and up to five new 345/138-kV autotransformers at or near two or more existing substations.
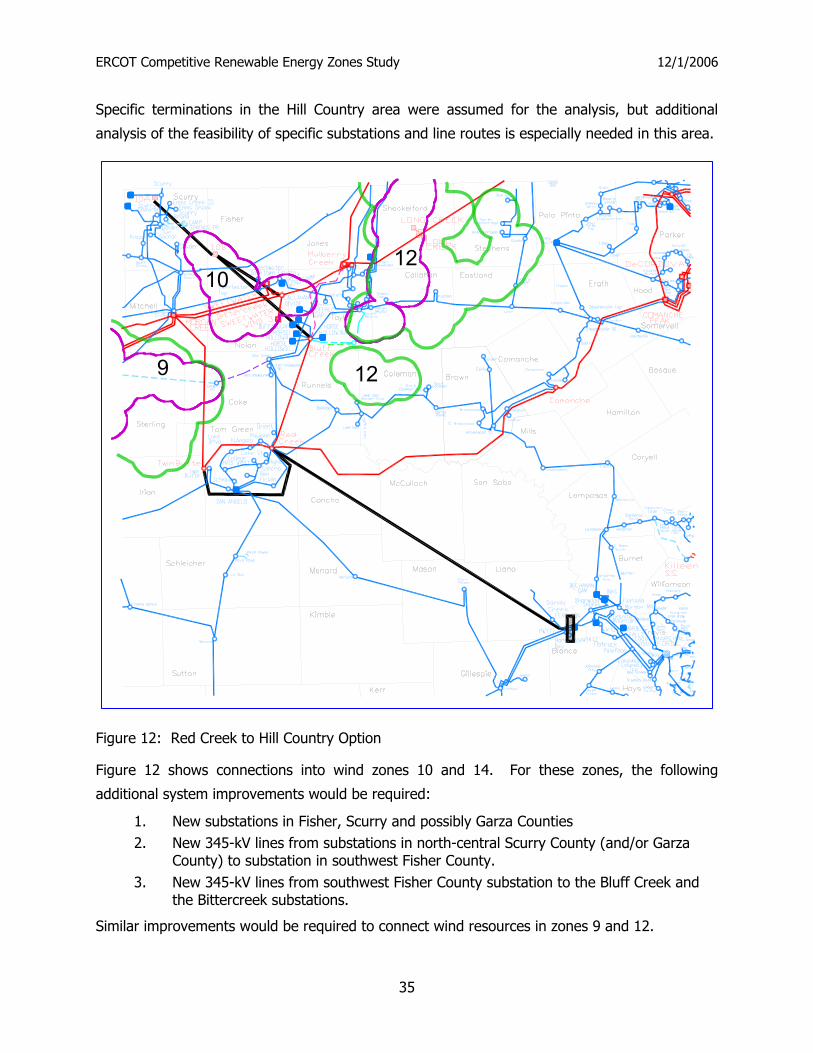
ERCOT Competitive Renewable Energy Zones Study 12/1/2006
35
Specific terminations in the Hill Country area were assumed for the analysis, but additional
analysis of the feasibility of specific substations and line routes is especially needed in this area.
Figure 12: Red Creek to Hill Country Option
Figure 12 shows connections into wind zones 10 and 14. For these zones, the following
additional system improvements would be required:
1. New substations in Fisher, Scurry and possibly Garza Counties 2. New 345-kV lines from substations in north-central Scurry County (and/or Garza
County) to substation in southwest Fisher County. 3. New 345-kV lines from southwest Fisher County substation to the Bluff Creek and
the Bittercreek substations.
Similar improvements would be required to connect wind resources in zones 9 and 12.
10
129
12
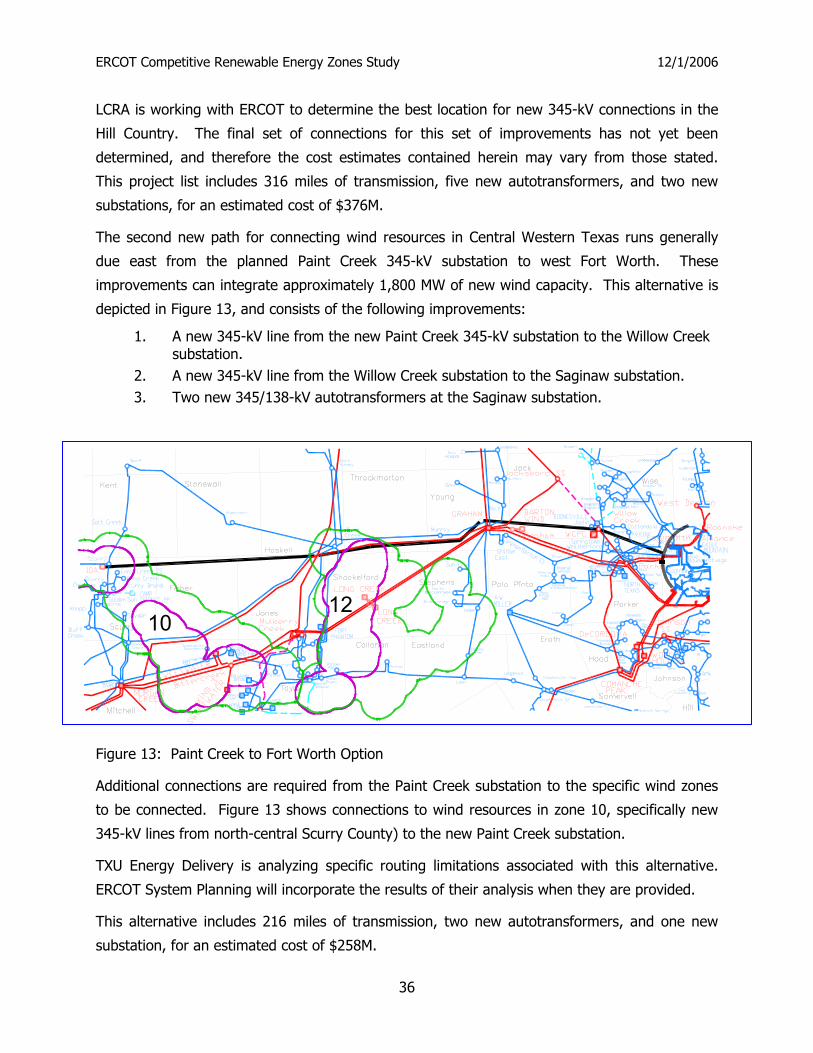
ERCOT Competitive Renewable Energy Zones Study 12/1/2006
36
LCRA is working with ERCOT to determine the best location for new 345-kV connections in the
Hill Country. The final set of connections for this set of improvements has not yet been
determined, and therefore the cost estimates contained herein may vary from those stated.
This project list includes 316 miles of transmission, five new autotransformers, and two new
substations, for an estimated cost of $376M.
The second new path for connecting wind resources in Central Western Texas runs generally
due east from the planned Paint Creek 345-kV substation to west Fort Worth. These
improvements can integrate approximately 1,800 MW of new wind capacity. This alternative is
depicted in Figure 13, and consists of the following improvements:
1. A new 345-kV line from the new Paint Creek 345-kV substation to the Willow Creek substation.
2. A new 345-kV line from the Willow Creek substation to the Saginaw substation. 3. Two new 345/138-kV autotransformers at the Saginaw substation.
Figure 13: Paint Creek to Fort Worth Option
Additional connections are required from the Paint Creek substation to the specific wind zones
to be connected. Figure 13 shows connections to wind resources in zone 10, specifically new
345-kV lines from north-central Scurry County) to the new Paint Creek substation.
TXU Energy Delivery is analyzing specific routing limitations associated with this alternative.
ERCOT System Planning will incorporate the results of their analysis when they are provided.
This alternative includes 216 miles of transmission, two new autotransformers, and one new
substation, for an estimated cost of $258M.
1012

ERCOT Competitive Renewable Energy Zones Study 12/1/2006
37
The third alternative for connecting new wind capacity in central Western Texas connects the
Bluff Creek area with the Bosque substation, and includes a new switching station near Selden,
on the existing Comanche Switch – Comanche Peak 345-kV line. This alternative is depicted in
Figure 14, and consists of the following transmission projects:
1. A new switching substation near Selden, about half-way along the length of the existing Comanche Switch – Comanche Peak 345-kV line.
2. A new 345-kV line from Bluff Creek to Selden. 3. A new 345-kV line from Selden to Bosque. 4. A new 345-kV line from Bosque to Pecan Creek, going around the west side of
Waco. 5. A new 138-kV line from Bosque to Elm Mott. 6. Moving the proposed Silver Star windpower project from the 138-kV Lingleville
interconnection to a 345-kV interconnection on the Bluff Creek – Selden line. 7. A third 345/138-kV autotransformer at Whitney.
This alternative, as depicted in Figure 14, includes connections into wind zones 10 and 14.
Similar connections would be required for connecting into other areas in central Western Texas.
This upgrade path by itself would allow the incorporation of approximately 1,400 MW of new
wind capacity in central Western Texas. This project list includes 330 miles of transmission,
one new autotransformer, and three new substations, for an estimated cost of $381M.
The three individual options for the Central West Texas area have been used to provide three
cumulative solutions for this area. The first level solution for potential CREZs in the Central
West Texas area is the Red Creek to Hill Country option described above, which would support
approximately 2,000 MW of new CREZ wind generation in this area.
The second level solution for this area is the addition of the Bluff Creek to Bosque option
described above to the Red Creek to Hill Country option. This cumulative second level
transmission solution supports about 3,000 MW in the Central West Texas areas at a
transmission capital cost of $727 million.
The third level solution for this area is the combination of the Red Creek to Hill Country option,
the Bluff Creek to Bosque Option and the Paint Creek to Fort Worth option. This combination
supports about 3,800 MW of new wind generation in the potential CREZs in this area at a cost
of $955 million.
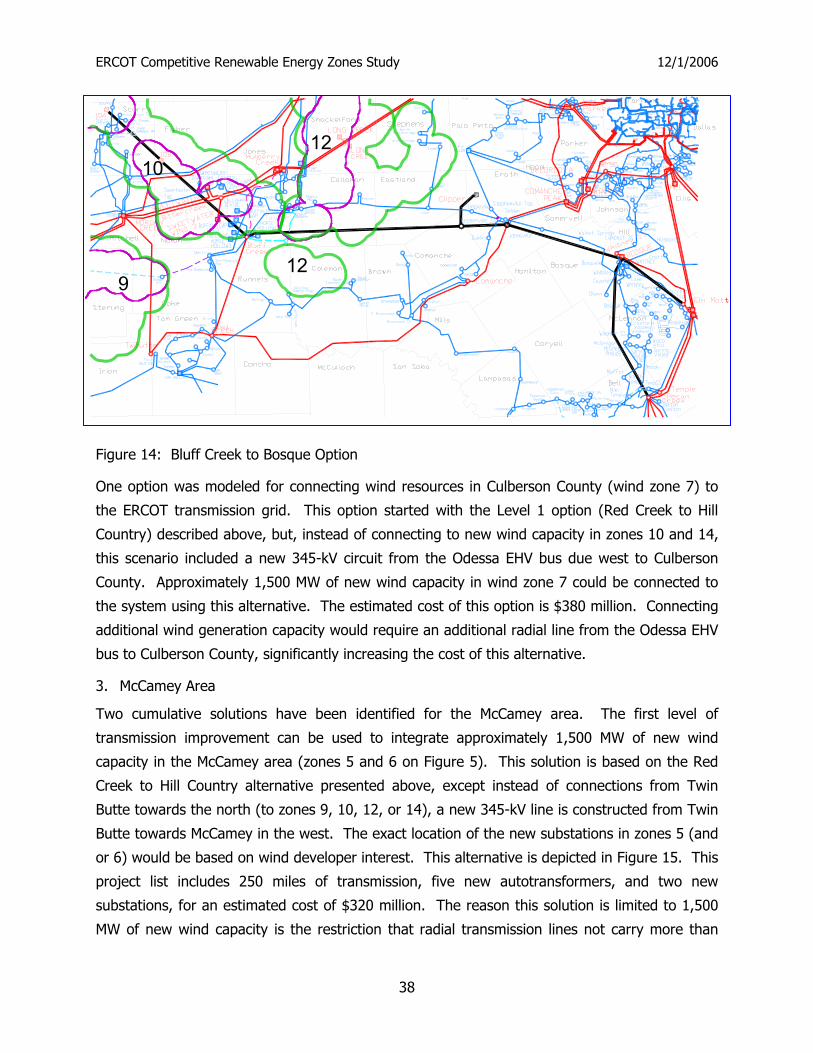
ERCOT Competitive Renewable Energy Zones Study 12/1/2006
38
Figure 14: Bluff Creek to Bosque Option
One option was modeled for connecting wind resources in Culberson County (wind zone 7) to
the ERCOT transmission grid. This option started with the Level 1 option (Red Creek to Hill
Country) described above, but, instead of connecting to new wind capacity in zones 10 and 14,
this scenario included a new 345-kV circuit from the Odessa EHV bus due west to Culberson
County. Approximately 1,500 MW of new wind capacity in wind zone 7 could be connected to
the system using this alternative. The estimated cost of this option is $380 million. Connecting
additional wind generation capacity would require an additional radial line from the Odessa EHV
bus to Culberson County, significantly increasing the cost of this alternative.
3. McCamey Area
Two cumulative solutions have been identified for the McCamey area. The first level of
transmission improvement can be used to integrate approximately 1,500 MW of new wind
capacity in the McCamey area (zones 5 and 6 on Figure 5). This solution is based on the Red
Creek to Hill Country alternative presented above, except instead of connections from Twin
Butte towards the north (to zones 9, 10, 12, or 14), a new 345-kV line is constructed from Twin
Butte towards McCamey in the west. The exact location of the new substations in zones 5 (and
or 6) would be based on wind developer interest. This alternative is depicted in Figure 15. This
project list includes 250 miles of transmission, five new autotransformers, and two new
substations, for an estimated cost of $320 million. The reason this solution is limited to 1,500
MW of new wind capacity is the restriction that radial transmission lines not carry more than
1012
129
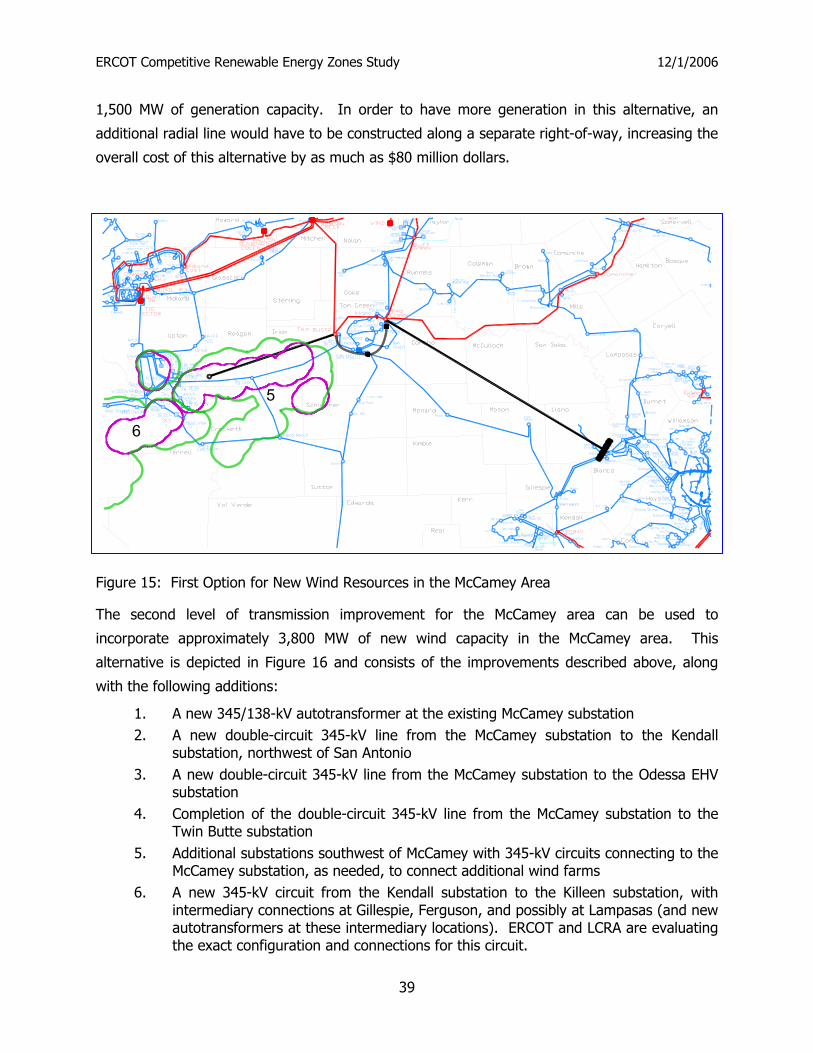
ERCOT Competitive Renewable Energy Zones Study 12/1/2006
39
1,500 MW of generation capacity. In order to have more generation in this alternative, an
additional radial line would have to be constructed along a separate right-of-way, increasing the
overall cost of this alternative by as much as $80 million dollars.
Figure 15: First Option for New Wind Resources in the McCamey Area
The second level of transmission improvement for the McCamey area can be used to
incorporate approximately 3,800 MW of new wind capacity in the McCamey area. This
alternative is depicted in Figure 16 and consists of the improvements described above, along
with the following additions:
1. A new 345/138-kV autotransformer at the existing McCamey substation 2. A new double-circuit 345-kV line from the McCamey substation to the Kendall
substation, northwest of San Antonio 3. A new double-circuit 345-kV line from the McCamey substation to the Odessa EHV
substation 4. Completion of the double-circuit 345-kV line from the McCamey substation to the
Twin Butte substation 5. Additional substations southwest of McCamey with 345-kV circuits connecting to the
McCamey substation, as needed, to connect additional wind farms 6. A new 345-kV circuit from the Kendall substation to the Killeen substation, with
intermediary connections at Gillespie, Ferguson, and possibly at Lampasas (and new autotransformers at these intermediary locations). ERCOT and LCRA are evaluating the exact configuration and connections for this circuit.
5
6
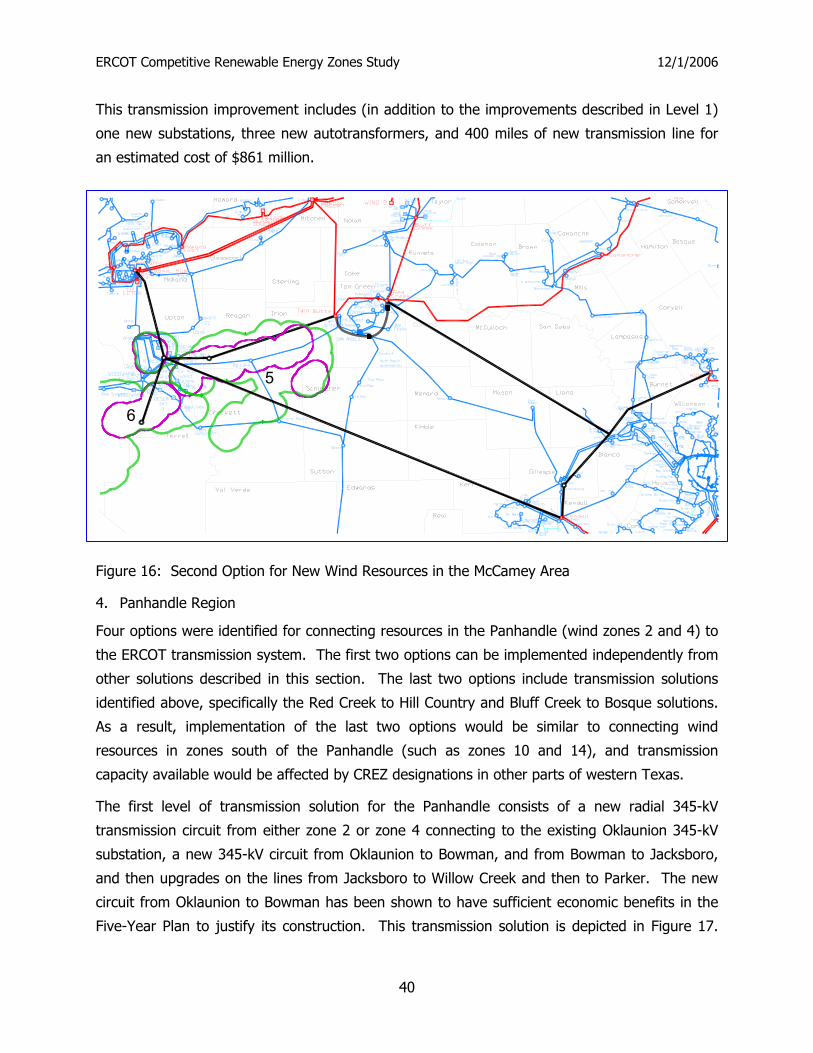
ERCOT Competitive Renewable Energy Zones Study 12/1/2006
40
This transmission improvement includes (in addition to the improvements described in Level 1)
one new substations, three new autotransformers, and 400 miles of new transmission line for
an estimated cost of $861 million.
Figure 16: Second Option for New Wind Resources in the McCamey Area
4. Panhandle Region
Four options were identified for connecting resources in the Panhandle (wind zones 2 and 4) to
the ERCOT transmission system. The first two options can be implemented independently from
other solutions described in this section. The last two options include transmission solutions
identified above, specifically the Red Creek to Hill Country and Bluff Creek to Bosque solutions.
As a result, implementation of the last two options would be similar to connecting wind
resources in zones south of the Panhandle (such as zones 10 and 14), and transmission
capacity available would be affected by CREZ designations in other parts of western Texas.
The first level of transmission solution for the Panhandle consists of a new radial 345-kV
transmission circuit from either zone 2 or zone 4 connecting to the existing Oklaunion 345-kV
substation, a new 345-kV circuit from Oklaunion to Bowman, and from Bowman to Jacksboro,
and then upgrades on the lines from Jacksboro to Willow Creek and then to Parker. The new
circuit from Oklaunion to Bowman has been shown to have sufficient economic benefits in the
Five-Year Plan to justify its construction. This transmission solution is depicted in Figure 17.
5
6
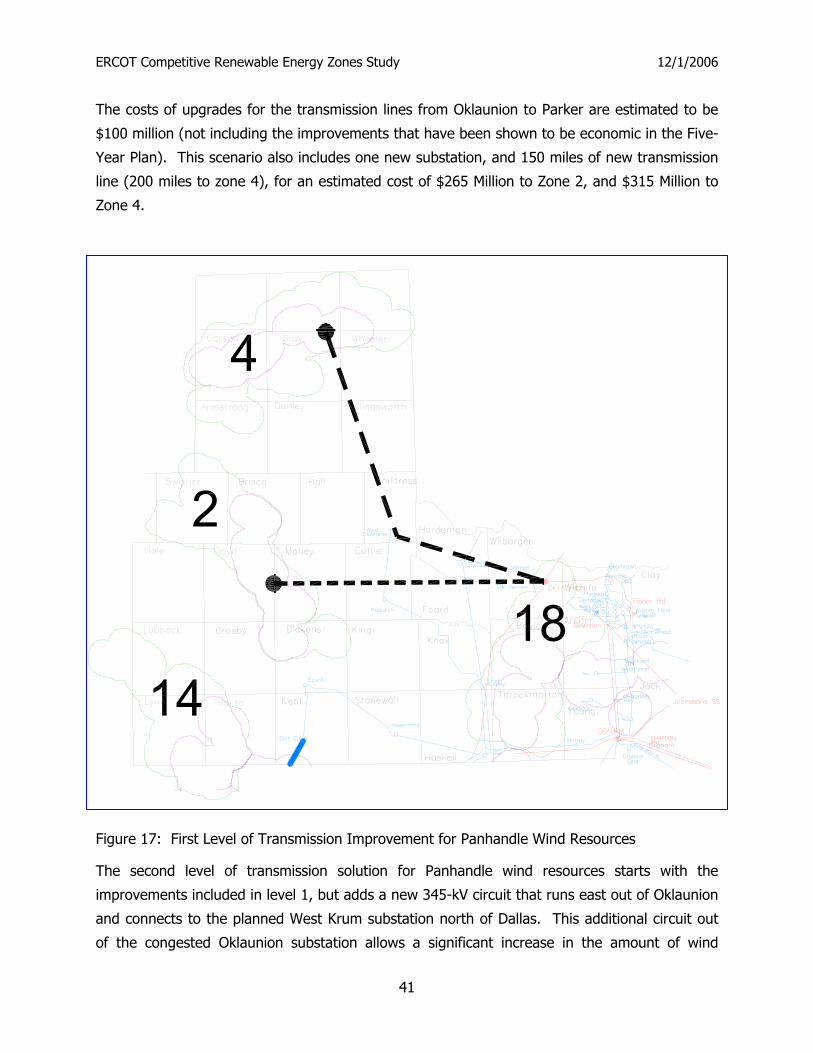
ERCOT Competitive Renewable Energy Zones Study 12/1/2006
41
The costs of upgrades for the transmission lines from Oklaunion to Parker are estimated to be
$100 million (not including the improvements that have been shown to be economic in the Five-
Year Plan). This scenario also includes one new substation, and 150 miles of new transmission
line (200 miles to zone 4), for an estimated cost of $265 Million to Zone 2, and $315 Million to
Zone 4.
Figure 17: First Level of Transmission Improvement for Panhandle Wind Resources
The second level of transmission solution for Panhandle wind resources starts with the
improvements included in level 1, but adds a new 345-kV circuit that runs east out of Oklaunion
and connects to the planned West Krum substation north of Dallas. This additional circuit out
of the congested Oklaunion substation allows a significant increase in the amount of wind
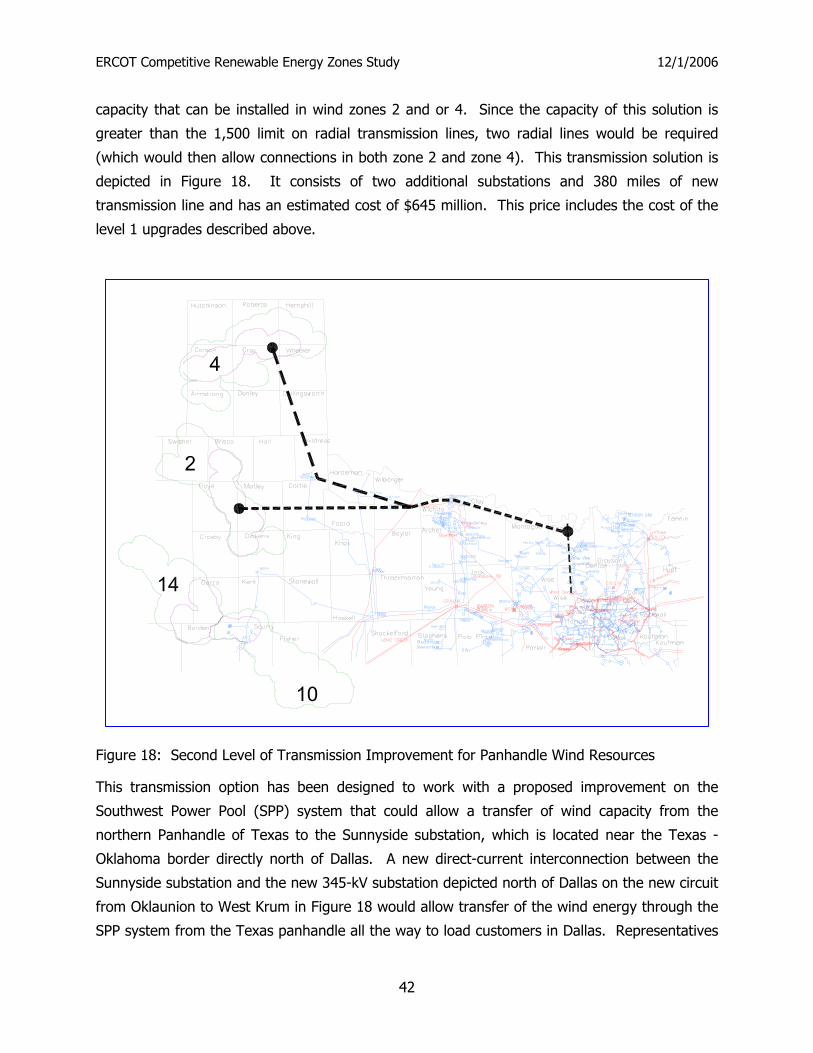
ERCOT Competitive Renewable Energy Zones Study 12/1/2006
42
capacity that can be installed in wind zones 2 and or 4. Since the capacity of this solution is
greater than the 1,500 limit on radial transmission lines, two radial lines would be required
(which would then allow connections in both zone 2 and zone 4). This transmission solution is
depicted in Figure 18. It consists of two additional substations and 380 miles of new
transmission line and has an estimated cost of $645 million. This price includes the cost of the
level 1 upgrades described above.
Figure 18: Second Level of Transmission Improvement for Panhandle Wind Resources
This transmission option has been designed to work with a proposed improvement on the
Southwest Power Pool (SPP) system that could allow a transfer of wind capacity from the
northern Panhandle of Texas to the Sunnyside substation, which is located near the Texas -
Oklahoma border directly north of Dallas. A new direct-current interconnection between the
Sunnyside substation and the new 345-kV substation depicted north of Dallas on the new circuit
from Oklaunion to West Krum in Figure 18 would allow transfer of the wind energy through the
SPP system from the Texas panhandle all the way to load customers in Dallas. Representatives
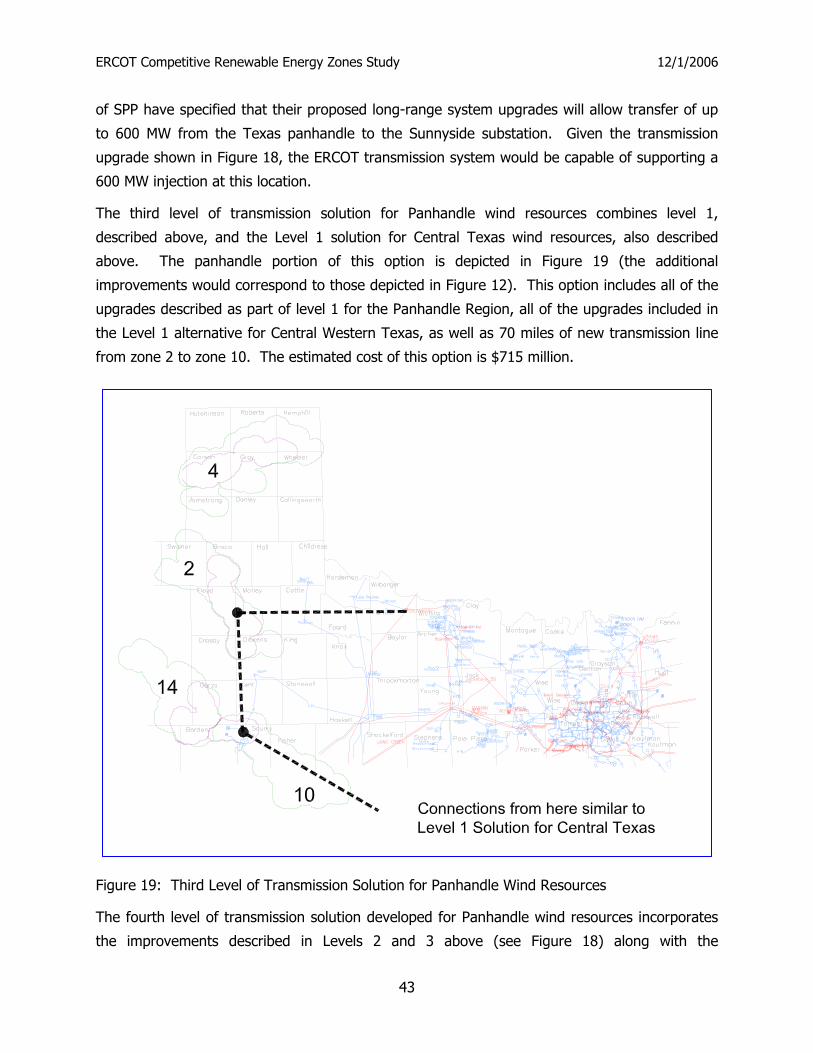
ERCOT Competitive Renewable Energy Zones Study 12/1/2006
43
of SPP have specified that their proposed long-range system upgrades will allow transfer of up
to 600 MW from the Texas panhandle to the Sunnyside substation. Given the transmission
upgrade shown in Figure 18, the ERCOT transmission system would be capable of supporting a
600 MW injection at this location.
The third level of transmission solution for Panhandle wind resources combines level 1,
described above, and the Level 1 solution for Central Texas wind resources, also described
above. The panhandle portion of this option is depicted in Figure 19 (the additional
improvements would correspond to those depicted in Figure 12). This option includes all of the
upgrades described as part of level 1 for the Panhandle Region, all of the upgrades included in
the Level 1 alternative for Central Western Texas, as well as 70 miles of new transmission line
from zone 2 to zone 10. The estimated cost of this option is $715 million.
Figure 19: Third Level of Transmission Solution for Panhandle Wind Resources
The fourth level of transmission solution developed for Panhandle wind resources incorporates
the improvements described in Levels 2 and 3 above (see Figure 18) along with the
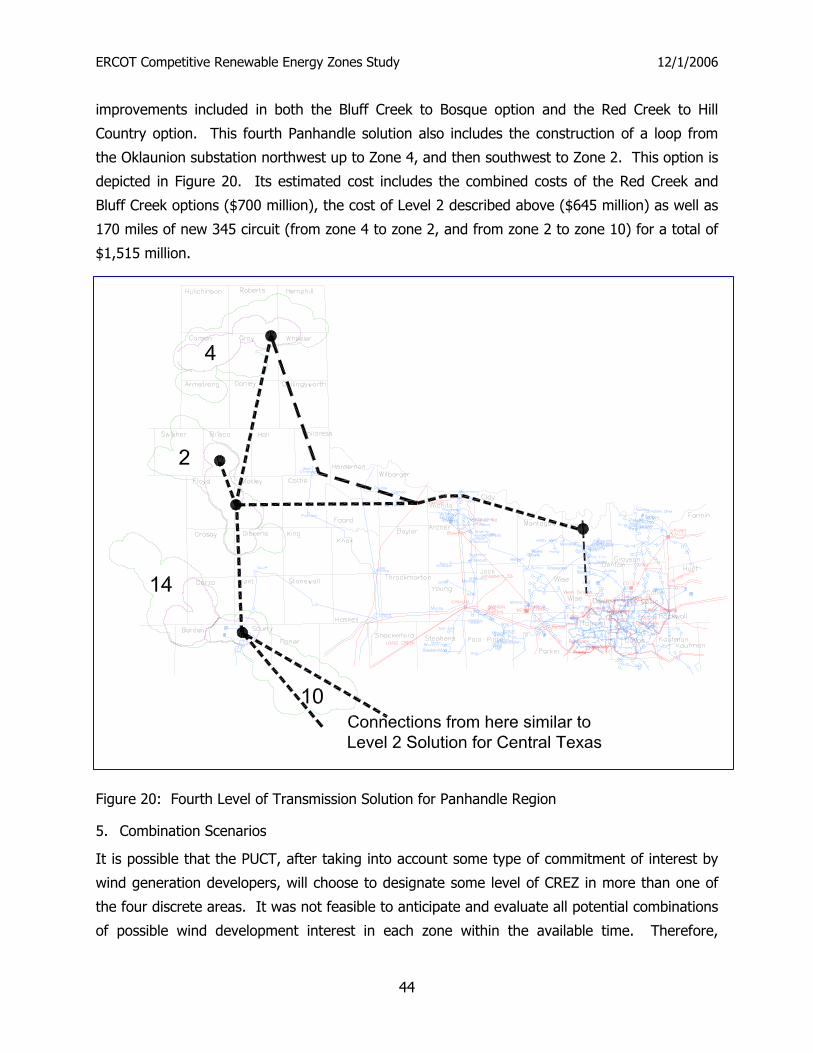
ERCOT Competitive Renewable Energy Zones Study 12/1/2006
44
improvements included in both the Bluff Creek to Bosque option and the Red Creek to Hill
Country option. This fourth Panhandle solution also includes the construction of a loop from
the Oklaunion substation northwest up to Zone 4, and then southwest to Zone 2. This option is
depicted in Figure 20. Its estimated cost includes the combined costs of the Red Creek and
Bluff Creek options ($700 million), the cost of Level 2 described above ($645 million) as well as
170 miles of new 345 circuit (from zone 4 to zone 2, and from zone 2 to zone 10) for a total of
$1,515 million.
Figure 20: Fourth Level of Transmission Solution for Panhandle Region
5. Combination Scenarios
It is possible that the PUCT, after taking into account some type of commitment of interest by
wind generation developers, will choose to designate some level of CREZ in more than one of
the four discrete areas. It was not feasible to anticipate and evaluate all potential combinations
of possible wind development interest in each zone within the available time. Therefore,

ERCOT Competitive Renewable Energy Zones Study 12/1/2006
45
ERCOT took the approach of evaluating different levels and distributions of new wind
generation between two or more of the discrete areas and using different logical combinations
of the building block transmission upgrades, until the distribution of wind between the areas
that resulted in the highest total installed wind generation (with around a 2% total wind
generation curtailment) was found for that set of transmission upgrades. Several combinations
of transmission solutions were evaluated to determine their joint effectiveness at incorporating
new wind capacity into the transmission system. If the level of CREZ interest varies
significantly, in level or distribution, from the scenarios studied, ERCOT should perform an
analysis of that combination to evaluate the exact transmission upgrades that would be needed
to accommodate this interest. Several scenarios were run that included wind from central
western Texas (zones 10 and 14) and the McCamey area. One additional scenario was
evaluated that included wind from Zones 10 and 14, zone 5 (McCamey area), and zone 24 (the
Gulf Coast area).
B. Modeling Results for Proposed System Improvements
The economic modeling results for each of these alternatives are provided in Appendix C
(Tables C1 – C8). These results are summarized in Table 5. Two base cases, one with the
common projects described in Section IV (I), and one without the projects, were used to
calculate the changes in total system production costs and total system generator revenue.
Two base cases were required because these common projects were not included in the Coastal
Zone cases nor were they included in the first two scenarios for additional Panhandle wind
capacity (because the new wind generation in these scenarios had a limited impact on the
transmission capacity utilized by the existing wind generation). The base case without common
projects had an annual total production cost of $13,378 million/year and an annual total
generator revenue of $17,449 million/year. The base case with the common projects had an
annual total production cost of $13,376 million/year and an annual total generator revenue of
$17,459 million/year.
The term annual total production cost equals the total cost to serve energy demand for one
year, i.e., the cost to run the plants that generate the electricity to meet hourly demand. This
value includes the costs of fuel, variable operations and maintenance, and unit startup. The
term annual total generator revenue indicates the revenue that would be received by a
generator being paid the sum of each hour’s generation multiplied by the generators hourly
nodal price. Generator revenue also includes a make-whole payment to dispatchable
generators to compensate them for hours during which they are required to stay on-line to
meet system needs yet the nodal price is insufficient to pay their hourly costs, and for startup
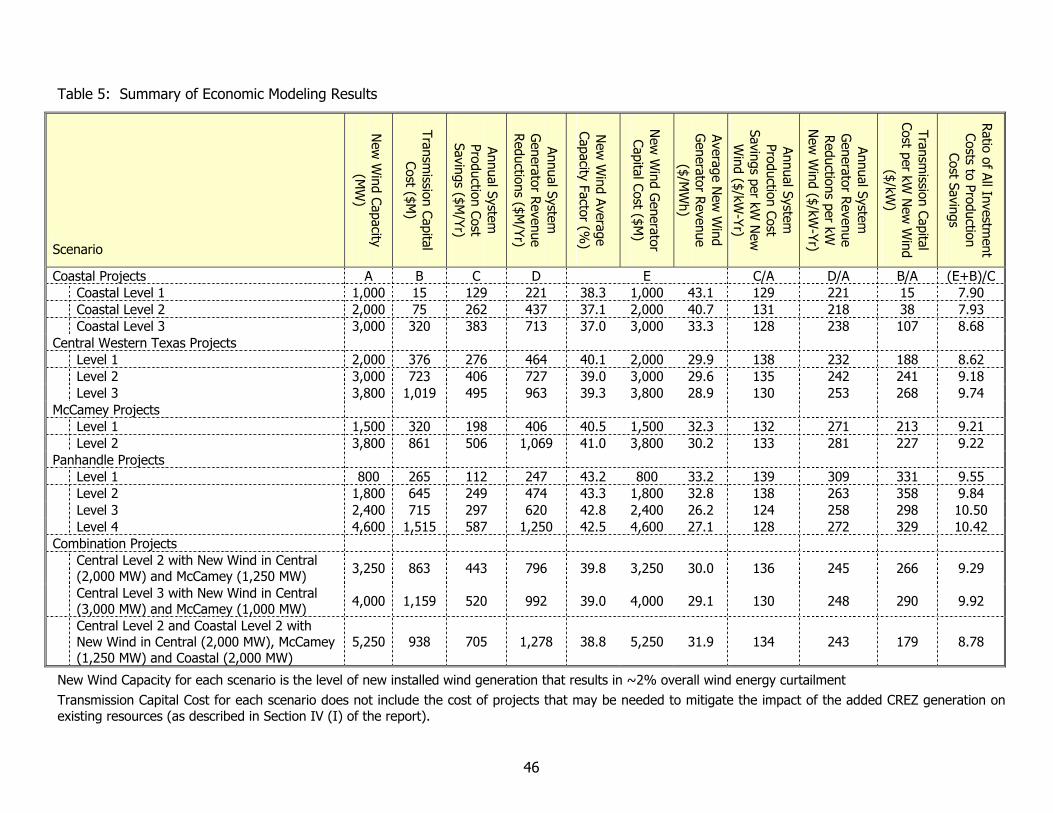
46
Table 5: Summary of Economic Modeling Results
Scenario
New
Wind Capacity (M
W)
Transmission Capital
Cost ($M)
Annual System
Production Cost Savings ($M
/Yr)
Annual System
Generator R
evenue Reductions ($M
/Yr)
New
Wind Average
Capacity Factor (%)
New
Wind G
enerator Capital Cost ($M
)
Average New
Wind
Generator R
evenue ($/M
Wh)
Annual System
Production Cost Savings per kW
New
W
ind ($/kW-Yr)
Annual System
Generator R
evenue Reductions per kW
N
ew W
ind ($/kW-Yr)
Transmission Capital
Cost per kW N
ew W
ind ($/kW
)
Ratio of All Investm
ent Costs to Production
Cost Savings
Coastal Projects A B C D E C/A D/A B/A (E+B)/C Coastal Level 1 1,000 15 129 221 38.3 1,000 43.1 129 221 15 7.90 Coastal Level 2 2,000 75 262 437 37.1 2,000 40.7 131 218 38 7.93 Coastal Level 3 3,000 320 383 713 37.0 3,000 33.3 128 238 107 8.68 Central Western Texas Projects Level 1 2,000 376 276 464 40.1 2,000 29.9 138 232 188 8.62 Level 2 3,000 723 406 727 39.0 3,000 29.6 135 242 241 9.18 Level 3 3,800 1,019 495 963 39.3 3,800 28.9 130 253 268 9.74 McCamey Projects Level 1 1,500 320 198 406 40.5 1,500 32.3 132 271 213 9.21 Level 2 3,800 861 506 1,069 41.0 3,800 30.2 133 281 227 9.22 Panhandle Projects Level 1 800 265 112 247 43.2 800 33.2 139 309 331 9.55 Level 2 1,800 645 249 474 43.3 1,800 32.8 138 263 358 9.84 Level 3 2,400 715 297 620 42.8 2,400 26.2 124 258 298 10.50 Level 4 4,600 1,515 587 1,250 42.5 4,600 27.1 128 272 329 10.42 Combination Projects
Central Level 2 with New Wind in Central (2,000 MW) and McCamey (1,250 MW) 3,250 863 443 796 39.8 3,250 30.0 136 245 266 9.29
Central Level 3 with New Wind in Central (3,000 MW) and McCamey (1,000 MW) 4,000 1,159 520 992 39.0 4,000 29.1 130 248 290 9.92
Central Level 2 and Coastal Level 2 with New Wind in Central (2,000 MW), McCamey (1,250 MW) and Coastal (2,000 MW)
5,250 938 705 1,278 38.8 5,250 31.9 134 243 179 8.78
New Wind Capacity for each scenario is the level of new installed wind generation that results in ~2% overall wind energy curtailment Transmission Capital Cost for each scenario does not include the cost of projects that may be needed to mitigate the impact of the added CREZ generation on existing resources (as described in Section IV (I) of the report).

ERCOT Competitive Renewable Energy Zones Study 12/1/2006
47
costs that are incurred for system reliability. The Annual Production Cost Savings and the
Annual Generator Revenue Reductions, shown on the table for each scenario, compare the
annual total production cost and annual total generator revenue, respectively, for that scenario
to the annual total production cost and annual total generator revenue from a simulation of the
system without any new CREZ wind or associated transmission upgrades. The term “New Wind
Capacity Energy Revenue” is defined as the average hourly nodal price paid to the new wind
units added in each scenario.
As noted previously, the term capacity factor is the percentage of energy actually produced by a
unit compared to the amount it would have produced if it operated at its nameplate rating over
an entire year. As discussed in Section IV(F), the total cost of energy from a wind project will
decrease by approximately $1.50/MWh for every 1% increase in capacity factor, all other
factors being equal.
In order to calculate the ratio of all investment costs to the annual production cost savings, the
investment capital required for the transmission improvements was added to the investment
capital required for the new wind generation. The result, for each scenario, was divided by the
total annual production cost savings. This result can be used to judge one possible scenario
against another, based on total societal benefit. Although this number allows comparison
between scenarios, it does not represent actual societal benefits. The capital costs for
transmission capacity, which will be paid through a regulated rate-making process through a
load-weighted charge to all customers, does not represent the same costs to society as the
market-based (i.e., at risk) investment of capital for new wind generation.

ERCOT Competitive Renewable Energy Zones Study 12/1/2006
48
VI. DISCUSSION
A. Comparison of Alternatives
The analysis described in this report has indicated a need for additional pathways between
areas with significant wind resources, most notably areas west of Abilene, and significant load
centers, generally along and east of the Interstate 35 corridor. The existing ERCOT 345-kV
system generally resembles V rotated towards the left, with one side of the V extending from
Odessa to the Dallas/Fort Worth area, and the other side made up of the relatively integrated
system covering a triangular area with Dallas, San Antonio and Houston at the vertices.
Results from the base case of this study, which includes 4,850 MW of wind capacity in West
Texas, indicate that in the vicinity of the vertex of this inverted V, near Fort Worth, the 345-kV
system is supporting about as much wind generation as it can. The transmission system
generally from the Oklaunion substation south through the Graham substation and to the
Parker substation cannot support any significant new additions of wind generation beyond what
the 4,850 MW in the base case (although it should be noted that this amount includes
approximately 1,500 MW of proxy wind generation for which there is not signed interconnection
agreements). This leads to the main result of this study: that there is a need for more
corridors that cross the divide of this inverted V, i.e., corridors that run generally from West
Texas to the east and southeast, rather than northeast towards Fort Worth.
It is also noteworthy that although the 345-kV system in East Texas is well-developed, there are
several areas of significant load growth on the western side of this area that are not served by
any 345-kV circuits. This is the case in the Hill Country, from northwest San Antonio to Killeen,
where significant load growth is currently projected to be served only by the existing 138-kV
system. Areas such as this can be good locations for end points for lines originating in the wind
generation zones because they have sufficient load to absorb the output of new wind
generation. However, because there is no existing 345-kV infrastructure in these areas,
additional circuits must be planned so that the injection of wind energy does not exceed the
capacity of the existing 138-kV system.
This study also shows that the existing congestion in the area from Oklaunion to the Parker
substation significantly limits additional power-flows in this area, even with the addition of new
circuits. Even with significant upgrades on the lines from Oklaunion to Parker, the system in
that area can only support 800 MW of new wind generation capacity. With an additional new
circuit from Oklaunion to north Dallas (terminating at the proposed West Krum substation), only
an additional 1,000 MW of wind capacity can be supported (for a total of 1,800 MW). Because

ERCOT Competitive Renewable Energy Zones Study 12/1/2006
49
the existing system is being utilized near its limitations, incremental additions in this area do not
provide significant amounts of additional transfer capability.
The exact opposite situation exists near the Gulf Coast, where there is no existing wind
generation, so very few system improvements must be made in order to support the first
incremental amounts of wind. However, there are currently over 4,000 MW of wind generation
in the ERCOT interconnection queue in South Texas. If all of these projects are developed, the
total capacity would exceed the three levels of system upgrades that have been identified
during this study.
B. Economic Considerations
It is a common simplification of open markets to assume that the consumer will eventually pay
for all resources required to supply a product. In the case of electricity, the consumer will
eventually pay for all of the resources required to produce and to transport the electricity. In
other words, the consumer will pay for the capital to build the generator, the fuel to run the
generator and the transmission system designed to serve loads securely.
It is important to consider that the consumer will have to pay for the capital costs of wind
generation, in addition to the transmission costs that have been estimated as part of this
analysis. The same can be said for all generation technologies. The comparison of the total
costs of wind energy to the total costs of other technologies is beyond the scope of this study.
Quantifying the other benefits from renewable technologies, such as human health impacts
from reduced fossil-fuel emissions, increased fuel diversity, reduced reliance on natural gas
generation, impacts of reduced demand on related markets (such as natural gas and coal),
benefits from economic development, to name a few, are also beyond the scope of this study.
This study examines one aspect of designating Competitive Renewable Energy Zones,
specifically what are the most cost-effective solutions to improve the transmission system and
allow transportation of additional wind energy from high wind zones to customer load while
maintaining system security. The results provided in this document should not be viewed as
documenting all costs or all benefits to consumers associated with CREZ designations.
C. Impact of Wind Curtailment
Defining the amount of new wind generation that can be added to the system, given a specific
transmission solution, is contingent on the answer to the question of how much wind
curtailment is acceptable. Unfortunately, wind curtailment is a complicated issue.
First and foremost, curtailment of energy to relieve transmission congestion can represent a
significant economic impact to a wind project, since the owner of a wind project relies on
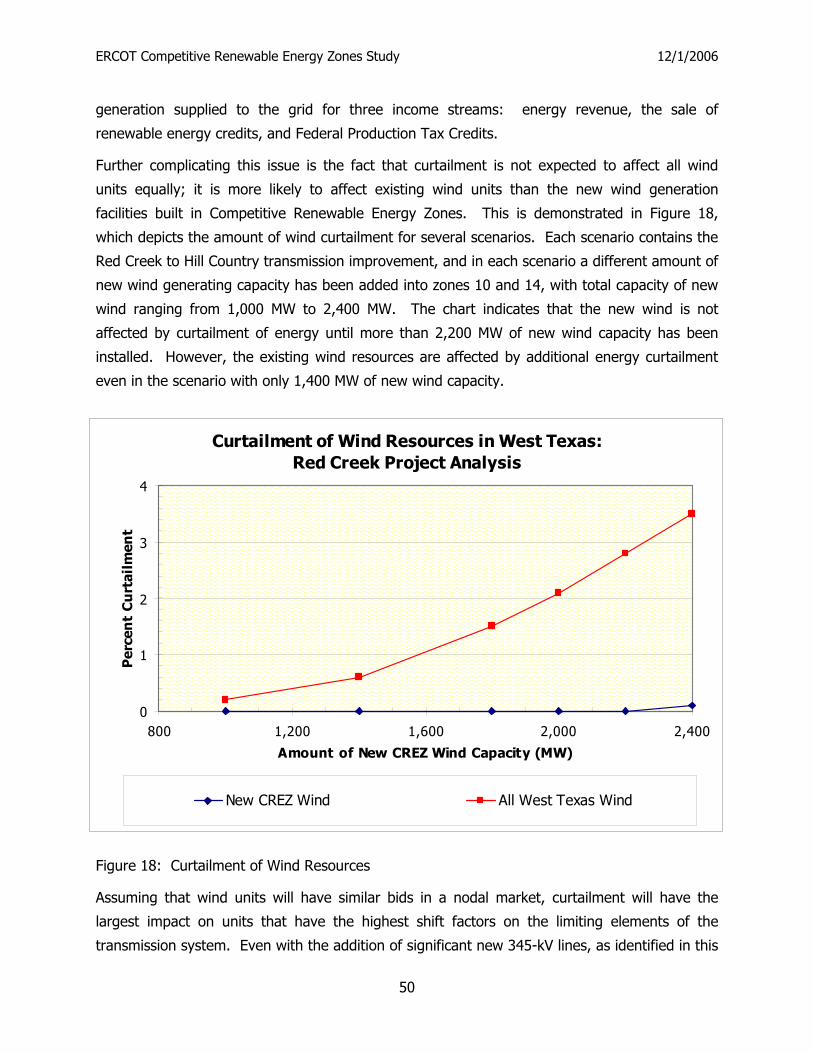
ERCOT Competitive Renewable Energy Zones Study 12/1/2006
50
generation supplied to the grid for three income streams: energy revenue, the sale of
renewable energy credits, and Federal Production Tax Credits.
Further complicating this issue is the fact that curtailment is not expected to affect all wind
units equally; it is more likely to affect existing wind units than the new wind generation
facilities built in Competitive Renewable Energy Zones. This is demonstrated in Figure 18,
which depicts the amount of wind curtailment for several scenarios. Each scenario contains the
Red Creek to Hill Country transmission improvement, and in each scenario a different amount of
new wind generating capacity has been added into zones 10 and 14, with total capacity of new
wind ranging from 1,000 MW to 2,400 MW. The chart indicates that the new wind is not
affected by curtailment of energy until more than 2,200 MW of new wind capacity has been
installed. However, the existing wind resources are affected by additional energy curtailment
even in the scenario with only 1,400 MW of new wind capacity.
Figure 18: Curtailment of Wind Resources
Assuming that wind units will have similar bids in a nodal market, curtailment will have the
largest impact on units that have the highest shift factors on the limiting elements of the
transmission system. Even with the addition of significant new 345-kV lines, as identified in this
Curtailment of Wind Resources in West Texas: Red Creek Project Analysis
0
1
2
3
4
800 1,200 1,600 2,000 2,400
Amount of New CREZ Wind Capacity (MW)
Per
cen
t C
urt
ailm
ent
New CREZ Wind All West Texas Wind

ERCOT Competitive Renewable Energy Zones Study 12/1/2006
51
study, the limiting elements for transfers from West Texas will likely include elements of the
138-kV circuits that extend from West Texas towards the North, East and South.
As proposed in this study, new wind generation projects in Competitive Renewable Energy
Zones will be connected to new 345-kV circuits and will thus have lower shift factors on the
existing, older 138-kV circuits. In hours in which some wind generation must be curtailed in
order to relieve constraints on the transmission system, the most economic solution will be to
limit generation of the wind units with the highest shift factors on the limiting element(s). The
first of these wind units to be curtailed will likely be older wind projects connected to existing
138-kV circuits in the immediate vicinity of the limiting element(s).
In addition, certain existing wind generators may be more affected than others. Figure 19
shows the differential impact of expected curtailment on different wind units for the scenario
with the Red Creek to Hill Country transmission improvement with 2,000 MW of new wind
capacity (the fourth data point depicted on Figure 18). Note that in this run the overall
curtailment of all wind units is just above 2%, which means that about 2% of the energy that
all of the wind units in the case could have produced, given the meteorological modeling and
analysis conducted by AWS Truewind, could not be accepted by the transmission system and
had to be curtailed in order to maintain n-1 system security. In Figure 19, each of the existing
wind units in the model is labeled by a number. The last of these units, number 36, represents
the 2,000 megawatts of new wind capacity located in the proposed wind zone.
This disparity in unit-by-unit curtailment exists even with the common projects (described in
Section IV[I]) that were generally developed to reduce the impact of new CREZ wind capacity
on existing wind generation. Other scenarios provide similar results, with different existing
units being affected, depending on which elements in the existing system become the most
congested following incorporation of new transmission improvements.
There will be a direct relationship between the amount of wind developed in any new CREZ and
the amount of curtailment of existing wind generation. For the purposes of this study, ERCOT
has described levels CREZ wind capacity consistent with ~2% overall wind curtailment. The
choice of the 2% overall curtailment criteria was arbitrary; the acceptable amount of wind
capacity in each CREZ should be reevaluated by the PUCT recognizing the disparity of impacts.
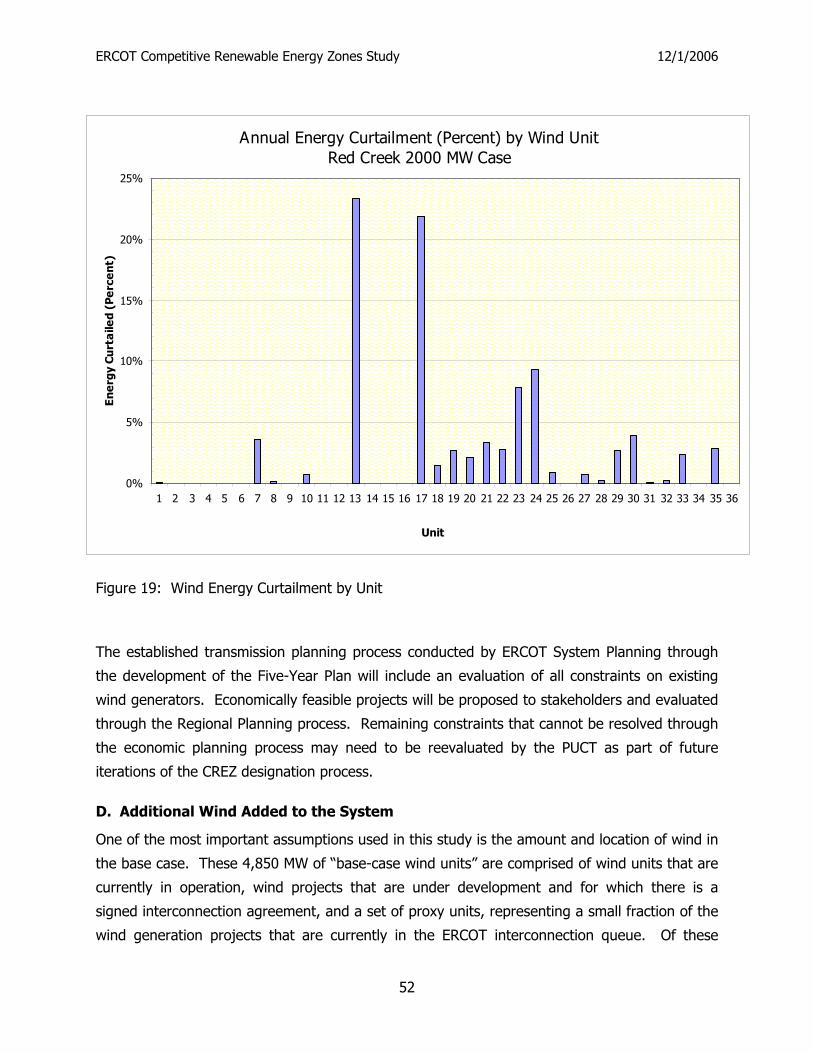
ERCOT Competitive Renewable Energy Zones Study 12/1/2006
52
Figure 19: Wind Energy Curtailment by Unit
The established transmission planning process conducted by ERCOT System Planning through
the development of the Five-Year Plan will include an evaluation of all constraints on existing
wind generators. Economically feasible projects will be proposed to stakeholders and evaluated
through the Regional Planning process. Remaining constraints that cannot be resolved through
the economic planning process may need to be reevaluated by the PUCT as part of future
iterations of the CREZ designation process.
D. Additional Wind Added to the System
One of the most important assumptions used in this study is the amount and location of wind in
the base case. These 4,850 MW of “base-case wind units” are comprised of wind units that are
currently in operation, wind projects that are under development and for which there is a
signed interconnection agreement, and a set of proxy units, representing a small fraction of the
wind generation projects that are currently in the ERCOT interconnection queue. Of these
Annual Energy Curtailment (Percent) by Wind UnitRed Creek 2000 MW Case
0%
5%
10%
15%
20%
25%
1 2 3 4 5 6 7 8 9 10 11 12 13 14 15 16 17 18 19 20 21 22 23 24 25 26 27 28 29 30 31 32 33 34 35 36
Unit
En
ergy
Cu
rta
iled
(P
erce
nt)

ERCOT Competitive Renewable Energy Zones Study 12/1/2006
53
base-case units, it is likely that the existing projects and almost all of the projects in
development with an interconnection agreement will be operational during the 2009 study year.
However, it is likely that some of the additional projects in the interconnection queue will be
operational in 2009, regardless of the CREZ designation. However, it is not known how many
or where these projects will be located on the system.
The amount and location of these projects will likely have an impact on the amount of
additional wind that can be added in the designated wind zones. Put another way, for a given
amount of new wind resources developed in a specific wind zone, the amount and location of
these other wind resources will have an impact on the distribution and aggregate amount of
curtailment of wind resources. Unfortunately, there is no way to avoid this situation. The
speed with which new wind projects can be developed, compared to the extensive amount of
time it takes to design, permit, and construct large transmission projects, will always result in a
lag between the projected wind resources when a transmission study is conducted and the
actual projects implemented when the transmission project is complete.
ERCOT System Planning will continue to track generation projects as they enter and progress
through the interconnection queue and will keep the PUCT apprised of any significant impacts
to overall transmission planning resulting from new generation projects. In addition, ERCOT
System Planning will continue to develop the annual Five-Year Plan, evaluating possible
transmission system upgrades over the next five years to maintain system reliability and to
maximize system cost-benefits. This Five-Year Plan will include all projects that cost-effectively
relieve congestion on existing and on planned generation projects for which there is a signed
interconnection agreement.
E. Other Considerations
Numerous solutions were evaluated in the course of this study. These solutions included new
345-kV rights-of-way, improvements of existing 345-kV and 138-kV circuits, and new 765-kV
rights-of-way.
1. System Upgrades Using 765-kV Circuits
A significant amount of time was spent evaluating the costs and benefits of new 765-kV circuits.
In general, 765-kV circuits have much lower impedances than 345-kV circuits. Given a choice
of using 345-kV or 765-kV for a new connection between to buses, more current is likely to flow
on the 765-kV circuit, resulting in less loading on the lower voltage circuits.
However, in contingency analysis, the loadings on the lower voltage circuits will be the same if
a new 345-kV circuit is opened or a new 765-kV circuit is opened. In situations where the
ERCOT Competitive Renewable Energy Zones Study 12/1/2006
54
limiting elements on the system are existing 138-kV circuits that span significant distances,
there are few, if any, benefits to building new 765-kV circuits instead of new 345-kV circuits.
This is the case in much of West Texas, where the only 345-kV circuits run generally from West
Texas to Fort Worth, through either the Graham or the Comanche buses.
Two other considerations regarding analyzing 765-kV circuits should be noted. The first is that
the current cost estimate for construction of 765-kV circuits is $2 million/mile. This is
significantly higher than the current $1 million/mile estimate for 345-kV construction. Even
construction of a double-circuit 345-kV line is estimated to cost $1.3 million/mile, and such a
circuit would have nearly the rate A thermal limit of a 765-kV circuit. The second consideration
is that 765-kV substations are estimated to cost approximately $50 million, compared with cost
of $15 million for a new 345-kV substation. Although this difference may not seem significant,
since a circuit can be constructed with only two new substations, this additional cost could
preclude connecting wind resources at intermediate locations along a new right-of-way. Several
of the new rights-of-way proposed in this study pass through or near other areas identified by
AWS Truewind as having economically viable wind resources. These rights-of-way include the
new circuit from Red Creek to the Hill Country, which passes through zones 11 and 20, the
circuit from Bluff Creek to Bosque, which passes through zones 12 and 15, and the circuit from
McCamey to Kendall, which passes through zones 13 and 20. Although connecting the wind
resources in these zones was not evaluated as part of this study, future wind development in
these areas would be more likely if the right-of-way passing through them has a voltage of 345
kV rather than 765 kV.
One benefit of 765-kV circuits is that they provide significant line capacity when nearby 345-kV
circuits are opened under contingency. In areas where there is already an established 345-kV
infrastructure, there may be substantial economic benefits to using 765-kV circuits for future
improvements, rather than 345-kV circuits. As such, 765-kV improvements should continue to
be studied in future years, especially if improvements like the ones analyzed in this study are
constructed.
2. Comanche Switch Circuit Upgrade
One of the system upgrades that was reviewed but not recommended in this study was
installation of the second circuit on the existing towers that run from the Morgan Creek
substation down to the Twin Butte substation, and then to the Comanche switch substation.
This second circuit could also be extended to the Comanche substation (located at the
Comanche Peak nuclear generating facility), however, in order to do so a 138-kV circuit that has
been installed on these transmission towers would need to be relocated to a new right-of-way.

ERCOT Competitive Renewable Energy Zones Study 12/1/2006
55
Over the course of this study several stakeholders have asked whether it would be reasonable
to include an upgrade to this circuit as part of the proposed system improvements, primarily
due to the fact that it would be relatively inexpensive (about $250,000/mile). Although this
alternative was studied in several scenarios, it was not found to increase the system capability
enough to justify its cost. There are two reasons for this, both of which relate to how current
flows on a transmission system. Intuitively, current will flow in the easiest path, i.e., the one
with the lowest total impedance, from generation to load. The line from Morgan Creek to
Comanche leads towards an area with a significant amount of generation, including Comanche
Peak (~2,300 MW of capacity), DeCordova (~1,100 MW) and Wolf Hollow (~800 MW), rather
than towards an area with significant load. In addition, the overall length of this circuit results
in its large impedance, which is why there is not a significant current flow on the existing single
circuit. This impedance could be altered using series compensation devices, however this
becomes problematic if the circuit is extended to the Comanche Peak substation. It is possible
for series compensation devices to result in localized system impacts to nearby generators. Any
such potential impacts to the steam generators at the Comanche Peak facility would require
extensive study.
F. Future Steps
This study was designed to provide cost and benefit comparisons of a large number of different
alternatives. As a result, it was not possible to fully delineate the system upgrades that will be
needed for every scenario, nor to fully characterize the system benefits associated with these
improvements. As an example, it was not possible to complete an AC power-flow analysis for
each alternative, so there may be minor modifications to the proposed alternatives that could
provide more system benefits than those proposed. At the same time, the benefits from the
proposed system upgrades into the Hill Country and Killeen areas have not been fully
quantified, as these improvements may significantly reduce the likelihood of reduced voltage
events given certain system contingencies.
Specific locations of end points within the proposed wind generation zones have also not been
determined (often referred to as the transmission system “on-ramps”). In almost all cases, the
new transmission corridors identified in this study can be used equally to serve wind generation
in multiple zones (such as the solutions that provide transmission capacity for wind generation
in the central zones 9, 10, 12, and 14). The AWS Truewind model results indicate the relative
level of wind resources in the different zones; however, the model results do not pinpoint these
resources to specific locations. Rather, the location of the sites within a zone may be located
anywhere within that zone. The geographic extent of some of the zones makes it difficult to

ERCOT Competitive Renewable Energy Zones Study 12/1/2006
56
know where exactly to place a new substation. Zone 10, as an example, stretches from Abilene
to Garza County.
Proposed locations of new substations within the evaluated wind zones also have not been
specified because there are numerous considerations regarding generation siting that are
beyond the scope of this study. These include: differences in local taxes; inclinations of local
property owners; familiarity of wind developers with different areas; site access issues; and
possible discrepancies between the model results and actual site conditions, to name a few.
Most, if not all, of these issues can be resolved through a process wherein the wind developers
express their interest in specific locations within the proposed wind zones.
The transmission necessary to connect the wind generation facilities in a CREZ to the bulk
transmission system has not been quantified in this study due to its dependence on the specific
siting of that generation. These direct connection facilities will have to be evaluated after the
specific generation siting has been determined. However, those direct connection costs are not
expected to vary so widely between the different potential CREZ areas as to change the relative
ranking of the areas.
The lowest cost solution for connecting multiple wind generation sites in a CREZ into the new
345-kV CREZ lines may be to build 138-kV lines from each of the sites to a single, central
345/138-kV substation, or it may be to build several 345/138-kV substations in order to lower
the 138-kV line costs. This tradeoff cannot be analyzed until the actual wind generation
locations are known.
After specific locations have been selected for proposed Competitive Renewable Energy Zones,
and wind generation developers have indicated their intentions to develop projects in these
zones, it is recommended that ERCOT System Planning, in coordination with the appropriate
TSPs, be allowed to fine-tune both the locations for new substations in the proposed wind
energy zones (the on-ramps) and the specific connection points near load.

ERCOT Competitive Renewable Energy Zones Study 12/1/2006
57
VII. CONCLUSIONS
This study of transmission improvements to support additional wind capacity developed in
Competitive Renewable Energy Zones has been conducted to support the Public Utility
Commission of Texas in meeting the requirements of recently passed legislation. This study is
based on input assumptions from the Five-Year Transmission Plan, and from a study of wind
generation potential from areas throughout the State of Texas conducted by AWS Truewind.
Detailed steady-state transmission models and security constrained unit-commitment and unit-
dispatch models have been used to analyze the costs and benefits of a large number of
potential transmission improvements.
The study indicates that there is significant potential for development of wind resources in
Texas. There are currently 2,508 MW of wind generation in-service in ERCOT and at least
4,850 MW of wind resources are likely to be in-service by the end of 2007. Approximately
17,000 MW of wind generation has requested interconnection analysis. Much of that current
wind generation development is in West Texas. Studies indicate that the existing transmission
network is fully utilized with respect to wind transfers from West Texas to the remainder of
ERCOT. Thus, new bulk transmission lines are needed to support significant transfers of
additional wind generation in the West Texas area.
From a transmission planning perspective, there are four general areas of wind capacity
expansion: the Gulf Coast; the McCamey area, central-western Texas, and the Texas
Panhandle. Transmission solutions for each of these areas are described in this report. These
solutions represent incremental plans for each area and form the basis of transmission solutions
to support combinations of wind development between two or more areas.
Some common projects will be needed to mitigate the impact of the new CREZ-related
generation on existing wind generation. Even with these projects, existing wind generation will
be more susceptible to curtailment due to remaining system constraints because of its generally
higher shift factors on those constraints.
This study does not attempt to capture all of the benefits and costs associated with the
designation of CREZs, but focuses primarily on the direct costs and benefits related to the
electric power system. In general, the production cost savings per kW of new wind generation
varies little between the different areas. The Coastal area has lower capacity factor sites than
the other areas but the wind output is somewhat more coincident with the ERCOT electrical
load. The Coastal area also requires the least transmission investment per MW of installed new
wind capacity. The Panhandle area has more, high capacity factor resources. The transmission

ERCOT Competitive Renewable Energy Zones Study 12/1/2006
58
cost per MW is also higher for the Panhandle area; the higher capacity factor of the resources
in this area does not offset this higher cost.
The first level solution for the Central and McCamey areas use the same bulk transmission
addition, so the designation of CREZs and addition of resources in these areas must be
generally considered in conjunction.
While transmission solutions were generally developed that provided 1,000 MW incremental
steps for each area, the second step for the McCamey level is larger, in terms of both cost and
MW of wind generation supported; although the cost per MW of supported wind is similar to the
other levels for McCamey and Central areas.
ERCOT will be performing an analysis of the impact of significant additional wind generation on
the level of the different ancillary services that it procures to maintain system reliability. In
addition, further ERCOT analysis of several issues is needed once a specific set of CREZs is
designated by the PUCT and wind generation developers have indicated specific locations.
These additional analyses include reactive support needs, dynamic stability analyses,
optimization of the “on-ramps” within the CREZs and analysis of the specific projects or
operational procedures needed to mitigate curtailments of existing wind generation.

APPENDIX A
Wind Generation Potential by Wind Energy Zone

Texas Wind Zone AnalysisNet Capacity Factor - Wind Generation Supply Curve
(Zone 1)
0
2,000
4,000
6,000
8,000
10,000
12,000
30% 35% 40% 45% 50%
Net Capacity Factor
MW
Cap
acity

Texas Wind Zone AnalysisNet Capacity Factor - Wind Generation Supply Curve
(Zone 2)
0
2,000
4,000
6,000
8,000
10,000
30% 35% 40% 45% 50%
Net Capacity Factor
MW
Cap
acity
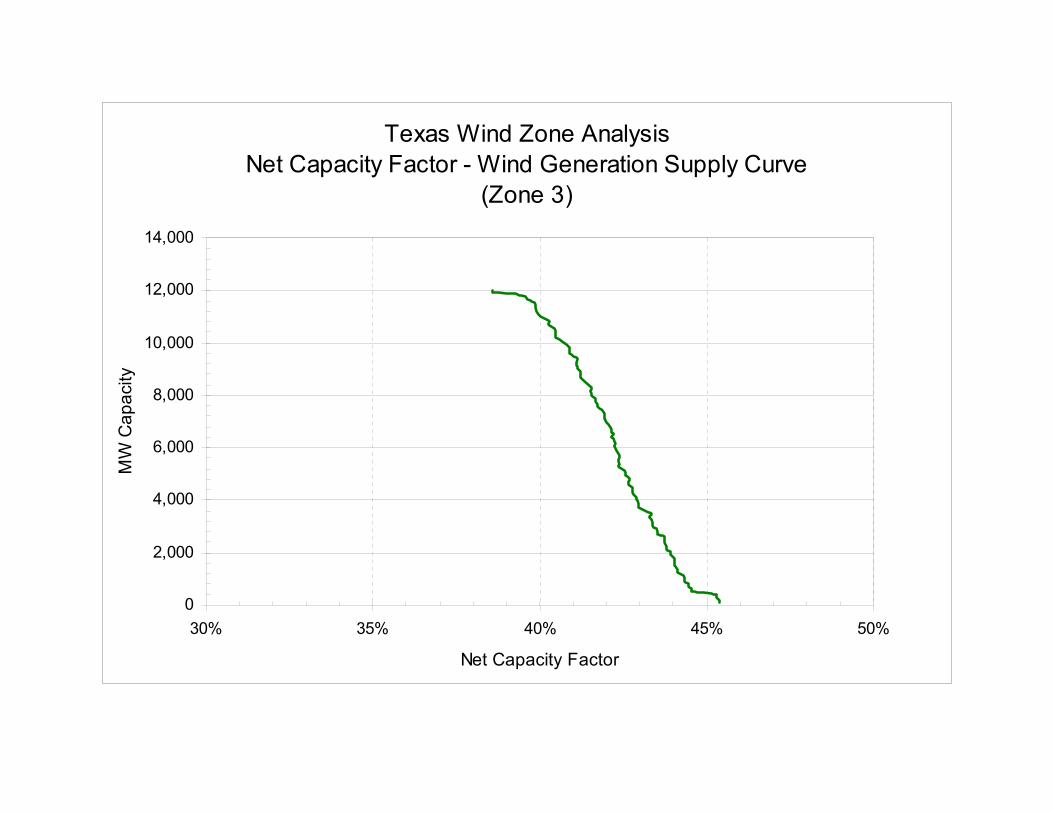
Texas Wind Zone AnalysisNet Capacity Factor - Wind Generation Supply Curve
(Zone 3)
0
2,000
4,000
6,000
8,000
10,000
12,000
14,000
30% 35% 40% 45% 50%
Net Capacity Factor
MW
Cap
acity
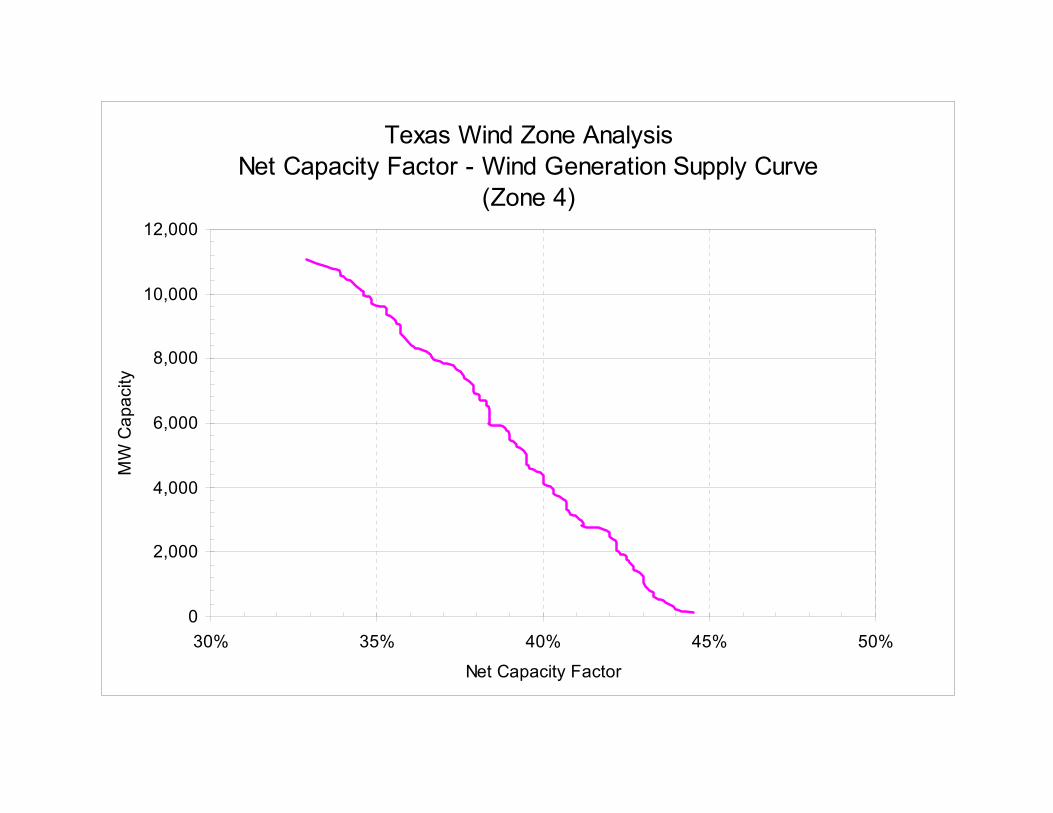
Texas Wind Zone AnalysisNet Capacity Factor - Wind Generation Supply Curve
(Zone 4)
0
2,000
4,000
6,000
8,000
10,000
12,000
30% 35% 40% 45% 50%
Net Capacity Factor
MW
Cap
acity
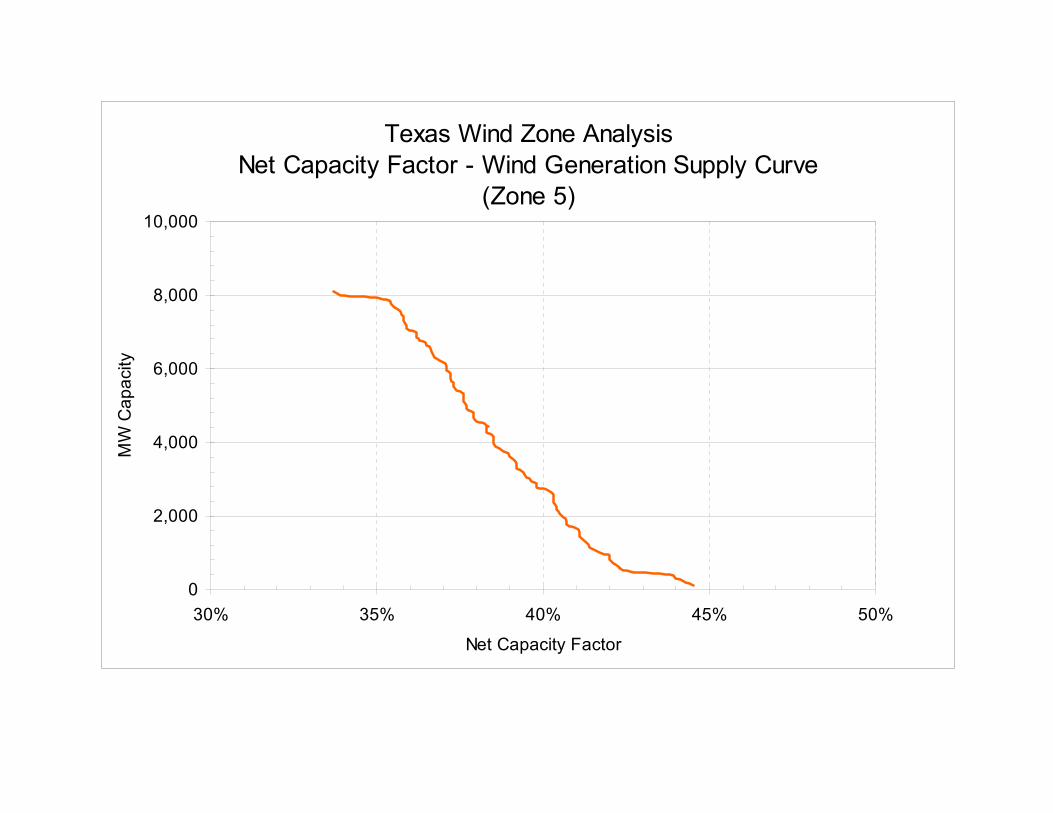
Texas Wind Zone AnalysisNet Capacity Factor - Wind Generation Supply Curve
(Zone 5)
0
2,000
4,000
6,000
8,000
10,000
30% 35% 40% 45% 50%
Net Capacity Factor
MW
Cap
acity
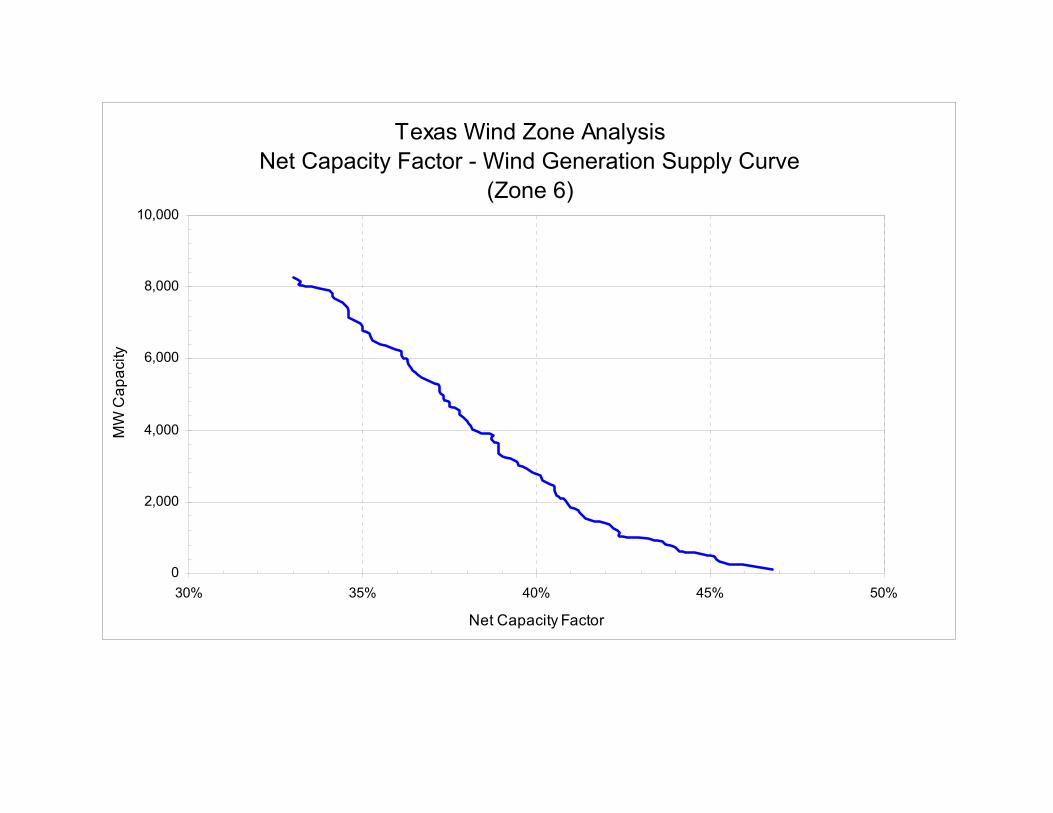
Texas Wind Zone AnalysisNet Capacity Factor - Wind Generation Supply Curve
(Zone 6)
0
2,000
4,000
6,000
8,000
10,000
30% 35% 40% 45% 50%
Net Capacity Factor
MW
Cap
acity
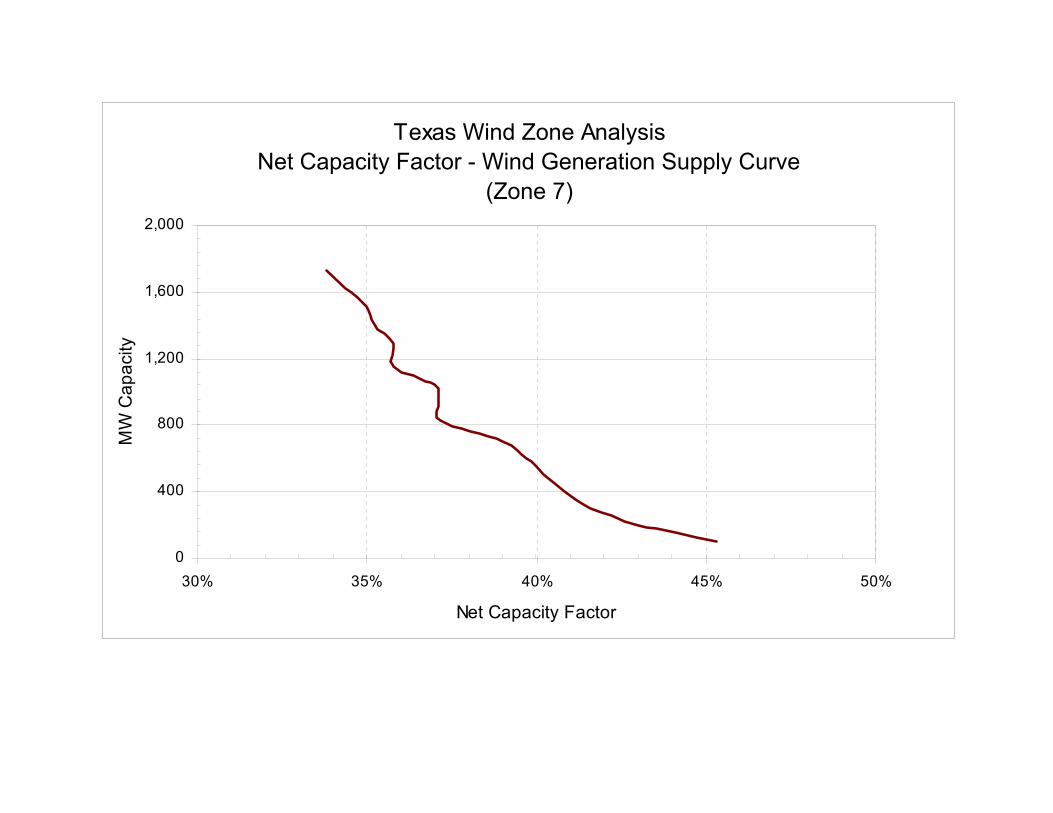
Texas Wind Zone AnalysisNet Capacity Factor - Wind Generation Supply Curve
(Zone 7)
0
400
800
1,200
1,600
2,000
30% 35% 40% 45% 50%
Net Capacity Factor
MW
Cap
acity
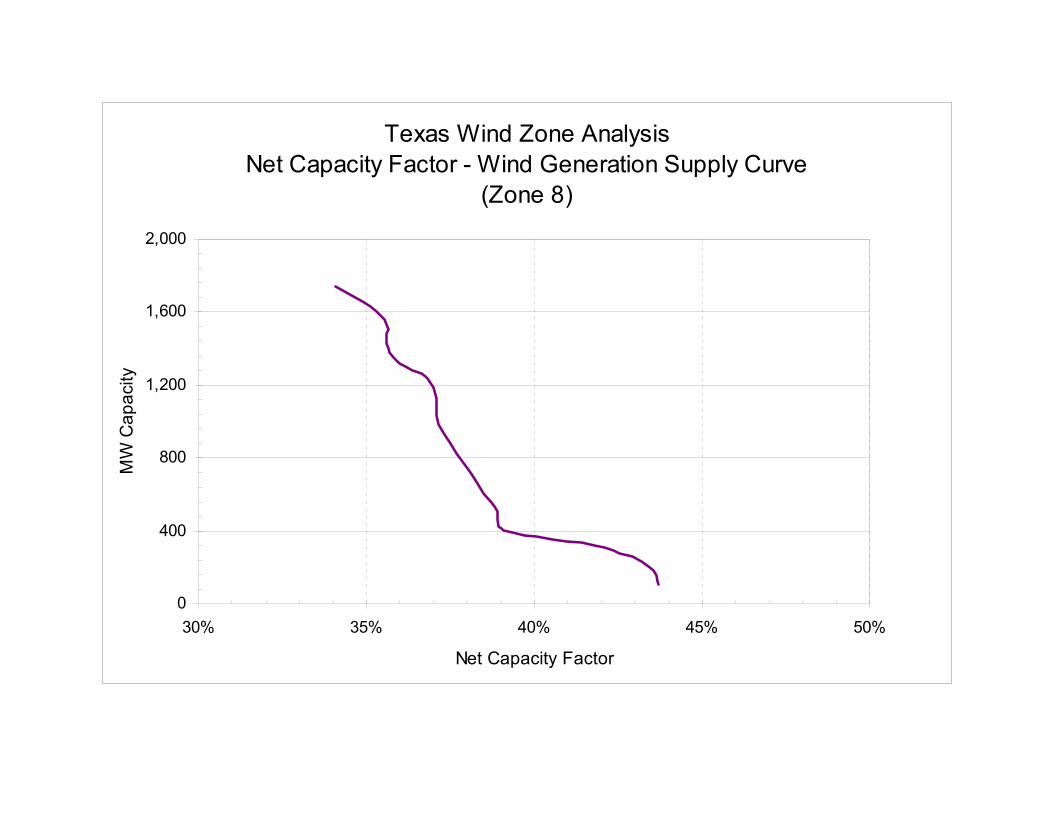
Texas Wind Zone AnalysisNet Capacity Factor - Wind Generation Supply Curve
(Zone 8)
0
400
800
1,200
1,600
2,000
30% 35% 40% 45% 50%
Net Capacity Factor
MW
Cap
acity
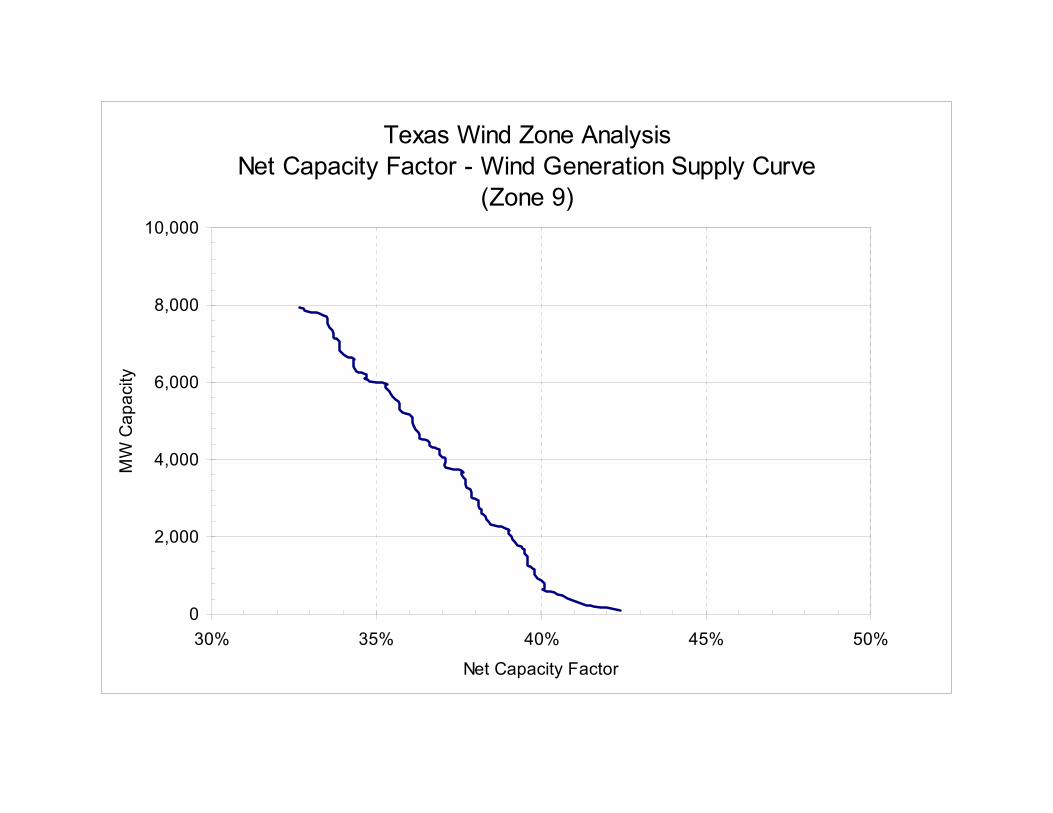
Texas Wind Zone AnalysisNet Capacity Factor - Wind Generation Supply Curve
(Zone 9)
0
2,000
4,000
6,000
8,000
10,000
30% 35% 40% 45% 50%
Net Capacity Factor
MW
Cap
acity
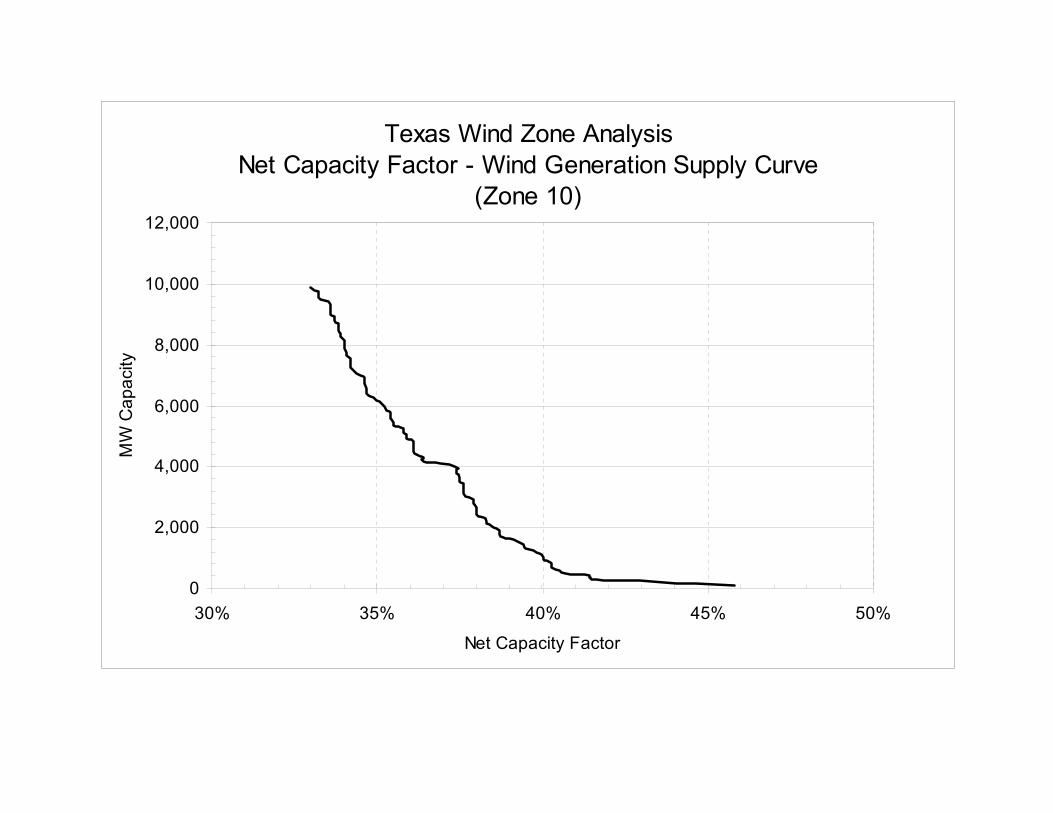
Texas Wind Zone AnalysisNet Capacity Factor - Wind Generation Supply Curve
(Zone 10)
0
2,000
4,000
6,000
8,000
10,000
12,000
30% 35% 40% 45% 50%
Net Capacity Factor
MW
Cap
acity
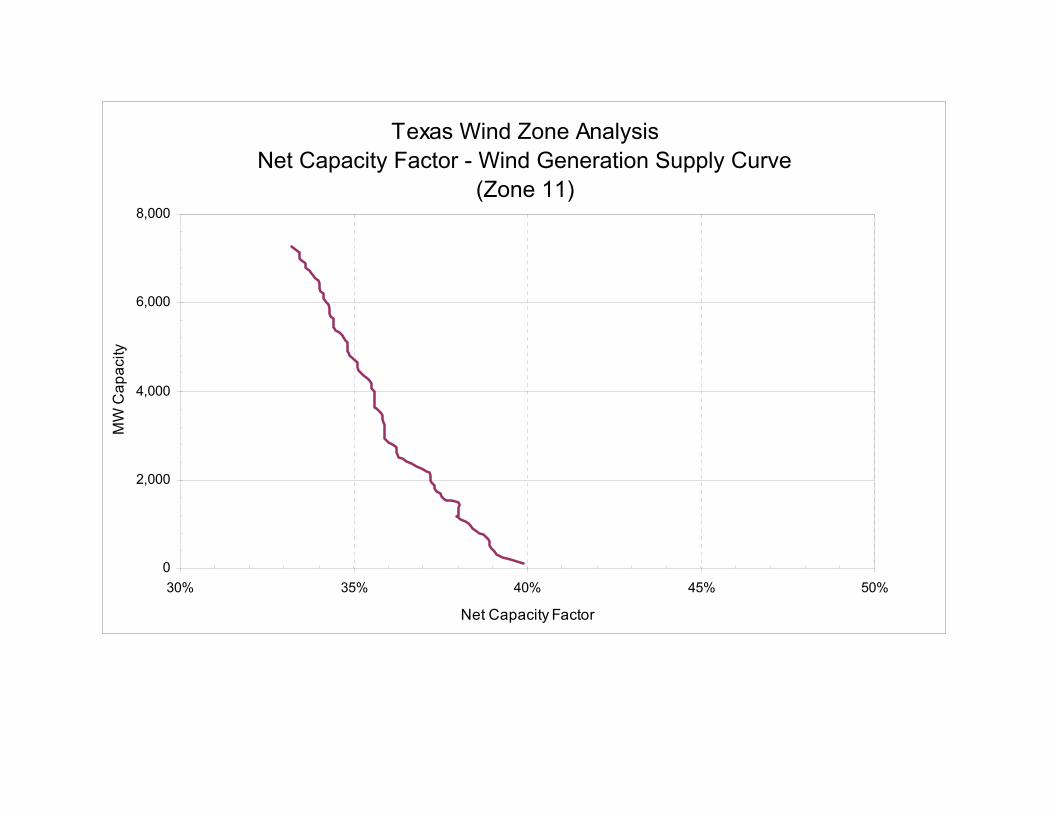
Texas Wind Zone AnalysisNet Capacity Factor - Wind Generation Supply Curve
(Zone 11)
0
2,000
4,000
6,000
8,000
30% 35% 40% 45% 50%
Net Capacity Factor
MW
Cap
acity
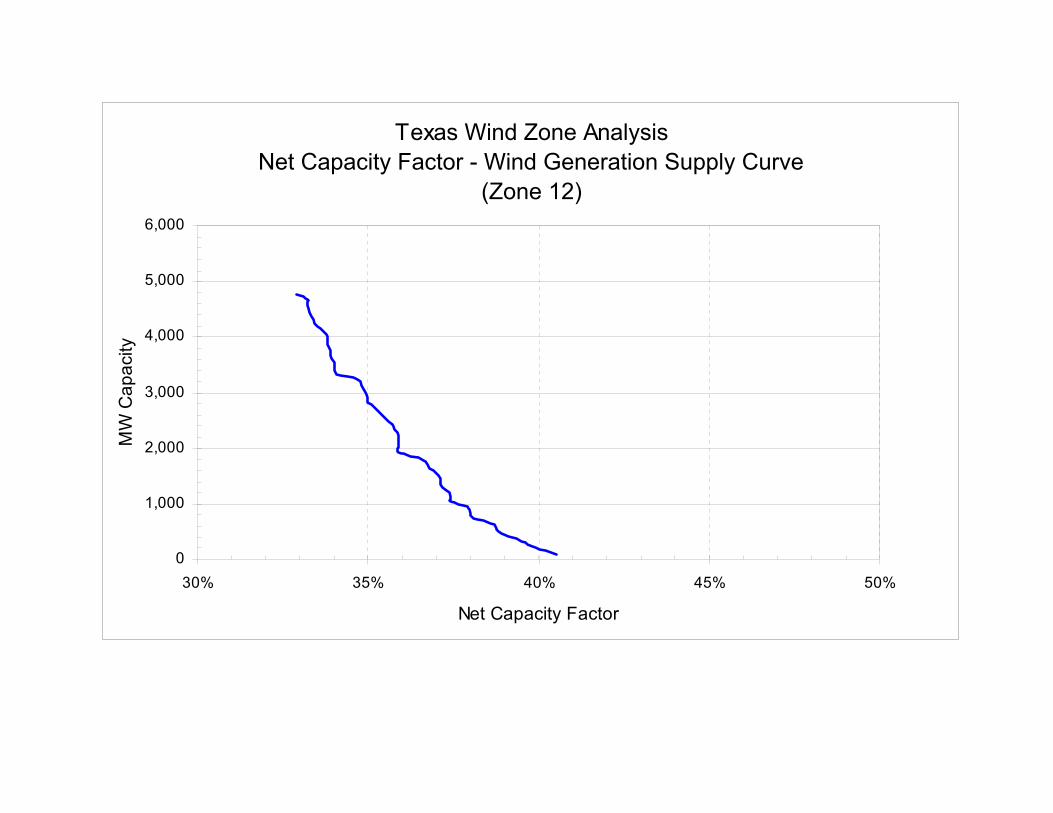
Texas Wind Zone AnalysisNet Capacity Factor - Wind Generation Supply Curve
(Zone 12)
0
1,000
2,000
3,000
4,000
5,000
6,000
30% 35% 40% 45% 50%
Net Capacity Factor
MW
Cap
acity
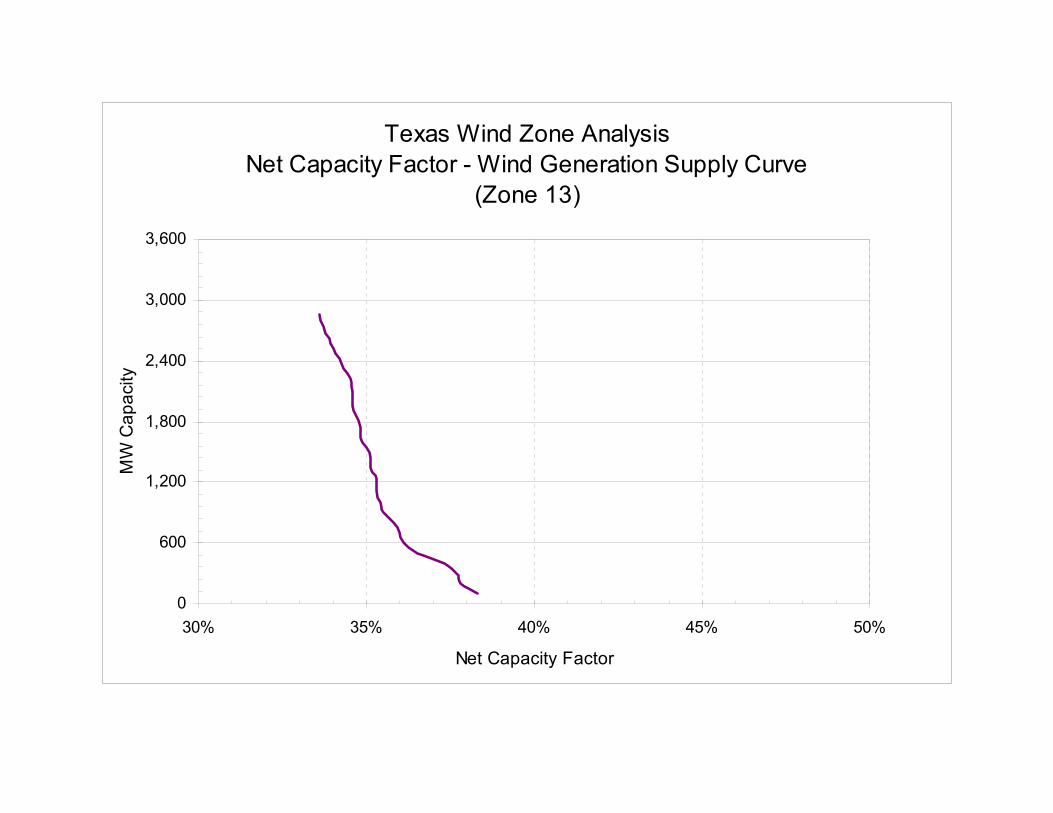
Texas Wind Zone AnalysisNet Capacity Factor - Wind Generation Supply Curve
(Zone 13)
0
600
1,200
1,800
2,400
3,000
3,600
30% 35% 40% 45% 50%
Net Capacity Factor
MW
Cap
acity
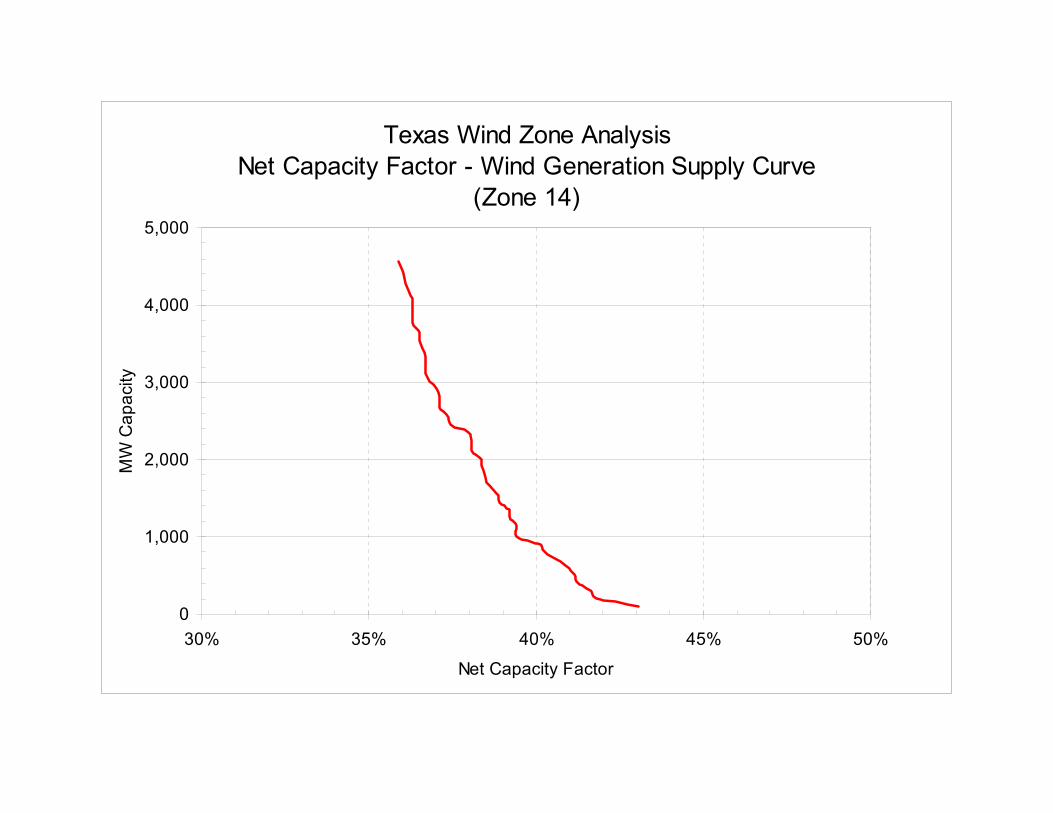
Texas Wind Zone AnalysisNet Capacity Factor - Wind Generation Supply Curve
(Zone 14)
0
1,000
2,000
3,000
4,000
5,000
30% 35% 40% 45% 50%
Net Capacity Factor
MW
Cap
acity
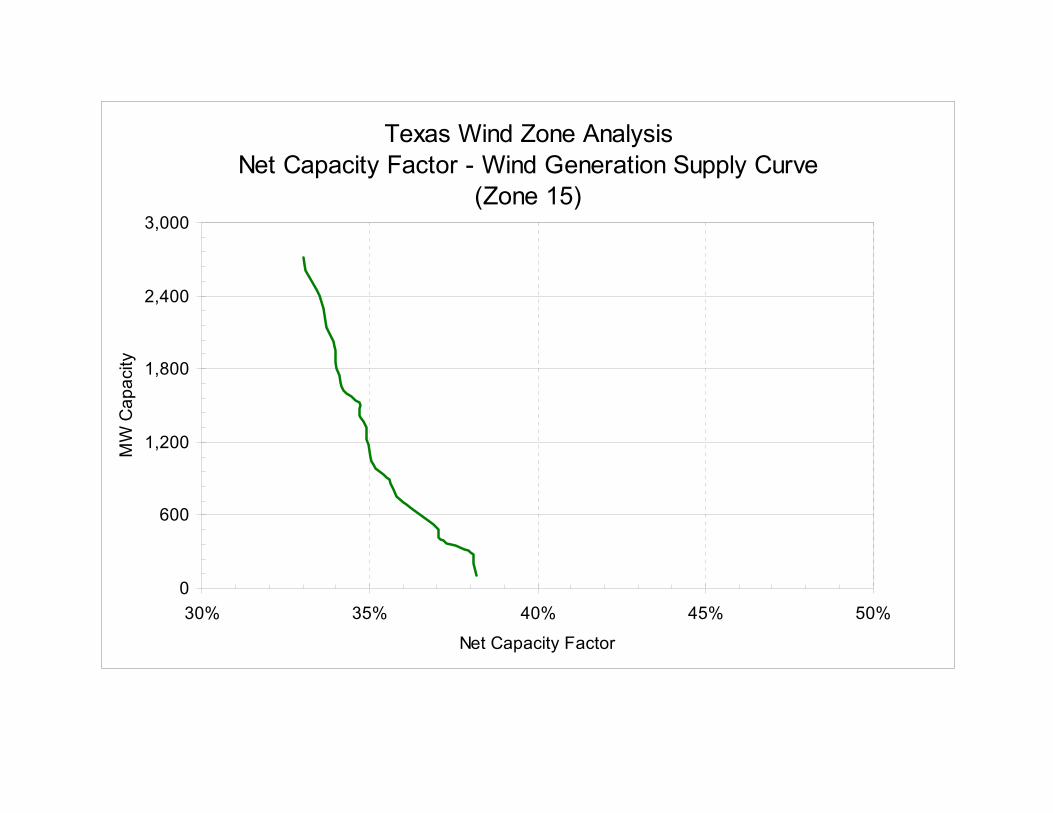
Texas Wind Zone AnalysisNet Capacity Factor - Wind Generation Supply Curve
(Zone 15)
0
600
1,200
1,800
2,400
3,000
30% 35% 40% 45% 50%
Net Capacity Factor
MW
Cap
acity

Texas Wind Zone AnalysisNet Capacity Factor - Wind Generation Supply Curve
(Zone 16)
0
75
150
225
300
375
30% 35% 40% 45% 50%
Net Capacity Factor
MW
Cap
acity
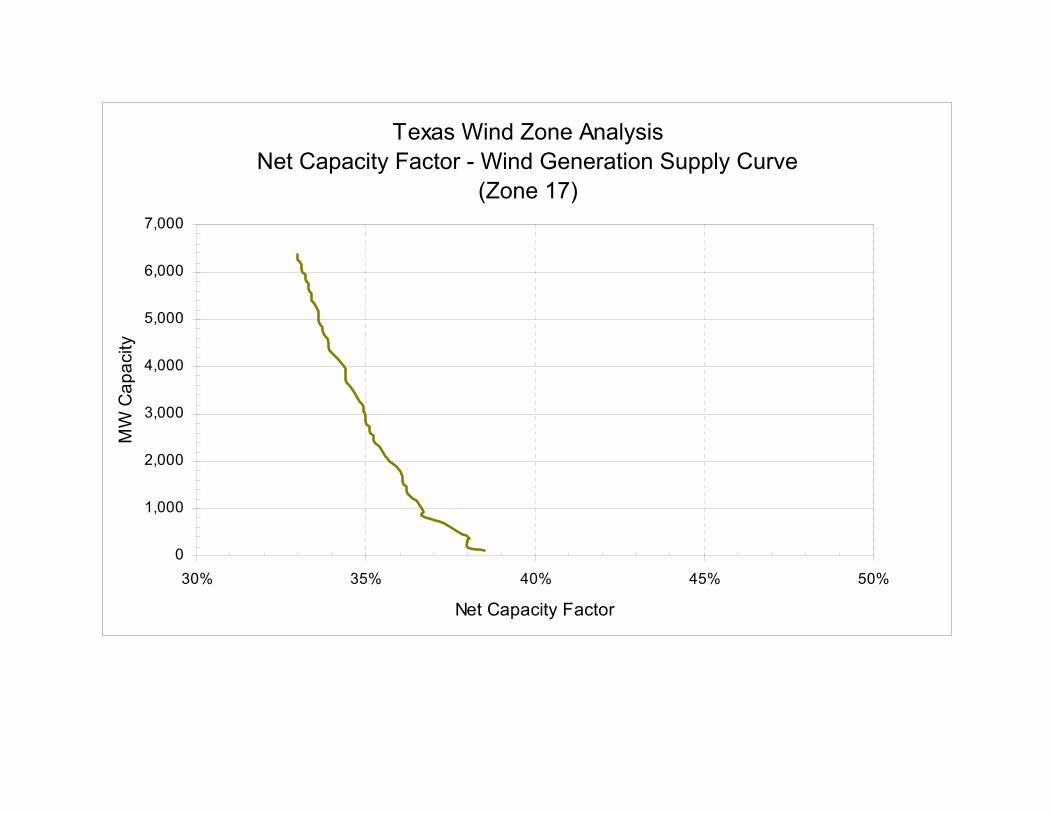
Texas Wind Zone AnalysisNet Capacity Factor - Wind Generation Supply Curve
(Zone 17)
0
1,000
2,000
3,000
4,000
5,000
6,000
7,000
30% 35% 40% 45% 50%
Net Capacity Factor
MW
Cap
acity
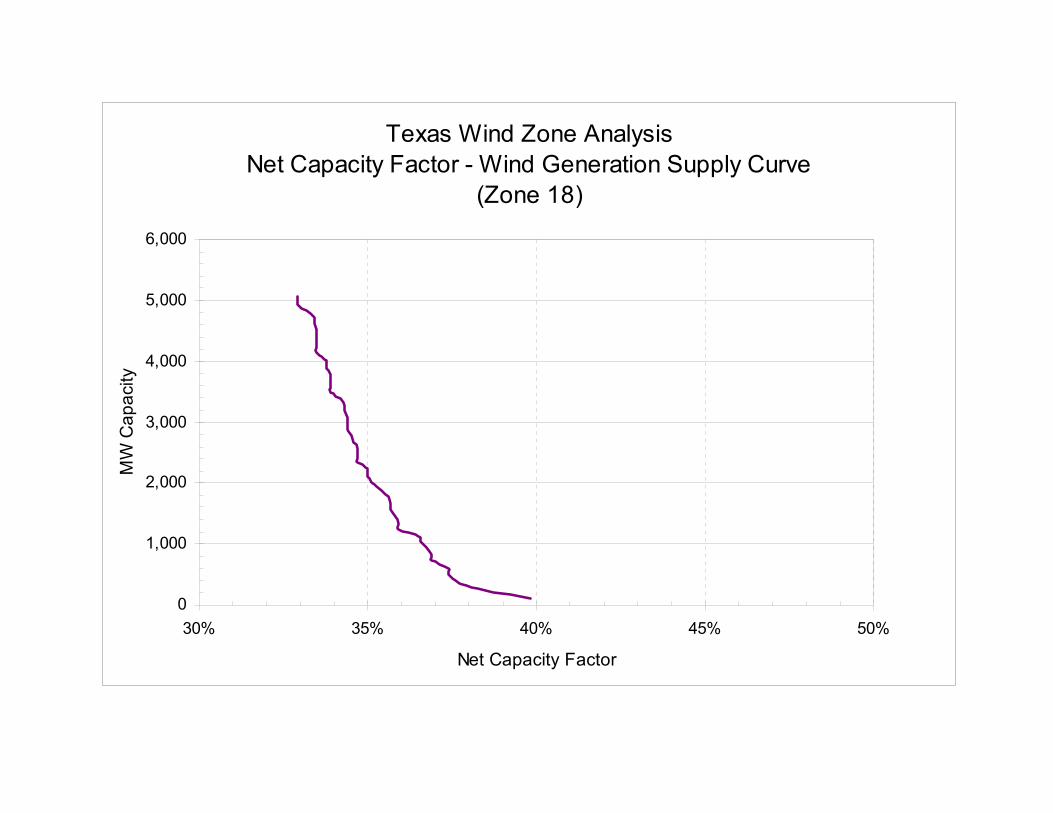
Texas Wind Zone AnalysisNet Capacity Factor - Wind Generation Supply Curve
(Zone 18)
0
1,000
2,000
3,000
4,000
5,000
6,000
30% 35% 40% 45% 50%
Net Capacity Factor
MW
Cap
acity
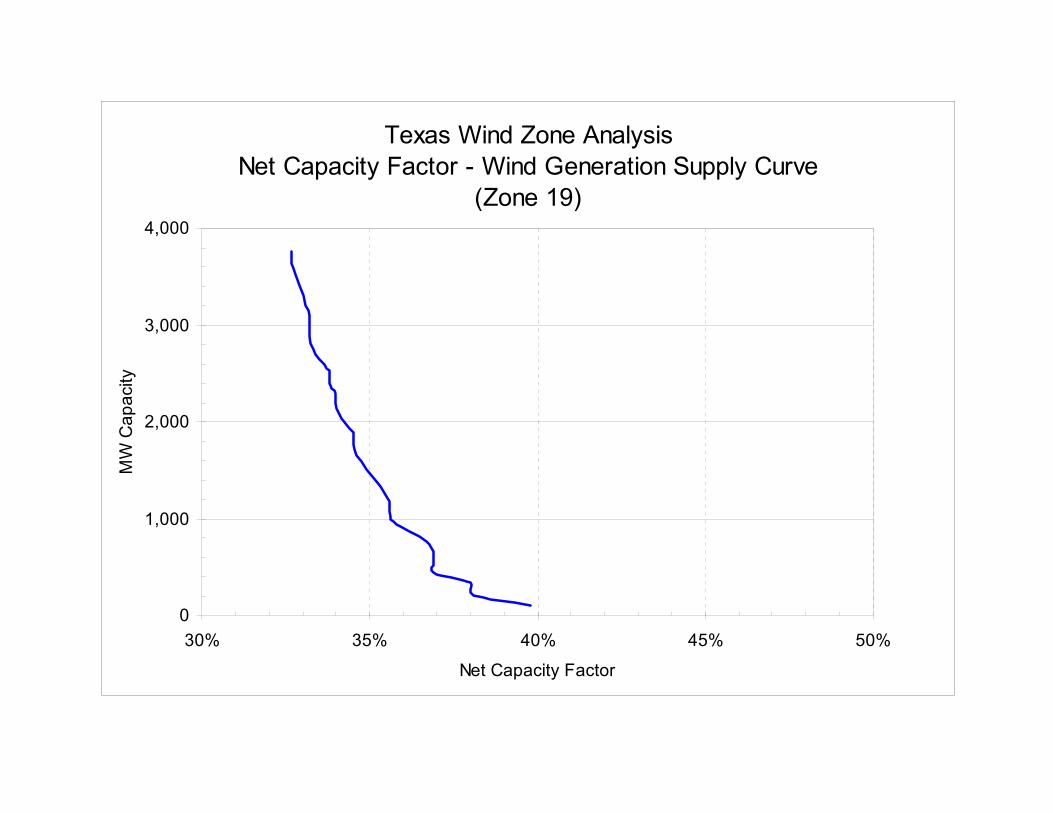
Texas Wind Zone AnalysisNet Capacity Factor - Wind Generation Supply Curve
(Zone 19)
0
1,000
2,000
3,000
4,000
30% 35% 40% 45% 50%
Net Capacity Factor
MW
Cap
acity

Texas Wind Zone AnalysisNet Capacity Factor - Wind Generation Supply Curve
(Zone 20)
0
600
1,200
1,800
2,400
30% 35% 40% 45% 50%
Net Capacity Factor
MW
Cap
acity
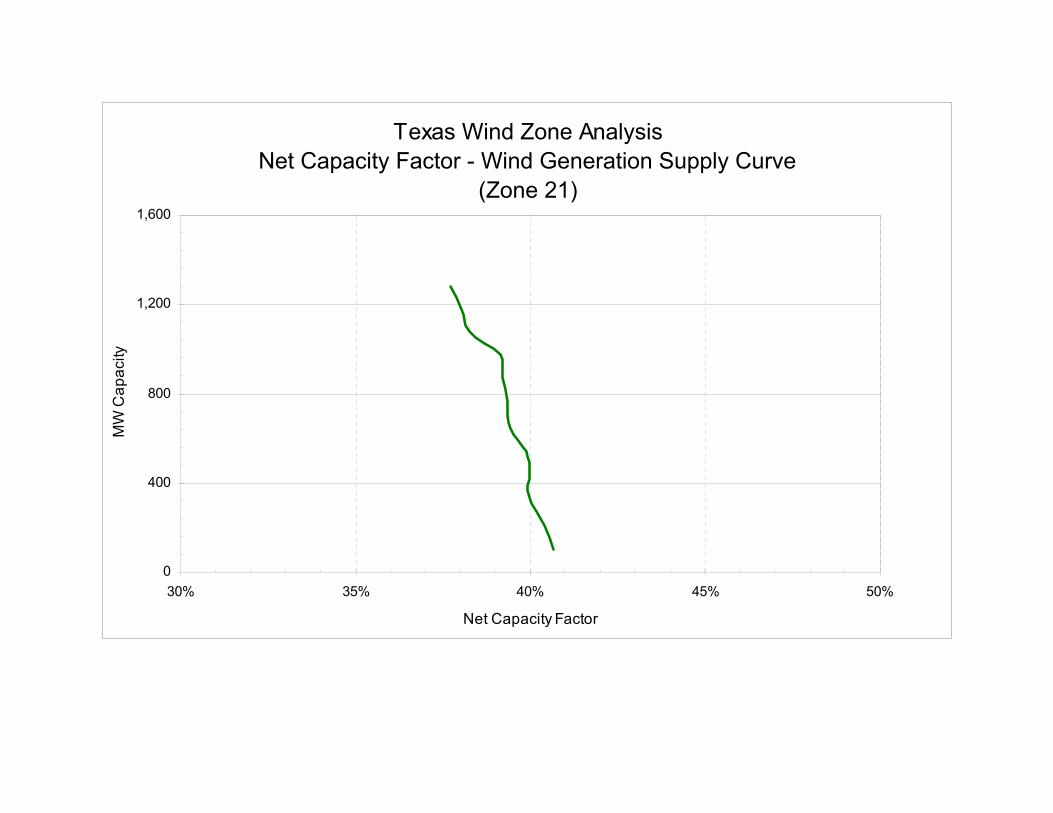
Texas Wind Zone AnalysisNet Capacity Factor - Wind Generation Supply Curve
(Zone 21)
0
400
800
1,200
1,600
30% 35% 40% 45% 50%
Net Capacity Factor
MW
Cap
acity
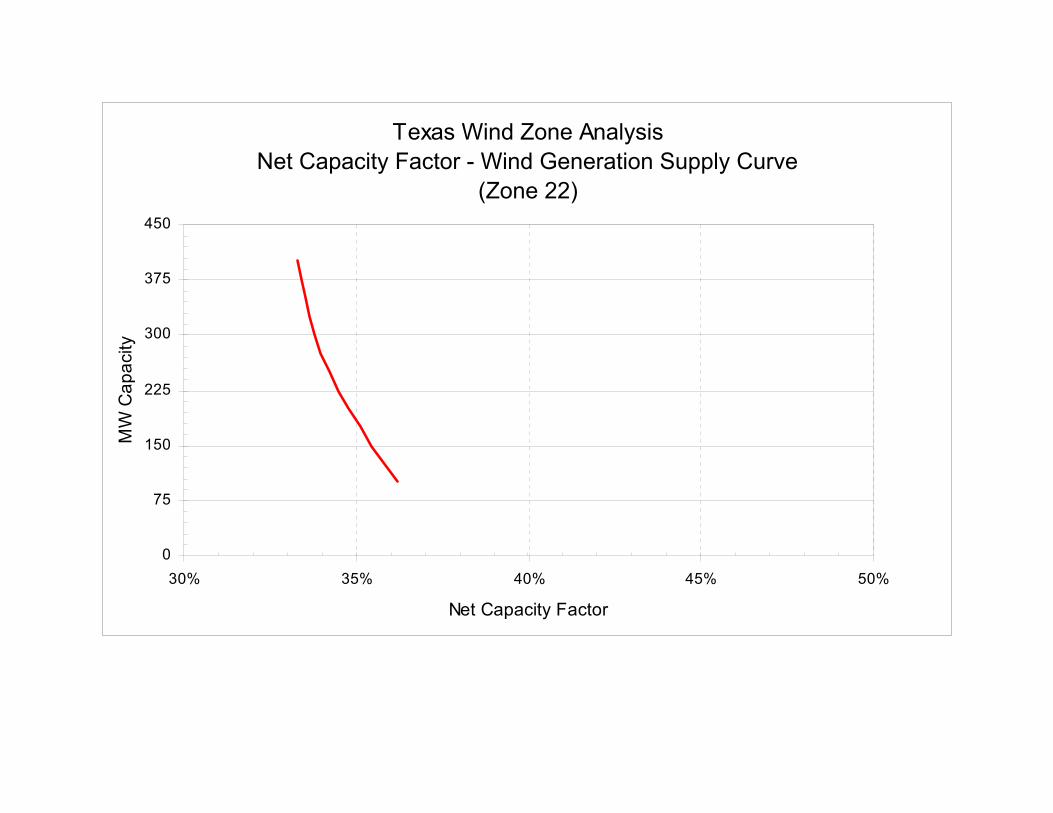
Texas Wind Zone AnalysisNet Capacity Factor - Wind Generation Supply Curve
(Zone 22)
0
75
150
225
300
375
450
30% 35% 40% 45% 50%
Net Capacity Factor
MW
Cap
acity
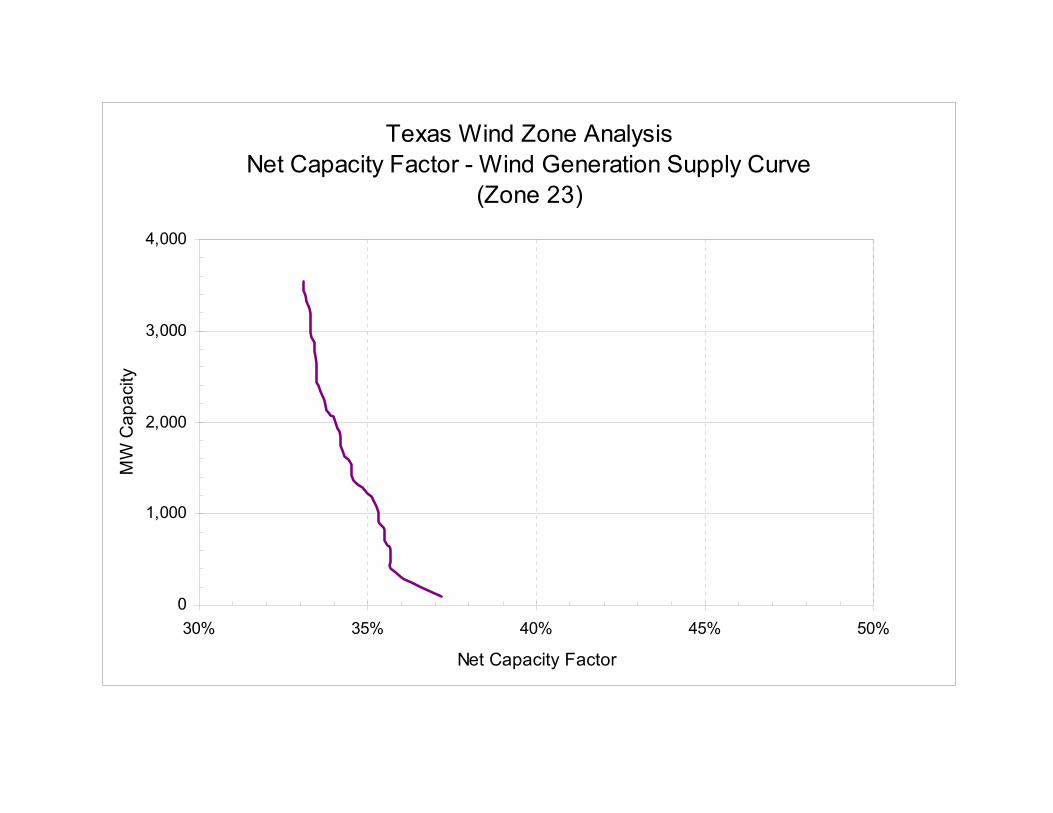
Texas Wind Zone AnalysisNet Capacity Factor - Wind Generation Supply Curve
(Zone 23)
0
1,000
2,000
3,000
4,000
30% 35% 40% 45% 50%
Net Capacity Factor
MW
Cap
acity
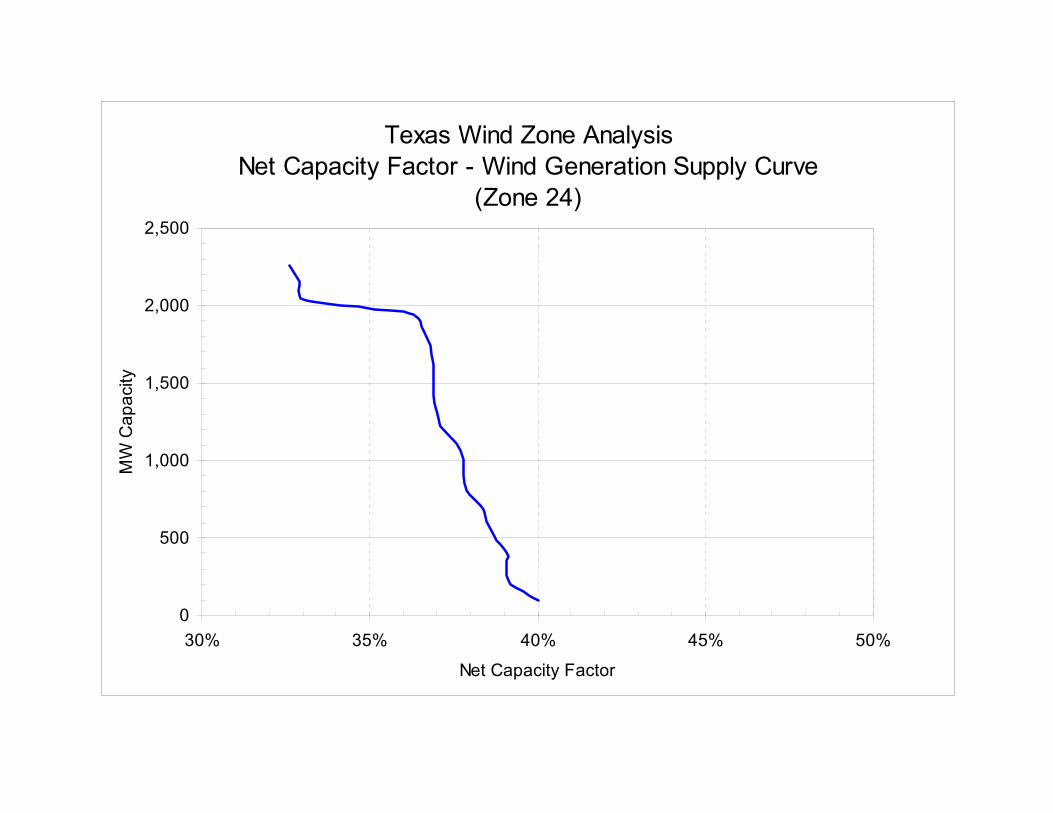
Texas Wind Zone AnalysisNet Capacity Factor - Wind Generation Supply Curve
(Zone 24)
0
500
1,000
1,500
2,000
2,500
30% 35% 40% 45% 50%
Net Capacity Factor
MW
Cap
acity
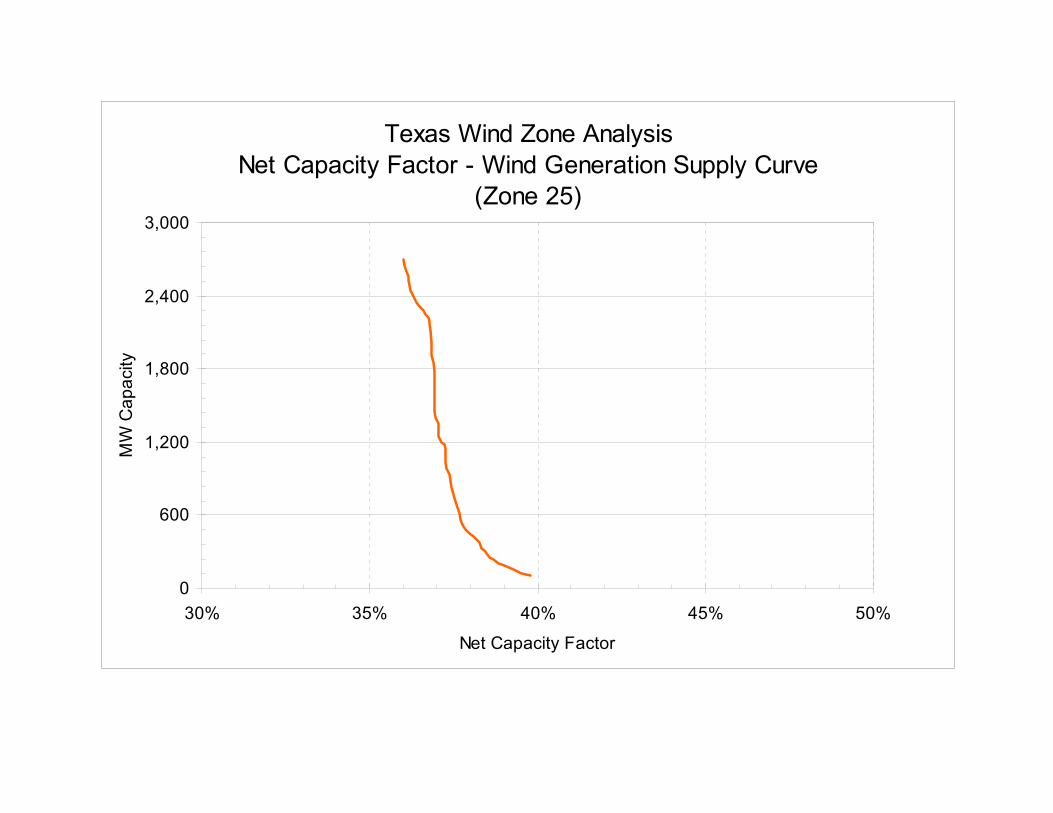
Texas Wind Zone AnalysisNet Capacity Factor - Wind Generation Supply Curve
(Zone 25)
0
600
1,200
1,800
2,400
3,000
30% 35% 40% 45% 50%
Net Capacity Factor
MW
Cap
acity
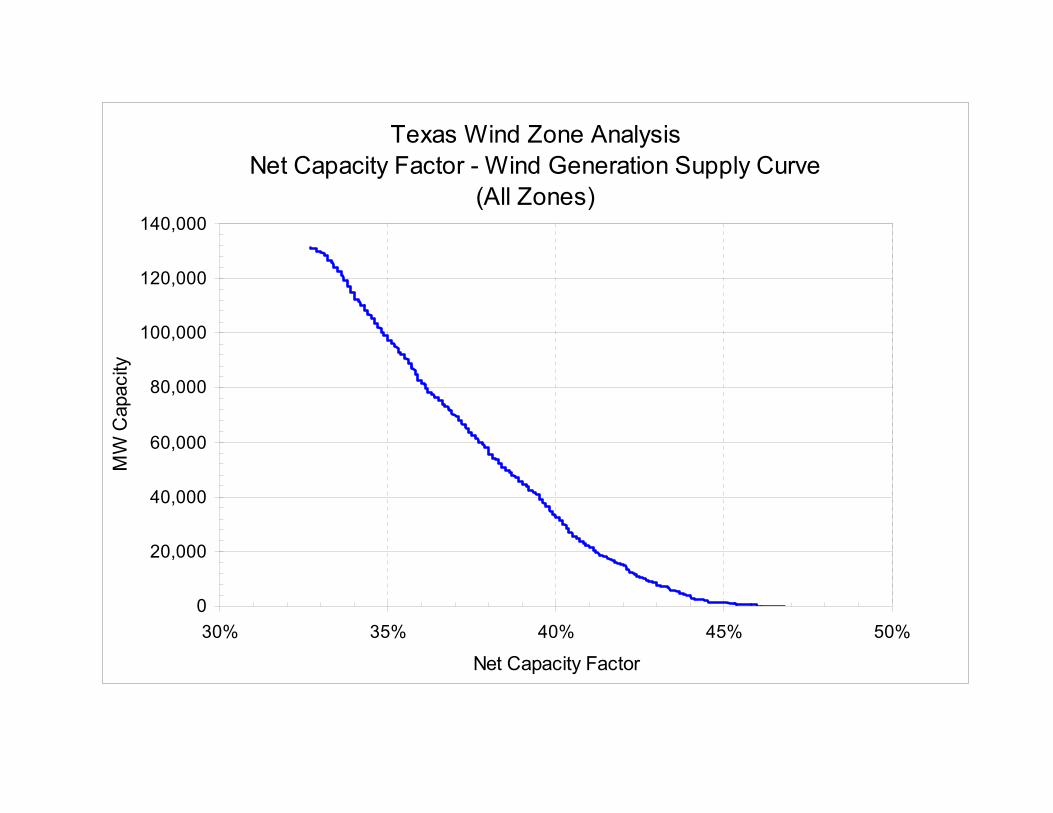
Texas Wind Zone AnalysisNet Capacity Factor - Wind Generation Supply Curve
(All Zones)
0
20,000
40,000
60,000
80,000
100,000
120,000
140,000
30% 35% 40% 45% 50%
Net Capacity Factor
MW
Cap
acity

APPENDIX B
List of Common Transmission Projects

The following common projects were included in many of the scenarios of this study:
1. Build a 345-kV ring-bus at the Long Creek substation to tie in both existing lines.
2. Build a new substation and 345-kV ring-bus near Paint Creek where the Mulberry Creek - Oklaunion and Morgan Creek – Graham lines cross. This project has been shown to be economically cost-justified in the Five-Year Plan.
3. Build a new 345-kV Oklaunion – Bowman line on separate right-of-way from the existing Oklaunion – Fisher Road – Bowman 345-kV line. This project also has been shown to be economically cost-justified in the Five-Year Plan.
4. Build a 345-kV ring-bus at Bittercreek substation to tie in both existing lines.
5. Upgrade the existing 345-kV Bluff Creek – Mulberry Creek line.
6. Build a new 345-kV Willow Creek – Eagle Mt line. The transmission owner has confirmed that the Willow Creek substation is arranged for additional lines, but that the Eagle Mountain endpoint may not have sufficient room for the necessary additional equipment. One possible alternative would be to build a new substation slightly east of Eagle Mountain in the existing right-of-way. Eagle Mountain is a good site for an additional 345-kV connection into the Fort Worth area because a significant amount of 138-kV infrastructure exists to distribute the output of the now inactive Eagle Mountain power plant.
7. Install a second 345/138-kV autotransformer at Eagle Mountain. The transmission owner has confirmed that the switching substation is big enough to accommodate an additional autotransformer.
8. Upgrade the existing 345-kV Willow Creek – Jacksboro line.
9. Build a new 138-kV line from Forsan tap or McDonald Rd to Cedar Hill.
10. Upgrade the existing 138-kV Cedar Hill – Oak Creek line.
11. Install a Special Protection Scheme to open the 69-kV Fort Stockton – Barrilla line if the 138-kV Fort Stockton – Barrilla line goes out of service.
12. Open the 69-kV switch at Camp Wood
13. Establish a methodology to protect the Bluff Creek autotransformers, such as a Special Protection Scheme to disconnect a nearby windfarm whenever one of the autotransformers goes out of service.
14. Evaluate the current operations of the 138-kV Sonora – Corinthian line. The phase-shifting transformer in service at Hamilton may already by sufficient to mitigate the effects of contingencies noted in the planning models, but its effectiveness and impact on production costs to relieve system congestion require further detailed study.
15. Upgrade the rate A of many 69-kV lines from their current thermal rating (often less than 20 MVA) to their rate B.

APPENDIX C
Economic Modeling Results

Table C1(A): Modeling Results for Transmission Solutions for Coastal Texas (Zone 24)
Transmission Option
New CREZ Installed
Wind Capacity
(MW)
New CREZ Wind
Energy Curtailed
(%)
New CREZ Wind
Capacity Factor (%)
Total Wind Energy
Curtailed (%)
Total Wind Capacity
Factor (%)
New CREZ Wind
Generation (GWh)
Total Wind Generation
(GWh)
800 0.00 38.44 2.56 38.71 2,694 19,174
1,000 0.00 38.27 2.47 38.67 3,353 19,835
1,200 0.05 38.01 2.39 38.61 3,996 20,479 Level 1
1,400 0.20 37.74 2.35 38.53 4,629 21,114
1,800 0.00 37.54 2.18 38.43 5,920 22,405
2,000 0.05 37.05 2.12 38.27 6,491 22,980 Level 2
2,200 0.29 37.14 2.14 38.26 7,157 23,645
2,600 0.09 37.41 1.99 38.29 8,520 25,003
2,800 0.45 37.29 2.08 38.22 9,147 25,627
3,000 1.26 37.00 2.33 38.08 9,724 26,206 Level 3
3,200 2.46 36.51 2.77 37.86 10,234 26,713
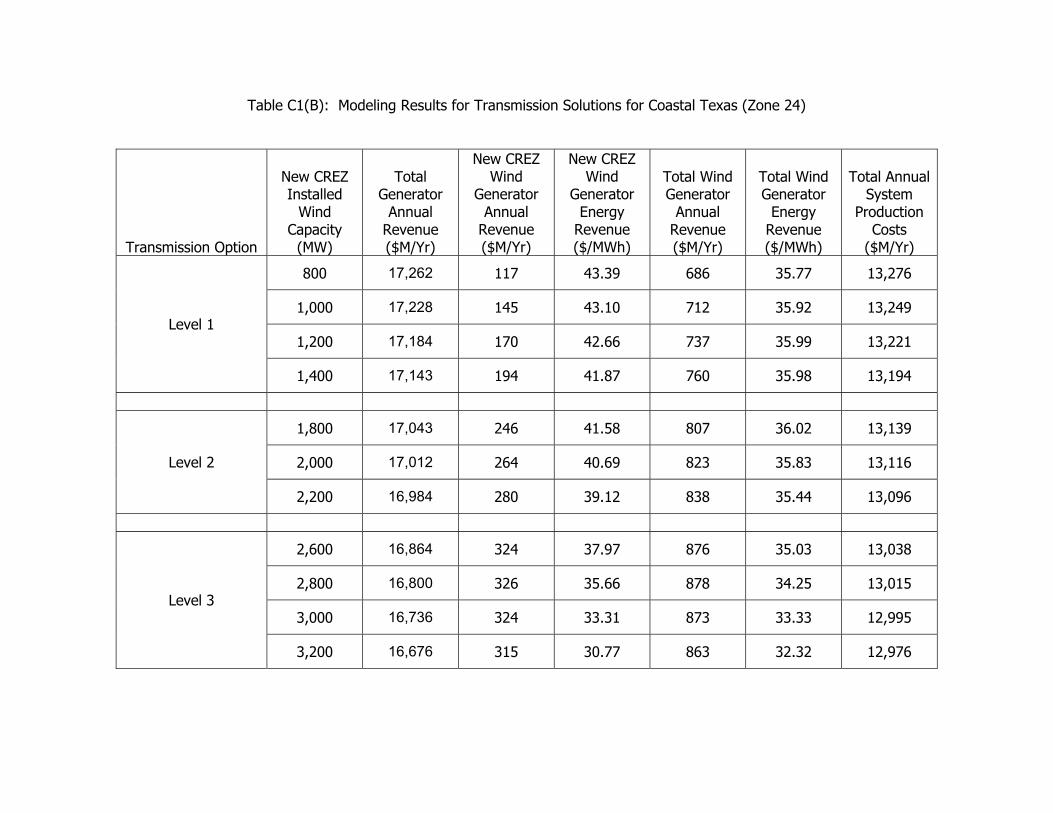
Table C1(B): Modeling Results for Transmission Solutions for Coastal Texas (Zone 24)
Transmission Option
New CREZ Installed
Wind Capacity
(MW)
Total Generator
Annual Revenue ($M/Yr)
New CREZ Wind
Generator Annual
Revenue ($M/Yr)
New CREZ Wind
Generator Energy
Revenue ($/MWh)
Total Wind Generator
Annual Revenue ($M/Yr)
Total Wind Generator
Energy Revenue ($/MWh)
Total Annual System
Production Costs
($M/Yr)
800 17,262 117 43.39 686 35.77 13,276
1,000 17,228 145 43.10 712 35.92 13,249
1,200 17,184 170 42.66 737 35.99 13,221 Level 1
1,400 17,143 194 41.87 760 35.98 13,194
1,800 17,043 246 41.58 807 36.02 13,139
2,000 17,012 264 40.69 823 35.83 13,116 Level 2
2,200 16,984 280 39.12 838 35.44 13,096
2,600 16,864 324 37.97 876 35.03 13,038
2,800 16,800 326 35.66 878 34.25 13,015
3,000 16,736 324 33.31 873 33.33 12,995 Level 3
3,200 16,676 315 30.77 863 32.32 12,976
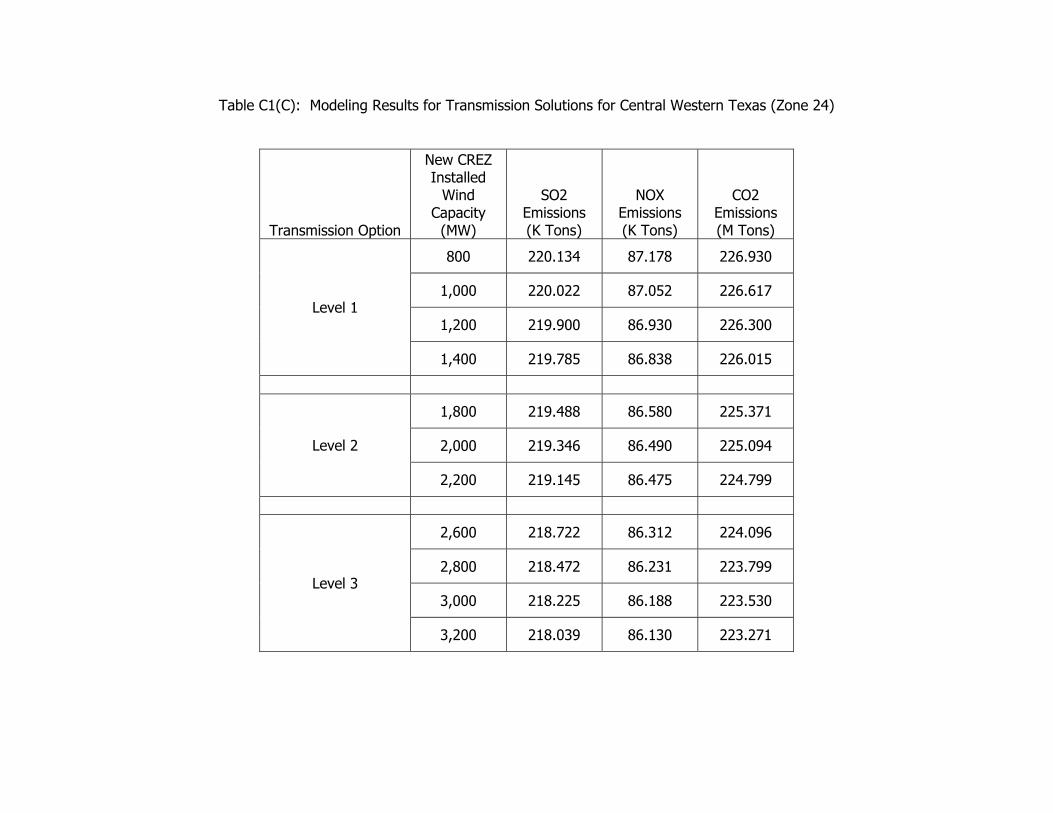
Table C1(C): Modeling Results for Transmission Solutions for Central Western Texas (Zone 24)
Transmission Option
New CREZ Installed
Wind Capacity
(MW)
SO2 Emissions (K Tons)
NOX Emissions (K Tons)
CO2 Emissions (M Tons)
800 220.134 87.178 226.930
1,000 220.022 87.052 226.617
1,200 219.900 86.930 226.300 Level 1
1,400 219.785 86.838 226.015
1,800 219.488 86.580 225.371
2,000 219.346 86.490 225.094 Level 2
2,200 219.145 86.475 224.799
2,600 218.722 86.312 224.096
2,800 218.472 86.231 223.799
3,000 218.225 86.188 223.530 Level 3
3,200 218.039 86.130 223.271

Table C2(A): Modeling Results for Transmission Solutions for Central Western Texas
Transmission Option
New CREZ Installed
Wind Capacity
(MW)
New CREZ Wind
Energy Curtailed
(%)
New CREZ Wind
Capacity Factor (%)
Total Wind Energy
Curtailed (%)
Total Wind Capacity
Factor (%)
New CREZ Wind
Generation (GWh)
Total Wind Generation
(GWh)
1,800 0.0 40.09 1.5 39.35 6,322 22,945
2,000 0.0 40.05 2.1 39.12 7,017 23,492 Red Creek to Hill
Country
2,200 0.0 40.03 2.8 38.85 7,715 24,014
1,400 0.0 39.74 1.3 39.35 4,874 21,567
1,800 0.2 39.49 2.1 38.98 6,227 22,728 Paint Creek to Fort
Worth
2,000 0.8 39.11 2.6 38.73 6,852 23,262
1,000 0.0 39.78 0.4 39.73 3,485 20,379
1,400 0.0 39.99 1.5 39.36 4,905 21,569 Bluff Creek to
Bosque
1,600 0.0 40.06 2.3 39.06 5,615 22,087
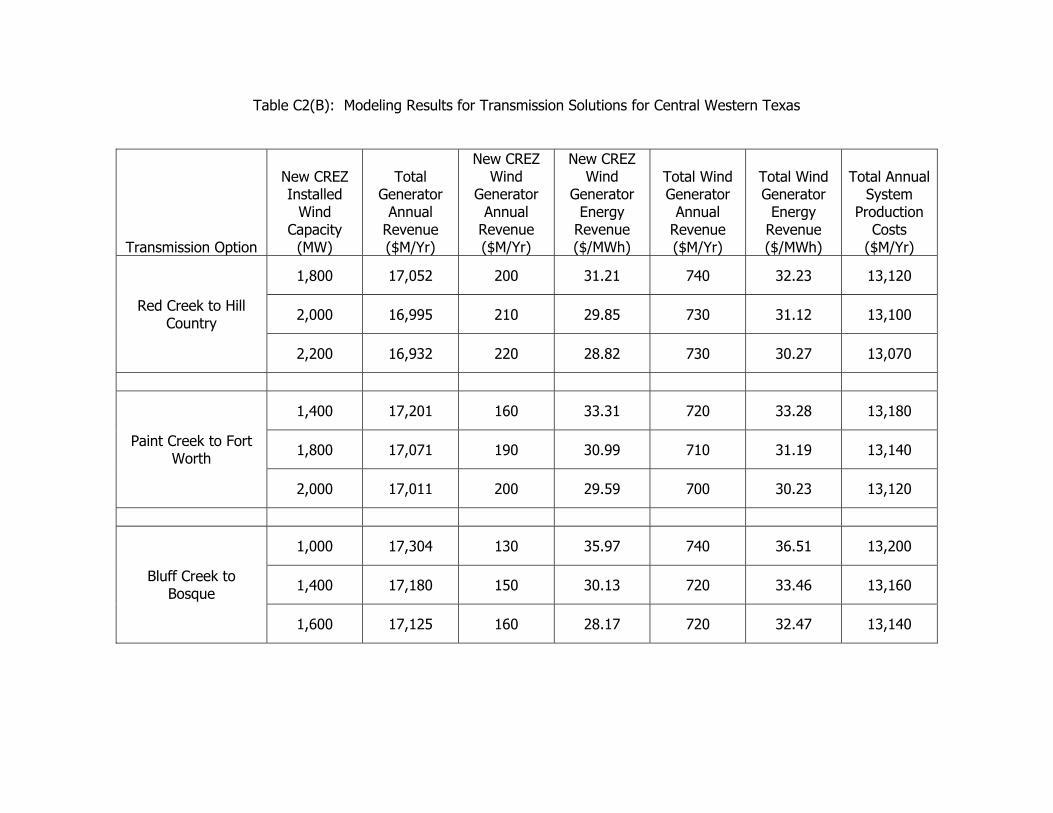
Table C2(B): Modeling Results for Transmission Solutions for Central Western Texas
Transmission Option
New CREZ Installed
Wind Capacity
(MW)
Total Generator
Annual Revenue ($M/Yr)
New CREZ Wind
Generator Annual
Revenue ($M/Yr)
New CREZ Wind
Generator Energy
Revenue ($/MWh)
Total Wind Generator
Annual Revenue ($M/Yr)
Total Wind Generator
Energy Revenue ($/MWh)
Total Annual System
Production Costs
($M/Yr)
1,800 17,052 200 31.21 740 32.23 13,120
2,000 16,995 210 29.85 730 31.12 13,100 Red Creek to Hill
Country
2,200 16,932 220 28.82 730 30.27 13,070
1,400 17,201 160 33.31 720 33.28 13,180
1,800 17,071 190 30.99 710 31.19 13,140 Paint Creek to Fort
Worth
2,000 17,011 200 29.59 700 30.23 13,120
1,000 17,304 130 35.97 740 36.51 13,200
1,400 17,180 150 30.13 720 33.46 13,160 Bluff Creek to
Bosque
1,600 17,125 160 28.17 720 32.47 13,140
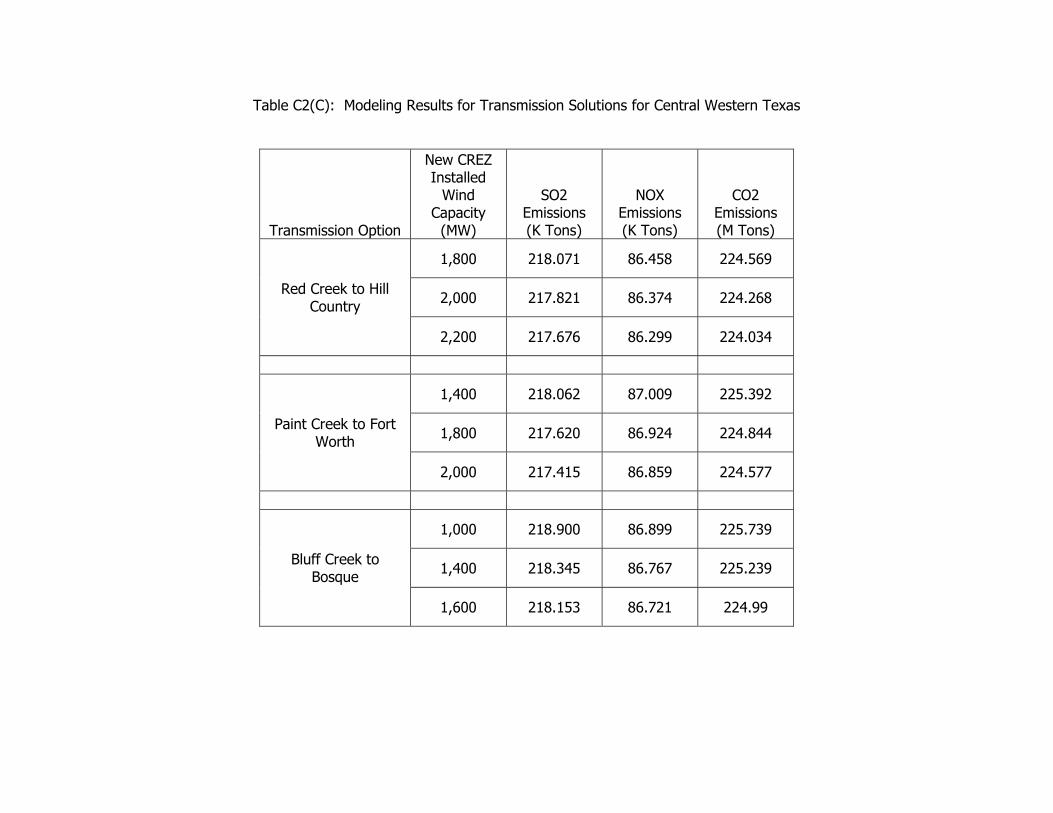
Table C2(C): Modeling Results for Transmission Solutions for Central Western Texas
Transmission Option
New CREZ Installed
Wind Capacity
(MW)
SO2 Emissions (K Tons)
NOX Emissions (K Tons)
CO2 Emissions (M Tons)
1,800 218.071 86.458 224.569
2,000 217.821 86.374 224.268 Red Creek to Hill
Country
2,200 217.676 86.299 224.034
1,400 218.062 87.009 225.392
1,800 217.620 86.924 224.844 Paint Creek to Fort
Worth
2,000 217.415 86.859 224.577
1,000 218.900 86.899 225.739
1,400 218.345 86.767 225.239 Bluff Creek to
Bosque
1,600 218.153 86.721 224.99
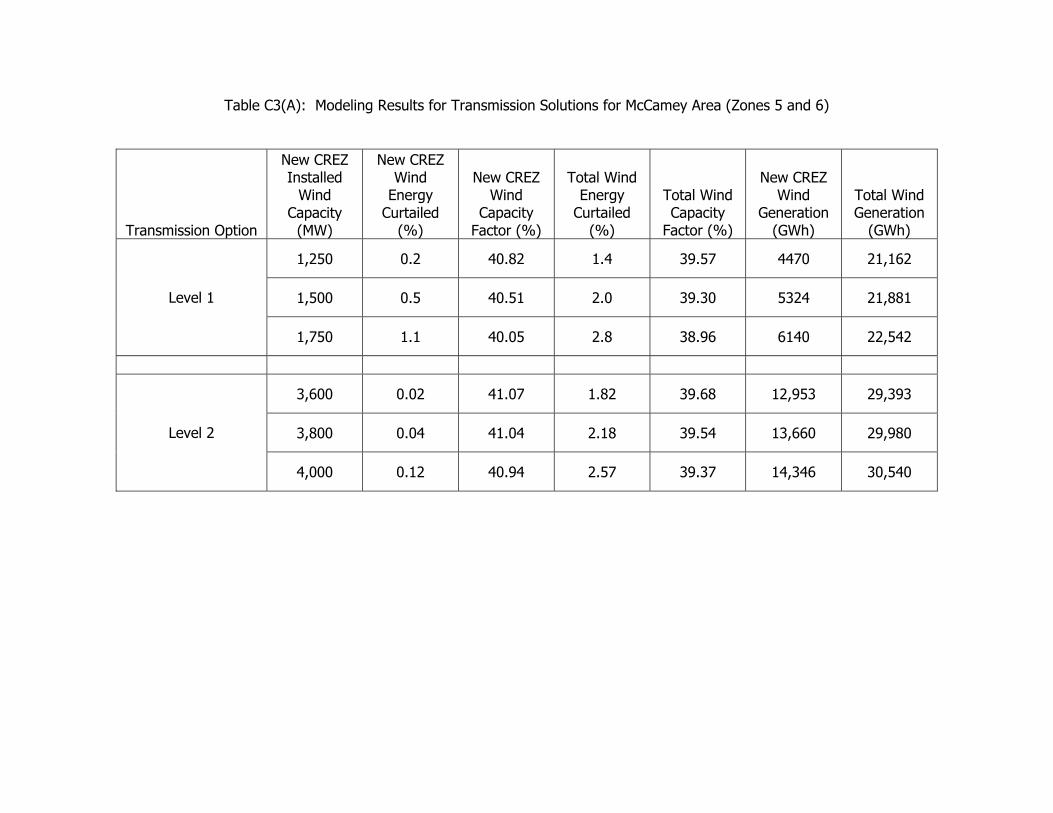
Table C3(A): Modeling Results for Transmission Solutions for McCamey Area (Zones 5 and 6)
Transmission Option
New CREZ Installed
Wind Capacity
(MW)
New CREZ Wind
Energy Curtailed
(%)
New CREZ Wind
Capacity Factor (%)
Total Wind Energy
Curtailed (%)
Total Wind Capacity
Factor (%)
New CREZ Wind
Generation (GWh)
Total Wind Generation
(GWh)
1,250 0.2 40.82 1.4 39.57 4470 21,162
1,500 0.5 40.51 2.0 39.30 5324 21,881 Level 1
1,750 1.1 40.05 2.8 38.96 6140 22,542
3,600 0.02 41.07 1.82 39.68 12,953 29,393
3,800 0.04 41.04 2.18 39.54 13,660 29,980 Level 2
4,000 0.12 40.94 2.57 39.37 14,346 30,540
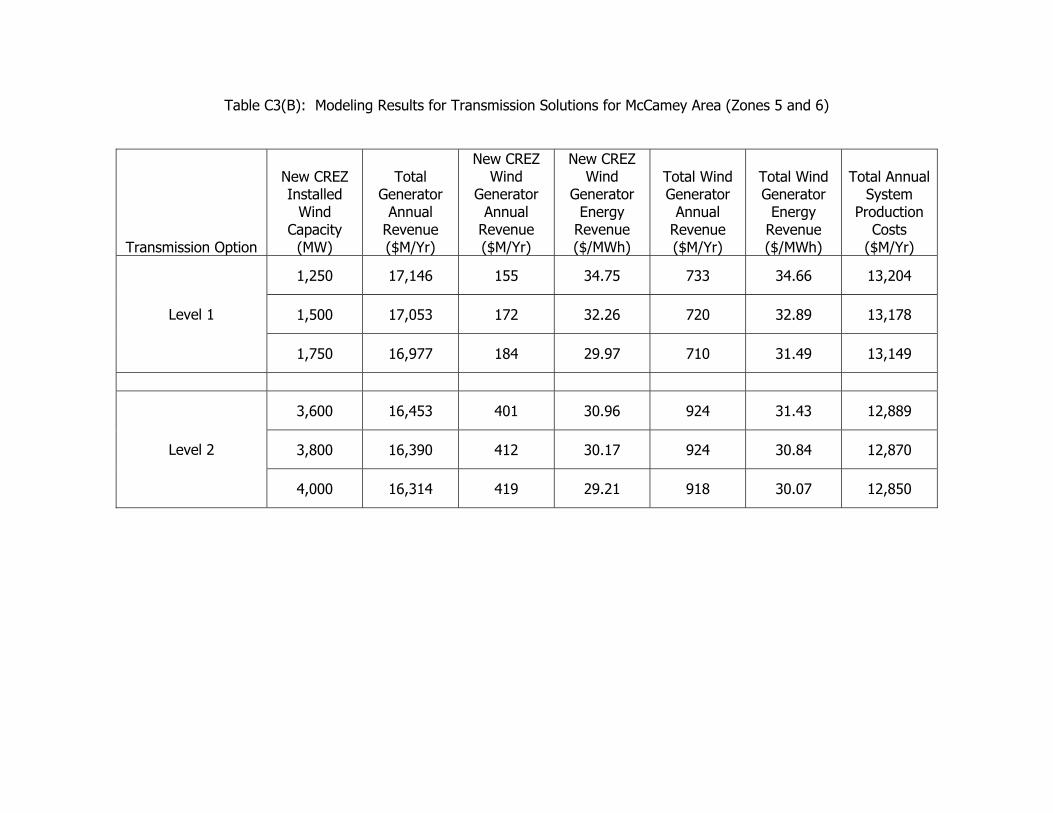
Table C3(B): Modeling Results for Transmission Solutions for McCamey Area (Zones 5 and 6)
Transmission Option
New CREZ Installed
Wind Capacity
(MW)
Total Generator
Annual Revenue ($M/Yr)
New CREZ Wind
Generator Annual
Revenue ($M/Yr)
New CREZ Wind
Generator Energy
Revenue ($/MWh)
Total Wind Generator
Annual Revenue ($M/Yr)
Total Wind Generator
Energy Revenue ($/MWh)
Total Annual System
Production Costs
($M/Yr)
1,250 17,146 155 34.75 733 34.66 13,204
1,500 17,053 172 32.26 720 32.89 13,178 Level 1
1,750 16,977 184 29.97 710 31.49 13,149
3,600 16,453 401 30.96 924 31.43 12,889
3,800 16,390 412 30.17 924 30.84 12,870 Level 2
4,000 16,314 419 29.21 918 30.07 12,850
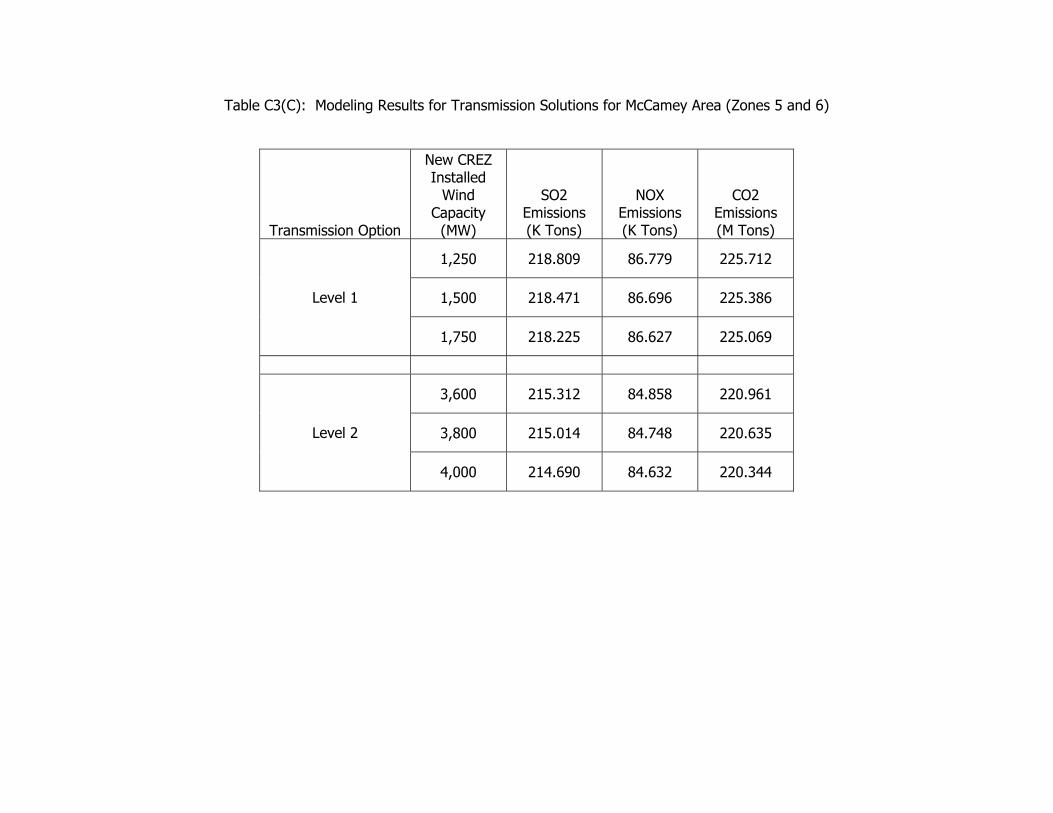
Table C3(C): Modeling Results for Transmission Solutions for McCamey Area (Zones 5 and 6)
Transmission Option
New CREZ Installed
Wind Capacity
(MW)
SO2 Emissions (K Tons)
NOX Emissions (K Tons)
CO2 Emissions (M Tons)
1,250 218.809 86.779 225.712
1,500 218.471 86.696 225.386 Level 1
1,750 218.225 86.627 225.069
3,600 215.312 84.858 220.961
3,800 215.014 84.748 220.635 Level 2
4,000 214.690 84.632 220.344

Table C4(A): Modeling Results for Transmission Solutions for Culberson County (Zone 7)
Transmission Option
New CREZ Installed
Wind Capacity
(MW)
New CREZ Wind
Energy Curtailed
(%)
New CREZ Wind
Capacity Factor (%)
Total Wind Energy
Curtailed (%)
Total Wind Capacity
Factor (%)
New CREZ Wind
Generation (GWh)
Total Wind Generation
(GWh)
1,200 0.0 38.79 0.52 39.50 4078 20,953
1,400 0.0 37.88 0.91 39.11 4645 21,433 Level 1
1,600 0.0 37.15 1.40 38.70 5207 21,880
Table C4(B): Modeling Results for Transmission Solutions for Culberson County (Zone 7)
Transmission Option
New CREZ Installed
Wind Capacity
(MW)
Total Generator
Annual Revenue ($M/Yr)
New CREZ Wind
Generator Annual
Revenue ($M/Yr)
New CREZ Wind
Generator Energy
Revenue ($/MWh)
Total Wind Generator
Annual Revenue ($M/Yr)
Total Wind Generator
Energy Revenue ($/MWh)
Total Annual System
Production Costs
($M/Yr)
1,200 17,293 148 36.18 763 36.41 13,177
1,400 17,245 159 34.25 761 35.50 13,158 Level 1
1,600 17,208 168 32.32 759 34.68 13,143
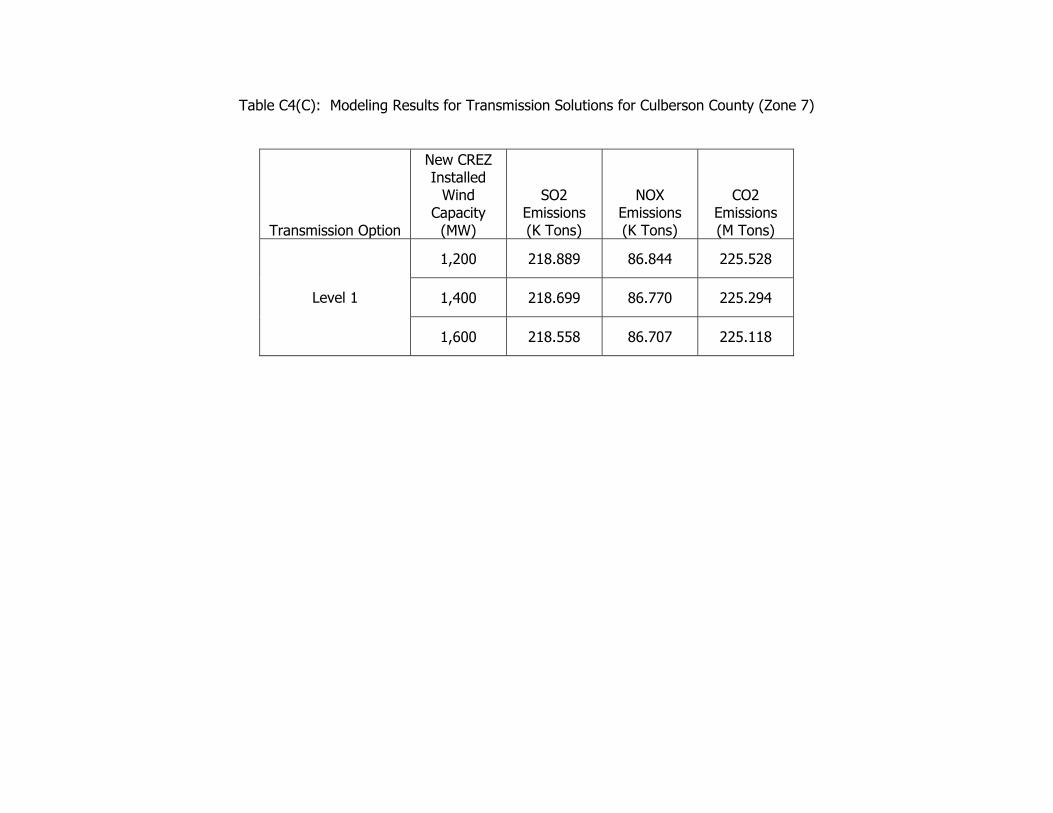
Table C4(C): Modeling Results for Transmission Solutions for Culberson County (Zone 7)
Transmission Option
New CREZ Installed
Wind Capacity
(MW)
SO2 Emissions (K Tons)
NOX Emissions (K Tons)
CO2 Emissions (M Tons)
1,200 218.889 86.844 225.528
1,400 218.699 86.770 225.294 Level 1
1,600 218.558 86.707 225.118

Table C5(A): Modeling Results for Transmission Solutions for the Panhandle Region (Zones 2 and 4)
Transmission Option
New CREZ Installed
Wind Capacity
(MW)
New CREZ Wind
Energy Curtailed
(%)
New CREZ Wind
Capacity Factor (%)
Total Wind Energy
Curtailed (%)
Total Wind Capacity
Factor (%)
New CREZ Wind
Generation (GWh)
Total Wind Generation
(GWh)
600 1.22 43.00 1.88 39.57 2,260 18,910 Level 1
800 2.12 43.24 2.46 39.53 3,030 19,585
1,600 0.14 43.55 1.72 40.14 6,104 22,699
1,800 0.18 43.26 2.04 40.02 6,822 23,332 Level 2
2,000 0.25 43.14 2.55 39.86 7,558 23,935
2,000 0.00 43.2% 1.78 40.2% 7577 24,123
2,400 0.22 42.8% 2.14 40.0% 8998 25,444 Level 3
2,800 1.63 41.9% 2.89 39.7% 10283 26,644
4,400 0.40 42.70 1.60 40.67 16,459 32,973
4,600 0.70 42.50 1.90 40.54 17,124 33,577 Level 4
4,800 1.02 42.27 2.20 40.83 17,774 34,173
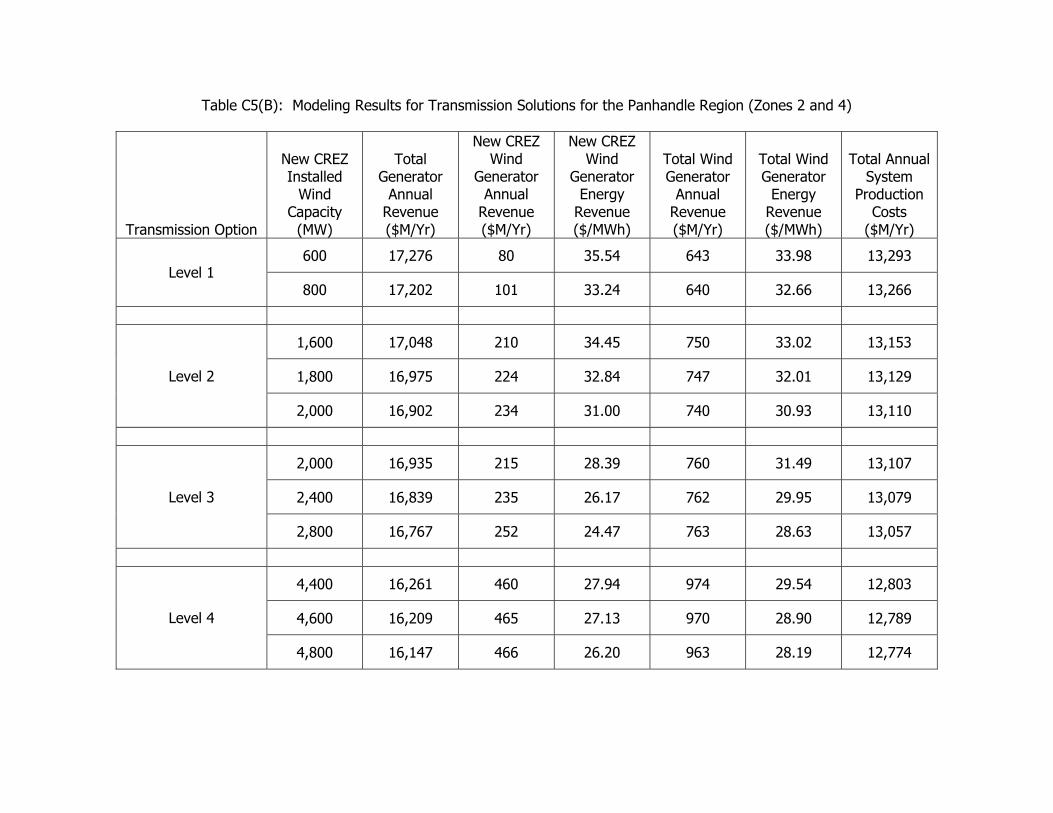
Table C5(B): Modeling Results for Transmission Solutions for the Panhandle Region (Zones 2 and 4)
Transmission Option
New CREZ Installed
Wind Capacity
(MW)
Total Generator
Annual Revenue ($M/Yr)
New CREZ Wind
Generator Annual
Revenue ($M/Yr)
New CREZ Wind
Generator Energy
Revenue ($/MWh)
Total Wind Generator
Annual Revenue ($M/Yr)
Total Wind Generator
Energy Revenue ($/MWh)
Total Annual System
Production Costs
($M/Yr)
600 17,276 80 35.54 643 33.98 13,293 Level 1
800 17,202 101 33.24 640 32.66 13,266
1,600 17,048 210 34.45 750 33.02 13,153
1,800 16,975 224 32.84 747 32.01 13,129 Level 2
2,000 16,902 234 31.00 740 30.93 13,110
2,000 16,935 215 28.39 760 31.49 13,107
2,400 16,839 235 26.17 762 29.95 13,079 Level 3
2,800 16,767 252 24.47 763 28.63 13,057
4,400 16,261 460 27.94 974 29.54 12,803
4,600 16,209 465 27.13 970 28.90 12,789 Level 4
4,800 16,147 466 26.20 963 28.19 12,774
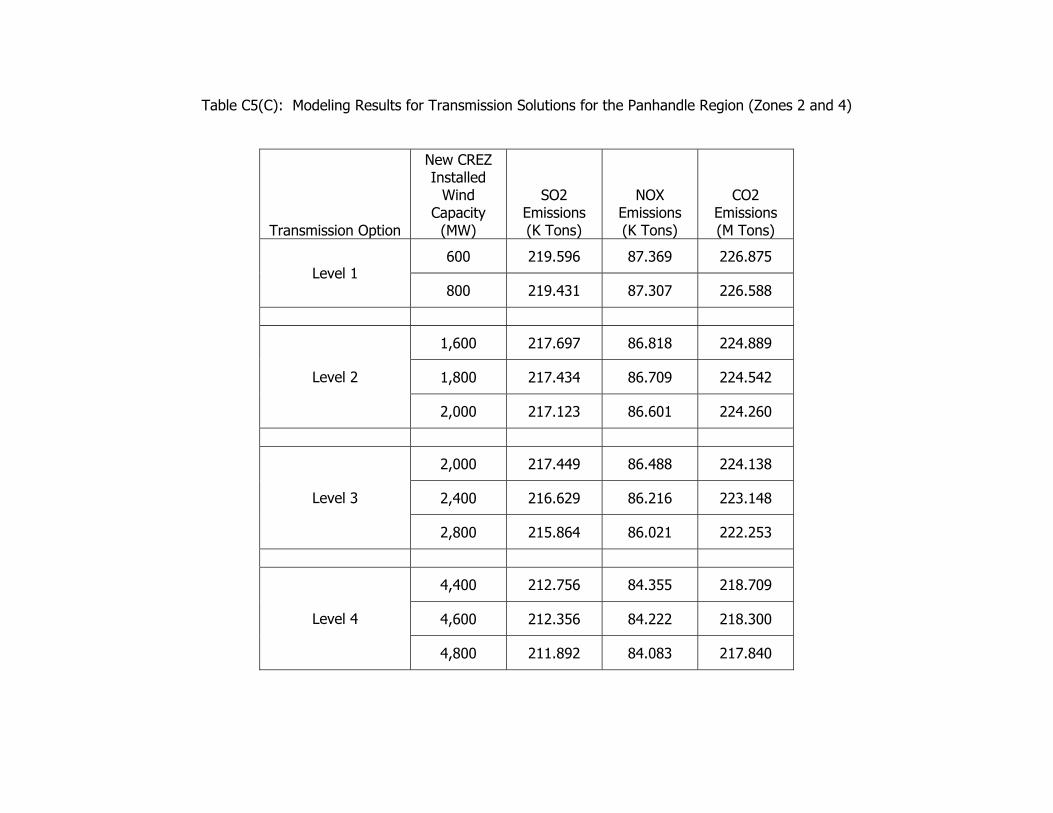
Table C5(C): Modeling Results for Transmission Solutions for the Panhandle Region (Zones 2 and 4)
Transmission Option
New CREZ Installed
Wind Capacity
(MW)
SO2 Emissions (K Tons)
NOX Emissions (K Tons)
CO2 Emissions (M Tons)
600 219.596 87.369 226.875 Level 1
800 219.431 87.307 226.588
1,600 217.697 86.818 224.889
1,800 217.434 86.709 224.542 Level 2
2,000 217.123 86.601 224.260
2,000 217.449 86.488 224.138
2,400 216.629 86.216 223.148 Level 3
2,800 215.864 86.021 222.253
4,400 212.756 84.355 218.709
4,600 212.356 84.222 218.300 Level 4
4,800 211.892 84.083 217.840
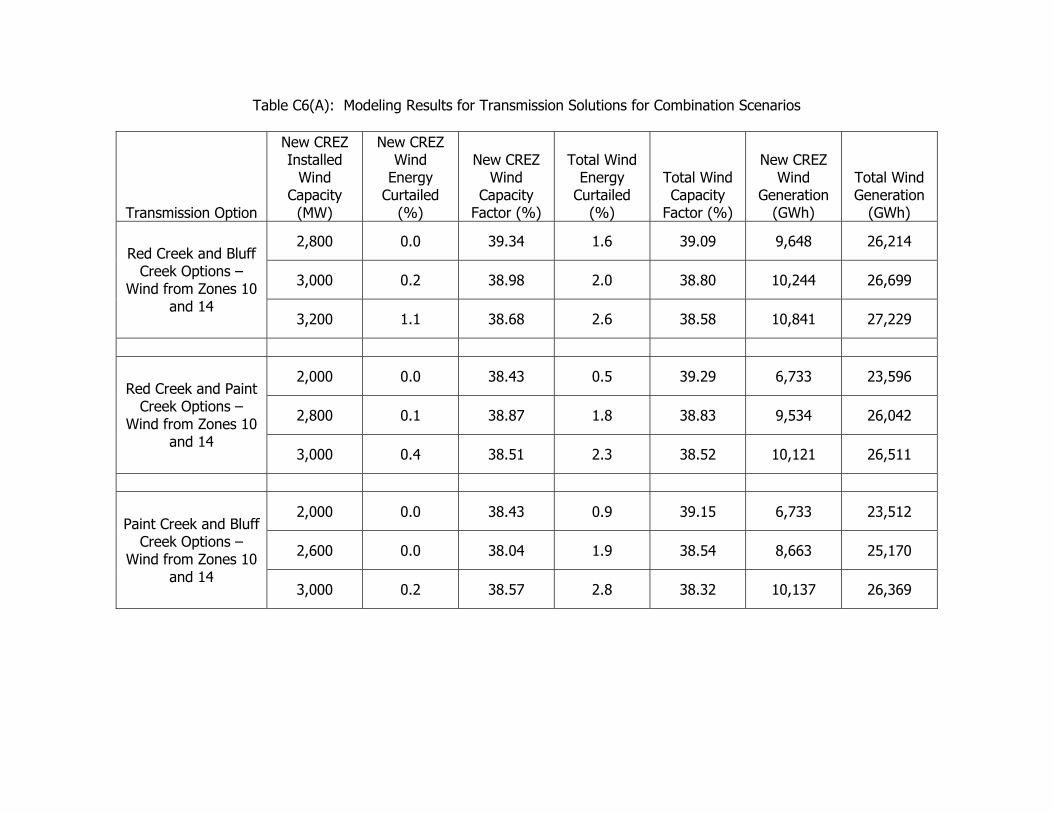
Table C6(A): Modeling Results for Transmission Solutions for Combination Scenarios
Transmission Option
New CREZ Installed
Wind Capacity
(MW)
New CREZ Wind
Energy Curtailed
(%)
New CREZ Wind
Capacity Factor (%)
Total Wind Energy
Curtailed (%)
Total Wind Capacity
Factor (%)
New CREZ Wind
Generation (GWh)
Total Wind Generation
(GWh)
2,800 0.0 39.34 1.6 39.09 9,648 26,214
3,000 0.2 38.98 2.0 38.80 10,244 26,699
Red Creek and Bluff Creek Options –
Wind from Zones 10 and 14
3,200 1.1 38.68 2.6 38.58 10,841 27,229
2,000 0.0 38.43 0.5 39.29 6,733 23,596
2,800 0.1 38.87 1.8 38.83 9,534 26,042
Red Creek and Paint Creek Options –
Wind from Zones 10 and 14
3,000 0.4 38.51 2.3 38.52 10,121 26,511
2,000 0.0 38.43 0.9 39.15 6,733 23,512
2,600 0.0 38.04 1.9 38.54 8,663 25,170
Paint Creek and Bluff Creek Options –
Wind from Zones 10 and 14
3,000 0.2 38.57 2.8 38.32 10,137 26,369
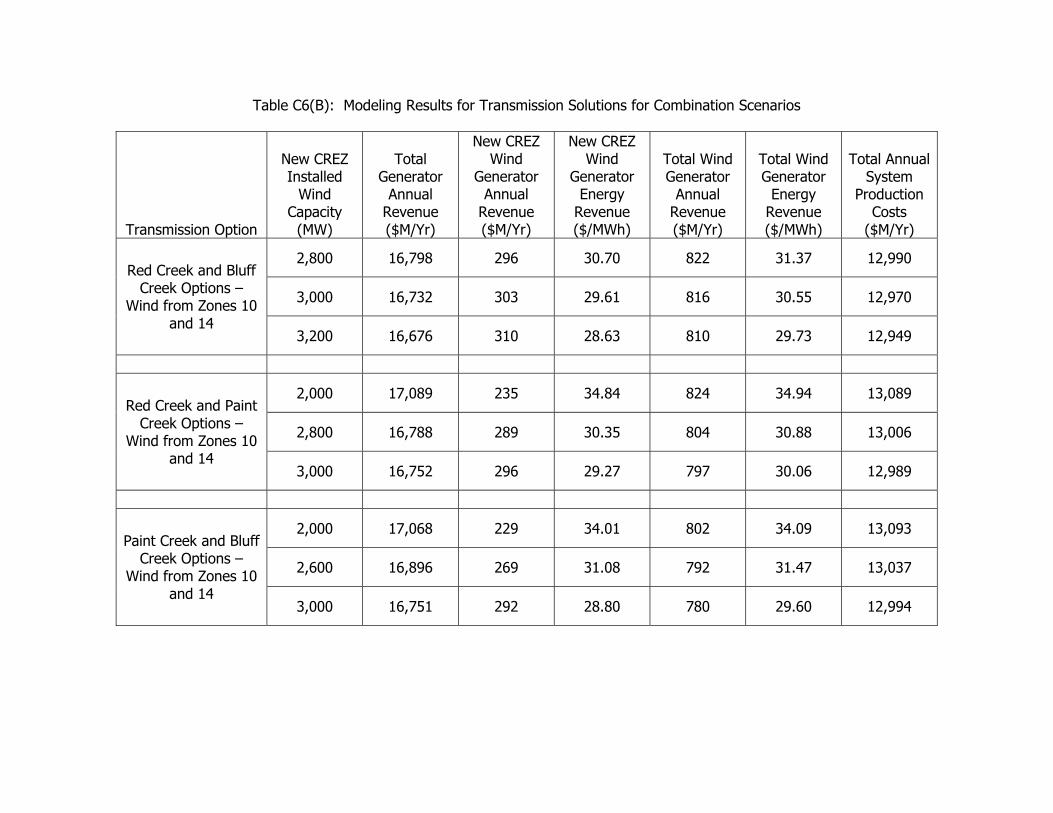
Table C6(B): Modeling Results for Transmission Solutions for Combination Scenarios
Transmission Option
New CREZ Installed
Wind Capacity
(MW)
Total Generator
Annual Revenue ($M/Yr)
New CREZ Wind
Generator Annual
Revenue ($M/Yr)
New CREZ Wind
Generator Energy
Revenue ($/MWh)
Total Wind Generator
Annual Revenue ($M/Yr)
Total Wind Generator
Energy Revenue ($/MWh)
Total Annual System
Production Costs
($M/Yr)
2,800 16,798 296 30.70 822 31.37 12,990
3,000 16,732 303 29.61 816 30.55 12,970
Red Creek and Bluff Creek Options –
Wind from Zones 10 and 14
3,200 16,676 310 28.63 810 29.73 12,949
2,000 17,089 235 34.84 824 34.94 13,089
2,800 16,788 289 30.35 804 30.88 13,006
Red Creek and Paint Creek Options –
Wind from Zones 10 and 14
3,000 16,752 296 29.27 797 30.06 12,989
2,000 17,068 229 34.01 802 34.09 13,093
2,600 16,896 269 31.08 792 31.47 13,037
Paint Creek and Bluff Creek Options –
Wind from Zones 10 and 14
3,000 16,751 292 28.80 780 29.60 12,994
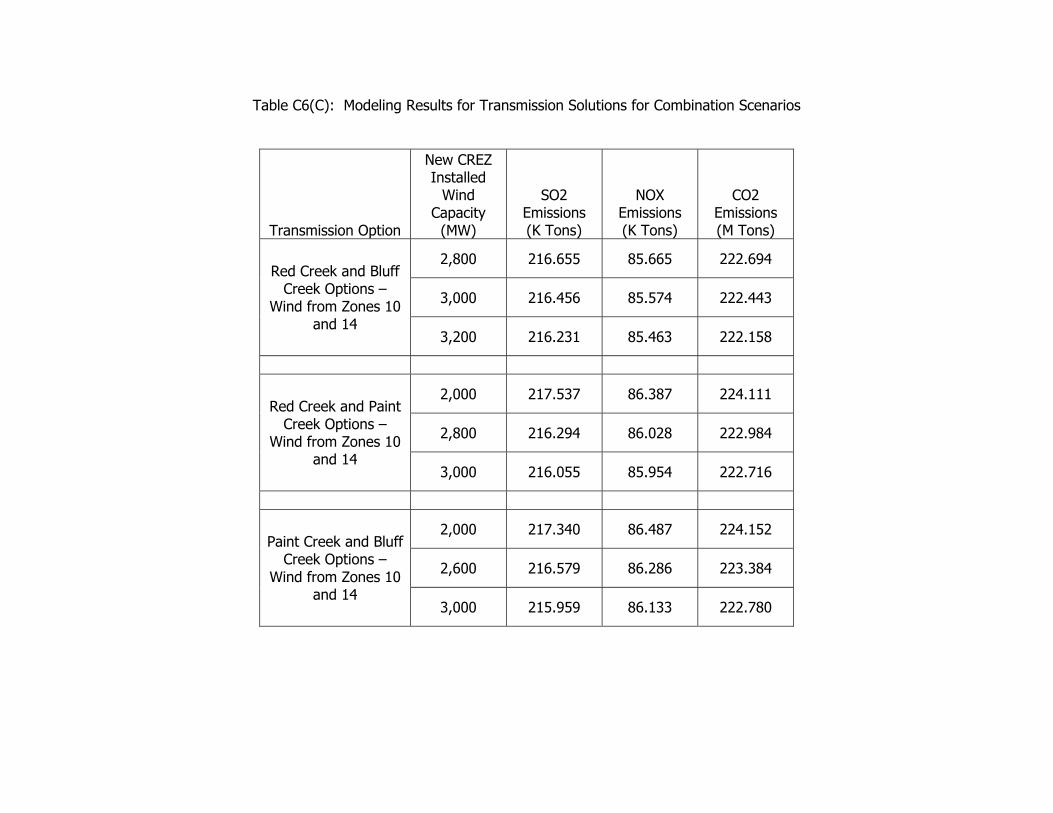
Table C6(C): Modeling Results for Transmission Solutions for Combination Scenarios
Transmission Option
New CREZ Installed
Wind Capacity
(MW)
SO2 Emissions (K Tons)
NOX Emissions (K Tons)
CO2 Emissions (M Tons)
2,800 216.655 85.665 222.694
3,000 216.456 85.574 222.443
Red Creek and Bluff Creek Options –
Wind from Zones 10 and 14
3,200 216.231 85.463 222.158
2,000 217.537 86.387 224.111
2,800 216.294 86.028 222.984
Red Creek and Paint Creek Options –
Wind from Zones 10 and 14
3,000 216.055 85.954 222.716
2,000 217.340 86.487 224.152
2,600 216.579 86.286 223.384
Paint Creek and Bluff Creek Options –
Wind from Zones 10 and 14
3,000 215.959 86.133 222.780

Table C7(A): Modeling Results for Transmission Solutions for Combination Scenarios
Transmission Option
New CREZ Installed
Wind Capacity
(MW)
New CREZ Wind
Energy Curtailed
(%)
New CREZ Wind
Capacity Factor (%)
Total Wind Energy
Curtailed (%)
Total Wind Capacity
Factor (%)
New CREZ Wind
Generation (GWh)
Total Wind Generation
(GWh)
3,000 0.3 39.87 1.6 39.32 10,479 27,061
3,250 0.4 39.84 2.1 39.13 11,343 27,784
Red Creek and Bluff Creek Options –
Wind from Zones 5, 10, and 14
3,500 0.7 39.71 2.8 38.85 12,174 28,437
2,500 0.4 39.67 1.3 39.38 8,687 25,376
2,750 0.6 39.66 1.7 39.23 9,555 26,141
Red Creek and Paint Creek Options –
Wind from Zones 5, 10, and 14
3,000 1.0 39.58 2.3 39.02 10,400 26,852
1,950 1.2 39.85 1.5 39.44 6,808 23,516
2,000 1.7 39.73 1.9 39.31 6,960 23,608
Paint Creek and Bluff Creek Options –
Wind from Zones 5, 10, and 14
2,750 4.7 38.05 3.6 38.47 9,166 25,629
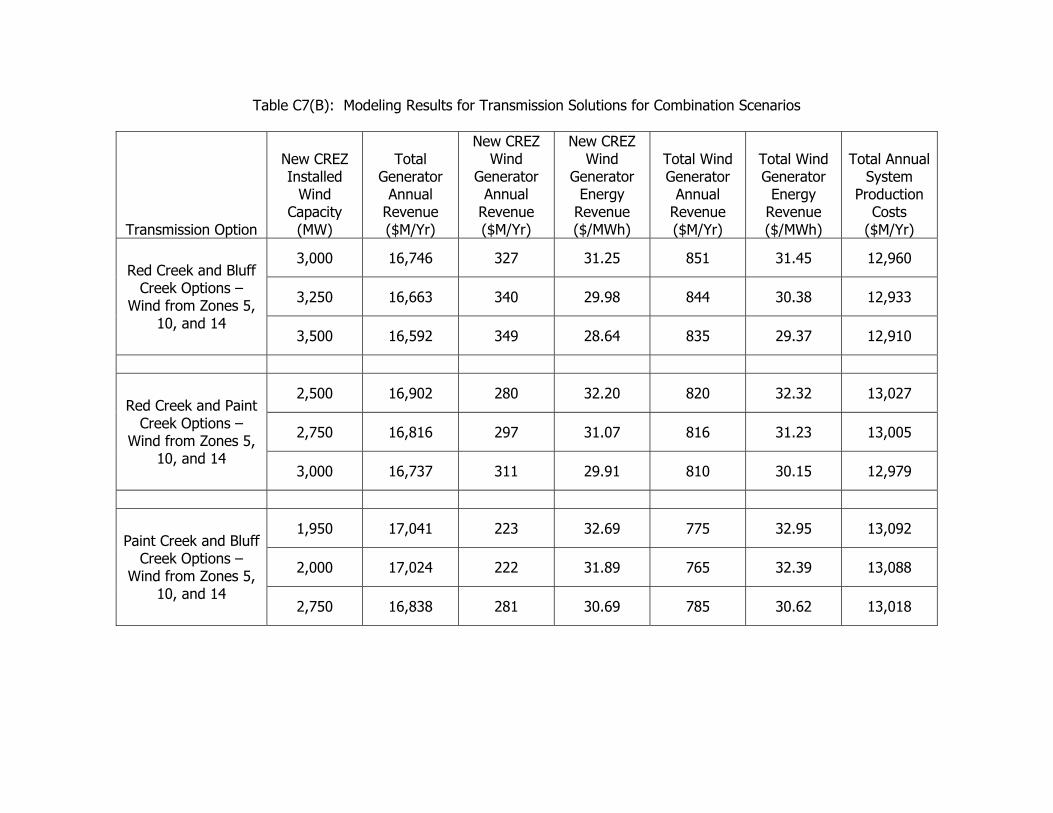
Table C7(B): Modeling Results for Transmission Solutions for Combination Scenarios
Transmission Option
New CREZ Installed
Wind Capacity
(MW)
Total Generator
Annual Revenue ($M/Yr)
New CREZ Wind
Generator Annual
Revenue ($M/Yr)
New CREZ Wind
Generator Energy
Revenue ($/MWh)
Total Wind Generator
Annual Revenue ($M/Yr)
Total Wind Generator
Energy Revenue ($/MWh)
Total Annual System
Production Costs
($M/Yr)
3,000 16,746 327 31.25 851 31.45 12,960
3,250 16,663 340 29.98 844 30.38 12,933
Red Creek and Bluff Creek Options –
Wind from Zones 5, 10, and 14
3,500 16,592 349 28.64 835 29.37 12,910
2,500 16,902 280 32.20 820 32.32 13,027
2,750 16,816 297 31.07 816 31.23 13,005
Red Creek and Paint Creek Options –
Wind from Zones 5, 10, and 14
3,000 16,737 311 29.91 810 30.15 12,979
1,950 17,041 223 32.69 775 32.95 13,092
2,000 17,024 222 31.89 765 32.39 13,088
Paint Creek and Bluff Creek Options –
Wind from Zones 5, 10, and 14
2,750 16,838 281 30.69 785 30.62 13,018

Table C7(C): Modeling Results for Transmission Solutions for Combination Scenarios
Transmission Option
New CREZ Installed
Wind Capacity
(MW)
SO2 Emissions (K Tons)
NOX Emissions (K Tons)
CO2 Emissions (M Tons)
3,000 216.084 85.581 222.277
3,250 215.575 85.407 221.820
Red Creek and Bluff Creek Options –
Wind from Zones 5, 10, and 14
3,500 215.287 85.336 221.510
2,500 216.561 86.152 223.292
2,750 216.173 86.081 222.922
Red Creek and Paint Creek Options –
Wind from Zones 5, 10, and 14
3,000 215.784 85.998 222.552
1,950 217.371 86.462 224.237
2,000 217.324 86.477 224.202
Paint Creek and Bluff Creek Options –
Wind from Zones 5, 10, and 14
2,750 216.347 86.241 223.193
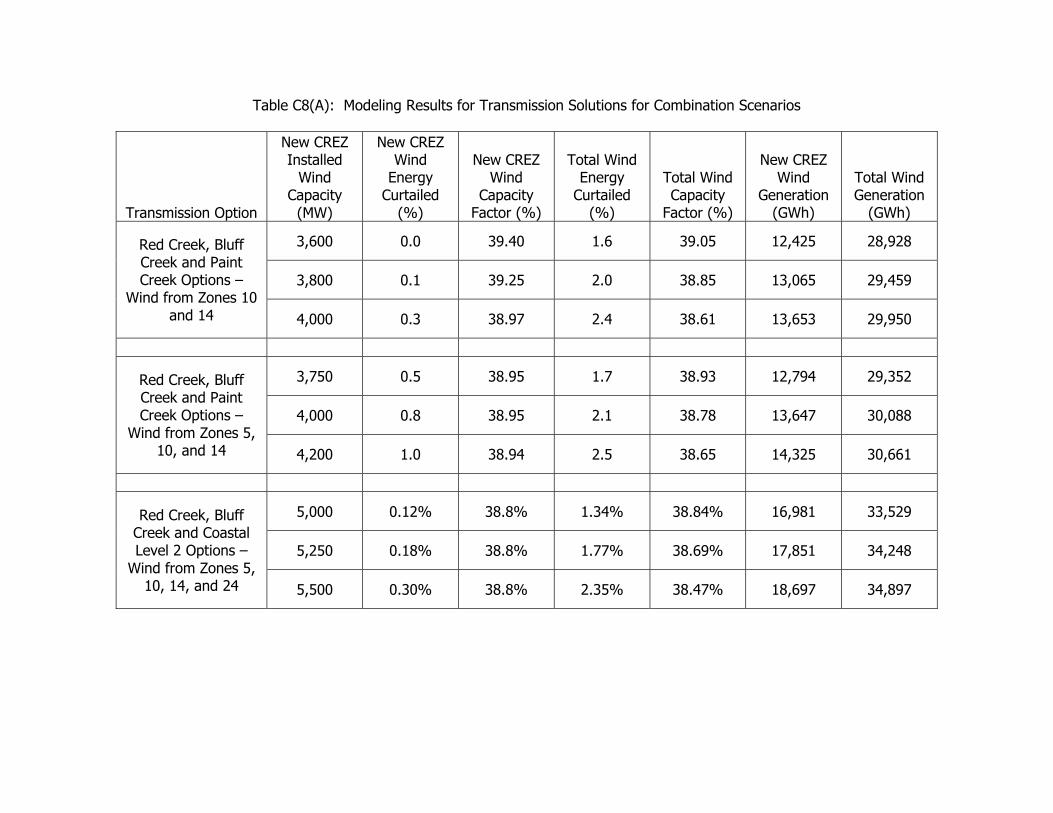
Table C8(A): Modeling Results for Transmission Solutions for Combination Scenarios
Transmission Option
New CREZ Installed
Wind Capacity
(MW)
New CREZ Wind
Energy Curtailed
(%)
New CREZ Wind
Capacity Factor (%)
Total Wind Energy
Curtailed (%)
Total Wind Capacity
Factor (%)
New CREZ Wind
Generation (GWh)
Total Wind Generation
(GWh)
3,600 0.0 39.40 1.6 39.05 12,425 28,928
3,800 0.1 39.25 2.0 38.85 13,065 29,459
Red Creek, Bluff Creek and Paint Creek Options –
Wind from Zones 10 and 14 4,000 0.3 38.97 2.4 38.61 13,653 29,950
3,750 0.5 38.95 1.7 38.93 12,794 29,352
4,000 0.8 38.95 2.1 38.78 13,647 30,088
Red Creek, Bluff Creek and Paint Creek Options –
Wind from Zones 5, 10, and 14 4,200 1.0 38.94 2.5 38.65 14,325 30,661
5,000 0.12% 38.8% 1.34% 38.84% 16,981 33,529
5,250 0.18% 38.8% 1.77% 38.69% 17,851 34,248
Red Creek, Bluff Creek and Coastal Level 2 Options –
Wind from Zones 5, 10, 14, and 24 5,500 0.30% 38.8% 2.35% 38.47% 18,697 34,897

Table C8(B): Modeling Results for Transmission Solutions for Combination Scenarios
Transmission Option
New CREZ Installed
Wind Capacity
(MW)
Total Generator
Annual Revenue ($M/Yr)
New CREZ Wind
Generator Annual
Revenue ($M/Yr)
New CREZ Wind
Generator Energy
Revenue ($/MWh)
Total Wind Generator
Annual Revenue ($M/Yr)
Total Wind Generator
Energy Revenue ($/MWh)
Total Annual System
Production Costs
($M/Yr)
3,600 16,565 370 29.74 875 30.26 12,899
3,800 16,496 377 28.89 869 29.51 12,881
Red Creek, Bluff Creek and Paint Creek Options –
Wind from Zones 10 and 14 4,000 16,453 385 28.18 867 28.96 12,864
3,750 16,535 381 29.81 887 30.20 12,884
4,000 16,467 397 29.09 887 29.48 12,856
Red Creek, Bluff Creek and Paint Creek Options –
Wind from Zones 5, 10, and 14 4,200 16,399 405 28.30 881 28.72 12,837
5,000 16,257 556 32.77 1059 31.59 12,695
5,250 16,181 570 31.92 1056 30.85 12,671
Red Creek, Bluff Creek and Coastal Level 2 Options –
Wind from Zones 5, 10, 14, and 24 5,500 16,102 577 30.87 1046 29.99 12,649

Table C8(C): Modeling Results for Transmission Solutions for Combination Scenarios
Transmission Option
New CREZ Installed
Wind Capacity
(MW)
SO2 Emissions (K Tons)
NOX Emissions (K Tons)
CO2 Emissions (M Tons)
3,600 214.817 85.162 221.186
3,800 214.513 85.085 220.852
Red Creek, Bluff Creek and Paint Creek Options –
Wind from Zones 10 and 14 4,000 214.275 84.988 220.600
3,750 214.525 85.113 220.944
4,000 214.052 84.986 220.494
Red Creek, Bluff Creek and Paint Creek Options –
Wind from Zones 5, 10, and 14 4,200 213.670 84.861 220.178
5,000 214.038 84.084 218.792
5,250 213.626 83.940 218.405
Red Creek, Bluff Creek and Coastal Level 2 Options –
Wind from Zones 5, 10, 14, and 24 5,500 213.214 83.807 218.047