comparisons between the window-based and storm-event...
TRANSCRIPT

Sains Malaysiana 41(11)(2012): 1377–1387
Comparisons between the Window-Based and Storm-Event Analysis(Perbezaan antara Analisis Berdasarkan Tingkap dan Analisis
Kejadian Ribut)
NoRATiqAh Mohd ARiff* & ABdul Aziz JEMAiN
ABSTRACT
Rainfalls data have been broadly used in researches including in hydrological and meteorological areas. Two common ways in extracting observations from hourly rainfalls data are the window-based analysis (WBA) and storm-event analysis (SEA) approach. However, the differences in the qualitative and quantitative properties of both methods are still vaguely discussed. The aim of studying these dissimilarities is to understand the effects of each approach in modelling and analysis. The qualitative difference is due to the way the two analyses define the accumulated rainfalls for observations which are referred to as rainfall and storm depths, respectively. The repetitiveness of rainfall depths provide nested structure while the storm depths are considered independent. The quantitative comparisons include their statistical and scaling properties that are linked by the self-similarity concept from simple scaling characteristics. If self-similarity concept holds, then the rainfall or storm depths follow simple scaling and the analysis would be simplified. The rainfall depths showed clearer simple scaling characteristics compared to the storm depths. Though the storm depths do not yield self-similarity for a large range of storm duration but the characteristics of simple scaling can be observed for a reduced range of the considered duration. In general, the context of the research and the region of the time interval and duration will be an important aspects to consider in choosing which method is best to use for analyzing the data.
Keywords: Rainfalls analysis; self-similarity concept; simple scaling; storm events
ABSTRAK
Data hujan telah diguna pakai dalam pelbagai kajian termasuk dalam bidang hidrologi dan meteorologi. Terdapat dua kaedah yang biasa digunakan untuk mengekstrak maklumat daripada data hujan setiap jam iaitu analisis berdasarkan tingkap dan analisis kejadian ribut. Walau bagaimanapun, perbezaan secara kualitatif dan kuantitatif kedua-dua analisis belum pernah dibincangkan dengan jelas. Tujuan mempelajari kelainan ini adalah untuk memahami kesan setiap kaedah tersebut terhadap permodelan dan analisis hujan. Perbezaan kualitatif antara kedua-dua analisis adalah disebabkan cara hujan terkumpul didefinisikan. Hujan terkumpul ini masing-masing ditulis sebagai kedalaman hujan dan kedalaman ribut. Pengulangan data yang digunakan dalam analisis berdasarkan tingkap menyebabkan kedalaman hujan mempunyai struktur bersarang manakala kedalaman ribut dianggap sebagai pemboleh ubah tak bersandar. Perbandingan kuantitatif pula terdiri daripada ciri statistik dan ciri berkala yang berkait rapat melalui konsep serupa daripada struktur berkala mudah. Jika konsep serupa diri ini dipenuhi, ini bermakna kedalaman hujan atau ribut itu mengikut sifat berkala mudah dan analisis akan menjadi lebih senang. Kedalaman hujan menunjukkan ciri berkala mudah yang lebih jelas berbanding pemboleh ubah kedalaman ribut. Walaupun kedalaman ribut tidak mempamerkan sifat serupa diri bagi julat tempoh ribut yang besar, tetapi sifat berkala mudah ini dapat dilihat pada pemboleh ubah tersebut jika julat ini dikecilkan untuk tempoh tertentu. Secara keseluruhannya, konteks kajian dan julat selang masa hujan atau tempoh ribut adalah aspek penting yang perlu diambil kira dalam memilih kaedah yang paling sesuai untuk menganalisis data hujan.
Kata kunci: Analisis hujan; berkala mudah; kejadian ribut; konsep serupa diri
iNTRoduCTioN
Rainfalls data have been analyzed extensively over the years in various researches including hydrological and meteorological areas of study. for example, studying the observed data from rainfall stations helps in understanding the trends and identifying any changes in the climates of the surrounding areas (deni et al. 2008; Wan zin et al. 2010). in order to manage water resources system and to design hydraulic structures, the characteristics of rainfalls need to
be modelled. due to the complexity of natural phenomena such as rainfalls which is highly unpredictable, statistical approaches are adopted to accommodate the modelling process (Kao & Govindaraju 2008). Previous literatures provide a few methods of viewing raw rainfalls data in their analysis. Among them are the window-based analysis (WBA) (Ceresetti et al. 2010; Chiew et al. 2010; Villarini et al. 2011) and storm-event analysis (SEA) (de Michele et al. 2011; Kao & Govindaraju 2007;

1378
Singh & zhang 2007; zhang & Singh 2007) approach. The window-based method relates to the concept of accumulated rainfalls in a given time interval. it determines the time intervals beforehand and does not measure the duration of rainfall event. Thus, it is sometimes referred to as a univariate analysis (Vanderberghe et al. 2011). The most prominent drawback of the method is that the time intervals used do not necessarily represent the durations of actual rainfall events. Although it is often heavily criticized for its disadvantage of non-random time intervals, the window-based approach is still widely used due to its abundance of data compared to the storm-event analysis approach. The storm-event analysis needs at least the hourly rainfalls data in order to compute the so called storm-events. Though the method is not particularly new, most of the researches regarding the storm-event are related to copula method and analysis. Briefly, the copula method provides a multivariate analysis of the event without having to assume equality of the marginal distributions and the independence among variables. The study on the characteristics of the storm events is still inadequate in order to compare with the window-based approach. Comparisons between the window-based and storm-event analysis are still very vaguely described and the impacts in their statistical properties of using one method over the other for modelling are still unknown. Palynchuk and Guo (2008) had attempted to compare the return periods of extreme rainfalls while lebel and Ali (2009) tried to distinguish between the trends of the usual window-based rainfall analysis and the event analysis. Both studies had revealed that there are differences in the results but the detailed characteristics and explanations behind the two methods are not discussed. This paper focused on examining the qualitative and quantitative aspects of both the window-based and storm-event analysis. The aim was to differentiate the underlying features of the two methods so as to help future researchers to determine which procedure is more suitable for the contexts of their research. The next section will explain on the rainfalls data used for observations in this study. This will then be followed by a discussion on the qualitative comparisons in regards to the definitions of window-based and storm-event, respectively. The descriptive statistics and the scaling properties of the observations are among the usual criteria looked at in statistical modelling process. hence, for quantitative comparisons, this paper will investigate the dissimilarity of the statistical and scaling properties of the depths of accumulated rainfalls from both approaches. finally, the last section will provide a conclusion of the whole paper.
dATA
data for the comparisons of the two approaches are taken from the department of irrigation and drainage Malaysia. They are the hourly rainfalls data obtained from stations
across Peninsular Malaysia. These stations are divided into four regions according to their geographical locations; Northwest, West, East and Southwest region (Suhaila & Jemain 2009). The comparisons between WBA and SEA obtained from stations of each region are generally the same. for this paper, stations from the East region are selected as examples of the rainfalls analysis. The stations chosen are dungun (4o42’ N, 103o24’ E), Endau (2o36’ N, 103o36’ E) and Kemaman (4o12’ N, 103o24’ E). All three stations contain hourly rainfall data which are more than 90% complete, 97.5%, 97.7% and 96.2%, respectively. The stations contain rainfalls data for the year 1975 to 2008. The time intervals and durations considered for analysis are 1, 2, 3, 4, 6, 8, 9, 12, 16, 20 and 24.
quAliTATiVE CoMPARiSoNS
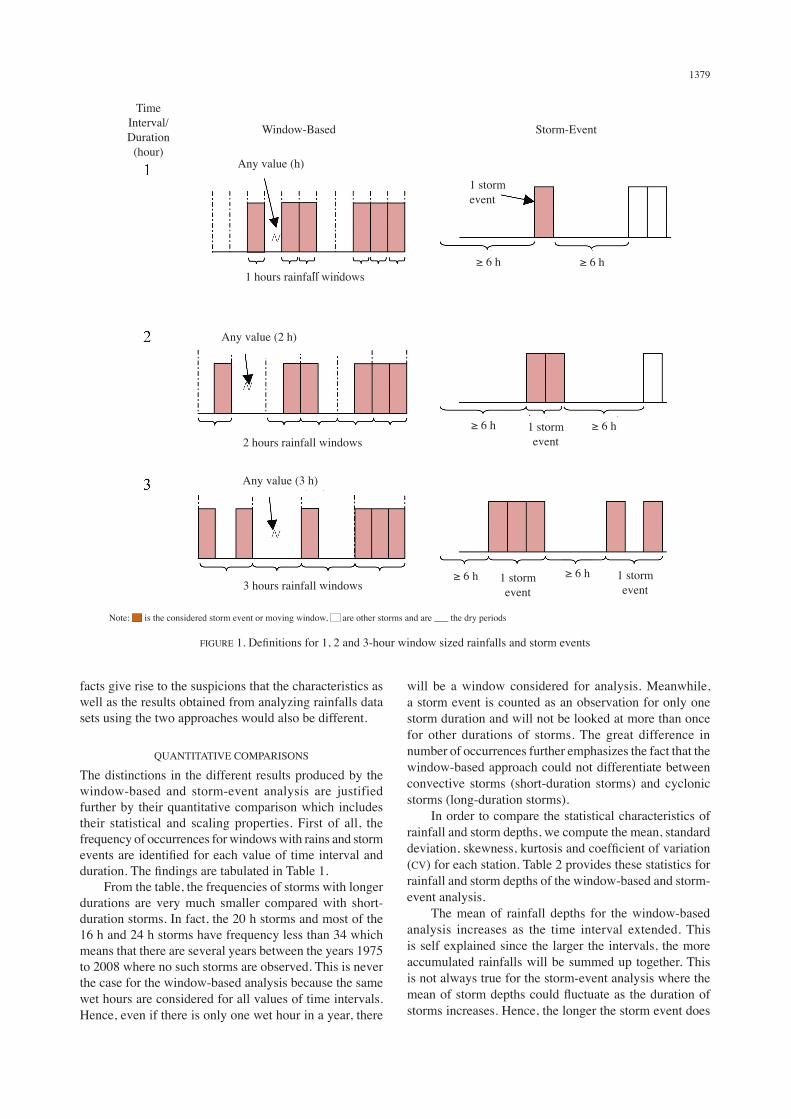
The window-based and storm-event analysis differs in the way they define the accumulated rainfalls for each observation. The windows are defined by the use of time intervals which are predetermined before exploring the rainfalls data. The time interval can be set to any values such as 1 h, 1 day, 1 month and even 1 year. The hourly data set is then divided into partitions with widths of the same size as the chosen time interval. Thus, the windows that are taken to be examined are those which have at least one hour of rain. The hours with rains are called wet hours while those without are dry hours. The rainfall depths are the accumulated rainfalls amounts for the windows. The definition of the storm-event analysis depends greatly on the inter-event time definition (iETd) (Palynchuk & Guo 2008). The iETd is the minimum duration of dry period between two consecutive storm events. if the dry period between two wet hours is less than the iETd, then they would not be considered as two different storm events but parts of a single storm. The iETd values are chosen such that the serial correlation between two different storms is minimized (Restrepo-Posada & Eagleson 1982). for small urban catchments, the iETd is usually taken as six hours since the time concentration of rainfalls is less than six hours and that would make the runoff response of successive storms to appear independent (Palynchuk & Guo 2008). hence, for small catchments, storm depths are the accumulated rainfalls amounts which begin and end with at least one wet hour and either contains dry periods of less than six hours or none at all. differences between the two analysis can be seen more clearly from the illustrations in figure 1. for the window-based analysis, the total of rainfall depths for any time interval that is being analyzed would always have the same values. This is because the wet hours which are taken into account are identical even though they belong to different windows for various intervals. Thus, the same data are repeatedly used for all values of time interval. Meanwhile, for storm events, the total storm depths with different durations will not be equal given that if a storm is said to be of certain duration, then it will not be considered again for other durations. following all these
1379
facts give rise to the suspicions that the characteristics as well as the results obtained from analyzing rainfalls data sets using the two approaches would also be different.
quANTiTATiVE CoMPARiSoNS
The distinctions in the different results produced by the window-based and storm-event analysis are justified further by their quantitative comparison which includes their statistical and scaling properties. first of all, the frequency of occurrences for windows with rains and storm events are identified for each value of time interval and duration. The findings are tabulated in Table 1. from the table, the frequencies of storms with longer durations are very much smaller compared with short-duration storms. in fact, the 20 h storms and most of the 16 h and 24 h storms have frequency less than 34 which means that there are several years between the years 1975 to 2008 where no such storms are observed. This is never the case for the window-based analysis because the same wet hours are considered for all values of time intervals. hence, even if there is only one wet hour in a year, there
will be a window considered for analysis. Meanwhile, a storm event is counted as an observation for only one storm duration and will not be looked at more than once for other durations of storms. The great difference in number of occurrences further emphasizes the fact that the window-based approach could not differentiate between convective storms (short-duration storms) and cyclonic storms (long-duration storms). in order to compare the statistical characteristics of rainfall and storm depths, we compute the mean, standard deviation, skewness, kurtosis and coefficient of variation (CV) for each station. Table 2 provides these statistics for rainfall and storm depths of the window-based and storm-event analysis. The mean of rainfall depths for the window-based analysis increases as the time interval extended. This is self explained since the larger the intervals, the more accumulated rainfalls will be summed up together. This is not always true for the storm-event analysis where the mean of storm depths could fluctuate as the duration of storms increases. hence, the longer the storm event does
fiGuRE 1. Definitions for 1, 2 and 3-hour window sized rainfalls and storm events
Timeinterval/ duration
(hour)
Window-Based Storm-Event
Any value (2 h)
1 hours rainfall windows
3 hours rainfall windows
2 hours rainfall windows
Any value (h)
Any value (3 h)
1 stormevent
≥ 6 h ≥ 6 h
≥ 6 h 1 stormevent
≥ 6 h
≥ 6 h 1 stormevent
≥ 6 h 1 stormevent
Note: is the considered storm event or moving window, are other storms and are ___ the dry periods

1380
not necessarily imply that the storm produces heavier rains. The mean of rainfall depths for windows with 1 h time intervals is usually greater than the mean of storm depths for 1 h storms because the 1 h windows could be parts of
longer storms. however, the reverse is true for any other time intervals or storm durations since the window-based only needs one wet hour for the window to be considered but a minimum of two wet hours with the time difference between them less than six hours are required to make
TABlE 1. frequency of occurrences for the window-based and storm-event analysis
Stn App Time interval/duration (hours)1 2 3 4 6 8 9 12 16 20 24
E01 WBASEAW:S
25335130219.5
1636181720.0
13216404
32.7
1118834832.3
926224537.8
799319541.0
7757134
57.9
680173
93.2
591837
160.0
536518
298.1
502850
100.6E02 WBA
SEAW:S
24667146316.9
1628298416.6
13280537
24.7
1141537630.4
951525137.9
843216451.4
8055129
62.4
703462
113.5
628935
179.7
573619
301.9
530328
189.4E03 WBA
SEAW:S
25839123421.0
1681979921.1
13597397
34.3
1150634833.1
948124538.7
817017945.6
7853126
62.3
6852101
67.8
598233
181.3
546914
390.6
510230
170.1 Note: W:S =
TABlE 2. Statistics for rainfall and storm depths of the window-based and storm-event analysis
App Stn Stats Time interval / duration (hours)1 2 3 4 6 8 9 12 16 20 24
WBA E01 MeanStd devSkewnessKurtosisCV
3.15.54.2
29.91.8
4.88.34.1
30.21.8
5.910.34.2
32.71.8
7.012.14.5
40.31.7
8.414.74.9
53.71.8
9.716.94.6
41.21.7
10.017.74.6
40.41.8
11.520.25.3
59.61.8
13.123.15.5
64.61.8
14.525.46.0
81.51.8
15.527.46.0
75.41.8
E02 MeanStd devSkewnessKurtosisCV
3.66.23.9
24.81.7
5.59.43.9
26.21.7
6.711.53.9
25.81.7
7.813.44.2
30.61.7
9.416.44.4
34.11.8
10.618.74.7
39.91.8
11.119.54.6
36.41.8
12.722.44.7
39.21.8
14.225.14.8
38.61.8
15.627.64.7
35.11.8
16.830.65.0
40.31.8
E03 MeanStd devSkewnessKurtosisCV
3.25.94.6
36.61.8
5.08.94.1
28.81.8
6.211.03.9
25.01.8
7.312.93.9
25.11.8
8.815.74.0
25.51.8
10.318.24.0
25.51.8
10.719.14.3
31.11.8
12.221.94.5
32.51.8
14.024.94.7
36.21.8
15.327.54.8
36.71.8
16.429.85.0
40.31.8
SEA E01 MeanStd devSkewnessKurtosisCV
2.03.75.2
41.81.8
5.77.13.0
16.21.3
12.212.71.75.81.0
12.114.12.18.11.2
15.016.41.96.91.1
19.920.42.07.81.0
17.418.52.8
15.71.1
25.726.61.86.01.0
31.222.80.83.00.7
62.784.52.26.81.4
22.927.42.17.11.2
E02 MeanStd devSkewnessKurtosisCV
2.44.44.2
25.01.9
7.610.02.6
11.11.3
13.013.31.75.81.0
14.716.62.5
12.41.1
16.317.01.65.51.0
18.420.81.96.51.1
21.820.71.65.91.0
21.218.61.23.40.9
44.348.21.75.21.1
59.560.91.33.61.0
23.823.72.39.61.0
E03 MeanStd devSkewnessKurtosisCV
2.44.85.0
34.82.1
6.27.52.5
12.21.2
11.613.21.97.11.1
12.615.72.6
11.51.2
15.620.12.9
13.01.3
18.116.51.44.70.9
18.219.11.65.01.1
21.622.92.07.71.1
35.836.62.07.91.0
50.740.00.72.20.8
60.066.01.54.41.1

1381
up a storm event. Most of the means for storm depths are doubled of the means for rainfall amounts from the window-based analysis. This would suggest that the actual rainfall events are in reality about twice more severe than studies which utilized the moving windows approach. Similar to the mean, the standard deviation of rainfall depths increases with increasing time interval while the standard deviation for storm depths does not. however, the standard deviation of storm depths are more varied compared with the standard deviation of rainfall depths. As for skewness and kurtosis, the window-based approach mostly provides larger values compared to the storm-event approach. The coefficient of variation (CV) is the dispersion of data per unit mean. it is the ratio of the standard deviation to the mean of rainfall or storm depths, i.e. CV = standard deviation/mean. All the CV values for the window-based analysis are greater than one, around 1.7 and 1.8, which shows that the standard deviation of rainfall depths is always greater than the mean. Meanwhile, the CV values for the storm-event vary below and above one. in fact, most of them are close to one which implies that the standard deviation is almost always equal to the mean of storm depths.
SCAliNG PRoPERTiES
A preliminary study on scaling properties is done for both the window-based and storm-event analysis to assess the scaling characteristics of the statistics of rainfall and storm depths with respect to time interval and duration. The easiest scaling would be the simple scaling with the self-similarity concept. let Xt and Xt0 be random variables with time interval or duration t and t0 respectively. The random variables possess the following scaling property:
Xt (1)
where t, t0 ∈ R. R is the region or range of t and t0, λ = t/t0 is the scaling factor and β is the scaling exponent. This property is known as ‘simple scaling in the strict sense’ with means equality of probability distributions (Gupta & Waymire 1990). The strict sense of simple scaling in equation (1) yields that and (λβXt0
)n has the same probability distribution. This implies that they have the same moments provided that the moments are finite,
(2)
βn is the scaling exponent of order n. The statistical and scaling properties are linked together by the self-similarity concept which looks at the central moments of random variables Xt and Xt0
. The relationships for moments in equation (2) can also be shown true for the case of central moments if they follow the simple scaling property, i.e.
E[(Xt – )n] = λβn E[(Xt0 – )n]. (3)
hence, by using the central moments on simple scaling random variables, the following self-similarity characteristics hold:
1. E[(Xt – )] = λβ E[(Xt0 – ) ]
2. Var (Xt) = λ2β Var(Xt0), i.e. σ(Xt) = Xβσ(Xt0
)
3. Skewness (Xt) = Skewness (Xt0)
4. Kurtosis (Xt) = Kurtosis (Xt0)
5. CV (Xt) – CV (Xt0).
Equation (3) can be log-transformed as: log E [(Xt – )n] = log E [(Xt0
– )n] + βn log λ(4)
in order to estimate β from the slope of the linear regression between log E [(Xt – )n] and log λ for all orders of n. Thus, the logarithms of mean, variance and standard deviation will have linear relationships with the logarithm of the scaling factor λ while the skewness, kurtosis and CV will be constant for all values of t if the random variables acquire simple scaling. in fact, the scaling exponent of the mean and standard deviation should be equal. Since studying both the variance and standard deviation will be redundant, we will focus on the standard deviation in this paper. if the self-similarity concept holds, then the analysis of rainfalls would be simplified and easier. As an example, figures 2 and 3 provide the boxplots of rainfall and storm depths for station E01 with respect to the time intervals and durations, respectively. in both figures, the boxplots for statistics of rainfall and storm depths which are yield from the bootstrap resampling method are also included. from figure 2, the boxplots show that the mean and standard deviation of rainfall depths increases as the time interval increases. hence this implies the possibility of linear relationships between their log-transformed and the logarithm of the time interval. This corresponds to the characteristics of simple scaling through the self-similarity concept. unfortunately, it is not obvious that the skewness and kurtosis are constant for all values of time interval as should be if the rainfall depths possess the simple scaling property. however, bear in mind that since the window-based analysis uses the same wet hours repetitively as the observations for all time intervals, the correlations among the random variables may affect the patterns of the statistics. The boxplot for the CV of rainfall depths illustrates the equality of the CV values for all time intervals and thus agree with the self-similarity concept of simple scaling. for the storm-event analysis, figure 3 shows that the mean and standard deviation of storm depths fluctuate as the duration of storms increases. This does not follow the self-similarity concept for the simple scaling property. furthermore, the skewness, kurtosis and CV are not

1382
(a) (b)
(c) (d)
(e) (f)
time interval time interval
time interval time interval
time interval time interval
skew
ness
mea
nC
V
kurto
sis
std
dev
rain
fall
dept
h, m
m
fiGuRE 2. Boxplots for (a) rainfall depths and their statistics; the (b) mean, (c) standard deviation, (d) skewness, (e) kurtosis and (f) CV of rainfall depths for station E01

1383
(a) (b)
(c) (d)
(e) (f)
duration duration
duration duration
duration, h duration
skew
ness
mea
nC
V
kurto
sis
std
dev
rain
fall
dept
h, m
m
fiGuRE 3. Boxplots for (a) storm depths and their statistics; the (b) mean, (c) standard deviation, (d) skewness, (e) kurtosis and (f) CV of storm depths for station E01

1384
constant for all values of storm durations. Thus, simple scaling may not be the most suitable scale-invariant model for storm depths and there is a possibility that in order to transform storm depths from one temporal model to another may be more complicated. in fact, further research on its scaling properties might be extended to include piecewise and multi scaling. however, it could be seen that if the range R of t is reduced to selected storm durations, then the simple scaling property may be obtained for the random variables storm depths. unlike the observations of rainfall depths from the window-based analysis, the storm depths are deemed independent random variables. linear regressions are performed on the logarithms of the mean and standard deviation as well as the skewness, kurtosis and CV for both the rainfall and storm depths. As was suggested earlier, the simple scaling procedures are repeated for a reduced range R of t with selected time interval or duration. The reduced R can be chosen such that it represents a short-duration or a long-duration storm. Storms which have the greatest impact on small urban catchments, like most rainfall stations in Peninsular Malaysia, are short-duration storms which are less than 12 h (Palynchuk & Guo 2008). furthermore, boxplots for various statistics of storm depths from most stations in Peninsular Malaysia show that the range of R for storm depths which resembles the self-similarity concept is mostly within 12 h and the reduced R chosen for the East region includes the 3, 4, 6, 8, 9 and 12 h. By using station E01 as an example, plots for all the linear regressions of rainfall and storm depths are shown in figures 4 and 5, respectively. The scaling exponents and adjusted R2s for the window-based and storm-event approach of both the full and reduced range R of station E01 are given in Table 3. for the window-based analysis, both the full and reduced R yield the characteristics of self-similarity. The scaling exponents for the log (mean) and log (standard deviation) are equal and their adjusted R2 show linear relationships with the logarithm of time intervals. furthermore, the scaling exponents for the skewness and CV of rainfalls depths are close to 0 implying that they are almost constants. The adjusted R2 for CV is also around 0
which means that there is no linear relationship with time intervals. Although the kurtosis demonstrate linearity and not the supposed constant for self-similarity, it is shown that by selecting certain reduced range R helps to move the kurtosis of rainfall depths towards the simple scaling property. The characteristics of simple scaling from the concept of self-similarity are less prominent for storm depths. however, these characteristics are seen clearer in the reduced range R of selected storm durations. The scaling exponents for the logarithms of mean and standard deviations have closer values and their adjusted R2 provide stronger linear relationships with the log-transformed of storm durations. The skewness and CV also produce scaling exponents near 0 while the adjusted R2 of the skewness and kurtosis prove that there is almost no linearity with the duration of storms.
CoNCluSioN
Two common approaches used by researches to extract observations for analysis from raw hourly rainfalls data were the window-based and storm-event analysis. Though both methods are used extensively, comparisons between the two are still vaguely described. The purpose of studying the differences in their qualitative and quantitative properties was to distinguish the impacts of using both methods in modelling and analysis. hence, it was possible to choose the most suitable method to be utilized depending on the context of future researches. The window-based analysis divides the rainfalls data into windows of fix equal sizes. The window sizes were predetermined by the time intervals used for analysis. The windows which are examined have at least one wet hour of rain. for the window-based analysis, the same wet hours are repetitively considered for each time interval under investigation. The storm-event analysis defines storm event as either a single wet hour or a rainfall event which begins and ends with at least one wet hour and contains dry periods of less than six h or none at all. The storm events are sandwiched between two long dry periods of no less than six h. once a wet hour is taken as part of a
TABlE 3. Scaling exponents and adjusted R2 for linear regressions of the window-based and storm-event analysis for both the full and reduced range of the time interval and duration respectively
Scaling exponents Adjusted R2
full Reduced full Reduced WBA SEA WBA SEA WBA SEA WBA SEA
log (mean) 0.50 0.84 0.48 0.53 0.99 0.86 1.00 0.88log (std dev) 0.50 0.72 0.48 0.49 1.00 0.82 1.00 0.92Skewness 0.09 -0.07 0.09 0.03 0.93 0.21 0.68 0.08Kurtosis 2.24 -0.68 2.05 0.26 0.88 0.23 0.47 0.06CV 0.00 -0.01 0.00 -0.01 0.01 0.08 0.13 0.23

1385
fiGuRE 4. Plots for linear regressions of the (i) mean, (ii) standard deviation, (iii) skewness, (iv) kurtosis and (v) CV of rainfall depths for the (a) full and (b) reduced range of time interval t
log
(mea
n of
stor
m d
epth
)lo
g (s
td d
ev o
f sto
rm d
epth
)sk
ewne
ss o
f rai
nfal
l dep
thku
rtosi
s of r
ainf
all d
epth
CV
of r
ainf
all d
epth
log
(mea
n of
stor
m d
epth
)lo
g (s
td d
ev o
f sto
rm d
epth
)sk
ewne
ss o
f rai
nfal
l dep
thku
rtosi
s of r
ainf
all d
epth
CV
of r
ainf
all d
epth

1386
fiGuRE 5. Plots for linear regressions of the (i) mean, (ii) standard deviation, (iii) skewness, (iv) kurtosis and (v) CV of storm depths for the (a) full and (b) reduced range of duration t
log
(mea
n of
stor
m d
epth
)lo
g (s
td d
ev o
f sto
rm d
epth
)sk
ewne
ss o
f rai
nfal
l dep
thku
rtosi
s of r
ainf
all d
epth
CV
of r
ainf
all d
epth
log
(mea
n of
stor
m d
epth
)lo
g (s
td d
ev o
f sto
rm d
epth
)sk
ewne
ss o
f rai
nfal
l dep
thku
rtosi
s of r
ainf
all d
epth
CV
of r
ainf
all d
epth

1387
storm with certain duration, it will no longer be used for storms of other durations. The quantitative comparisons included the statistical and scaling properties of the window-based and storm-event analysis. These properties were linked by the self-similarity concept from the simple scaling characteristics. if the statistics of the random variables which are either the rainfall or storm depths follow the self-similarity concept, then they possess the simple scaling property. The self-similarity implied that the logarithms of the mean and standard deviation were linearly related to the logarithm of the time interval or duration. furthermore, their skewness, kurtosis and CV will be constant for all values of time interval or duration considered. The full region of time interval and duration taken into account for this study were the 1, 2, 3, 4, 6, 8, 9, 12, 16, 20 and 24 h. The rainfall depths showed clearer simple scaling characteristics compared to the storm depths. due to the repetitiveness of the observed data in window-based analysis, the rainfall depths acquire nested structure which is the reason why the window-based is more likely to follow simple scaling than the storm-event analysis. hence, for studies which require a scale-invariant model for a long range of time interval or duration, it was simpler to use the WBA. however, some considerations have to be taken since the WBA did not represent actual rainfalls. Although the storm depths did not produce self-similarity as clearly as the window-based for the full range R of storm durations, it can be shown that for smaller range R, the self-similarity concept was satisfied. Thus, for studies which were only interested in a certain type of storms, for example convex or cyclonic storms, the simple scaling property may be applied to observations obtained from the SEA with greater confidence. The characteristics for rainfall and storm depths shown in this paper were generally similar to the characteristics found from stations in different regions of Peninsular Malaysia. overall, the context of the research and the region of the time interval and duration were an important aspects to consider in choosing which method was best to analyze the data.
ACKNoWlEdGEMENT
The authors would like to thank the department of irrigation and drainage Malaysia for providing hourly rainfalls data for the use of the study. utmost appreciations to the Ministry of higher Education (MohE) for the allocation of the research grant (uKM-ST-06-fRGS0181-2010).
REfERENCES
Ceresetti, d., Molinié, G. & Creutin, J.d. 2010. Scaling properties of heavy rainfall at short duration: A regional analysis. Water Resources Research 46(9): W09531.
Chiew, f.h.S., Kirono, d.G.C., Kent, d.M., frost, A.J., Charles, S.P., Timbal, B., Nguyen, K.C. & fu, G. 2010. Comparison of runoff modelled using rainfall from different downscaling methods for historical future climates. Journal of Hydrology 387(1-2): 10-23.
de Michele, C., zenoni, E., Pecora, S. & Rosso, R. 2011. Analytical derivation of rain intensity-duration-area-frequency relationships from event maxima. Journal of Hydrology 399(3-4): 385-393.
deni, S.M., Suhaila, J., Wan zin, W.z. & Jemain, A.A. 2008. Tracing trends in the sequences of dry and wet days over Peninsular Malaysia. Journal of Environmental Science and Technology 1(3): 97-110.
Gupta, V.K. & Waymire, E. 1990. Multiscaling properties of spatial rainfall and river flow distributions. Journal of Geophysical Research 95(d3): 1999-2009.
Kao, S.C. & Govindaraju, R.S. 2007. Probabilistic structure of storm surface runoff considering the dependence between average intensity and storm duration of rainfall events. Water Resources Research 43(6): W06410.
Kao, S.C. & Govindaraju, R.S. 2008. Trivariate statistical analysis of extreme rainfall events via the Plackett family of copulas. Water Resources Research 44(2): W02415.
lebel, T. & Ali, A. 2009. Recent trends in the central and western Sahel rainfall regime (1990-2007). Journal of Hydrology 375(1-2): 52-64.
Palynchuk, B. & Guo, Y. 2008. Threshold analysis of rainstorm depth and duration statistics at Toronto, Canada. Journal of Hydrology 348(3-4): 535-545.
Restrepo-Posada, P.J. & Eagleson, P.S. 1982. Identification of independent rainstorms. Journal of Hydrology 55(1-4): 303-319.
Singh, V.P. & zhang, l. 2007. idf curves using the frank Archimedean copula. Journal of Hydrologic Engineering 12: 651-662.
Suhaila, J. & Jemain, A.A. 2009. investigating the impacts of adjoining wet days on the distribution of daily rainfall amounts in Peninsular Malaysia. Journal of Hydrology 368(1-4): 17-25.
Vanderberghe, S., Verhoest, N.E.C., onof, C. & de Baets, B. 2011. A comparative copula-based bivariate frequency analysis of observed and simulated storm events: A case study on bartlett-lewis modeled rainfall. Water Resources Research 47(7): W07529.
Villarini, G., Smith, J.A., Baeck, M.l., Vitolo, R., Stephenson, d.B. & Krajewski, W.f. 2011. on the frequency of heavy rainfall for the midwest of the united States. Journal of Hydrology 400(1-2): 103-120.
Wan zin, W.z., Jamaludin, S., deni, S.M. & Jemain, A.A. 2010. Recent changes in extreme rainfall events in Peninsular Malaysia: 1971-2005. Theoretical and Applied Climatology 99(3): 303-314.
zhang, l. & Singh, V.P. 2007. Bivariate rainfall frequency distributions using Archimedean copulas. Journal of Hydrology 332(1-2): 93-109.
School of Mathematical Sciencesfaculty of Science and Technologyuniversiti Kebangsaan Malaysia 43600 Bangi, Selangor Malaysia
*Corresponding author; email: [email protected]
Received: 17 october 2011Accepted: 29 May 2012