comparison of two potato simulation models under climate
TRANSCRIPT

CLIMATE RESEARCHClim Res
Vol. 21: 173–186, 2002 Published June 14
1. INTRODUCTION
Since agricultural production is greatly affected byclimate, any changes in climate which may result fromincreasing concentrations of greenhouse gases in theatmosphere (Mearns 2000) could have dramatic conse-quences for agricultural yield potential. In this study
the effects of climate change on the yield potential ofpotato have been analysed.
The relationship between climate, crop growth andyield is complicated, since a large number of climate,soil, management and crop characteristics are in-volved. In addition, crop growth mainly appears torespond to changing conditions in a non-linear way(Nonhebel 1994). For example, crop yields may de-crease with an increase in temperature variability (i.e.temperatures more often outside of the optimum rangefor crop growth) or rainfall variability (i.e. longer dryspells), as shown by Semenov & Porter (1995) and
© Inter-Research 2002 · www.int-res.com
*Present address: Department of Soil and Land Use,ALTERRA Research Institute, Droevendaalse steeg 3, PO Box 47, 6700 AA Wageningen, The Netherlands. E-mail: [email protected]
Comparison of two potato simulation models under climate change. I. Model calibration
and sensitivity analyses
Joost Wolf*
Group Plant Production Systems, Department of Plant Sciences, Wageningen University, PO Box 430, 6700 AK Wageningen, The Netherlands
ABSTRACT: To analyse the effects of climate change on potato growth and production, both a sim-ple growth model, POTATOS, and a comprehensive model, NPOTATO, were applied. Both modelswere calibrated and tested against results from experiments and variety trials in The Netherlands.The sensitivity of model results to different values of weather variables was determined. The com-parison of the results from both models indicated the sort of conditions in which model results dif-fered and may become less reliable. The average tuber yield level and the inter-annual yield varia-tion in potato experiments were predicted well by NPOTATO, whereas POTATOS sometimescalculated yields that were too high. The fit between yields observed in variety trials on clay soils andsimulated yields from both models was quite good over the last 4 yr of the period 1974–1988. How-ever, in almost all earlier years a considerably lower yield occurred in the trials than was calculated.This yield difference might be caused by factors that were not described by the models (e.g. a changein management). Irrigated tuber yield from both models considerably increased with increases inboth solar radiation and atmospheric CO2, and it had its optimum at the present temperatures inWageningen, The Netherlands. Water-limited yield from both models had a slightly lower tempera-ture optimum, considerably increased with increasing precipitation, atmospheric CO2 and vapourpressure and decreased with increasing wind speed. The main differences between NPOTATO andPOTATOS results were the higher evapo-transpiration and, hence, the stronger yield reduction bywater limitation from NPOTATO, and with irrigation, the lower yields for present conditions and theweaker and stronger yield increases with increasing radiation and atmospheric CO2, respectively,from NPOTATO compared with those from POTATOS.
KEY WORDS: Climate change · Model comparison · Potato · Sensitivity analyses · Simulation model
Resale or republication not permitted without written consent of the publisher
Clim Res 21: 173–186, 2002
Semenov et al. (1996). As a consequence, the effects ofclimate change on crop yield cannot be described interms of simple and average relationships between thetwo. In the last 2 decades methods have been devel-oped for calculating yield levels of crops under well-specified conditions. These methods are based on theapplication of crop growth simulation models, combin-ing knowledge about crop characteristics and theirinteractions with the environment.
In this way, the effects of climate change in the USAon the yields of a large number of main crops, such aswheat, maize, soya bean and alfalfa, and the efficacy ofmanagement responses to climate change have beenexamined (Wilks 1988, Adams et al. 1990, Cooter 1990,Curry et al. 1990, 1995, Easterling et al. 1992a,b, Sin-clair & Rawlins 1993). For potato production in theUSA, only Rosenzweig et al. (1996) investigated theimpacts of climate change. Although effects of climatechange on the yields of a number of crops, such aswheat (Wolf 1993, Nonhebel 1996, Semenov et al.1996), maize (Wolf & Van Diepen 1994, 1995) andgrapevines (Bindi et al. 1996, Bindi & Fibbi 2000), havebeen analysed for Europe, impacts on potato produc-tion have been studied only for Scotland (Peiris et al.1996) and for England and Wales (Davies et al. 1997).
Potato is the only important tuber crop in the EU.Almost 2% of the arable land area in the EU is used forpotato production. This potato area is almost 4% of theland area used for all cereal crops in the EU but thetuber production (in fresh weight) is as large as 20% ofthe total grain production of cereal crops in the EU(FAO [Food and Agriculture Organization of the UnitedNations] statistical data bases1). Within a recent EU-project (CLIVARA), the effects of climate change andclimatic variability on the growth and yield of 4 cropspecies (e.g. potato) in Europe were analysed (Downinget al. 2000). The climate change impacts on potato werestudied at the site and regional scales (i.e. the presentstudy and Wolf 2000a,b), the national scale (GreatBritain: Butterfield et al. 2000; Finland: Carter et al.2000; Hungary: Harnos et al. 2000; Denmark: Olesen etal. 2000) and the European scale (Harrison et al. 2000).
A detailed potato model, NPOTATO, developedwithin the CLIVARA project, was applied within thisclimate change impact study under European condi-tions. This model was first calibrated and tested againstresults from potato trials. Subsequently, the sensitivityof tuber production of potato to separately changedweather variables was determined. These analyseswere also done with a more simplified model,POTATOS. Both models were also applied to analysethe possible effects of climate change, change in cli-
matic variability and change in crop management in re-sponse to climate change on tuber production of potatoat a number of sites in Europe (Wolf 2002 this issue).
2. METHODOLOGY
NPOTATO contains more elaborate descriptions ofcrop growth, assimilate allocation, leaf area expansion,phenology, senescence of crop organs, water balance,sink limitation, stress effects on assimilate productionand allocation and on senescence than POTATOS. Aschematic of both models and their main differences isshown in Fig. 1. The main characteristics of both mod-els and their input data requirements are described inthe following.
2.1. POTATOS
The growth simulations with POTATOS are conductedfrom crop emergence to maturity and are carried out intime steps of 1 d. POTATOS can simulate both potatogrowth under optimal nutrient and water supply (i.e.with irrigation), taking into account the climatic condi-tions, and growth without irrigation, also considering theamount of available soil water. More information on thebasic concepts of POTATOS and a number of applica-tions of this model are given by Spitters (1990), Kooman(1995) and Kooman & Spitters (1995).
2.1.1. Crop growth
Daily growth is computed as radiation interceptionmultiplied by a specified radiation use efficiency(RUE). The radiation interception is calculated fromincoming radiation and the fractional radiation inter-ception (FINT). FINT is determined by leaf areaexpansion after crop emergence and senescence ofleaves near maturity. RUE is corrected for sub-optimaltemperatures and soil water contents and for a changein atmospheric CO2 concentration. Optimum day tem-peratures are between 16 and 24°C (Kooman 1995),and outside of this range RUE is reduced linearly withtemperature. If the available soil water in the root zonebecomes limiting for crop transpiration, RUE and thuscrop growth are reduced proportionally to the reduc-tion in transpiration.
2.1.2. Crop phenology and assimilate allocation
The initial increase in FINT, the date of tuber initia-tion, and the decrease in FINT by canopy senescence
174
1FAOSTAT database collections on food balances, land useand irrigated areas (http://apps.fao.org)

Wolf: Comparison of two potato simulation models under climate change. I
are all determined by variety-specific temperaturesum requirements (°C d) from crop emergence (Spit-ters 1990, Kooman & Spitters 1995), and the last twomay be determined by day length too (Kooman 1995).A fraction of total biomass that increases with thermaltime (°C d) from tuber initiation is allocated to thetubers. However, dry matter partitioning among plantorgans and leaf weight increase and leaf area expan-sion are not explicitly calculated in POTATOS.
Late varieties in POTATOS differ from the early onesby the increased temperature sum requirement to ini-tiate tuber filling, by a reduced increase in tuber frac-tion against thermal time, and by an increased temper-ature sum requirement for final canopy senescence(Spitters 1987). In this way the late varieties start tuberfilling at a later date and are able to maintain foliageand produce biomass over a longer period. This resultsin a larger final biomass but in a lower fraction of bio-mass in the tubers.
2.1.3. Water balance
The available amount of soil water in the root zone iscalculated from the water balance, which includes pre-cipitation, irrigation, losses by runoff, soil evaporation,crop transpiration, and leaching from the root zone.Potential rates of soil evaporation and crop transpira-tion are calculated using the Penman approach (Frère
& Popov 1979). The actual transpiration rate is calcu-lated from its potential rate by correction for thedegree of radiation interception by the crop and theavailable soil water content in the root zone (Supit etal. 1994). The actual evaporation rate is calculatedfrom its potential rate by correction for the degree ofradiation interception by the soil and the time since itlast rained (Ritchie 1972).
2.1.4. Direct effects of increased atmospheric CO2
Doubling of the ambient atmospheric CO2 concen-tration results in observed biomass increases of 20 to30% for potato (Dijkstra et al. 1995, Miglietta et al.1998, Schapendonk et al. 2000). This CO2 effect mayvary depending on the degree of sink limitation andthe resulting down-regulation of the CO2 assimilationbetween nil and about 40% increase in biomass (Sageet al. 1989, Wheeler et al. 1991, Van de Geijn & Dijk-stra 1995). Sink limitation is strongest at high radiationlevels, a long day length, which results in retardedtuber filling, and low soil temperatures. In POTATOS,RUE increases by 20% with a doubling of ambientCO2, assuming a small sink limitation, and FINT doesnot change with CO2 enrichment, as observed in alarge number of potato experiments under elevatedCO2 within the EU-CHIP project (Wolf 2000c). Thepotential transpiration is reduced by 5% for a doubling
175
Fig. 1. Schematic of the calculation of crop growth. Left: POTATOS model based on light interception, light use efficiency andharvest index. Right: NPOTATO model based on the light profile within the canopy, photosynthesis and respiration characteris-
tics, and dry matter partitioning; LAI: leaf area index. Source: Spitters (1990)

Clim Res 21: 173–186, 2002
of ambient CO2, representing a large decrease instomatal conductance, which is largely nullified bymicrometeorological feedback (Goudriaan & Unsworth1990, Morison 1993).
2.2. NPOTATO
The simulation of potato growth and water and nitro-gen dynamics is carried out from planting to maturityin time steps of 1 d. NPOTATO comprises submodelsthat simulate crop growth, phenological development,nitrogen uptake by the crop, soil nitrogen dynamicsand soil moisture dynamics. The principles of the orig-inal model for winter wheat, NWHEAT, and its appli-cation for analysing soil nitrogen supply and nitrogenuptake by the crop during the growth period and forimprovement of nitrogen application methods, werediscussed by Groot & De Willigen (1991) and Groot &Spiertz (1991). A complete description of NWHEATwas given by Groot (1987, 1993). NPOTATO differsmainly from NWHEAT with respect to crop phenologyand dry matter allocation, based largely on the workby Kooman (1995) and Spitters (1990).
2.2.1. Crop growth
Simulation of crop growth is done in the way de-scribed by Spitters et al. (1989); this approach is, forexample, applied in the SUCROS model (Van Laar etal. 1997). Gross assimilation of the canopy is calculatedas a function of the leaf area index, the radiation distri-bution in the canopy and the photosynthesis-lightresponse curve of individual leaves. The maximum ofthis response curve increases with increasing nitrogencontent in the leaves (Van Keulen & Seligman 1987)and with increasing atmospheric CO2, and it is reducedfor sub-optimal temperatures. Maintenance require-ments, calculated as a function of crop weight andchemical composition (Penning de Vries 1975), aresubtracted from daily gross assimilation. The remain-ing assimilates are allocated to the different croporgans. If the available soil water in the rooted soil lay-ers becomes limiting for crop transpiration, the assimi-late production is reduced proportionally to the reduc-tion in transpiration.
2.2.2. Crop phenology and assimilate allocation
The rate of phenological development is mainlydetermined by the ambient temperatures, and thisrelationship is cultivar-specific. Between emergenceand tuber initiation the effect of day length is also
important (Kooman 1995), and NPOTATO accounts forthis effect, resulting in an advanced tuber initiationunder short days. The allocation of available assimi-lates to the different crop organs changes over timeand depends on the phenological development of thecrop.
After tuber initiation, the fraction of assimilates allo-cated to the tubers increases with the rate of potentialtuber growth and with increasing water stress or nitro-gen shortage (Kabat et al. 1995), resulting in a largerfinal harvest index. Hence, the reduction of tuberyields by these stresses is smaller than the correspond-ing decrease in biomass production. Temperatures thatare low or high compared to the small optimal range(16 to 22°C) for tuber growth (Kooman 1995) have anopposite effect, resulting in a smaller harvest index. Atthe end of the crop growth period, vegetative plantorgans die rapidly and a considerable part of their car-bon and nitrogen is translocated to the tubers. Latepotato varieties differ from the early ones by both theincreased temperature sum requirement to initiatetuber filling and the increased life span of the leaves(Spitters 1987).
2.2.3. Water balance
The soil is treated as a multi-layered system. Foreach layer, changes in soil water content are the resultof infiltration, soil evaporation, crop transpiration, anddownward movement to the lower layer. If precipita-tion occurs, the first layer is filled to field capacity.Excess water drains to the next layer, which is alsofilled to maximum field capacity. This procedure isrepeated for the deeper layers as long as there isexcess water. Upward movement of water, for exam-ple, by capillary rise from ground water, is not calcu-lated by the model.
Potential soil evaporation is calculated using thePenman approach (Frère & Popov 1979) and potentialcrop transpiration by the Penman or Penman-Monteithapproach (Smith 1992). The actual transpiration rate iscalculated from its potential rate by correction for thedegree of radiation interception by the canopy and theavailable soil water content in the rooted soil layers(Supit et al. 1994). The actual evaporation is calculatedfrom its potential rate by correction for the degree ofradiation interception by the soil and the soil moisturecontent in the top layer (Van Keulen 1975).
2.2.4. Nitrogen uptake
Crop nitrogen demand is based on the concept ofnitrogen deficiency (i.e. the degree that actual nitro-
176

Wolf: Comparison of two potato simulation models under climate change. I
gen concentrations in crop organs are below theirmaximum possible values). The actual nitrogen uptakeproceeds according to crop demand as long as theamount of mineral nitrogen in the soil is not limiting.This amount of mineral nitrogen depends on fertilizernitrogen application, nitrogen in rainfall, decomposi-tion of old (humus) and fresh organic matter (cropresidues), crop nitrogen uptake and downward move-ment of nitrogen by leaching. After the start of tuberfilling, crop nitrogen is translocated from the canopyto the tubers. Limiting nitrogen supply results inlower leaf nitrogen concentration and photosyntheticcapacity.
2.2.5. Direct effects of increased atmospheric CO2
Effects of CO2 enrichment were incorporated in themodel by increasing the maximum value and the initialangle of the photosynthesis-light response curve ofsingle leaves, by increasing the thickness of leaves,and by decreasing the stomatal conductance. Thesechanges in model parameters were based on experi-mental results for potato under CO2 enrichment bySage et al. (1989), Dijkstra et al. (1995) and Schapen-donk et al. (2000) and on more general studies onthe responses of photosynthesis and transpiration toCO2 enrichment by Goudriaan (1990), Goudriaan &Unsworth (1990) and Morison (1993).
2.3. Data requirements for both models
For application of both models, data that specify cropgrowth, phenological development and assimilateallocation are required. For POTATOS, these datawere mainly based on work by Spitters (1990). ForNPOTATO, data that determine phenological develop-ment, assimilation and respiration processes, dry mat-ter allocation to and death rate of plant organs, and thetemperature sensitivity of various growth processeswere mainly based on studies by Spitters (1990),Kooman (1995) and Boons-Prins et al. (1993).
Daily minimum and maximum air temperatures,atmospheric CO2 concentration and solar radiation arerequired for both models to calculate CO2 assimilationrates and crop growth (Goudriaan & Van Laar 1978).To calculate the components of the water balance,daily precipitation, wind speed and vapour pressureare also required. Historical or generated sets of dailyweather data over a period of about 30 yr were used.
To calculate the soil water balance, the soil physicalcharacteristics must be known. For POTATOS, theseare maximum rooted soil depth, soil moisture charac-teristics such as soil porosity and volumetric moisture
contents at field capacity and wilting point for therooted soil, and the fraction of precipitation lost by sur-face runoff. For NPOTATO, the required characteris-tics are the texture class for each soil layer, maximumrooted soil depth and soil moisture characteristics foreach texture class. To calculate organic matter decom-position and nitrogen mineralisation with NPOTATO,initial amounts of old and fresh organic matter, theirrelative decomposition rates and carbon and nitrogencontents must be known. To calculate the amount ofsoil mineral nitrogen, the initial amount of mineralnitrogen in each layer and the inputs of nitrogen inprecipitation and fertilizer applications are also re-quired. The limited soil information for POTATOS canbe derived from the European soil map (King et al.1995), but the detailed information for NPOTATOrequires field trials with elaborate soil sampling andanalyses.
3. RESULTS
Both models were calibrated and tested againstresults from a number of potato experiments and vari-ety trials in The Netherlands. For analysis of the possi-ble effects of climate change, the sensitivity of mod-elled tuber production of potato to separately changedvalues of weather variables was determined.
3.1. Model calibration and validation
Results from potato experiments at Varsseveld, TheNetherlands, and from variety trials on both clay andsandy soils were compared with simulated results fromboth models.
3.1.1. Experiments at Varsseveld
Field experiments with a number of potato varietieswere carried out on sandy soils with a high organicmatter content at Varsseveld. Data on biomass produc-tion, assimilate distribution between crop organs, leafarea, and crop husbandry and dates of planting, emer-gence and harvest were available, but no soil physicaland weather data. Hence, maximum available soilwater was estimated based on qualitative soil informa-tion and historical weather data from Wageningen(50 km west of Varsseveld) were used. No irrigationwas applied and nutrient supply was presumed to besufficient to prevent nutrient limitation of crop growth.The trials were carried out in the years 1968, 1969,1971, 1972 and 1973. Further information about thesetrials can be found in Caesar et al. (1981) and Gmelig
177

Clim Res 21: 173–186, 2002
Meyling & Bodlaender (1981). A large part of the data-set is given by Boons-Prins et al. (1993).
Observed tuber yields for different varieties duringthe 5 years were compared with yields calculated withboth models for both mid and late varieties and withand without irrigation (Fig. 2). The difference betweenthe simulated and observed yields was considerablefor irrigated production, in particular for POTATOS.This indicated that tuber yields were limited by watersupply. The difference between simulated tuber pro-duction without irrigation and observed yield data wassmall, particularly for NPOTATO. The average tuberyield and the inter-annual variation in tuber yield werepredicted well by NPOTATO, but the water-limitedyields from POTATOS were sometimes too high.
3.1.2. Variety trials
Trials with a large number of potato varieties havebeen conducted over many years in different parts ofThe Netherlands. Information on measured tuber yield,potato variety, location and soil type are available fromthese trials. The cultivated varieties has changed overtime, and hence, only the average of the yields of all va-rieties cultivated at a given location could be comparedwith the simulated yields. The only exception was theBintje variety, which was grown on different soils andlocations over a period of more than 20 yr.
Observed tuber yields on clay soils at Dronten in thecentral polders of The Netherlands were compared
with simulated yields from both models for the samelocation (Fig. 3). This showed that average yield andinter-annual yield variation of the average of all vari-eties were almost identical to average yield and yieldvariation of the Bintje variety. It also showed that watersupply was not limiting production in the trials, as canbe seen in the results for the relatively dry years 1975,1976, 1983 and 1986 (Fig. 3B: in these years simulatedyields without irrigation were lower than the yieldsunder irrigated conditions, whereas such a yield re-duction did not occur in the trial). Hence, simulationswith irrigation were used for comparison with the trialresults. The fit between observed and simulated yieldswith irrigation from both models was good over the last4 yr. However, in almost all years before 1985 a consid-erably lower yield occurred in the trials than was cal-culated with both models for an irrigated crop. Theinter-annual yield variation simulated with NPOTATOfor both irrigated and water-limited production wasessentially similar to that simulated with POTATOS.Note that POTATOS used a lower value for RUE thanNPOTATO. This was due to the simple calculationmethod for radiation interception in POTATOS, whichsometimes resulted in overestimated interceptionvalues.
Observed tuber yields on sandy soils at Wageningenwere compared with simulated yields from the 2 mod-els for the same location (Fig. 4). These results alsoshowed that average yield and inter-annual yield vari-ation of the average of all varieties were almost identi-cal to average yield and yield variation of the Bintje
178
Fig. 2. Tuber yields of potato calculated (Calc.) with NPOTATO (NPOT) and POTATOS (POTS) (both with RUE = 3.0) for mid and late varieties at Varsseveld (A) with and (B) without irrigation and actual tuber yields for different varieties
A B

Wolf: Comparison of two potato simulation models under climate change. I
variety. Water supply probably did not limit yield onthe sandy soil (see Fig. 4B, year 1986), and hence, sim-ulations with irrigation were used for comparison withthe trial results. Even with an RUE of 2.5 (g dry matterMJ–1 PAR [photosynthetically active radiation]), simu-lated yields from both models corresponded with
observed yields in only a few years (Fig. 4A). This indi-cated that the simulated yield level can be attained onsandy soils. However, unknown factors resulted in alower observed mean yield level and a larger yieldvariability on sandy soils than on clay soils (Fig. 3) andin a larger difference between simulated and mea-
179
Fig. 3. Tuber yields of potato calculated (Calc.) with NPOTATO (NPOT.) and POTATOS (POTA.) for mid variety at Dronten(A) with and (B) without irrigation, for different values of the radiation use efficiency (RUE) and available soil water (soil w.), and
actual tuber yields of the Bintje variety and average yields of all potato varieties in field trials on clay soil
Fig. 4. Tuber yields of potato calculated (Calc.) with NPOTATO (NPOT.) and POTATOS (POTA.) for mid variety at Wageningen(A) with and (B) without irrigation, and for different values of RUE and available soil water (soil w.), and actual tuber yields of the
Bintje variety and average yields of all potato varieties in field trials on sandy soil
A B
A B

Clim Res 21: 173–186, 2002
sured yields. The inter-annual yield variation simu-lated with NPOTATO for irrigated and water-limitedproduction at Wageningen (Fig. 4) was similar to thatsimulated with POTATOS. As both models used anidentical value for RUE, the average yield level washigher for POTATOS due to overestimated radiationinterception than for NPOTATO.
3.2. Sensitivity analyses
For both irrigated and water-limited potato produc-tion in Wageningen the sensitivity of model results tosystematic changes in climate were analysed. Themain characteristics of the climate in Wageningen dur-ing the growth period of potato (from end of May tohalf September) are the following: mean minimum andmaximum temperatures of respectively about 10 and20°C; daily mean irradiation of 12 to 18 MJ m–2 (de-creasing from June to September); and a monthlymean rainfall of about 75 mm. Growth simulationswere conducted with both NPOTATO and POTATOSover a time period of 20 yr (1970–1989) for a historicalclimate dataset from Wageningen. Weather variablesin this dataset were adjusted independently, in a step-wise manner, in order to gauge the sensitivity of modelresults to changing values of each variable. Sensitivityto changes in the following variables were analysed:temperature, atmospheric CO2 concentration, rainfall,solar radiation, vapour pressure and wind speed. Val-ues for each output variable are the mean result of20 yr of growth simulations.
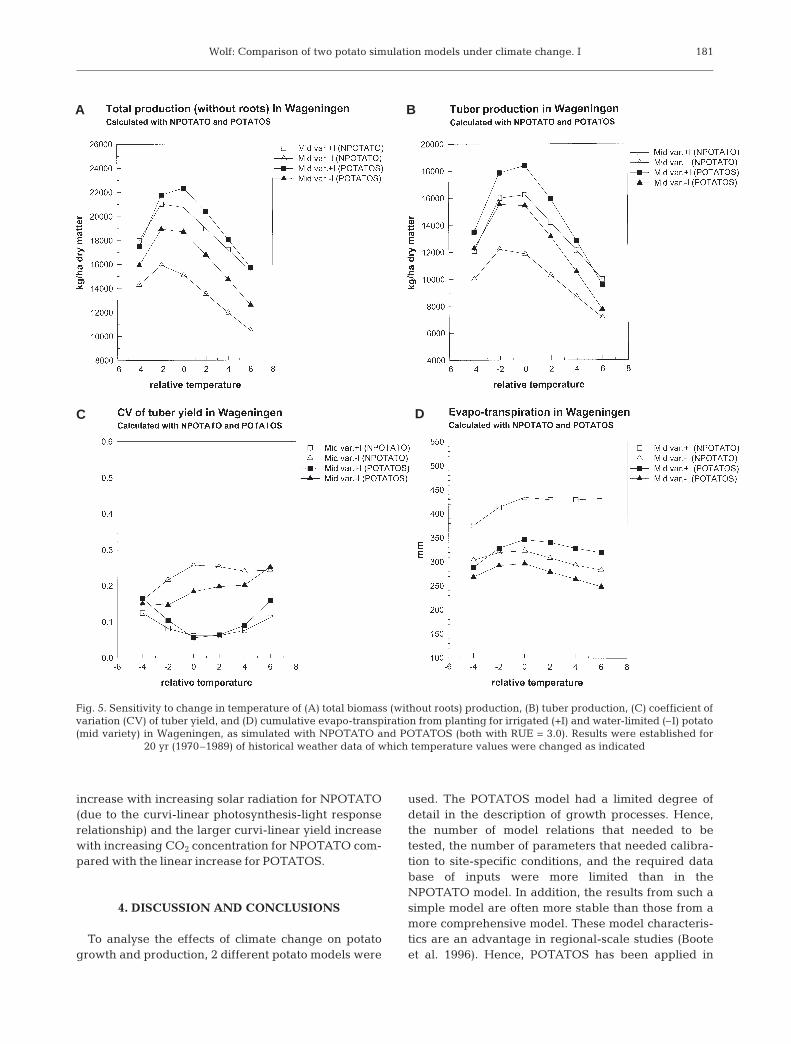
The optimum temperature for irrigated total biomassand tuber production was encompassed by presentconditions in Wageningen for both models, and it wasslightly lower than present temperatures for water-limited production (Fig. 5A,B). Temperature risecaused an accelerated death of leaves and, thus,advanced the end of growth. In addition, more dayswith a reduced assimilation rate and tuber growth rateoccurred at high temperatures. This resulted in a lowerbiomass and tuber production. A decrease in tempera-ture also caused lower yields, partly because therewere more days with a reduced assimilation andgrowth rate at low temperatures and partly because ofthe reduced length of the growing season. The sensi-tivity of total biomass and tuber yields to temperaturechange from both models was almost identical. Themain differences were the higher irrigated yields atoptimum temperature (because of overestimated radi-ation interception), the stronger increase in yield to itsoptimum due to temperature change, and the weakeryield reduction for water-limited production (due tolower evapo-transpiration; Fig. 5D) from POTATOS, incomparison to NPOTATO.
The coefficient of variation (CV) of the tuber yields,which indicates the degree of inter-annual yield varia-tion, was lowest when the crop was irrigated andincreased with both increases and decreases in tem-perature (Fig. 5C). This indicated that yield variabilityincreased if temperatures were too low and limited thelength of the growing season and if temperatures weretoo high and caused advanced leaf death and weresub-optimal for assimilation and tuber growth. Forwater-limited production CV values were higher (i.e.indication of yield sensitivity to water shortage), partic-ularly for NPOTATO due to the higher evapo-transpi-ration (Fig. 5D), but the CV was practically not sensi-tive to temperature. Cumulative evapo-transpirationhad a maximum close to that for the present tempera-ture regime, which was due mainly to the length of theeffective growth period. In NPOTATO evapo-transpi-ration was calculated with the Penman-Monteithmethod (Smith 1992), which gave higher evapo-tran-spiration values than the Penman approach (Frère &Popov 1979) in POTATOS. In the subsequent applica-tions of POTATOS (Wolf 2002) a factor has been incor-porated to correct for the lower Penman estimate.
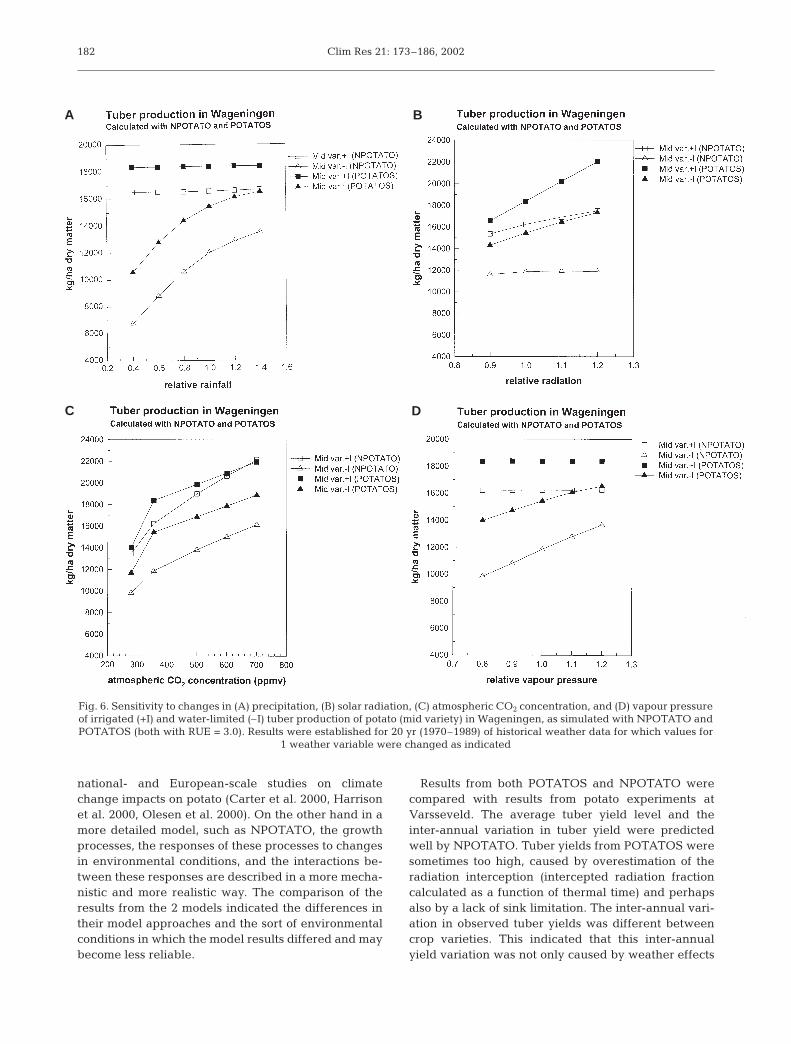
Tuber production considerably increased with theamount of precipitation when no irrigation was applied(Fig. 6). The amount of soil water available to a potatocrop is rather limited, owing to its relatively shallow root-ing depth (i.e. 50 cm). This explains the strong sensitiv-ity of potato production to precipitation. Note that in thevariety trials at Wageningen, water supply did not limitthe potato yields (see above). This was probably due tohigh groundwater levels and the resulting capillary rise,which were not taken into account in these sensitivityanalyses. Irrigated tuber production considerably in-creased with the amount of radiation and atmosphericCO2 concentration as long as atmospheric CO2 was lessthan twice the ambient CO2 concentration. For water-limited production the yield sensitivity to radiation wassmaller than that for irrigated production (i.e. moderateyield increase from POTATOS and no yield change fromNPOTATO) as a result of increasing water limitationwith increasing radiation. The vapour pressure deficitand, thus, evapo-transpiration were reduced withincreasing vapour pressure. This resulted in fewergrowth days with water stress and, thus, in a highertuber yield, but only if no irrigation water was applied.The opposite occurred with increasing wind speed, i.e.evapotranspiration increased, which reduced tuberyields. The sensitivity of tuber production to theseweather variables and atmospheric CO2 concentrationwas almost the same for NPOTATO and POTATOS. Themain differences between NPOTATO and POTATOS re-sults were the higher irrigated yields and the smalleryield reduction for water-limited production fromPOTATOS. Other differences were the smaller yield
180
Wolf: Comparison of two potato simulation models under climate change. I
increase with increasing solar radiation for NPOTATO(due to the curvi-linear photosynthesis-light responserelationship) and the larger curvi-linear yield increasewith increasing CO2 concentration for NPOTATO com-pared with the linear increase for POTATOS.
4. DISCUSSION AND CONCLUSIONS
To analyse the effects of climate change on potatogrowth and production, 2 different potato models were
used. The POTATOS model had a limited degree ofdetail in the description of growth processes. Hence,the number of model relations that needed to betested, the number of parameters that needed calibra-tion to site-specific conditions, and the required database of inputs were more limited than in theNPOTATO model. In addition, the results from such asimple model are often more stable than those from amore comprehensive model. These model characteris-tics are an advantage in regional-scale studies (Booteet al. 1996). Hence, POTATOS has been applied in
181
Fig. 5. Sensitivity to change in temperature of (A) total biomass (without roots) production, (B) tuber production, (C) coefficient ofvariation (CV) of tuber yield, and (D) cumulative evapo-transpiration from planting for irrigated (+I) and water-limited (–I) potato(mid variety) in Wageningen, as simulated with NPOTATO and POTATOS (both with RUE = 3.0). Results were established for
20 yr (1970–1989) of historical weather data of which temperature values were changed as indicated
A B
C D
Clim Res 21: 173–186, 2002
national- and European-scale studies on climatechange impacts on potato (Carter et al. 2000, Harrisonet al. 2000, Olesen et al. 2000). On the other hand in amore detailed model, such as NPOTATO, the growthprocesses, the responses of these processes to changesin environmental conditions, and the interactions be-tween these responses are described in a more mecha-nistic and more realistic way. The comparison of theresults from the 2 models indicated the differences intheir model approaches and the sort of environmentalconditions in which the model results differed and maybecome less reliable.
Results from both POTATOS and NPOTATO werecompared with results from potato experiments atVarsseveld. The average tuber yield level and theinter-annual variation in tuber yield were predictedwell by NPOTATO. Tuber yields from POTATOS weresometimes too high, caused by overestimation of theradiation interception (intercepted radiation fractioncalculated as a function of thermal time) and perhapsalso by a lack of sink limitation. The inter-annual vari-ation in observed tuber yields was different betweencrop varieties. This indicated that this inter-annualyield variation was not only caused by weather effects
182
Fig. 6. Sensitivity to changes in (A) precipitation, (B) solar radiation, (C) atmospheric CO2 concentration, and (D) vapour pressureof irrigated (+I) and water-limited (–I) tuber production of potato (mid variety) in Wageningen, as simulated with NPOTATO andPOTATOS (both with RUE = 3.0). Results were established for 20 yr (1970–1989) of historical weather data for which values for
1 weather variable were changed as indicated
A
C D
B

Wolf: Comparison of two potato simulation models under climate change. I
on crop growth, but also by other factors (e.g. pests,diseases, premature leaf death, and losses due to poorharvesting conditions) that were not incorporated inthe models.
Observed yields from variety trials on clay soils inThe Netherlands were compared with simulated yieldsfrom both models for the period 1974–1988. The fitbetween observed and simulated yields with irrigationfrom both models was good over the last 4 yr. However,in almost all the earlier years a considerably loweryield occurred in the trials than was calculated withthe 2 models. As information on these trials was lim-ited, it was not possible to determine why the earlieryields were relatively low. The yield difference mightbe caused by factors that were not described by themodel (e.g. change in crop management and protec-tion or in nutrient supply). These results correspondwell with the conclusions from modelling studies forwinter wheat and potatoes in Denmark (Olesen et al.2000) and for winter wheat in the UK (Landau et al.1998) that, first, crop growth model simulations couldexplain only to a limited extent the inter-annual yieldvariation from the inter-annual variation in weatherconditions and, second, for most crop species in the EUa clear technology trend (i.e. yield increase over time[FAO statistical data bases] due to improved crop vari-eties and crop management) was observed.
Observed yields from variety trials on sandy soils inThe Netherlands were compared with simulated yieldsfrom the 2 models. Simulated yields corresponded wellwith observed yields in only a few years. This indicatedthat the simulated yield can be attained on the sandysoils. However, the observed mean yield level waslower and the yield variability larger than those on aclay soil, and the difference between simulated yieldsfrom both models and observed yields was larger thanon a clay soil. These low yields on sandy soils com-pared with those on clay soils could not be explainedbut might result from a more problematic control ofpests and diseases and/or a less favourable soil roota-bility and nutrient availability. In Denmark, mean cropyields in counties with sandy soils were lower thanthose in counties with loamy soils; this yield differencecould also not be explained (Olesen et al. 2000).
The inter-annual yield variations simulated withNPOTATO for irrigated and water-limited productionin the variety trials on both clay and sandy soils wereessentially similar to those simulated with POTATOS.If both models applied an identical value for radiationuse efficiency, the average yield from POTATOS washigher, mainly due to overestimated radiation inter-ception.
The sensitivity of tuber production to systematicchanges in climate was calculated with both potatomodels for Wageningen. These climate effects that
were largely determined by the model approaches,were already discussed in the sensitivity analyses (Sec-tion 3.2). Hence, mainly the conclusions of these analy-ses are given here. Irrigated tuber production fromboth models considerably increased with increases inboth solar radiation and atmospheric CO2 concentra-tion and had its optimum at present temperaturesin Wageningen. The main differences betweenNPOTATO and POTATOS results for irrigated produc-tion were the lower yields for present conditions, theweaker and stronger increases with increasing radia-tion and atmospheric CO2 concentration, respectively,and the higher evapo-transpiration from NPOTATOcompared with those from POTATOS. Water-limitedproduction from both models had a slightly lowertemperature optimum than present temperatures, con-siderably increased with increases in amount of pre-cipitation, atmospheric CO2 concentration, and vapourpressure, and decreased with an increase in windspeed. The main differences between NPOTATO andPOTATOS results for water-limited production werethe stronger yield reduction by water limitation fromNPOTATO (due to its higher evapo-transpiration),which resulted in a higher CV of tuber yield, and thenil yield change with increasing radiation fromNPOTATO compared with the moderate yield increasefrom POTATOS.
Comparable model analyses of the sensitivity ofpotato production to climate change have been per-formed for both Scotland (Peiris et al. 1996) and differ-ent states in the USA (Rosenzweig et al. 1996). In thecooler climate in Scotland (than in Wageningen) tem-perature rise gave higher tuber yields because of theincreased length of the growing season, whereas in thewarmer climates in the USA, especially in the moresouthern states, temperature rise had a strongly nega-tive effect on tuber yields. These results correspondwell with the sensitivity of tuber production to temper-ature in NPOTATO and POTATOS, which model cal-culated maximum tuber yields at the present tempera-tures in The Netherlands.
Acknowledgements. The author is grateful to all colleagueswithin the EU-project CLIVARA (see Downing et al. 2000) forthe good collaboration and in particular to Elaine Barrow (Cli-matic Research Unit, University of East Anglia, UK) for pro-viding the climate change scenarios. This work was fundedby the Commission of the European Communities’ Environ-ment Programme (contract ENV4-CT95-0154).
LITERATURE CITED
Adams RM, Rosenzweig C, Peart RM, Ritchie JT and 6 others(1990) Global climate change and US agriculture. Nature345:219–223
Bindi M, Fibbi L (2000) Modelling climate change impacts at
183

Clim Res 21: 173–186, 2002
the site scale on grape vine. In: Downing TE, Harrison PA,Butterfield RE, Lonsdale KG (eds) Climate change, cli-matic variability and agriculture in Europe: an integratedassessment. Research report no. 21, EnvironmentalChange Institute, University of Oxford, p 117–134
Bindi M, Fibbi L, Gozzini B, Orlandini S, Miglietta F (1996)Modelling the impacts of future climate scenarios on yieldand yield variability of grapevine. Clim Res 7:213–224
Boons-Prins ER, De Koning GHJ, Van Diepen CA, PenningDe Vries FWT (1993) Crop-specific simulation parametersfor yield forecasting across the European Community.Simulation Reports AB-TPE, no. 32, AB-DLO, Wagenin-gen
Boote KJ, Jones JW, Pickering NB (1996) Potential uses andlimitations of crop models. Agron J 88:704–716
Butterfield RE, Harrison PA, Orr JL, Gawith MJ, Lonsdale KG(2000) Modelling climate change impacts on wheat, potatoand grapevine in Great Britain. In: Downing TE, HarrisonPA, Butterfield RE, Lonsdale KG (eds) Climate change, cli-matic variability and agriculture in Europe: an integratedassessment. Research report no. 21, EnvironmentalChange Institute, University of Oxford, p 265–287
Caesar K, Bodlaender KBA, Hunicken C , Roer L, Umaerus M(1981) Growth of four potato varieties under different eco-logical conditions. Report of a working group of the sec-tion physiology of the European Association for PotatoResearch, Berlin
Carter TR, Saarikko RA, Joukainen SKH (2000) Modelling cli-mate change impacts on wheat and potato in Finland. In:Downing TE, Harrison PA, Butterfield RE, Lonsdale KG(eds) Climate change, climatic variability and agriculturein Europe: an integrated assessment. Research report no.21, Environmental Change Institute, University of Oxford,p 289–312
Cooter EJ (1990) The impact of climate change on continuouscorn production in the southern U.S.A. Clim Change 16:53–82
Curry RB, Peart RM, Jones JW, Boote KJ, Allen LH (1990)Response of crop yield to predicted changes in climate andatmospheric CO2 using simulation. Trans Am Soc AgronEng 33:1383–1390
Curry RB, Jones JW, Boote KJ, Peart RM, Allen LH, PickeringNB (1995) Response of soybean to predicted climatechange in the USA. In: Climate change and agriculture:analysis of potential international impacts. ASA specialpublication number 59, American Society of Agronomy,Madison, p 163–182
Davies A, Jenkins T, Pike A, Shao J, Carson I, Pollock CJ,Parry ML (1997) Modelling the predicted geographic andeconomic response of UK cropping systems to climatechange scenarios: the case of potatoes. Ann Appl Biol 130:167–178
Dijkstra P, Schapendonk AHCM, Van de Geijn SC, Visser A,Rozema J (1995) Interactions between atmospheric CO2
concentration, temperature and environmental factorswith respect to photosynthesis, assimilate distribution anddevelopment rhythm of three agricultural crops. Nota 9,AB-DLO Institute, Wageningen, Free University, Amster-dam
Downing TE, Harrison PA, Butterfield RE, Lonsdale KG (eds)(2000) Climate change, climatic variability and agriculturein Europe: an integrated assessment. Research report no.21, Environmental Change Institute, University of Oxford
Easterling WE, McKenney MS, Rosenberg NJ, Lemon KM(1992a) Simulations of crop response to climate change:effects with present technology and no adjustments (the‘dumb farmer’ scenario). Agric For Meteorol 59:53–73
Easterling WE, Rosenberg NJ, Lemon KM, McKenney MS(1992b) Simulations of crop responses to climate change:effects with present technology and currently availableadjustment (the ‘smart farmer’ scenario). Agric For Meteo-rol 59:75–102
Frère M, Popov GF (1979) Agrometeorological crop monitor-ing and forecasting. FAO Plant Production and ProtectionPaper 17, FAO, Rome
Gmelig Meyling HD, Bodlaender KBA (1981) Varietal differ-ences in growth, development and tuber production ofpotatoes. Neth J Agric Sci 29:113–127
Goudriaan J (1990) Primary productivity and CO2. In: Goudri-aan J, Van Keulen H, Van Laar HH (eds) The greenhouseeffect and primary productivity in European agro-ecosys-tems. Pudoc, Wageningen, p 23–25
Goudriaan J, Unsworth MH (1990) Implications of increasingcarbon dioxide and climate change for agricultural pro-ductivity and water resources. In: Kimball BA, RosenbergNJ, Allen LH, Heichel GH, Stuber CW, Kissel DE (eds)Impact of carbon dioxide, trace gases, and climate changeon global agriculture. ASA Special Publication no. 53,American Society of Agronomy, Crop Science Society ofAmerica, and Soil Science Society of America, Madison,p 111–130
Goudriaan J, Van Laar HH (1978) Calculation of daily totals ofthe gross CO2 assimilation of leaf canopies. Neth J AgricSci 26:373–382
Groot JJR (1987) Simulation of nitrogen balance in a system ofwinter wheat and soil. Simulation Reports CABO-TT no.13, DLO Research Institute for Agrobiology and Soil Fer-tility and Department of Theoretical Production Ecology,Wageningen Agricultural University
Groot JJR (1993) NWHEAT: nitrogen balance in a system ofwinter wheat and soil. In: Engel T, Klöcking B, Priesack E,Schaaf T (eds) Simulationsmodelle zur Stickstoffdynamik,Analyse und Vergleich. Agrarinformatik, Band 25. Ulmer,Stuttgart, p 397–411
Groot JJR, De Willigen P (1991) Simulation of the nitrogenbalance in the soil and a winter wheat crop. Fertil Res 27:261–272
Groot JJR, Spiertz JHJ (1991) The role of nitrogen in yield for-mation and achievement of quality standards in cereals.In: Porter JR, Lawlor DW (eds) Plant growth: interactionswith nutrition and environment. Society for experimentalbiology seminar series, Cambridge University Press, Cam-bridge, p 227–247
Harnos, Z, Bussay A, Harnos N (2000) Modelling climatechange impacts on wheat and potato in Hungary. In:Downing TE, Harrison PA, Butterfield RE, Lonsdale KG(eds) Climate change, climatic variability and agriculturein Europe: an integrated assessment. Research report no.21, Environmental Change Institute, University of Oxford,p 349–364
Harrison PA, Butterfield RE, Orr JL (2000) Modelling climatechange impacts on wheat, potato and grapevine inEurope. In: Downing TE, Harrison PA, Butterfield RE,Lonsdale KG (eds) Climate change, climatic variabilityand agriculture in Europe: an integrated assessment.Research report no. 21. Environmental Change Institute,University of Oxford, p 367–390
Kabat P, Marshall B, Van den Broek BJ (1995) Comparison ofsimulation results and evaluation of parameterizationschemes. In: Kabat P, Marshall B, Van den Broek BJ, VosJ, Van Keulen H (eds) Modelling and parameterizationof the soil-plant-atmosphere system. A comparison ofpotato growth models. Wageningen Press, Wageningen,p 439–501
184

Wolf: Comparison of two potato simulation models under climate change. I
King D, Le Bas C, Daroussin J, Thomasson AJ, Jones RJA(1995) The EU map of soil water available for plants. In:King D, Jones RJA, Thomasson AJ (eds) European landinformation systems for agro-environmental monitoring,EUR 16232, Agriculture series, European Commission,Luxembourg, p 131–141
Kooman PL (1995) Yielding ability of potato crops as influ-enced by temperature and daylength. PhD thesis,Wageningen Agricultural University
Kooman PL, Spitters CJT (1995) Coherent set of models tosimulate potato growth. In: Kabat P, Marshall B, Van denBroek BJ, Vos J, Van Keulen H (eds) Modelling and para-meterization of the soil-plant-atmosphere system. A com-parison of potato growth models. Wageningen Press,Wageningen, p 253–274
Landau S, Mitchell RAC, Barnett V, Colls JJ, Craigon J,Moore KL, Payne RW (1998) Testing winter wheat simula-tion models’ predictions against observed UK grain yields.Agric For Meteorol 89:85–99
Mearns LO (2000) Climatic change and variability. In: ReddyKR, Hodges HF (eds) Climate change and global crop pro-ductivity. CABI Publishing, Wallingford, p 7–35
Miglietta F, Magliulo V, Bindi M, Cerio L, Vaccari FP, LoducaV, Peressotti A (1998) Free air CO2 enrichment of potato(solanum tuberosum L.): development, growth and yield.Global Change Biol 4:163–172
Morison JIL (1993) Response of plants to CO2 under waterlimited conditions. Vegetatio 104/105:193–209
Nonhebel S (1994) The effects of use of average instead ofdaily weather data in crop growth simulation models.Agric Syst 44:377–396
Nonhebel S (1996) Effects of temperature rise and increase inCO2 concentration on simulated wheat yields in Europe.Clim Change 34:73–90
Olesen JE, Jensen T, Bøcher PK (2000) Modelling climatechange impacts on wheat and potato in Denmark. In:Downing TE, Harrison PA, Butterfield RE, Lonsdale KG(eds) Climate change, climatic variability and agriculturein Europe: an integrated assessment. Research report no.21, Environmental Change Institute, University of Oxford,p 313–332
Peiris DR, Crawford JW, Grashoff C, Jefferies RA, Porter JR,Marshall B (1996) A simulation study of crop growth anddevelopment under climate change. Agric For Meteorol79:271–287
Penning de Vries FWT (1975) The cost of maintenance pro-cesses in plant cells. Ann Bot 39:77–92
Ritchie JT (1972) Model for predicting evaporation from arow crop with incomplete cover. Water Resour Res 8:1204–1212
Rosenzweig C, Phillips J, Goldberg R, Carroll J, Hodges T(1996) Potential impacts of climate change on citrus andpotato production in the US. Agric Syst 52:455–479
Sage RF, Sharkey TD, Seemann JR (1989) Acclimation of pho-tosynthesis to elevated CO2 in five C3 species. Plant Phys-iol 89:590–596
Schapendonk AHCM, Van Oijen M, Dijkstra P, Pot CS, JordiWJRM, Stoopen GM (2000) Effects of elevated CO2 con-centration on photosynthetic acclimation and productivityof two potato cultivars grown in open-top chambers. AustJ Plant Physiol 27:1119–1130
Semenov MA, Porter JR (1995) Climatic variability and themodelling of crop yields. Agric For Meteorol 73:265–283
Semenov MA, Wolf J, Evans LG, Eckersten H, Iglesias A(1996) Comparison of wheat simulation models. II.Application of climate change scenarios. Clim Res 7:271–281
Sinclair TR, Rawlins SL (1993) Inter-seasonal variation insoybean and maize yields under global environmentalchange. Agron J 85:406–409
Smith M (1992) Report of expert consultation on revision ofFAO methodologies for crop water requirements. FAO,Land and Water Development Division, Rome
Spitters CJT (1987) An analysis of variation in yield amongpotato cultivars in terms of light absorption, light utiliza-tion and dry matter partitioning. Acta Horticult 214:71–84
Spitters CJT (1990) Crop growth models: their usefulness andlimitations. Acta Horticult 267:349–368
Spitters CJT, Van Keulen H, Van Kraalingen DWG (1989) Asimple and universal growth simulator: SUCROS87. In:Rabbinge R, Ward SA,Van Laar HH (eds) Simulation andsystems management in crop production. SimulationMonographs, Pudoc, Wageningen, p 147–181
Supit I, Hooijer AA, Van Diepen CA (eds) (1994) Systemdescription of the WOFOST 6.0 crop simulation modelimplemented in CGMS, Vol 1: Theory and algorithms.Joint Research Centre of the European Commission, EUR15956, European Commission, Luxembourg
Van de Geijn SC, Dijkstra P (1995) Physiological effects ofchanges in atmospheric carbon dioxide concentration andtemperature on growth and water relations of crop plants.In: Haverkort AJ, MacKerron DKL (eds) Potato ecologyand modelling of crops under conditions limiting growth.Current issues in production ecology, Vol 3. Kluwer Acad-emic Publishers, Dordrecht, p 89–99
Van Keulen H (1975) Simulation of water use and herbagegrowth in arid regions. Simulation Monographs, Pudoc,Wageningen
Van Keulen H, Seligman NG (1987) Simulation of water use,nitrogen nutrition and growth of a spring wheat crop. Sim-ulation Monographs, Pudoc, Wageningen
Van Laar HH, Goudriaan J, Van Keulen H (eds) (1997)SUCROS97: Simulation of crop growth for potential andwater-limited production situations as applied to springwheat. Quantitative approaches in systems analysis No.14, AB-DLO Research Institute & Graduate School for Pro-duction Ecology, Wageningen
Wheeler RM, Tibbitts TW, Fitzpatrick AH (1991) Carbon diox-ide effects on potato growth under different photoperiodsand irradiance. Crop Sci 31:1209–1213
Wilks DS (1988) Estimating the consequences of CO2-inducedclimatic change on North American grain agricultureusing general circulation model information. Clim Change13:19–42
Wolf J (1993) Effects of climate change on wheat productionpotential in the European Community. Eur J Agron 2:281–292
Wolf J (2000a) Modelling climate change impacts at the sitescale on potato. In: Downing TE, Harrison PA, ButterfieldRE, Lonsdale KG (eds) Climate change, climatic variabilityand agriculture in Europe: an integrated assessment.Research report no. 21, Environmental Change Institute,University of Oxford, p 135–154
Wolf J (2000b) Modelling climate change impacts on potato incentral England. In: Downing TE, Harrison PA, ButterfieldRE, Lonsdale KG (eds) Climate change, climatic variabilityand agriculture in Europe: an integrated assessment.Research report no. 21, Environmental Change Institute,University of Oxford, p 239–261
Wolf J (2000c) Analysis of the responses of potato cv. Bintje toelevated CO2 and O3 and assessment of future potatoyields in Europe. In: De Temmerman L, Vandermeiren K,Hacour A (eds) Final report of EU-project CHIP (Changing
185

Clim Res 21: 173–186, 2002
climate and potential impacts on potato yield and quality).Veterinary and Agrochemical Research Centre, Tervuren,p 221–271
Wolf J (2002) Comparison of two potato simulation modelsunder climate change. II. Application of climate changescenarios. Clim Res 21:187–198
Wolf J, Van Diepen CA (1994) Effects of climate change onsilage maize production potential in the European Com-munity. Agric For Meteorol 71:33–60
Wolf J, Van Diepen CA (1995) Effects of climate change ongrain maize yield potential in the European Community.Clim Change 29:299–331
186
Editorial responsibility: Gerd Esser,Gießen, Germany
Submitted: June 11, 2001; Accepted: October 18, 2001Proofs received from author(s): May 17, 2002