comparison of results obtained from the french …...report no. cdot-dtd-r-92-11 comparison of...
TRANSCRIPT
Report No. CDOT-DTD-R-92-11
COMPARISON OF RESULTS OBTAINED FROM THE FRENCH RUTTING TESTER WITH PAVEMENTS OF KNOWN FIELD PERFORMANCE
Timothy Aschenbrener Colorado Department of Transportation 4340 East Louisiana Avenue Denver, Colorado 80222
Final Report October 1992
Prepared in cooperation with the U.S. Department of Transportation Federal Highway Administration
The contents of this report reflect the views of
the author who is responsible for the' facts and
the accuracy of the data presented herein. The
contents do not necessarily reflect the official
views of the Colorado Department of Transportation
or the Federal Highway Administration. This report
does not constitute a standard, specification, or
regulation.
i
ACKNOWLEDGMENTS
The author would l ike to express his gratitude to the
many people who assisted in performing this study_ Kevin
stuart of the FHWA's Turner Fairbank Highway Research
Center provided numerous contributions throughout the
sampling, testing, analysis, and report writing performed
for this project. Werner Hutter performed the search of
the network level pavement management data to identify
the options for site selections. Donna Harmelink and
Skip outcalt performed scheduling and obtained all the
samples used in this study. Kim Gilbert and Cindy Moya
performed all the trimming, testing, tire changing, and
trouble shooting to keep the rutting tester operating.
Special thanks to the expert panel of Colorado asphalt
paving experts who provided numerous ideas and
suggestions which made this study more informational: Bud
Brakey (BCE), Jim Fife (Western Colorado Testing), Darre l
Holmquist (CTL/Thompson), Joe Proctor (Morton/Thiokol ) ,
and Eric West (Western Mobile, Inc.).
ii

Technical Report Documentation Page
1. Report No. CDOT-DTD-R-92-11
2. Government Accession No. 3. Recipient's Catalog No.
4. Title 2nd Subtitle 5. Report Date October 1992
Comparison of Results Obtained from the French Tester with Pavements of Known Performance 6. Performing Organization Code
File No. 10.12
7. Author(s) Tim Aschenbrener and Kevin stuart
9.Performing Organization Name and Address Colorado Department of Transportation 4201 E. Arkansas Avenue Denver, Colorado 80222
12. Sponsoring Agency Name and Address Colorado Department of Transportation 4201 E. Arkansas Avenue Denver, Colorado 80222
15. Supplementary Notes
8.Performing Organization Rpt.No. CDOT-DTD-R-92-11
10. Work Unit No.(TRAIS)
11. Contract or Gr~nt No.
13.Type of Rpt.and Period Covered Final Report
14. Sponsoring Agency Code
Prepared in Cooperation with the U.s. Department of Transportation Federal Highway Administration
16. Abstract The French rutting tester has been used successfully in France to eliminate the occurrence of rutting. The Colorado Department of Transportation (CDOT) and the Turner-Fairbank Highway Research Center (TFHRC) were selected to demonstrate this equipment.
Thirty-three sites across Colorado with good and poor performance and a variety of temperature and traffic conditions were selected. Test results indicated that the French rutting tester, using the French specifications, was overly severe for many of the temperature and environmental conditions encountered in Colorado. However, by adjusting the testing temperature to match the highest temperature at a site location, the French rutting tester did an excellent job of predicting pavement performance. The results from the French rutting tester also had good correlation with actual rutting depths when temperature and traffic levels were considered.
17. Key Words European, testing equipment, hot mix asphalt, permanent deformation
18. Distribution Statement No Restrictions: This report is available to the public through, the National Information Service, springfield, Virginia 22161
19. Security Classif. (of this report) Unclassified
20. Security Classit.(ot this page) Unclassified
21. No. of Pages 73
22. Price
iii
TABLE OF CONTENTS
Page
Section Number
I. INTRODUCTION •.•.••••.••..•••......•..•......••... . . . . . 1
II. EQUIPMENT DESCRIPTION •••••....••.••..•...••...•.• . •... 2
Testing Equipment and Procedures ....••.............. 2
Test Results •..•..•...••.•..•.....••.••............. 3
French Specifications ..••.•.....••••.•••............ 3
stress Conditions ••••......••••••....•....••........ 4
I I I • STUDY APPROACH •••...••..•.....•..•.........•.........• 5
IV. SITE SELECTION .••••••....••••......•.................. 6
Tempera ture .••......•••••.••••......•............... 6
Traffic .... " " " . " .. " .... " ..... " " ................ " " ... 6
Performance ..•••••••••..•...•...........•.........•. 8
Final site Selection ...••........................... 9
V . SAMPLING AND TESTING ••••.•••....•.....•.............. 12
VI. RESULTS AND DISCUSSION OF TESTING ....•••...•..•...••. 12
VII.
VIII.
Repeatabili ty ••••.••••••••.•••...••............•... 13
French Specification •..••••••••...•....•.•......... 15
Temperature Adjustments ••..•••••••...•.•.•......... 16
Modified "Go, No-Go" Specification ..•.............. 20
Prediction of Rutting Depth •..............•........ 22
CONCLUSIONS .•••..•.•......•.•..•.•................... 25
ADDITIONAL RESEARCH .......•...••••............•...... 27
REFERENCES ....•...•......•.•..•••..........•......... 28
iv
LISTS OF TABLES
Table Page
Number Number
1 Specifications for the French Rutting Tester .......... 4
2 Summary of site Conditions by site Number ............. 9
3 sites for French Rutting Tester ............... . ...... 10
4 Results of Replicate Testing for Unacceptable Sites .. 14
5 Results of Replicate Testing for Acceptable Sites .... 14
6 Comparison of French Specification
7
S
9
to Actual Performance .............................. 15
sites with HMMMT from 32 0 to 3SoC .................... IS
sites with HMMMT from 27 0 to 320 C .................... 19
sites with HMMMT Less Than 27 0 C ...................... 20
10 Comparison of Modified Specification
to Actual Performance .............................. 21
11 Coefficients of Determination (r2) for
Predicting Actual Rutting Depths with
French Rutting Tester Results .............. . ... .... 25
Figure
Number
LIST OF FIGURES
Page
Number
1 Test site Locations Listed by City' s Name ............. 11
2 French Rutting Tester VS. Actual Rut Depth ............ 24
(For High Traffic)
3 French Rutting Tester VS. Actual Rut Depth ............ 24
(For Low Traffic)
APPENDICES
Appendix A ...... PHOTOGRAPHS
Appendix B ...... RUTTING DEPTHS VERSUS CYCLES
v

I. INTRODUCTION
In September 1990, a group of individuals representing
AASHTO, FHWA, NAPA, SHRP, AI, and TRB participated in a
two-week tour of six European countries. Information on
this tour has been published in a "Report on the 1990
European Asphalt Study Tour" (1). Several areas for
potential improvement of asphalt pavements were
identified, including the use of performance-related
testing equipment used in several European countries.
Since the French equipment was commercially distributed
and marketed, it was a natural choice for demonstration
in the United States. The Colorado Department of
Transportation (CDOT) and the FHWA Turner-Fairbank
Highway Research Center (TFHRC) were selected to
demonstrate this equipment.
The first priority was to verify the predictive
capabilities of this equipment by performing tests on
mixtures of known field performance. Since the French
rutting tester arrived in February of 1992, rutting was
the initial focus of the testing. Samples of hot mix
asphalt pavements with a history of rutting and of good
performance were identified and tested in the French
rutting tester. The purpose of this report is to present
the results of the correlation of the French rutting
tester and pavements with known performance.
1
II. EQUIPMENT DESCRIPTION
A full description of the French hot mix asphalt (HMA)
design methodology and equipment operation, as followed
by the Laboratoire Central des Ponts et Chaussees (LCPC),
is provided by Bonnot (2). A brief description of the
testing device, operation and results is provided here.
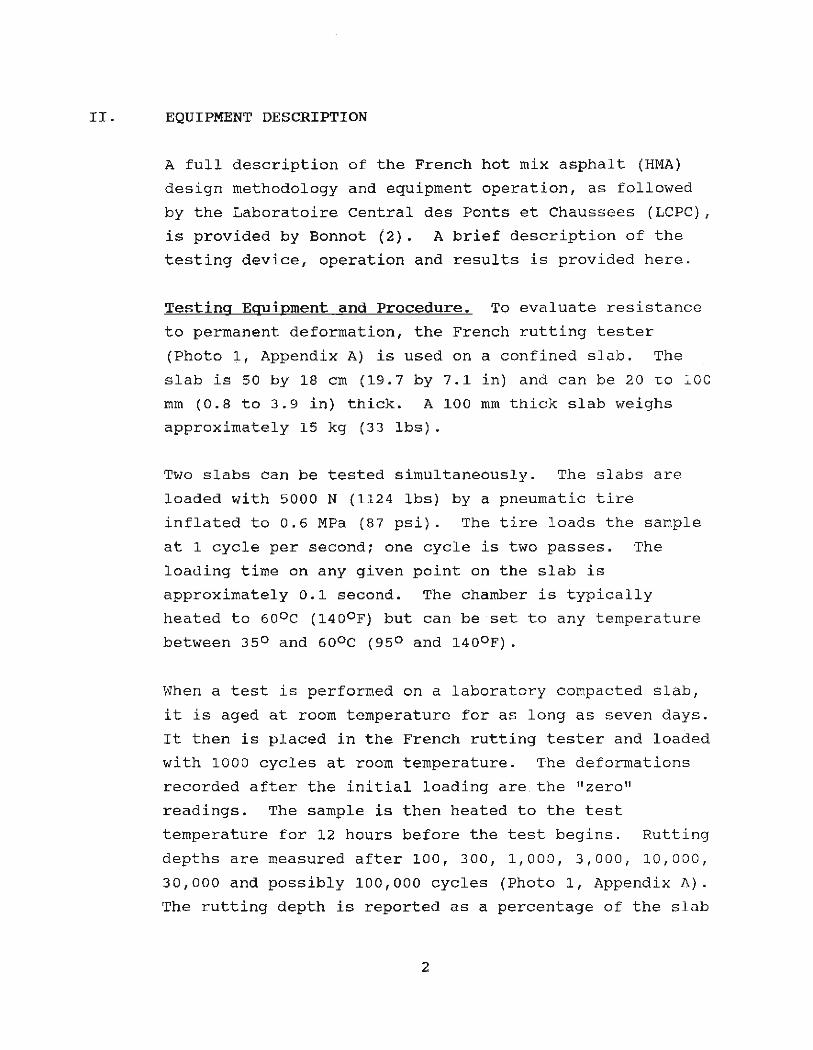
Testing Equipment and Procedure. To evaluate resistance
to permanent deformation, the French rutting tester
(Photo 1, Appendix A) is used on a confined slab. The
slab is 50 by 18 cm (19.7 by 7.1 in) and can be 20 to 100
mm (0.8 to 3.9 in) thick. A 100 mm thick slab weighs
approximately 15 kg (33 lbs).
Two slabs can be tested simultaneously. The slabs are
loaded with 5000 N (1124 lbs) by a pneumatic tire
inflated to 0.6 MPa (87 psi). The tire loads the sample
at 1 cycle per second; one cycle is two passes. The
loading time on any given point on the slab is
approximately 0.1 second. The chamber is typically
heated to 60 0 C (1400 F) but can beset to any temperature
between 35 0 and 60 0 C (95 0 and 1400 F).
When a test is performed on a laboratory compacted slab,
it is aged at room temperature for as long as seven days.
It then is placed in the French rutting tester and loaded
with 1000 cycles at room temperature. The deformations
recorded after the initial loading are . the "zero"
readings. The sample is then heated to the test
temperature for 12 hours before the test begins. Rutting
depths are measured after 100, 300, 1,000, 3,000, 10,000,
30,000 and possibly 100,000 cycles (Photo 1, Appendix A).
The rutting depth is reported as a percentage of the slab
2
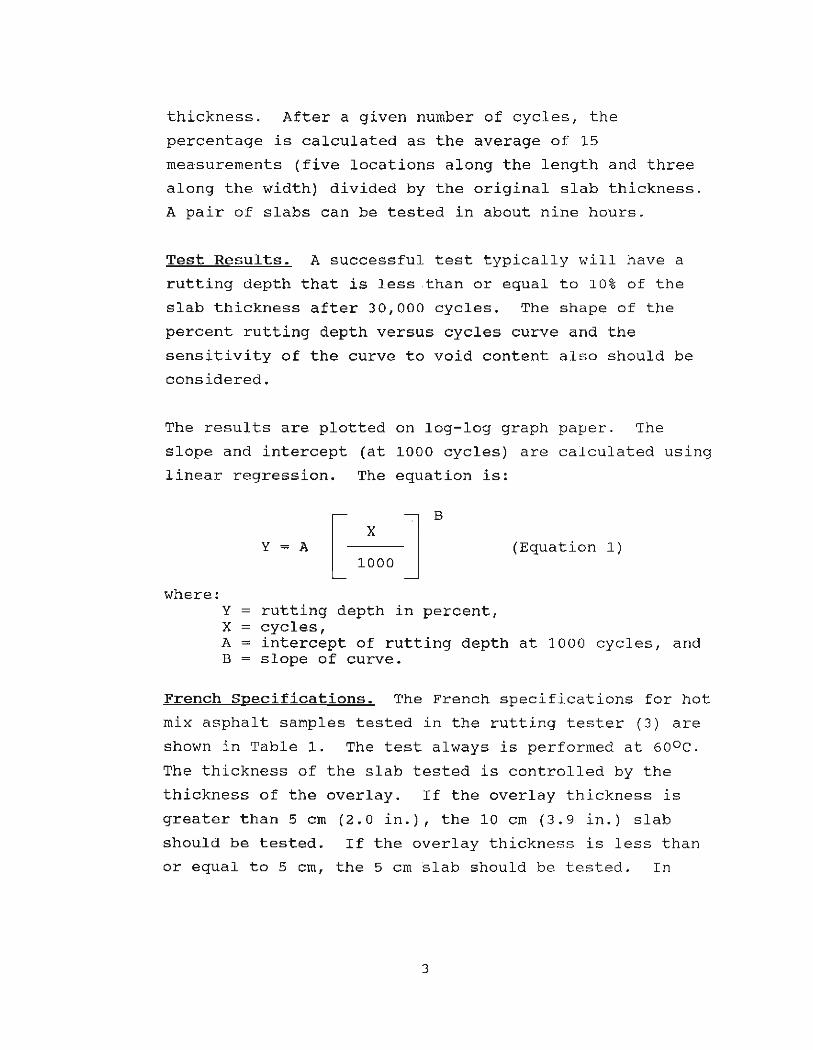
thickness. After a given number of cycles, the
percentage is calculated as the average of 15
measurements (five locations along the length and three
along the width) divided by the original slab thickness.
A pair of slabs can be tested in about nine hours.
Test Results. A successful test typically will have a
rutting depth that is less , than or equal to 10% of the
slab thickness after 30,000 cycles. The shape of the
percent rutting depth versus cycles curve and the
sensitivity of the curve to void content also should be
considered.
The results are plotted on log-log graph paper. The
slope and intercept (at 1000 cycles) are calculated using
l inear regression. The equation is:
where: Y = rutting depth in percent, X = cycles,
(Equation 1)
A = intercept of rutting depth at 1000 cycles, and B = slope of curve.
French Specifications. The French specifications for hot
mix asphalt samples tested in the rutting tester ( 3) are
shown in Table 1. The test always is performed at 60o C.
The thickness of the slab tested is controlled by the
thickness of the overlay. If the overlay thicknes s is
greater than 5 cm (2.0 in.), the 10 cm (3.9 in.) slab
should be tested. If the overlay thickness is less than
or equal to 5 cm, the 5 cm ~lab should be tested. In
3

some instances the design engineer may set more stringent
criteria. For example, if there is very heavy traffic
loads and a grade of 3% to 4%, the rutting depth should
be less than 5% .
stress Conditions. The French rutting tester applies a
5000 N (1124 lb) force onto a pneumatic tire inflated to
0.6 MPa (87 psi). CHEVPC is a pavement analysis program
adopted for personal computers from CHEVNL, a program
originally developed by the Chevron Research Company to
run on mainframe computers. As calculated by CHEVPC,
throughout the thickness of the slab the average
compressive stress in a 100 rom thick slab bel0w the tire
is 0.41 MPa (60 psi), and in a 50 mm thick slab is 0 .55
MPa (80 psi). The French rutting tester can apply
average compressive stresses ranging from 0. 2 8 to 0.6 2
MPa (40 to 90 psi) to a slab.
Table 1. Specifications for the French Rutting Tester
Pavement Pavement Number Maximum Thickness Type of ~
0
Cycles Rutting
Subbase 10,000 < 10 Base
6-8 cm Base Course 30,000 < 10 (2.4-3.1 in. ) Wearing Course
3-4 cm Wearing Course 1,000 < 10 (1.2-1.6 in. ) 3,000 < 20
8-10 cm Base Course 30,000 < 8 (3.1-3.9 in. ) (High modulus for
rut resistance)
4

III. STUDY APPROACH
Three possible approaches were considered for comparing
the French rutting tester results to pavements of known
field performance. The first option involved developing
mixes that pass the testing specification and then
placing the mix on a project. The project would b e
monitored over time. This option will be performed, but
results may not b e available for 5 years .
The second and third options involved testing mixes that
were placed in the past, whose history already has been
determined. The second option involved obtaining field
cores and slabs and testing the original materials from
the pavements of known performance. The flaws in this
option include: the asphalt has aged, air voids have
changed with time, etc.
The third option involved obtaining the original raw
materials from projects of known performance. The
original material would be blended in the laboratory and
tested. The test results would b e compared to the field
performance. The flaws in this approach are readily
identified; the aggregates and asphalts will not b e the
same as those used when the project was constructed. For
example: the crushing operations at the aggregate sources
changei the location and material u sed at the aggregate
sources change over time; some of t he aggregate sources
have been reclaimed; the asphalts (even though from the
same refinery) may be from a different crude source ; and
construction will be difficult to take into consideration
(4) (the mixing efficiency of the plant, the introduction
of baghouse fines, the wasting of fines from a wet
scrubber, construction variability of gradation and
asphalt content, etc. )
5
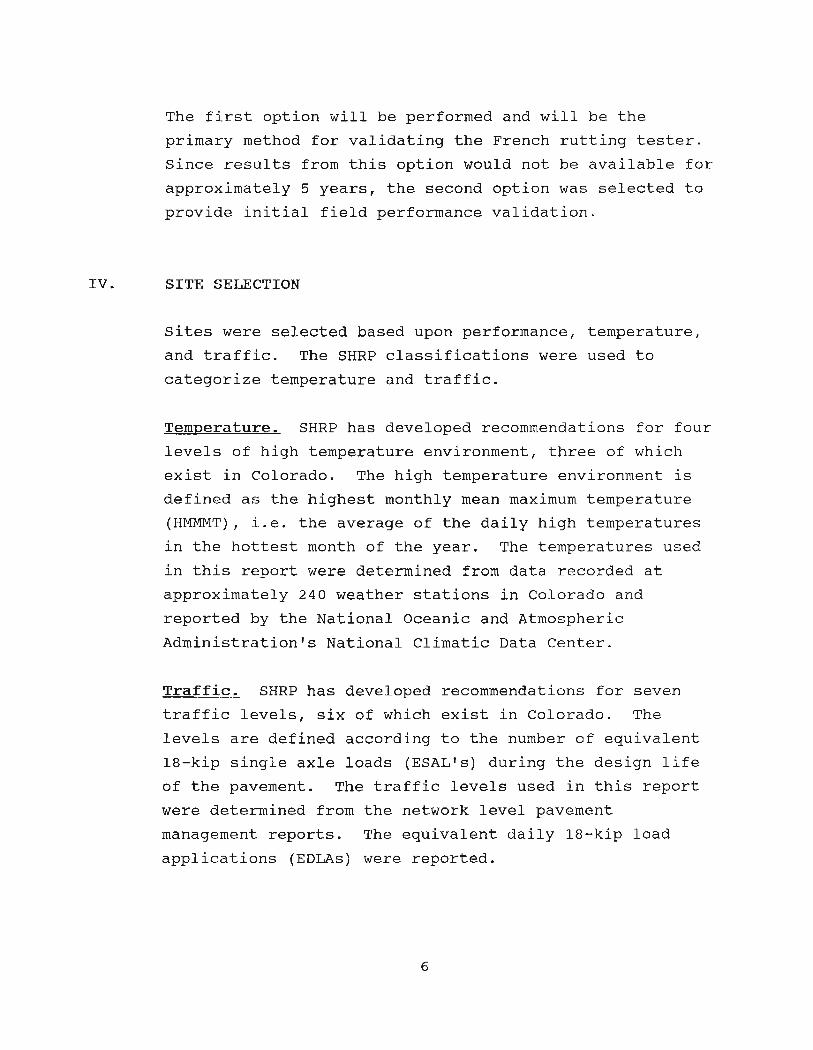
The first option will be performed and will be the
primary method for validating the French rutting tester.
since results from this option would not be available for
approximately 5 years, the second option was selected to
provide initial field performance validation.
IV. SITE SELECTION
sites were selected based upon performance, temperature,
and traffic. The SHRP classifications were used to
categorize temperature and traffic.
Temperature. SHRP has developed recommendations for four
levels of high temperature environment, three of which
exist in Colorado. The high temperature environment is
defined as the highest monthly mean maximum temperature
(HMMMT), i.e. the average of the daily high temperatures
in the hottest month of the year. The temperatures used
in this report were determined from data recorded at
approximately 240 weather stations in Colorado and
reported by the National Oceanic and Atmospheric
Administration's National Climatic Data Center.
Traffic. SHRP has developed recommendations for seven
traffic levels, six of which exist in Colorado. The
levels are defined according to the number of equivalent
18-kip single axle loads (ESAL's) during the design life
of the pavement. The traffic levels used in this report
were determined from the network level pavement
management reports. The equivalent daily 18-kip load
applications (EDLAs) were reported.
6

It is desirable to know the total traffic that has
traveled on each highway. The Average Daily Traffic
(ADT) was not considered appropriate because rutting is
related more to the load applied to the pavement rather
than the number of vehicles. EDLA was selected over
total ESALs. Considering observations of rutting in
Colorado and the administrative decision process, EDLA is
believed to be a more appropriate unit of measure than
ESALs for designing against rutting.
In Colorado's experience a pavement will appear to be
performing acceptably and in a very short period (usually
1 month in a hot summer) the rutting becomes very
dramatic. This rutting generally occurs when the
pavement is 3 to 5 years old; however, in some instances
rutting does occur before and after that time range .
After the rut develops, the depth does not increase much
with additional traffic and time. Rutting depth does not
increase linearly with cumulative ESALs.
Determining the traffic loading at the time the rut. depth
increases dramatically is a most desirable value, but the
information is not available. Since traffic loading
after the rut develops is not important because the rut
depth does not increase significantly, the total
cumUlative ESALs is not appropriate. EDLA was selected
to provide a relative comparison of traffic loading for
each level of highway analyzed.
7

A second reason EDLA is more appropriate than cumulative
ESALs is that the structural design is not tied to
material design. In the design of asphalt pavements,
there are engineering designs and administrative
decisions based on budget limitations. When the cost of
the engineering design exceeds the budget for the
project, administrative decisions often are made to
shorten the design life. situations developed where
interstate pavements have been designed for 2 . 2 years.
In terms of rutting this could be disastrous, resulting
in a 50-blow Marshall effort. The structural design of
an asphalt pavement should be tied to the material
design. Unfortunately, when the structural design is
changed in an administratively acceptable manner (often
unacceptable from an engineering perspective) the use of
total ESALs also will affect the material properties. By
using EDLA, administrative decisions that influence the
structural design can be separated from engineering
decisions of the required mix properties.
Based upon the rutting observations in Colorado and the
nature of the unexpected implementation of administrative
decisions, EDLA is considered appropriate for use in
designing the rutting resistance of a mix.
Performance. Rutting depths, in inches, were reported by
the network level pavement management report. Several
sites with high levels of rutting and several sites with
no rutting were identified for evaluation in this study.
Each combination of traffic and temperature
classifications was included.
8
Based on experience in Colorado, pavements typical l y rut
in the first 3 to 5 years. There is a high probability
that pavements that do not rut in the first 3 to 5 years
will not rut throughout their service l ife. Good
pavements selected for this study were over 6 years old.
Each site was visited to determine actual rutting depth
and the cause of rutting. Only sites that exhibited
rutting from plastic flow were used. sites rutting
because of subgrade failure or improper compaction were
eliminated. Additionally, sites at intersections or with
climbing lanes for trucks on steep grades were
eliminated. It was attempted to accept sites that rutted
from plastic flow in areas of normal highway speeds, 7 3
to 105 km/hr (45 to 65 mph) .
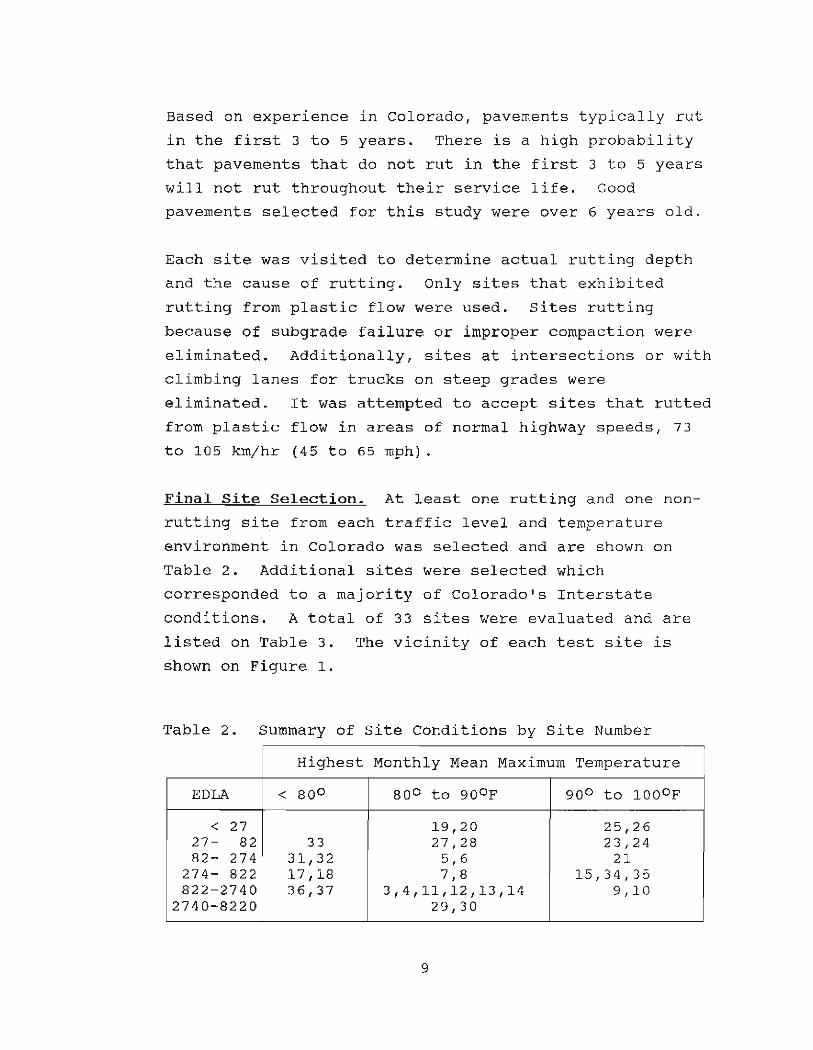
Final Site Selection. At least one rutting and one non
rutting site from each traffic level and temperature
environment in Colorado was selected and are shown on
Table 2. Additional sites were selected which
corresponded to a majority of Colorado's Interstate
conditions. A total of 33 sites were evaluated and are
listed on Table 3. The vicinity of each test site is
shown on Figure 1.
Table 2 . Summary of site Conditions by site Number
Highest Monthly Mean Maximum Temperature
EDLA < 80 0 80 0 to 90 0 F 90 0 to 1000 F
< 27 19,20 25,26 27- 82 33 27,28 23,24 82 - 274 31,32 5,6 21
274- 822 17,18 7,8 15 , 34,35 822-2740 36,37 3,4,11,12,13,14 9,10
2740-8220 29,30
9

Table 3. sites for French Rutting Tester Rut HMMM Traffic
site Hwy M.P. Location Depth Temp. EDLA 3 US-85 251 (SB) Platteville 0.0 11 88 941 4 US-85 248.3(SB) Platteville 1.0 11 88 864 5 SH-66 40 (EB) Longmont 0.0 11 88 2 50 6 SH-119 50 (EB) Niwot 0.4 11 88 22 1 7 SH-52 12 (WB) Dacona 0.111 88 358 8 SH-5 2 19 (WB) Fort Lupton 0.7 11 88 310 9 US -2 87 430.3 (EB) Lamar 0.111 96 878
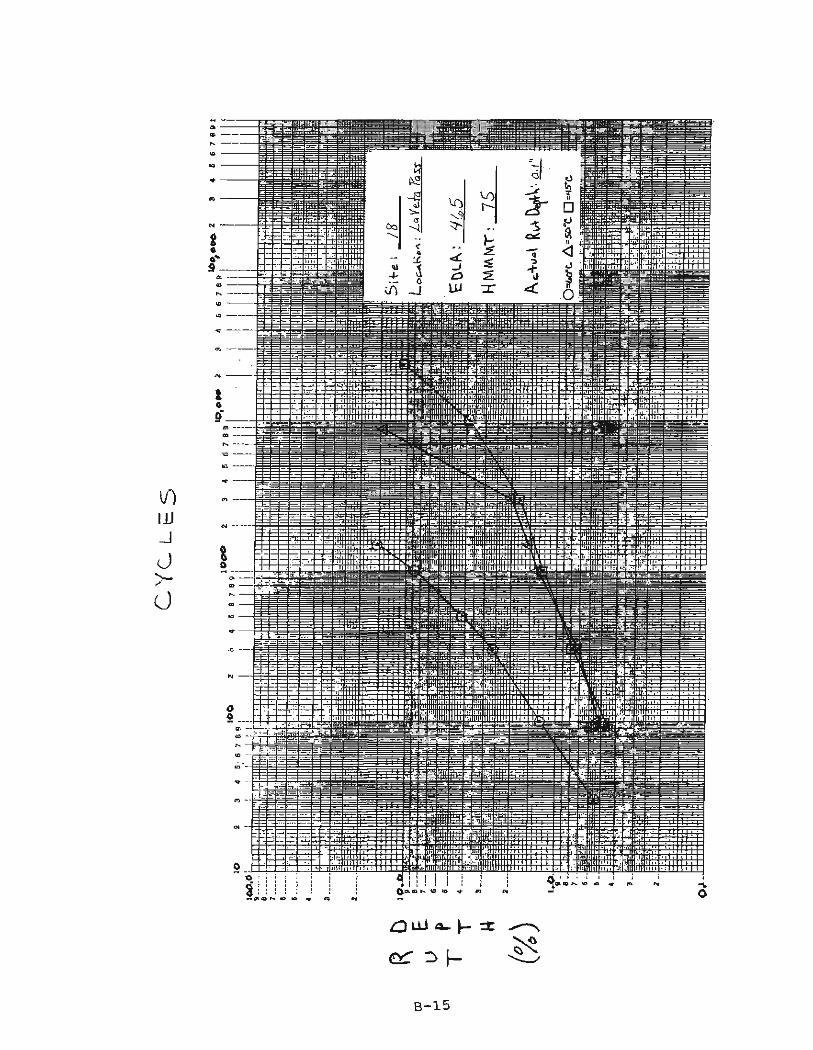
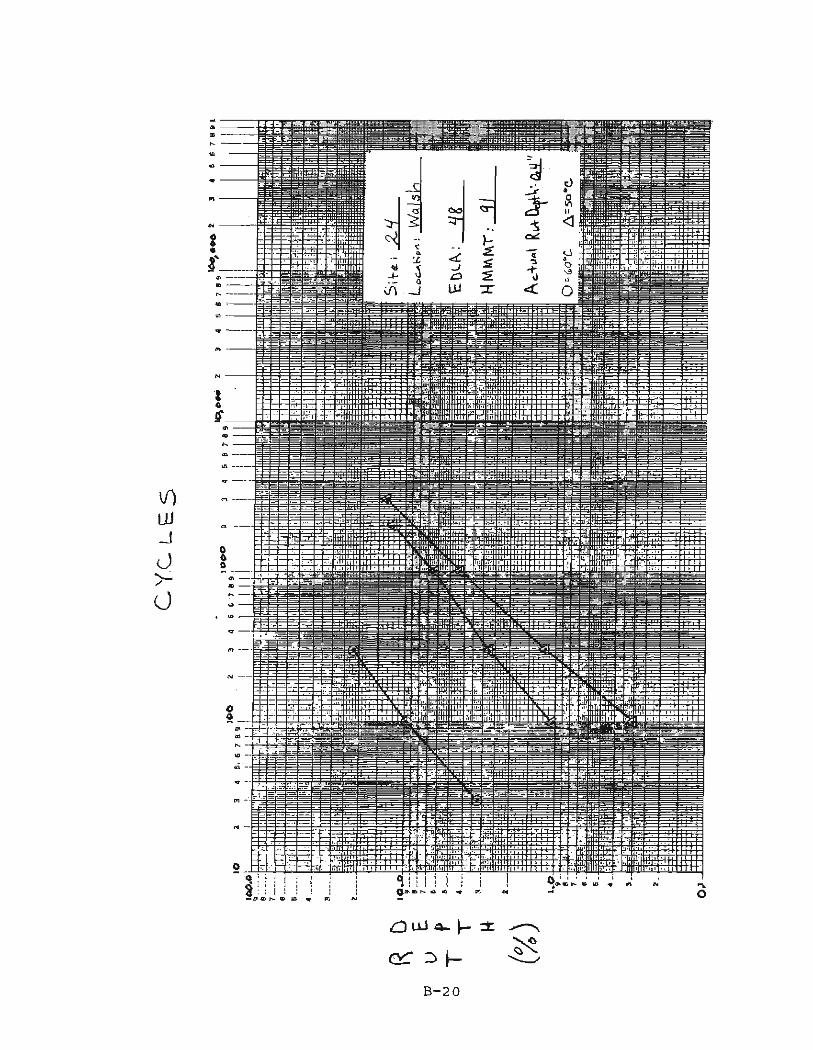
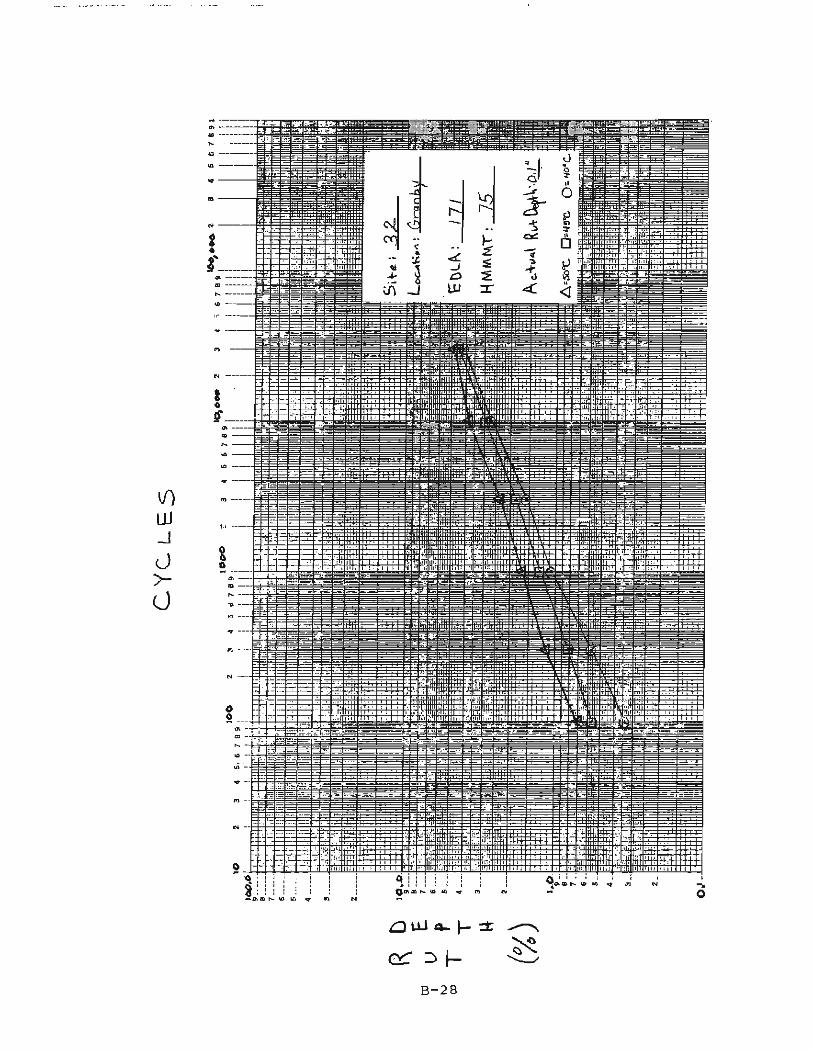
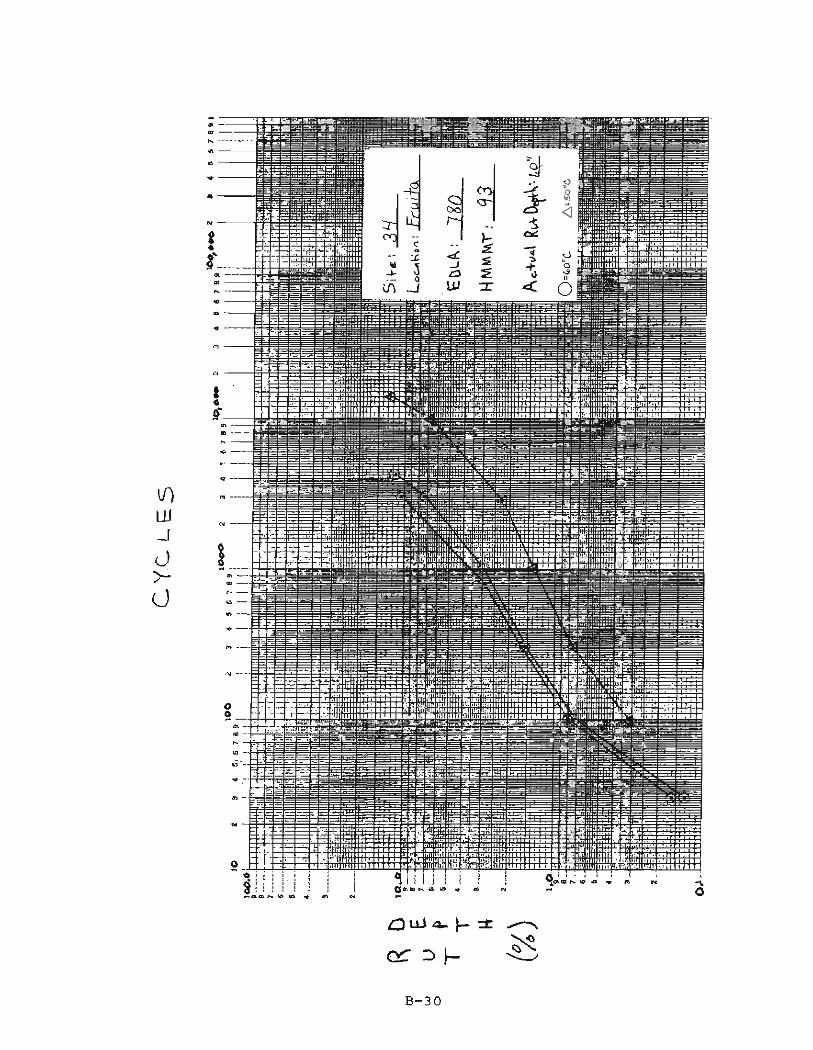
10 US-287 430.5(EB) Lamar 1.0 11 96 878 11 1-25 41 (SB) Walsenburg 0.0 11 85 1 027 12 1-25 35 (SB) Walsenburg 0.8 11 85 1027 13 1-70 430 (EB) Burlington 0.111 89 1377 14 1-70 445 (EB) Burlington 0.8" 89 1336 15 US-50 375 (WB) LaJunta 0.1" 94 551 17 US-160 271 (EB) LaVeta Pass 0.5" 75 493 18 US-160 278 (WB) LaVeta Pass 0.1" 75 465 19 US-389 10.3 (NB) Branson 0.0 11 84 3 20 US-389 10.5 (SB) Branson 0.4 11 84 3 21 US-50 ~54 (WB) Granada 0.0 11 94 270 23 US-160 490 (WB) Walsh 0.111 91 48 24 US-160 486 (WB) Walsh 0.4" 91 48 25 SH-55 2 (NB) Crook 0.1" 91 20 26 SH-55 0.3 (SB) Crook 0.5" 9 1 20 27 SH-71 219 (NB) Stoneham 0.0" 87 56 28 SH-71 214.4(NB) Stoneham 0.7 11 87 56 29 1-25 237 (SB) Denver 0.3" 87 3127 30 1-25 242.5(NB) Denver 0.6" 87 3127 31 US-40 225 (EB) Fraser 0.4" 75 1 69 32 US-40 216 (WB) Granby 0.1" 75 171 33 US-34 2.3 (WB) Granby 0.5 11 75 53 34 1-70 14.9 (WB) Fruita 1.0" 93 780 35 US-50 75 (NB) Delta 0.5" 93 399 36 1-70 214 (EB) Eisenhower 0.8" 72 1137 37 1-70 2 07 (EB) Silverthorne 0.111 7 2 1137
10

.. ~-·r---'E
j
Figure 1 Test site Locations Listed by City's Name
11

V. SAMPLING AND TESTING
Cores and slabs were obtained from each selected site.
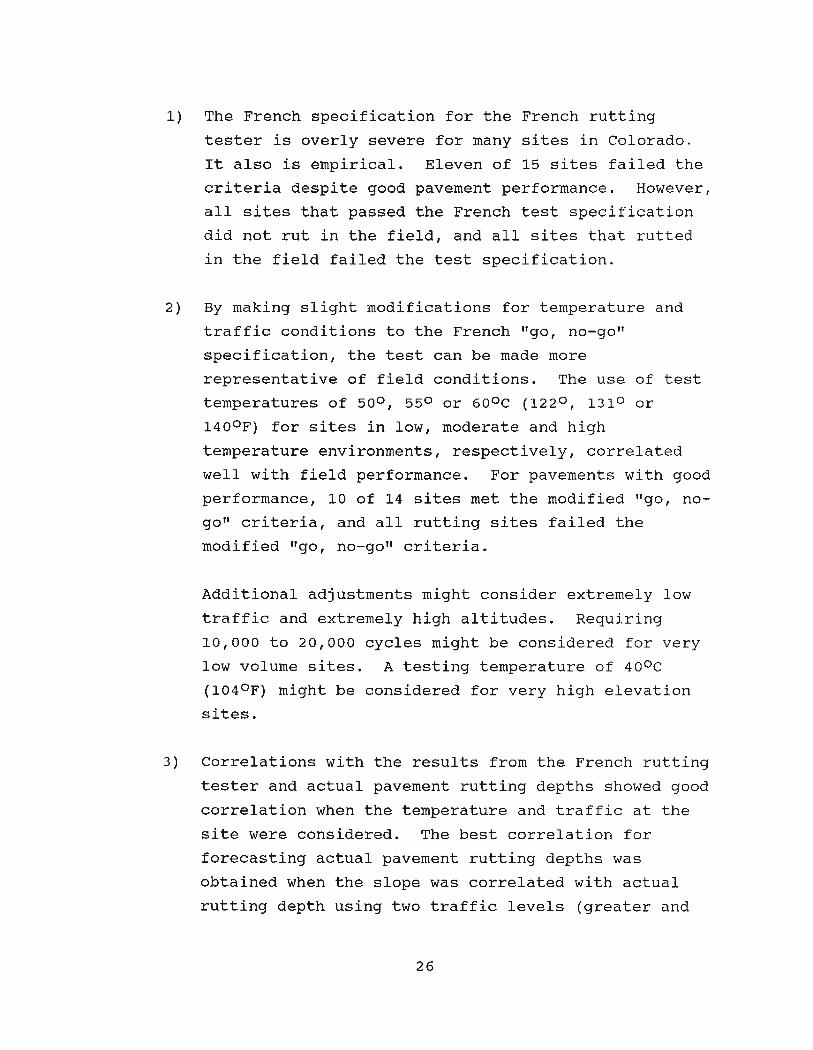
Slabs were sawed between the wheel paths and parallel to
the direction of travel. Three slabs were obtained at
each location (Photos 2 and 3, Appendix A). Five, 4-inch
diameter cores were obtained between the wheel paths and
three, 4-inch diameter cores were obtained in the wheel
paths. The thickness of lifts at each site was
identified by observing and measuring the slabs.
Mixture tests included the bulk and maximum specific
gravities (AASHTO T 166 and 209) on cores. Vacuum
extractions were performed to determine the asphalt
content and gradation, and the asphalt cement was
recovered. Penetration tests and shear rheometer tests
were performed to identify the properties of the asphalt
cement. Additional tests, including recompaction in a
gyratory compactor, Hveem stabilometer, percent fractured
faces, and aggregate angularity were performed to
determine why some pavements rutted and the others did
not rut. The results of the forensic investigation are
reported in subsequent reports.
VI. RESULTS AND DISCUSSION OF TESTING
Three slabs were obtained at each site. One slab was
typically tested at 50 0 and another at 60 0C (1220 and
1400F). The third slab was tested at e ither 400 or 450C
(104 0 or 113 0F) for low temperature sites and typically
at 55 0C (1310F) for moderate and high temperature s ites.
12

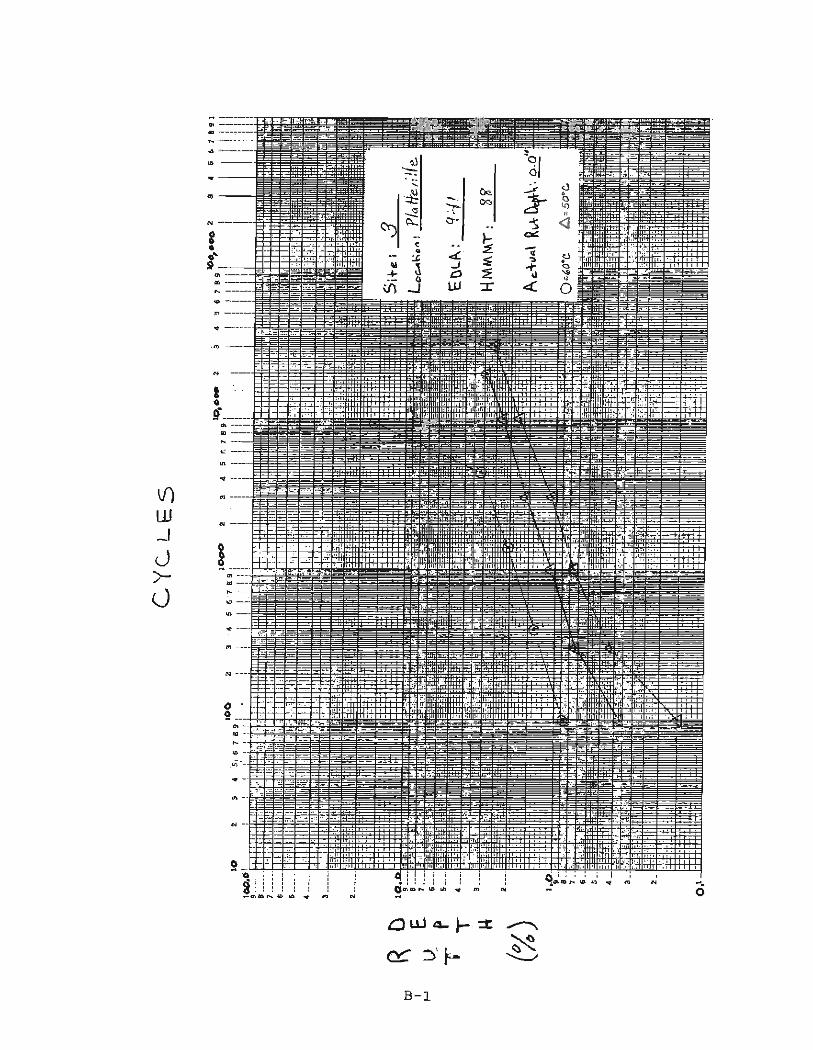
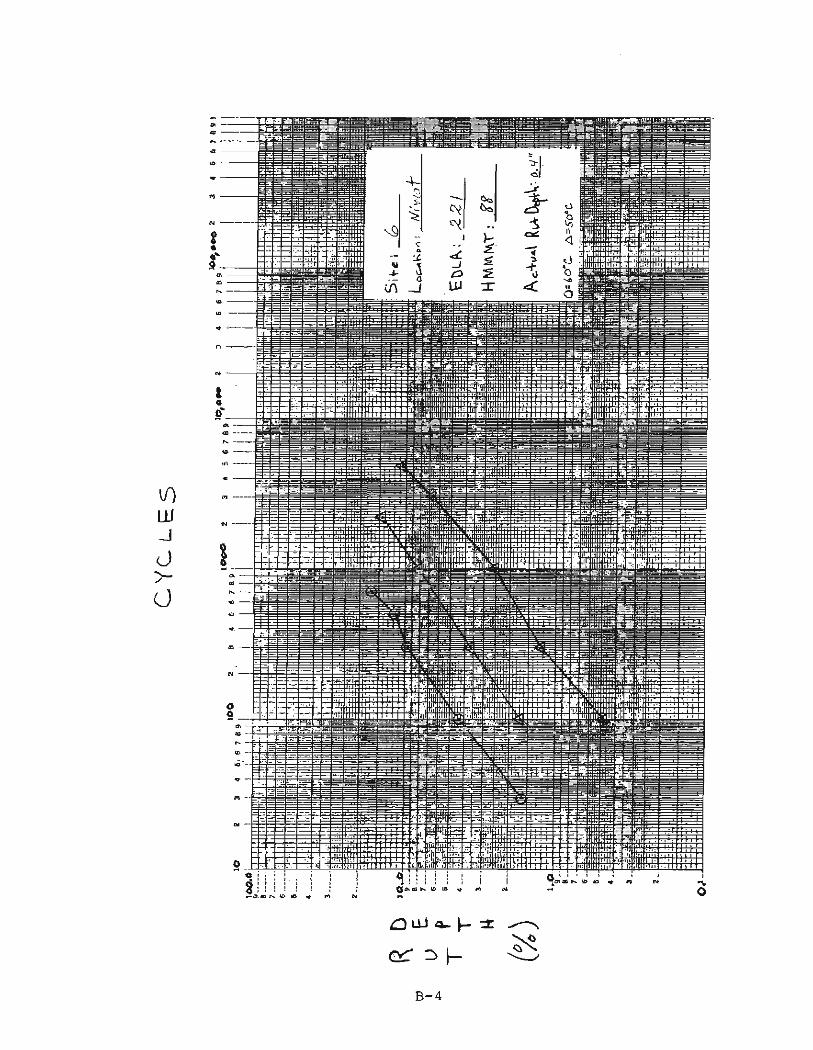
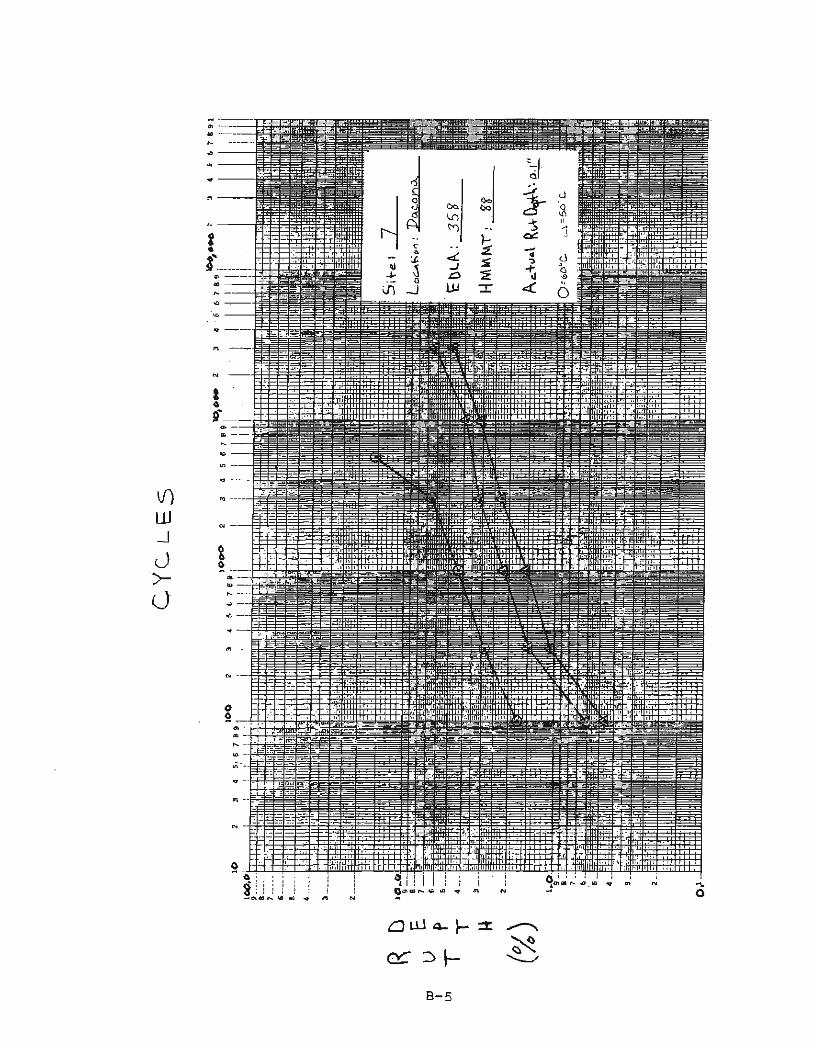
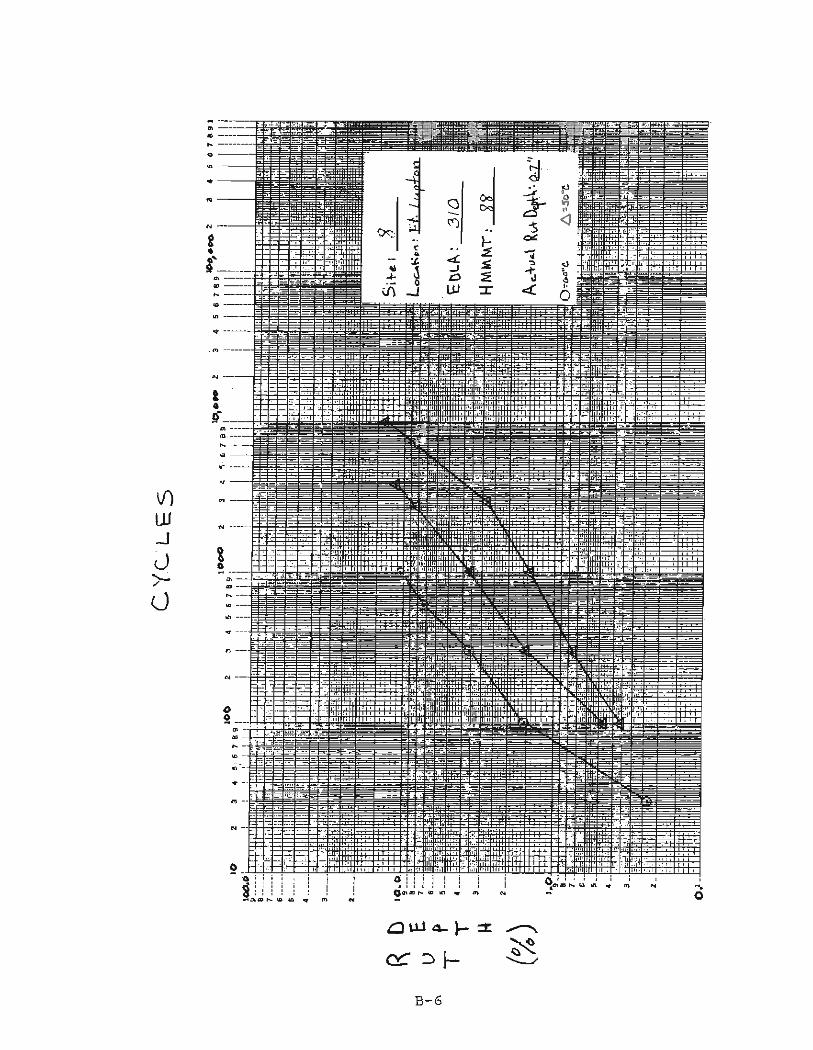
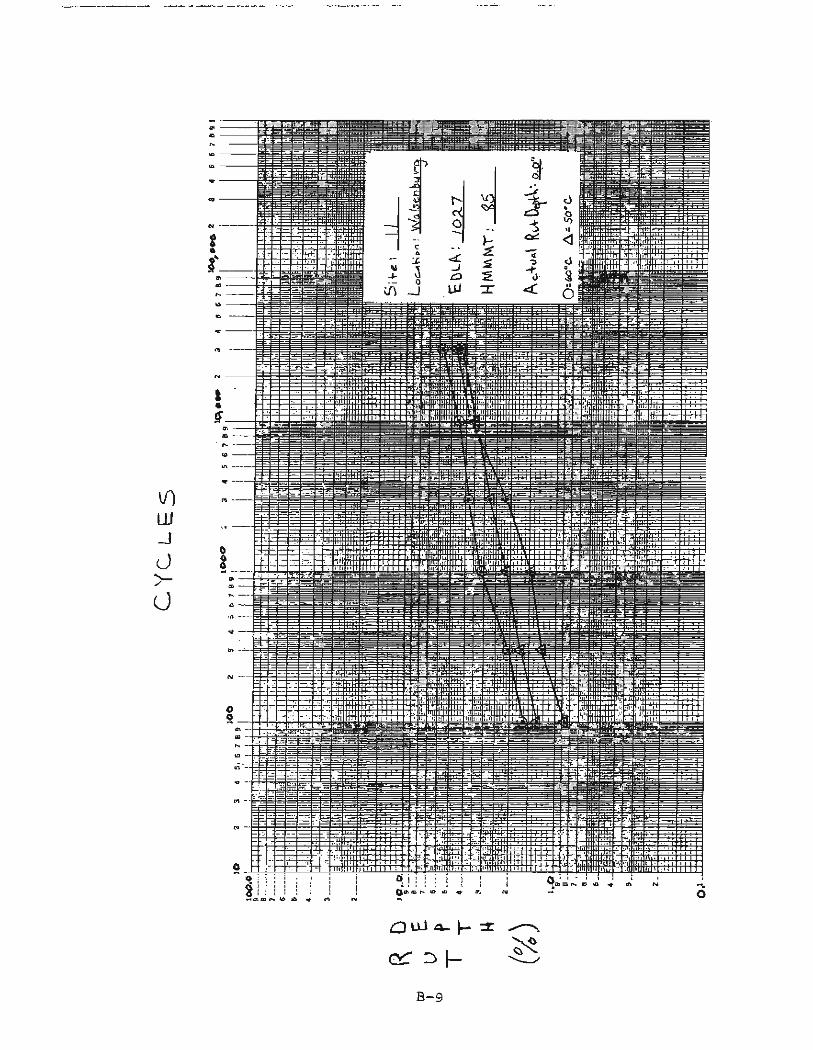
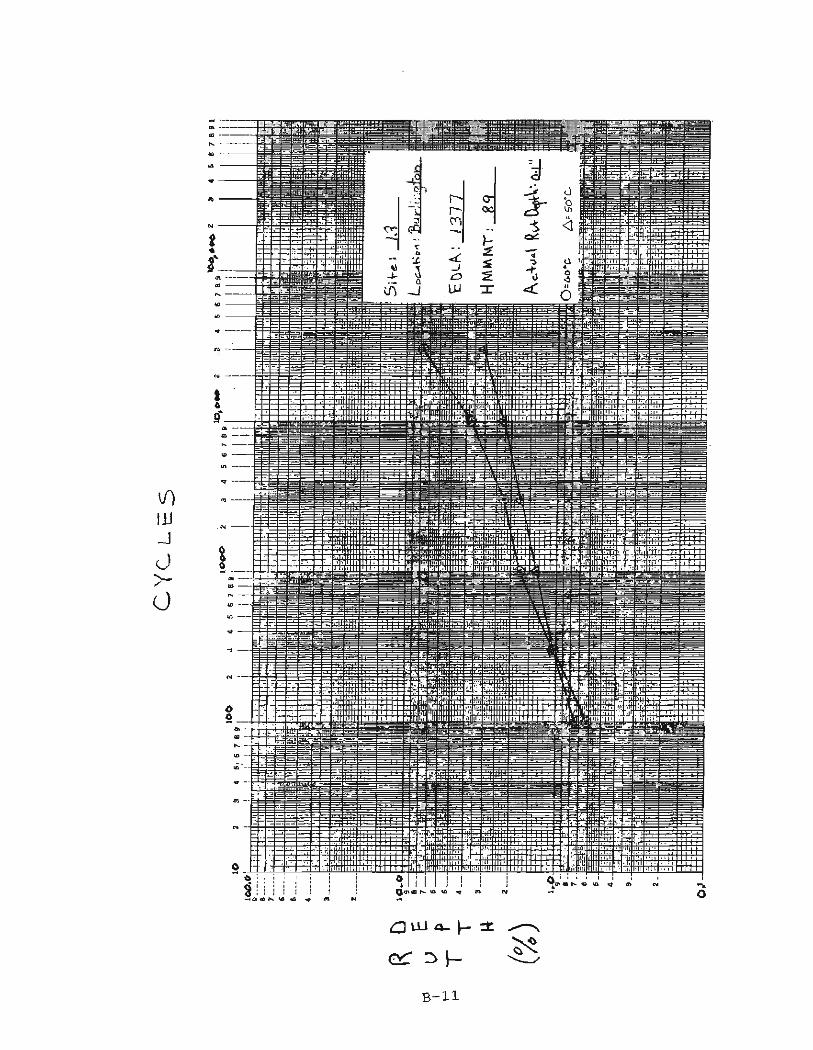
In some instances the third slab was tested at 50 0 or
60 0 C to measure repeatability. Plots of the rutting
depth versus cycles for all slabs tested are included in
Appendix B.
Each slab that was tested typically had 2 to 4 layers .
No attempt was made to separate the layers of the slabs.
Each slab was tested as a multiple layer, just as it was
in the field. If a lower lift contributed to rutting, it
will be detected by the French rutting tester (5 ) .
Repeatability. Some replicate slabs were tested at
identical temperatures. Repeatability and
reproducibility have been defined according to ASTM C
802. Repeatability provides an estimate of the
difference that may be expected between duplicate
measurements made on the same material in the same
laboratory by the same operator using the same apparatus
within a time span of a few days. Reproducibility
provides an estimate of the difference that may be
expected between measurements on the same materials in
two different laboratories.
The repeatability and reproducibility of the results from
the French rutting tester currently are not known, so the
LCPC is performing a statistical s tudy (3). The analysis
is performed for a 2% to 8% rutting depth. A difference
in the rutting depth of 1.5 mm (0.06 in) or greater is
necessary to distinguish between two materials tested
with 100 mm (3.9 in) thick slabs.
A full repeatability task will be performed as part of
the CDOT's overall study. For the study documented in
this paper, some slabs were tested twice at the same
13

temperature to provide an indication of the
repeatability. The results of replicate testing for
unacceptable sites are shown on Table 4. The cycles at a
7% rutting depth are reported to be consistent with the
French study (3). Since the results from the acceptable
sites did not reach the 7% rutting depth, the rutting
depths at 30,000 cycles are reported on Table 5.
Table 4. Results of Replicate Testing for Unacceptable sites
Cycles at 7% Rutting Depth
site 1st Replicate 2nd Replicate
4 800 4,000 6 800 3,000 8 2 ,000 6,000
12 1 ,000 3,000 20 1,000 2,000 23 4,000 5,000 24 2,000 1,000 28 2,000 600 34 2,000 3,000 35 300 500
Table 5. Results of Replicate Testing for Acceptabl e sites
Rutting Depth at 30,000 Cycles
site 1st Replicate 2nd Replicate
3 2 .9 % 3.5 % 7 6.4 4.8
11 4.4 4.5 21 5.5 4.1
Rutting depths on replicate samples for acceptable sites
were typically within 1.5%, as reported by the French.
On bad sites, the difference in the cycles to failure
14

varied by 1000 to 4000 . Considering the specification is
30,000 cycles, 4000 cycles is a reasonable difference ,
especially on such bad samples that appear to be very
sensitive.
French Specification. An acceptable mix for the
pavements tested in this study using the French
specification will have a rutting depth of less than or
equal to 10% of the slab thickness after 30,000 cycles at
60oC. This is a Ilgo, no-go" criteria. The shape of the
rutting depth versus cycles curve and the sensitivity of
the curve to void content also should be considered.
The French indicate that there are no reports of rutting
on highways in which the placed mix passed the test (3).
In the few cases where rutting did occur, problems were
identified which included: the mix placed failed in the
design, an improper test procedure was used with the
French rutting tester, or the material placed on the
project varied from the material used in the design.
For the 31 Colorado sites tested at 60oC, the comparison
of the actual pavement performance versus the
specification established by the French is shown on Table
6. Two sites (32 and 36) were not included on the Table
because the slabs were not tested at 60o C.
Table 6. Comparison of French Specification to Actual Performance
Actual Pavement Performance
Acceptable Unacceptable
French Acceptable 4 0
Spec. Unacceptable 11 16
15
The French specification is very severe for conditions
typically encountered in Colorado. For the sites tested ,
there was no rutting in the field when the slabs passed
the test and sites that rutted in the field all failed
the test. However, several pavements with good
performance would have failed the French specification.
It may be necessary to examine the testing specification
for the different traffic and climatic conditions that
exist in Colorado.
Temperature Adjustments. The French use one very severe
temperature to perform the test. This is appropriate to
create a high factor of safety against rutting. However,
in order to make the test more representative of the
conditions in Colorado and less severe, different test
temperatures were examined. The testing temperature
should simulate the actual pavement conditions. The
actual field temperature was defined using the highest
monthly mean maximum temperature (HMMMT) .
Tests were performed using different testing
temperatures. The slope, B, as defined in Equation 1 is
reported along with results from the French rutting
tester on Tables 7-9. The rutting depth at 30,000 cycles
was reported if the sample survived; the cycles at a 10%
rutting depth were reported if the test had to be
terminated.
1) High Temperature. Most of the high temperature sites
shown on Table 7 worked very well u sing the "go, no-go"
criteria. A 600 C testing temperature seems appropriate.
site 23 at Walsh had very poor performance in the rutting
tester despite good performance on the road. The results
from sites 23 and 24 were not distinguishable from each
16

other despite having different performance histories .
The sites were from the same project and within four mi les
of each other. It was assumed that this mix was marginal
and that some site specific situation during or after
placement caused the difference in rutting in the field.
site 15 in LaJunta did not meet the criteria despite good
field performance. The pavement had 1.7% air voids in
the wheel path and at adjacent locations there is 0.5 "
rutting depths. Past research had indicated that
pavements with less than 3% air voids in the wheel path
have a high probability of rutting (6,7,8). Even though
the pavement did not rut at the location of the sample,
the material would be undesirable to produce for projects
statewide. Results from the French rutting tester
indicated that the material was unacceptable.
Mechanical problems developed with the French rutting
tester while testing sites 25 and 26. Therefore only one
result from each site was obtained. site 25 had very low
traffic. For low traffic, 10,000 or 20,000 cycles
possibly could be specified.
17

Tabl e 7. sites with HMMMT from 32 0 to 38 0 C ( 90 0 to 100 0 F).
60 0 C Test Temp. 55 0 C Test Temp. 50 0 C Test Temp.
S Pvmnt Slope Rut Depth Slope Rut Depth Slope Rut Depth i EDLA Rut @ 30,000 @ 30,000 @ 30,000 t Depth (B) or Cycles (B) or cycles ( B) or Cycles e (in. ) @ 10% @ 10% @ 10%
25 20 0.1 0.40 22,000 26 20 0.5 0.70 9,000 23 48 0.1 0.86 600 0.70 4,000 24 48 0.4 0.86 100 0.80 2 ,000 21 270 0.0 0.33 5.5 0.35 4.1 35 399 0.5 1. 02 600 0.89 2,000 15 550 0.1 0.45 9,000 0.57 29,000 34 780 1.0 0.84 3,000 0.69 12,000
9 878 0.1 0.34 4.8 0.36 7.1 10 878 1.0 0.73 300 0.40 2,000
2 ) Moderate Temperature. Results from the pavements
placed in moderate temperature areas shown on Table 8
were significantly affected by the testing temperature.
By changing the testing temperature from 60 0 to 5 00 C, six
sites with good field performance (3, 5, 7, 19, 27 and
29) went from failing to passing, and no sites with poor
performance went from failing to passing. The drastic
change is not uncommon. By using a polymer modified
asphalt, which is less temperature sensitive, the
dramatic change in rutting results is reduced
significantly (5). A testing temperature of 55 0 C would
still be very severe, and the "go, no-go" specification
would have better correlation with the actual pavement
performance.
site 29 in Denver had a 0 . 3" rutting depth; this i s
considered barely unacceptable. At the 55 0 C testing
temperature, the slab failed at 27,000 cycles, barely
short of the required 30,000 cycles. A testing
18

temperature of 55 0 C would closely represent the actual
performance of this pavement.
Values were estimated for many of the sites at the 55°C
test temperature based upon results from 50 0 and 60 0 e because there was no test performed at this temperature.
No values were estimated for sites 3 and 5 since there
was a large change in results in the 10 0 e difference in
testing temperature.
Table 8. Sites with HMMMT from 270 to 320C (80 0 to 90 0 F).
60 0 C Test Temp. 55 0 e Test Temp. 500 e Test Temp.
S Pvmnt Slope Rut Depth Slope Rut Depth Slope Rut Depth i EDLA Rut @ 30,000 @ 30,000 @ 30,000 t Depth (B) or Cycles (B) or Cycles ( B) or Cycles e (in. ) @ 10% @ 10% @ 10%
19 3 0.0 0.37 12,000 0.36 7.8 0.37 9.7 20 3 0.4 0.96 400 *0.93 *700 0.90 1,000 27 56 0.0 0.41 20,000 0.28 4.4 0.31 3.7 28 56 0.7 1. 02 200 *1. 03 *1,000 1. 03 2 ,000
5 250 . 0.0 0.71 7,000 0.26 3 .1 0.38 2 .5 6 221 0.4 0.74 300 *0.72 *1,000 0.70 2 ,000 7 308 0.1 0.49 4,000 0.37 6.4 8 310 0.7 0.89 400 *0.82 *700 0.75 1,000 3 941 0.0 0.55 7,000 0.37 2 .9 4 864 1.0 0.73 500 *0.73 *2,000 0.74 5,000
13 1377 0.1 0.41 7.9 *0.32 *5.5 0.24 3.0 14 1336 0.8 0.92 200 0.55 5,000 0.62 3,000 11 1027 0.0 0.22 5.7 *0.21 *5.1 0.21 4.4 12 1027 0.8 1. 06 800 *0.95 *2,000 0.85 3 ,000 29 3127 0.3 0.38 15,000 0.44 27,000 0.36 3 .6 30 3127 0.6 0.60 4,000 0.55 6,000 0.59 12 ,000
*estimated value
3) Low Temperature. The low temperature sites are shown
on Table 9. Correlating results with actual pavement
performance was highly variable and believed to be
dependent on elevation. It was not always possibl e to
obtain the HMMMT at the exact site location. The
"standard ll low temperature sites (Sites 17 , 31 , 32 , and
19

33) were below 24 00 meters (8,000 feet) in elevation and
had good correlation at 500 C. Site 18 was at the top of
LaVeta Pass at over 3,000 meters (9,000 feet). For a mix
placed at this elevation the testing temperature that
models field performance, possibly 400C, appears to be
much lower than the "standard" sites.
site 36 was in the Eisenhower Tunnel at an elevation o f
over 3,000 meters (9,000 feet). Although the pavement
rutted 0.6", it was not because of plastic flow; it
likely was due to abrasion from studded tires and tire
chains. The voids in the wheel path were 6.4.%.
Additionally, the pavement texture was very rough and
potholed in the bottom of the rut in the wheel path.
This site was not included in any additional analysis.
Table 9 . Sites with HMMMT Less Than 27 0 C (80 0F).
50 0 C Test Temp. 450 C Test Temp. 40 0 C Test Temp.
S Pvmnt Slope Rut Depth Slope Rut Depth Slope Rut Depth i EDLA Rut @ 30,000 @ 30,000 @ 30,000 t Depth (B) or Cycles (B) or Cycles (B) or Cycles e (in. ) @ 10% @ 10% @
33 53 0.5 0.85 5,000 0.77 8,000 0.46 32 169 0.1 0.33 4.7 0.35 4.3 0.44 31 171 0.4 0.62 5,000 0.60 18 465 0.1 0.66 8,000 0.53 17,000 17 493 0.5 0.79 3,000 0.71 9,000 0.75 37 1137 0.1 0.37 3.8 0.30 36 1137 0.8 0.29 6.1 0.29 5.3 0.30
Modified "Go, No-Go" Specification. Testing
specifications should be selected to match the testing
temperature with the field temperature. To select the
highest testing temperature that still would provide a
correlation with the results, the proposed "go, no-go "
testing temperatures are 60 0 , 55 0 , and 50 0 C for sites
2 0
10%
5.5 4.1 3.9
9,000 1.9 4.3
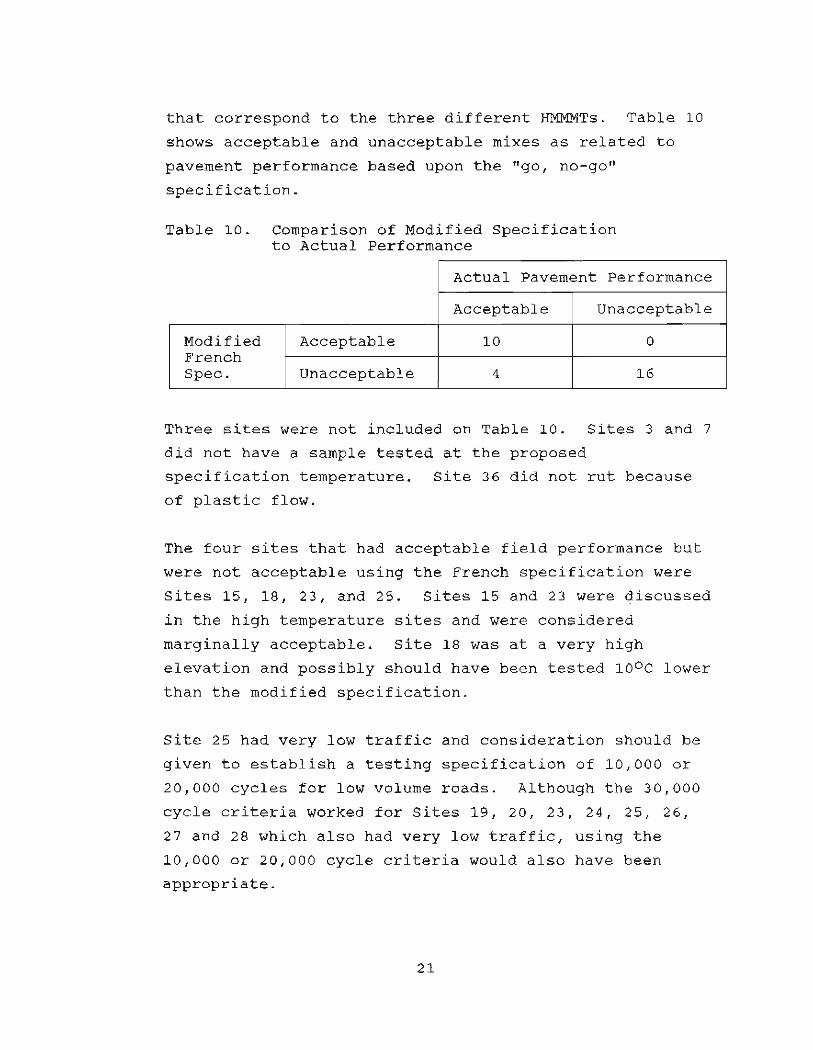
that correspond to tbe three different HMMMTs. Table 10
shows acceptable and unacceptable mixes as related to
pavement performance based upon the "go, no-go"
specification.
Table 10. comparison of Modified Specification to Actual Performance
Actual Pavement Performance
Acceptable Unacceptable
Modified Acceptable 10 0 French Spec. Unacceptable 4 16
Three sites were not included on Table 10. Sites 3 and 7
did not have a sample tested at the proposed
specification temperature. site 36 did not rut because
of plastic flow.
The four sites that had acceptable field performance but
were not acceptable using the French specification were
sites 15, 18, 23, and 25. sites 15 and 23 were discussed
in the high temperature sites and were considered
marginally acceptable. site 18 was at a very high
elevation and possibly should have been tested 100 C lower
than the modified specification.
site 25 had very low traffic and consideration should be
given to establish a testing specification of 10,000 or
20,000 cycles for low volume roads. Although the 30,000
cycle criteria worked for sites 19, 2 0, 23, 24, 25, 2 6 ,
27 and 28 which also had very low traffic, using the
10,000 or 20,000 cycle criteria would also have been
appropriate.
21

Prediction of Rutting Depth. Additional analysis was
performed in order to determine i f the test could be
extended beyond a "go, no-go" criteria and was used to
forecast actual rutting depths. The results from the
French rutting tester used in the analysis were the slope
of the rutting curve, B, as defined in Equation 1 and the
log of the cycles at failure, C. The slopes and cycles
were plotted versus actual pavement rutting depths. The
regression results as expressed by the coefficient of
determination, r 2 , are shown on Table 11. The Imv
temperature sites were not included in these regressions
since no testing was performed at 600C.
Observation of the results indicated that there was a
distinct difference between sites with high and low
levels of traffic. In all cases, when traffic was
divided into two categories, the coefficient of
determination increased dramatically. Several entities
use 1 million ESALs to differentiate between high and
moderate traffic, and that is approximately an EDLA of
250 for 10 years. Regardless of test temperature, there
seemed to be slightly better correlation when an EDLA of
400 was used which is approximately 1. 5 million ESALs
over 10 years.
Regression analysis was performed for al l sites using the
60 0C testing temperature specified by the French.
Additional analyses were performed by varying the testing
temperature to better represent the actual pavement
temperatures. When the slope was used the best
correlations were obtained when a testing temperature of
600 C was used for sites with a HMMMT of 32 0 to 38 0C (900
to 1000 F) and 500C was used for 27 0 to 32 0C (800 to
90 0F). When the cycles were used, the best correlations
22

were obtained when a testing temperature of 600 C was used
for sites with a HMMMT of 32 0 to 38 0 C (90 0 to 1000F) and
550 C was used for 27 0 to 32 0 C (800 to 90 0 F) .
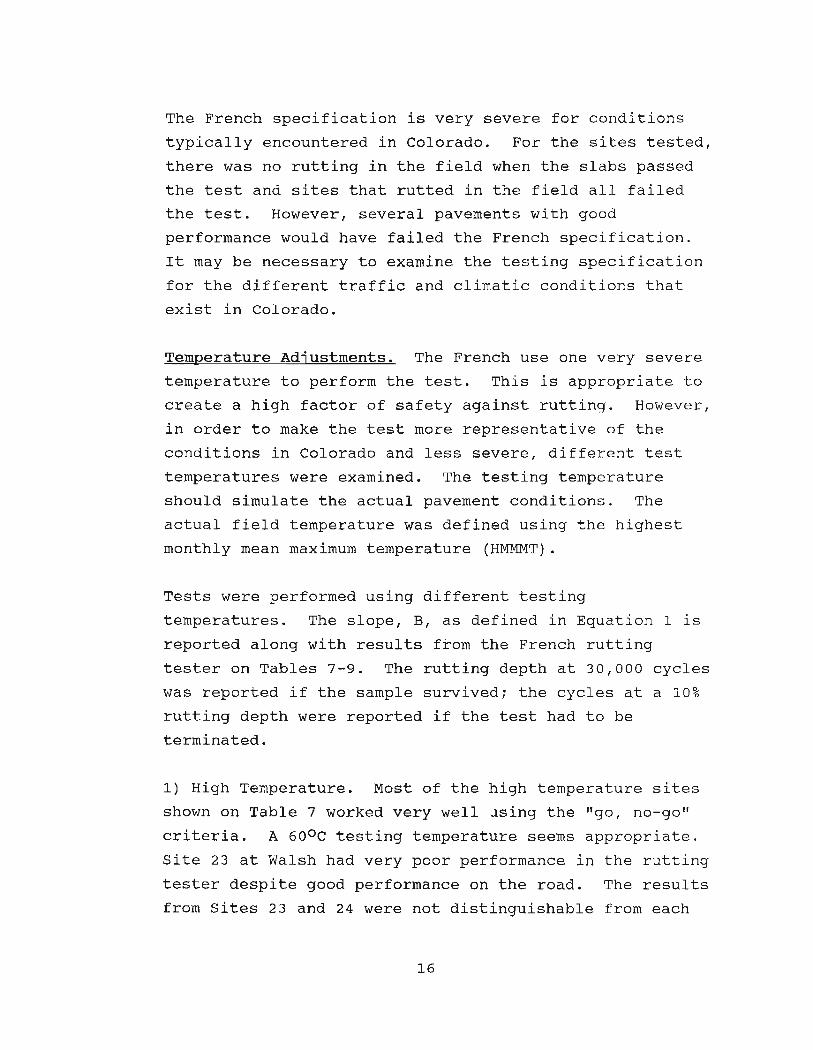
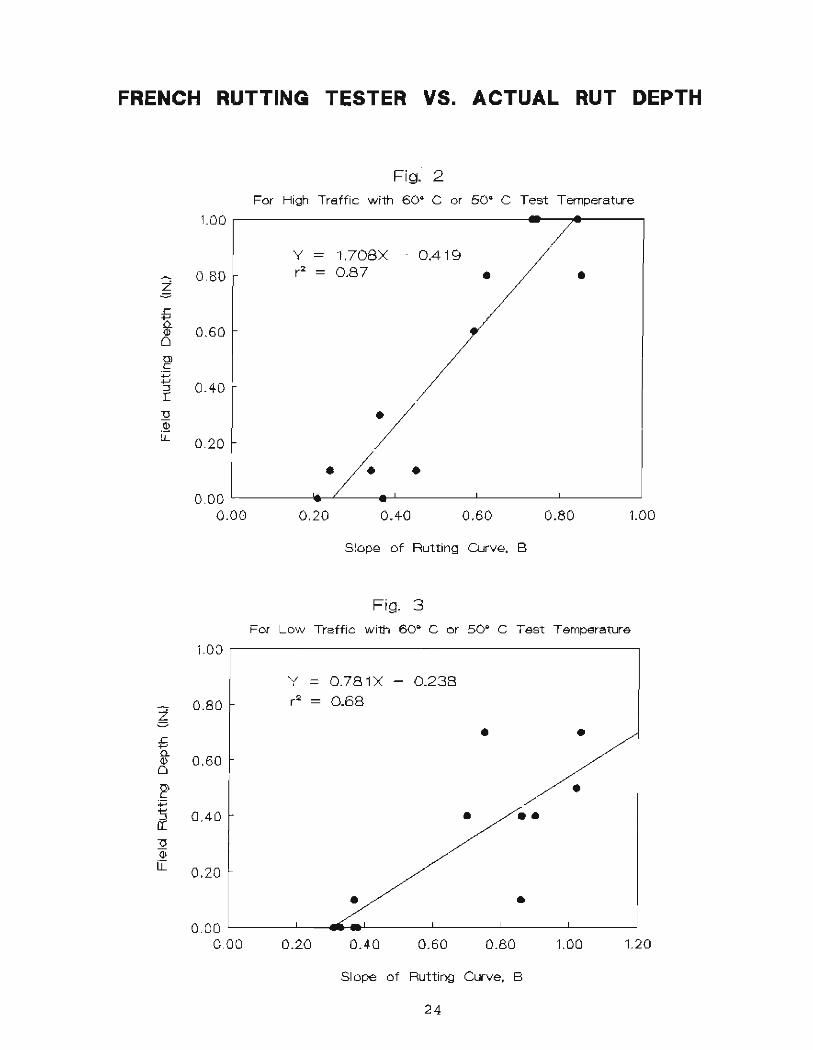
Based on regression analysis, there was a correlation
with the tests from the French rutting tester and actual
rutting depths. The forecasting capability was better
when traffic volume and site temperatures were
considered. The plot shown on Fig. 2 is for traffic with
an EDLA greater than 400 and a testing temperature of
600 C and 500 C was used for sites with a HMMMT of 32 0 to
38 0 C (900 to 1000F) and 27 0 to 32 0C (800 to 900 F) ,
respectively. The coefficient of determination, r2, of
0.87 indicated good correlation. Fig. 3 is a plot for
traffic with an EDLA less than 400 and the testing
temperature of 60 0 and 50 0 C. The coefficient of
determination, r 2 , of 0.68 indicated a positive
correlation.
2 3
FRENCH RUTTING TESTER VS. ACTUAL RUT DEPTH
.r:
~ o
Z = .c +-' 0. <J)
0
~ +-'
~ "U "$ iI
Fig. 2
For High Traffic with 60· C or 50· C Test Temperature 1.00 ,--------------- - __ 1-----.41..-----,
0.80
0.60
0.40
0.20
Y = 1.708X - 0.419 r2 = 0.87
•
• •
0.00 1- ----'4 .... ·-'/--·-41 ........... _. ___ --L-___ ----L. ___ ---'
0 .00 0.20 0.40 0.60 0.80 1.00
Slope of Rutting Curve, B
Fig. 3 For Low Traffic with 60° C or 50° C Test Temperature
1.00
'/ i = 0.781 X - 0.238
0.80 r2 = 0.68
• • 0.60
• 0.40 • ••
0.20
• • 0 .00
0.0 0 0.20 0.40 0.60 0.80 1.00 1.20
Slope of Rutting Curve, B
2 4

Table 11. Coefficients of Determination (r2) for Predicting Actual Rutting Depths with French Rutting Tester Results.
n Slope (8) Log(C/1000)
600 C Test Temperature All Traffic 24 0.45 0.47 > 400 EDLA 12 0.67 0.74 < 400 EDLA 12 0.65 0.68 > 250 EDLA 16 0.61 0.69 < 250 EDLA 8 0.60 0.72
50 0 C Test Temperature All Traffic 25 0.37 0.44 > 400 EDLA 13 0.52 0.75 < 400 EDLA 12 0.84 0.78 > 250 EDLA 17 0.47 0.61 < 250 EDLA 8 0.80 0.71
60 0 or 50 0 C Test Temp. All Traffic 24 0.49 0.35 > 400 EDLA 12 0.87 0.70 < 400 EDLA 12 0.68 0.48 > 250 EDLA 16 0.67 0.61 < 250 EDLA 8 0.72 0.38
60 0 or 55 0 C Test Temp. All Traffic 22 0.45 0.33 > 400 EDLA 11 0.78 0.76 < 400 EDLA 11 0.70 0.56 > 2 50 EDLA 14 0.60 0.63 < 250 EDLA 8 0.72 0.50
VII. CONCLUSIONS
It is understood that the sites tested were old
pavements, and that the air voids and asphalt cement had
changed since the original construction. The testing
performed for this study was to provide a preliminary
indication of the ability of the French rutting tester to
forecast the performance of a pavement.
25
1) The French specification for the French rutting
tester is overly severe for many sites in Colorado.
It also is empirical. Eleven of 15 sites failed the
criteria despite good pavement performance. However ,
all sites that passed the French test specification
did not rut in the field, and all sites that rutted
in the field failed the test specification.
2 ) By making slight modifications for temperature and
traffic conditions to the French "go, no-go"
specification, the test can be made more
representative of field conditions. The use of test
temperatures of 50 0 , 550 or 60 0 C ( 1 22 0 , 1310 or
1400 F) for sites in low, moderate and high
temperature environments, respectively, correlated
well with field performance. For pavements with good
performance, 10 of 14 sites met the modified "go, no
go" criteria, and all rutting sites failed the
modified "go, no-go" criteria.
Additional adjustments might consider extremely low
traffic and extremely high altitudes. Requiring
10,000 to 20,000 cycles might be considered for very
low volume sites. A testing temperature of 40 0 C
(104 0 F) might be considered for very high elevat ion
sites.
3) Correlations with the results from the French rutting
tester and actual pavement rutting depths showed good
correlation when the temperature and traffic at the
site were considered. The best correlation for
forecasting actual pavement rutting depths was
obtained when the slope was correlated with actual
rutting depth using two traffic levels (greater and
2 6

VIII.
less than an EDLA of 400) and test temperatures of
60 0C and 500C for sites with a HMMMT of 32 0 to 38 0C
(900 to 1000F) and 27 0 to 32 0 C (800 to 900 F) ,
respectively. The best correlation with the number
of cycles and actual rutting depth was obtained using
test temperatures of 600C and 550 C.
4) The French rutting tester can apply a variety of
stresses into the slabs being tested. The French
rutting tester could probably model field results
better by considering stress levels when performing
tests.
ADDITIONAL RESEARCH
A study titled "Investigation of the rutting Performance
of Pavement in Colorado" which documents why the good
pavements performed well and the bad pavements did not
will be available for distribution in November 1992.
27

REFERENCES
1 . Report on the 1990 European Asphalt study Tour (June 1991), American Association of state Highway and Transportation Officials, Washington, D.C., 115+ pages.
2 . Bonnot, J. (1986), "Asphalt Aggregate Mixtures", Transportation Research Record 1096, TRB, National Research council, Washington, D.C., pp. 42-51.
3. Brosseaud, Y. (1992), "Assessment of the Use of the L.C.P.C . Rutting Tester", section des Materiaux de Chaussees, L.C.P.C. Nantes, 12 pages.
4. DI Angelo, J.A. and T. Ferragut (1991), "Summary of Simulation Studies from Demonstration Project No. 74: Field Management of Asphalt Mixes", Journal of the Association of Asphalt paving Technologists, Volume 60, pp. 287-309.
5. Nievelt, G. and H. Thamfald (1988), "Evaluation of the Resistance to Deformation of Different Road Structures and Asphalt Mixtures Determined in the Pavement-Rutting Tester", Proceedings of the Association of Asphalt Paving Technologists, Volume 57, pp. 320-345.
6. Huber, G.A. and G.H. Heiman (1987), "Effect of Asphalt Concrete Parameters on Rutting Performance: A Field Investigation", Proceedings of the Association of Asphalt Paving Technologists, Vol. 56, pp. 33-61.
7. Brown, E.R. and S.A. Cross (1992), "A National Study of Rutting in Asphalt Pavements", Journal of the Association of Asphalt Paving Technologists, Vol. 61, pp.
8. Ford Jr., M.C. (1988), "Asphalt Mix Characteristics and Related Pavement Performance", Proceedings of the Association of Asphalt Paving Technologists, Vol. 57 , pp. 519-544.
28

Appendix A
PHOTOGRAPHS

Photo I
Measuring rutting depths on a slab in the French rutting tester.
A-I
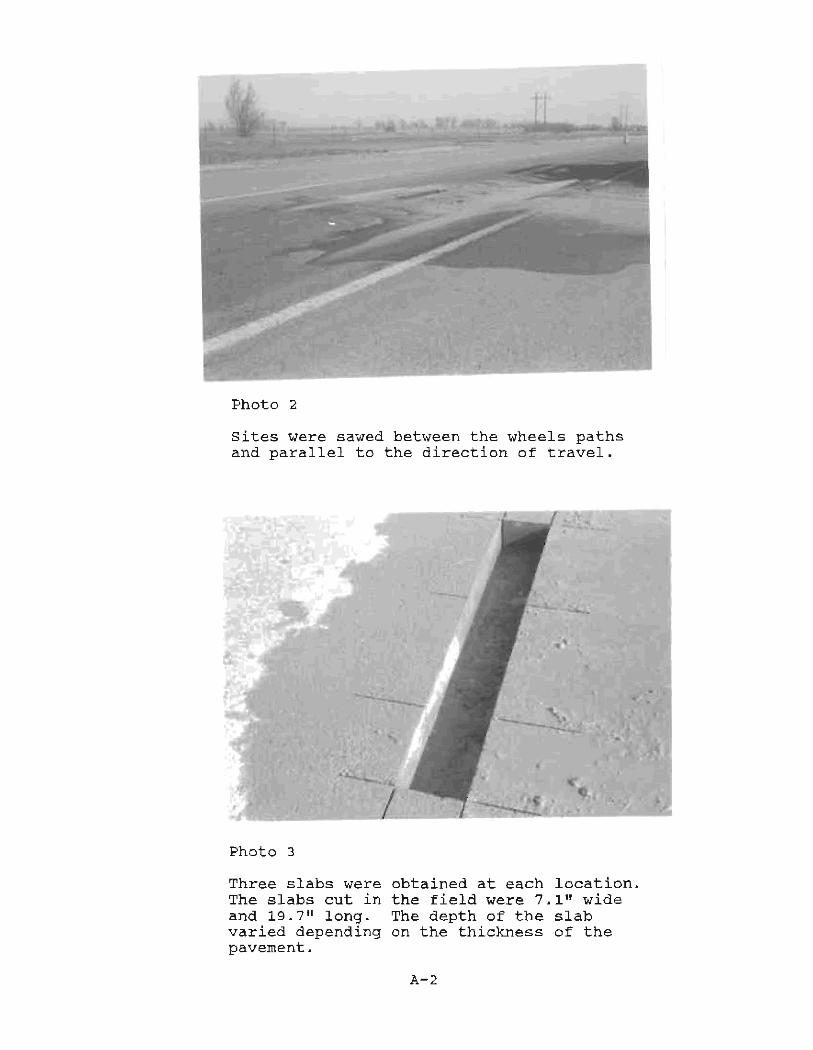
Photo 2
sites were sawed between the wheels paths and parallel to the direction of travel.
Photo 3
Three slabs were The slabs cut in and 19.7" long. varied depending pavement.
obtained at each location. the field were 7.1" wide The depth of the slab on the thickness of the
A-2

Appendix B
RUTTING DEPTHS VERSUS CYCLES
If) W _I
o >-cj
• m ~
• • v •
"<~
';: ft .~
~ • ~
k
g • o· :II
i----... ~-:::t:=:::
B-1
C<o } -. "'" ~ C- ~
0<:

" a · . • •
~ .~ ~
~I • j-Ot! 00
N ~ 2 c<:
• --f
• .. :r. • ... ~ • ~ ..J • • ~
"
I • go
N'_'_-. ~ --... !E~a:d •• 1
... o
B-2

~
• ~
~
~
• •
• g • ~. ~
• ~
•
• I • If
~
• V)
W • .J
U 0 0 ~
)- ~
• (j •
~
•
:.-g---m •
.. ... .., lilt .. "" N
B-3
~
• ~
• • • "
" r • .-:9 • • •
• " " I • If
• \I) " W
" -.I
0 & . ~
~ •
U
o !! . __ .j..j4.L
~I -~ ~ -.9
" ...
B-4
~I .. j-~
c><
, ... o
------ - ._-_._-_._._. __ ._-_._ -_. -. - -- _._---. -,.-
• G
0
~~ • ft C)o :i-0.. ..,
I.!) -s H ~ g "'" • • r 'J.
" ~ • ... G
-! ~
0
~
• ft
I • If
V) ft
W ~
.J
U i 2
>- • =
<J • • ft
QuJ4- l- :t:
B- 5
• ~
~
• ~
~ • ft G J-
<') -s • <;x:. 2 a::
• f .. • .... ~
i--.. p' m ,
V) " W • -' U &
~ >- •
U
:~ g----1Rml
B-6

~
~
~
~
•
~ ~ L
~ " ~ ," !::
" N tr -.l. . - ~ g ~
c<:
• .-
r ~ • ~ ~ :r
i-~---I.
~ If) W
N
-' U
0 0 ~
>-<J
----... ~ ---.f: mw:.l=I~;;J:,"
-. N o
B-7

~
~
• ~
• •
~ ~ ~ •
" 0., I'-
N Co g • 0' • :r. :9 " ~ ~ ~
• 0 -1
•
• ~
" I 0
!f
l/) W -.l
U ~ ____ .g >-<J
N-mma_ ~=-mm ~ : . .
11 ' : : ... "'.... ... '0#
B-8
j--S
at::
..,. o
If) w -' U
~
• ~
• • • • N
g • t • • ~
•
• ~
N
1 • If
N
~ ... -
f ~ < • .. :£
" ~ ... . - 0 \1\-1
B-9
~ ~ j--S ..
i: ex: .. ..:.
~ ..J C) ::E l.1l ::r

a
• ~
w
w
~~ •
~ ~ 1.1)
"" ~
2 • .. t • :L
3 • 0 -1
• "
~
~
I 0 go
~
V) W • -.I
<J t !!
--- • , • <J
• ~
~JIII
... o
B-IO
V) W ..J
J >-
~
~
• ~
G
• •
• 2 • r ~
• ~
G
• ~
~
I • If ~
•
~
•
•••
~f ~ ~ "
.. ~ .- • <£ :t. :lO " ~
.J ... 0 :E v)-l UJ :r
... o
B-ll

• • , • • • " ~
2 • f • • , • • •
• V) " L!.!
~
.J
U & !!
>-<J
~l • .- ~ .. ~ ... 0
(/) -'
"
:-1,,11.. , , , ,
11> .... .., (II
~ <"1 ('f'j
.. c£. .J 0 IJ.l
B-12
~ } ~ ..
~ c<:
~ :z: :r
... o

~
• , .. ~
~1 ~ •
~ -N
a .. ~ • ..
r .- • 4. :L .:;; .. ~
.J • ..... 0 ~ • LU , \/)...J :r •
•
"
• I • If
V) W
N
-.l
U 0 0 ~
>- ~
• <J •
•
N
0 !!

~
• •
~ ~ ~
~
<Y) j-~ :.>
N ~ < ::;- -S ~
g 0<: " 0 • • r :&
" ~ ... -1
• • • ~
B-14
V) W .J
U >-(j
• ~
0
0
• ~
~
g • o· 9 • •
•
~
~
1 • If
~
& ~
• •
~.
!!,~ , .
..... II> ...
"" ...... ~ = I
~I " ~ }
. , -s "
~ co::
< . , • ci: :t :li ~
..J 0 :E
...J UJ -X
.... o
B-15

V) W -.I
J >-U
• • •
• " N
2 • f • • ~
• ~
•
"
I • !l
& 0
• •
• • •
N
0 !!
N--_ !!-1tmlI
N
J ~ (
0) ~ • :£ .. ~ ... 0
..J
... o
B-16

N ----t'H' 2 • r
t • §'
• if) " W
N
.J
<.J , !
>- ~
• U
:-... !!;--::~
, .... o
B-17

If) W -I
J >-
~
G
~
~
~
N
g • r • G
~
~
~
• ~
~
I • rr • G
~
B-1B

~
m ~
• •
~ ~
~ } <>0
(V) "l- -s " 2 C\( c<:
• r .. ~ .... m
•
• m
"
:---DflI. 2----M
... • o
B-19
V) W _I
~
~
• ~
• • • ~
N
g • r • • ~
• ~
• M
U : )--
~~ • .- :J: .. ~ ....
\1)-1
~ ~ .'
j--S ..
~ """ .. <!. ::;; ..J 0 ::E UJ :r
, ... o
B-20

If) w -' U
" • • , •
~
~~ ~ ~
w
g • .. o· .- • 4-:£ :9 " ~ .J • .... 0 • -- 0
LU , ;J)..J • • ~
~
w
I • !f
" "-_-Jflllllill L • •
N
o 9 ... .!.:p:H~g:..r;:
B-21
~ . -~ :z ~ :r

~
~
~
~
~
~~ ~ •
- <)
N "'{
2 • • r -- :£
~ ~ G
~ -1 c
• • ~
I • If
N~-jll~irlll!lIl!lIlIlIlIlI ~
.... o
B-22

VI W _I
J r
-• m
• • • ~
" g • r
i-~-·-I.
l .. _II.
:-~ !!.-~
"
• •
~ ~ ~ ~ < .. ~ ..
• 4. .- ~ ~
~ ~ .J 0 :E
Vl-l UJ :r
.... " o
B-23

V) L!.! ..J
U r {J
-~ e ~
~
~
• e
N
: • f • e
~
~
• M
I • f
N
, .... '" .......
l ~ j---3
~ < \.() -S
0:::
• -- ~ .. ~ .l-
--1
B-24

~
• ~
• ~
l ~ •
~ ~ :1-N ~ <
.. -S ! ;: c..: .. r .- • 4. :t .:;;
" ~ .J • ... Q :;E • .- Q
~ V) ..J \.1l I • • • M
N
I 0
If
VI W .J
U 0 0 0
>-<J
• M
N
0 9
B-25

If) w -' U )-
(j
-~ • ~
~
~
•
" N
r • f ~
• •
• M
N
& • If
~~ • .- :£
" ~ .... \1)-1
N _.~ ~---n ~ • •
...
~ .. c:( .J 0 I.U
B-26
~ j--S ..
~ co:
:< :2 :r
.... o

I/) W -1
V >-
-~ . G
~
~
" N
g • f • G
~
~
" •
."
N
I • f
N-----m~
;---mE • G
~~ ~ -. • -- :£ ~ 0
-1
:---mwa. !! ____ Mr+:q::
.... '" ..... I'll N
B-27
~
'-' ~
V) W -.I
o >-
~
m
~
~ f a
~
~ ~
~
a • • --r ~ .. ~ ~ ...
0 • -I
I o ~
•
:-~ 2-ffidm1 ~
• ~
.;
:m~
" ,
B-28
' I ti
~ j--s
c<:
... o

\f) W -I
U >U
~
m ~
~
~
• ~
N
: • f • • ~
• • • ~
• I 0
If
~t ~ 9 .. ~ . . .- • <£. :l- s;
" ~ .J ... 0 ::E .- Q llJ \1)-1 I
N-. ~.-.~
.... o
B-29
V) W _I
U
•
i---mtII ~' ~~
. --·--~w~~
• •
, ... o
B-30

\f) w -.I
U )-
<J
.---f
• •
v
" ~
0 0 !!
• • ~
• M
•
0 !!
• •
. -... !! -JUm
•
B-31
." , ... o

VI W -I
V >-<J
~----j,
N
2 • f • • , ~
• ------i~ • --------1=1'
~ ---------bd'
i -------111141 !f.;-:.:::.:::~W~ • , • • • "
" •• !! ~ , :: S: i ... III UI on '"
B-32
, N ...
o

V) W -J
V ~
U
-~ • • •
" N
g • f ~
• •
•
" N
I • If ~
•
• • •
N
0 0 !!
• •
N :-Jlrillilllillll!lI~; ~ ~
•
B-33
, ... o