comparison of operator line-of-sight t (los) … · comparison of operator line-of-sight ... laser...
TRANSCRIPT

Transaction
Paper
IntroductionSeveral studies1–4 have investigated operatorline-of-sight (LOS) associated with driving aload-haul-dump (LHD) vehicle. Their findingsindicated poor LOS was a causal factor formany underground mine accidents that haveresulted in injury to pedestrians andequipment operators and damage to otherequipment. In a 2004 publication Eger4 et al.reported modifications to the design ofoperator cab posts, engine covers, lightbrackets, boom hoses, vent/exhaust systems,and mud guards would be beneficial forincreasing operator LOS. In an effort to preventfuture accidents associated with poor LOS,accurate and reliable methods to evaluate LOSduring the operation of mobile miningequipment are needed.
Current techniques for analysing LOS forLHD vehiclesThe next section will briefly outline several
current techniques used within the miningindustry to assess operator LOS for LHDvehicles. For further information on theoutlined procedures please refer to the originalresearch papers.
Light filament method for assessing LOS
The light filament (LF) method established byEger4 et al. for assessing LOS from LHDvehicles was adapted from the ForestEngineering Research Institute of Canada(FERIC)5 standardized model originallydeveloped for visibility testing of forestmachinery. The LF method was designed forthe underground mining environment, whilethe FERIC method utilized a 12-metre radiuscircle for recording operator visibility, whichmakes it impractical for undergroundapplications (due to the size of most minedrifts). The methodological procedures of theLF method can easily be used by individualswith little training within the mining industry.This method has been proven to be successful4at providing awareness about factors resultingin poor LOS to pedestrian workers, other minevehicles, as well as ground hazards. Thedocumented limitations of the LF methodinclude the time requirements to perform astatic field assessment, approximately threehours for one vehicle, with additionallaboratory hours required to produce a staticvisibility grid4. Furthermore, the results of theLF method are represented as a static two-dimensional (2D) horizontal visibility grid atground level, which is a poor representationfor LOS of the visual field experienced by an
Comparison of operator line-of-sight(LOS) assessment techniques:evaluation of an underground load-haul-dump (LHD) mobile mining vehicleby J. West*, M. Haywood†, P. Dunn†‡, T. Eger*, S. Grenier*,and C. Whissel§
Synopsis
For many years line-of-sight (LOS) issues for underground mobileequipment is a growing focus of research. This research is a resultof the numerous fatalities and injuries which occur in the miningindustry and which are related to poor operator LOS. Threeassessment methods are currently used to assess operator LOS ofunderground mobile equipment. The light filament (LF) method is ahands-on assessment method that is performed in the field. Thismethod is not evaluated in this paper. The laser scan (LS) methodof assessing equipment is a quick and reliable method that comesfrom the need to evaluate vehicles already located in the field. Thecomputer simulation (CS) method can assess LOS issues using acomputer aided drawing (CAD) model, which is useful for assessingcurrent or prototype models. The purpose of the current research isto compare and validate different operator LOS assessmentmethods. Comparison of the results of the LS and CS visibility plotsyielded similar quantifiable results. A visual comparison of theresults further illustrate that the LS and CS methods are acceptableassessment tools for mobile equipment operator LOS evaluation.The visibility assessment methods are now being prepared asguidelines for the mining industry to assess current and potentialdesigns.
* School of Human Kinetics, Laurentian University.† MIRARCO, Laurentian University.‡ School of Engineering, Laurentian University.§ Department of Psychology, Laurentian University.© The Southern African Institute of Mining and
Metallurgy, 2007. SA ISSN 0038–223X/3.00 +0.00. Paper received Jun. 2006; revised paperreceived Apr. 2007.
315The Journal of The Southern African Institute of Mining and Metallurgy VOLUME 107 REFEREED PAPER MAY 2007 ▲
Comparison of operator line-of-sight (LOS) assessment techniques
operator in the underground mining environment. Inaddition, this procedure lacks the quantitative ability todetermine whether vehicle modification or redesign would besignificantly beneficial to the operator for increased LOS. Forexample, if retrofits or modifications are implemented on aLHD vehicle the true benefit may not be properly representedin the static 2D horizontal visibility plot due to the three-dimensional (3D) nature of the environment.
Laser scanning to evaluate LOS
Bhattacherya6 developed a laser scan (LS) method, whichutilizes a terrestrial laser scanning system (commonly used insurveying applications) to assess operator LOS for LHDvehicles in the field. The laser scanner uses a pulsed greenlaser based on time-of-flight laser ranging technology. Thesystem measures the amount of time required for the laser toreflect from a surface, which is then used to calculate thedistance between the laser scanning system and the reflectionsurface7. The information captured from the environmentdisplays a cloud of points, which is presented as x, y, zcoordinates of the Cartesian plane for areas that are in thelaser scanning systems LOS6. Utilizing the collected cloud ofpoints data Bhattacherya6 developed a 2D static visibility plotsimilar to the output of the LF method but with increaseddetail. The advantages of using the LS method include itsappropriateness for field assessments (portability), non-contact method, and rapid capture of large amounts of data,as well as the ability for the data to be imported into a virtualenvironment6. However, due to the laser scanner using atime-of-flight technology, boundary limitations affect thequality of the scan6. For example, the surface from which thelaser scanner is being reflected must be relatively smooth andenclose the entire vehicle for repeatable results. Furthermore,the LS method developed by Bhattacherya6 provide static 2Dvisibility plots, which are not representative of what theoperator would view in the underground miningenvironment. However, an LS application that would displaycaptured LOS output as horizontal and vertical visual fieldswould be more beneficial.
Computer simulation to evaluate LOS
Jeffkins8 et al. document a successful and reliable method toevaluate LOS using a computer software package known asClassic JACK. A visibility audit9 and target audit assessmentprotocol was adopted by Jeffkins8 et al. to quantify the LOSavailable to a virtual operator situated in a computer-aideddrawing (CAD) LHD model. The results yielded a visibilitypercentage score represented on a 2D horizontal planepositioned at a height of 1 m. Their research goes on to reportthat using computer simulation to assess LOS for LHDvehicles is found to be reliable. However, this method waslimited by the presentation of the results in a 2D horizontalformat not characteristic of the mining environment. Anothermethod utilized by Jeffkins8 et al. to evaluate LOS was thetarget audit, which incorporates the use of vertical visibilityplanes located at five locations deemed necessary fordetecting objects at various heights for safe operation of aLHD within a mine drift. The advantage of this method is thatLOS data is captured in vertical planes of various heights and
is positioned to represent a mine drift. However, this methoddoes not entirely surround the vehicle with visibility planes,which may allow for important attributes that limit LOS forLHD vehicles to go unnoticed. Assessing operator LOS usinga boxplot method conceived by Eger10 et al. surrounds theentire CAD LHD model with visibility planes (similar to thetarget audit) in a box orientation. However, little research hasbeen performed to confirm the usability and reliability of thismethod.
Several of the LOS assessment methods discussed aboveare currently being used to evaluate LHD vehicles with littleknowledge about the quality, reliability and applicability for amining application (i.e. are the results representative orapplicable to a vehicle operating in a typical mining drift?).Therefore the purpose of this paper is to compare the LOSoutput from an adapted laser scan method with a computersimulation plot method (hereby referred to as a boxplot).Each method was used to determine operator LOS whendriving a small LHD vehicle. The LS method was applied inthe field, whereas the CS method was used to evaluate LOSusing a CAD model of the same LHD vehicle, which wassituated in a virtual environment that was constructed tomimic the real-life situation. These methods are useful forassessing LOS in different applications and settings. Theobjective of this investigation was to review and compare theoutputs of the two assessment methods in order to determineaccuracy and applicability.
Methodology
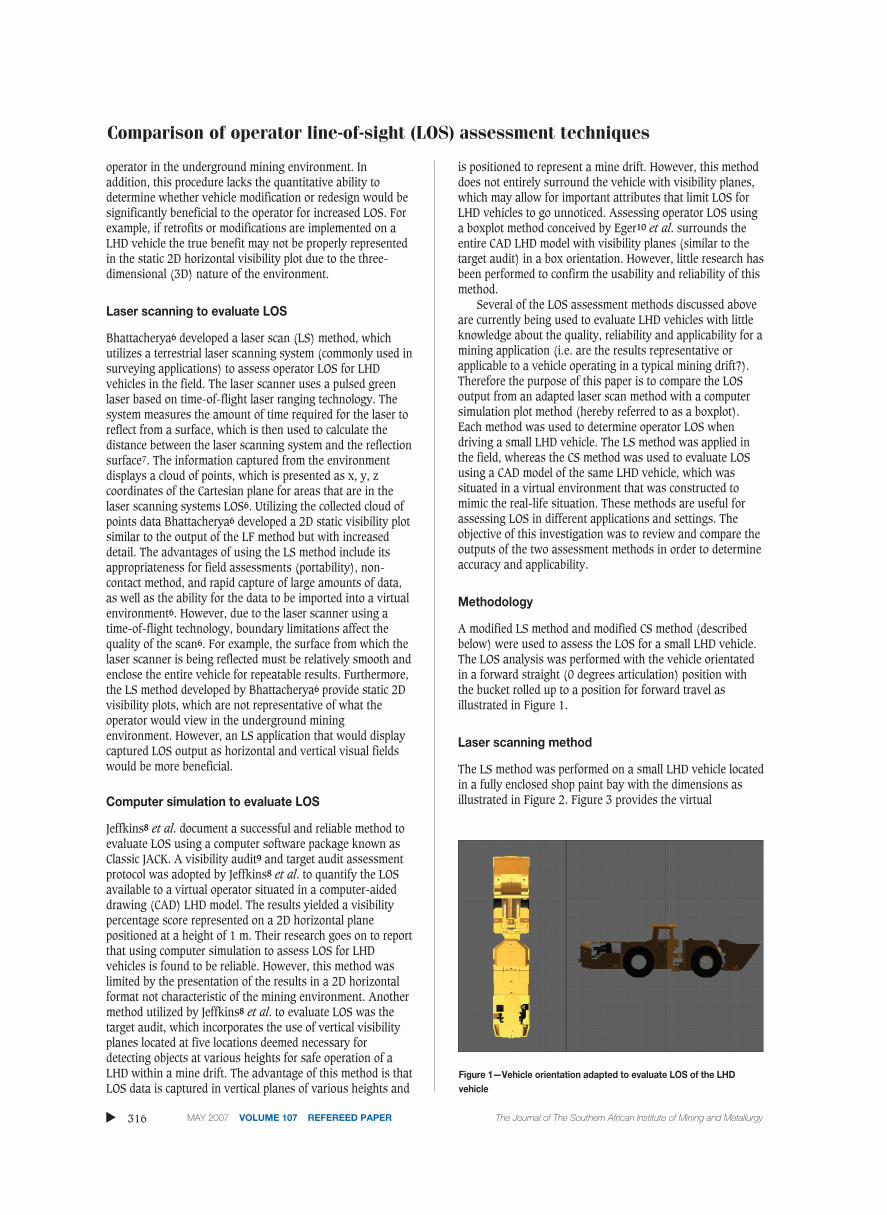
A modified LS method and modified CS method (describedbelow) were used to assess the LOS for a small LHD vehicle.The LOS analysis was performed with the vehicle orientatedin a forward straight (0 degrees articulation) position withthe bucket rolled up to a position for forward travel asillustrated in Figure 1.
Laser scanning method
The LS method was performed on a small LHD vehicle locatedin a fully enclosed shop paint bay with the dimensions asillustrated in Figure 2. Figure 3 provides the virtual
▲
316 MAY 2007 VOLUME 107 REFEREED PAPER The Journal of The Southern African Institute of Mining and Metallurgy
Figure 1—Vehicle orientation adapted to evaluate LOS of the LHDvehicle

environment representation of the paint bay. The datacollection techniques, established by Bhattacherya6, wereutilized to complete the LOS evaluation using laser scanning.A GS100 laser scanner affixed to a tripod was located withinthe operator cabin positioned over the seat at a height of 650mm from the seat index point (SIP) with a 70 kg forceapplied to the seat to replicate approximate eye position of a50th percentile male as performed in 2004 by Eger1 et al. Thelaser scan of the vehicle was then performed and recorded.
Computer simulation method
A computer aided drawing (CAD) of the same model of LHDtested with the laser scan method was imported into thevirtual environment of the computer software program ClassicJACK (v4.1) developed by Unigraphics Solutions Inc. (UGS)as illustrated in Figure 3. A 50th percentile male virtual
human was positioned in the cabin of the CAD created LHDvehicle, the simulated eye position was orientated at thevirtual site ‘bottom head sight’ and located 650 mm directlyover the SIP with the eye point stationary (not effected byposture) as outlined in the laser scan method.
Visibility planes were created in the computer simulationprogram at the same location as the boundary walls usedwith the laser scanning method (refer to Figure 2). Smallervisibility squares were created within the visibility planes(front, back, right, and left), which consisted of a size of 0.5 m x 0.5 m (refer to Figure 4 and 5 for visibility planebreakdown).
Laser scan data analysis
Processing of the cloud of points data collected from the laserscan were reconstructed into 3D models using 3Dipsossoftware designed specifically to create enhanced 3Dmodelling of laser scanned images. The 3D reconstructedcloud of points models were then analysed using Matlabv6.1. A series of mathematical functions were created, whichseparated the x, y, z coordinate data from the Cartesian planeinto four separate front, back, right, and left planes. Visibilityassessment planes were created to analyse the smallervisibility squares (0.5 m x 0.5 m), which were used for thecomparison of the LS and CS data. The visibility squares were
Comparison of operator line-of-sight (LOS) assessment techniquesTransaction
Paper
317The Journal of The Southern African Institute of Mining and Metallurgy VOLUME 107 REFEREED PAPER MAY 2007 ▲
Figure 2—Recorded on-site measurements for the LS method
Figure 3—Orientation of paint walls represented as visibility planessurround the test LHD presented in the virtual environment
Figure 5—Visibility squares orientation in the right/left visibility sideplanes
Figure 4—Visibility squares orientation in the front/back visibility planes

Comparison of operator line-of-sight (LOS) assessment techniques
used to calculate the per cent of visible area in each visibilityplane (breakdown of the planes are illustrated in Figures 3and 4). The per cent of visible area was calculated bysumming up the cloud of points data that were located ineach visibility square. This value was then divided by theaverage value of laser points, which were located in squaresthat were deemed 100 per cent visible by the laser scanner.The end product produced a per cent visible score for eachvisibility square. This process was repeated for each square todetermine an individual visibility score. In addition, anoverall per cent value was also obtained for each visibilityplane.
Computer simulation data collection and analysis
Data collection for the computer simulation method wasperformed by using the coverage zone tool in the JACKprogram to determine LOS from the virtual operator’sposition. The location between the eyes was selected on thevirtual operator as the point of origin; the toolkit wasadjusted to a resolution of ten horizontal units and tenvertical units; and the human geometry was ignored todisregard postural changes of the virtual human and treat theeye point as a stationary point as used in the LS method. Aper cent visible score of obstructed area was obtained foreach visibility square as produced by the coverage zone tooland recorded into a spreadsheet. As outlined in the laserscanning method an overall per cent value was also obtainedfor each visibility plane.
Comparison of LS and CS dataThe values obtained from each visibility square within eachvisibility plane for both the LS and CS methods were recordedin the same fashion. The per cent difference between eachvisibility square was calculated. In addition, the cloud ofpoints data was imported into the virtual environment andoverlaid with the CS collected data for the purposes of visualcomparison. The visual comparisons were performed toidentify areas of discrepancy in visible and/or obstructedareas between the two methods.
ResultsLOS generated outputs from the LS method (imported into avirtual environment) along with the output from the CSmethod are illustrated in Figure 6. An overlay technique wasused to visually compare the 3D generated plots. Differencesare observed in Figure 7, and per cent differences betweenthe two methods are reported in Table I.
The 3D representation was separated into front, back,right and left visibility planes for the LS method and CSmethod (Figure 8). The per cent difference for the visibilitysquares within each visibility plane are presented in Table I,(A) front visibility plane, (B) left visibility plane, (C) backvisibility plane, and (D) right visibility plane. The valuesrepresented in Table I are recorded and displayed as the percent difference between the computer simulation method andlaser scan method for each visibility square for each plane(CS percentage score minus LS percentage score). Hence, alarge positive value would denote a large variation between
▲
318 MAY 2007 VOLUME 107 REFEREED PAPER The Journal of The Southern African Institute of Mining and Metallurgy
Figure 6—LS method cloud of points output with blue representing visible area (left) in virtual environment and CS method output with green representingvisible area and red represents the obstructed area to operator (right)
Figure 7—Overlay of LS output (blue area represents visible area) and CS output (green area represents visible area and red represents obstructed area)

Comparison of operator line-of-sight (LOS) assessment techniquesTransaction
Paper
The Journal of The Southern African Institute of Mining and Metallurgy VOLUME 107 REFEREED PAPER MAY 2007 319 ▲
Table IPer cent difference of visible area for the LS and CS assessment methods
(A) Front visibility planeZone X
Zone Y 1 2 3 4 5 6 7 8 9 10 11 12 13
10 54.55 54.55 60.33 63.64 63.64 63.64 63.64 63.64 63.64 63.64 63.64 70.25 83.129 86.70 86.00 82.60 81.20 78.80 76.20 77.10 81.60 74.50 79.10 71.90 71.70 77.008 0.00 0.00 0.00 0.00 0.00 0.00 0.00 0.00 35.90 28.10 0.00 0.00 0.007 0.00 0.00 0.00 0.00 27.80 35.70 33.10 24.20 30.60 14.60 0.00 14.30 0.006 0.00 0.00 12.80 33.50 64.40 64.90 85.40 60.70 25.90 13.60 0.00 36.90 0.005 0.00 0.00 0.00 41.40 65.90 76.10 75.20 69.20 35.80 0.00 14.40 72.00 0.004 0.00 0.00 24.80 47.30 61.00 70.30 79.10 59.40 45.50 25.40 0.00 32.40 0.003 0.00 0.00 10.87 19.67 29.00 34.24 38.92 41.58 40.97 25.20 0.00 26.70 0.002 -28.10 -43.72 -2.90 -2.70 0.00 0.00 0.00 0.00 7.09 5.04 -45.61 -11.54 -30.311 21.89 -13.78 0.00 0.00 0.00 0.00 0.00 0.00 0.00 0.00 -26.70 0.00 -21.73
(B) Left visibility planeZone X
Zone Y 1 2 3 4 5 6 7 8 9 10 11 12 13
10 37.19 4.96 0.00 0.00 0.00 0.00 0.00 0.00 0.00 0.00 0.00 0.00 0.009 53.18 88.43 49.59 10.74 0.00 0.00 0.00 0.00 0.00 0.00 0.00 0.00 0.008 0.00 39.04 41.73 51.76 54.42 38.02 10.74 0.00 0.00 0.00 0.00 0.00 0.007 0.00 23.62 0.00 0.00 0.00 38.05 94.21 23.14 0.00 -18.53 -37.77 0.80 0.006 0.00 20.65 0.00 0.00 0.00 0.00 100.00 45.45 0.00 -100.00 -12.40 -9.92 -19.835 0.00 17.68 0.00 36.35 0.00 0.00 100.00 45.45 0.00 -93.39 -2.48 0.00 0.004 0.00 27.02 0.00 57.85 0.00 0.00 100.00 45.45 -0.14 -90.91 0.00 0.00 0.003 0.00 54.88 0.00 13.62 -4.13 0.00 100.00 42.98 0.00 -90.91 0.00 0.00 0.002 -61.98 23.04 0.65 -15.11 -95.04 -44.63 80.17 36.36 0.00 -93.39 -13.22 -19.83 -29.751 -2.41 -6.49 -17.01 0.00 -13.72 -23.20 9.92 12.40 0.00 0.00 0.00 0.00 -10.18
Zone XZone Y 14 15 16 17 18 19 20 21 22 23 24 25
10 0.00 0.00 0.00 0.00 0.00 0.00 0.00 0.00 0.00 2.29 -5.15 -6.829 0.00 0.00 0.00 0.00 0.00 0.00 0.00 0.00 -19.50 -19.01 0.00 0.008 0.00 0.00 0.00 0.00 0.00 0.00 4.99 -40.50 -1.65 0.00 0.00 0.007 0.00 0.00 0.00 0.00 0.00 -71.07 -13.22 0.00 0.00 0.00 0.00 0.006 -30.58 -40.50 -75.21 0.00 4.96 -5.79 0.00 0.00 0.00 0.00 0.00 0.005 0.00 0.00 -42.15 0.00 1.65 -7.44 0.00 0.00 0.00 0.00 0.00 0.004 0.00 0.00 -35.54 0.00 0.00 -18.18 0.00 0.00 0.00 0.00 0.00 0.003 0.00 0.00 -27.27 0.00 0.00 -28.93 0.00 0.00 0.00 0.00 0.00 0.002 -39.67 -49.59 -71.07 0.00 0.00 -51.24 -2.48 0.00 0.00 0.00 0.00 0.001 -0.71 0.00 0.00 0.00 0.00 0.00 14.88 31.83 -16.68 -20.86 -5.37 -27.68
(C) Back visibility planeZone X
Zone Y 1 2 3 4 5 6 7 8 9 10 11 12 13
10 0.00 0.00 0.00 0.00 0.00 0.00 0.00 0.00 0.00 0.00 0.00 0.00 0.009 0.00 0.00 0.00 0.00 0.00 0.00 0.00 0.00 0.00 0.00 0.00 0.00 0.008 0.00 0.00 0.00 0.00 0.00 0.00 0.00 0.00 0.00 0.00 0.00 0.00 0.007 0.00 0.00 0.00 0.00 0.00 0.00 0.00 0.00 0.00 0.00 0.00 0.00 0.006 0.00 0.00 0.00 0.00 0.00 0.00 0.00 0.00 0.00 0.00 0.00 0.00 0.005 0.00 0.00 0.00 0.00 0.00 0.00 0.00 0.00 0.00 0.00 0.00 0.00 0.004 0.00 0.00 0.00 0.00 0.00 0.00 0.00 0.00 0.00 0.00 0.00 0.00 0.003 0.00 0.00 0.00 0.00 0.00 12.68 8.57 9.82 7.53 0.00 0.00 0.00 0.002 0.00 0.00 9.05 -5.43 29.31 1.65 0.00 0.00 3.31 18.32 9.67 -1.07 0.001 0.30 31.62 8.26 0.00 0.00 0.00 0.00 0.00 0.00 0.00 0.00 0.83 -24.30
(D) Right visibility planeZone X
Zone Y 1 2 3 4 5 6 7 8 9 10 11 12 13
10 72.73 42.15 11.57 0.00 0.00 0.00 0.00 0.00 0.00 0.00 0.00 0.00 0.009 53.10 100.00 95.04 57.85 6.61 0.00 0.00 0.00 0.00 0.00 0.00 0.00 0.008 0.00 64.60 60.20 70.10 49.65 0.00 0.00 0.00 0.00 0.00 0.00 0.00 0.007 0.00 49.50 33.90 19.50 -27.27 -64.50 0.00 0.00 0.00 8.26 0.83 11.57 14.056 0.00 51.50 32.10 16.10 -20.66 -100.00 -1.20 0.00 0.00 30.62 -27.27 -23.14 0.005 19.40 43.70 26.30 58.60 -18.18 -100.00 -5.30 0.00 0.00 15.15 0.00 0.00 0.004 0.00 42.70 23.10 61.90 -18.18 -100.00 -9.10 0.00 0.00 54.35 0.00 0.00 0.003 0.00 44.40 25.20 40.40 -9.92 -100.00 -7.30 0.00 0.00 54.55 0.00 0.00 0.002 -52.89 6.84 8.31 39.77 -9.09 -100.00 -1.50 0.00 0.00 8.01 0.00 0.00 0.001 23.46 -13.59 -1.60 4.81 -4.94 -22.30 -0.20 0.00 0.00 25.38 59.56 54.55 38.02
Zone XZone Y 14 15 16 17 18 19 20 21 22 23 24 25
10 0.00 0.00 0.00 0.00 0.00 0.00 0.00 0.00 0.00 1.65 20.40 0.029 0.00 0.00 0.00 0.00 0.00 0.00 0.00 0.00 -0.65 43.45 15.90 0.008 0.00 0.00 0.00 0.00 0.00 0.00 0.28 -25.20 -8.26 16.40 0.00 0.007 2.48 0.00 0.00 0.00 0.00 -48.20 -41.32 0.00 0.00 0.00 0.00 0.006 -7.44 -21.49 -57.85 0.00 0.00 -100.00 -22.31 0.00 0.00 0.00 0.00 0.005 0.00 0.00 -27.27 0.00 0.00 -100.00 -32.23 0.00 0.00 0.00 0.00 0.004 0.00 0.00 -19.83 0.00 0.00 -100.00 -42.15 0.00 0.00 0.00 0.00 0.003 0.00 0.00 -14.05 0.00 0.00 -83.30 -52.07 0.00 0.00 0.00 0.00 0.002 0.00 0.00 -11.57 0.00 0.00 -21.40 -63.64 0.00 0.00 0.00 0.00 0.001 50.41 56.20 22.31 0.00 0.00 5.79 28.60 29.65 5.63 19.03 32.83 38.81

Comparison of operator line-of-sight (LOS) assessment techniques
the two assessment methods where the computer simulationmethod reported a visible area and the LS method reported anobstruction. Likewise, a low value or near zero percentagescore would denote little variation between the CS and LSoutput (i.e. CS reports slightly better visible area thanreported by the LS method). A per cent score of zero woulddenote that CS and LS methods are reporting the same valuesfor that specific area. A zero or low positive or negative valueindicated a good correlation and large positive or negativevalues indicates a large variation. The overall results for thevisibility difference for each individual visibility plane aredisplayed in Table II. Table II presents an adjusted differencefor the front plane. This was performed where there was alack of recorded data for the laser scanning method (Figure8a). The adjusted difference was determined by removing thetop section of the computer simulation to eliminate themissing information. In other words, the comparison for thefront plane was performed only up to the 4 m point. Thestrengths and weakness of the LS and CS evaluation methodsas performed in this paper are summarized in Table III.
Discussion
In general, the results of the LS method and CS methodcomparison yielded similar findings in operator LOS asreported in Table I and presented in Figure 8. The results
demonstrate that variations do exist between the datacollected by the two methods; however, the results arepromising and indicate that each method depicts the generalshape of the operator visibility profile.
The per cent difference between the CS method comparedto the LS method for the back visibility plane was 0.9 percent, the right visibility plane 1.5 per cent, the left visibilityplane -0.04 per cent, and the front visibility plane 26.7 percent. With the top section variance removed by deleting thefirst two rows of the front plane, thereby eliminating theerror, the total difference between the two LS and CS methodswas found to be 15.5 per cent. This difference results in adecrease of 11.2 per cent visible area compared to the 26.7per cent difference found with the initial assessment.
The discrepancies found between the output methodsmay be attributed to the methodological set-up of the LS fieldassessment. Some possible reasons for the differences maybe attributed to the laser scanner position being slightlyoffset from the seat index point (SIP), which may not havebeen accurately recreated in the CS virtual environment.Similarly, if the laser scanner was not positioned exactlyhorizontal the laser scan would inaccurately report the datacollected6. In addition, the vehicle orientation may not havebeen reproduced in the virtual environment as exactlyencountered during the field LS assessment (i.e. the vehicle
▲
320 MAY 2007 VOLUME 107 REFEREED PAPER The Journal of The Southern African Institute of Mining and Metallurgy
Figure 8—Illustration of LS output (blue area—visible to operator), CS output (green area—visible to operator, red area—obstructed to operator) andoverlap (purple area—LS determined the area to be visible and CS determined the area to be obstructed) for each plane from within the LHD cabin: (a)Front visibility plane (b) Left visibility plane (c) Back visibility plane and (d) Right visibility plane. Images on the left were generated with the LS, images inthe middle column were generated with CS and the right column shows the overlay between the two methods
(a)
(b)
(c)
(d)
Table II
Overall per cent difference for individual visibility planes
Visibility plane Laser scan Per cent visible (%)Computer simulation Difference Adjusted difference
Front 50.42 77.09 26.68 15.49Back 85.48 86.41 0.9 0.9Right 45.54 47.07 1.53 1.53Left 50.22 50.18 -0.04 -0.04

articulation during LS might not have been exactly 0 degreesas recreated in the CS method). If a small discrepancy withthe orientation of the LHD vehicle in the field compared tothe virtual environment exists, this would explain some ofthe differences in the output between the LS and CS methods.
Laser scanners use time-of-flight technology, which couldalso account for differences in LS and CS results7. Thistechnology requires a relatively smooth reflection surface.Any variations in the walls of the paint bay such asdoorframes or hanging objects that may have been capturedin the laser scanner cloud of points data may have slightlymodified the visible area captured during the fieldassessment. Variations in vehicle dimensions throughmanufacturing processes of components between the fieldLHD (LS) and the CAD LHD (CS) may have also influencedthe resultant outputs of the two methods. Additionalcomponents fitted to the vehicle (post original CAD model)could include: boom hoses, valve covers, cabin glass seals, aswell as after market add-ons such as fire extinguishers,wheel chocks, etc. In this case the equipment was close to theoriginal design and had not been retrofitted yet.
ConclusionsManufacturers of LHD vehicles are continually working toimprove LOS for their vehicles by incorporating additionalwindows to the current cabin design and relocatingcomponents such as light brackets and hoses, in addition torounding vehicle corners. However, the industry is lacking a3D method for LOS evaluation, which can be easily used infield applications or with CAD models. A 3D evaluationmethod would allow manufacturers to locate and selectvehicle components for maximum operator LOS and it wouldenable health and safety professionals within miningcompanies to evaluate LOS from existing vehicles in order toidentify retrofit modifications or changes to mine layouts. Anaccurate LOS assessment method would also allow for aninformed vehicle selection process for specific miningenvironment areas, in addition to complementing mineplanning and layout strategies while developing mineinfrastructure such as designated pedestrian walkways. Thecomparison of the LS and CS method illustrated that bothmethods are capable of visually displaying operator LOSissues. The LS output demonstrated accurate depictions ofthe general shape of the LOS outputs produced from the CSoutput. From these findings two independent visibilityassessment techniques have been calibrated against eachother.
Future recommendations include the collection of adetailed set-up of the laser scan method for accuratereplication in the virtual computer simulation environment.Future testing could also examine different size LHD vehiclesand conduct field testing in different environments.
Acknowledgements
Funding for this research was provided by the WorkplaceSafety and Insurance Board of Ontario (WSIB), and MiningInnovation, Rehabilitation and Applied Research Corporation(MIRARCO). Support from the Mines and Aggregates Safetyand Health Association is appreciated. Additional thanks tothe mobile equipment vehicle manufacturers, the Ontariomining industry and mineworkers.
References
1. BOOCOCK, M.G., WEYMAN, A.K., CORLETT, T.C., anD NAYLOR, J. The problemsof restricted visibility from free-steered mining vehicles. Vision inVehicles, V. Gale, A.G. et al. (eds.). 1996. pp. 355–362.
2. RUSHWORTH, A.M. Reducing accident potential by improving theergonomics and safety of locomotive and FSV driver cabs by retrofit.Mining Technology, 78 (898). 1996. pp. 153–159.
3. TYSON, J. To see or not to see…that is the question. Ergonomics Australia.Available at: http://uq.edu.au/eaol/oct97/tyson/tyson.html. 1997.
4. EGER, T., SALMONI, A., and WHISSELL, R. Factors influencing Load-Haul-Dump operator line of sight in underground mining, Applied Ergonomics,vol. 35, no. 2, 2004. pp. 93–103.
5. GOLSSE, J.M. Forest Engineering Research Institute of Canada SpecialReports, SR-100. 1994.
6. BHATTACHERYA, I. Visibility Assessment of Underground Mobile Equipment.Unpublished Masters Thesis, Laurentian University, Sudbury, Ontario,Canada. 2004.
7. KERSTIEN, T., STERNBERG, H., MECHELIK, K., and ACEVEDO PARDO, C..Terrestrial laserscanning system Mensi GS100/GS200 – Accuracy testing,experiences and projects at the Hamburg University of Applied Sciences.Panoramic Photogrammertry Workshop 2004.
8. JEFFKINS, A., EGER, T., SALMONI, A., and WHISSELL, R. Virtual JACK in avirtual machine: Computer simulation is beneficial for investigatingvisibility during mobile mining equipment operation. Ergonomics inDesign, vol. 12, no. 2, 2004. pp. 12–17.
9. GIGUERE, D. and LARUE, C. The Visibility Audit: A Conceptual Frameworkfor the Assessment of Visibility Around Trucks and Industrial Vehicles.Vision in Vehicles, V. Gale, A.G. et al. (eds.). 1996. pp. 371–378.
10. EGER, T., GODWIN, A., DUNN, P., and SALMONI, A. Computer-aided design andvirtual reality investigations of line-of-sight for operators of miningequipment. Association of Canadian Ergonomics Conference Proceedings,Windsor, ON. 2004.
11. EGER, T., SALMONI, A., and WHISSELL, R. Factors influencing Load-Haul-Dump operator line of sight in underground mining, Applied Ergonomics,vol. 35, no. 2, 2004. pp. 93–103. ◆
Comparison of operator line-of-sight (LOS) assessment techniquesTransaction
Paper
The Journal of The Southern African Institute of Mining and Metallurgy VOLUME 107 REFEREED PAPER MAY 2007 321 ▲
Table III
Summary of strengths and weaknesses of the two methods
Laser scanning method Computer simulation method
Strengths • Portable (can be used in field) • Rapid• Rapid (~1h per scan) • Current and prototype models can be evaluated• Great for replicating real world in a virtual environment • Potential modifications to vehicle designs can be easily evaluated• 2D and 3D representations • Allows the operating environment of the vehicle to be modelled• Applicable for assessing aftermarket addition/ modifications • 2D and 3D representations
• Dynamic environment (can account for operator postural changes)
Weaknesses • Static environment • Expensive (software)• Expensive • Requires trained individual to perform the assessment• Requires trained individual for operation • Not suitable for field assessments• Quality of scan depends on environment • Not representative of aftermarket modifications (without CAD model)• Not representative of the mining environment (depends on setting)• Additional lab hours required to produce the output plots