comparison of link-based and smoke processed motor vehicle emissions over the greater toronto area...
TRANSCRIPT
COMPARISON OF LINK-BASED AND SMOKE PROCESSED MOTOR VEHICLE EMISSIONS
OVER THE GREATER TORONTO AREA
Junhua Zhang1, Craig Stroud1, Michael D. Moran1, Brett Taylor2, and David Lavoué3
1. Air Quality Research Division, Environment Canada, Toronto, Ontario, Canada
2. Pollutant Inventories and Reporting Division, Environment Canada, Gatineau, Quebec, Canada
3. Golder Associates Ltd., 2390 Argentia Road, Mississauga, Ontario, Canada
11th Annual CMAS Conference, Chapel Hill, NC, Oct. 15-17, 2012

Page 2 – April 19, 2023
OVERVIEW:• Introduction
• On-road mobile emissions processing by SMOKE
• Link-based on-road mobile emissions processing
• Temporal and spatial comparisons between SMOKE-processed and link-based on-road emissions
• Potential improvements to representation of on-road emissions for air quality modelling, especially for high-resolution modeling

Page 3 – April 19, 2023
Objective of this study:Prepare on-road mobile emissions for high
resolution (~1km) air quality modeling for the Greater Toronto Area (GTA)
• Largest urban area in Canada, with a population of 5.5 million in 2011• Major highways that link cities in the U.S. and Canada• Busy local arterial network

Page 4 – April 19, 2023
Emissions Processing by SMOKE (1):
Canadian On-Road Emissions Inventory
Temporal:
Monthly Totals
Spatial:
Mostly Provincial Totals
Source Category:
By Vehicle Type and by
Road Type
Pollutants:
PM, VOC, NOx, etc.
SMOKE
Temporal (Weekly & Diurnal Profiles): Hourly
Spatial (Spatial Surrogates): Each Grid Cell, e.g., 42 km,
15 km, 2.5 km
Chemical Species (Chemical
Speciation Profiles): PM Species:
Sulphate, Nitrate, Ammonium,
Elemental Carbon, Organic
Matter, Crustal Material
VOC Species:
Propane, Alkenes, Alkanes,
Toluene, Isoprene, etc.
NOx Species:
NO2, NO
AQ Model Inputs
Right TimeRight LocationRight Species Right Amount
Zhang et al., 2012, 20th International Emission Inventory Conference

Page 5 – April 19, 2023
Emissions Processing by SMOKE (2):
Four Weekly Profiles from EPA:
Weekly Profiles for On-Road Mobile Emissions:
0
2
4
6
8
10
12
14
16
18
20
Mon Tue Wed Thu Fri Sat Sun
Per
cen
t (%
)
Urban LDV Rural LDV
Urban HDV Rural HDV

Page 6 – April 19, 2023
Emissions Processing by SMOKE (3):
0
1
2
3
4
5
6
7
8
0 1 2 3 4 5 6 7 8 9 10 11 12 13 14 15 16 17 18 19 20 21 22 23
Local Time
Per
cent
age
(%)
2014_WKD 2014_WKD
12 profiles for Light Duty Vehicles from EPA for 12 Road Classes 1 derived profile from FEVER Study for Heavy Duty Vehicles for All Roads
Urban Roads: 6 Road Classes
Heavy Duty Vehicles: All Roads Rural Roads: 6 Road Classes
Urban Interstate Urban Freeway Urban Principal Arterial Urban Minor Arterial Urban Collector Urban Local
Rural Interstate Rural Principal Arterial Rural Minor Arterial Rural Major Collector Rural Minor Collector Rural Local
0
1
2
3
4
5
6
7
8
9
10
0 1 2 3 4 5 6 7 8 9 10 11 12 13 14 15 16 17 18 19 20 21 22 23
Local Time (hour)
Per
cen
tag
e (%
)
2001_WKD 2002_WKD 2003_WKD 2004_WKD
2005_WKD 2006_WKD 2001_WND 2002_WND
2003_WND 2004_WND 2005_WND 2006_WND
0
1
2
3
4
5
6
7
8
9
10
0 1 2 3 4 5 6 7 8 9 10 11 12 13 14 15 16 17 18 19 20 21 22 23
Local Time (hour)
Per
cen
tag
e (%
)
2007_WKD 2008_WKD 2009_WKD 2010_WKD
20011_WKD 2012_WKD 2007_WND 2008_WND
2009_WND 2010_WND 2011_WND 2012_WND
Diurnal Profiles for On-Road Mobile Emissions

Page 7 – April 19, 2023
Spatial Surrogates for On-Road Mobile Emissions: BAQS-Met 2.5km AURAMS Domain
Based on National Road Network & PopulationUrban Local Road Urban Secondary Road Urban Primary Road
Rural Secondary Road Rural Primary Road
Rural Local Road
Emissions Processing by SMOKE (4):

Page 8 – April 19, 2023
Traffic Flow:Street NetworkTraffic Analysis Zones (TAZs)Vehicle Specific Hourly Origin-
Destination MatricesVehicle Specific Hourly Traffic Flow
on each segment of the road
On-Road Mobile Emissions:
HC, NOX, CO, PM, Toxics,
etc.Hourly on Each Road
Segment (link) By Vehicle Type or Total
Link-Based Emissions Processing (1):
Emission Factors:Vehicle Fleet Information: Vehicle
Type, Age Distribution, SpeedFuel TypesType of Emissions: Exhaust,
Evaporative, Tire Dust, Brake DustMeteorology

Page 9 – April 19, 2023
Link-Based Emissions Processing (2):Kanaroglou et al., 2009, Final Report to Environment Canada
GTA Road Network Traffic Analysis Zones (1,316)
Traffic Flow Software:
TRAFFIC, Centre for Spatial Analysis (CSpA), McMaster University, Canada
Emission Factors:
MOBILE6.2C, Canadian Version of US EPA MOBILE6.2
Source: Kanaroglou et al., 2009, Final Report to Environment Canada
Page 10 – April 19, 2023
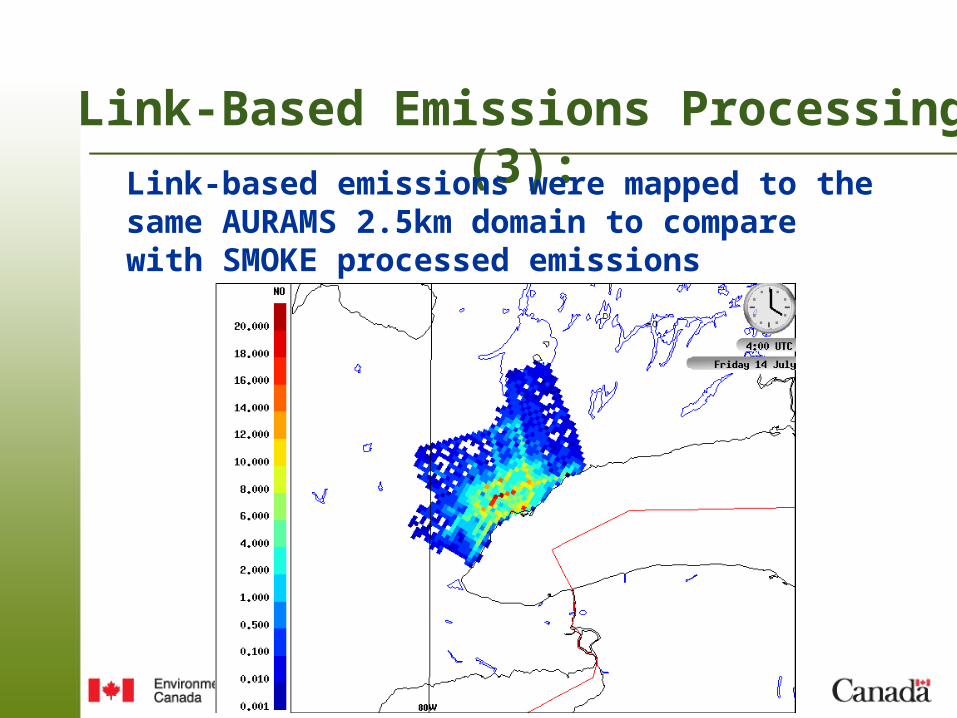
Link-Based Emissions Processing (3):
Link-based emissions were mapped to the same AURAMS 2.5km domain to compare with SMOKE processed emissions

Page 11 – April 19, 2023
Temporal Comparisons:Time series of domain total NO and CO emissions during a week in July
1) Link-based emissions have significant rush hour peaks
2) Rush hour peaks are not clear for SMOKE-processed emissions, especially NO
3) SMOKE-processed emissions are larger than link-based emissions: mid-day, night, and weekends
4) Vehicles from outside the GTA were not considered in the link-based emissions

Page 12 – April 19, 2023
Spatial Comparisons (1):Link-based Highways vs. SMOKE-Processed Primary Roads
Link-based Highways SMOKE-Processed Primary Roads
Domain Average Diurnal Variation 1) Link-based highways correspond reasonably well with SMOKE primary road
2) Much higher emissions from SMOKE

Page 13 – April 19, 2023
Spatial Comparisons (2):Link-based Arterial Roads vs. SMOKE-Processed Secondary Roads
Link-based Arterial Roads
SMOKE-Processed Secondary Roads
Domain Average Diurnal Variation 1) Much lower emissions from SMOKE
2) Link-based emissions are concentrated in the downtown area, which is reasonable
3) SMOKE surrogate based on road length and # of lanes

Page 14 – April 19, 2023
Spatial Comparisons (3):Link-based Pseudo Links vs. SMOKE-Processed Local Roads
Link-based Pseudo Links SMOKE Processed Local Roads
Domain Average Diurnal Variation 1) SMOKE-processed emissions compare reasonably well with link-based emissions

Page 15 – April 19, 2023
Improvements to SMOKE Processing of On-road Emissions (1):Sensitivity to Surrogate Assignment
The issue: Compared with link-based emissions, too much emissions on primary roads, too little on secondary roads
Sensitivity Test: Assigning Urban Minor Arterial Road to Secondary Road surrogate

Page 16 – April 19, 2023
Improvements to SMOKE Processing of On-road Emissions (2):Sensitivity to Surrogate Assignment

Page 17 – April 19, 2023
Improvements to SMOKE Processing of On-road Emissions (3):Build a secondary road surrogate based on link-based emissions
The issue: SMOKE secondary road surrogate is based on road length and number of lanes, without considering traffic volume
Original Secondary Road SurrogateSecondary Road Surrogate from Link-based Emissions

Page 18 – April 19, 2023
Conclusions: Significant differences between SMOKE-processed and link-based mobile
emissions in the Greater Toronto Area, both temporally and spatially
During weekdays, the link-based emissions have significant peaks during both morning and afternoon rush hours. The peaks are not so clear for SMOKE processed emissions, especially for NO emissions
For SMOKE, assignment of spatial surrogates may need to be adjusted
The SMOKE secondary road surrogate needs to be improved to reflect the variation of traffic volumes in the city
Emissions from vehicles coming from outside the city need to be included in the link-based emissions inventory to be suitable for AQ modeling studies
Emission factors from MOVES, instead of MOBILE, should be used in the future for link-based emissions processing

AcknowledgementsThanks to the project team in the Centre for Spatial Analysis (CSpA), McMaster University for processing the link-based emissions Thanks to our colleagues in Environment Canada for their helpful discussions