improvements to smoke processing of canadian on · pdf fileimprovements to smoke processing of...
TRANSCRIPT
Improvements to SMOKE Processing of Canadian On-Road Mobile Emissions
Junhua Zhang1, Qiong Zheng1, Michael Moran1, Mark Gordon1,
John Liggio1, Paul Makar1, Brett Taylor2, and Craig Stroud1
1. Air Quality Research Division, Environment Canada, Toronto, Ontario, Canada
2. Pollutant Inventories and Reporting Division, Environment Canada, Gatineau, Quebec, Canada
2012 International Emission Inventory Conference , Tampa, Florida, 13-16 Aug. 2012
Page 2 – August 21, 2012
Highlights of Outcomes
• Improvement to Spatial Distribution of Emissions
• Improvement to Temporal Allocation of Emissions
• Improvement to Canadian On-Road Mobile Emissions Inventory for Road Type
• Improvement to Chemical Speciation of Particulate Matter (PM) Emissions
Page 3 – August 21, 2012
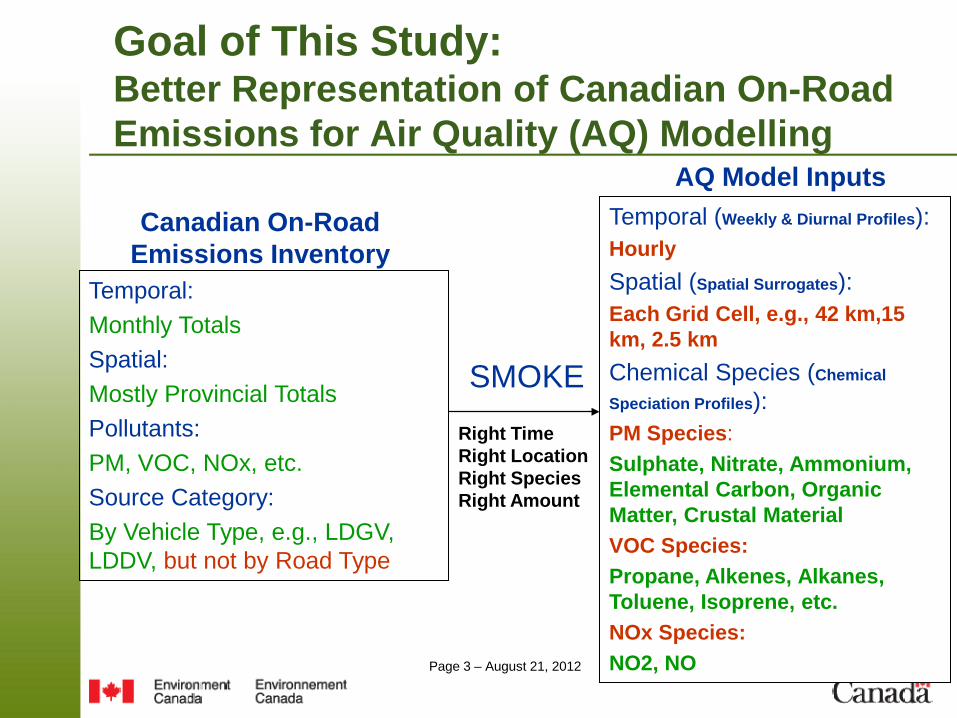
Goal of This Study: Better Representation of Canadian On-Road Emissions for Air Quality (AQ) Modelling
Canadian On-Road Emissions Inventory
Temporal: Monthly Totals Spatial: Mostly Provincial Totals Pollutants: PM, VOC, NOx, etc. Source Category: By Vehicle Type, e.g., LDGV, LDDV, but not by Road Type
SMOKE
Temporal (Weekly & Diurnal Profiles): Hourly Spatial (Spatial Surrogates): Each Grid Cell, e.g., 42 km,15 km, 2.5 km Chemical Species (Chemical
Speciation Profiles): PM Species: Sulphate, Nitrate, Ammonium, Elemental Carbon, Organic Matter, Crustal Material VOC Species: Propane, Alkenes, Alkanes, Toluene, Isoprene, etc. NOx Species: NO2, NO
AQ Model Inputs
Right Time Right Location Right Species Right Amount
Page 4 – August 21, 2012
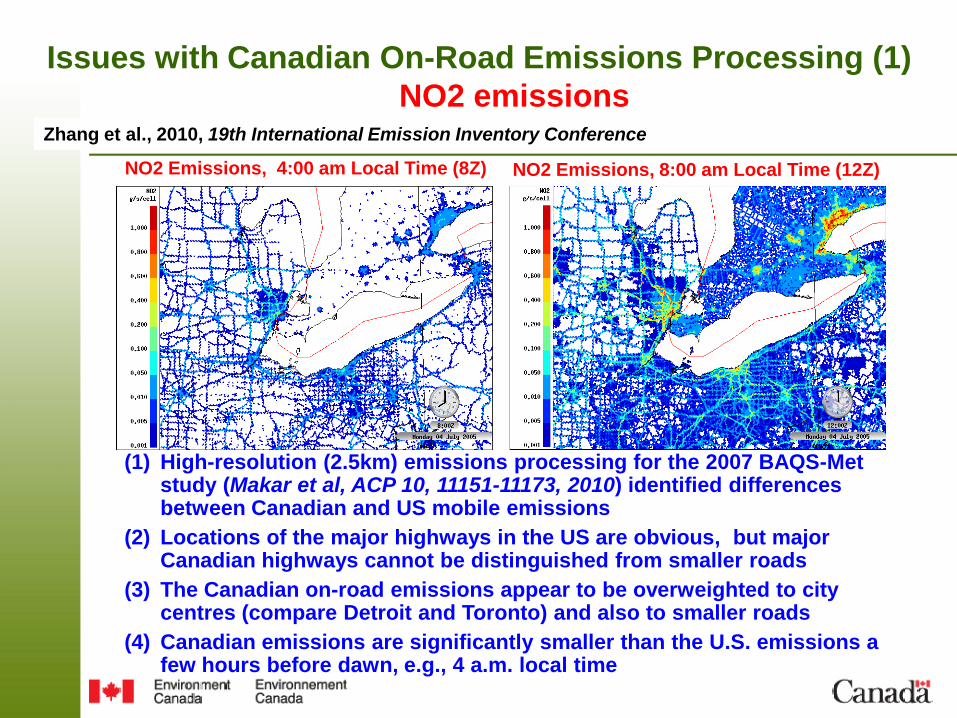
Issues with Canadian On-Road Emissions Processing (1) NO2 emissions
(1) High-resolution (2.5km) emissions processing for the 2007 BAQS-Met study (Makar et al, ACP 10, 11151-11173, 2010) identified differences between Canadian and US mobile emissions
(2) Locations of the major highways in the US are obvious, but major Canadian highways cannot be distinguished from smaller roads
(3) The Canadian on-road emissions appear to be overweighted to city centres (compare Detroit and Toronto) and also to smaller roads
(4) Canadian emissions are significantly smaller than the U.S. emissions a few hours before dawn, e.g., 4 a.m. local time
Zhang et al., 2010, 19th International Emission Inventory Conference
NO2 Emissions, 4:00 am Local Time (8Z) NO2 Emissions, 8:00 am Local Time (12Z)
Page 5 – August 21, 2012
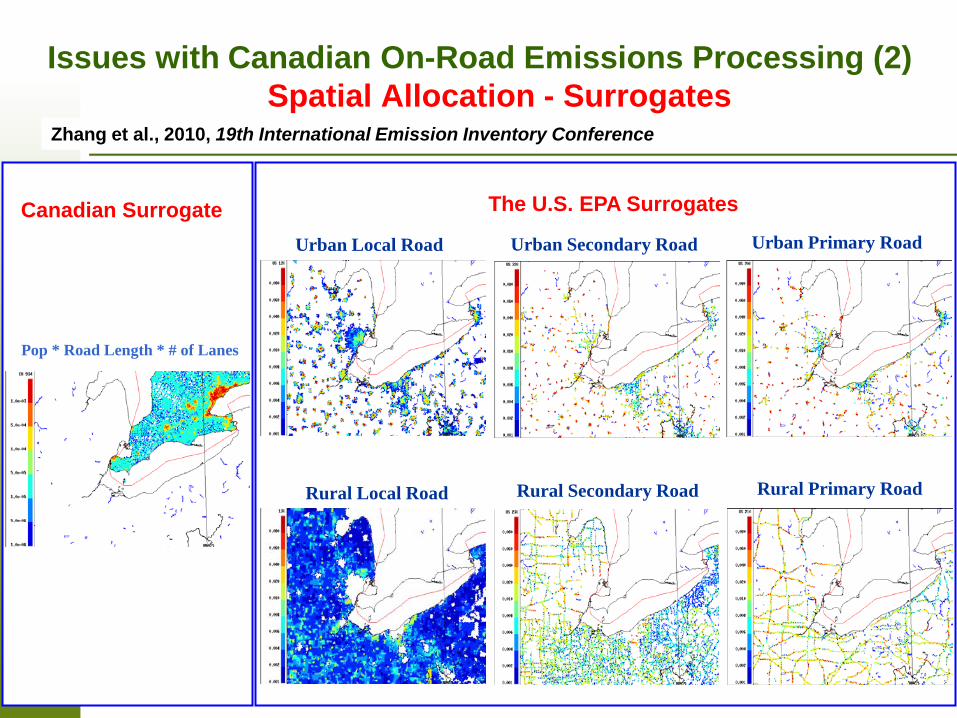
Pop * Road Length * # of Lanes
Canadian Surrogate The U.S. EPA Surrogates
Urban Local Road
Urban Secondary Road
Urban Primary Road
Rural Secondary Road Rural Primary Road
Rural Local Road
Issues with Canadian On-Road Emissions Processing (2) Spatial Allocation - Surrogates Zhang et al., 2010, 19th International Emission Inventory Conference

Page 6 – August 21, 2012
Issues with Canadian On-Road Emissions Processing (3) Temporal Allocation
0
0.01
0.02
0.03
0.04
0.05
0.06
0.07
0.08
0.09
0.1
00 01 02 03 04 05 06 07 08 09 10 11 12 13 14 15 16 17 18 19 20 21 22 23
Local Time
Emiss
ion Fr
actio
nUS_Rural_Interstat US_Rural_Principal_Arterial US_Rural_Minor_ArterialUS_Rural_Major_Collector US_Rural_Minor_Collector US_Rural_LocalUS_Urban_Interstate US_Urban_Freeway US_Urban_Principal_ArterialUS_Urban_Minor_Arterial US_Urban_Collector US_Urban_LocalCA_LDGV
(1) 12 diurnal profiles for the U.S. LDGV vehicle type representing 12 road classes, but only one for Canadian LDGV due to lack of road class information in the inventory
(2) No emissions at 3 & 4 a.m. from Canadian LDGV, resulting in Canadian emissions that are significantly smaller than the U.S. emissions a few hours before dawn
(3) Different weekday and weekend profiles for U.S. emissions, but only one profile for both Canadian weekday and weekend emissions.
Zhang et al., 2010, 19th International Emission Inventory Conference
Weekday Diurnal Profiles for LDGV
Page 7 – August 21, 2012
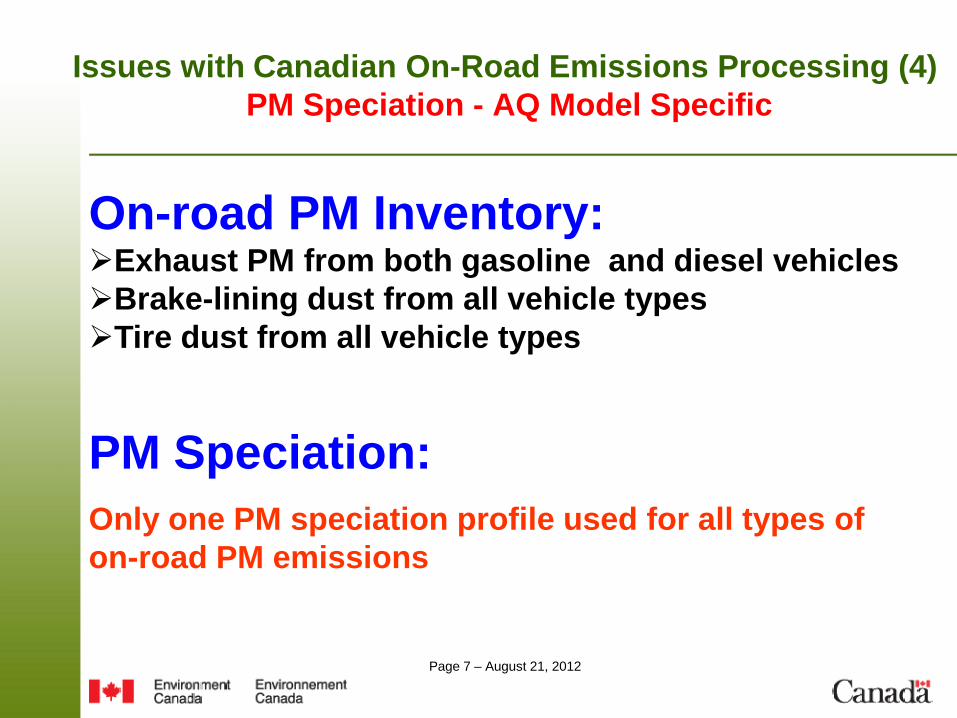
Issues with Canadian On-Road Emissions Processing (4) PM Speciation - AQ Model Specific
On-road PM Inventory: Exhaust PM from both gasoline and diesel vehicles Brake-lining dust from all vehicle types Tire dust from all vehicle types
PM Speciation: Only one PM speciation profile used for all types of on-road PM emissions
Page 8 – August 21, 2012
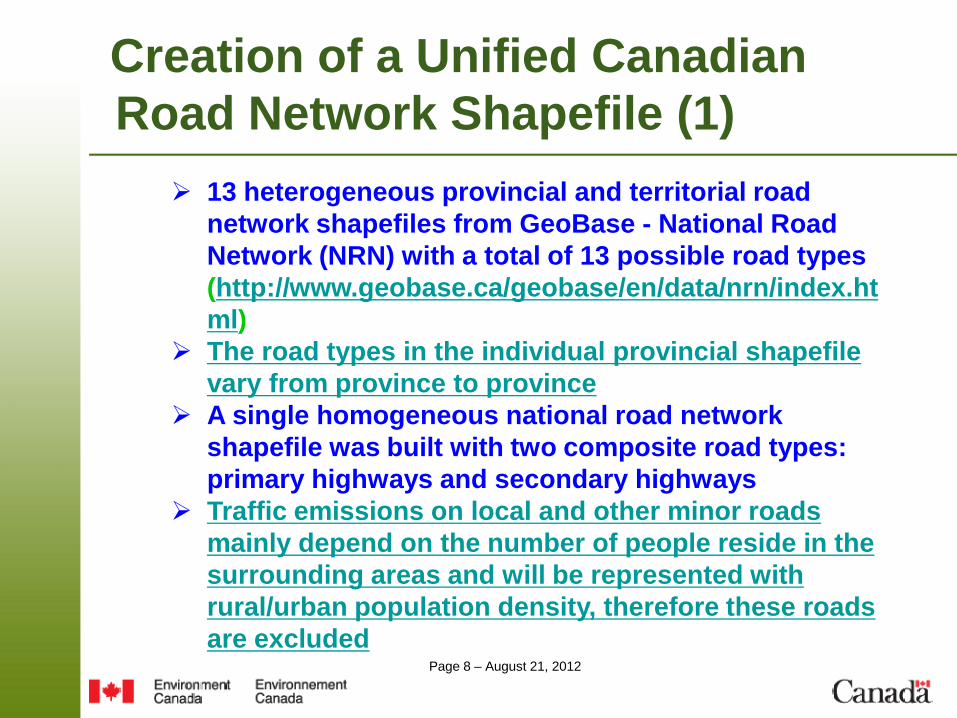
Creation of a Unified Canadian Road Network Shapefile (1)
13 heterogeneous provincial and territorial road network shapefiles from GeoBase - National Road Network (NRN) with a total of 13 possible road types (http://www.geobase.ca/geobase/en/data/nrn/index.html)
The road types in the individual provincial shapefile vary from province to province
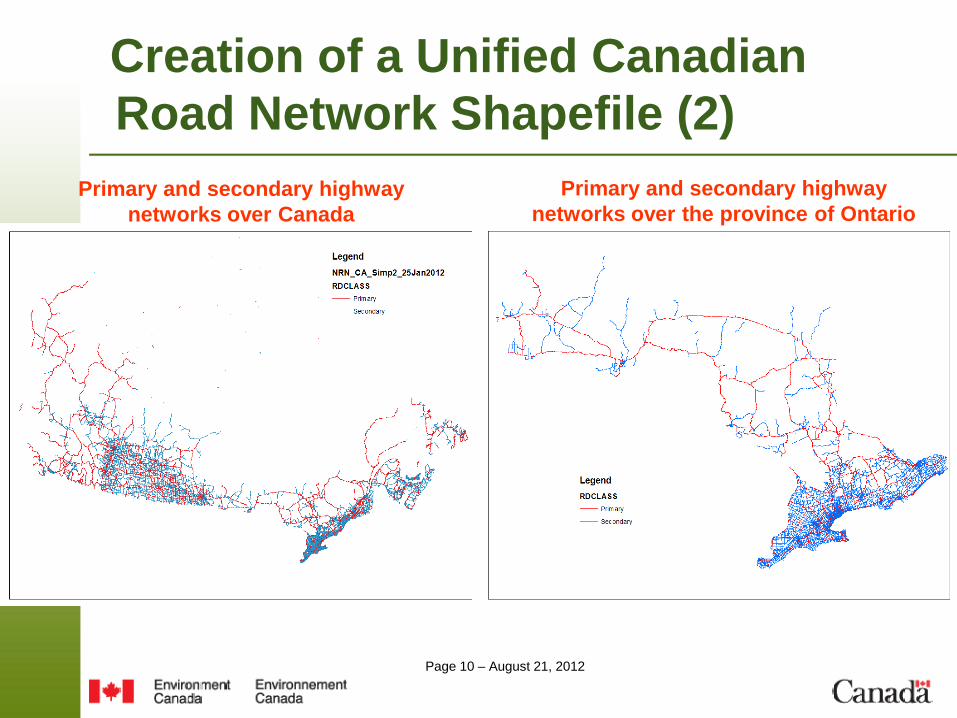
A single homogeneous national road network shapefile was built with two composite road types: primary highways and secondary highways
Traffic emissions on local and other minor roads mainly depend on the number of people reside in the surrounding areas and will be represented with rural/urban population density, therefore these roads are excluded
Page 9 – August 21, 2012
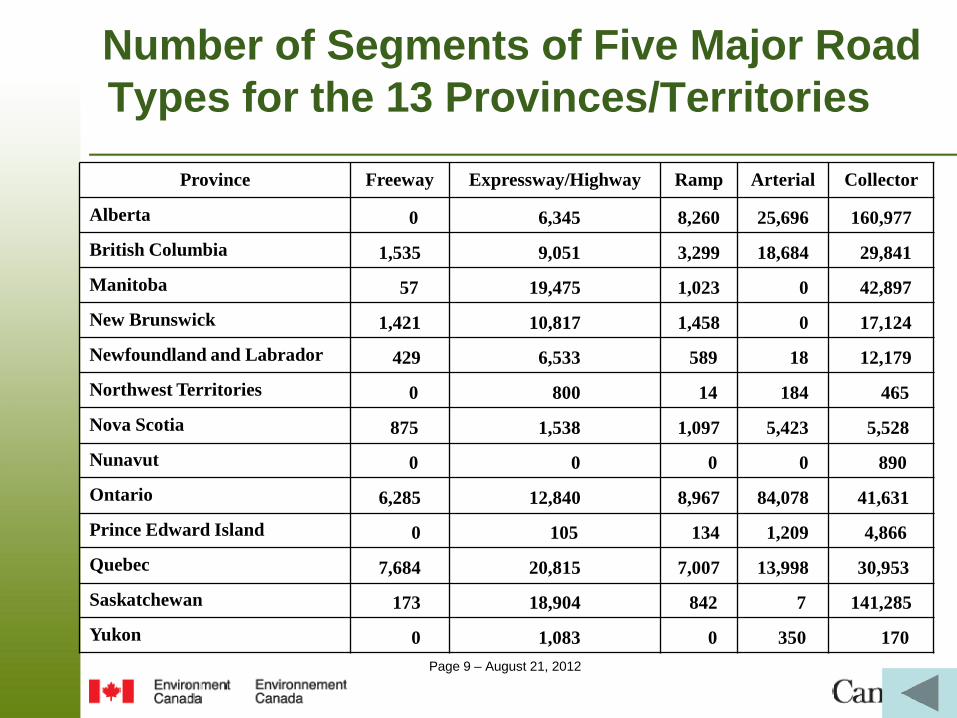
Number of Segments of Five Major Road Types for the 13 Provinces/Territories
Province Freeway Expressway/Highway Ramp Arterial Collector
Alberta 0 6,345 8,260 25,696 160,977 British Columbia 1,535 9,051 3,299 18,684 29,841 Manitoba 57 19,475 1,023 0 42,897 New Brunswick 1,421 10,817 1,458 0 17,124 Newfoundland and Labrador 429 6,533 589 18 12,179 Northwest Territories 0 800 14 184 465 Nova Scotia 875 1,538 1,097 5,423 5,528 Nunavut 0 0 0 0 890 Ontario 6,285 12,840 8,967 84,078 41,631 Prince Edward Island 0 105 134 1,209 4,866 Quebec 7,684 20,815 7,007 13,998 30,953 Saskatchewan 173 18,904 842 7 141,285 Yukon 0 1,083 0 350 170
Page 10 – August 21, 2012
Creation of a Unified Canadian Road Network Shapefile (2)
Primary and secondary highway networks over Canada
Primary and secondary highway networks over the province of Ontario
Page 11 – August 21, 2012
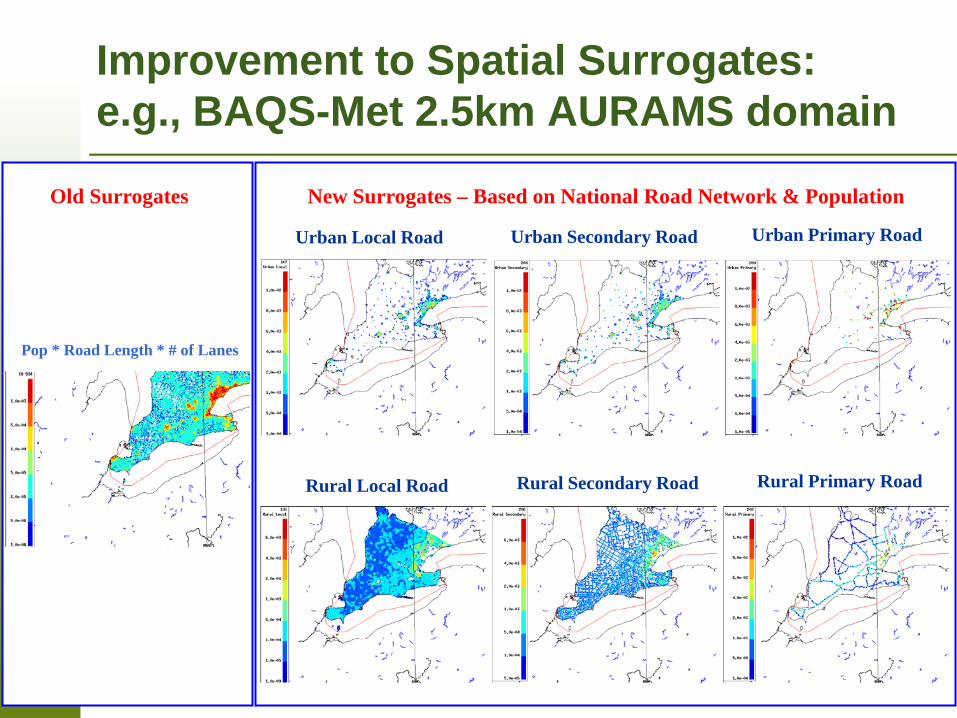
Improvement to Spatial Surrogates: e.g., BAQS-Met 2.5km AURAMS domain
Old Surrogates New Surrogates – Based on National Road Network & Population
Urban Local Road
Urban Secondary Road Urban Primary Road
Rural Secondary Road Rural Primary Road
Rural Local Road
Pop * Road Length * # of Lanes
Page 12 – August 21, 2012
Improvement to Temporal Profiles (1):
Fast Evolution of Vehicle Emissions from Roadways (FEVER) Study (Liggo et al., 2010, Gordon et al., 2012)
Conducted Aug. 17 – Sep. 17, 2010 on a multi-lane highway in the Toronto area in Ontario
A traffic camera was used to record the traffic. Traffic density, composition and speed were then determined from the video recording Weekly and diurnal profiles were derived for light
duty vehicles (LDV) and heavy duty vehicles (HDV)

Page 13 – August 21, 2012

Page 14 – August 21, 2012
Improvement to Temporal Profiles (1):
Weekly profiles derived from FEVER traffic count vs. those used by the U.S. EPA: 20031: urban LDV 20021: rural LDV 20032: urban HDV 20022: rural HDV
Weekly Profiles for On-Road Mobile Emissions
02
46
81012
1416
1820
Mon Tue Wed Thu Fri Sat Sun
Perc
ent (
%)
LDV EPA #20031 EPA #20021HDV EPA #20032 EPA #20022
Page 15 – August 21, 2012
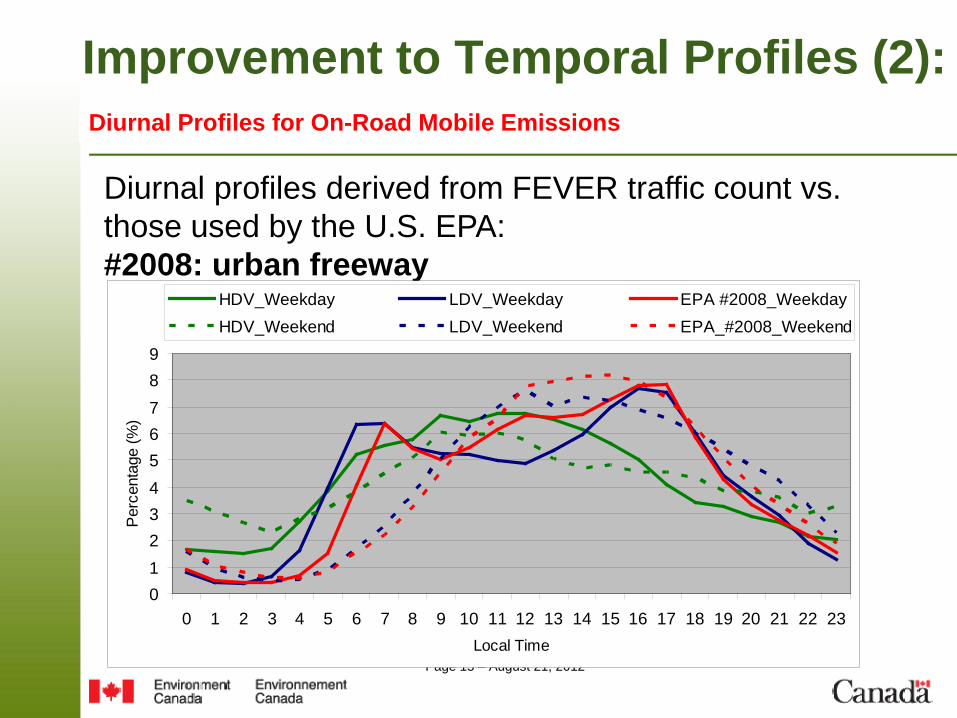
Improvement to Temporal Profiles (2):
Diurnal profiles derived from FEVER traffic count vs. those used by the U.S. EPA: #2008: urban freeway
Diurnal Profiles for On-Road Mobile Emissions
0123456789
0 1 2 3 4 5 6 7 8 9 10 11 12 13 14 15 16 17 18 19 20 21 22 23Local Time
Per
cent
age
(%)
HDV_Weekday LDV_Weekday EPA #2008_WeekdayHDV_Weekend LDV_Weekend EPA_#2008_Weekend

Page 16 – August 21, 2012
Improvement to Temporal Profiles (2):
0
1
2
3
4
5
6
7
8
0 1 2 3 4 5 6 7 8 9 10 11 12 13 14 15 16 17 18 19 20 21 22 23Local Time
Per
cent
age
(%)
2014_WKD 2014_WKD
12 profiles for Light Duty Vehicles from EPA for 12 Road Classes 1 derived profile from FEVER for Heavy Duty Vehicles for All Roads
Urban Roads: 6 Road Classes
New Profile for Heavy Duty Vehicles: All Roads
Rural Roads: 6 Road Classes
Urban Interstate Urban Freeway Urban Principal Arterial Urban Minor Arterial Urban Collector Urban Local Rural Interstate Rural Principal Arterial Rural Minor Arterial Rural Major Collector Rural Minor Collector Rural Local
0123456789
10
0 1 2 3 4 5 6 7 8 9 10 11 12 13 14 15 16 17 18 19 20 21 22 23
Local Time (hour)
Per
cent
age
(%)
2001_WKD 2002_WKD 2003_WKD 2004_WKD2005_WKD 2006_WKD 2001_WND 2002_WND2003_WND 2004_WND 2005_WND 2006_WND
0123456789
10
0 1 2 3 4 5 6 7 8 9 10 11 12 13 14 15 16 17 18 19 20 21 22 23
Local Time (hour)
Per
cent
age
(%)
2007_WKD 2008_WKD 2009_WKD 2010_WKD20011_WKD 2012_WKD 2007_WND 2008_WND2009_WND 2010_WND 2011_WND 2012_WND
Diurnal Profiles for On-Road Mobile Emissions
Page 17 – August 21, 2012
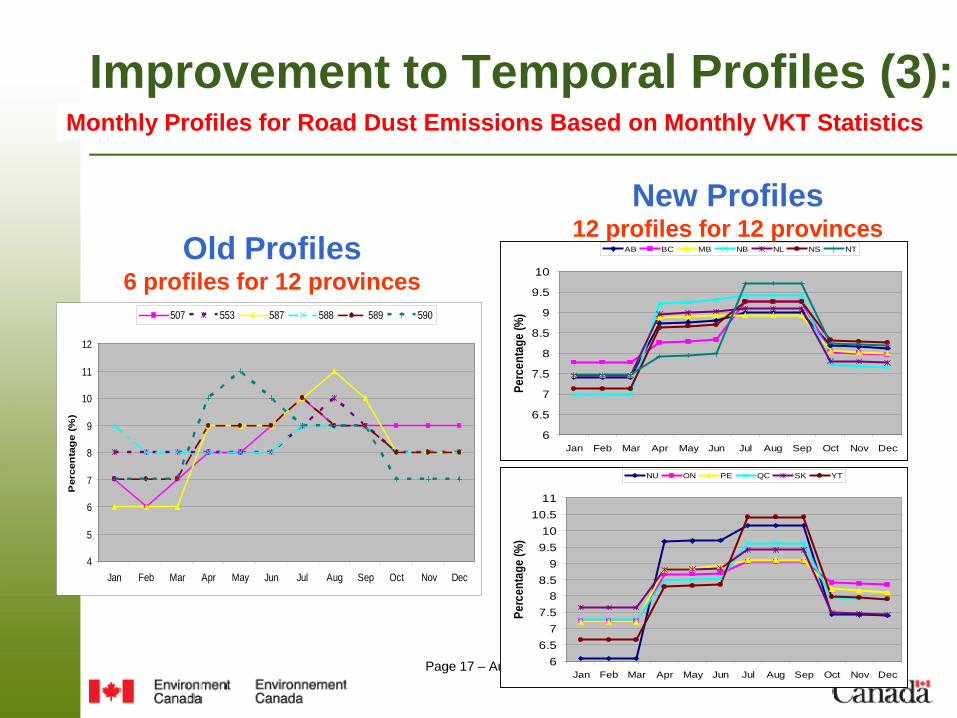
Improvement to Temporal Profiles (3): Monthly Profiles for Road Dust Emissions Based on Monthly VKT Statistics
4
5
6
7
8
9
10
11
12
Jan Feb Mar Apr May Jun Jul Aug Sep Oct Nov Dec
Per
cen
tag
e (%
)
507 553 587 588 589 590
6
6.5
7
7.5
8
8.5
9
9.5
10
Jan Feb Mar Apr May Jun Jul Aug Sep Oct Nov Dec
Perc
enta
ge (%
)
AB BC MB NB NL NS NT
66.5
77.5
88.5
99.510
10.511
Jan Feb Mar Apr May Jun Jul Aug Sep Oct Nov Dec
Perc
enta
ge (%
)
NU ON PE QC SK YT
Old Profiles 6 profiles for 12 provinces
New Profiles 12 profiles for 12 provinces
Page 18 – August 21, 2012
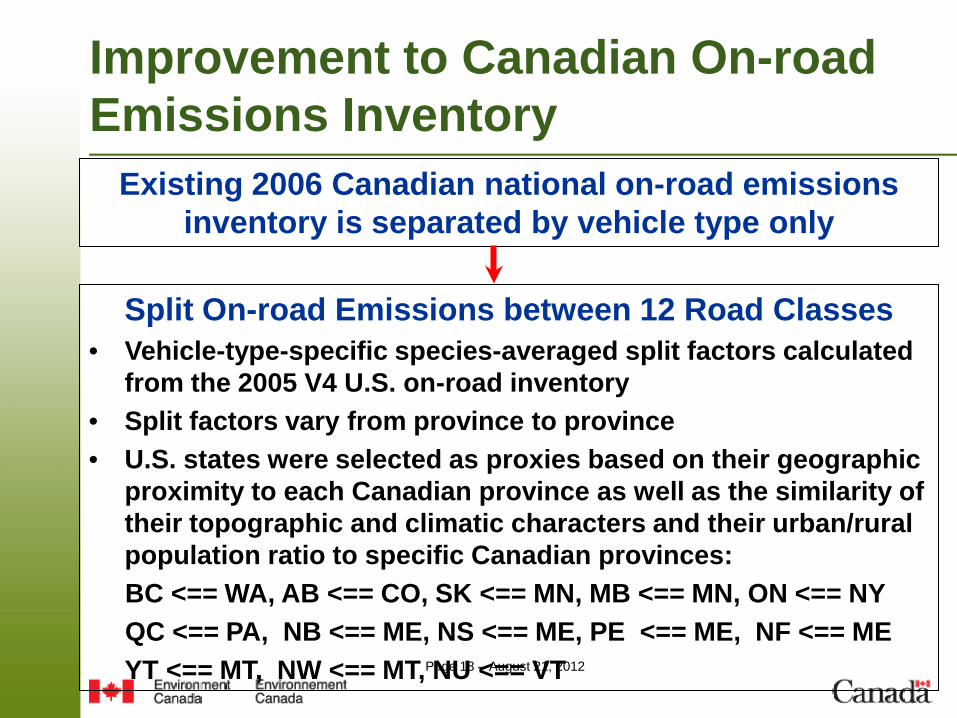
Improvement to Canadian On-road Emissions Inventory
Existing 2006 Canadian national on-road emissions inventory is separated by vehicle type only
Split On-road Emissions between 12 Road Classes • Vehicle-type-specific species-averaged split factors calculated
from the 2005 V4 U.S. on-road inventory • Split factors vary from province to province • U.S. states were selected as proxies based on their geographic
proximity to each Canadian province as well as the similarity of their topographic and climatic characters and their urban/rural population ratio to specific Canadian provinces:
BC <== WA, AB <== CO, SK <== MN, MB <== MN, ON <== NY QC <== PA, NB <== ME, NS <== ME, PE <== ME, NF <== ME YT <== MT, NW <== MT, NU <== VT
Page 19 – August 21, 2012
Improvement to PM Chemical Speciation - AQ Model Specific Originally only one PM chemical speciation profile for
all on-road PM emissions
5 PM chemical speciation profiles now used based on the SPECIATE4.3 database: 92050, exhaust PM from all gasoline vehicles (GV) 92042, exhaust PM from all light duty-diesel vehicles (LDDV) 92035, exhaust PM from heavy-duty diesel vehicles (HDDV) 92009, brake-lining dust from all vehicle types 92087, tire dust from all vehicle types
Page 20 – August 21, 2012
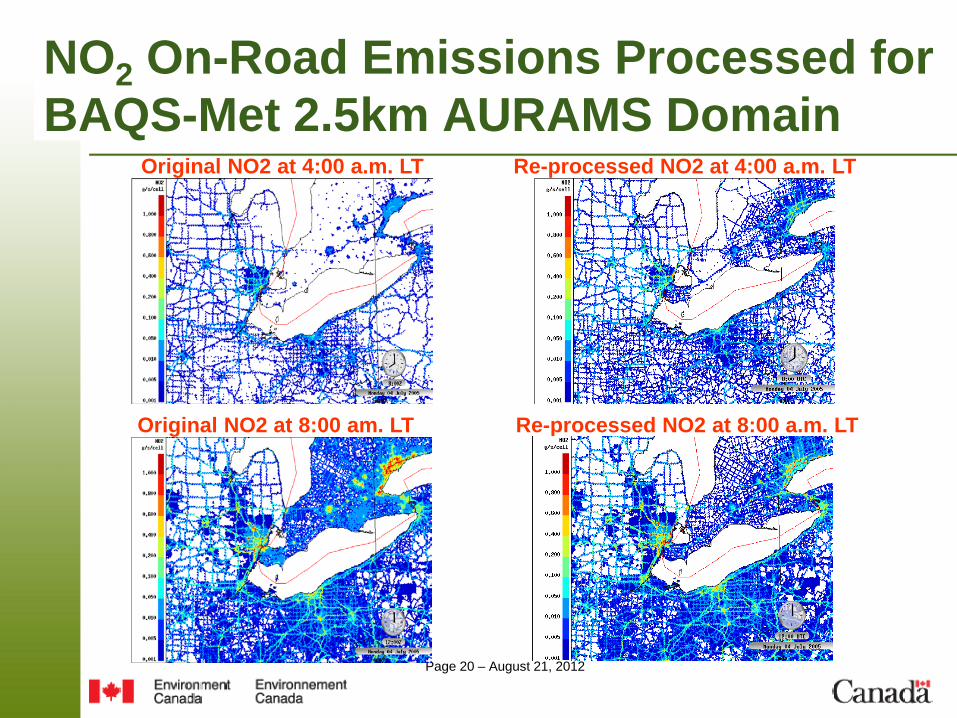
NO2 On-Road Emissions Processed for BAQS-Met 2.5km AURAMS Domain
Original NO2 at 4:00 a.m. LT Re-processed NO2 at 4:00 a.m. LT
Original NO2 at 8:00 am. LT Re-processed NO2 at 8:00 a.m. LT

Page 21 – August 21, 2012
Time Series of NO2 On-Road Emissions in downtown Toronto

Page 22 – August 21, 2012
Conclusions
Significant changes to space and time distribution of on-road mobile emissions were seen after implementing improvements to SMOKE processing, especially over Canadian cities
After implementing these improvements, the distribution of emissions on the Canadian side of the domain are more comparable with the U.S. side
These changes to the emissions will have significant impacts on air quality modelling results

Acknowledgements Thanks to our colleagues in U.S. EPA and Environment Canada Adam Reff and Heather Simon of U.S. EPA for updated PM speciation library Mourad Sassi of Environment Canada for helpful discussions