comparison of continuous and pulsed wave lasers in keyhole
TRANSCRIPT

Comparison of Continuous and Pulsed Wave Lasersin Keyhole Welding of Stainless-Steel to AluminiumJulio Coroado ( [email protected] )
Cran�eld UniversitySupriyo Ganguly
Cran�eld UniversityStewart Williams
Cran�eld UniversityWojciech Suder
Cran�eld UniversitySonia Meco
Cran�eld UniversityGoncalo Pardal
Cran�eld University
Research Article
Keywords: dissimilar metal joining, keyhole laser welding, intermetallic compounds, aluminium, stainless-steel.
Posted Date: August 4th, 2021
DOI: https://doi.org/10.21203/rs.3.rs-683158/v1
License: This work is licensed under a Creative Commons Attribution 4.0 International License. Read Full License

1
Comparison of continuous and pulsed wave lasers in keyhole welding of
stainless-steel to aluminium
Julio Coroado*1, Supriyo Ganguly1, Stewart Williams1, Wojciech Suder1, Sonia
Meco1, Goncalo Pardal1
1 Welding Engineering and Laser Processing Centre, Cranfield University, Cranfield
MK43 0AL, UK
Abstract
A continuous wave (CW) and a nanosecond pulsed wave (PW) lasers were used to
join 1 mm thick sheets of SS304L (SS) austenitic stainless-steel to AA5251 (Al)
aluminium alloy in an overlap joint configuration. The weld shape (penetration depth
and width), intermetallic compounds concentration, weld quality (cracking and
porosity) and mechanical strength were correlated with the process energy and
compared between each laser temporal mode. Successful CW joints were produced
with the SS sheet on top of the Al, but the opposite configuration revealed to be
impossible for the range of parameters tested. The PW joints were successful with
the Al sheet on top of SS, but all the joints cracked at the interface when the
opposite configuration was used. The mechanical tests showed that even though it is
possible to achieve higher tensile shear load in CW welds due to the larger bonding
area, the load per unit of weld length revealed to be almost 5x higher for PW welds
at similar applied energy.

2
Keywords: dissimilar metal joining, keyhole laser welding, intermetallic compounds,
aluminium, stainless-steel.
*Corresponding author. Tel.: +447438093485.
E-mail address: [email protected] (J. Coroado)
1.0 Introduction
Dissimilar joining of SS to Al alloys is widely used in thin gauge materials in
aerospace and automotive applications, seeking to improve the fuel efficiency
through weight reduction. The combination of lightweight of Al alloys and the good
corrosion resistance and weldability of SS alloys bring higher quality and economic
demand where several material requirements are desired for similar applications,
such as electric vehicles (EVs) battery enclosure/housings which contain large
number of cells [1]. However, due to the different physical properties and chemical
incompatibility of the alloys, the joining process becomes challenging [2]. The low
solid solubility of Al into iron (Fe) and the almost zero solid solubility of iron into
aluminium is responsible for the formation of brittle intermetallic compounds (IMCs).
The presence of the IMCs added to the differences in melting point, thermal
expansion coefficient, thermal conductivity and specific heat capacity may lead to the
formation of brittle intermetallic compounds (IMCs) and consequently defects such
as cracking, causing brittle failure in service due to internal stresses after fusion
welding [3]. The IMCs formed have different crystal structures in comparison to the
base metals. Solid Fe and molten Al reaction is controlled by diffusion [4]. When

3
temperature on the SS side approaches the Al melting temperature, the diffusion
coefficient of Fe into Al increases, but the opposite is not verified if SS is still solid.
Temperature and time are the key parameters in the formation and growth of the
IMCs [4][5]. It is not possible to control them independently in order to minimize the
amount of IMCs and maximise the mechanical strength of joints produced, as low
heat input leads to less IMCs but also smaller welds and lower strength. Mechanical
joining processes such as screwing, riveting, roll bonding or clinching are good
alternatives since no IMCs are formed [6][7]. More recently, friction stir welding, a
solid state joining process, was also successfully employed, avoiding fully molten
material [8]. Nevertheless, tool wear and lack of flexibility in the joint geometry are
some of the limitations. On the other hand, some fusion based joining processes
such as resistance spot welding and laser-MIG hybrid welding create a large weld
pool due to the long thermal cycle, which enhances the IMCs formation [9].
Laser welding is a popular process to join dissimilar materials. Localized energy
input of the welding source allows a minimal heat affected zone. The high cooling
rates and short processing time compared with other techniques reduces diffusion of
Fe in Al and thus, the formation of Fe-Al (Fe3Al, FeAl2, Fe2Al3, Fe2Al5, FeAl3) [10][11]
and Al-Cr (Al4Cr, Al8Cr5, Al9Cr4) binary compounds commonly formed at the joint
interface [12]. As an industrially commonly used joining technique, laser welding can
be employed in welding applications in automotive battery packs where laser is used
to precisely join small cylindrical cells (≤0.5 mm thick) but also large cells with
geometrical large interconnectors [1]. Another prominent application associated is

4
the manufacturing of biomedical devices, orthopaedic and prosthetic implants which
require in some cases several microscopic welds to join thin materials (≤1 mm thick)
[13].
There are two types of laser temporal modes: CW and PW. The PW lasers have
lower average power but higher peak power on each pulse, leading to high power
density and deep keyhole, being able to create narrow weld profiles with high aspect
ratio [14]. The higher peak power promotes more vaporisation than CW laser for the
same average power, which associated to a rapid energy application within a short
duration allows fast material solidification, being better for dissimilar metal joining.
Many researchers used lasers to weld dissimilar materials. Huang et al. [15] studied
the formation of brittle IMCs using high energy and a high repetition femtosecond
laser to join Al to SS (≤1 mm thick). The formation of IMCs was restricted, and crack
formation suppressed due to highly localized heat generation, which minimized the
heat input into the material. Yang et al. [16] joined pure Al and SS (0.8 mm thick)
using a millisecond PW laser. They found that for deeper welds, hard Al rich IMCs
were formed, which deteriorated the strength of the joint. Many micro-cracks were
observed in the Al-rich IMCs, and almost no defects were discovered in the Fe-rich
IMCs at the joint interface. The two previous studies suggest that different pulse
durations can be used to successfully reduce the IMCs formation. However, the
results were analysed in terms of system parameters, being difficult the comparison
of both lasers to understand how the Al-rich IMCs should be avoided independently
of the laser used. Nanosecond PW lasers can also be used to enhance the joining of
1 mm thick Al to 0.85 mm thick steel sheet [17]. Defect free Fe-Al joints were

5
achieved by laser spot welding using laser-textured steel: first, the surface of steel
was textured using a nanosecond PW laser and then, the spot welding process was
performed with a defocused and stationary CW laser. The steel plate was positioned
on top of the Al sheet with a texture faced down to the Al surface in a lap-joint
configuration. The results suggested that the maximum tensile-shear load was
improved due to an increase in the bonding area created by the textured surface and
the quality and uniformity of the weld nuggets. Nevertheless, several weld spots or
different weld patterns could also have been used to improve the bonding area.
CW laser can also be used for dissimilar welds with good results. Meco et al. [18]
successfully minimized the reaction between Fe and Al by joining steel to Al in a lap-
joint configuration operating a CW laser in conduction mode. This technique also
allowed successful T-joints produced by melting the Al plate, which was inserted into
a steel plate [19]. In a different study, Meco et al. [20] used a FE model to predict the
thermal cycle at the interface between steel and Al plates using different laser
parameters. They showed that a small bonding area is equally detrimental to the
mechanical strength of the joint as having a thick IMC layer. The FE model
suggested that temperature to which the materials are exposed is more critical than
the time, as this is the factor with higher contribution to the growth of the IMC layer
and the formation of the bonding area. Power density was found to be the dominant
parameter controlling the peak temperature. Hence, this parameter should be low in
order to avoid high temperatures and consequently brittle IMCs at the joint interface.
It is important to note that since the previous studies were performed in terms of
power density, interaction time and energy, the results can be equally and easily

6
compared to any other CW laser. Sierra et al. [21] showed that when Al was placed
upon steel, the IMC layer created by a CW laser was larger when compared to the
opposite configuration. This was caused due to the increased diffusion of Fe into
molten Al when the steel plate was still solid. The high concentration of hard and
brittle Fe2Al5 in the Al interface was detrimental to the strength of the welds [21][22].
The advancements of the latest generation of fibre pulsed lasers in pulse shape
modulation, higher peak powers and shorter pulse durations available can bring
advantages in minimizing the IMC concentration through a fast freezing of the melt
pool. Nevertheless, their lower average power in comparison to CW lasers can be a
major drawback for the application in thicker material sheets. The previous studies
showed that is possible to achieve good joints between SS and Al using PW and CW
lasers, but the results are case to case sensitive. However, it wasn’t found any direct
comparison between both laser temporal modes in order to quantify which one offers
better control of the IMCs at the joint interface, better weld shape flexibility to
increase the bonding area and consequently stronger joints. Therefore, it is
necessary a like-for-like comparison of both lasers with a systematic and controlled
way to achieve large enough joints without overheating the materials.
The aim of this research is to compare continuous wave and pulsed wave in order to
understand how the bond area, weld shape, IMCs distribution and lap-joint
configuration affect the mechanical strength of welds achieved at similar applied
energy per unit length.

7
2.0 Definition of the fundamental laser material interaction parameters
To enable like for like comparison between CW and PW lasers, a concept of
fundamental laser material interaction parameters (FLMIP) has been used this work
[23][24][25]. These parameters fully describe the laser-material interaction, allowing
the replication of similar weld shapes in different laser systems operated in CW
mode [23][24] and PW mode [25] because they control the weld thermal cycle [26].
The application of energy per unit length on the material is well defined for CW
mode. However, as shown in Fig. 1, in nano-second PW seam welding the energy is
delivered in the form of individual pulses or trains of pulses with a characteristic
pulse energy (Epulse), peak power and pulse duration (PWidth). Since the peak power
is only instantaneous, similarly to previous studies [27][28], this work has also
considered the average peak power for pulse energy calculation purposes.
Fig. 1 Differentiation of lasers in terms of temporal outputs in continuous wave
and modulated pulsed wave mode [29]
In CW mode, the process can be specified using power density (qp), interaction time
(ti) and specific point energy (ESP), as given by Eqs. (1-3) [26]. The first one is
Po
we
r Average power = Peak power
CW operation
Time Time
Po
we
r
Modulated PW operation
Average Power
Average peak power
Peak Power

8
determined as the ratio of the laser average power (PL) to the area of laser spot on
the material’s surface (AS), which for a circular beam diameter is given by Eq. (1).
The interaction time is defined as the ratio of the beam diameter (d) in the welding
direction to the travel speed (v), given by Eq. (2). The energy delivered to any
specific point on the weld centreline is equal to the product of power density,
interaction time and the area of the laser spot on the surface, as given by Eq. (3).
𝑞𝑝 = 𝑃𝐿𝐴𝑠 [𝑀𝑊/𝑐𝑚2] (1)
𝑡𝑖 = 𝑑𝑣 [𝑚𝑠] (2)
𝐸𝑆𝑃 = 𝑞𝑝 ∗ 𝑡𝑖 ∗ 𝐴𝑠 = 𝑃𝐿 ∗ 𝑡𝑖 [𝐽] (3)
The output characterization of the nano-second PW laser used in this work is shown
in Fig. 2. Each temporal mode, referred to as waveform, has optimum pulse
repetition frequency (PRF0) where the average peak power (Ppeak) and pulse energy
are maximum. Above PRF0, the average power remains constant but the pulse
energy and average peak power are reduced, whereas below PRF0, the average
power decreases but the average peak power and pulse energy remain constant
[30], as given by Eq. (4) and Eq. (5), respectively. The duty cycle has different limits
depending on the average peak power selected. The percentage of overlap between
consecutive spots is given by Eq. (6) [31].
Ppeak = Epulse/ Pwidth [W] (4)
Epulse = PL/PRF [J] (5)

9
𝑂𝐹 = (1 − 𝑣𝑑∗𝑃𝑅𝐹) ∗ 100 [%] (6)
Fig. 2 Output characterization of the nano-second PW laser [27]
The analysis of the PW welding results was also made using FLMIP: However, in
PW mode the interaction time defines the time in which a point is exposed to the
laser beam in the weld centreline. It is dependent on the duration of each pulse and
the overlap between them, as given by Eq. (7). At 0% overlap factor, the interaction
time is equal to pulse width and at 100% the equation is not applicable, since the
beam is stationary. Hence, Eq. (7) is only applicable below 100% of overlapping
factor [17]. As previously explained in Fig. 2, Ppeak change with PRF for constant
average power. Therefore, the average peak power density (qp, peak) in Eq. (8) is
defined by the ratio of Ppeak by the area of the laser spot, whereas the specific pulse
energy (ESP, pulse) in Eq.(9) represents the overall energy delivered by several pulses
for a certain laser-material interaction time.
𝑡𝑖 = (𝑃𝑤𝑖𝑑𝑡ℎ1− 𝑂𝑓100 ) [𝑚𝑠] (7)

10
𝑞𝑝, 𝑝𝑒𝑎𝑘 = 𝑃𝑝𝑒𝑎𝑘𝐴𝑠 [𝑀𝑊/𝑐𝑚2] (8)
𝐸𝑆𝑃, 𝑝𝑢𝑙𝑠𝑒 = 𝑞𝑝, 𝑝𝑒𝑎𝑘 ∗ 𝑡𝑖 ∗ 𝐴𝑠 = 𝑃𝑝𝑒𝑎𝑘 ∗ 𝑡𝑖 [𝐽] (9)
3.0 Experimental set-up
The welds were carried out in 1 mm thick 5251 Al alloy and 304L austenitic SS. The
chemical composition of each alloy is shown in Table 1. The physical and
mechanical properties are shown in Table 2.
Table 1 Chemical composition of the base materials [32][33]
Elements (wt.%)
Material Si Fe P Cu Mn Mg N Ni Zn Ti Cr C Al Fe
5251
H22
Max
0.4
Max
0.5 -
Max
0.15
0.1
–
0.5
1.7
–
2.4
- - Max
0.15
Max
0.15
Max
0.15 - Bal. -
304 L Max
1.00 Bal.
Max
0.05 -
Max
2.00 -
Max
0.11
8.00 –
10.50 - -
17.50
–
19.50
Max
0.03 - Bal.
Table 2 Physical and mechanical properties of the base materials [32][33][34]
Property Symbol Units Al 5251 H22 SS304L
Density ρ g/cm3 2.69 8.0
Melting Temperature Tm K 898 1723
Vaporisation Temperature Tv W.(m.K)-1 2790 3023
Thermal conductivity average k W m-1 K
-1 134 16.2
Latent heat of melting Hm J.kg-1 3.5 x 10
5 2.73 x 10
5
Latent heat of vaporisation Hv J.kg-1 1.19 x 10
7 6.1 x 10
6
Thermal diffusivity average α m2 s
-1 5.7 x 10
-5 5.5 x 10
-6
Specific heat of solid phase cps J.kg-1.K
-1 850 477
Viscosity ƞ m.Pas 1.3 8
Modulus of Elasticity E GPa 70 193
Proof Stress ᵟ MPa 120 min 220 min
Tensile Strength UTS MPa 190 - 230 520 - 700
The welding configuration used, and corresponding dimensions are shown in Fig 3.
Lap-joints were performed positioning SS on top of Al (SS-Al) and vice-versa (Al-
SS). According to the literature survey, the IMC grow with temperature and time. A

11
copper heat sink can efficiently extract the heat away from the joint due to its high
thermal conductivity [4]. By reducing the thermal cycle, the growth of the IMCs but
also the likelihood of distortion are reduced [35]. Therefore, a 5 mm thick copper
backing bar was used. The welding tests were carried out with two different SPI fibre
lasers independently used: a 500W average power CW fibre laser and a 100W
average power nano-second pulsed fibre laser. The power of both lasers was
measured and calibrated by a Laserpoint power meter and the beam profiles were
measured using a DataRay slit scan beam profiler, showing both Gaussian beam
profiles. The 35 µm beam diameters of both lasers was focused using the same 160
mm f-theta focusing lens connected to a Galvanometer-scanner. An air-knife was
used with compressed gas to protect the lens from spatter and no shielding gas was
applied on the substrate. Before welding, the base materials were ground to remove
the oxide layer and residues and then cleaned with acetone.
Fig 3 Lap-joints dimensions of SS-Al and Al-SS
Copper backing bar
Alloy 1 Alloy 2

12
4.0 Methodology
CW laser welding of SS-Al and Al-SS 4.1
This section aims to investigate the influence of power density (qp) and specific point
energy (ESP) in the bonding quality of lap welded joints of SS-Al and Al-SS, using a
CW laser. For a constant beam diameter of 35 µm, different combinations of average
power and travel speed were used, resulting in a range of qp from 26 to 49 MW/cm2
and ESP from 137 to 1000 mJ, according to Eqs. (1) and (3), respectively. The set of
parameters used, and the respective results of the bonding success are shown in
Table 3. The values presented result from a number of experiments produced to
identify the necessary laser parameters to ensure successful bonding between the
base materials.
Table 3 CW laser welding parameters and results for a beam diameter of 35 µm
System Parameters FLMIP
Beam
diameter
[µm]
Average Power
[W]
Travel Speed
[mm/s]
Interaction time
[ms]
Average Power Density
[MW/cm2]
Specific Point Energy
[mJ]
d PL v ti qp ESP
35 250-472 11-94 0.40-3.2 26-49 137-100
PW laser welding of SS-Al and Al-SS 4.2
A nanosecond PW laser was used to join SS-Al and Al-SS. The aim is to study the
influence of average peak power density (qp, peak) and specific pulse energy (ESP,
pulse) in the bonding quality of lap-joints and compare the processing parameters to
achieve similar PW and CW welds. Only one waveform with maximum pulse energy
and longest pulse duration available in the laser has been selected. Its

13
characteristics are shown in Table 4. For a constant beam diameter of 35 µm,
average power of 100 W and pulse width of 500 ns, different combinations of peak
power, pulse energy, travel speed and pulse repetition frequency were used,
resulting in a constant qp of 10.4 MW/cm2 and a range of qp, peak from 33 to 208
MW/cm2 and ESP, pulse from 250 to 1000 mJ, according to Eqs. (1), (8) and (9),
respectively. The set of parameters used are shown in Table 5.
Table 4 Characteristics of waveform 31 of PW laser
Waveform PRF0 (kHz) Max pulse energy, Emax
(mJ) Pulse width (ns) Peak Power at Emax (kW)
31 100 1 500 7
Table 5 PW laser welding parameters for a beam diameter of 35 µm, average
power of 100 W and pulse width of 500 ns
System parameters Calculated
parameters FLMIP
Frequency
(kHz)
Travel
speed
(mm/s)
Pulse
energy
(mJ)
Peak
power
(kW)
Overlap
factor
(%)
Duty
cycle
(%)
Average
power
density
(MW/cm2)
Average
peak power
density
(MW/cm2)
Specific
pulse
energy
(mJ)
Interaction
time (ms)
PRF v EPulse Ppeak 𝑂𝐹 DC qp qp, peak ESP, pulse ti
100 - 807 3.5 - 14 0.12 -
1.0
0.25 -
2.0
99.9-
99.98 5 - 40.4 10.4 26-208
250-
1000 0.5-3.2
Mechanical strength characterisation 4.3
Tensile shear tests were carried out to analyse the mechanical strength of selected
successful joints from Table 3 and Table 5 for CW and PW mode, respectively. The
maximum load and maximum load per unit of length of the welds were compared
between both laser processing modes for similar applied energies. The ultimate

14
tensile strength (UTS) was also calculated for the strongest joint achieved in each
mode by dividing the maximum load by the area of the weld cross-section. The tests
were performed at room temperature using an electromechanical Instron 5500
machine, with a load cell of 3 kN and a crosshead displacement of 0.5 mm/min
perpendicular to the weld direction. The geometry and dimensions of the cross weld
lap tensile-shear test specimens were compliant with ISO 14273:2001 standards for
mechanical tensile shear testing of seam welds [36]. Fig. 4 shows the weld lines
patterns used for the tensile testing. The test sample was straight lined, 25 mm wide
and 160 mm long. Different number of 25 mm long horizontal weld line patterns were
used: (a) single line, (b) 2 lines and (c) 4 lines, separated by 5 mm each. The
elongation of the parent metals was measured using a laser extensometer model
LE-15, for a gauge length of 30 mm.
Fig. 4 Pattern of weld lines used for tensile testing
Metallographic characterization 4.4
The cross sections were mounted in plastic moulds using an epoxy resin mixed with
a hardener, ground and then polished to mirror like surface. The microstructure of
25 mm 25 mm 25 mm
a b c

15
aluminium was revealed by etching its surface with Keller´s reagent, whereas
stainless-steel was electrolytically etched with 10% of oxalic acid. Micrographs were
taken with an Optiphot optical microscope with several magnification levels. A
scanning electron microscope (SEM) equipment was also used to investigate the
composition and distribution of the IMC on the fusion zone of the welds with an
integrated energy-dispersive X-ray spectroscopy (EDS).
5.0 Results and discussion
CW laser welding of SS-Al and Al-SS 5.1
The CW laser was used to join SS-Al in the first stage and then, in a second stage,
Al-SS. The welding parameters used are shown in Table 6.
Table 6 Laser welding parameters and results for a beam diameter of 35 µm
System Parameters FLMIP Successful bonding?
Beam
diameter
[µm]
Average
Power
[W]
Travel
Speed
[mm/s]
Interaction
time [ms]
Average Power
Density [MW/cm2]
Specific Point
Energy [mJ] SS-Al lap-joint Al-SS lap-joint
d PL v ti qp ESP - -
35 250 64 0.55 26 137 NO NO
35 250 32 1.1 26 273 YES NO
35 250 16 2.2 26 545 YES NO
35 304 64 0.55 32 166 NO NO
35 304 32 1.1 32 333 YES NO
35 304 16 2.2 32 665 YES NO
35 320 64 0.50 33 176 YES NO
35 320 41 0.90 33 273 YES NO
35 320 34 1.0 33 333 YES NO
35 320 22 1.6 33 516 YES NO
35 320 11 3.2 33 1000 YES NO
35 472 94 0.40 49 176 YES NO
35 472 64 0.50 49 258 YES NO
35 472 32 1.1 49 516 NO NO

16
It is shown in Fig 5a-c the fusion zone of the lap-joints of SS-Al for different levels of
specific point energy and constant power density. In Fig 5d-f, it is shown in more
detail the respective joints magnification from Fig 5a-c. Due to the lower vaporisation
temperature of Al in comparison to stainless-steel (Table 2), in Fig 5a occurred a
violent ejection of metal for the highest ESP and qp applied. As ESP decreased from
Fig 5d-f at constant qp through a reduction in ti (Table 6), the penetration depth
decreased as well and weld quality was improved, i.e. cracks were reduced. This
improvement is related with the IMC formation, since they are dependent on the time
and temperature of the process, decreasing with a reduction in energy input [35]. It is
important to highlight the difficulty in achieving low energy levels with CW lasers,
since high travel speeds are required to achieve rapid melting and solidification and
consequently, low IMC formation.

17
qp = 49 MW/cm2
ESP = 516 mJ; ti = 1.1 ms. ESP = 258 mJ; ti = 0.50 ms ESP = 176 mJ; ti = 0.40 ms
Higher magnification of the joints interface
Fig 5 CW lap-joints of SS-Al for constant qp of 49 MW/cm2 and different ESP and
ti
In Fig 5, the IMC were mixed and not distributed in a thin layer as a needle shape
along the interface, as observed in previous studies for laser conduction mode
[35][37][38]. Since this study has been performed in keyhole mode, the mixing of
both alloys was enhanced and the IMCs distributed around the fusion zone, as
observed in the EDS mapping in Fig. 6. A several times lower viscosity of Al as
compared to SS (Table 2) must be considered as an important factor to explain how
easy Fe diffuses in Al, enhancing their mixing. Moreover, the higher density of SS in
comparison to Al (Table 2) may also have facilitated the mixing of both alloys. A
similar explanation was given by Lee et al. when they tried to join Al to copper [39].
a b c
d e f
500 µm 500 µm 500 µm
200 µm 200 µm 100 µm
SS
Al
SS
Al
SS
Al
Al
SS SS
Al
SS
Al

18
Fig. 6 EDS mapping of Fe and Al elements from a CW lap-joint of SS-Al for qp
of 49 MW/cm2, ESP of 176 mJ and ti of 0.4 ms
It is known that lower power density decreases the reaction rate between Al and Fe,
enabling a better control of the IMCs formation [35]. Therefore, in this work, the
power density has been decreased from 49 MW/cm2 in Fig 5 to 33 MW/cm2 in Fig. 7
at constant ESP through a reduction in average power and travel speed (Table 6). As
expected, the weld quality has been improved, despite the small cracks caused by
the remaining IMCs. Some solute bands of Fe-Al phases are visible on the edge of
the weld. These bands have also been observed by Sierra et al. when joining steel to
Al using a high-power CW laser [21]. They attributed their origin to the upward
convection movements occurring at high temperature, entrapping Al in steel. A rise
in the volume of liquid Al due to the increase of steel penetration led to a greater Al–
Fe dilution, which resulted in thicker bands, as observed in Fig. 7d. These bands
could form: (1) locally richer aluminium Fe–Al alloys, (2) FexAly intermetallic phases
if the formation threshold had been reached, or (3) could solidify as pure Al. [21].
SS
Al
SS
Al
19
qp = 33 MW/cm2
ESP = 516 mJ; ti = 1.6 ms ESP = 333 mJ; ti = 1.0 ms ESP = 176 mJ; ti = 0.5 ms
Higher magnification of the joints interface
Fig. 7 CW lap-joints of SS-Al for constant qp of 33 MW/cm2 and different ESP
and ti
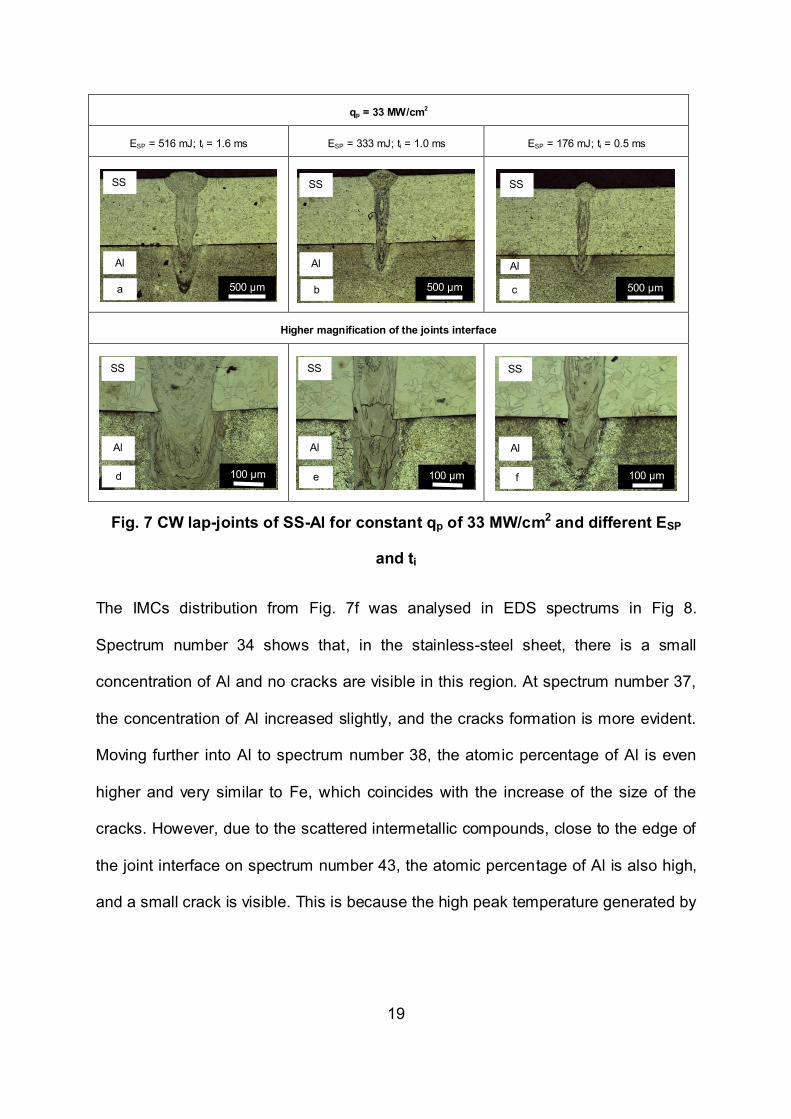
The IMCs distribution from Fig. 7f was analysed in EDS spectrums in Fig 8.
Spectrum number 34 shows that, in the stainless-steel sheet, there is a small
concentration of Al and no cracks are visible in this region. At spectrum number 37,
the concentration of Al increased slightly, and the cracks formation is more evident.
Moving further into Al to spectrum number 38, the atomic percentage of Al is even
higher and very similar to Fe, which coincides with the increase of the size of the
cracks. However, due to the scattered intermetallic compounds, close to the edge of
the joint interface on spectrum number 43, the atomic percentage of Al is also high,
and a small crack is visible. This is because the high peak temperature generated by
a b c
d e f
500 µm 500 µm 500 µm
100 µm 100 µm 100 µm
SS
Al
SS
Al
SS
Al
SS
Al
SS
Al
SS
Al
20
the high-power density applied in a small beam, resulted in a rise in the recoil
pressure, causing an upward convection of Al [27].
The IMCs are organized into two groups, the Fe-rich and the Al-rich IMCs. The
hardest and thus more brittle IMCs are found in the Al-rich group [40][38] for an
atomic concentration (at) of Al above 58%. Sierra et al. [21] observed that the
hardness and consequently, the cracks formation, increased in steel-on-aluminium
laser welds for deeper penetrations, mainly attributed to an increase in Al ratio in the
weld. These conclusions are in agreement with spectrum 34 from Fig 8b, where the
at.% of Al is below 10% and no cracks are visible, being all the Al dissolved in Fe
[40][38], and also with spectrum 38, where the at.% of Al is close to 40% and larger
cracks can be observed. However, due to the severe Al gradients across the weld
metal area, different IMCs could have been formed on specific locations.

21
Fig 8 SEM micrograph (a) and respective EDS spectrum analysis (b) from a CW
lap-joint of SS-Al for qp of 33 MW/cm2, ESP of 176 mJ and ti of 0.5 ms
The welding parameters from Fig. 7 were replicated for a Al-SS lap-joint
configuration and presented in Fig. 9. Despite the reduction of ESP at constant qp
from Fig. 9a-c, no successful lap-joints were possible to achieve, breaking at the
interface. In Fig. 9a (Al-SS), for specific point energy of 516 mJ and power density of
33 MW/cm2, the weld width of the upper sheet of Al was greater as in comparison to
Fig. 7a (SS-Al). The higher thermal conductivity by a factor of eight and lower
melting temperature by a factor of two of Al (Table 2), allowed to create a larger
b
a

22
fusion zone in Fig. 9a, conducting the heat faster to SS. On the other hand, for SS-Al
in Fig. 7a, similar energy of 516 mJ took longer to reach the Al sheet for a similar
interaction time of 0.5 ms, since the specific heat capacity of SS is 1.8x lower than
Al. Thus, the peak temperature reached at the joint interface was lower, decreasing
the penetration depth and the IMCs concentration in comparison to the Al-SS lap-
joint in Fig. 9a. This may explain difference in bonding for both joint configurations.
Similar results were observed by Sierra et al. when joining aluminium-on-steel [21].
All welds performed were cracked at the joint interface. The steel interface exhibited
large IMCs, more than 50 µm thick because the liquid was richer in steel. They
concluded that the cracks were probably related to the sensitivity to hot cracking of
the Al alloys used in their study.

23
qp = 33 MW/cm2
ESP = 516 mJ; ti = 1.6 ms ESP = 333 mJ; ti = 1.0 ms ESP = 176 mJ; ti = 0.5 ms
Higher magnification of the joints interface
Fig. 9 CW lap-joints of Al-SS for constant qp of 33 MW/cm2 and different ESP
and ti
PW laser welding of SS-Al and Al-SS 5.2
In this section, a PW laser was used to join SS-Al in the first stage and then Al-SS in
a second stage. The welding parameters used are shown in Table 7.
a b c
d e f
500 µm 500 µm 500 µm
200 µm 100 µm 100 µm
SS
Al
Al Al
SS SS
SS
SS SS
Al Al Al

24
Table 7 PW laser welding parameters and results for a beam diameter of 35
µm, average power of 100 W and pulse width of 500 ns.
System parameters Calculated
parameters
FLMIP Successful
bonding?
Frequency
(kHz)
Travel
speed
(mm/s)
Pulse
energy
(mJ)
Peak
power
(kW)
Overlap
factor
(%)
Duty
cycle
(%)
Average
power
density
(MW/cm2)
Average
peak power
density
(MW/cm2)
Specific
pulse energy
(mJ)
Interaction
time (ms)
SS-Al
lap-joint
Al-SS
lap-joint
PRF v EPulse Ppeak 𝑂𝐹 DC qp qp, peak ESP, pulse ti -
100 3.5 1.0 2.0 99.9 5 10.4 208 1000 0.5 NO YES
150 5.2 0.67 1.3 99.9 7.5 10.4 139 667 0.5 NO YES
300 10.5 0.33 0.67 99.9 15 10.4 69 333 0.5 NO YES
400 14 0.25 0.50 99.9 20 10.4 52 250 0.5 NO NO
807 6.4 0.12 0.25 99.98 40.4 10.4 26 545 2.2 NO NO
640 3.5 0.16 0.31 99.98 32 10.4 33 1000 3.2 NO NO
426 6.8 0.23 0.47 99.96 21.3 10.4 49 516 1.1 NO NO
In Fig. 10a is shown a PW lap-joint of SS-Al for qp, peak of 208 MW/cm2 and ESP, pulse
of 1000 mJ. The respective EDS spectrum analysis is shown Fig. 10b. Several voids
can be observed along the fusion zone in Fig. 10a. Magnesium is one of the main
alloying elements of the Al alloy used in this study (Table 1). Since the vaporisation
temperature of magnesium (1363 K) is much lower than SS (3023 K) and Al (2790
K), its vaporisation may have a strong contribution for the keyhole instability,
increasing the capillary forces generated and the defects likelihood in the weld pool
[28][41]. The lower viscosity of Al as compared to SS also enables more efficient
melt removal from the bottom of the keyhole [34].

25
The EDS spectrum analysis from Fig. 10b indicates a high concentration of Fe in the
centre of the SS sheet, being residual the atomic percentage of Al. However, on the
edge of the same horizontal line, the atomic percentage of Al is 49%. On the Al
sheet, in the middle of the fusion zone the atomic percentage of Al is almost 100%.
The presence of voids caused by the entrapment of the vaporised alloys after
solidification enhanced the mixing of both metals at the interface [42] where the
atomic percentage of Al is above 70%. For these Al percentages, F2Al5 and FeAl3
phases were formed [12][40][38]. The low fracture toughness of each phase may
explain the lack of bonding between these alloys for the parameters tested due to
crack formation [42].

26
Fig. 10 SEM micrograph (a) and respective EDS spectrum analysis (b) from a
PW lap-joint of SS-Al for qp of 10.4 MW/cm2, qp, peak of 208 MW/cm2, ESP, pulse of
1000 mJ and ti of 0.5 ms
The SS-Al lap-joints were unsuccessful using a PW laser, but successful in CW
mode, as demonstrated in the previous section. A comparison between both
temporal modes is shown in Fig. 11 for similar penetration depth of 1.2 mm. Despite
the lower average power of the PW laser in comparison to the CW laser, its higher
peak power generated a higher average peak power density applied in Fig. 11b,
increasing the vaporisation of Al and its alloying elements. This is likely to cause the
b
a

27
escape of the vaporised elements towards the top of the narrow weld, causing a high
pressure at the joint interface by a descending stream of molten steel and an
ascending stream of molten Al, enhancing the mixing between the base metals and
the formation of brittle IMCs. Moreover, the difference in thermal expansion
coefficient of both alloys [3] will force a gap between both sheets, cracking the
narrow joint, avoiding the bonding. However, this phenomenon is not so evident in
CW mode in Fig. 11a. For a similar interaction time of 0.5 ms, CW laser utilizes a
duty cycle of 100% at a travel speed of 64 mm/s (Table 6), whereas with PW laser a
duty cycle of 15% and a travel speed of 10.5 mm/s are applied. Thus, the thermal
losses are lower in CW mode than in PW mode, being possible to achieve similar
penetration depth and a larger weld width at lower applied energy. Due to the deeper
depth of penetration, a greater volume of SS was mixed in Al, breaking the balance
between recoil pressure and surface tension, enhancing the mixing between both
alloys at the bottom of the weld, as previously shown in the EDS mapping from Fig 8.
Hence, in CW mode, most of the brittle IMCs concentration are shifted away from the
joint interface, improving the bonding between both alloys.
28
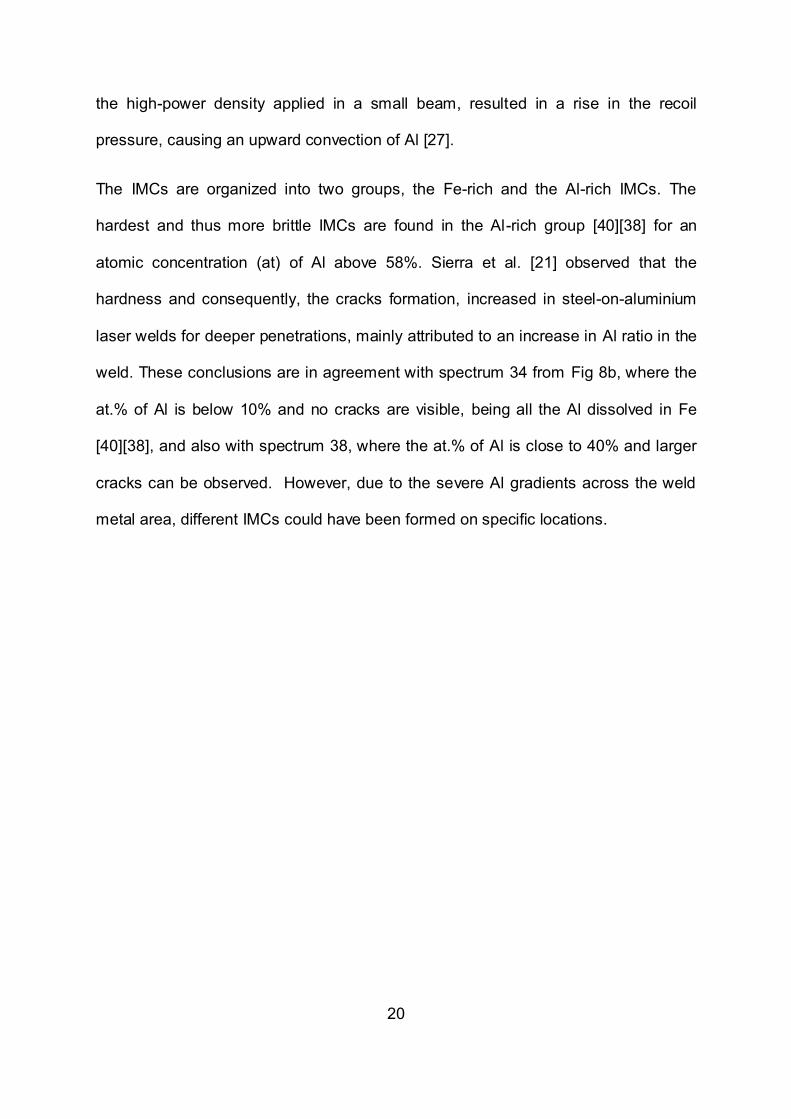
Fig. 11 SS-Al lap-joints for a penetration depth of 1.2 mm: (a) CW welding at qp
of 33 MW/cm2, ESP of 176 mJ and ti of 0.5 ms; (b) PW welding at qp of 10.4
MW/cm2, qp, peak of 69 MW/cm2, ESP, pulse of 333 mJ and ti of 0.5 ms
The welding parameters from Table 5 have been replicated for Al-SS lap-joint
configuration and presented in Fig. 12. Decreasing ESP, pulse and qp, peak at constant qp
and ti through an increase in travel speed and PRF, the penetration depth decreased
from Fig. 12a-c and the weld quality was decreased as well, with some cracks being
visible at the joint interface in Fig. 12f. Due to Al positioned on top, its alloying
elements are more likely to vaporise and escape from the top of the weld pool,
generating capillary forces which drag SS (Fe) into Al, as observed in the EDS
mapping from Fig. 13, corresponding to Fig. 12d. Similar results were observed in
Fig. 9 for CW mode.
Aluminium
Stainless-steel
Aluminium
Stainless-steel
100 µm 100 µm
100 µm 100 µm
CW welding PW welding
b
a

29
qp = 10.4 MW/cm2; ti = 0.5 ms
qp, peak = 208 MW/cm2
ESP, pulse = 1000mJ
qp, peak = 139 MW/cm2
ESP, pulse = 667 mJ
qp, peak = 52 MW/cm2
ESP, pulse = 250mJ
Higher magnification of the joints interface
Fig. 12 PW lap-joints of Al-SS for constant qp of 10.4, ti of 0.5 ms and different
qp, peak and ESP, pulse
Fig. 13 EDS mapping of Fe and Al elements from a PW lap-joint of Al-SS for qp
of 10.4 MW/cm2, qp, peak of 208 MW/cm2, ESP, pulse of 1000 mJ and ti of 0.5 ms
a b c
d e f
500 µm 500 µm 500 µm
200 µm 100 µm 100 µm
Al Al Al
Al Al Al
SS SS
SS
SS SS SS
SS
Al Al
SS

30
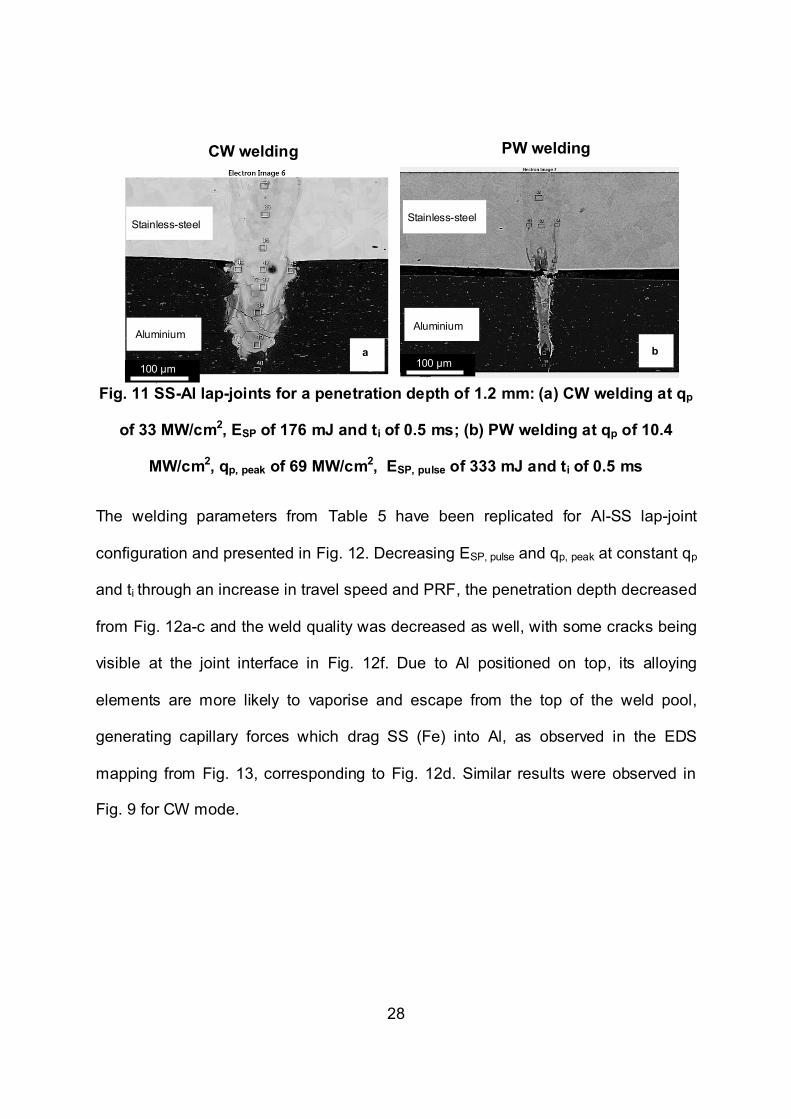
Several sections from Fig. 12d were analysed in Fig. 14 at the top (Fig. 14a), middle
(Fig. 14b) and at the joint interface (Fig. 14c). The corresponding SEM analysis is
shown in Fig. 15. In spectrum 67 from Fig. 15, there is a high atomic concentration of
Al in comparison to Fe, whereas in spectrum 64, the atomic percentage of iron
increased. This is likely to be caused by the high peak power density applied in PW
mode at a high pulse repetition frequency, which forced the stirring and mixing of Al
in SS, despite the difference in density and viscosity. Consequently, the higher peak
temperature in the centre of the beam increased the concentration of FeAl3 in this
area, being visible a large crack along the fusion zone. In spectrum 52 from Fig. 15,
the concentration of Al in the fusion zone decreased in comparison to spectrum 64,
increasing the concentration of Fe, being formed FeAl phase (Iron-rich IMC), which
have higher ductility [40][38]. Consequently, the cracks’ size was reduced. At the
joint interface, the atomic concentration of Al is almost inexistent, being dominated
by iron, as shown in spectrum 39. Therefore, most of the Al is dissolved into Fe
[38][40] and most of the IMCs were shifted away from this region, which is the
reason why no cracks are visible.
31
Fig. 14 SEM micrographs from a PW lap-joint of Al-SS for qp of 10.4 MW/cm2,
qp, peak of 208 MW/cm2, ESP, pulse of 1000 mJ and ti of 0.5 ms
67 64
52
39
a
b
c
25 µm
25 µm
25 µm
Sta
inle
ss-s
tee
l A
lum
iniu
m

32
Fig. 15 EDS spectrum analysis from a PW weld of Al-SS for qp of 10.4 MW/cm2,
qp, peak of 208 MW/cm2, ESP, pulse 1000 mJ and ti of 0.5 ms
The EDS spectrum analysis from Fig. 12f is shown in Fig 16. When the peak power
density and specific pulse energy were reduced, the penetration depth and the weld
quality were reduced as well, being visible more cracks on the aluminium side. The
mixing between both alloys was shifted closer to the joint interface, being formed Al-
rich brittle IMCs (Fe2Al3) [38][40], which avoided a successful bonding. It may be
possible that the reduction in the applied energy led to a reduction in peak
temperature in the molten metal. Since, the temperature reduction increases the
viscosity of both alloys [34], the capillary forces are reduced, being more difficult for
SS to push Al towards the top of the weld pool. Hence, this may explain why the
higher IMC concentration and cracks at the interface.
0
20
40
60
80
100
39 52 64 67
at
[%]
Spectrum
Fe Cr Al

33
Fig 16 SEM micrograph (a) and respective EDS spectrum analysis (b) from a
PW lap-joint of Al-SS for qp of 10.4 MW/cm2, qp, peak of 52 MW/cm2, ESP, pulse of
250 mJ and ti of 0.5 ms
The lap-joints of Al-SS were successful using a PW laser, but unsuccessful in CW
mode, as demonstrated in section 5.1. A comparison between both temporal modes
is shown in Fig. 17 for a similar penetration depth of 1.6 mm. Due to the larger weld
width of Al formed in the CW weld in Fig. 17b, iron is diffused over a larger area and
the brittle IMCs are scattered along the joint interface, increasing the cracking
likelihood. However, in Fig. 17a, the weld width of Al in PW mode is 10x smaller than
in CW mode, forcing iron to diffuse in Al through a narrower channel, as previously
b
a

34
observed in the EDS mapping from Fig. 13. This phenomenon is enhanced by the
faster cooling rate of the nanosecond laser in comparison to CW mode, which limits
the diffusion of Al on SS for a similar interaction time of 0.5 ms. In addition to this, a
smaller volume of liquid Al should minimize the mixing and prevent the IMC
formation. Consequently, the mixing between both alloys in PW mode is shifted
away from the joint interface, as previously shown in Fig. 14, allowing successful
joints.

35
Depth of Penetration = 1.6 mm; ti = 0.5 ms
PW welding CW welding
qp = 10.4 MW/cm2; qp, peak = 208 MW/cm
2
ESP, pulse = 1000mJ
qp = 33 MW/cm2 = qp, peak
ESP = 176 mJ
Higher magnification of the joints interface
Fig. 17 PW and CW lap-joints of Al-SS for a penetration depth of 1.6 mm and ti
of 0.5 ms
Mechanical testing 5.3
CW laser welding of SS-Al 5.3.1
A subsection of the successful set of parameters from Table 3 were chosen to
conduct mechanical tests in order to evaluate the tensile shear load and load per unit
a b
c d
500 µm 500 µm
50 µm 100 µm
Al
SS
Al
SS
Al
SS
Al
SS

36
of weld length of CW joints. It is shown in Figure 18a that, for constant ESP and qp,
the breaking load increases with an increase in the number of weld lines. There is
also a trend on the increase of the tensile shear load with the increase of the energy
from 333 mJ to 1000 mJ, being possible to reach 1700 N using four weld lines. This
observation may be related with the larger bonding area achieved for a longer
thermal cycle [20], creating a better anchoring effect of the weld-aluminium interface
due to a higher penetration [21]. On the other hand, since the penetration is deeper
for higher energy levels, most of the brittle IMCs are concentrated at the bottom of
the weld-aluminium interface, being most of the cracks shifted away from the joint
interface, reducing their propagation, as previously explained in section 5.1.Thus, the
remaining cracks will avoid an increase in tensile shear load in the same proportion
of the increase of weld lines number.
Fig. 18 Tensile shear load and load per unit length of weld versus ESP of CW
lap-joints of SS-Al for qp of 33 MW/cm2
In Fig. 18b, the maximum load per unit length of weld was calculated by dividing the
maximum tensile shear load by the weld width from Fig. 18a. As observed in Fig.
a b

37
18b, by increasing ESP from 333 mJ to 1000 mJ at constant qp of 33 MW/cm2, the
load remained similar for each weld pattern. Thus, the advantage of a larger bonding
area for higher values of specific pulse energy may have a threshold in order to
improve the load capacity, as further IMCs growth would outweigh the advantage of
higher wetting area [35], decreasing the linear strength from a certain threshold [21].
These results suggest that it is difficult to further improve the mechanical strength of
the joints by solely controlling the energy of the process, as also previously
concluded by Meco et al. [20], but a definite answer would need more experiments.
Meco et al. concluded that the bonding area is one of the key factors for the integrity
of the Fe-Al joints and the mechanical strength of the joints couldn ’t be improved by
increasing the bonding through power density since it is the parameter which most
controls the temperature and consequently, the IMC growth would be enhanced.
However, the authors suggested that by producing parallel weld seams, the bonding
area could be increased, avoiding the negative effect of the IMCs [20]. That strategy
was used in this work in Fig. 18a and has revealed to be successful.
PW laser welding of Al-SS 5.3.2
The successful set of parameters from Table 5 were chosen to conduct mechanical
tests and evaluate the tensile shear load and load per unit of weld length of PW
joints. In Figure 19a, the maximum tensile shear load increased with the increase in
the number of weld lines and with the pulse ESP. A maximum load of 1330 N was
achieved using four weld lines for an energy of 1000 mJ and an interaction time of
0.5 ms. For one weld line and an applied energy of 1000 mJ, the specimen

38
experienced a total elongation of 0.11%, slightly less when compared to the 0.14 %
in CW processing. In both cases, there was some plastic deformation and the failure
of all samples occurred at the metal interface.
As observed in Figure 19b, the maximum load per unit length of weld increases with
ESP, pulse and with the number of weld lines. However, contrary to what was observed
in the previous section for CW mode, this improvement is not related with the
increase of the bonding area since the PW weld width remained almost constant for
different energy levels, as previously shown in Fig. 12d-f. Thus, for a constant weld
width, a higher applied energy will force a larger volume of SS to push Al through a
narrow channel, preventing the defects caused by the brittle IMCs at the joint
interface, increasing the weld strength. The maximum tensile shear load achieved in
PW mode (Figure 19a) is lower than in CW mode (Fig. 18a) for similar energy levels.
Nevertheless, due to the narrower welds in PW welding, the load per unit length of
weld in Figure 19b can be almost 5x higher than in CW mode in Fig. 18b. This
highlights once again the importance of the higher peak power density, which allows
high aspect ratio welds, and the fast freezing of the melt pool, avoiding the IMCs
growth. Therefore, if the welding application requires a higher fit-up tolerance and
productivity, CW laser is more indicated, providing a flexible weld shape and larger
bonding areas. On the other hand, if the requirements are low heat affected zone,
precise control of the heat input and narrow joints, PW is the most suitable laser.

39
a b ESP, pulse [mJ] E
SP, pulse [mJ]
a
Figure 19 Tensile shear load and load per unit length of weld versus ESP, pulse of
PW lap-joints of Al-SS for ti of 0.5 ms.
In both laser temporal modes, it was impossible to control the brittle IMCs formation
for the range of parameters tested. In CW laser was harder to decouple temperature
from the melt area, which created a high concentration and more scattered IMCs in
the fusion zone, especially for Al-SS joints where there was a high diffusion of Fe to
the wider Al weld. On the other hand, for PW laser, there was more flexibility in
reducing the alloys mixing and increase the weld strength by minimizing the IMC
formation through the faster freezing of the weld pool. The addition of many narrower
welds using low power density and energy levels above 333 mJ allowed equivalent
bonding areas to CW and localized diffusion of Fe into Al, pushing the IMCs out to
the fusion zone in Al-SS joints. Thus, for similar applied energy of 1000 mJ and
using four weld lines, an ultimate tensile strength (UTS) of 332 MPa was possible in
Al-SS joints for PW mode, whereas in SS-Al CW welds it was only possible 65 MPa

40
for the same conditions. This reveals that PW welds can be nearly 5x stronger than
the weakest parent metal (Al) showed in Table 2.
The limitation imposed by the melting temperature of these alloys, maximum weld
width and penetration depth on the IMCs growth and distribution in the weld fusion
zone, creates a limit on the laser parameters selection in order to maximise the
tensile shear load. Thus, several combinations of energy and power density can be
used to achieve similar welds, but the maximum load per unit length of weld can only
be achieved for a certain weld shape for these alloys and thicknesses. Larger beam
diameters and different weld patterns could be used to increase even more the
bonding area and consequently, the weld strength. In PW mode it could also be
explored shorter pulse durations in order to provide higher peak power density to
push completely the IMCs out of the welding zone.
6.0 Conclusions
The SS-Al lap-joints were successful in CW mode but unsuccessful using a
PW laser.
The Al-SS lap-joints were successful using a PW laser, but unsuccessful in
CW mode.
For similar applied energy and number of weld lines, the maximum tensile
shear loads were higher in CW than in PW laser welding. However, for the
strongest weld, the UTS was five times higher in PW mode.

41
CW laser provides better higher fit-up tolerance and productivity. On the other
hand, lower heat affected zone, more precise control of the heat input and
high aspect ratio welds can be achieved in PW mode.
Further investigation using larger beam diameters and different weld patterns
is recommended to increase the bonding area and consequently, the weld
strength. In PW mode, different pulse durations could also be explored.
7.0 Declarations
Compliance with Ethical Standards 7.1
Funding 7.1.1
The researchers would like to acknowledge Innovate UK (TS/MO11089/1) for
sponsoring this investigation in the scope of the Environmental Domed End project.
Conflicts of interest/Competing interests 7.1.2
The authors have no relevant financial or non-financial interests to disclose.
Ethics approval 7.1.3
To the author’s knowledge, this is the first paper showing how the penetration and
weld width of stainless-steel resultant from the laser welding process is controlled by
the pulse power factor and interaction time. The authors confirm that this manuscript
has not been published elsewhere and is not under consideration by another journal.
The publication of this manuscript has also been approved by all the co-authors.

42
Consent to participate 7.2
Not applicable.
Consent for publication 7.3
The Author transfers to Springer (respective to owner if other than Springer and for
U.S. government employees: to the extent transferable) the non-exclusive
publication rights and he warrants that his contribution is original and that he has full
power to make this grant. The author accepts responsibility for releasing this material
on behalf of any and all co-authors. This transfer of publication rights covers the non-
exclusive right to reproduce and distribute the article, including reprints, translations,
photographic reproductions, microform, electronic form (offline, online) or any other
reproductions of similar nature. The author may self-archive an author-created
version of his article on his own website and his institution's repository, including his
final version; however, he may not use Springer's PDF version which is posted on
www.springerlink.com. Furthermore, the author may only post his version provided
acknowledgement is given to the Journal and Springer as one of the original places
of publication and a link is inserted to the published article on Springer's website.
Availability of data and material 7.4
Not applicable.
Code availability 7.5
Not applicable.

43
Authors' contributions 7.6
• Julio Coroado – PhD student. He has designed and produced the
experimental work in consultation with the other co-authors and is the principal
author of the manuscript.
• Supriyo Ganguly – Reader. He helped in creation of research methodology,
experimental work and provided the very essential research direction. Supriyo took
active participation in preparing the manuscript.
• Stewart Williams – Professor and chair of the welding engineering and laser
processing centre. He also participated actively in experimental design, data analysis
and interpretation.
• Wojciech Suder – Lecturer. As one of the laser experts, Wojciech provided
important knowledge on the design of the experimental work and manuscript
discussion.
• Sonia Meco – Senior Research Fellow. Sonia participated in the manuscript
checking and correction.
• Goncalo Pardal – Senior Research Fellow. Goncalo also took active
participation in data analysis, manuscript checking and correction.
Acknowledgement
The researchers would like to acknowledge Innovate UK (TS/MO11089/1) for
sponsoring this investigation in the scope of the Environmental Domed End project.

44
References
1. Zwicker MFR, Moghadam M, Zhang W, Nielsen CV (2020) Automotive battery
pack manufacturing – a review of battery to tab joining. J Adv Join Process
1:100017. https://doi.org/10.1016/j.jajp.2020.100017
2. Springer H, Kostka A, Payton EJ, et al (2011) On the formation and growth of
intermetallic phases during interdiffusion between low-carbon steel and
aluminum alloys. Acta Mater. https://doi.org/10.1016/j.actamat.2010.11.023
3. Song JL, Lin SB, Yang CL, et al (2009) Spreading behavior and microstructure
characteristics of dissimilar metals TIG welding-brazing of aluminum alloy to
stainless steel. Mater Sci Eng A. https://doi.org/10.1016/j.msea.2009.02.036
4. Borrisutthekul R, Yachi T, Miyashita Y, Mutoh Y (2007) Suppression of
intermetallic reaction layer formation by controlling heat flow in dissimilar
joining of steel and aluminum alloy. Mater Sci Eng A.
https://doi.org/10.1016/j.msea.2007.03.049
5. Shahverdi HR, Ghomashchi MR, Shabestari S, Hejazi J (2002) Microstructural
analysis of interfacial reaction between molten aluminium and solid iron. J
Mater Process Technol. https://doi.org/10.1016/S0924-0136(02)00225-X
6. Lee WB, Schmuecker M, Mercardo UA, et al (2006) Interfacial reaction in
steel-aluminum joints made by friction stir welding. Scr Mater.
https://doi.org/10.1016/j.scriptamat.2006.04.028
7. Soltan Ali Nezhad M, Haerian Ardakani A (2009) A study of joint quality of
aluminum and low carbon steel strips by warm rolling. Mater Des.

45
https://doi.org/10.1016/j.matdes.2008.06.042
8. W M Thomas, D J Staines, I M Norris SAW and CSW (2006) Transition Joints
Between Dissimilar Materials. TWI Ltd Granta Park Gt Abingt Cambridge CB1
6AL United Kingdom 1–7
9. Meco S, Ganguly S, Williams S, McPherson N (2014) Effect of Laser
Processing Parameters on the Formation of Intermetallic Compounds in Fe-Al
Dissimilar Welding. J Mater Eng Perform 23:3361–3370.
https://doi.org/10.1007/s11665-014-1106-5
10. Liu XB, Pang M, Zhang ZG, et al (2007) Characteristics of deep penetration
laser welding of dissimilar metal Ni-based cast superalloy K418 and alloy steel
42CrMo. Opt Lasers Eng. https://doi.org/10.1016/j.optlaseng.2007.03.004
11. Li Y, Liu Y, Yang J (2020) First principle calculations and mechanical
properties of the intermetallic compounds in a laser welded steel/aluminum
joint. Opt Laser Technol. https://doi.org/10.1016/j.optlastec.2019.105875
12. Palm M (1997) The Al-Cr-Fe system-Phases and phase equilibria in the Al-rich
corner. J Alloys Compd. https://doi.org/10.1016/S0925-8388(96)02719-3
13. Quazi MM, Ishak M, Fazal MA, et al (2020) Current research and development
status of dissimilar materials laser welding of titanium and its alloys. Opt Laser
Technol 126:106090. https://doi.org/10.1016/j.optlastec.2020.106090
14. Cao X, Wallace W, Immarigeon J-P, Poon C (2003) Research and Progress in
Laser Welding of Wrought Aluminum Alloys. II. Metallurgical Microstructures,
Defects, and Mechanical Properties. Mater Manuf Process 18:23–49.

46
https://doi.org/10.1081/AMP-120017587
15. Huang H, Yang L-M, Bai S, Liu J (2014) Femtosecond fiber laser welding of
dissimilar metals. Appl Opt. https://doi.org/10.1364/ao.53.006569
16. Yang J, Li YL, Zhang H (2016) Microstructure and mechanical properties of
pulsed laser welded Al/steel dissimilar joint. Trans Nonferrous Met Soc China
(English Ed. https://doi.org/10.1016/S1003-6326(16)64196-1
17. Pardal G, Meco S, Dunn A, et al (2017) Laser spot welding of laser textured
steel to aluminium. J Mater Process Technol 241:24–35.
https://doi.org/10.1016/j.jmatprotec.2016.10.025
18. Meco S, Pardal G, Ganguly S, et al (2013) Overlap conduction laser welding of
aluminium to steel. Int J Adv Manuf Technol 67:647–654.
https://doi.org/10.1007/s00170-012-4512-6
19. Meco S, Ganguly S, Williams S, McPherson N (2019) Design of laser welding
applied to T joints between steel and aluminium. J Mater Process Technol
268:132–139. https://doi.org/10.1016/j.jmatprotec.2019.01.003
20. Meco S, Cozzolino L, Ganguly S, et al (2017) Laser welding of steel to
aluminium : Thermal modelling and joint strength analysis. J Mater Process
Tech 247:121–133. https://doi.org/10.1016/j.jmatprotec.2017.04.002
21. Sierra G, Peyre P, Deschauxbeaume F, et al (2007) Steel to aluminium key-
hole laser welding. Mater Sci Eng A 447:197–208.
https://doi.org/10.1016/j.msea.2006.10.106
22. Torkamany MJ, Malek Ghaini F, Poursalehi R, Kaplan AFH (2016)
47
Combination of laser keyhole and conduction welding: Dissimilar laser welding
of niobium and Ti-6Al-4V. Opt Lasers Eng.
https://doi.org/10.1016/j.optlaseng.2015.11.001
23. Suder WJ, Williams SW (2012) Investigation of the effects of basic laser
material interaction parameters in laser welding. J Laser Appl 24:032009.
https://doi.org/10.2351/1.4728136
24. Coroado J, Meco S, Williams S, et al (2017) Fundamental understanding of the
interaction of continuous wave laser with aluminium.
https://doi.org/10.1007/s00170-017-0702-6
25. Banat D, Ganguly S, Meco S, Harrison P (2020) Application of high power
pulsed nanosecond fibre lasers in processing ultra-thin aluminium foils. Opt
Lasers Eng 129:. https://doi.org/10.1016/j.optlaseng.2020.106075
26. Williams S, Suder W (2011) Use of fundamental laser material interaction
parameters in laser welding. CLEO 2011 - Laser Sci to Photonic Appl 1–2
27. John A (2015) Dissimilar welding of stainless steel to aluminium thin sheet
using nano-second pulsed fibre laser. Dissertation, Cranfield University
28. Alsaidi M, Caballero A, Eze S, et al (2015) Study of laser metal interaction for
pulsed nanosecond fibre laser. Dissertation, Cranfield University
29. Coroado J, Ganguly S, Suder W, et al (2021) Selection of parameters in
nanosecond pulsed wave laser micro-welding. Int J Adv Manuf Technol.
https://doi.org/10.1007/s00170-021-07251-8
30. TRUMPF (2014) 100W G4 pulsed fibre laser specification interface manual.

48
TRUMPF Lasers UK Ltd, Southampton
31. Chmelickova H, Ctvrtlik R, Stranyanek M (2004) Pulsed laser welding of thin
metals. In: Proc. SPIE 5445, Microwave and Optical Technology. pp 356–359
32. aalco (2019) Aluminium Alloy 5251 - H22 Sheet and Plate properties.
http://www.aalco.co.uk/datasheets/Aluminium-Alloy-5251-H22-Sheet-and-
Plate_150.ashx. Accessed 1 Oct 2019
33. aalco (2019) Stainless Steel - Austenitic - 304L properties.
http://www.aalco.co.uk/datasheets/Stainless-Steel-14301-Sheet-and-Plate-
Quarto-Plate--CPP-Plate_343.ashx. Accessed 1 Oct 2019
34. Suder W (2011) Study of fundamental parameters in hybrid laser welding.
Dissertation, Cranfield University
35. Meco S (2016) Joining of steel to aluminium alloys for advanced structural
applications. Dissertation, Cranfield University
36. British Standard Institution (2001) BS EN ISO 14273:2001 Specimen
dimensions and procedure for shear testing resistance spot , seam and
embossed projection welds. London
37. Qiu R, Iwamoto C, Satonaka S (2009) Interfacial microstructure and strength
of steel/aluminum alloy joints welded by resistance spot welding with cover
plate. J Mater Process Technol 209:4186–4193.
https://doi.org/10.1016/j.jmatprotec.2008.11.003
38. Olsen FO (2009) Hybrid Laser Arc Welding. In: Hybrid Laser-Arc Welding, 1st
ed. CRC Press, pp 270–295
49
39. Lee SJ, Nakamura H, Kawahito Y, Katayama S (2014) Effect of welding speed
on microstructural and mechanical properties of laser lap weld joints in
dissimilar Al and Cu sheets. Sci Technol Weld Join 19:111–118.
https://doi.org/10.1179/1362171813Y.0000000168
40. Massalski T (1986) Binary Alloy Phase Diagrams, American S. Williams, Jr. W.
Scott, Metals Park, Ohio
41. Xiao R, Zhang X (2014) Problems and issues in laser beam welding of
aluminum-lithium alloys. J Manuf Process 16:166–175.
https://doi.org/10.1016/j.jmapro.2013.10.005
42. Indhu R, Divya S, Tak M, Soundarapandian S (2018) Microstructure
development in Pulsed Laser Welding of Dual Phase Steel to Aluminium Alloy.
In: Procedia Manufacturing