comparison of ambient aerosol extinction coefficients … · 2016-01-11 · 2604 p. zieger et al.:...
TRANSCRIPT

Atmos. Chem. Phys., 11, 2603–2624, 2011www.atmos-chem-phys.net/11/2603/2011/doi:10.5194/acp-11-2603-2011© Author(s) 2011. CC Attribution 3.0 License.
AtmosphericChemistry
and Physics
Comparison of ambient aerosol extinction coefficients obtained fromin-situ, MAX-DOAS and LIDAR measurements at Cabauw
P. Zieger1, E. Weingartner1, J. Henzing2, M. Moerman2, G. de Leeuw2,3,4, J. Mikkil a4, M. Ehn4, T. Petaja4,K. Cl emer5, M. van Roozendael5, S. Yilmaz6, U. Frieß6, H. Irie 7, T. Wagner8, R. Shaiganfar8, S. Beirle8,A. Apituley 9,10, K. Wilson9,10, and U. Baltensperger1
1Paul Scherrer Institut, Laboratory of Atmospheric Chemistry, 5232 Villigen, Switzerland2Netherlands Organization for Applied Scientific Research TNO, Princetonlaan 6, 3508 Utrecht, The Netherlands3Finnish Meteorological Institute, Climate Change Unit, Erik Palmenin Aukio 1, 00101 Helsinki, Finland4University of Helsinki, Department of Physics, Gustaf Hallstromin katu 2, 00014 Helsinki, Finland5Belgium Institute for Space Aeronomy, Ringlaan 3, 1180 Brussels, Belgium6University of Heidelberg, Institute of Environmental Physics, Im Neuenheimer Feld 229, 69120 Heidelberg, Germany7Japan Agency for Marine-Earth Science and Technology, Research Institute for Global Change, Yokohama, Japan8Max-Planck-Institute for Chemistry, Joh.-Joachim-Becher-Weg 27, 5512 Mainz, Germany9National Institute for Public Health and the Environment RIVM, 3721 Bilthoven, The Netherlands10Royal Netherlands Meteorological Institute KNMI, 3730 AE De Bilt, The Netherlands
Received: 1 November 2010 – Published in Atmos. Chem. Phys. Discuss.: 6 December 2010Revised: 14 February 2011 – Accepted: 11 March 2011 – Published: 18 March 2011
Abstract. In the field, aerosol in-situ measurements are oftenperformed under dry conditions (relative humidity RH<30–40%). Since ambient aerosol particles experience hygro-scopic growth at enhanced RH, their microphysical and op-tical properties – especially the aerosol light scattering –are also strongly dependent on RH. The knowledge of thisRH effect is of crucial importance for climate forcing cal-culations or for the comparison of remote sensing with in-situ measurements. Here, we will present results from afour-month campaign which took place in summer 2009 inCabauw, The Netherlands. The aerosol scattering coefficientσsp(λ) was measured dry and at various, predefined RH con-ditions between 20 and 95% with a humidified nephelome-ter. The scattering enhancement factorf (RH,λ) is the keyparameter to describe the effect of RH onσsp(λ) and is de-fined asσsp(RH,λ) measured at a certain RH divided by thedry σsp(dry,λ). The measurement off (RH,λ) together withthe dry absorption measurement (assumed not to change withRH) allows the determination of the actual extinction coeffi-cientσep(RH,λ) at ambient RH. In addition, a wide range ofother aerosol properties were measured in parallel. The mea-surements were used to characterize the effects of RH on the
Correspondence to:E. Weingartner([email protected])
aerosol optical properties. A closure study showed the con-sistency of the aerosol in-situ measurements. Due to the largevariability of air mass origin (and thus aerosol composition)a simple parameterization off (RH,λ) could not be estab-lished. Iff (RH,λ) needs to be predicted, the chemical com-position and size distribution need to be known. Measure-ments of four MAX-DOAS (multi-axis differential opticalabsorption spectroscopy) instruments were used to retrievevertical profiles ofσep(λ). The values of the lowest layerwere compared to the in-situ values after conversion of thelatter ones to ambient RH. The comparison showed a goodcorrelation ofR2 = 0.62–0.78, but the extinction coefficientsfrom MAX-DOAS were a factor of 1.5–3.4 larger than the in-situ values. Best agreement is achieved for a few cases char-acterized by low aerosol optical depths and low planetaryboundary layer heights. Differences were shown to be de-pendent on the applied MAX-DOAS retrieval algorithm. Thecomparison of the in-situ extinction data to a Raman LIDAR(light detection and ranging) showed a good correlation andhigher values measured by the LIDAR (R2
= 0.82− 0.85,slope of 1.69–1.76) if the Raman retrieved profile was usedto extrapolate the directly measured extinction coefficient tothe ground. The comparison improved if only nighttime mea-surements were used in the comparison (R2
= 0.96, slope of1.12).
Published by Copernicus Publications on behalf of the European Geosciences Union.
2604 P. Zieger et al.: Aerosol extinction coefficients at ambient conditions
1 Introduction
Atmospheric aerosol particles change in size due to wateruptake which is determined by their chemical compositionand the ambient relative humidity (RH). As a result theiroptical properties – especially the aerosol light scattering –also strongly depend on RH. Therefore, long-term measure-ments of aerosol physical and optical properties are generallyrecommended at dry conditions in order to keep measure-ments comparable (e.g. RH< 30–40% as recommended byWMO/GAW, 2003). However, for the comparison of suchground-based measurements with other optical aerosol mea-surements (e.g. LIDAR, MAX-DOAS or satellite retrieval),for the purpose of aerosol correction of satellite retrievals, orfor the use in climate models, accurate knowledge of the RHeffect is very important.
The size and the solubility of a particle determine the re-sponse of an ambient particle to changes in RH. The watervapor pressure above a water droplet containing dissolvedmaterial is lowered by the Raoult effect. The equilibrium sizeof a droplet was first described byKohler (1936), who con-sidered the Kelvin (curvature) and Raoult (solute) effect. Thegrowth of an aerosol particle due to water uptake is describedby the hygroscopic growth factorg(RH) which is defined asthe particle diameterDwet at a certain RH divided by its drydiameterDdry:
g(RH) =Dwet(RH)
Ddry. (1)
The RH dependence ofg(RH) can be parameterized ina good approximation by a one-parameter equation, pro-posed e.g. byPetters and Kreidenweis(2007):
g(aw) =
(1+κ
aw
1−aw
) 13
. (2)
Here,aw is the water activity, which can be replaced by therelative humidity RH, if the Kelvin effect is negligible, as forparticles with sizes more relevant for light scattering and ab-sorption, i.e. withDwet> 100 nm. The coefficientκ is a sim-ple measure of the particle’s hygroscopicity and captures allsolute properties (Raoult effect). The impact of hygroscopicgrowth on the aerosol light scattering coefficient is usuallydescribed by the scattering enhancement factorf (RH,λ):
f (RH,λ)=σsp(RH,λ)
σsp(dry,λ), (3)
where the scattering coefficientσsp depends on the wave-lengthλ and the relative humidity RH. In the following wewill discuss the characteristics of the scattering enhance-ment factor forλ = 550 nm. Since no clear wavelength de-pendency was found during our measurement period (in therange of 450–700 nm), we will omitλ for simplicity and referto the scattering enhancement factor asf (RH).
Measured and modeled enhancement factors have been de-scribed in several previous studies, including studies on ur-ban (Yan et al., 2009; Fitzgerald et al., 1982), continental(Sheridan et al., 2001), biomass burning (Kotchenruther andHobbs, 1998), maritime (Fierz-Schmidhauser et al., 2010b;Wang et al., 2007; Carrico et al., 2003), free tropospheric(Fierz-Schmidhauser et al., 2010a; Nessler et al., 2005a) orArctic aerosol (Zieger et al., 2010).
The comparison of remote sensing measurements to in-situ values of the aerosol extinction coefficient for validationpurposes has been performed in several studies. Lidar mea-surements have been compared to nephelometer measure-ments, but almost always with dry nephelometer data usingmodel assumptions or literature values off (RH) (Ferrare etal., 1998; Voss et al., 2001) and only rarely using a humidi-fied nephelometer (Morgan et al., 2010). The MAX-DOAStechnique for aerosol retrieval is novel and only few compar-isons have been made with in-situ data. The first compari-son of the extinction coefficient (measured at Ghuangzhou,China) with a single MAX-DOAS instrument (similar re-trieval as for the instrument by the Max-Planck-Institute forChemistry (MPI), see below) to nephelometer data was madeby Li et al. (2010) using a single parameterization from adifferent station (60 km further away) to calculate the ambi-ent aerosol extinction coefficients from the dry nephelometerdata. In addition, they only used ground based RH measure-ments and differences between indoor and ambient RH andtemperature conditions were not accounted for.
In this study, the RH dependency of the aerosol extinc-tion coefficient was examined using direct measurements ofaerosol optical properties as a function of RH taken duringa four months’ campaign at Cabauw, The Netherlands. Thedata were compared in an optical closure study with Mie-calculations, which relied on the aerosol number size distri-bution corrected to a specific RH using hygroscopicity mea-surements. As a proof of concept, the in-situ measurementsof the aerosol extinction coefficient were compared to re-mote sensing data from MAX-DOAS and LIDAR measure-ments. The vertical profiles of the aerosol extinction coef-ficient obtained from MAX-DOAS and their comparison toLIDAR measurements are discussed in an upcoming publi-cation (Frieß et al., 2011).
2 The Cabauw site and the CINDI campaign
A field campaign was carried out from 8 June to 6 Oc-tober 2009 at the Cabauw Experimental Site for Atmo-spheric Research (CESAR, located at 51.97◦ N, 4.93◦ E) inThe Netherlands. The site is located approximately 33 kmnorth-east of the city of Rotterdam and 30 km south-westof Utrecht. CESAR is a facility dedicated to the obser-vation and characterization of the state of the atmosphere,its radiative properties and interaction with land surface,for the study of physical processes, climate monitoring and
Atmos. Chem. Phys., 11, 2603–2624, 2011 www.atmos-chem-phys.net/11/2603/2011/

P. Zieger et al.: Aerosol extinction coefficients at ambient conditions 2605
validation studies (Russchenberg et al., 2005). A large set ofcontinuous in-situ and remote sensing equipment is installedat the site. A 213 m high mast equipped with variousmeteorological sensors (like temperature, dew point, winddirection, wind speed, etc.) is the main feature of the CESARsite. The continuous aerosol measurements are contribut-ing to the EUSAAR (European Supersites for AtmosphericAerosol Research) project (Philippin et al., 2009) with asso-ciated quality control, site audits, and reporting.
During 16 June and 24 July 2009 our measurements werepart of the CINDI campaign (Cabauw Intercomparison Cam-paign of Nitrogen Dioxide measuring Instruments) wherethe main goal was to compare different remote sensing andin-situ techniques measuring NO2. Besides NO2, other at-mospheric gases and aerosols were measured and intercom-pared. For more details seeRoscoe et al.(2010) andPiters etal. (2010).
3 Experimental
Various physical aerosol properties have been measured dur-ing the four-month period. The following section describesthe main experimental techniques used in this work. Inthe first part (Sect.3.1) the main in-situ instruments usedto characterize the effects of RH on the aerosol extinc-tion coefficient will be described. The results of the in-situ measurements are later compared to two different atmo-spheric profiling techniques: First to MAX-DOAS measure-ments (Sect.3.2) and in a next step to LIDAR measurements(Sect.3.3). This comparison is carried out only for the lowestground layer.
3.1 In-situ measurements
3.1.1 Inlet system
Air is sampled at a height of 60 m at the Cabauw tower. Theinlet system consists of four parts: (a) PM10 size selectiveinlets (4 PM10 heads), (b) a Nafion drying system that driesaerosol to or below 40% RH, (c) a 60-m stainless steel pipe,and (d) a manifold that splits the flow to the suite of instru-ments. The manifold and the in-situ instruments are all lo-cated at the basement of the tower. The in-situ measurementsused in this paper are those from the nephelometer, the multi-angle absorption photometer (MAAP), the aethalometer, thescanning mobility particle sizer (SMPS) and aerodynamicparticle sizer (APS), all of which are described below. Theseinstruments sampled their flow from the manifold using sep-arate pumps to adjust the required flow for proper operationof the instruments.
The total flow sustained in the 60-m inlet pipe was 60 lpm,for optimal operation of the PM10 inlets. Whenever an in-strument was added or removed, the flows to the other instru-ments were checked and adjusted when needed. Although at-tempts have been made to characterize the losses, they were
not conclusive in an experimental sense. In general the lossesin similar inlet pipes can be calculated by theory (e.g.,Bir-mili et al., 2007). Losses through diffusion (for smaller par-ticles with D<0.1 µm) and sedimentation (for larger parti-cles withD>2 µm) are expected to be below 10–20 %. Sincethe main contribution to the extinction in the visible neph-elometer wavelength will be in the size range between 0.1and 1 µm, the effect of particle losses on the dry extinctioncoefficient is assumed to be smaller than 10–20%. Addi-tional losses are expected due to the use of a Nafion dryerbut there is no quantitative information for the specific dryerused in Cabauw.
3.1.2 Humidified and dry nephelometer
A recently developed humidified nephelometer (WetNeph)was installed for four months next to the continuously run-ning aerosol in-situ instruments. The WetNeph is describedin detail byFierz-Schmidhauser et al.(2010c). Briefly, theaerosol scattering coefficientσsp(λ) and the back scatter-ing coefficientσbsp(λ) are measured at three wavelengths(λ = 450, 550, and 700 nm) at defined RH between 20% and95%. For this purpose a specifically designed single-streamhumidification system (consisting of a humidifier followedby a dryer) brings the initially dry aerosol (the aerosol is al-ready dried at the main inlet) to a defined RH before its scat-tering properties are measured by an integrating nephelome-ter (TSI Inc., Model 3563).
The WetNeph was programmed to measure RH cycles. Inthe first part of the cycle, the dry particles experience el-evated RH in the humidifier, after which they are passedthrough the turned off dryer before their scattering proper-ties are measured in the nephelometer (hydration mode). Itis noted that the temperature in the nephelometer’s detectioncell is ∼1◦C higher than in the humidifier, thereby causinga slight RH decrease of approximately 2–6% (see Fig. A1in Fierz-Schmidhauser et al., 2010c) and with that a concur-rent shift of the observed deliquescence RH. Deliquescenceis described as a sudden uptake of water of an initially dryand solid particle at the defined deliquescence relative hu-midity. Inorganic salts (for instance ammonium sulfate orsodium chloride) exhibit a distinct deliquescence. Organicconstituents of mixed atmospheric aerosols can suppress thedeliquescence of inorganic salts (Sjogren et al., 2007). Thebehavior of dehydrating particles following the upper hys-teresis branch of the growth curve is measured by setting thehumidifier to its maximum RH (∼95%), followed by RH re-duction in the dryer and measurement in the nephelometer(dehydration mode). The lowest possible RH in this modewas∼55%, limited by the capacity of the dryer at the highsample flow of 10 l min−1 chosen for this campaign. The RHinside the nephelometer cell is monitored by a HygroClip(Rotronic), which was calibrated before and after the cam-paign with standard salt solutions, and in addition by a dewpoint mirror (Edge Tech, Model 2000, Dewprime DF). More
www.atmos-chem-phys.net/11/2603/2011/ Atmos. Chem. Phys., 11, 2603–2624, 2011

2606 P. Zieger et al.: Aerosol extinction coefficients at ambient conditions
technical details can be found inFierz-Schmidhauser et al.(2010c).
A second nephelometer (DryNeph, TSI Inc., Model 3563,operated by TNO) was used in parallel to measure the scat-tering coefficient under dry conditions as a reference. TheRH inside the DryNeph was always below 30% (campaignmean RH= 17.7%).
Both nephelometers measured within the scattering anglesof 7◦ to 170◦. The scattering coefficients for the completeangle between 0◦ and 180◦ were retrieved by correcting themeasured values using the scheme proposed byAnderson etal. (1996) (truncation error correction) which also accountsfor non-idealities of the light source in the nephelometer.
Both nephelometers were calibrated (with particle-freeair and CO2) and compared directly (WetNeph without hu-midifier system). In addition, the scattering coefficientsat dry conditions (RHWetNeph<40%) were compared forthe entire campaign. From these measurements it wasfound that the WetNeph scattering coefficients at dry con-ditions were slightly higher than the ones of the DryNeph(for 450nm: σWetNeph= 1.07σDryNeph+ 8.7 × 10⁻⁷m−1,R2 = 0.99; for 550nm: σWetNeph= 1.06σDryNeph+ 6.7 ×
10−7m−1, R2 = 0.97; for 700nm:σWetNeph= 1.03σDryNeph+
4.5×10⁻⁷m−1, R2 = 0.94), which was caused by differencesin the absolute calibration of the nephelometer (WetNephnephelometer measured higher scattering coefficients) andlosses in the humidifier (∼ 5%, seeFierz-Schmidhauser etal. 2010c). The WetNeph measurements were therefore cor-rected accordingly.
3.1.3 Measurement of the aerosol absorption coefficient
A multi-angle absorption photometer (MAAP) and anaethalometer were used to quantify the aerosol absorptionproperties.
The MAAP (Thermo Scientific Inc., Model 5012, oper-ated by TNO) measures the light attenuation and light scat-tered back from aerosol particles which are deposited on afilter. The measurement is performed atλ = 637 nm (whichdiffers from the manufacturer’s value of 670 nm,Muller etal., 2010). A radiative transfer scheme is applied to retrievethe fraction of light absorbed by the deposited aerosol (Pet-zold and Schonlinner, 2004). The aerosol absorption coeffi-cientσap is obtained by multiplying the measured black car-bon (BC) mass concentration with the instrumental set valueof the mass absorption cross section of 6.6 m2 g−1.
In addition, an aethalometer (Magee Scientific, Model AE-31, operated by RIVM) was used which measures the lightattenuation by the aerosol particles (also deposited on a fil-ter) at 7 wavelengths (λ = 370, 470, 520, 590, 660, 880, and950 nm). The aerosol absorption coefficientσap(λ) is thenderived from the light attenuation:
σap(λ) =A
Q
4ATN(λ)
4t
1
C ·R(ATN(λ)), (4)
whereA is the filter spot area,Q the volumetric flow, and4ATN(λ) the change of light attenuation during the time in-terval4t (Weingartner et al., 2003). The empirical constantC corrects for multiple scattering in the unloaded filter. Here,a value ofC = 4.09 was used (Collaud Coen et al., 2010).The wavelength and ATN dependent factorR corrects for ef-fects caused by the amount of particles deposited on the filter,which decrease the optical path in the filter (also called theshadowing effect).R was set to unity as the single scatteringalbedoω0 (defined as the ratio of scattering to extinction co-efficient) is larger than 0.8 most of the time (Weingartner etal., 2003).
Since the aethalometer measures at various wavelengths,the absorptionAngstrom exponentαap can be derived:
σap(λ) = ελ−αap, (5)
whereλ is the wavelength of the aethalometer andε a con-centration dependent constant.
Using the measuredαap of the aethalometer and the mea-sured value ofσap(637 nm) from the MAAP, the absorptioncoefficient for a different wavelengthλ was calculated as fol-lows:
σap(λ) = σap(637 nm)
(λ
637 nm
)−αap
. (6)
3.1.4 Measurement of the aerosol size distribution
A scanning mobility particle sizer (SMPS) and an aerody-namic particle sizer (APS) were used to measure the aerosolsize distribution for dry diameters between approximately10 nm and 5 µm (both operated by TNO).
The SMPS (a modified TSI Inc., Model 3034) consistsof a bipolar particle charger, a differential mobility analyzer(DMA) and a condensation particle counter (CPC). Particlesare charged before they are classified in the DMA accord-ing to their electrical mobility diameter and are counted bythe CPC. A correction for multiple charged particles was ap-plied. Number size distributions in the diameter range be-tween approximately 10 and 520 nm were recorded with atime resolution of 5 min.
The APS (TSI Inc., Model 3321) measures the particlesize distribution between aerodynamic diameters of approxi-mately 0.5 and 20 µm. However, in Cabauw, particles largerthan approximately 5 µm are not sampled through the inletsystem due to the PM10 size cut at the inlet and the dryingthereafter, which results in a reduction in size. One distribu-tion is recorded each minute.
The overlap between the SMPS and APS showed to begood for most of the cases. Small differences seen in the tran-sition of the volume size distribution were caused by varia-tions in density and shape influencing the APS sizing. How-ever, they were found to be negligible for our purposes, sincethe scattering coefficient is dominated by contributions fromthe fine mode (Dp<500 nm, measured by the SMPS). The
Atmos. Chem. Phys., 11, 2603–2624, 2011 www.atmos-chem-phys.net/11/2603/2011/

P. Zieger et al.: Aerosol extinction coefficients at ambient conditions 2607
measured volume size distributions could be well fitted us-ing a three modal lognormal size distribution equation.
3.1.5 Measurement of the hygroscopic growth factor
Hygroscopic particles are able to grow in size by absorbingwater vapor even at sub-saturated conditions. A simple wayto describe the hygroscopicity of a particle is via the diam-eter growth factorg(RH) as defined in Eq. (1). This prop-erty can be measured directly with a hygroscopicity tandemdifferential mobility analyzer (H-TDMA,Liu et al., 1978).The aerosol sample is first dried in the H-TDMA, and thencharged with a bipolar charger. Subsequently a dry size classof particles,Ddry, is selected using a DMA (Winklmayr etal., 1991). At Cabauw, the H-TDMA of the University ofHelsinki (modified version of the instrument presented byEhn et al., 2007) was set up to measureDdry of 35, 50, 75,110, and 165 nm. Then the monodisperse particles are ex-posed to controlled relative humidity (90%) and temperature.The wet aerosol goes through the second DMA, which scansa size range covering possible growths factors from 0.7 to2.5. A corresponding concentration for each size fractionis monitored with a CPC. A humidified size distribution fora certainDdry is then obtained. The growth factors in thisstudy were determined within±0.05, which is typical for awell-maintained TDMA system (Swietlicki et al., 2008).
In a complex location such as Cabauw, with several dif-ferent aerosol sources, the particles are typically externallymixed. This is reflected in the hygroscopic growth factorspectrum by a widened distribution, or even by clearly sepa-rated growth modes, for a given particle size. The piecewiselinear method of the TDMAinv Toolkit (Gysel et al., 2009)was used to retrieve the growth factor distributions. Althoughmany different sources can contribute to the aerosol popu-lation, typically one of the sources dominated. Therefore,simply using the average growth factor for each distributionis sufficient to describe the temporal variation of the growthof the accumulation mode particles at 90% RH. In this workonly the data at the largest dry size, 165 nm, was utilizedas the larger particles contribute to the optical properties themost (Sundstrom et al., 2009).
3.2 MAX-DOAS measurements
Multi-axis differential optical absorption spectroscopy(MAX-DOAS) is a technique to derive profiles of atmo-spheric gases and aerosols using spectral radiation mea-surements under different (mostly slant) elevation angles(Honninger and Platt, 2002; Leser et al., 2003; Van Roozen-dael et al., 2003; Wittrock et al., 2004; Honninger et al.,2004; Wagner et al., 2004; Sinreich et al., 2005; Heckel etal., 2005; Frieß et al., 2006; Irie et al., 2008).
For the retrieval of aerosol extinction profiles, usuallythe atmospheric absorption of the oxygen collision-induceddimer (O2-O2 or O4) is analyzed. Since the atmospheric O2
concentration is almost constant, changes in the observed ab-sorption can be attributed to changes in the atmospheric ra-diative transfer, e.g. caused by the influence of aerosol scat-tering and absorption (Wagner et al., 2004; Frieß et al., 2006).By comparison with a forward model which describes the ef-fects of aerosols on the MAX-DOAS measurements, aerosolproperties can be inverted from the measured O4 absorption.Usually MAX-DOAS aerosol retrieval consists of two steps:first, the O4 optical depth is retrieved from the measuredspectra using the DOAS technique (Platt and Stutz, 2008). Ina second step, the aerosol properties are inverted by compar-ing the measured O4 optical depths to those simulated by aradiative transfer model. As was shown byFrieß et al.(2006)andClemer et al.(2010), dependent on the wavelength andatmospheric visibility, typically 1–3 independent pieces ofinformation on the aerosol extinction profile can be obtainedfrom MAX-DOAS O4 observations. It is noted that usuallyfor some of the aerosol optical properties (e.g. the single scat-tering albedo or the asymmetry parameter) either fixed valuesare assumed or information from independent measurements(e.g. sun photometers or in-situ measurements) is used.
In this study MAX-DOAS aerosol retrievals from fourgroups are included: the Belgium Institute for Space Aeron-omy (BIRA), the Institute for Environmental Physics ofthe University of Heidelberg (IUPHD), the Japan Agencyfor Marine-Earth Science and Technology, Research Insti-tute for Global Change (JAMSTEC), and the Max-Planck-Institute for Chemistry (MPI). All groups use similar re-trieval schemes for the spectral analysis of the O4 absorp-tion (first step); further details of the spectral analysis canbe found inRoscoe et al.(2010). For the inversion of theaerosol properties by comparison with radiative transfer sim-ulations (second step) two different approaches are used.BIRA, IUPHD, and JAMSTEC apply the optimal estima-tion method (Rodgers, 2000), which yields height-resolvedprofiles of the aerosol extinction coefficient. MPI uses amore simplified approach following the technique ofLi etal. (2010): the aerosol extinction profile is described byonly two parameters (the total aerosol optical depth and theaerosol layer height) which are determined by fitting themeasured O4 optical depths to the radiative transfer simu-lations using a least squares method (the aerosol extinction isassumed to be constant within the aerosol layer).
The properties of the different MAX-DOAS measure-ments and the specific settings of the aerosol inversionschemes are summarized in Table1. Note that most groupsanalyze the O4 absorption band at 477 nm which is close tothe wavelengths of the in-situ aerosol measurements. Be-cause of the limited spectral range of the instrument, MPIuses the O4 band at 360 nm. It should also be noted thatsome uncertainty with respect to the absolute value of the O4absorption cross section exists (Wagner et al., 2009; Clemeret al., 2010), and all groups apply a correction factor to theretrieved O4 absorption ranging between 0.75 and 0.83, seeTable1. Additional information on the individual retrievals
www.atmos-chem-phys.net/11/2603/2011/ Atmos. Chem. Phys., 11, 2603–2624, 2011

2608 P. Zieger et al.: Aerosol extinction coefficients at ambient conditions
Table 1. Overview of the main MAX-DOAS technical and inversion properties.
BIRAa IUPHDb JAMSTECc MPId
Wavelength 400–700 nm 290–790 nm 223–558 nm 310–461 nmSpectral resolution 0.95 nm 0.5–0.6 nm 0.7 nm 0.5–0.9 nm(FWHM)Field of view 0.8◦ 0.9◦ <1◦ 1.2◦
O4 bands used 477 nm 477 nme 477 nmf 360 nmScaling factor 0.75 0.8 0.8 0.83Elevation angles (◦) 1, 2, 4, 5, 8, 10, 15, 30, 90 2, 4, 8, 15, 30, 90 2, 4, 8, 15, 30, 90g 2, 4, 6, 8, 10, 15, 30, 90Inversion scheme Optimal estimation Optimal estimation Optimal estimation Least squaresTime resolution 15 min 15 min 30 min 10 min
1 elevation sequence 2–3 elevation sequences 1 elevation sequence 1 elevation sequenceRadiative transfer model LIDORT v3.3h SCIATRANi MCARaTSj McARTimk
Aerosol optical properties AERONETl , in-situ OPACm ω0: 0.95, AP: 0.65n ω0: 0.95, AP: 0.68Time period used 19.6.–21.7. 23.6.–26.9. 19.6.–24.7. 22.6.–14.7.Vertical discretization 200 m 200 m 1 km 20–5000 m
a Clemer et al.(2010); b Frieß et al.(2006); c Irie et al. (2008, 2009); d Li et al. (2010); Wagner et al.(2011); e σep is retrieved at 450 nm due to specifications of the radiative
transfer model and the employed OPAC database (Hess et al., 1998); f The retrievedσep is for 476 nm, which is the O4 cross-section-weighted mean wavelength over the fitting
window used.g from 08.06.–21.06. 3◦ was used instead of 2◦; h Spurr(2008); i Rozanov et al.(2001); j Iwabuchi(2006); k Deutschmann and Wagner(2008); l Holben et al.(1998); m Calculated for an assumed mixture of water soluble and soot particles with a number mixing ratio of 0.46 and 0.54, respectively (Hess et al., 1998); n ω0: single scatteringalbedo, AP: asymmetry parameter;
can be found in a comparison exercise of the spectral anal-yses during the CINDI campaign (Roscoe et al., 2010) andin a MAX-DOAS aerosol comparison paper byFrieß et al.(2011).
3.3 Lidar measurements
The LIDAR CAELI (CESAR Water Vapour, Aerosol andCloud Lidar; Apituley et al., 2009) is a high-performance,multi-wavelength Raman LIDAR, capable of providinground-the-clock measurements. The instrument is part of theEuropean Aerosol Research Lidar Network (EARLINET),and provides profiles of volume backscatter and extinctioncoefficients of aerosol particles, the depolarization ratio, andwater-vapor-to-dry-air mixing ratio. A high-power Nd:YAGlaser transmits pulses at 355, 532, and 1064 nm. Because alarge telescope is essentially blind for LIDAR signals fromclose to the instrument, a second, small telescope is neededto cover the near range, in particular for measurements inthe planetary boundary layer. The LIDAR echoes at the elas-tic and Raman scattered wavelengths are relayed to the photodetectors through optical fibers. The LIDAR returned signalsstrongly depend on the rangeh and decrease withh2. Mul-tiplication with h2 thus removes the range dependence. Inthis way, the range-corrected signals for the vertically point-ing ground-based LIDAR are obtained. Range-corrected sig-nals at 1064 nm are dominated by particle backscatter andare therefore well-suited to display aerosol layering struc-ture and dynamics and to detect the presence of clouds (seee.g. Fig.7a).
Raman LIDAR instruments can retrieve aerosol extinctionprofiles using a single LIDAR signal at a nitrogen Ramanscattered wavelength (here: 387 nm), with just the help of anatmospheric density profile (e.g. a radio sonde or an atmo-spheric model) (Ansmann et al., 1992). However, two ma-jor problems occur when extinction needs to be calculated atdaytime and close to the ground:
1. Raman signals are relatively weak and often dominatedby the daylight background, and
2. the geometry of the LIDAR instrument, the so-calledoverlap-function, dictates a minimum distance beyondwhich unbiased extinction values can be derived.
For CAELI, the Raman signals at 387 nm are strong enoughfor daytime performance up to a few km altitude, however,trustworthy extinction profiles start between 500 and 1000 mabove ground.
To work around the overlap problem for this study, extinc-tion profiles were calculated via the Raman aerosol backscat-ter profiles down to about 60 m above ground. This wasachieved by calculating the Raman aerosol backscatter pro-file from the ratio of the N2 Raman signal and the elastic(normal) LIDAR signal (Ansmann et al., 1992). Becauseboth of these signals are affected in the same way by theoverlap function, for a well-aligned LIDAR system, it doesnot affect their ratio. For CAELI, correct alignment could beverified using methods described byFreudenthaler(2008).
Atmos. Chem. Phys., 11, 2603–2624, 2011 www.atmos-chem-phys.net/11/2603/2011/

P. Zieger et al.: Aerosol extinction coefficients at ambient conditions 2609
For a given measurement, the Raman backscatter (β) andextinction (σep) profiles are calculated. From these profilesthe LIDAR ratio LR is determined:
LR(h) =σep(h)
β(h)(7)
whereh denotes the height above the ground.The LIDAR ratio is only valid beyond the minimum over-
lap height where bothσep andβ are valid. However, it can beargued that within well-mixed states of the boundary layer,LR should be fairly constant, since it is representative fora particular type of aerosol and only RH can be a signifi-cant factor determining the LR (Salemink et al., 1984; Ack-ermann, 1998). So by assuming an effective LR, LR′, thebackscatter profile at lower altitudes can be converted to anextinction profile using LR′ as a conversion factor in Eq. (7).By varying LR′ over a range of values and comparing to in-situ measurements, it can be determined whether the valuesobtained in this way are consistent.
4 Results
The results of the in-situ measurements are presented in thefirst Sects.4.1 to 4.3. First, the results of the WetNeph anal-ysis and the factors influencingf (RH) at Cabauw are dis-cussed in Sects.4.1and4.2. A closure study using differentaerosol in-situ measurements is shown in Sect.4.3. The pre-diction off (RH) without explicit WetNeph measurements atCabauw is also discussed in Sect.4.3. The ambient aerosolextinction coefficient is compared to MAX-DOAS and LI-DAR measurements in Sect.4.4.
4.1 WetNeph analysis
During the four-month campaign the WetNeph and DryNephwere running continuously without any major interruptions(except for a 70-h break at the end of August). The WetNephwas set up to measure humidograms for most of the time, ex-cept for two 7- and 11-day long periods in July and August,where the relative humidity was set on a constant value ofapproximately 82–85%. This was done to further investigatediurnal cycles. Due to the large variation of air masses, no ex-plicit diurnal cycles were found. The humidograms were pa-rameterized with an empirical equation, which has been usedin previous studies (Clarke et al., 2002; Carrico et al., 2003)and has been found to best describe the individual branches(hydration, dehydration separately):
f (RH) = a(1−RH)−γ , (8)
wherea andγ are two independent curve fit parameters (a
is the intercept at RH= 0% andγ parameterizes the magni-tude of the scattering enhancement). The humidograms wereaveraged (3-h mean values for 2% wide RH-bins) and fittedwith Eq. (8) for RH>70%. No differences were found at
these high RH values between the hydration and dehydrationbranch). During the periods when the WetNeph was operatedin a constant RH mode Eq. (8) was used with a campaignmean value fora = 0.7 (upper branch only).
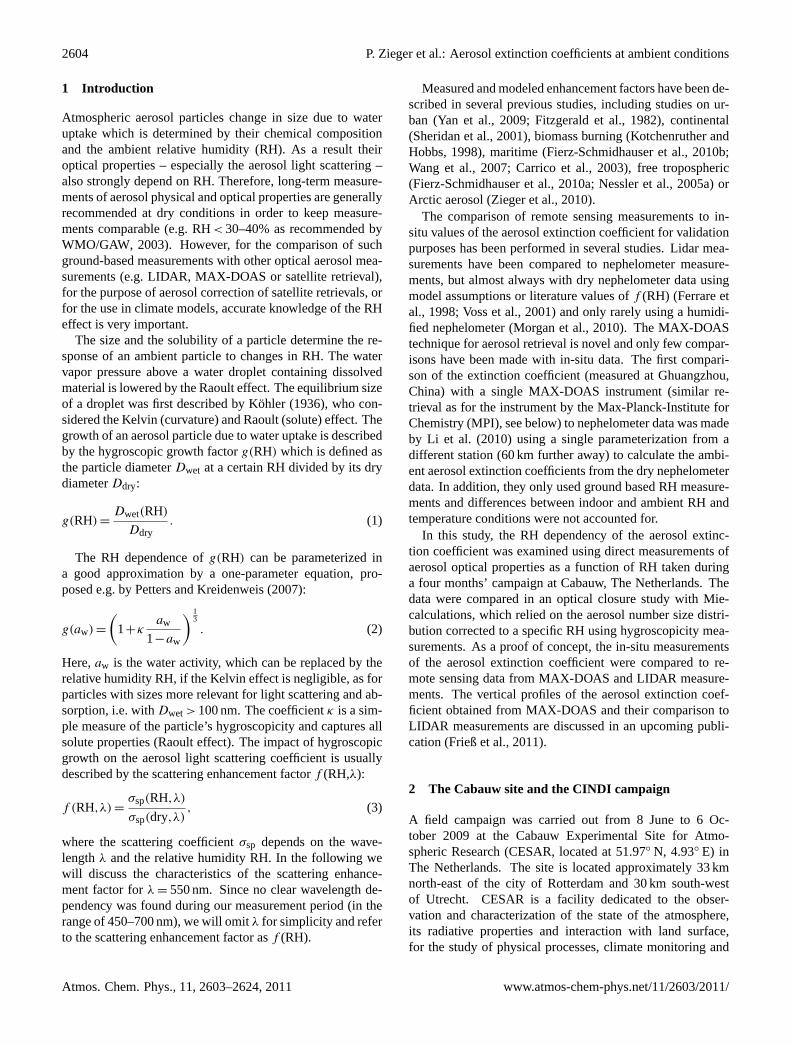
Figure 1a shows the temporal evolution off (RH) forRH = 85% for the entire campaign period. The values var-ied between mid June and the beginning of October be-tween approximately 1.3 and 3.9 (10th percentile = 1.93, 90thpercentile = 2.9). The corresponding measured dry and wet(at RH = 85%) scattering coefficients (at 550 nm) and dryabsorption coefficients (at 637 nm) are shown in Fig.1b.The main contribution to the ambient extinction coefficient(= scattering plus absorption coefficient) is the scattering co-efficient, since the absorption coefficient is about an order ofmagnitude lower than the scattering coefficient.
The distinct periods of lowered and elevatedf (RH) values(see Fig.1a) were correlated with the origin of the air massesas revealed from 48-h air-mass back trajectories which werecalculated using the FLEXTRA trajectory model (Stohl etal., 1995; Stohl and Seibert, 1998) and ECMWF (EuropeanCentre for Medium Range Weather Forecasts) meteorolog-ical data (trajectories are provided by NILU atwww.nilu.no/trajectories). The result is shown in Fig.2a where theback trajectories are color coded by thef (RH = 85%) mea-sured at Cabauw. In general, thef (RH = 85%) is lower inair masses originating from the continent and urban regions(like Rotterdam or Ruhr area), probably reflecting the pres-ence of aerosol particles with lower hygroscopicity resultingfrom anthropogenic emissions and lower sea salt content. Airmasses that were transported over the North Atlantic Oceanor the North Sea prior to their arrival in Cabauw likely con-tain more sea-salt leading to higher hygroscopic growth andtherefore to higher values off (RH = 85%). Mixtures of bothextremes are frequently observed, for example air parcelsthat have their origin over the Atlantic Ocean and are passingover heavy industrialized areas (like the Rotterdam area orsouthern Great Britain) where the addition of anthropogenicpollution leads to lower hygroscopicity.
Examples of typical humidograms measured at Cabauware shown in Fig.2b–f. These averaged humidograms aresorted according to the origin of the air masses arriving atthe site. A typical maritime case is presented in Fig.2b (se-lection criteria used: direction of arriving air parcel between45◦<θ<315◦, f (RH = 85%,550 nm)>3.5, average of 4 hu-midograms). This humidogram shows a sudden increase off (RH) at ∼65% RH (deliquescence) during the hydrationmode (increase of RH, dark blue circles). During the dehy-dration mode (humidifier constantly at high RH and dryeron, light blue circles), the deliquescence RH is passed andf (RH) decreases until RH=∼ 58%. This is not the crystal-lization RH, which unfortunately can not be measured withour set-up, due to temperature and flow conditions insidethe WetNeph (see Sect.3.1.2). The distinct hysteresis be-havior indicates that an almost pure maritime aerosol con-sisting mainly of inorganic salts – e.g. NaCl – was detected
www.atmos-chem-phys.net/11/2603/2011/ Atmos. Chem. Phys., 11, 2603–2624, 2011
2610 P. Zieger et al.: Aerosol extinction coefficients at ambient conditions
01−Jul 01−Aug 01−Sep 01−Oct1
1.5
2
2.5
3
3.5
4
f(RH
=85%
,550
nm) [
−]
(a)
01−Jul 01−Aug 01−Sep 01−Oct0
1
2
3x 10⁻⁴
σ sp(5
50nm
) [m
−1]
(b)
01−Jul 01−Aug 01−Sep 01−Oct0
2
4
6x 10⁻⁵
σ ap(6
37nm
) [m
−1]
σsp(550nm) at RH=85%
σsp(550nm) dry
σap(637nm) dry
Fig. 1. Panel(a) Time series of the scattering enhancement factorf (RH = 85%, 550 nm) measured at Cabauw, The Netherlands, over theperiod from mid June to the beginning of October 2009. Panel(b) Scattering coefficient atλ = 550 nm at RH = 85% (blue line) and atdry conditions (green line) measured by the humidified nephelometer (WetNeph) and reference nephelometer (DryNeph). The absorptioncoefficient atλ = 637 nm (orange line) was measured by the multi-angle absorption photometer (MAAP) at dry conditions.
here. Figure2d and e are two further examples of air masseshaving a maritime origin, although they show no clear del-iquescence behavior. The maritime slightly polluted case(Fig. 2d; with 225◦<θ<315◦ and f (RH = 85 %, 550 nm)>3, average of 31 humidograms) reveals a similarly highmagnitude off (RH) as the clean maritime case (Fig.2b),but without deliquescence, while the maritime heavily pol-luted case is characterized by much lower values off (RH)(Fig. 2e; with 225◦<θ<315◦ andf (RH = 85 %,550 nm)<2,average of 25 humidograms). This is probably caused byadditional pollution and/or a higher fraction of organics,which suppresses the deliquescence and/or reduces the hy-groscopic growth of the particles (Ming and Russell, 2001).Figure 2c and f show two examples of air masses havinga continental origin (continental south: 135◦<θ<225◦ andf (RH = 85 %,550nm)< 2, average of 48 humidograms; con-tinental east: 60◦<θ<135◦, average of 75 humidograms).Both humidograms show a smooth increase off (RH) with-out a distinct deliquescence behavior. This means that theparticles are liquid over a broad RH range. The continen-tal south air masses (Fig.2c) show the lowest values off (RH) of ∼1.9 at RH = 85%. These air parcels originatedfrom northern France, Belgium and The Netherlands southof Cabauw. It is emphasized that these are examples of se-lected air masses only. A simple and generalized categoriza-tion using the air mass trajectories could not be established
due to the high variability of size and composition and theshort measurement period. For a better statistical analysis alonger time period of at least a year would be desirable.
4.2 Factors influencingf (RH) at Cabauw
What determines the magnitude off (RH) and what otherparameters can be used as proxies to estimatef (RH)? Toanswer these questions, the main in-situ aerosol parame-ters available during our measurement period were cross-correlated. The result is presented in Fig.3, which showsthe coefficient of determinationR2 (squared correlation co-efficient) of f (RH = 85%) versus each parameter (the pos-itive or negative sign shows the algebraic sign of the cor-relation coefficient). The strongest correlation (R2
= 0.72)of f (RH = 85%) exists with the hygroscopic growth factorg(RH, 165 nm) measured by the H-TDMA for the dry diam-eter of 165 nm. The chemical composition of the particle atthis rather large diameter is the main factor that determinesits ability to grow. This value seems to be the best proxymeasured independently that can be used to estimatef (RH).It will be shown later that together with the measured sizedistribution and Mie theory this factor can be used to get anestimate off (RH).
The BC volume fractionVBC/Vtot (assuming a density of2.1gcm−3) shows only a weak (negative) correlation withf (RH). Also the coarse mode volume fractionVAPS/Vtot is
Atmos. Chem. Phys., 11, 2603–2624, 2011 www.atmos-chem-phys.net/11/2603/2011/

P. Zieger et al.: Aerosol extinction coefficients at ambient conditions 2611
Cabauw
48 hours
(a)
f(R
H=
85%
,550
nm)
[−]
1.3
2
2.6
3.2
3.8
30 40 50 60 70 80 900.5
1
1.5
2
2.5
3
3.5
f(R
H,5
50nm
) [−
]
RH [%]
Maritime(b)
HydrationDehydration
30 40 50 60 70 80 900.5
1
1.5
2
2.5
3
3.5
f(R
H,5
50nm
) [−
]
RH [%]
Continental south(c)
30 40 50 60 70 80 900.5
1
1.5
2
2.5
3
3.5
f(R
H,5
50nm
) [−
]
RH [%]
Maritime heavily polluted(e)
30 40 50 60 70 80 900.5
1
1.5
2
2.5
3
3.5
f(R
H,5
50nm
) [−
]
RH [%]
Maritime slightly polluted(d)
30 40 50 60 70 80 900.5
1
1.5
2
2.5
3
3.5
f(R
H,5
50nm
) [−
]
RH [%]
Continental east(f)
Fig. 2. Panel(a) FLEXTRA trajectories (48 h backward calculation) of air parcels arriving at Cabauw. The trajectories are color coded withthe mean aerosol scattering enhancementf (RH = 85%, 550 nm) measured at the site. Panels(b)–(f) Example humidograms classified by theorigin of the air masses. Dark blue circles denote averages off (RH) for the hydration branch of the humidogram, while light blue circles areaverages of the dehydration branch (2% RH bins). Underlined in grey are the individual humidograms of each trajectory. Error bars denotethe standard deviation.
only weakly (positively) correlated tof (RH). These ratherlow correlations tof (RH) are accompanied by significantcorrelations of bothVBC/Vtot andVAPS/Vtot to g(RH). Thepositive correlation can be explained by the fact that a largercoarse mode volume fraction is an indicator for the pres-ence of sea salt, which exhibits a higher hygroscopic growth(therefore positively correlated). Increased BC fractions onthe other hand are an indicator for anthropogenic pollutionwith a reduced hygroscopic growth, causing a negative cor-relation because high amounts of BC in the aerosol reduce itsability for hygroscopic growth (Weingartner et al., 1997).
The mean diameter Dmean = N−1∫
∞
0 (DdrydN/dlogDdry)dlogDdry measured by the APS (repre-sentative for the coarse mode) and by the SMPS and APS(representative for the entire size distribution) show similarvalues ofR2 as the coarse mode fraction if compared tof (RH). Both coarse mode proxies (VAPS/Vtot and DAPS)are more highly correlated tog(RH) than tof (RH), becausef (RH) is a measure for the entire size distribution (wherethe hygroscopic properties may change with size) whileg(RH) is representative for only one dry diameter. Thismay also point towards effects of non-linearity in the Mie-
scattering, where both size and chemical composition areinput parameters. If the chemical composition (hygroscopicgrowth and refractive index) is assumed to be constant fora given wavelength,f (RH) will decrease with increasingparticle size. This can be compensated if the size changesconcurrently with its hygroscopicity. A similar effect wase.g. observed and modeled for Arctic aerosol (see Fig. 9in Zieger et al.2010), where smaller but less hygroscopicparticles had a similar magnitude off (RH) compared tolarger but more hygroscopic particles (in that case the coarsemode was also dominated by hygroscopic sea salt).
The scatteringAngstrom exponentαsp (retrieved simi-lar to Eq. (5) but usingσsp instead ofσap) of the dry andwet (at RH = 85%) scattering coefficient show no correla-tion with f (RH). αsp is commonly used as a proxy for themean size (as can be seen in the clear anticorrelation be-tweenαsp and the coarse mode volume fractionVAPS/Vtot).This implies that they can not be used as a simple proxy forf (RH), as for example it has been proposed and verified forthe typical aerosol found at the high alpine site Jungfrau-joch (JFJ) (Nessler et al., 2005a; Fierz-Schmidhauser et al.,2010a). The reason for this is the occasional presence of
www.atmos-chem-phys.net/11/2603/2011/ Atmos. Chem. Phys., 11, 2603–2624, 2011

2612 P. Zieger et al.: Aerosol extinction coefficients at ambient conditions
f(R
H=
85%
)
f(RH=85%) +
αf(
RH
=85
%)
αf(RH=85%) + +
αsp
,dry
αsp,dry − + +
αsp
,RH
=85
%
αsp,RH=85% − − + +
b dry
bdry + − + + +
mea
n D
AP
S
mean DAPS + − − − + +
mea
n D
SM
PS
+A
PS
mean DSMPS+APS − + + + − − +
ω0,
dry
ω0,dry + + − − − + + +
VA
PS/V
tot
VAPS
/Vtot + + − − − + − + +
VB
C/V
tot
VBC
/Vtot − − + + − − + − − +
g(16
5nm
)
g(165nm) + − − − + + − + + − +
Squ
are
of c
orre
latio
n co
effic
ient
(R
2 )
0
0.1
0.2
0.3
0.4
0.5
0.6
0.7
0.8
0.9
1
Fig. 3. Correlation plot of all intensive aerosol parameters measuredin-situ at the Cabauw tower.f (RH = 85%, 550 nm): scatteringenhancement factor;αf(RH): Angstrom exponent off (RH = 85%,550 nm); αsp,dry: Angstrom exponent of scattering coefficient atlow RH; αsp,RH=85%: Angstrom exponent of scattering coeffi-cient at RH = 85%;bdry: backscatter fraction (atλ = 550 nm) atlow RH; DAPS: mean (dry) diameter of APS size distributionmeasurement;DSMPS: mean (dry) diameter of SMPS size distri-bution measurement;ω0,dry: single scattering albedo at low RH(at λ = 550 nm); VAPS/Vtot: coarse mode fraction measured byAPS and SMPS;VBC/Vtot: black carbon volume fraction mea-sured by MAAP, SMPS, and APS;g(RH = 90%,165 nm): hygro-scopic growth factor measured at the dry diameterd0 = 165 nm andat RH = 90% by the H-TDMA. Plus and minus signs indicate theslope of the regression line.
a hygroscopic coarse mode (sea salt) at Cabauw (and mostprobably for all measurement sites with maritime influence),whereas at the JFJ a coarse mode is mainly composed ofmineral dust with very low hygroscopicity. Neither the drybackscattering coefficientbdry (measured by the nephelome-ter) nor the dry single scattering albedoω0,dry (e.g. measuredby the nephelometer, the MAAP and/or the aethalometer) aresuitable proxies. TheAngstrom exponent of the scatteringenhancement factorαf (RH) shows no significant correlationto any in-situ parameters.
4.3 Closure study
To check for consistency within the aerosol in-situ measure-ments a closure study using Mie theory was performed. Themain goal was to reproduce the WetNeph measurements us-ing independent measurements of the hygroscopic growthfactor (H-TDMA), the aerosol size distribution (SMPS andAPS), the aerosol absorption (MAAP and aethalometer), andscattering properties (DryNeph). The Mie-based model isdescribed in detail inZieger et al.(2010). The focus was
1.3 1.4 1.5 1.6 1.70
0.01
0.02
0.03
0.04
0.05
gHTDMA
(d0=165nm,RH=90%) [−]
mim
ag(5
50nm
) [−
]
R2=0.51
Fig. 4. Retrieved imaginary part of the complex refractive indexversus the hygroscopic growth factor measured by the H-TDMA (atd0 = 165 nm and RH = 90%).
set on the period 4 July to 18 July 2009, because during thisperiod all instruments were operating successfully (for theother periods the SMPS did not measure). Independent mea-surements of the chemical composition were not availablefor this study, but are needed to calculate the complex re-fractive index used in the Mie calculations. Therefore, aninversion of the dry scattering and absorption coefficients us-ing the measured size distribution and Mie theory was done(assuming a 50×50 field of real and imaginary parts of therefractive index). With this inversion only a mean refractiveindex (representative for the entire aerosol size distribution)can be derived. This procedure is not a critical issue for theWetNeph closure itself because the closure will be done fora high RH (here, at 85%) as an example, where the particle’srefractive index will be close to that of water.
The retrieval of the refractive index showed additionallythat the imaginary part anticorrelates well with the hygro-scopic growth factor which is measured independently by theH-TDMA (R2
= 0.51, see Fig.4). This shows that less hy-groscopic particles at Cabauw are also characterized by anenhanced absorption, which indicates the presence of blackcarbon. A functional description (e.g. polynomial fit) can notbe established due to the clear and strong presence of organicmatter at Cabauw (Morgan et al., 2010), which is expected tolower the hygroscopic growth while having a minor influenceon the refractive index (negligible imaginary part of the re-fractive index compared to BC,Nessler et al.2005a). There-fore, an extrapolation tog = 1 in order to estimate the imag-inary part of BC can not be made without assumptions. Theimaginary part versus the BC volume fraction showed a verygood correlation (R2
= 0.96,mi = 0.68VBC/Vtot−0.0013 at550 nm); an extrapolation toVBC/Vtot → 1 would lead toan imaginary part of pure BC of∼0.7, which is in accor-dance with literature values (see e.g.Bond and Bergstrom,
Atmos. Chem. Phys., 11, 2603–2624, 2011 www.atmos-chem-phys.net/11/2603/2011/
P. Zieger et al.: Aerosol extinction coefficients at ambient conditions 2613
0 0.5 1 1.5 x 10−40
0.5
1.0
1.5 x 10⁻⁴
y=(0.96±0.013)x + (−2.4e−7±3.1e−7)
R2= 0.96
σsp(550nm,RH=85%) measured [m−1]
σ sp(5
50nm
,RH
=85%
) cal
cula
ted
[m−1
]
Using measured gHTDMA(d0=165nm,RH=90%)(a)
g HTD
MA(d
0=165
nm,R
H=9
0%) [
−]
1.25
1.3
1.35
1.4
1.45
1.5 2 2.5 3 3.51.5
2
2.5
3
3.5y=(0.77±0.033)x + (0.38±0.087)
R2= 0.62
f(RH,550nm) meas. [−]
f(RH
,550
nm) c
alc.
[−]
Using measured gHTDMA(d0=165nm,RH=90%)(b)
g Mie
/gH
TDM
A [−]
0.85
0.9
0.95
1
1.5 2 2.5 3 3.51.5
2
2.5
3
3.5y=(−0.061±0.025)x + (2.6±0.068)
R2= 0.011
f(RH,550nm) meas. [−]
f(RH
,550
nm) c
alc.
[−]
Using mean gHTDMA(d0,RH=90%)=1.48(c)
g HTD
MA(d
0=165
nm,R
H=9
0%) [
−]
1.35
1.4
1.45
1.5
1.55
1.6
1.5 2 2.5 3 3.51.5
2
2.5
3
3.5y=(0.49±0.031)x + (1.3±0.082)
R2= 0.38
f(RH,550nm) meas. [−]
f(RH
,550
nm) c
alc.
[−]
Using g(VBC/Vtot,VAPS/Vtot)(d)
σ sp(5
50nm
) Dry
Nep
h [m
−1]
1
2
3
4
5x 10⁻⁵
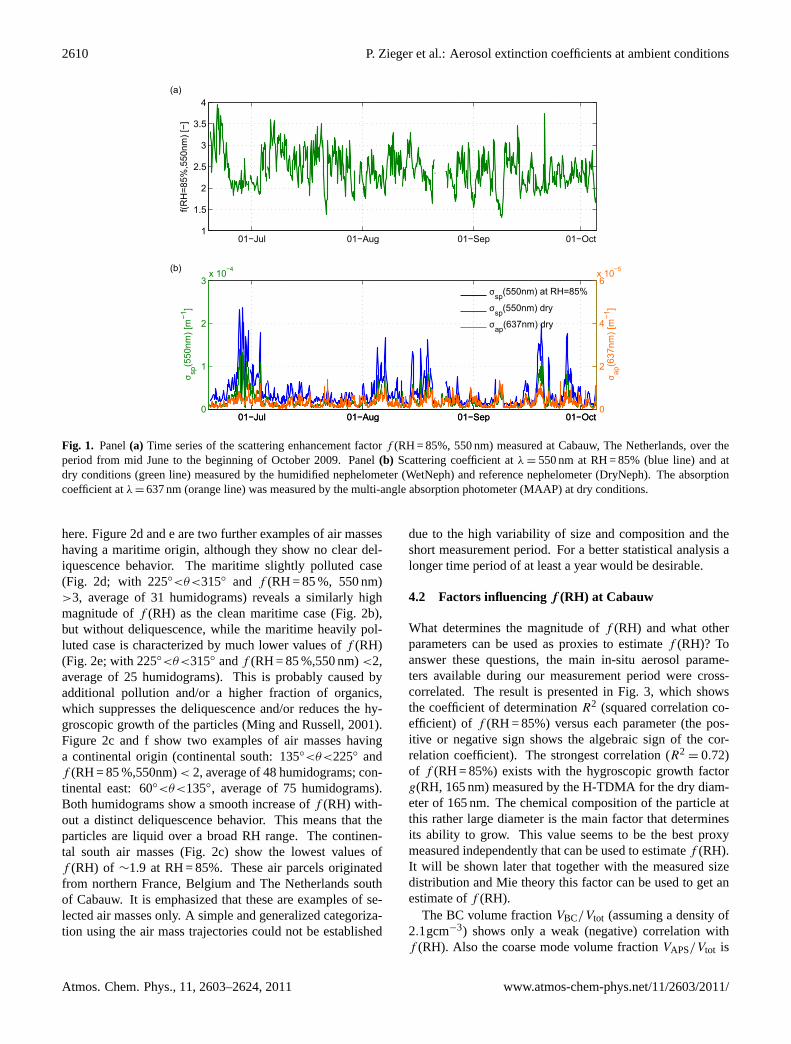
Fig. 5. Panel(a)Scattering coefficientσspcalculated vs. measured using the hygroscopic growth factor measured by the H-TDMA. Panel(b)–(d) Scattering enhancement factorf (RH = 85%, 550 nm) calculated vs. measured values. Panel(b) The measured hygroscopic growthfactor of the H-TDMA (dry diameterd0 = 165 nm) has been used for the calculation, the color code denotes the ratio ofgMie/gHTDMA .Panel(c) A fixed value ofg(d0RH= 90%) = 1.48 (mean for that period) has been used for the calculation. Panel(d) An empirical relationof g(VBC/Vtot,VAPS/Vtot) has been used for the calculation off (RH). All values are shown at RH = 85%. The solid black line represents abivariate linear regression including weights (with calculated uncertainty of slope and intercept). The 1:1-line is shown as a dashed line.
2006). The good correlation is not surprising since the imag-inary part was retrieved using the BC measurements from theMAAP in conjunction with the size distribution and neph-elometer measurements.
The hygroscopic growth factorg(RH) is measured bythe H-TDMA at the dry diameters of 35, 50, 75, 110,and 165 nm. Since the H-TDMA measured at a constantRH = 90%, the value ofg(RH) for different RH was calcu-lated using Eq. (2), where instead of the water activityaw
the relative humidity RH is used. The largest diameter is themost important one for the determination of the optical prop-erties. The change of the size distribution at RH = 85% wascalculated assuming that particles larger than 165 nm havethe same hygroscopic growth as the 165-nm-particles. Theresult for the wet scattering coefficientσsp(RH = 85%) is pre-sented in Fig.5a (the results are shown forλ = 550 nm andare similar for the other nephelometer wavelengths). For thelinear regression a bivariate weighted fit according toYorket al.(2004) as described inCantrell(2008) with the assump-tion of a 10% error in the measured (Anderson et al., 1996)and calculated scattering coefficients has been used. Thismethod includes the uncertainties of both thex andy vari-ables and allows the calculation of the uncertainties of theretrieved slope and intercept. The high correlation coefficient
and the good linear relationship are clear indicators that theaerosol in-situ measurements are consistent with each other(at least for the investigated period). The slightly lower val-ues of the calculatedσsp(RH = 85%) can be explained by thefact that the H-TDMA measures only rather small particlesand misses the coarse mode which might include large hy-groscopic particles such as sea salt. This is also seen in theapplied color code. While the H-TDMA measures particleswith low hygroscopicity (e.g.g <1.3, blue points) the mea-sured values ofσsp(RH= 85%) are larger than the calculatedones. One reason could be the presence of a mixture con-taining a polluted fine mode (e.g. soot) and a coarse modeconsisting of sea salt, which can not be measured with theH-TDMA. The calculatedf (RH = 85%) using the measuredg(RH) of the H-TDMA is therefore lower than that derivedfrom the measurements (see Fig.5b).
Keeping the dry refractive index at a fixed value doesnot significantly change the agreement within this closurestudy. Despite the fact that the number size distributiondominates the magnitude of the calculated dry scattering co-efficient the variation of the dry refractive index still hasan influence. Taking e.g.m = 1.5291+ 0.024i at 550 nm(used inFierz-Schmidhauser et al.(2010b) for polluted airat Mace Head, Ireland) givesy = (1.0± 0.014)x + (2.2×
www.atmos-chem-phys.net/11/2603/2011/ Atmos. Chem. Phys., 11, 2603–2624, 2011

2614 P. Zieger et al.: Aerosol extinction coefficients at ambient conditions
04−Jul 06−Jul 08−Jul 10−Jul 12−Jul 14−Jul 16−Jul 18−Jul 20−Jul1.2
1.3
1.4
1.5
1.6
1.7
g(R
H=
90%
) [−
]
HTDMA (d0=165nm)
MIE
VA
PS/V
tot [−
]
0.05
0.1
0.15
0.2
0.25
0.3
0.35
0.4
0.45
0.5
Fig. 6. Time series of the hygroscopic growth factor measured by the H-TDMA (black line) and retrieved from WetNeph, DryNeph, SMPS,APS measurements and Mie theory (red line). The color code denotes the coarse mode volume fraction measured by the APS and SMPS.
10−7± 2.4× 10⁻⁷)m−1 and R2=0.94 for the comparison
of the wet scattering coefficients to the calculated values(analog to Fig.5a). For the comparison of the measuredand calculatedf (RH) using the growth factor of the H-TDMA (analog to Fig.5b) gives a slightly lower agreementy = (0.64±0.029)x +(0.57±0.078) andR2=0.61.
To further demonstrate the effect of the limited size rangeof the H-TDMA measurements for the closure study, the hy-groscopic growth factor was derived via Mie theory fromthe WetNeph, DryNeph and size distribution measurements(for more details seeZieger et al.2010). The results arepresented in Fig.6 together with the hygroscopic growthfactors measured with the H-TDMA (both at RH = 90%).While the correlation between both methods is quite good(R2
= 0.71) and the agreement is good for certain periods,the WetNeph basedgMie(RH) is generally slightly higher(gMie(RH) = 1.3gHTDMA (RH)−0.4 derived by an orthogo-nal linear regression), but there are certain periods where thedifferences increase substantially. These are most probablyepisodes with enhanced sea salt influence, as can be seen byan enlarged coarse mode measured by the APS and SMPS(see color code in Fig.6).
The calculations were repeated using a fixed hygroscopicgrowth factor of g(d0,RH = 90%) = 1.48 (mean campaignvalue for 165 nm) to demonstrate the effect of assuminga constant hygroscopic growth. The result is depicted inFig. 5c. The calculatedf (RH) values are clearly lower thanthe measured values off (RH). The color code shows theg(RH) measured by the H-TDMA, which is high for the un-derestimated and low for the overestimated values off (RH).
If f (RH) needs to be predicted, the chemical composition(especially the coarse mode composition) needs to be known.Fierz-Schmidhauser et al.(2010a) andNessler et al.(2005a)used one mean growth factor to successfully predictf (RH)at the JFJ, but they were in a comfortable position that theaerosol coarse mode consisted only of non-hygroscopic min-eral dust.
The question arises whether other continuously measuredaerosol properties can be used as a proxy to estimatef (RH)or g(RH). f (RH) correlates poorly with other in-situ mea-sured parameters as already shown in Fig.3, but clearly cor-relates withg(RH). g(RH) on the other hand correlates wellwith the coarse mode and black carbon volume fraction. Anempirical equation was retrieved from the available measure-ments
g(RH = 85%) = b1+b2VBC/Vtot+b3VAPS/Vtot+
b4VAPS/Vtot ·VBC/Vtot (9)
with b1 = 1.38, b2 = −1.64, b3 = 0.35, andb4 = −1.77 andfound to be the best suitable equation. The result of thef (RH) calculation using Eq.9 for g(RH) compared to themeasurements is presented in Fig.5d. Although the varia-tion is quite large, an improvement compared to the constantchemistry assumption is clearly seen. Nevertheless, these ex-amples demonstrate the need for a full chemical analysis andmeasured size distribution to predictf (RH) if no humidifiednephelometer (or at least H-TDMA) measurements are avail-able.
4.4 Comparison to remote sensing data
The WetNeph measurements allow the determination of theambient extinction coefficient, assuming that the absorptioncoefficient does not change with RH. This assumption can bemade, because the scattering is the dominant part of the ex-tinction (medianω0 = 0.81, 10th percentileω0 = 0.70, 90thpercentileω0 = 0.89 at dry conditions for the entire cam-paign) and model studies for free tropospheric aerosol (al-though with a higherω0) show that the effect of RH on theabsorption coefficient (with respect to the extinction) is neg-ligible (Nessler et al., 2005b). The extinction is then calcu-lated as follows:
σep(RH) = cp
(f (RH)σsp+σap
). (10)
Atmos. Chem. Phys., 11, 2603–2624, 2011 www.atmos-chem-phys.net/11/2603/2011/

P. Zieger et al.: Aerosol extinction coefficients at ambient conditions 2615
σsp andσap are measured by the DryNeph and the MAAPand aethalometer under dry conditions.cp is a correctionfactor for pressure and temperature differences (see below).All optical measurements were inter- or extrapolated to therelevant wavelength using theAngstrom law (Eq. (5), withσep). αap=0.84 was assumed for periods without aethalome-ter measurements which represents the mean value measureduntil the 6th of July by the aethalometer at the site. The as-sumption of a constant value ofαap is justified in our case dueto the low variation of the measured value (10th percentile:0.71, 90th percentile: 0.98) and due to the negligible impactof αap on the ambient extinction coefficient where the scat-tering is the clearly dominant part (e.g. taking 1 or 1.5 asa fixed value forαap would increase the ambient extinctioncoefficient only by a factor of 1.002 or 1.01, respectively).f (RH) was interpolated assuming a linear relationship. Timeperiods with RH>95% were ignored, due to the uncertaintyin the parameterization off (RH) at very high RH values(e.g.f (RH)→ ∞ for RH→ 100%). cp = p(h)T0/p0T (h)
accounts for pressure and temperature differences inside (p0,T0) and outside (p(h), T (h)) the nephelometer. For the cal-culation ofp(h) the barometric formula was used, whereh isthe height of the RH measurement. This is mainly of impor-tance for the comparison to the MPI measurements where themeasured extinction coefficient is a mean value for a varyinglayer height (20–5000 m). At the Cabauw tower, the tem-perature and dew point (from which the RH can be derivedvia the Magnus formula) are continuously measured at 10,20, 40, 80, 140, and 200 m. For the MPI comparison thetemperature and RH profiles were taken from the operationalweather forecast model COSMO (based on assimilated data,seehttp://www.cosmo-model.org/). It was assumed that theaerosol type and concentration are constant with altitude andonly RH is changing. Only the retrievals at the lowest heightlevel of the remote sensing instruments were compared to in-situ measurements.
4.4.1 MAX-DOAS
For comparison with the in-situ measurements, aerosol ex-tinction coefficient from the lowermost layer of the MAX-DOAS profiles from BIRA, IUPHD and JAMSTEC are used.BIRA and IUPHD retrievals use a layer thickness of 200 m,whereas from the JAMSTEC retrieval with a layer height of1 km, an extinction coefficient representative for the lower-most 200 m has been estimated by assuming an exponen-tially decreasing extinction profile. In the MPI retrieval amean aerosol extinction coefficient in the boundary layer isestimated by retrieving the layer height and the aerosol op-tical thickness. Thef (RH) value was calculated for eachavailable RH measurements of the tower (for MPI taken fromthe COSMO model), and a mean value was then calculatedusing Eq. (10). For the correction factorcp, the pressurewas taken from ground based measurements (and taking thebarometric height formula for the height dependency) and
the temperature was measured next to the RH sensors (forMPI again the COSMO data was used). It should be pointedout that the comparison of the lowest MAX-DOAS extinctioncoefficient with in-situ measurements is of special interestsince the MAX-DOAS retrieval has its highest sensitivity atthe ground (Frieß et al., 2006) while LIDAR measurementsare usually challenged with the overlap problem at low al-titudes. In a recent study (Li et al., 2010), good agreementwas found between aerosol extinction coefficients retrievedfrom MAX-DOAS and surface in-situ measurements. MAX-DOAS aerosol extinction coefficient profiles have only beencompared in very few studies with other independent profil-ing techniques.Irie et al. (2008, 2009) made comparisonsbetween lower-tropospheric vertical profiles retrieved fromthe JAMSTEC MAX-DOAS and coincident LIDAR obser-vations at Tsukuba, Japan. They found reasonable agreementfor layers of 0–1 and 1–2 km to within 30% and 60%, respec-tively, for most cases. However, these very few studies alsoshow the need for further independent validation studies likethe one presented here.
In Fig.7 an example measurement of 24 June 2009 is seen.This day was characterized by almost entirely cloud free con-ditions in the morning and was classified as one of the goldendays during CINDI (Roscoe et al., 2010). This is also re-flected in the LIDAR measurement (Fig.7a), which showedthe appearance of cirrus clouds at around 10:00 a.m. andlow level clouds at around 11:30 a.m. The agreement be-tween MAX-DOAS and in-situ is good during the forenoon,which was characterized by high ambient RH values, whichwere decreasing until noon (see color code of ambient in-situ values in Fig.7b–e); concurrently the extinction wasdecreasing within all measurements. From approximately10:30 a.m. (12:00 p.m. for IUPHD) the MAX-DOAS andambient in-situ values ofσep were diverging. This was co-incident with an increase of the planetary boundary layerheight and the appearance of low level clouds (see LIDARmeasurement in Fig.7a), while the surface values of RH (be-tween 0–200 m) stayed below 70%. The comparison of theaerosol optical depth (AOD), which is the integral ofσep overthe vertical column, retrieved by the MAX-DOAS and mea-sured by a Cimel sun photometer showed good agreementduring the entire day, although this is just a columnar valuebeing compared and gives no information on the true profileshape (further details inFrieß et al., 2011).
Figures8 and9 display the comparison of the entire dataset, for the time periods given in Table1. All MAX-DOASinstruments detect generally a higher extinction coefficientthan the in-situ measurements. The slope of the applied bi-variate linear regression (Cantrell, 2008; York et al., 2004)varies from 2.9 (IUPHD), 3.4 (JAMSTEC) to 3.4 (BIRA,with sun photometer (Cimel) used as input values). The MPIMAX-DOAS shows a lower slope (1.5), but has to be treatedwith care since the retrieval height varied and RH profileswere taken from a re-analyzed weather model (COSMO).All comparisons are well correlated (R2
= 0.62 to 0.78). An
www.atmos-chem-phys.net/11/2603/2011/ Atmos. Chem. Phys., 11, 2603–2624, 2011

2616 P. Zieger et al.: Aerosol extinction coefficients at ambient conditions
Table 2. Results of an orthogonal linear regression (using weights) between ambient in-situ and MAX-DOAS extinction coefficients for thetime periods given in Table1. Values in parenthesis are for time periods when all four MAX-DOAS instruments were measuring in parallel.
BIRA with Cimel BIRA with in-situ IUPHD JAMSTEC MPI
Slope 3.4 (2.9) 2.7 (2.4) 2.9 (2.2) 3.4 (2.6) 1.5 (1.2)Error slope 0.06 (0.08) 0.04 (0.06) 0.05 (0.06) 0.06 (0.09) 0.08 (0.2)Intercept −1.6×10⁻⁵ (−2.4×10⁻⁵) −8.2×10⁻⁶ (−1.3×10⁻⁵) −1.2×10⁻⁵ (1.2×10⁻⁵) −2.9×10⁻⁶ (1.4×10⁻⁵) 4.6×10⁻⁵ (4.3×10⁻⁵)Error intercept 2×10⁻⁶ (3×10⁻⁶) 1×10⁻⁶ (2×10⁻⁶) 2×10⁻⁶ (4×10⁻⁶) 2×10⁻⁶ (3×10⁻⁶) 8×10⁻⁶ (2×10⁻⁵)No. of points 404 (124) 362 (132) 830 (177) 629 (96) 642 (194)R2 0.78 (0.79) 0.81 (0.83) 0.66 (0.76) 0.74 (0.75) 0.62 (0.72)
Fig. 7. Example day 24 June 2009 (golden day). Panel(a) Range corrected signal (RCS) at 1064 nm measured by the RIVM backscatterand the CAELI LIDAR. Panels(b)–(e) Time series of the aerosol extinction coefficient retrieved by MAX-DOAS instruments (black line)compared to in-situ measurements (red line: dry in-situ extinction coefficient, grey line: ambient value at the RH denoted in the color codeddots).
overview of the coefficients retrieved from the orthogonallinear fit and the correlation is found in Table2. Slope andR2 improve slightly if only identical time periods (when allfour MAX-DOAS instruments were measuring at the sametime) are being compared, although the number of compara-ble points is largely reduced (see Table2). A distinct numberof points show a good agreement and are located on the 1:1-line. The color code in Fig.8 reveals that these are timeswith a low aerosol optical depth (data from the AERONETsun photometer measurement, level 2.0). Figure9 showsthe same comparison, but with the planetary boundary layer(PBL) height as color code. The PBL height is measured bya ceilometer (Vaisala, Model LD-40; for details concerning
the algorithm seede Haij et al., 2007, 2010). The points withbetter agreement show a low PBL height.
Figure10 illustrates the comparison of the MPI measure-ment, where the layer height is kept variable during the re-trieval. The agreement improves with decreasing layer heightdespite the assumptions that had to be made (well mixedaerosol layer, same aerosol type, RH from COSMO).
The error bars of the ambient in-situ extinction coefficientin Figs.7–10 were derived from Gaussian error propagationassuming a 10% uncertainty of the nephelometer (Andersonet al., 1996) and a 12% uncertainty of the MAAP (Petzoldand Schonlinner, 2004).
Atmos. Chem. Phys., 11, 2603–2624, 2011 www.atmos-chem-phys.net/11/2603/2011/

P. Zieger et al.: Aerosol extinction coefficients at ambient conditions 2617
0 2 4 6 x 10−40
0.2
0.4
0.6
0.8
1x 10⁻³
y=(3.4±0.054)x + (−1.6e−5 ±1.2e−6)
R2= 0.78
In−situ amb. σep(477nm) [m−1]
BIR
Aw
Cim
elσ ep
(477
nm)
[m−1
]No. of points=404
(a)
AO
DC
imel
0
0.2
0.4
0.6
0.8
1
0 2 4 6 x 10−40
0.2
0.4
0.6
0.8
1x 10⁻³
y=(2.9±0.041)x + (−1.2e−5±1.9e−6)
R2= 0.66
In−situ amb. σep(450nm) [m−1]
IUP
HDσ ep
(450
nm)
[m−1
]
No. of points=830
(b)
AO
DC
imel
0
0.2
0.4
0.6
0.8
1
0 2 4 6 x 10−40
0.2
0.4
0.6
0.8
1x 10⁻³
y=(3.4±0.056)x + (−2.9e−6±1.4e−6)
R2= 0.74
In−situ amb. σep(476nm) [m−1]
JAM
STE
C20
0mσ ep
(476
nm)
[m−1
]
No. of points=629
(c)
AO
DC
imel
0
0.2
0.4
0.6
0.8
1
0 2 4 6 x 10−40
0.2
0.4
0.6
0.8
1x 10⁻³
y=(1.5±0.075)x + (4.6e−5±7.9e−6)
R2= 0.62
In−situ amb. σep(360nm) [m−1]
MP
Iσep
(360
nm)
[m−1
]
No. of points=642
(d)
AO
DC
imel
0
0.2
0.4
0.6
0.8
1
Fig. 8. Ambient extinction coefficient retrieved by MAX-DOAS vs. in-situ measurements brought to ambient conditions. The color codedenotes the AOD measured by the Cimel sun photometer (AOD interpolated in accordance with the appropriate wavelength; grey points aretimes with no sun photometer measurements). The solid black line represents a bivariate linear regression including weights (with calculateduncertainty of slope and intercept). The dashed line is the 1:1-line.
0 2 4 6 x 10−40
0.2
0.4
0.6
0.8
1x 10⁻³
y=(3.4±0.054)x + (−1.6e−5±1.2e−6)
R2= 0.78
In−situ amb. σep(477nm) [m−1]
BIR
Aw
Cim
elσ ep
(477
nm)
[m−1
]
No. of points=404
(a)
PB
L he
ight
[m]
200
300
400
500
600
700
800
900
1000
0 2 4 6 x 10−40
0.2
0.4
0.6
0.8
1x 10⁻³
y=(2.9±0.041)x + (−1.2e−5 ±1.9e−6)
R2= 0.66
In−situ amb. σep(450nm) [m−1]
IUP
HDσ ep
(450
nm)
[m−1
]
No. of points=830
(b)
PB
L he
ight
[m]
200
400
600
800
1000
1200
1400
0 2 4 6 x 10−40
0.2
0.4
0.6
0.8
1x 10⁻³
y=(3.4±0.056)x + (−2.9e−6±1.4e−6)
R2= 0.74
In−situ amb. σep(476nm) [m−1]
JAM
STE
C20
0mσ ep
(476
nm)
[m−1
]
No. of points=629
(c)
PB
L he
ight
[m]
200
400
600
800
1000
0 2 4 6 x 10−40
0.2
0.4
0.6
0.8
1x 10⁻³
y=(1.5±0.075)x + (4.6e−5±7.9e−6)
R2= 0.62
In−situ amb. σep(360nm) [m−1]
MP
Iσep
(360
nm)
[m−1
]
No. of points=642
(d)
PB
L he
ight
[m]
200
400
600
800
1000
Fig. 9. Same as Fig.8, but here the color code denotes the planetary boundary layer height measured by the ceilometer (grey points: noquality assured PBL data available).
www.atmos-chem-phys.net/11/2603/2011/ Atmos. Chem. Phys., 11, 2603–2624, 2011

2618 P. Zieger et al.: Aerosol extinction coefficients at ambient conditions
0 2 4 6x 10⁻⁴
0
0.2
0.4
0.6
0.8
1x 10⁻³
y=(2.1±0.25)x + (3.8e−005±2.3e−005)
R2= 0.55
No. of points=86
In−situ amb. σep(360nm) [m−1]
MP
Iσep
(360
nm)
[m−1
]
Retrieval height=5000m
0 2 4 6x 10⁻⁴
0
0.2
0.4
0.6
0.8
1x 10⁻³
y=(2±0.23)x + (−2.3e−006±2e−005)
R2= 0.61
No. of points=81
In−situ amb. σep(360nm) [m−1]
MP
Iσep
(360
nm)
[m−1
]
Retrieval height=3000m
0 2 4 6x 10⁻⁴
0
0.2
0.4
0.6
0.8
1x 10⁻³
y=(1.7±0.22)x + (3.8e−005±2.3e−005)
R2= 0.65
No. of points=65
In−situ amb. σep(360nm) [m−1]
MP
Iσep
(360
nm)
[m−1
]
Retrieval height=2500m
0 2 4 6x 10⁻⁴
0
0.2
0.4
0.6
0.8
1x 10⁻³
y=(1.7±0.23)x + (3.9e−005±2.4e−005)
R2= 0.78
No. of points=53
In−situ amb. σep(360nm) [m−1]
MP
Iσep
(360
nm)
[m−1
]
Retrieval height=2000m
0 2 4 6x 10⁻⁴
0
0.2
0.4
0.6
0.8
1x 10⁻³
y=(1.4±0.24)x + (1.8e−005±2.6e−005)
R2= 0.87
No. of points=44
In−situ amb. σep(360nm) [m−1]
MP
Iσep
(360
nm)
[m−1
]
Retrieval height=1750m
0 2 4 6x 10⁻⁴
0
0.2
0.4
0.6
0.8
1x 10⁻³
y=(1.2±0.2)x + (5.3e−005±2.8e−005)
R2= 0.69
No. of points=41
In−situ amb. σep(360nm) [m−1]
MP
Iσep
(360
nm)
[m−1
]
Retrieval height=1500m
0 2 4 6x 10⁻⁴
0
0.2
0.4
0.6
0.8
1x 10⁻³
y=(1.5±0.25)x + (4.2e−005±3.4e−005)
R2= 0.63
No. of points=53
In−situ amb. σep(360nm) [m−1]
MP
Iσep
(360
nm)
[m−1
]
Retrieval height=1200m
0 2 4 6x 10⁻⁴
0
0.2
0.4
0.6
0.8
1x 10⁻³
y=(1±0.16)x + (7e−005±3e−005)
R2= 0.62
No. of points=46
In−situ amb. σep(360nm) [m−1]
MP
Iσep
(360
nm)
[m−1
]
Retrieval height=1000m
0 2 4 6x 10⁻⁴
0
0.2
0.4
0.6
0.8
1x 10⁻³
y=(1.3±0.38)x + (4.9e−005±6.1e−005)
R2= 0.7
No. of points=24
In−situ amb. σep(360nm) [m−1]
MP
Iσep
(360
nm)
[m−1
]
Retrieval height=700m
Fig. 10. Ambient extinction coefficient measured by the MPI MAX-DOAS instrument, where the layer height is kept variable during theMAX-DOAS retrieval vs. in-situ. The aerosol type is assumed to be constant within the layer (for the calculation of the in-situσep, onlythe RH changes with height). The RH profiles are taken from assimilated COSMO data. Solid line represents a bivariate linear regressionincluding weights (with calculated uncertainty of slope and intercept), dashed line is the 1:1-line.
For the BIRA and IUPHD retrieval the error bars repre-sent the sum of the noise and smoothing error. Forwardmodel errors were not considered here (Rodgers, 2000; Frießet al., 2006; Clemer et al., 2010). For the JAMSTEC re-trieval the errors have been quantified by the retrieval co-variance matrix, which is defined to represent the sum ofthe smoothing error and the retrieval noise error (Rodgers,2000). For the MPI retrieval so far no full error assess-ment was implemented, and the errors were assumed to be0.25σep+0.05×10⁻³ m−1.
As already mentioned, BIRA uses the values of the asym-metry factor and the single scattering albedo inverted fromsun photometer measurements in their standard retrieval. Thecomparison improves if in-situ measurements (at ambientconditions) of the asymmetry factor and the single scatter-ing albedo are taken as input parameters (see Table2). Thishowever can be caused by the large uncertainty of the singlescattering albedo and the asymmetry factor retrieved fromAERONET at low AOD.
The following hypotheses concerning the disagreementare being made. On the in-situ side:
– Particle losses due to impaction or diffusion in the inletsystem
– Underestimation of the measured extinction due to thePM10 size cut
– Parameterization off (RH) (Eq. (8), large errors forRH> 90%)
On the MAX-DOAS side:
– BIRA, JAMSTEC, IUPHD: systematic overestimationof the lowest level (0–200 m). The most probable ex-planation for this finding is that due to the limited verti-cal resolution of the retrievals, the presence of aerosol athigher altitudes (>200 m) might result in an overestima-tion of the lowest level ofσep. In addition, in the caseof an uplifted aerosol layer with a strong vertical gra-dient near the surface, the vertical resolution of about
Atmos. Chem. Phys., 11, 2603–2624, 2011 www.atmos-chem-phys.net/11/2603/2011/

P. Zieger et al.: Aerosol extinction coefficients at ambient conditions 2619
0 1 2 3
x 10−4
0
500
1000
1500
2000
2500
σep(λ=355nm) [m −1]
Hei
ght [
m]
Lidar measured (04−Aug 00:59−03:07)Lidar from β−signal with LR=27 (800m)Lidar from β−signal with LR=30 (1000m)Lidar from β−signal with LR=33 (1200m)Lidar from β−signal with LR=37 (1400m)Lidar from β−signal with LR=48 (1600m)in−situ (dry)in−situ (ambient)
RH ambient (tower) [%]60 70 80 90
Fig. 11. Lidar and in-situ measurements of the aerosol extinc-tion coefficientσep at λ = 355 nm (4 August 2009, 00:59–03:07).Black line: Direct LIDAR measurement ofσep; Colored lines:σep calculated from the backscatter signal using measured LIDARratios (LR) obtained from mean values of different height levels(±100 m); black square:σep measured in-situ at dry conditions;colored circles:σep brought to ambient conditions (color code de-notes the ambient RH measured at the tower, error bars are retrievedvia Gaussian error propagation).
250 m near the surface will be insufficient and result inan overestimation of the surface value.
– Influence of the horizontal aerosol gradient, whichmight exhibit large variation
– Influence of clouds
The influence of clouds was tested by comparing only datapoints for which AERONET AOD measurements (level 2.0)were available (other time periods were excluded in theAERONET data processing due to the presence of clouds).No clear improvement could be observed; therefore the in-fluence of clouds is believed not to be the main cause for thisdisagreement.
The smaller slope of the regression line for the MPI mea-surements could indicate that the coarser resolution withmore simplified assumptions is a more robust retrieval. Itshould, however, also be noted that the scatter and the y-axisintercept for the MPI retrieval is larger than for the other re-trievals.
The comparison was also tested against other parameterslike the ambient RH (to check the validity of thef (RH) pa-rameterization), the aerosol mean diameter (to check for de-pendencies concerning the size dependent losses), the winddirection, and the single scattering albedo (to check for
aerosol type dependencies). No clear dependency was found.With this and with the favorable results from the closurestudy in mind (Sect.4.3), we assume that the in-situ measure-ments are not the main reason for the disagreement and onlya certain percentage (possibly<10–30%) can be explainedthrough errors in the in-situ data.
4.4.2 LIDAR
Due to the long averaging times, only 22 profiles (withinthe period 23 June–20 September, averaging time 1.85±0.5 h(mean± standard deviation) of the aerosol extinction coef-ficient measured by the CAELI LIDAR could be comparedto the in-situ measurements. The aerosol extinction coeffi-cient (at 355 nm) can be measured directly using the Ramanchannel above approximately 750 m. The backscatter signal,retrieved using the Raman method, starts at approximately60 m and can be used to extrapolate the direct measurementof σep if an appropriate LIDAR ratio LR (Eq.7) is assumed.Instead of an educated guess, the measured LR of the upperlayers between 700 and 1700 m was determined (mean val-ues for 200 m thick levels) and multiplied with the backscat-ter signal.
An example day is presented in Fig.11. The extinction isdirectly measured above∼750 m (black line). The LR of theupper layers increase with height from LR = 37 to LR = 48(due to changing RH and/or aerosol type changes or lowersignal to noise ratio). These values are used to calculateσepby multiplying the backscatter signal with the LR. The in-situvalues at dry (black square) and at ambient conditions at theRH measurement of the tower (color coded circles) are alsoshown. The large RH gradient results in a strong increase ofσep concurrently determined indirectly from both the in-situaerosol measurements and the LIDAR measurements.
The LR values are within the range as e.g. modeledby Ackermann(1998) for marine (LR=∼10–25 betweenRH = 0–99%) or continental aerosol (LR=∼40–70 betweenRH = 0–99%) or as observed byMuller et al. (1997) forurban haze in central Europe (LR=58±12). As mentionedabove, the LR depends besides the aerosol composition alsostrongly on the RH. To illustrate the effect of RH on the LRmeasured here, the LR of the individual layer versus the layerRH is shown in Fig.12a. The RH-profiles were taken froma re-analyzed weather model (COSMO). One can observethat for most of the cases the LR increases with increasingRH, similar to the model results ofAckermann1998or themeasurements ofSalemink et al.(1984). Of course, also theaerosol type might change with altitude which can not be ex-cluded here.
The LR of the lowest possible height level was multi-plied with the mean backscatter coefficient measured be-tween (∼60–200m) to retrieve a mean extinction coefficientfor the ground (see Eq.7). In addition, the individual re-trieved LR-RH-relationships (see Fig.12a) were used to cal-culate (interpolate) the LR for the mean RH measured at the
www.atmos-chem-phys.net/11/2603/2011/ Atmos. Chem. Phys., 11, 2603–2624, 2011

2620 P. Zieger et al.: Aerosol extinction coefficients at ambient conditions
0 1 2
x 10−4
0
1
2
3
4
5x 10⁻⁴
in−situ (ambient) σep(355nm) [m−1]
LID
ARσ ep
(355
nm) [
m−1
]
(b)
Daytime meas. (LR from lowest height level)Nighttime meas. (LR from lowest height level)LR interpolated (see Panel a)All (22 profiles): y=1.69x−2.26e−005 R2=0.82Night (6 profiles): y=1.12x−4.51e−006 R2=0.96LR interp. (15 profiles) : y=1.76x−6.6e−006 R 2=0.85
0 20 40 60 80 1000
10
20
30
40
50
60
RH (COSMO) or mean RHtower [%]
LR (8
00 −
160
0 m
asl
.) [s
r]
(a)
All profilesProfiles usedLR lowest levelLR interp. at RHtower
Fig. 12. Panel(a): The LIDAR ratio LR measured in 200-m altitude intervals between 700 and 1700 m versus the RH in the individual layer(taken from COSMO). Grey crosses denote the LR of the lowest layer, red crosses show the interpolated LR for the RH measured at theground (mean 60–200 m). The profiles used to retrieve the interpolated value are shown in blue. Grey are all profiles (where no interpolationwas possible or where no WetNeph measurements were available). Panel(b): Comparison of the extinction coefficientσep at the groundretrieved from LIDAR vs. the in-situ values (mean for 60–200 m). Circular points denote the mean value if the LR from the lowest level istaken (black daytime measurements; blue nighttime measurements). Red crosses show the mean value if the LR interpolated to the groundRH is taken (see Panela). The y-error bars give the range of the retrievedσep taking the measured minima and maxima LR of the upperlayer. The x-error bars give the calculated error in the ambient in-situ measurement. The solid lines represent linear orthogonal regressions(see legend).
ground. With this method only 15 profiles could be com-pared since the no extrapolation was performed. The resultis shown in Fig.12b. The error bars denote the range ofthe retrieved extinction coefficient taking the maximum andminimum value of the measured LR to calculateσep at theground.
Orthogonal linear regressions (without weights) revealedthat the LIDAR retrievedσep were about∼1.7–1.8 highercompared to the ambient in-situ values. There is no largedifference if the LR interpolated to the ground RH (insteadof the LR from the lowest layer) is being used, which indi-cates that the LR of the lowest level has been a good estimatefor the LR at the ground (at least for most of the cases). Bothsets ofσep are well correlated to the ambient in-situ values(R2 = 0.82–0.96). Nighttime measurements showed to havea better agreement (slope 1.12,R2
= 0.96) compared to day-time measurements, which might be due to lower noise inthe LIDAR measurements during nighttime. However, thisimprovement has to be treated with care since only 6 profileswere measured during nighttime.
5 Conclusions
In this study, the influence of water uptake on the aerosol ex-tinction coefficient was investigated during a 4-month cam-paign at the Cabauw field station (The Netherlands) usingdirect measurements of aerosol optical and micro-physicalproperties. While the scattering coefficient was measuredas a function of RH, the absorption coefficient was mea-sured dry and assumed not to change with RH. The scat-
tering enhancement factorf (RH) was found to be highlyvariable (f (RH) varied between∼1.4 and 3.8 at RH = 85%)and dependent on the air mass origin. Continental aerosolshowed a lower scattering enhancement possibly due to an-thropogenic pollution and lower sea salt content. Hystere-sis was observed only during some very few events, whenthe air masses arrived directly from the oceans. The bestquantity to estimatef (RH) from other continuous in-situmeasurements was found to be the hygroscopic growth fac-tor measured e.g. by a H-TDMA. The use of the scatteringAngstrom exponent did not correlate well withf (RH) dueto the large variability in the chemical composition. Thismakes a simple prediction off (RH) at Cabauw, in con-trast to other sites (e.g. Jungfraujoch), quite difficult. Here,continuous measurements off (RH) and/or better chemicalcomposition measurements would be desirable to better re-late dry measured values to the ambient ones. A closurestudy, which relied on the measured size distribution and thehygroscopic growth, showed the consistency of the aerosolin-situ measurements. The imaginary part of the retrievedcomplex refractive index was found to correlate well withthe hygroscopic growth factor of the HTDMA, which meansthat more absorbing particles grow less. As a proof of con-cept, the in-situ measurements were compared with remotesensing data from MAX-DOAS and LIDAR measurements.A good correlation was found between in-situ and MAX-DOAS measurements. For certain cases (low AOD and lowPBL height) good agreement was found, but for most of thetime MAX-DOAS retrieved a∼1.5–3.4 higher extinction co-efficient. Differences could have been caused by e.g. particle
Atmos. Chem. Phys., 11, 2603–2624, 2011 www.atmos-chem-phys.net/11/2603/2011/

P. Zieger et al.: Aerosol extinction coefficients at ambient conditions 2621
losses in the inlet system (all remote-sensing instrumentswere measuring generally higher extinction) or by the factthat the limited vertical resolution of the MAX-DOAS re-trieval overestimated the extinction in the lowest layer whenlofted layers were present. In addition, the MAX-DOAS re-trieval could have been influenced by the horizontal aerosolgradient, which could have exhibited large variations. Thesmaller slope of the regression line for the MPI measure-ments could indicate that the coarser resolution with moresimplified assumptions is a more robust MAX-DOAS aerosolretrieval. Lidar and in-situ comparison found to be in betteragreement, although the direct measurement of the ambientextinction coefficient started from an altitude above 750 m.Extrapolation with the backscatter signal showed a good cor-relation (R2
= 0.82−0.85) and a higher extinction comparedto in-situ (slope of 1.69-1.76), which improved (slope of1.12,R2
= 0.96) if only nighttime measurements were com-pared.
Acknowledgements.We thank Jacques Warmer and the staffof KNMI at the CESAR site for providing an excellent serviceduring our campaign. We thank the CINDI local organizationteam at KNMI, in particular Ankie Piters, Mark Kroon, andJennifer Hains, for facilitating this very successful campaign.We gratefully acknowledge Henk Klein-Baltink (KNMI) forproviding the ceilometer data. We also gratefully acknowledgethe easy access of the meteorological data used in this work viahttp://www.cesar-observatory.nl. We thank Rahel Fierz (PSI)for valuable discussions. Many thanks to Michel Tinquely (PSI)for helping out with the COSMO data, which was provided bythe Swiss Federal Office of Meteorology and Climatology (Me-teoSwiss). NILU and especially Ann Mari Fjæraa are gratefullyacknowledged for providing the air mass trajectories. Many thanksto A. Rozanov from the Institute of Environmental Physics, Uni-versity of Bremen, for providing the SCIATRAN radiative transfermodel to IUPHD. Hitoshi Irie thanks H. Takashima, Y. Kanaya, andPREDE, Co., Ltd for their technical assistance in developing andoperating the MAX-DOAS instrument. Observation by JAMSTECwas supported by the Japan EOS Promotion Program of theMinistry of Education, Culture, Sports, Science and Technology(MEXT), and by the Global Environment Research Fund (S-7) ofthe Japanese Ministry of the Environment. Katrijn Clemer (BIRA-IASB) was financially supported by the AGACC project (contractSD/AT/10A) funded by the Belgian Federal Science Policy Office.This work was financially supported by the ESA Climate ChangeInitiative Aerosolcci (ESRIN/Contract No. 4000101545/10/I-AM)and by the EC-projects Global Earth Observation and Monitor-ing (GEOmon, contract 036677) and European Supersites forAtmospheric Atmospheric Aerosol Research (EUSAAR, contract026140).
Edited by: A. Petzold
References
Ackermann, J.: The extinction-to-backscatter ratio of troposphericaerosols: a numerical study, J. Atmos. Ocean. Tech., 15, 1043–1050, 1998.
Anderson, T., Covert, D., Marshall, S., Laucks, M., Charlson, R.,Waggoner, A., Ogren, J., Caldow, R., Holm, R., Quant, F.,Sem, G., Wiedensohler, A., Ahlquist, N., and Bates, T.: Perfor-mance characteristics of a high-sensitivity, three-wavelength, to-tal scatter/backscatter nephelometer, J. Atmos. Oceanic Technol.,13, 967–986, 1996.
Ansmann, A., Wandinger, U., Riebesell, M., Weitkamp, C., andMichaelis, W.: Independent measurement of extinction andbackscatter profiles in cirrus clouds by using a combined Ramanelastic-backscatter lidar, Appl. Opt., 31, 7113–7131, 1992.
Apituley, A., Wilson, K.M., Potma, C., Volten, H., and de Graaf, M.:Performance Assessment and Application of Caeli – A high-performance Raman lidar for diurnal profiling of Water Vapour,Aerosols and Clouds, Proceedings of the 8th International Sym-posium on Tropospheric Profiling, 19–23 October 2009, Delft,The Netherlands, 2009.
Bond, T. C. and Bergstrom, R. W.: Light absorption by carbona-ceous particles: an investigative review, Aerosol Sci. Technol.,40(1), 27–67, 2006.
Birmili, W., Stopfkuchen, K., Hermann, M., Wiedensohler, A., andHeintzenberg, J.: Particle penetration through a 300 m inlet pipefor sampling atmospheric aerosols from a tall meteorologicaltower, Aerosol Sci. Technol., 41, 811–817, 2007.
Cantrell, C. A.: Technical Note: Review of methods for linear least-squares fitting of data and application to atmospheric chemistryproblems, Atmos. Chem. Phys., 8, 5477–5487,doi:10.5194/acp-8-5477-2008, 2008.
Carrico, C. M., Kus, P., Rood, M. J., Quinn, P. K., and Bates, T. S.:Mixtures of pollution, dust, sea salt, and volcanic aerosol duringACE-Asia: radiative properties as a function of relative humidity,J. Geophys. Res., 108(D23), 8650,doi:10.1029/2003JD003405,2003.
Clarke, A. D., Howell, S., Quinn, P. K., Bates, T. S., Ogren J. A.,Andrews, E., Jefferson, A., Massling, A., Mayol-Bracero, O.,Maring, H., Savoie, D., and Cass, G.: INDOEX aerosol: A com-parison and summary of chemical, microphysical, and opticalproperties observed from land, ship, and aircraft, J. Geophys.Res., 107, 8033, doi:803310.1029/2001JD000572, 2002.
Clemer, K., Van Roozendael, M., Fayt, C., Hendrick, F., Hermans,C., Pinardi, G., Spurr, R., Wang, P., and De Maziere, M.: Mul-tiple wavelength retrieval of tropospheric aerosol optical proper-ties from MAXDOAS measurements in Beijing, Atmos. Meas.Tech., 3, 863–878,doi:10.5194/amt-3-863-2010, 2010.
Collaud Coen, M., Weingartner, E., Apituley, A., Ceburnis, D.,Fierz-Schmidhauser, R., Flentje, H., Henzing, J. S., Jennings, S.G., Moerman, M., Petzold, A., Schmid, O., and Baltensperger,U.: Minimizing light absorption measurement artifacts of theAethalometer: evaluation of five correction algorithms, Atmos.Meas. Tech., 3, 457–474,doi:10.5194/amt-3-457-2010, 2010.
de Haij, M., Klein Baltink, H., and Wauben, W.: Continuous mixinglayer height determination using the LD40-ceilometer: a feasi-bility study, KNMI Scientific Report WR 2007-01, De Bilt, TheNetherlands, 2007.
de Haij, M., Wauben, W., Klein Baltink, H., and Apituley, A.: De-termination of the mixing layer height by a ceilometer, Proceed-
www.atmos-chem-phys.net/11/2603/2011/ Atmos. Chem. Phys., 11, 2603–2624, 2011

2622 P. Zieger et al.: Aerosol extinction coefficients at ambient conditions
ings of the 8th International Symposium on Tropospheric Profil-ing, 19–23 October, Delft, The Netherlands, edited by: Apituley,A., Russchenberg, H. W. J., Monna, W. A. A., ISBN 978-90-6960-233-2, 2010.
Deutschmann, T. and Wagner, T.: TRACY-II Users man-ual, available online at: http://joseba.mpch-mainz.mpg.de/Strahlungstransport.htm, 2008.
Ehn, M., Petaja, T., Aufmhoff, H., Aalto, P., Hameri, K., Arnold,F., Laaksonen, A., and Kulmala, M.: Hygroscopic properties ofultrafine aerosol particles in the boreal forest: diurnal variation,solubility and the influence of sulfuric acid, Atmos. Chem. Phys.,7, 211–222,doi:10.5194/acp-7-211-2007, 2007.
Ferrare, R. A., Melfi, S. H., Whiteman, D. N., Evans, K. D., andLeifer, R.: Raman lidar measurements of aerosol extinction andbackscattering, 1. Methods and comparisons, J. Geophys. Res.,103(D16), 19663–19672, 1998.
Fierz-Schmidhauser, R., Zieger, P., Gysel, M., Kammermann, L.,DeCarlo, P. F., Baltensperger, U., and Weingartner, E.: Measuredand predicted aerosol light scattering enhancement factors at thehigh alpine site Jungfraujoch, Atmos. Chem. Phys., 10, 2319–2333,doi:10.5194/acp-10-2319-2010, 2010a.
Fierz-Schmidhauser, R., Zieger, P., Vaishya, A., Monahan, C.,Bialek, J., O’Dowd, C.D., Jennings, S. G., Baltensperger, U., andWeingartner, E.: Light scattering enhancement factors in the ma-rine boundary layer (Mace Head, Ireland), J. Geophys. Res., 115,D20204,doi:10.1029/2009JD013755, 2010b.
Fierz-Schmidhauser, R., Zieger, P., Wehrle, G., Jefferson, A.,Ogren, J. A., Baltensperger, U., and Weingartner, E.: Mea-surement of relative humidity dependent light scattering ofaerosols, Atmos. Meas. Tech., 3, 39–50,doi:10.5194/amt-3-39-2010, 2010c.
Fitzgerald, J. W., Hoppel, W. A., and Vietti, M. A.: The size andscattering coefficient of urban aerosol particles at Washington,DC as a function of relative humidity, J. Atmos. Sci., 39, 1838–1852, 1982.
Freudenthaler, V.: The Telecover Test: A quality assurancetool for the optical part of a lidar system, available on-line at: http://www.meteo.physik.uni-muenchen.de/∼st212fre/ILRC24/index.html, Proc. of the 24th ILRC, Boulder, Colorado,USA, 23–27 June 2008.
Frieß, U., Monks, P. S., Remedios, J. J., Rozanov, A., Sinre-ich, R., Wagner, T., and Platt, U.: MAX-DOAS O4 measure-ments: A new technique to derive information on atmosphericaerosols: 2. Modeling studies, J. Geophys. Res., 111, D14203,doi:10.1029/2005JD006618, 2006.
Frieß, U., Clemer, K., Irie, H., Vlemmix, T., Wagner, T., Wittrock,F., Yilmaz, S., Zieger, P., and Apituley, A.: Intercomparisonof MAX-DOAS aerosol profile retrieval algorithms during theCINDI campaign, Atmos. Meas. Tech. Discuss., in preparation,2011.
Gysel, M., McFiggans, G., and Coe, H.: Inversion of tandem differ-ential mobility analyser (TDMA) measurements, J. Aerosol Sci.,40, 134–151,doi:10.1016/j.jaerosci.2008.07.013, 2009.
Heckel, A., Richter, A., Tarsu, T., Wittrock, F., Hak, C., Pundt, I.,Junkermann, W., and Burrows, J. P.: MAX-DOAS measurementsof formaldehyde in the Po-Valley, Atmos. Chem. Phys., 5, 909–918,doi:10.5194/acp-5-909-2005, 2005.
Hess, M. P., Koepke, P., and Schultz, I.: Optical properties ofaerosols and clouds: The software package OPAC, Bull. Mete-
orol. Soc., 79, 831–844, 1998.Holben, B. N., Eck, T. F., Slutsker, I., Tanre, D., Buis, J. P., Set-
zer, A., Vermote, E., Reagan, J. A., Kaufman, Y. J., Nakajima, T.,Lavenu, F., Jankowiak, I., and Smimov, A.: AERONET -A fed-erated instrument network and data archive for aerosol character-ization, Remote Sens. Environ., 66(l), 1–16, 1998.
Honninger, G. and Platt, U.: Observations of BrO and its verticaldistribution during surface ozone depletion at Alert, Atmos. En-viron., 36, 2481–2490, 2002.
Honninger, G., von Friedeburg, C., and Platt, U.: Multi axis dif-ferential optical absorption spectroscopy (MAX-DOAS), Atmos.Chem. Phys., 4, 231–254,doi:10.5194/acp-4-231-2004, 2004.
Irie, H., Kanaya, Y., Akimoto, H., Iwabuchi, H., Shimizu, A., andAoki, K.: First retrieval of tropospheric aerosol profiles usingMAX-DOAS and comparison with lidar and sky radiometer mea-surements, Atmos. Chem. Phys., 8, 341–350,doi:10.5194/acp-8-341-2008, 2008.
Irie, H., Kanaya, Y., Akimoto, H., Iwabuchi, H., Shimizu, A.,and Aoki, K.: Dual-wavelength aerosol vertical profile measure-ments by MAX-DOAS at Tsukuba, Japan, Atmos. Chem. Phys.,9, 2741–2749,doi:10.5194/acp-9-2741-2009, 2009.
Iwabuchi, H.: Efficient Monte Carlo methods for radiative transfermodeling, J. Atmos. Sci., 63(9), 2324–2339, 2006.
Kohler, H.: The nucleus and growth of hygroscopic droplets,Trans. Faraday Soc., 32, 1152–1161, 1936.
Kotchenruther, R. A. and Hobbs, P. V.: Humidification factorsof aerosols from biomass burning in Brazil, J. Geophys. Res.,103(D24), 32081–32089, 1998.
Leser, H., Honninger, G., and Platt, U.: MAX-DOAS measure-ments of BrO and NO2 in the marine boundary layer, Geophys.Res. Lett., 30(10), 1537,doi:10.1029/2002GL015811, 2003.
Li, X., Brauers, T., Shao, M., Garland, R. M., Wagner, T.,Deutschmann, T., and Wahner, A.: MAX-DOAS measurementsin southern China: retrieval of aerosol extinctions and validationusing ground-based in-situ data, Atmos. Chem. Phys., 10, 2079–2089,doi:10.5194/acp-10-2079-2010, 2010.
Liu, B. Y. H., Pui, D. Y. H., Whitby, K. T., Kittelson, D. B.,Kousaka, Y., and McKenzie, R. L.: Aerosol mobility chromato-graph – new detector for sulfuric-acid aerosols, Atmos. Environ.,12, 99–104, 1978.
Ming, Y. and Russell, L.: Predicted hygroscopic growth of sea saltaerosol, J. Geophys. Res., 106(D22), 28259–28274, 2001.
Morgan, W. T., Allan, J. D., Bower, K. N., Esselborn, M., Har-ris, B., Henzing, J. S., Highwood, E. J., Kiendler-Scharr, A.,McMeeking, G. R., Mensah, A. A., Northway, M. J., Osborne,S., Williams, P. I., Krejci, R., and Coe, H.: Enhancement of theaerosol direct radiative effect by semi-volatile aerosol compo-nents: airborne measurements in North-Western Europe, Atmos.Chem. Phys., 10, 8151–8171,doi:10.5194/acp-10-8151-2010,2010.
Muller, D., Ansmann, A., Mattis, I., Tesche, M., Wandinger, U.,Althausen, D., and Pisani, G.: Aerosol-type-dependent lidar ra-tios observed with Raman lidar, J. Geophys. Res., 112(D16202),1–11, 1997.
Muller, T., Henzing, J. S., de Leeuw, G., Wiedensohler, A.,Alastuey, A., Angelov, H., Bizjak, M., Collaud Coen, M., En-gstrom, J. E., Gruening, C., Hillamo, R., Hoffer, A., Imre, K.,Ivanow, P., Jennings, G., Sun, J. Y., Kalivitis, N., Karlsson, H.,Komppula, M., Laj, P., Li, S.-M., Lunder, C., Marinoni, A., Mar-
Atmos. Chem. Phys., 11, 2603–2624, 2011 www.atmos-chem-phys.net/11/2603/2011/

P. Zieger et al.: Aerosol extinction coefficients at ambient conditions 2623
tins dos Santos, S., Moerman, M., Nowak, A., Ogren, J. A., Pet-zold, A., Pichon, J. M., Rodriquez, S., Sharma, S., Sheridan,P. J., Teinila, K., Tuch, T., Viana, M., Virkkula, A., Weingart-ner, E., Wilhelm, R., and Wang, Y. Q.: Characterization and in-tercomparison of aerosol absorption photometers: result of twointercomparison workshops, Atmos. Meas. Tech., 4, 245–268,doi:10.5194/amt-4-245-2011, 2011.
Nessler, R., Weingartner, E., and Baltensperger, U.: Adaptationof dry nephelometer measurements to ambient conditions at theJungfraujoch, Environ. Sci. Technol., 39, 2219–2228, 2005a.
Nessler, R., Weingartner, E., and Baltensperger, U.: Effect of hu-midity on aerosol light absorption and its implications for ex-tinction and the single scattering albedo illustrated for a site inthe lower free troposphere, J. Aerosol Sci., 36, 958–972, 2005b.
Petters, M. D. and Kreidenweis, S. M.: A single parameter repre-sentation of hygroscopic growth and cloud condensation nucleusactivity, Atmos. Chem. Phys., 7, 1961–1971,doi:10.5194/acp-7-1961-2007, 2007.
Petzold, A. and Schonlinner, M.: Multi-angle absorption photome-try – a new method for the measurement of aerosol light absorp-tion and atmospheric black carbon, J. Aerosol Sci., 35, 421–441,2004.
Philippin, S., Laj, P., Putaud, J.-P., Wiedensohler, A., de Leeuw, G.,Fjaeraa, A. M., Platt, U., Baltensperger, U., Fiebig, M.: EU-SAAR – An unprecedented network of aerosol observation inEurope. Earozoru Kenkyu, JAAST, 24(2), 78–83, 2009.
Piters, A., Hains, J., Boersma, F., Kroon, M., Wittrock, F., vanRoozendael, M.: The Cabauw Intercomparison campaign for Ni-trogen Dioxide Measuring Instruments (CINDI), June/July 2009,The Netherlands, Atmos. Meas. Tech. Discuss., in preparation,2010.
Platt, U. and Stutz, J.: Differential Optical Absorption Spec-troscopy: Principles and Applications, Springer-Verlag, Berlin,Germany, 2008.
Rodgers, C. D.: Inverse Methods for Atmospheric Sounding: The-ory and Practice, Ser. Atmos. Oceanic Planet. Phys., vol. 2, F. W.Taylor, World Sci., Hackensack, NY, USA, 2000.
Roscoe, H. K., Van Roozendael, M., Fayt, C., du Piesanie, A.,Abuhassan, N., Adams, C., Akrami, M., Cede, A., Chong, J.,Clmer, K., Friess, U., Gil Ojeda, M., Goutail, F., Graves, R.,Griesfeller, A., Grossmann, K., Hemerijckx, G., Hendrick, F.,Herman, J., Hermans, C., Irie, H., Johnston, P. V., Kanaya, Y.,Kreher, K., Leigh, R., Merlaud, A., Mount, G. H., Navarro,M., Oetjen, H., Pazmino, A., Perez-Camacho, M., Peters, E.,Pinardi, G., Puentedura, O., Richter, A., Schnhardt, A., Shaigan-far, R., Spinei, E., Strong, K., Takashima, H., Vlemmix, T.,Vrekoussis, M., Wagner, T., Wittrock, F., Yela, M., Yilmaz, S.,Boersma, F., Hains, J., Kroon, M., Piters, A., and Kim, Y. J.: In-tercomparison of slant column measurements of NO2 and O4 byMAX-DOAS and zenith-sky UV and visible spectrometers, At-mos. Meas. Tech., 3, 1629–1646,doi:10.5194/amt-3-1629-2010,2010.
Rozanov, A., Rozanov, V., and Burrows, J. P.: A numerical radiativetransfer model for a spherical planetary atmosphere: combineddifferential-integral approach involving the Picard iterative ap-proximation, J. Quant. Spec. Rad. Trans., 69, 491–512, 2001.
Russchenberg, H. W. J., Bosveld, F., Swart, D. P. J., ten Brink, H.,de Leeuw, G., Uijlenhoet, R., Arbesser-Rastburg, B., van derMarel, H., Ligthart, L., Boers, R., and Apituley, A.: Ground-
based atmospheric remote sensing in The Netherlands; Euro-pean outlook, IEICE Transactions on Communications, E88-B(6), 2252–2258,doi:10.1093/ietcom/e88-b.6.2252, 2005.
Salemink, H. W. M., Schotanus, P., and Bergwerff, J. B.: Quantita-tive lidar at 532 nm for vertical extinction profiles and the effectof relative humidity, Appl. Phys., 34, 187–189, 1984.
Sheridan, P. J., Delene, D. J., and Ogren, J. A.: Four years of con-tinuous surface aerosol measurements from the Department ofEnergy’s Atmospheric Radiation Program Southern Great PlainsCloud and Radiation Testbed site, J. Geophys. Res., 106, 20735–20747, 2001.
Sinreich, R., Frieß, U., Wagner, T., and Platt, U.: Multi axisdifferential optical absorption spectroscopy (MAX-DOAS) ofgas and aerosol distributions, Faraday Discuss., 130, 153–164,doi:10.1039/b419274, 2005.
Sjogren, S., Gysel, M., Weingartner, E., Baltensperger, U., Cubison,M. J., Coe, H., Zardini, A. A., Marcolli, C., Krieger, U. K., andPeter, T.: Hygroscopic growth and water uptake kinetics of two-phase aerosol particles consisting of ammonium sulfate, adipicand humic acid mixtures, J. Aerosol Sci., 38, 157–171, 2007.
Spurr, R.: LIDORT and VLIDORT: Linearized pseudo-sphericalscalar and vector discrete ordinate radiative transfer models foruse in remote sensing retrieval problems, Light Scattering Re-views, Volume 3, edited by: Kokhanovsky, A., Springer BerlinHeidelberg, Germany, 229–275, 2008.
Stohl, A. and Seibert, P.: Accuracy of trajectories as determinedfrom the conservation of meteorological tracers, Q. J. Roy. Me-teorol. Soc., 124, 1465–1484, 1998.
Stohl, A., Wotawa, G., Seibert, P., and Kromp-Kolb, H.: Interpo-lation errors in wind fields as a function of spatial and temporalresolution and their impact on different types of kinematic tra-jectories, J. Appl. Meteorol., 34, 2149–2165, 1995.
Sundstrom , A.-M., Nousiainen, T., and Petaja, T.: On the quantita-tive low-level aerosol measurements using ceilometer-type lidar,J. Atmos. Ocean. Technol., 26, 2340–2352, 2009.
Swietlicki, E., Hansson, H. C., Hameri, K., Svenningsson, B.,Massling, A., McFiggans, G., McMurry, P. H., Petaja, T.,Tunved, P., Gysel, M., Topping, D., Weingartner, E., Bal-tensperger, U., Rissler, J., Wiedensohler, A., and Kulmala, M.:Hygroscopic properties of submicrometer atmospheric aerosolparticles measured with H-TDMA instruments in various envi-ronments – a review, Tellus, 60B, 432–469, 2008.
Van Roozendael, M., Fayt, C., Post, P., Hermans, C., and Lambert,J.-C.: Retrieval of BrO and NO2 from UV-Visible Observations,in: Sounding the troposphere from space: a new era for atmo-spheric chemistry, Springer-Verlag, ISBN 3-540-40873-8, editedby: Borell, P., Borrell, P. M., Burrows, J. P., and Platt, U., 2003.
Voss, K. J., Welton, J. E. J., Quinn, P. K., Frouin, R., Miller, M., andReynolds, R. M.: Aerosol optical depth measurements duringthe Aerosols99 experiment, J. Geophys. Res., 106(D18), 20811–20819, 2001.
Wagner, T., Dix, B., Friedeburg, v.C., Frieß, U., Sanghavi, S., Sin-reich, R., and Platt, U.: MAX-DOAS O4 measurements: A newtechnique to derive information on atmospheric aerosols Princi-ples and information content, J. Geophys. Res., 109, D22205,doi:10.1029/2004JD004904, 2004.
Wagner, T., Deutschmann, T., and Platt, U.: Determination ofaerosol properties from MAX-DOAS observations of the Ringeffect, Atmos. Meas. Tech., 2, 495–512,doi:10.5194/amt-2-495-
www.atmos-chem-phys.net/11/2603/2011/ Atmos. Chem. Phys., 11, 2603–2624, 2011

2624 P. Zieger et al.: Aerosol extinction coefficients at ambient conditions
2009, 2009.Wagner, T., Beirle, S., Brauers, T., Deutschmann, T., Frieß, U., Hak,
C., Halla, J. D., Heue, K. P., Junkermann, W., Li, X., Mettendorf,K.-U., Platt, U., and Pundt, I.: Inversion of tropospheric profilesof aerosol extinction and HCHO and NO2 mixing ratios fromMAX-DOAS observations in Milano in summer 2003 and com-parison with independent data sets, in preparation, 2011.
Wang, W., Rood, M. J., Carrico, C. M., Covert, D. S., Quinn, P. K.,and Bates, T. S.: Aerosol optical properties along the northeastcoast of North America during the New England Air QualityStudy – Intercontinental Transport and Chemical Transformation2004 campaign and the influence of aerosol composition, J. Geo-phys. Res., 112, D10S23,doi:10.1029/2006JD007579, 2007.
Weingartner, E., Burtscher, H., and Baltensperger, U.: Hygroscopicproperties of carbon and diesel soot particles, Atmos. Environ.,31(15), 2311–2327, 1997.
Weingartner, E., Saathoff, H., Schnaiter, M., Streit, N., Bitnar, B.,and Baltensperger, U.: Absorption of light by soot particles: De-termination of the absorption coefficient by means of aethalome-ters, J. Aerosol Sci., 34, 1445–1465, 2003.
Winklmayr, W., Reischl, G., Lindner, A., and Berner, A.: A newelectromobility spectrometer for the measurement of aerosol sizedistributions in the size range from 1 to 1000 nm, J. Aerosol Sci.,22(3), 289–296,doi:10.1016/S0021-8502(05)80007-2, 1991.
Wittrock, F., Oetjen, H., Richter, A., Fietkau, S., Medeke, T.,Rozanov, A., and Burrows, J. P.: MAX-DOAS measurementsof atmospheric trace gases in Ny-Alesund – Radiative transferstudies and their application, Atmos. Chem. Phys., 4, 955–966,doi:10.5194/acp-4-955-2004, 2004.
WMO/GAW: Aerosol Measurement Procedures Guidelines andRecommendations, GAW Report No. 153, World MeteorologicalOrganization Global Atmosphere Watch, Geneva, Switzerland,2003.
Yan, P., Pan, X. L., Tang, J., Zhou, X. J., Zhang, R. J., andZeng, L. M.: Hygroscopic growth of aerosol scattering coeffi-cient: a comparative analysis between urban and suburban sitesat winter in Beijing, Particuology, 7, 52–60, 2009.
York, D., Evensen, N. M., Lopez Martinez, M., and De Basabe Del-gado, J.: Unified equations for the slope, intercept, and standarderrors of the best straight line, Am. J. Phys., 72(3), 367–375,2004.
Zieger, P., Fierz-Schmidhauser, R., Gysel, M., Strom, J., Henne, S.,Yttri, K. E., Baltensperger, U., and Weingartner, E.: Effects ofrelative humidity on aerosol light scattering in the Arctic, At-mos. Chem. Phys., 10, 3875–3890,doi:10.5194/acp-10-3875-2010, 2010.
Atmos. Chem. Phys., 11, 2603–2624, 2011 www.atmos-chem-phys.net/11/2603/2011/