comparative study on dynamic analysis of medium and high rise rc structure … · 2016-12-28 ·...
TRANSCRIPT

International Research Journal of Engineering and Technology (IRJET) e-ISSN: 2395 -0056
Volume: 03 Issue: 12 | Dec -2016 www.irjet.net p-ISSN: 2395-0072
© 2016, IRJET | Impact Factor value: 4.45 | ISO 9001:2008 Certified Journal | Page 567
COMPARATIVE STUDY ON DYNAMIC ANALYSIS OF MEDIUM AND HIGH
RISE RC STRUCTURE WITH AND WITHOUT BASE ISOLATION
Garipally Prashanth Kumar (M.Tech)
Dept. of Civil Engineering, Indur Institute of Engineering & Technology, Siddipet,Telangana State, India
---------------------------------------------------------------------***---------------------------------------------------------------------
Abstract- The seismic isolation system is mounted beneath the superstructure and is referred as ‘Base Isolation’. The main aim of using Base isolation is to separating (“isolating”) the structure from the ground to reduce the inertia forces introduced in the structure due to earthquake and lateral forces of an earthquake. Here lead rubber bearing base isolation which is designed to take the weight of the building and let the foundations move sideways during an earthquake. In the paper a parametric study on Reinforced Concrete (RC) building medium rise(G+4 storied frame structure) and high rise(G+14 storied frame structure) building with fixed and isolated base with lead rubber bearing (LRB) are carried out using time history analysis. To evaluate the seismic response of the buildings is performed using the computer program ETABS2015
Keywords: Base Isolation, Lead Rubber Bearing
1. INTRODUCTION
1.1 BACKGROUND
For seismic design of building structures, the traditional method, i.e., strengthening the stiffness, strength, and
ductility of the structures, has been in common use for a long time. Therefore, the dimensions of structural
members and the consumption of material are expected to be increased, which leads to higher cost of the buildings
as well as larger seismic responses due to larger stiffness of the structures. Thus, the efficiency of the traditional
method is constrained. To overcome these disadvantages associated with the traditional method, many vibration-
control measures, called structural control, have been studied and remarkable advances in this respect have been
made over recent years.
Structural Control is a diverse field of study. Structural Control is the one of the areas of current research aims
to reduce structural vibrations during loading such as earthquakes and strong winds. In terms of different vibration
absorption methods, structural control can be classified into active control, passive control, hybrid control, semi-
active control and so on. The passive control is more studied and applied to the existing buildings than the others.
Base isolation is a passive vibration control system that does not require any external power source for its
operation and utilizes the motion of the structure to develop the control forces. Performance of base isolated
buildings in different parts of the world during earthquakes in the recent past established that the base isolation
technology is a viable alternative to conventional earthquake-resistant design of medium-rise buildings.
International Research Journal of Engineering and Technology (IRJET) e-ISSN: 2395 -0056
Volume: 03 Issue: 12 | Dec -2016 www.irjet.net p-ISSN: 2395-0072
© 2016, IRJET | Impact Factor value: 4.45 | ISO 9001:2008 Certified Journal | Page 568
The application of this technology may keep the building to remain essentially elastic and thus ensure safety
during large earthquakes. Since a base-isolated structure has fundamental frequency lower than both its fixed base
frequency and the dominant frequencies of ground motion, the first mode of vibration of isolated structure involves
deformation only in the isolation system whereas superstructure remains almost rigid. In this way, the isolation
becomes an attractive approach where protection of expensive sensitive equipment’s and internal non-structural
components is needed. It was of interest to check the difference between the responses of a fixed-base building
frame and the isolated-base building frame under seismic loading. This was the primary motivation of the present
study.
1.2 IMPORTANCE OF PRESENT STUDY:
Civil Engineers are still unable to rigorously predict even in a probabilistic way the loads which structures may have
to withstand during their useful life. All structures are subjected to vibration. Recent destructive earthquakes in
California and Japan have shown how vulnerable our structures and societies remain to natural phenomena. The
enormous losses inflicted by such catastrophes have motivated ever more stringent requirements on the
performance of structural systems, in an effort to reduce the cost of repair and disruption. The cost and
performance requirements for both buildings and equipment have motivated advances in the field of Structural
Control, which deals with methodologies for the protection of high performance structural systems. The vibration
isolator is a device that is designed to effectively isolate such structures from harmful vibrations.
1.3 VIBRATION CONTROL:
Vibration control is the mechanism to mitigate vibrations by reducing the mechanical interaction between the
vibration source and the structure, equipment etc. to be protected. Structural control relies on stiffness (i.e. energy
storage) and damping (i.e. energy absorption/dissipation) devices in a structure to control its response to
undesirable excitations caused by winds and moderate earthquakes. This control has, in most cases, been achieved
passively by means of bracing systems and shear walls, which do not require any additional external energy input.
More recently, we have seen the emergence of more modem passive structural control systems. The tuned mass
damper and base isolation systems are examples of such relatively modern passive systems.
1.4 BASE ISOLATION OF STRUCTURES
1.4.1 Concept of base isolation
Base isolation technology works by separating or reducing the lateral movement of a building’s superstructure from
the movement of the ground/foundation during an earthquake event. To allow for this difference in lateral
movement while still supporting the weight of the superstructure, base isolation bearings are designed to be very
flexible laterally while being stiff vertically. This base condition is in contrast to a typical fixed-base structure, in
International Research Journal of Engineering and Technology (IRJET) e-ISSN: 2395 -0056
Volume: 03 Issue: 12 | Dec -2016 www.irjet.net p-ISSN: 2395-0072
© 2016, IRJET | Impact Factor value: 4.45 | ISO 9001:2008 Certified Journal | Page 569
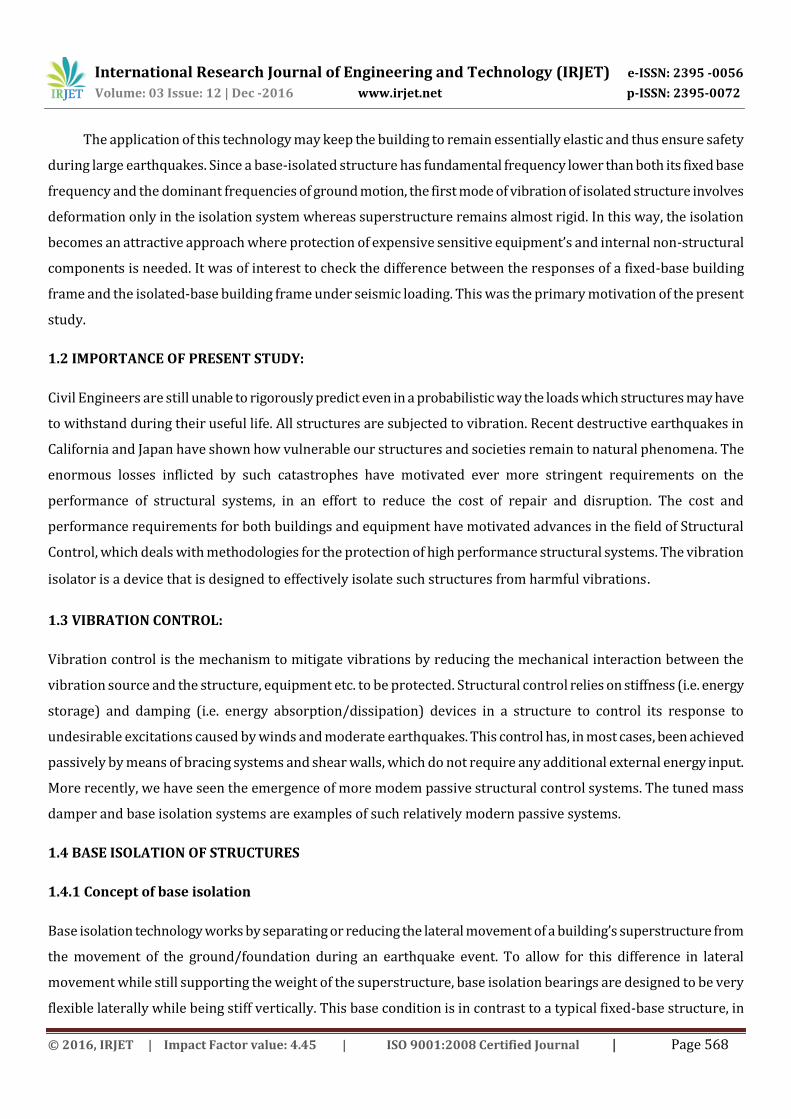
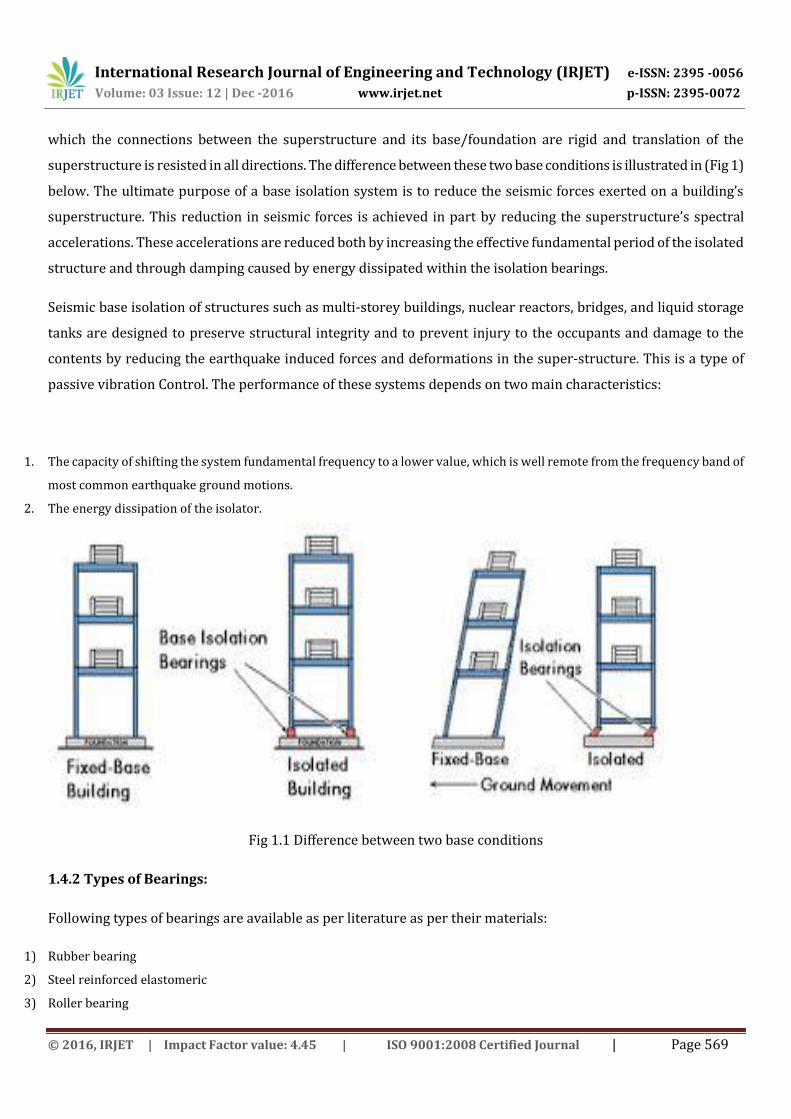
which the connections between the superstructure and its base/foundation are rigid and translation of the
superstructure is resisted in all directions. The difference between these two base conditions is illustrated in (Fig 1)
below. The ultimate purpose of a base isolation system is to reduce the seismic forces exerted on a building’s
superstructure. This reduction in seismic forces is achieved in part by reducing the superstructure’s spectral
accelerations. These accelerations are reduced both by increasing the effective fundamental period of the isolated
structure and through damping caused by energy dissipated within the isolation bearings.
Seismic base isolation of structures such as multi-storey buildings, nuclear reactors, bridges, and liquid storage
tanks are designed to preserve structural integrity and to prevent injury to the occupants and damage to the
contents by reducing the earthquake induced forces and deformations in the super-structure. This is a type of
passive vibration Control. The performance of these systems depends on two main characteristics:
1. The capacity of shifting the system fundamental frequency to a lower value, which is well remote from the frequency band of
most common earthquake ground motions.
2. The energy dissipation of the isolator.
Fig 1.1 Difference between two base conditions
1.4.2 Types of Bearings:
Following types of bearings are available as per literature as per their materials:
1) Rubber bearing
2) Steel reinforced elastomeric
3) Roller bearing

International Research Journal of Engineering and Technology (IRJET) e-ISSN: 2395 -0056
Volume: 03 Issue: 12 | Dec -2016 www.irjet.net p-ISSN: 2395-0072
© 2016, IRJET | Impact Factor value: 4.45 | ISO 9001:2008 Certified Journal | Page 570
4) Rocker bearing
5) Pot bearing
6) Disc bearing
7) Spherical and cylindrical bearing
Rubbers are further divided into four categories,
a) Rubber Bearing
b) Steel laminated rubber bearing (RB).
c) Lead rubber Bearing (LRB).
d) High damping rubber bearing (HDRB).
1.4.3 Lead rubber bearing (LRB):
Lead Rubber Bearing or LRB is one type of elastomeric bearing. This type of bearing consists of a lead core at center
of the bearing and thin layers of steel plates and high damping rubber built in alternate layers. Horizontal stiffness
of the bearing is controlled by the low shear modulus of elastomeric while steel plates and lead core provides high
vertical stiffness as well as prevent bulging of rubber. The vertical stiffness of the bearing is several hundred times
of the horizontal stiffness due to the presence of internal steel plates and lead core.
Multilayer construction rather than single layer rubber pads provides better vertical rigidity for supporting a
building. With the help of LRB earthquake vibration is converted to low speed motion. As horizontal stiffness of the
multi- layer rubber bearing is low, strong earthquake vibration is lightened and the oscillation period of the
building is increased. Horizontal elasticity of LRB returns the building to its original position. In a LRB, elasticity
mainly comes from restoring force of the rubber layers.
Fig 1.2 lead rubber bearing (LRB)

International Research Journal of Engineering and Technology (IRJET) e-ISSN: 2395 -0056
Volume: 03 Issue: 12 | Dec -2016 www.irjet.net p-ISSN: 2395-0072
© 2016, IRJET | Impact Factor value: 4.45 | ISO 9001:2008 Certified Journal | Page 571
1.5 RESPONSE OF THE BUILDING UNDER EARTHQUAKE.
1.5.1 Building frequency and period:
The magnitude of Building response mainly accelerations depends primarily upon the frequencies of input ground
motions and Buildings natural frequency. When these are equal or nearly equal to one another, the buildings
response reaches a peak level. In some cases, this dynamic amplification level can increase the building acceleration
to a value two times or more that of ground acceleration at the base of the building. Generally buildings with higher
natural frequency and a short natural period tend to suffer higher accelerations and smaller displacement.
Buildings with lower natural frequency and a long natural period tend to suffer lower accelerations and larger
displacement. When the frequency content of the ground motion is around the building’s natural frequency, it is
said that the building and the ground motion are in resonance with one another. Resonance tend to increase or
amplify the building response by which buildings suffer the greatest damage from ground motion at a frequency
close to its own natural frequency.
1.5.2 Building stiffness:
Taller the building, longer the natural period and the building is more flexible than shorter building.
1.5.3 Ductility:
Ductility is the ability to undergo distortion or deformation without complete breakage or failure. In order to be
earthquake resistant the building will possess enough ductility to withstand the size and type of earthquake it is
likely to experience during its lifetime.
1.5.4 Damping:
All buildings possess some intrinsic damping. Damping is due to internal friction and adsorption of energy by
buildings structural and non- structural components. Earthquake resistant design and construction employ added
damping devices like shock absorbers to supplement artificially the intrinsic damping of a building.
1.6 INTRODUCTION ABOUT ETABS:
ETABS is the Extended three – dimensional analysis of building systems.
ETABS is a sophisticated, yet easy to use, special purpose analysis and design program Developed specifically for
building systems. ETABS features an intuitive and powerful Graphical interface coupled with unmatched modeling,
analytical, and design procedures, All integrated using a common database. Although quick and easy for simple
structures, ETABS can also handle the largest and most complex building models, including a wide Range of
geometrical nonlinear behaviors, making it the tool of choice for structural engineers in the building industry. The
International Research Journal of Engineering and Technology (IRJET) e-ISSN: 2395 -0056
Volume: 03 Issue: 12 | Dec -2016 www.irjet.net p-ISSN: 2395-0072
© 2016, IRJET | Impact Factor value: 4.45 | ISO 9001:2008 Certified Journal | Page 572
accuracy of analytical modeling of complex Wall Systems have always been of concern to the Structural Engineer.
The computer models of
These systems are usually idealized as line elements instead of continuum elements. Single walls are modeled as
cantilevers and walls with openings are modeled as pier and Spandrel systems. For simple systems, where lines of
stiffness can be defined, these models can give a reasonable result.
However, it has always been recognized that continuum model based upon the finite element method is more
appropriate and desirable. Nevertheless this option has been impractical for the Structural Engineer to use In
practice primarily because such models have traditionally been costly to create, but more importantly, they do not
produce information that is directly useable by the Structural Engineer.
However, new developments in ETABS using object based modeling of simple and complex wall systems, in an
integrated single interface environment, has made it very practical for Structural Engineers to use finite element
models routinely in their practice. Wall is a vertical load bearing member whose length Exceeds four times its
thickness. Un-braced wall is designed to carry lateral loads (horizontal loads) in addition to vertical loads. Braced
wall does not carry any lateral loads (horizontal loads).
All horizontal loads are carried by principal structural bracings or lateral supports. Reinforced wall contains at
least the minimum quantities for reinforcement. Plain walls contain either no reinforcement or less than the
minimum quantity of reinforcement. The wall which is investigated in this research is consisting of several
separated blocks which are placed in such a way that they form an infill wall for IBS construction.
Recently the application of precast components in construction of many structures is accelerating due to its
simplicity for fabrication and saving in time and labor force of many construction projects.IBS is a construction
technique where components are manufactured in a controlled environment (on or off site), transported,
positioned and assembled into a structure with minimal additional site works. For nearly30 years, ETABS has been
recognized as the industry standard for Building Analysis and Design Software. Today, continuing in the same
tradition, ETABS has evolved into a completely integrated building analysis and design environment. The system
built around a physical object based graphical user interface, powered by targeted new special purpose algorithms
for analysis and design, with interfaces for drafting and manufacturing, is redefining standards of integration,
productivity and technical innovation.
The integrated model can include moment resisting frames, braced frames, staggered truss systems,
frames with reduced beam sections or side plates, rigid and flexible floors, sloped roofs, ramps and parking
structures, mezzanine floors, and multiple tower buildings and stepped diaphragm systems with complex concrete,
composite or steel joist floor framing systems. Solutions to complex problems such a spaniel zone deformations,
diaphragm shear stresses, and construction sequence loading are now at your fingertips. ETABS is the solution,
International Research Journal of Engineering and Technology (IRJET) e-ISSN: 2395 -0056
Volume: 03 Issue: 12 | Dec -2016 www.irjet.net p-ISSN: 2395-0072
© 2016, IRJET | Impact Factor value: 4.45 | ISO 9001:2008 Certified Journal | Page 573
whether you are designing a simple2D frame or performing a dynamic analysis of a complex high-rise that utilizes
nonlinear dampers for understory Drift control.
1.7 SEISMIC ANALYSIS:
Seismic analysis is a subset of structural analysis and is the calculation of the response of a building (or
non-building) structure to earthquakes. It is part of the process of structural design, earthquake engineering or
structural assessment and retrofit (see structural engineering) in regions where earthquakes are prevalent.
As seen in the figure, a building has the potential to ‗wave ‘back and forth during an earthquake (or even a
severe wind storm). This is called the ‗fundamental mode‘, and is the lowest frequency of building response. Most
buildings, however, have higher modes of response, which are uniquely activated during earthquakes. The figure
just shows the second mode, but there are higher ‗shimmy‘(abnormal vibration) modes. Nevertheless, the first and
second modes tend to cause the most damage in most cases.
The earliest provisions for seismic resistance were the requirement to design for a lateral force equal to a
proportion of the building weight (applied at each floor level).This approach was adopted in the appendix of the
1927 Uniform Building Code (UBC), which was used on the west coast of the USA. It later became clear that the
dynamic properties of the structure affected the loads generated during an earthquake. In the Los Angeles County
Building Code of 1943 a provision to vary the load based on the number of floor levels was adopted (based on
research carried out at Caltech in collaboration with Stanford University and the U.S. Coast and Geodetic Survey,
which started in 1937). The Concept of "response spectra" was developed in the 1930s, but it wasn't until 1952 that
a Joint committee of the San Francisco Section of the ASCE and the Structural Engineers Association of Northern
California (SEAONC) proposed using the building period (the Inverse of the frequency) to determine lateral forces.
[1]
Earthquake engineering has developed a lot since the early days, and some of the more complex designs now use
special earthquake protective elements either just in the foundation (base isolation) or distributed throughout the
structure. Analyzing these types of structures requires specialized explicit finite element computer code, which
divides time into very small slices and models the actual physics, much like common videogames often have
"physics engines". Very large and complex buildings can be modeled in this way (such as the Osaka International
Convention Center).

International Research Journal of Engineering and Technology (IRJET) e-ISSN: 2395 -0056
Volume: 03 Issue: 12 | Dec -2016 www.irjet.net p-ISSN: 2395-0072
© 2016, IRJET | Impact Factor value: 4.45 | ISO 9001:2008 Certified Journal | Page 574
2. MODELLING:
2.1. MODELLING:
The modeling procedure of fixed base and base isolated building in ETABS2015 and design steps of
isolators and linear static analysis using UBC 97 for isolated building has been carried out and seismic design
procedure has been done using IS 1893:2002 (Part 1), for that the following data is used.
Models are symmetrical plan with medium rise structure (G+ 4 storied frame structures) and high rise
structure (G+14 storied frame structure). For symmetrical structures 4 bays in x-direction 5 bays in y-direction.
Plans applied base isolation.
Group-1 Symmetrical plan with medium (G+4) and high (G+14) rise structure.
Group-2 Lead rubber bearing isolators are applied to symmetrical plan of both medium and high rise structure.
3.1.1 RC structure details for (G+4) & (G+14):
General details of RC structure (G+4) with and without base isolation.
1. Grade of Concrete – M25, Steel Grade – Fe500
2. Floor to Floor height is 3m, Plinth height above GL is 0.5m
3. External wall thickness = 230mm, Internal wall thickness = 115mm,
4. Size of Columns = 300X450 mm, Size of Beams = 230*450mm
5. Live load on floor = 3 KN/m², Live load on Roof = 1.5 KN/m²
6. Site located in Seismic zone 2, i.e. Z= 0.1
7. Building is resting on medium soil, Take importance factor as 1.
8. Building frame type – OMRF, Density of Concrete = 25 KN/m³
General details of RC structure (G+14) with and without base isolation.
1. Grade of Concrete – M25, Steel Grade – Fe500
2. Floor to Floor height is 3m, Plinth height above GL is 0.5m
3. External wall thickness = 230mm, Internal wall thickness = 115mm,
4. Size of Columns = 450X650 mm, Size of Beams = 300*450mm
5. Live load on floor = 3 KN/m², Live load on Roof = 1.5 KN/m²
6. Site located in Seismic zone 2, i.e. Z= 0.1
7. Building is resting on medium soil, Take importance factor as 1.
8. Building frame type – OMRF, Density of Concrete = 25 KN/m³

International Research Journal of Engineering and Technology (IRJET) e-ISSN: 2395 -0056
Volume: 03 Issue: 12 | Dec -2016 www.irjet.net p-ISSN: 2395-0072
© 2016, IRJET | Impact Factor value: 4.45 | ISO 9001:2008 Certified Journal | Page 575
2.1.2 Load Calculations for Both (G+4) & (G+14):
1. Dead Loads:
230mm thick wall load = 0.23x2.55x20 = 11.73Kn/m2 = 12 Kn/m
115mm thick wall load = 0.115x2.55x20 = 5.865Kn/m2 = 6 Kn/m
230mm thick parapet wall load = 0.23x1.0x20 = 4.6Kn/m
Floor Finish Load = 1Kn/m2
Dead loads on staircase landing Beams (1st & 3rd Flights) = (4.75x3.71)/2 = 8.81 Kn/m
Dead loads on staircase landing Beams (2nd Flight) = (4.75x5.00)/2 = 11.875 Kn/m
2. Live Loads (As Per IS 875 PART-2):
LL for floors (except Top Floor) = 3Kn/m2
LL for Top Floor = 2Kn/m2
LL for Staircase = 3Kn/m2
Live loads on staircase landing Beams (1st & 3rd Flights) = (3.00x3.71)/2 = 5.565 Kn/m
Live loads on staircase landing Beams (2nd Flight) = (3.00x5.00)/2 = 7.5 Kn/m
3. Seismic Loads (As Per IS 1893-2002(PART-1)):
Seismic Zone ZONE=II (HYDERABAD)
Zone Factor Z=0.10
Response Reduction Factor RF=3.0 (AS PER TABLE 7 OF CODE PG.23)
Importance Factor I=1.0 (AS PER TABLE 6 OF CODE PG.18)
Rock/Soil Sites Factor SS=2 (1 FOR ROCK,
2 FOR MEDIUM &
3 FOR LOOSE SOILS)
(AS PER TABLE 1 OF CODE PG.15)
International Research Journal of Engineering and Technology (IRJET) e-ISSN: 2395 -0056
Volume: 03 Issue: 12 | Dec -2016 www.irjet.net p-ISSN: 2395-0072
© 2016, IRJET | Impact Factor value: 4.45 | ISO 9001:2008 Certified Journal | Page 576
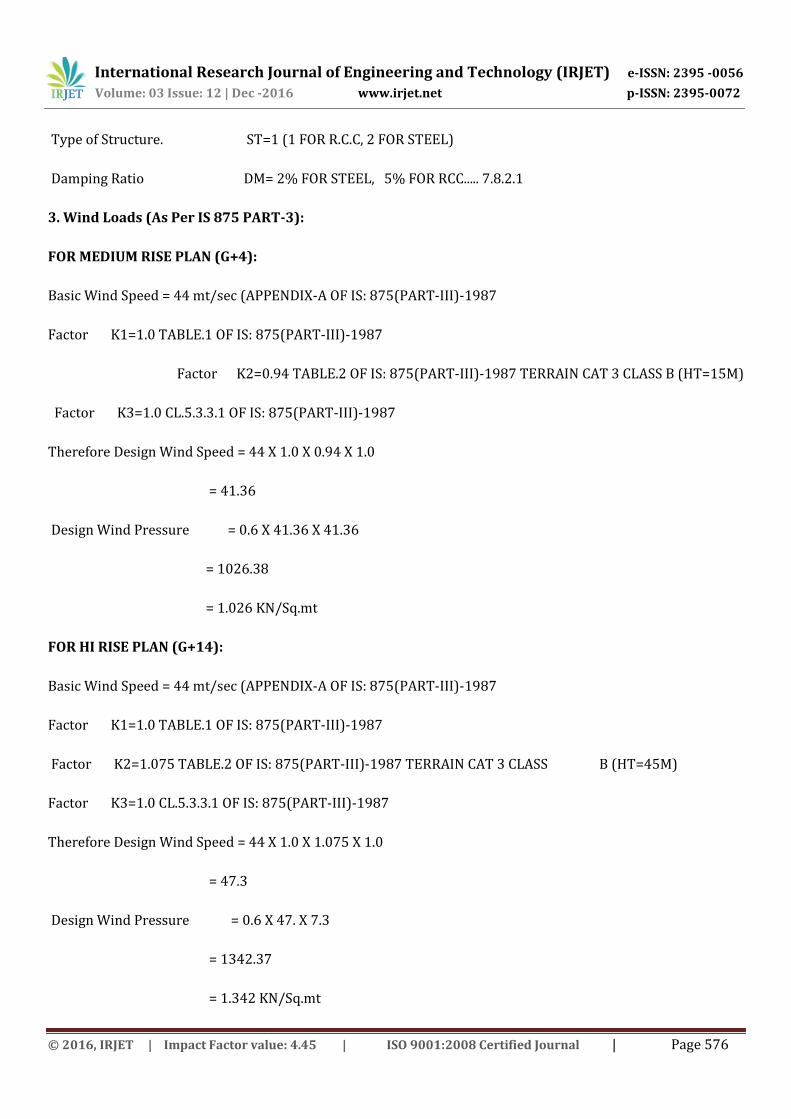
Type of Structure. ST=1 (1 FOR R.C.C, 2 FOR STEEL)
Damping Ratio DM= 2% FOR STEEL, 5% FOR RCC..... 7.8.2.1
3. Wind Loads (As Per IS 875 PART-3):
FOR MEDIUM RISE PLAN (G+4):
Basic Wind Speed = 44 mt/sec (APPENDIX-A OF IS: 875(PART-III)-1987
Factor K1=1.0 TABLE.1 OF IS: 875(PART-III)-1987
Factor K2=0.94 TABLE.2 OF IS: 875(PART-III)-1987 TERRAIN CAT 3 CLASS B (HT=15M)
Factor K3=1.0 CL.5.3.3.1 OF IS: 875(PART-III)-1987
Therefore Design Wind Speed = 44 X 1.0 X 0.94 X 1.0
= 41.36
Design Wind Pressure = 0.6 X 41.36 X 41.36
= 1026.38
= 1.026 KN/Sq.mt
FOR HI RISE PLAN (G+14):
Basic Wind Speed = 44 mt/sec (APPENDIX-A OF IS: 875(PART-III)-1987
Factor K1=1.0 TABLE.1 OF IS: 875(PART-III)-1987
Factor K2=1.075 TABLE.2 OF IS: 875(PART-III)-1987 TERRAIN CAT 3 CLASS B (HT=45M)
Factor K3=1.0 CL.5.3.3.1 OF IS: 875(PART-III)-1987
Therefore Design Wind Speed = 44 X 1.0 X 1.075 X 1.0
= 47.3
Design Wind Pressure = 0.6 X 47. X 7.3
= 1342.37
= 1.342 KN/Sq.mt

International Research Journal of Engineering and Technology (IRJET) e-ISSN: 2395 -0056
Volume: 03 Issue: 12 | Dec -2016 www.irjet.net p-ISSN: 2395-0072
© 2016, IRJET | Impact Factor value: 4.45 | ISO 9001:2008 Certified Journal | Page 577
2.1.3 Load Combinations (As Per IS 875 PART-5):
1. (1.5DL+1.5LL)
2. (1.5DL+1.5EL(X))
3. (1.5DL+1.5EL (-X))
4. (1.5DL+1.5EL(Y))
5. (1.5DL+1.5EL (-Y))
6. (1.2DL+1.2LL+1.2WL(X)
7. (1.2DL+1.2LL+1.2WL (-X)
8. (1.2DL+1.2LL+1.2WL(Y)
9. (1.2DL+1.2LL+1.2WL (-Y)
10. (1.5DL+1.5WL(X))
11. (1.5DL+1.5WL (-X))
12. (1.5DL+1.5WL(Y))
13. (1.5DL+1.5WL (-Y))
14. (1.2DL+1.2LL+1.2EL(X)
15. (1.2DL+1.2LL+1.2EL (-X)
16. (1.2DL+1.2LL+1.2EL(Y)
17. (1.2DL+1.2LL+1.2EL (-Y)
18. (0.9DL+1.5EL(X))
19. (0.9DL+1.5EL (-X))
20. (0.9DL+1.5EL(Y))
21. (0.9DL+1.5EL (-Y))
22. (0.9DL+1.5WL(X))

International Research Journal of Engineering and Technology (IRJET) e-ISSN: 2395 -0056
Volume: 03 Issue: 12 | Dec -2016 www.irjet.net p-ISSN: 2395-0072
© 2016, IRJET | Impact Factor value: 4.45 | ISO 9001:2008 Certified Journal | Page 578
23. (0.9DL+1.5WL (-X))
24. (0.9DL+1.5WL(Y))
25. (0.9DL+1.5WL (-Y))
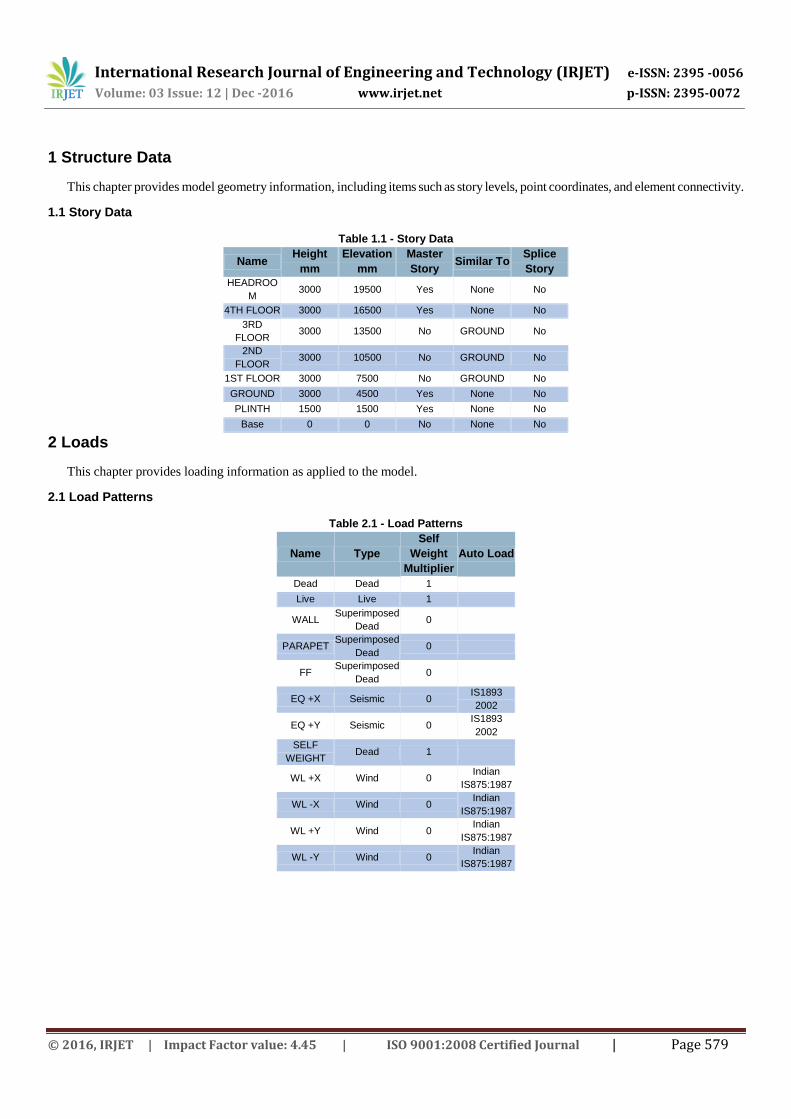
2.1.4 INPUT REPORT OF STRUCTURE FROM ETABS
Summary Report Model File: G+4, Revision 0 11/3/2015
International Research Journal of Engineering and Technology (IRJET) e-ISSN: 2395 -0056
Volume: 03 Issue: 12 | Dec -2016 www.irjet.net p-ISSN: 2395-0072
© 2016, IRJET | Impact Factor value: 4.45 | ISO 9001:2008 Certified Journal | Page 579
1 Structure Data
This chapter provides model geometry information, including items such as story levels, point coordinates, and element connectivity.
1.1 Story Data
Table 1.1 - Story Data
Name Height
mm
Elevation
mm
Master
Story Similar To
Splice
Story
HEADROO
M 3000 19500 Yes None No
4TH FLOOR 3000 16500 Yes None No
3RD
FLOOR 3000 13500 No GROUND No
2ND
FLOOR 3000 10500 No GROUND No
1ST FLOOR 3000 7500 No GROUND No
GROUND 3000 4500 Yes None No
PLINTH 1500 1500 Yes None No
Base 0 0 No None No
2 Loads
This chapter provides loading information as applied to the model.
2.1 Load Patterns
Table 2.1 - Load Patterns
Name Type
Self
Weight
Multiplier
Auto Load
Dead Dead 1
Live Live 1
WALL Superimposed
Dead 0
PARAPET Superimposed
Dead 0
FF Superimposed
Dead 0
EQ +X Seismic 0 IS1893
2002
EQ +Y Seismic 0 IS1893
2002
SELF
WEIGHT Dead 1
WL +X Wind 0 Indian
IS875:1987
WL -X Wind 0 Indian
IS875:1987
WL +Y Wind 0 Indian
IS875:1987
WL -Y Wind 0 Indian
IS875:1987

International Research Journal of Engineering and Technology (IRJET) e-ISSN: 2395 -0056
Volume: 03 Issue: 12 | Dec -2016 www.irjet.net p-ISSN: 2395-0072
© 2016, IRJET | Impact Factor value: 4.45 | ISO 9001:2008 Certified Journal | Page 580
2.2 Load Cases
Table 2.2 - Load Cases - Summary
Name Type
Dead Linear Static
Live Linear Static
WALL Linear Static
PARAPET Linear Static
FF Linear Static
EQ +X Linear Static
EQ +Y Linear Static
SELF
WEIGHT Linear Static
WL +X Linear Static
WL -X Linear Static
WL +Y Linear Static
WL -Y Linear Static
International Research Journal of Engineering and Technology (IRJET) e-ISSN: 2395 -0056
Volume: 03 Issue: 12 | Dec -2016 www.irjet.net p-ISSN: 2395-0072
© 2016, IRJET | Impact Factor value: 4.45 | ISO 9001:2008 Certified Journal | Page 581
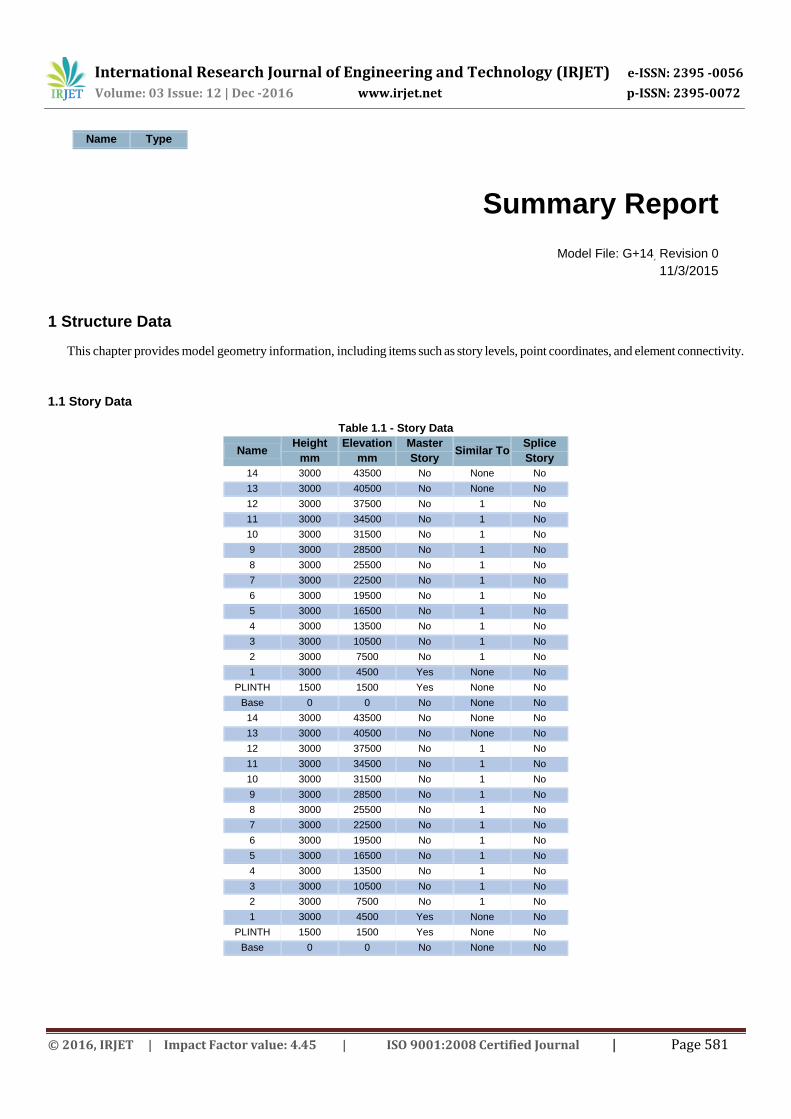
Name Type
Summary Report
Model File: G+14, Revision 0
11/3/2015
1 Structure Data
This chapter provides model geometry information, including items such as story levels, point coordinates, and element connectivity.
1.1 Story Data
Table 1.1 - Story Data
Name Height
mm
Elevation
mm
Master
Story Similar To
Splice
Story
14 3000 43500 No None No
13 3000 40500 No None No
12 3000 37500 No 1 No
11 3000 34500 No 1 No
10 3000 31500 No 1 No
9 3000 28500 No 1 No
8 3000 25500 No 1 No
7 3000 22500 No 1 No
6 3000 19500 No 1 No
5 3000 16500 No 1 No
4 3000 13500 No 1 No
3 3000 10500 No 1 No
2 3000 7500 No 1 No
1 3000 4500 Yes None No
PLINTH 1500 1500 Yes None No
Base 0 0 No None No

International Research Journal of Engineering and Technology (IRJET) e-ISSN: 2395 -0056
Volume: 03 Issue: 12 | Dec -2016 www.irjet.net p-ISSN: 2395-0072
© 2016, IRJET | Impact Factor value: 4.45 | ISO 9001:2008 Certified Journal | Page 582
2 Loads
This chapter provides loading information as applied to the model.
2.1 Load Patterns
Table 2.1 - Load Patterns
Name Type
Self
Weight
Multiplier
Auto Load
Dead Dead 1
Live Live 0
SELF
WEIGHT Dead 1
WALL Superimposed
Dead 0
PARAPET Superimposed
Dead 0
FF Superimposed
Dead 0
EQ+X Seismic 0 IS1893
2002
EQ-X Seismic 0 IS1893
2002
EQ+Y Seismic 0 IS1893
2002
EQ-Y Seismic 0 IS1893
2002
WL +X Wind 0 Indian
IS875:1987
WL -X Wind 0 Indian
IS875:1987
WL +Y Wind 0 Indian
IS875:1987
WL -Y Wind 0 Indian
IS875:1987
2.2 Load Cases
Table 2.2 - Load Cases - Summary
Name Type
Dead Linear Static
Live Linear Static
SELF
WEIGHT Linear Static
WALL Linear Static
PARAPET Linear Static
FF Linear Static
EQ+X Linear Static
EQ-X Linear Static
EQ+Y Linear Static
EQ-Y Linear Static
WL +X Linear Static
WL -X Linear Static
WL +Y Linear Static
WL -Y Linear Static

International Research Journal of Engineering and Technology (IRJET) e-ISSN: 2395 -0056
Volume: 03 Issue: 12 | Dec -2016 www.irjet.net p-ISSN: 2395-0072
© 2016, IRJET | Impact Factor value: 4.45 | ISO 9001:2008 Certified Journal | Page 583
2.2 3D VIEWS OF MODELS:
2.2.1 Group-1:
Symmetrical structural of 3-D view
Fig.3.1 Medium rise structure (G+4)

International Research Journal of Engineering and Technology (IRJET) e-ISSN: 2395 -0056
Volume: 03 Issue: 12 | Dec -2016 www.irjet.net p-ISSN: 2395-0072
© 2016, IRJET | Impact Factor value: 4.45 | ISO 9001:2008 Certified Journal | Page 584
Fig.3.2 High rise structure (G+14)

International Research Journal of Engineering and Technology (IRJET) e-ISSN: 2395 -0056
Volume: 03 Issue: 12 | Dec -2016 www.irjet.net p-ISSN: 2395-0072
© 2016, IRJET | Impact Factor value: 4.45 | ISO 9001:2008 Certified Journal | Page 585
2.2.2 Group-2
Group -2 structures are applying lead rubber bearing isolators at bottom of structure where it separates the sub-
structure and super-structure to same structural plan of group-1 respectively.
For group-2 structure Plinth height above GL is 0.5m to provide the base isolators. Where base isolator having
nearly 350mm height for high rise structure and 250mm height for medium rise structure.
Fig. 3.3 LRB base isolator apply to structures
Using the above plan in (G+4) RC structure and (G+14) RC structures , the RC G+14 frame building is generated
using commercial software ETABS 2015. Beams and Columns are modeled by 3D frame elements. The concrete
floor slabs were assumed to act as diaphragms, which ensure integral action of all the vertical lateral load-resisting
elements. The weight of the slab was distributed as triangular and trapezoidal load to the surrounding beams. Both
have been analyzed for a fixed base & isolated base with Lead Rubber Bearing for time history analysis forces by
ETABS2015 software.
3. MATHEMATICAL FORMULATION
3.1 LEAD RUBBER BEARING:
In the present paper, the isolators were initially designed to follow some available recommendations of the Uniform
Building Code (UBC-97). The mechanical properties of the LRB isolation system were set to comply with a
recommendation of the UBC-97 building code. The design parameters considered here are the ratio Q/W of the
characteristic strength Q over the total weight on the isolation system W, the yield force Fy , the isolator diameter D,

International Research Journal of Engineering and Technology (IRJET) e-ISSN: 2395 -0056
Volume: 03 Issue: 12 | Dec -2016 www.irjet.net p-ISSN: 2395-0072
© 2016, IRJET | Impact Factor value: 4.45 | ISO 9001:2008 Certified Journal | Page 586
the lead core diameter d, the number of rubber layers n, and the layer thickness t. For design and analysis, the shape
of the nonlinear force–deflection relationship, termed the hysteresis loop (represented as a bilinear curve as shown
in Fig. 4), has an elastic (or unloading) stiffness ke and a yielded (or post-elastic) stiffness kp.
Fig. 4.1 the Lead Rubber Bearing. (The top mounting plate is not shown)
Table 1. Parameters of basic hysteresis loop of isolator
Symbols Terms
ke = Elastic stiffness
K2 or kp = Yielded stiffness
keff = Effective stiffness
∆ = Designed displacement
Dy = The yield displacement of isolator
Ζeff = Effective damping ratio
Fy = Yield force
Tiso = Fundamental isolation period

International Research Journal of Engineering and Technology (IRJET) e-ISSN: 2395 -0056
Volume: 03 Issue: 12 | Dec -2016 www.irjet.net p-ISSN: 2395-0072
© 2016, IRJET | Impact Factor value: 4.45 | ISO 9001:2008 Certified Journal | Page 587
3.1.1 Elastic stiffness (ke):
Elastic stiffness ke is defined as the ratio of the yield strength to the yield displacement. This is the initial stiffness of
the isolator, its value is dominated by lead core size and is important in controlling the response to service load
such as wind.
Fig. 4.2 Hysteresis loop of the LRB.
3.1.2 Yielded Stiffness (K2 or Kp):
This is the secondary stiffness of the isolator and is a function of the shear modulus, total height and area of the rubber.
Its post-yield stiffness is given by the formula,
Where,
G = Shear modulus of the rubber.
= Cross-sectional area of the rubber layers
= Total thickness of the rubber consisting of n-layers.
International Research Journal of Engineering and Technology (IRJET) e-ISSN: 2395 -0056
Volume: 03 Issue: 12 | Dec -2016 www.irjet.net p-ISSN: 2395-0072
© 2016, IRJET | Impact Factor value: 4.45 | ISO 9001:2008 Certified Journal | Page 588
= factor given by 1.15.
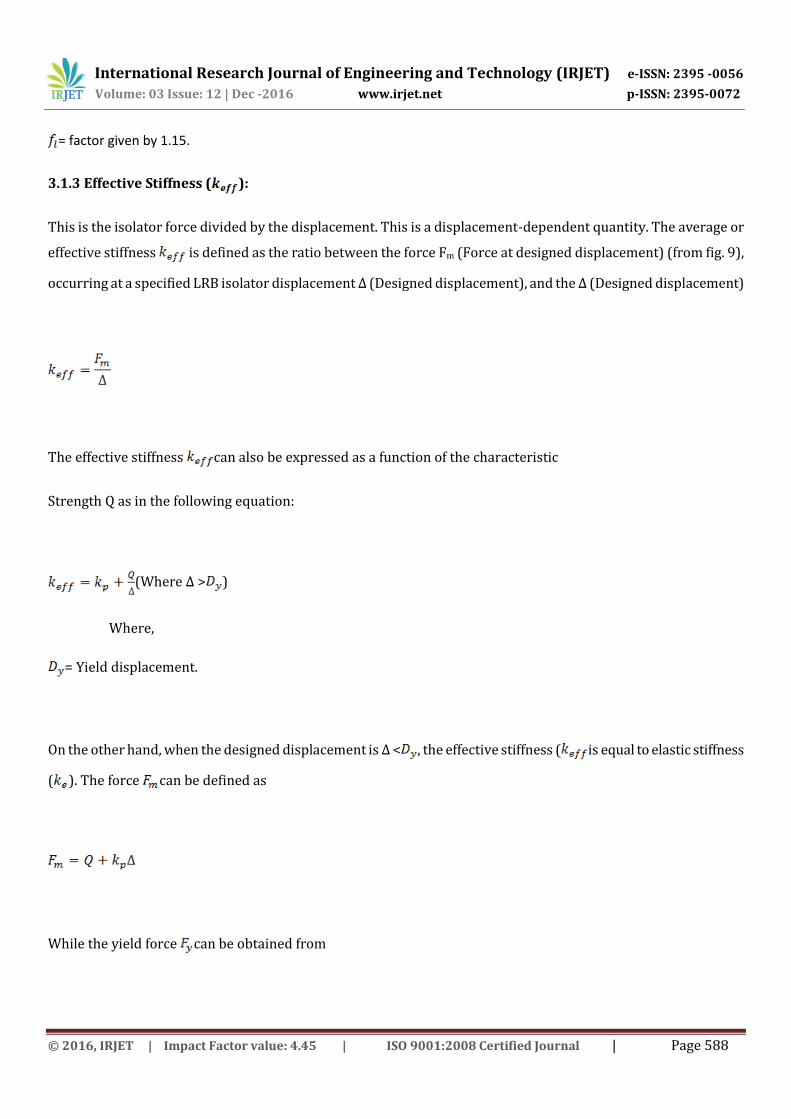
3.1.3 Effective Stiffness ( ):
This is the isolator force divided by the displacement. This is a displacement-dependent quantity. The average or
effective stiffness is defined as the ratio between the force Fm (Force at designed displacement) (from fig. 9),
occurring at a specified LRB isolator displacement ∆ (Designed displacement), and the ∆ (Designed displacement)
The effective stiffness can also be expressed as a function of the characteristic
Strength Q as in the following equation:
(Where ∆ > )
Where,
= Yield displacement.
On the other hand, when the designed displacement is ∆ < , the effective stiffness ( is equal to elastic stiffness
( ). The force can be defined as
While the yield force can be obtained from

International Research Journal of Engineering and Technology (IRJET) e-ISSN: 2395 -0056
Volume: 03 Issue: 12 | Dec -2016 www.irjet.net p-ISSN: 2395-0072
© 2016, IRJET | Impact Factor value: 4.45 | ISO 9001:2008 Certified Journal | Page 589
For lead-rubber bearings in which the elastic stiffness is approximately equal to 6.5, the yield displacement can be
estimated as:
The area ED of the hysteresis loop can be obtained from the equation,
This area represents the energy dissipation at each cyclic motion of LRB isolator. Then, the effective damping ratio
ζeff, which produces the same amount of damping energy dissipation as the hysteretic energy dissipated at each
cyclic motion of the LRB isolator, is expressed as;
Finally, the fundamental isolation period is given by the equation

International Research Journal of Engineering and Technology (IRJET) e-ISSN: 2395 -0056
Volume: 03 Issue: 12 | Dec -2016 www.irjet.net p-ISSN: 2395-0072
© 2016, IRJET | Impact Factor value: 4.45 | ISO 9001:2008 Certified Journal | Page 590
Where, M is the total mass on the isolation system, including the mass of the superstructure and the mass of the
isolation system. The term Σ = is the total effective stiffness of the isolation system.
Where,
= effective damping coefficient
High-damping rubber bearings are made of specially compounded rubber that exhibits effective damping between
0.10 and 0.20 of critical. The increase in effective damping of high-damping rubber is achieved by the addition of
chemical compounds that may also affect other mechanical properties of rubber.
3.1.4 Vertical Stiffness (Kv):
This is the vertical stiffness of the isolator.
3.1.5 Yield Force (Fy):
The yield force is the point in the model at which the initial stiffness changes to secondary stiffness. In reality there
is a smooth transition from one stiffness to the other, rather than a well-defined point. This value is mainly used in
analytical modeling.
The characteristics strength is given by equation;
Where
= area of the lead core.
= The yield strength of lead core (ranginh between 7.0 and 8.5 MPa)

International Research Journal of Engineering and Technology (IRJET) e-ISSN: 2395 -0056
Volume: 03 Issue: 12 | Dec -2016 www.irjet.net p-ISSN: 2395-0072
© 2016, IRJET | Impact Factor value: 4.45 | ISO 9001:2008 Certified Journal | Page 591
3.1.6 Hysteretic Strength (Qd):
This is the force-axis intercept of the isolator hysteresis loop. This parameter relates to damping and isolator
response to service loads.
3.2 ISOLATION SYSTEM
The isolation systems, which can be elastomeric systems, exhibit highly nonlinear behavior. Nonlinear behavior is
restricted to the base and the superstructure is considered to be elastic at all times. All of the isolation bearings in
this study are modeled by a bilinear model, based on three parameters: elastic stiffness (K1), yielded stiffness (K2),
and characteristics Strength (Q). Refer Fig. 10 for details. The elastic stiffness (K1) is either estimated from
elastomeric bearing tests or as a multiple of K2 for lead plug bearing. The characteristics strength (Q) is estimated
from the hysteresis loops for the elastomeric bearings. For lead plug bearings Q is given by the yield stress in the
lead and the area of the lead. The post-yield stiffness can be accurately estimated or predicted for the bearing. The
effective stiffness, defined as the secant slope of the peak-to-peak values, in a hysteresis loop, is given by:
Where, D > Dy
Here, Dy = is the yield displacement.
Fig. 4.2 Parameters of basic hysteresis loop of isolator for bilinear modeling

International Research Journal of Engineering and Technology (IRJET) e-ISSN: 2395 -0056
Volume: 03 Issue: 12 | Dec -2016 www.irjet.net p-ISSN: 2395-0072
© 2016, IRJET | Impact Factor value: 4.45 | ISO 9001:2008 Certified Journal | Page 592
The natural frequency w is given by:
=
Where,
The effective time period T is given by
=
And the area of the hysteresis loop is (the energy dissipated per cycle), WD, is given as;
WD = 4Q (D - Dy )
The effective damping eff is given by

International Research Journal of Engineering and Technology (IRJET) e-ISSN: 2395 -0056
Volume: 03 Issue: 12 | Dec -2016 www.irjet.net p-ISSN: 2395-0072
© 2016, IRJET | Impact Factor value: 4.45 | ISO 9001:2008 Certified Journal | Page 593
Eff =
This can be expressed in non-dimensional quantities by defining a non-dimensional displacement.
Y =
And a non-dimensional characteristics strength
a =
Then effective damping becomes
3.3 MATERIALS OF LRB
Tableted 2. Materials of lead rubber bearing
1 Rubber
2 Steel
3 Lead core
4 Mounting plate.(steel mounting plate and top mounting plate)
3.4 PROPERTIES OF BASE ISOLATION:
The isolation elements (Fig. 4.1) used is modeled by biaxial behavior of elastomeric bearings (Fig.
4.3). The lead-rubber bearings are modeled using the biaxial model for elastomeric bearings. In the present study,
bilinear isolators such as the commonly used lead rubber bearing (LRB) isolation systems were investigated.
The introduction of LRB isolators in the nonlinear time-history analysis was achieved by activating
the nonlinear link element of ETABS. The performance of a base isolated framed structure with a fixed base

International Research Journal of Engineering and Technology (IRJET) e-ISSN: 2395 -0056
Volume: 03 Issue: 12 | Dec -2016 www.irjet.net p-ISSN: 2395-0072
© 2016, IRJET | Impact Factor value: 4.45 | ISO 9001:2008 Certified Journal | Page 594
otherwise similar framed structure was compared one by one as described below using computer program ETABS
2015 to conclude the effectiveness of base isolation using bilinear behavior of elastomeric bearing.
STOREY PLAN
G+4 G+14
U1 Linear effective
stiffness(kN/m) 445060 811800
U2 and U3 Linear
effective stiffness
(kN/m)
1750 2102.5
U2 and U3
Nonlinear stiffness
(kN/m)
6820 9530
U2 and U3 Yield
strength (kN) 132 169
U2 and U3 Post
yield stiffness
ratio
0.065 0.07
Table 3 Properties of lead rubber bearing isolator
3.5 DESIGN OF BASE ISOLATORS:
ISOLATOR DESIGN FOR G+4
1. Seismic zone factor, z = 0.30 (Table 16 – I)
2. Soil profile type SB (Table 16 – J)
3. Seismic co-efficient, CA = 0.33 (Table 16 – Q)
4. Seismic co-efficient, CV = 0.45 (Table 16 – R)
5. Near source factor, NA = 1.5 (Table 16 – S)
6. Near source factor, NV = 2 (Table 16 – T)

International Research Journal of Engineering and Technology (IRJET) e-ISSN: 2395 -0056
Volume: 03 Issue: 12 | Dec -2016 www.irjet.net p-ISSN: 2395-0072
© 2016, IRJET | Impact Factor value: 4.45 | ISO 9001:2008 Certified Journal | Page 595
7. MCE Shaking intensity MMZ NA = 0.40 , MM = 1.21
8. MCE Shaking intensity MMZ NV = 0.48
9. Seismic Source type A (Table 16 – U)
10. Distance of known source (km) = 2 ( from site seismology)
11. MCE Response co-efficient, MM = 1.21 (Table A-16-D)
12. Lateral force co-efficient, R1 = 2 (Table A-16-E)
13. Fixed base Lateral force co-efficient, R = 5.5 (Table 16 – N)
14. Importance factor, I = 1 (Table 16 – K)
15. Seismic co-efficient, CAM = 1 (Table A-16-F)
16. Seismic co-efficient, CVM= 1 (Table A-16-G)
17. Eccentricity, e =1.45 (5% of d)
18. Shortest building dimension, b = 22 (Building site)
19. Longest building dimension, d = 22
20. Dimension of extreme isolator, y = 6 (from geometry)
21. DTD / DD = DTM / DM = [1 + (y x 12 x e) / (b2 + d2)]
= 1.1
Parameters:
22. Shear modulus (G) = 0.0004 (shear modulus of rubber, Table 5.4)
23. Ultimate elongation , €U = 6.5 (shear modulus of rubber, Table 5.4)
24. Material constant, K = 0.87 (shear modulus of rubber, Table 5.4)
25. Elastic modulus, E = 0.00135 (shear modulus of rubber, Table 5.4)
26. Bulk modulus, E∞ = 1.5 (Typical value for neutral rubber)
27. Damping, β = 0.05 (5% used for plain rubber bearings)
28. Lead yield strength, σy = 0.008 (Usually 7 to 8.5 Mpa)
29. Teflon co-efficient of friction, µ = 0.1 (Use high velocity for design)
30. Gravity, g = 9810
Isolator type & load data:
Number of bearing = 30
Avg DL + LL, Pd = 803
Max DL + LL = 1180
Wing load/isolator = 50 50 x 30 = 1500
Seismic weight = 30 x 803 + 1500 = 25590

International Research Journal of Engineering and Technology (IRJET) e-ISSN: 2395 -0056
Volume: 03 Issue: 12 | Dec -2016 www.irjet.net p-ISSN: 2395-0072
© 2016, IRJET | Impact Factor value: 4.45 | ISO 9001:2008 Certified Journal | Page 596
Isolator Dimension:
Plan dimension, B = 520mm
Layer thickness, t1 = 10
No of Layers, N = 16
Lead core size, dpl= 150
Side cover, tsc = 10
Internal slim thickness, tsl = 3
Load plate thickness, Tpl = 40 [required to get total height]
Total rubber thickness, Tr = 160 [ Nt1 ]
Total height, H = 285 [ Nt1 + (N-1) tsl + 2Tpl]
Gross area , Ag = 212371.66 [пB2 / 4]
Bonding dimension, Bb = 500 [B-2 tsc]
Bonding depth = Nil
Bond area, Ab = 196349.54 [пBb2 / 4]
Plug area, Apl = 17671.45 [пdpl2 / 4]
Net bonding area, Abn = 178678.08 [Ab - Apl]
Total rubber thickness, Tr = 160 [ Nt1 ]
Bonded perimeter, P = 1570.79 [пBb]
Shape factor, S =11.39 [Abn / t1p]
Characteristic strength, Qd = 141.37 [σy Apl]
Shear modulus [50%] = 0.0004 [G]
Yielded stiffness, Kr = 0.48 [G (Ag - Apl) / Tr]
For LRB,

International Research Journal of Engineering and Technology (IRJET) e-ISSN: 2395 -0056
Volume: 03 Issue: 12 | Dec -2016 www.irjet.net p-ISSN: 2395-0072
© 2016, IRJET | Impact Factor value: 4.45 | ISO 9001:2008 Certified Journal | Page 597
C1, Co-efficient on Kr = 6.5 [Typical value]
C2, Co-efficient on Apl/Ab = 12 [Typical value]
Elastic stiffness, Kv = 6.82 [6.5 Kr (1 + (12 Apl / Abn))]
Yield force, Fy = 131.42 [Qd (1- (Kr / Kv))]
Yield displacement, ∆V = 19.26 [Fy / Kv]
Moment of inertia, I = 0.3067x 10¹⁰ [пBb4 / 64] (circular)
Buckling factors
Height free to buckle, Hr = 205 [Tr + tsl (N-1)]
Buckling modulus, Eb = 0.197 [E (1+0.742S12)]
Constant, T = 0.776 x 10¹⁰ [Eb I Hr / Tr]
Constant, R = 76.8 [Kr Tr]
Constant, Q = 0.0153 [п / Hr]
Factor on €U = 0.33 [factor of safety 3 for gravity]
Applied vertical load, PDL+LL = 803
Applied displacement = 0
Applied rotation = 0
Shape factor, S1 = 14.00 [from properties]
Constant, K = 0.87 [from properties]
E= 0.0014 [from properties]
Compressive modulus, Ec = 0.478 [E (1+2KS12)]
Reduced area, Ar = 196349.54 [пBb2 / 4]
Vertical stiffness, Kvi = 9385.50 [Ec Ar / t1] per layer

International Research Journal of Engineering and Technology (IRJET) e-ISSN: 2395 -0056
Volume: 03 Issue: 12 | Dec -2016 www.irjet.net p-ISSN: 2395-0072
© 2016, IRJET | Impact Factor value: 4.45 | ISO 9001:2008 Certified Journal | Page 598
Compressive strain, €c = 0.0167 [P / Kvi t1]
Compressive shear strain, €sc = 1.40 [6 S1€c]
Displacement strain, €sl = 0
Rotational strain, €sv = 0
Total strain, € = 1.40 [€sc + €sl + €sv]
Allowable strain = 2.16 [€U / f]
Status Ok Satisfactory
If € < €V / f
Adjusted shear modulus = 0.00045 [G]
Adjusted stiffness, Kr* = 0.48 [Kr ]
Vertical stiffness calculation
Kvi = 9385.5
Kv = 586.59
Bulk modulus, E∞ = 1.5 [from material properties]
Vertical stiffness, KV = 445.06 [Kv / (1+ (Ec / E∞))]
DBE: (Performance)
No of Isolators = 30
Elastic stiffness, KU = 6.82
Adjusted stiffness, Kr* = 0.48
Yield displacement, ∆V = 19.26
Characteristic strength, Qd = 141.37
Iteration 1
Seismic displacement, DD = 160 [Assume a displacement adjust until SD / DD = 1]

International Research Journal of Engineering and Technology (IRJET) e-ISSN: 2395 -0056
Volume: 03 Issue: 12 | Dec -2016 www.irjet.net p-ISSN: 2395-0072
© 2016, IRJET | Impact Factor value: 4.45 | ISO 9001:2008 Certified Journal | Page 599
Bearing force, F = 218.17 [Qd + DD Kr*]
Effective stiffness, Ke = 1.36 [F/DD] Ke x 30 = 40.9
Seismic Weight = 25590 dead load
Seismic Weight = 2.592 W / g
Effective period, TE = 1.58 [2п (M/ Ke)0.5]
Loop area, Ah = 79585.655 [4 Qd (DD - ∆V)
Damping = 36.38% [(1/2п) x (Ah / Ke DD2)]
Damping factor, B = 1.81 [UBC Table A-16-C]
Spectral acceleration, SA = 0.1 [CV / BTE]
Spectral displacement, SD = 98.20 [(g x CV x TE) / (4 п2B)]
Iteration 2
Seismic displacement, DD = 98.20
Bearing force, F = 167.41
Effective stiffness, Ke = 1.70 [F/DD] Ke x 30 = 51.14
Seismic Weight = 25590 dead load
Seismic Weight = 2.59 W / g
Effective period, TE = 1.41
Loop area, Ah = 44684.22
Damping = 43.38%
Damping factor, B = 1.9
Spectral acceleration, SA = 0.1
Spectral displacement, SD = 83.49
Iteration 3

International Research Journal of Engineering and Technology (IRJET) e-ISSN: 2395 -0056
Volume: 03 Issue: 12 | Dec -2016 www.irjet.net p-ISSN: 2395-0072
© 2016, IRJET | Impact Factor value: 4.45 | ISO 9001:2008 Certified Journal | Page 600
Seismic displacement, DD = 83.49
Bearing force, F = 181.44
Effective stiffness, Ke = 2.17 [F/DD] Ke x 30 = 65.199
Seismic Weight = 25590 dead load
Seismic Weight = 2.59 W / g
Effective period, TE = 1.25
Loop area, Ah = 36213.33
Damping = 38.1%
Damping factor, B = 1.86
Spectral acceleration, SA = 0.1
Spectral displacement, SD = 83
Check convergence = 1 [ SD / DD]
MCE performance
No of isolator = 30
Elastic stiffness, KU = 6.82
Adjusted stiffness, Kr* = 0.45
Yield displacement, ∆V = 19.26
Characteristic strength, Qd = 141.37
Iteration 1
DM =85
F = 182.17
Ke = 2.14
TE = 1.26

International Research Journal of Engineering and Technology (IRJET) e-ISSN: 2395 -0056
Volume: 03 Issue: 12 | Dec -2016 www.irjet.net p-ISSN: 2395-0072
© 2016, IRJET | Impact Factor value: 4.45 | ISO 9001:2008 Certified Journal | Page 601
Loop area, Ah = 37174.655
Damping = 38.2%
Damping factor, B = 1.86
Spectral acceleration, SA = 0.1
Spectral displacement, SD = 76.21
Iteration 2
DM = 76.21
F = 177.95
Ke = 2.33
TE = 1.20
Loop area, Ah = 32204.08
Damping = 37.8%
Damping factor, B = 1.8
Spectral acceleration, SA = 0.1
Spectral displacement, SD = 75
Check convergence = 1 [ SD / DD]
Earthquake design
Eu = 0.75
Applied vertical load, PDL + SLL + E = 8206 [Max DL + SLL + E]
DBE displacement = 156 [DBE displacement DD]
Factor on displacement = 1.25 [DTD / DD]
Applied displacement = 195 [DD]
Applied rotation = 0
International Research Journal of Engineering and Technology (IRJET) e-ISSN: 2395 -0056
Volume: 03 Issue: 12 | Dec -2016 www.irjet.net p-ISSN: 2395-0072
© 2016, IRJET | Impact Factor value: 4.45 | ISO 9001:2008 Certified Journal | Page 602
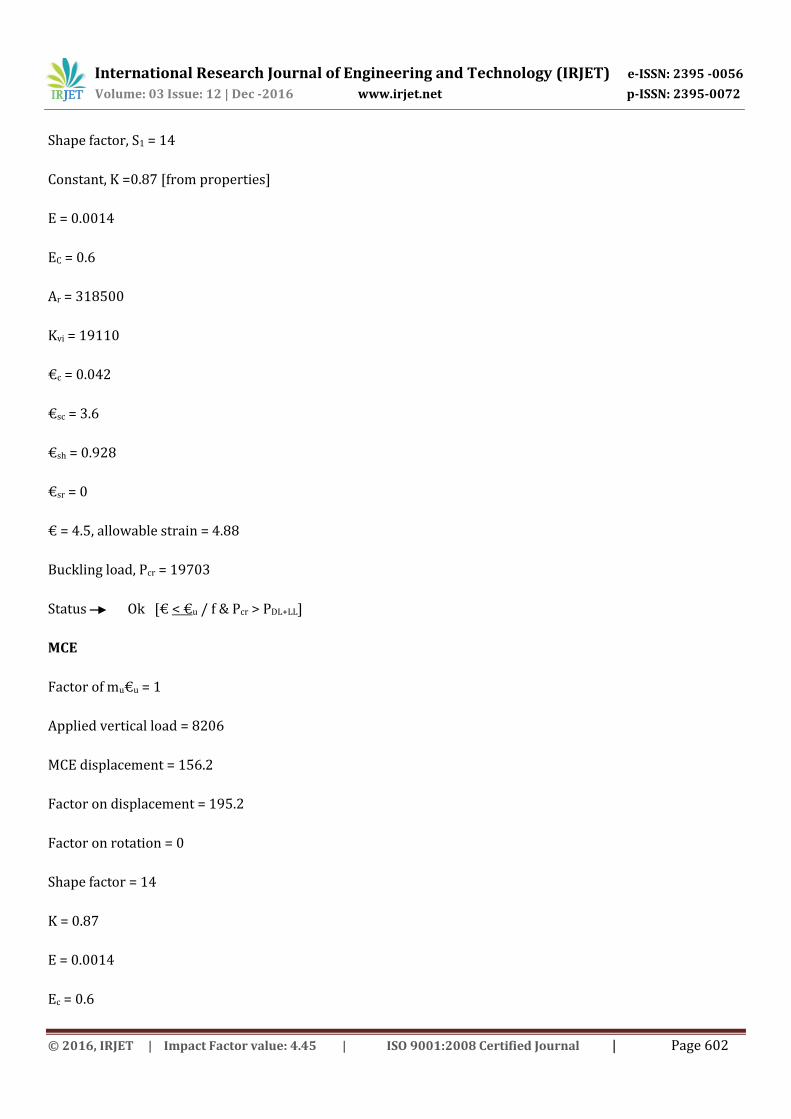
Shape factor, S1 = 14
Constant, K =0.87 [from properties]
E = 0.0014
EC = 0.6
Ar = 318500
Kvi = 19110
€c = 0.042
€sc = 3.6
€sh = 0.928
€sr = 0
€ = 4.5, allowable strain = 4.88
Buckling load, Pcr = 19703
Status Ok [€ < €u / f & Pcr > PDL+LL]
MCE
Factor of mu€u = 1
Applied vertical load = 8206
MCE displacement = 156.2
Factor on displacement = 195.2
Factor on rotation = 0
Shape factor = 14
K = 0.87
E = 0.0014
Ec = 0.6

International Research Journal of Engineering and Technology (IRJET) e-ISSN: 2395 -0056
Volume: 03 Issue: 12 | Dec -2016 www.irjet.net p-ISSN: 2395-0072
© 2016, IRJET | Impact Factor value: 4.45 | ISO 9001:2008 Certified Journal | Page 603
Ar = 318500
Kvi = 19110
€c = 0.042
€sc = 3.6
€sh = 0.928
€ = 4.5, allowable strain = 6.5
Buckling load, Pcr = 19703
Status Ok
Gravity strain FS 4.03 €u / € = 6.5 / 1.61
Buckling FS 7.57 Pcr / P = 25542 / 3372.5
DBE strain FS 1.44 €u / € = 6.5 / 4.5
Buckling FS 2.4 Pcr / P = 19703 / 8206
MCE strain FS 1.44 €u / € = 6.5 / 4.5
Buckling FS 2.4 Pcr / P = 19703 / 8206
Reduced area / Gross area 98.6 at MCE = Ar / Ab
Max shear strain at MCE = €sh
DBE MCE Comments
Effective period TD TM 2.38 2.4
From seismic performance Displacement DD DM 165 15
Total Displacement DTD DTM 206 206
Force co- efficient Vb / w 0.1 0.1 SA
International Research Journal of Engineering and Technology (IRJET) e-ISSN: 2395 -0056
Volume: 03 Issue: 12 | Dec -2016 www.irjet.net p-ISSN: 2395-0072
© 2016, IRJET | Impact Factor value: 4.45 | ISO 9001:2008 Certified Journal | Page 604
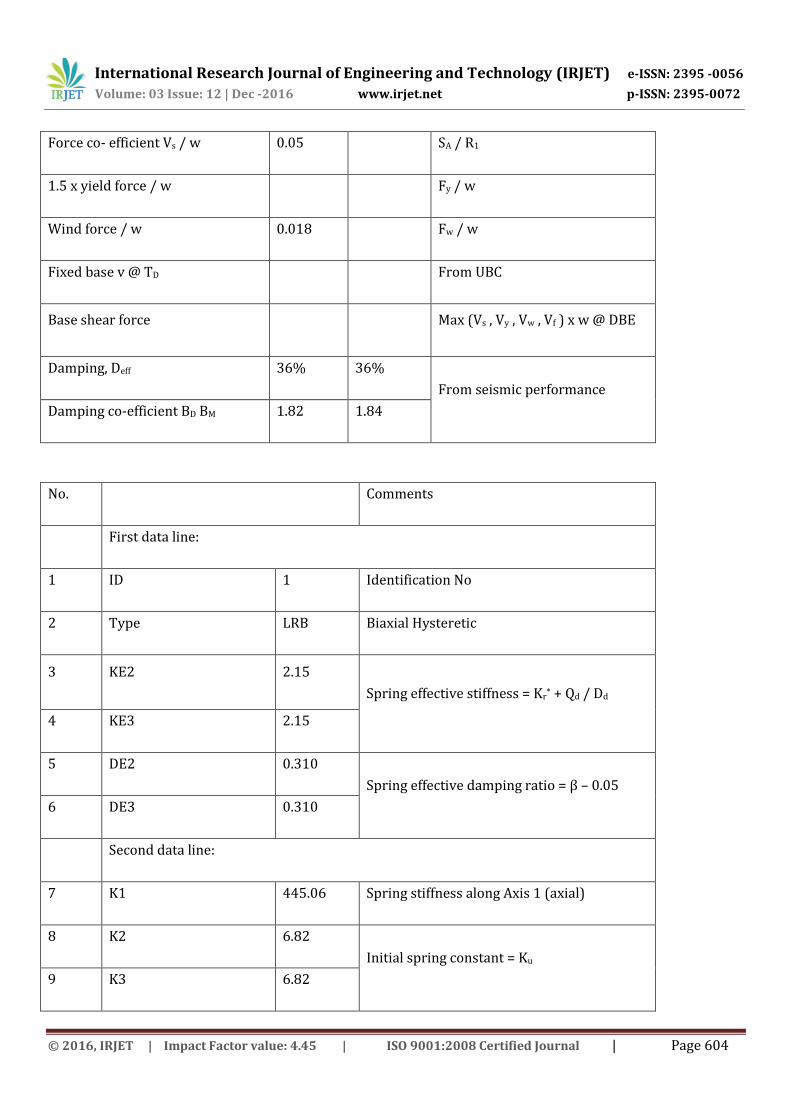
Force co- efficient Vs / w 0.05 SA / R1
1.5 x yield force / w Fy / w
Wind force / w 0.018 Fw / w
Fixed base v @ TD From UBC
Base shear force Max (Vs , Vy , Vw , Vf ) x w @ DBE
Damping, Deff 36% 36%
From seismic performance
Damping co-efficient BD BM 1.82 1.84
No. Comments
First data line:
1 ID 1 Identification No
2 Type LRB Biaxial Hysteretic
3 KE2 2.15
Spring effective stiffness = Kr* + Qd / Dd
4 KE3 2.15
5 DE2 0.310
Spring effective damping ratio = β – 0.05
6 DE3 0.310
Second data line:
7 K1 445.06 Spring stiffness along Axis 1 (axial)
8 K2 6.82
Initial spring constant = Ku
9 K3 6.82

International Research Journal of Engineering and Technology (IRJET) e-ISSN: 2395 -0056
Volume: 03 Issue: 12 | Dec -2016 www.irjet.net p-ISSN: 2395-0072
© 2016, IRJET | Impact Factor value: 4.45 | ISO 9001:2008 Certified Journal | Page 605
10 FY2 / K11 / CFF2 132
Yield force = (Fy for LRB)
11 FY3 / K22 / CFF3 132
12 RK2 / K33 / CFF2 0.065
Post – yield stiffness ratio = Kr* / Ku
13 RK3 / CFS3 0.065
Hysteresis properties
Displacement Force Comments
Yield displacement 19.32 Bearing properties
Design displacement 83 DBE properties
Yield force, Fy 132 Bearing properties
Origin 0 0 Start of plot
Point A 19.32 132
∆ = ∆Y
F = Fy
Point B 83 178.72
∆ = DD
F = QD + DD Kr*
Point C 44.26 -85.26
∆ = DD - 2∆Y
F = QD + DD Kr* - 2Fy
Point D -83 --178.72
∆ = -DD
F = - QD - DD Kr*
Point E -44.26 +85.26
∆ = - DD + 2∆Y
F = - QD - DD Kr* + 2Fy

International Research Journal of Engineering and Technology (IRJET) e-ISSN: 2395 -0056
Volume: 03 Issue: 12 | Dec -2016 www.irjet.net p-ISSN: 2395-0072
© 2016, IRJET | Impact Factor value: 4.45 | ISO 9001:2008 Certified Journal | Page 606
Point A 19.32 132
∆ = ∆Y
F = Fy
ISOLATOR DESIGN FOR G+14
1. Seismic zone factor, z = 0.3 (Table 16 – I)
2. Soil profile type SB (Table 16 – J)
3. Seismic co-efficient, CA = 0.33 (Table 16 – Q)
4. Seismic co-efficient, CV = 0.45 (Table 16 – R)
5. Near source factor, NA = 1.5 (Table 16 – S)
6. Near source factor, NV = 2(Table 16 – T)
7. MCE Shaking intensity MMZ NA = 0.40 , MM = 1.21
8. MCE Shaking intensity MMZ NV = 0.48
9. Seismic Source type A (Table 16 – U)
10. Distance of known source (km) = 2 ( from site seismology)
11. MCE Response co-efficient, MM = 1.21 (Table A-16-D)
12. Lateral force co-efficient, R1 = 2 (Table A-16-E)
13. Fixed base Lateral force co-efficient, R = 5.5 (Table 16 – N)
14. Importance factor, I = 1 (Table 16 – K)
15. Seismic co-efficient, CAM = 1(Table A-16-F)
16. Seismic co-efficient, CVM= 1 (Table A-16-G)
17. Eccentricity, e =1.45 (5% of d)
18. Shortest building dimension, b = 22 (Building site)
19. Longest building dimension, d = 22
20. Dimension of extreme isolator, y = 6 (from geometry)
21. DTD / DD = DTM / DM = [1 + (y x 12 x e) / (b2 + d2)]
= 1.10
Parameters:
22. Shear modulus (G) = 0.0004 (shear modulus of rubber, Table 5.4)
23. Ultimate elongation , €U = 6.5 (shear modulus of rubber, Table 5.4)
24. Material constant, K = 0.87 (shear modulus of rubber, Table 5.4)
25. Elastic modulus, E = 0.00135 (shear modulus of rubber, Table 5.4)
26. Bulk modulus, E∞ = 1.5 (Typical value for neutral rubber)
27. Damping, β = 0.05 (5% used for plain rubber bearings)
28. Lead yield strength, σy = 0.008 (Usually 7 to 8.5 Mpa)
29. Teflon co-efficient of friction, µ = 0.1 (Use high velocity for design)

International Research Journal of Engineering and Technology (IRJET) e-ISSN: 2395 -0056
Volume: 03 Issue: 12 | Dec -2016 www.irjet.net p-ISSN: 2395-0072
© 2016, IRJET | Impact Factor value: 4.45 | ISO 9001:2008 Certified Journal | Page 607
30. Gravity, g = 9810
Isolator type & load data:
Number of bearing = 30
Avg DL + LL, Pd = 3113.2
Max DL + LL = 4078
Wing load/isolator = 50 50 x 30 = 1500
Seismic weight = 32 x 2593.5 + 1500 = 94896
Isolator Dimension:
Plan dimension, B = 800mm
Layer thickness, t1 = 10
No of Layers, N = 21
Lead core size, dpl= 175
Side cover, tsc = 10
Internal slim thickness, tsl = 3
Load plate thickness, Tpl = 40 [required to get total height]
Total rubber thickness, Tr = 210 [ Nt1 ]
Total height, H = 350 [ Nt1 + (N-1) tsl + 2Tpl]
Total yield level of system = 7.2% [(Qd x No of bearing) / W]
Gross area, Ag = 502654.8 [пB2 / 4]
Bonding dimension, Bb = 780 [B-2 tsc]
Bonding depth = Nil
Bond area, Ab = 477836.24 [пBb2 / 4]
Plug area, Apl = 24052.81 [пdpl2 / 4]

International Research Journal of Engineering and Technology (IRJET) e-ISSN: 2395 -0056
Volume: 03 Issue: 12 | Dec -2016 www.irjet.net p-ISSN: 2395-0072
© 2016, IRJET | Impact Factor value: 4.45 | ISO 9001:2008 Certified Journal | Page 608
Net bonding area, Abn = 453783.42 [Ab - Apl]
Total rubber thickness, Tr = 210 [ Nt1 ]
Bonded perimeter, P = 2450 [пBb]
Shape factor, S =14.00 [Abn / t1p]
Characteristic strength, Qd = 192.4 [σy Apl]
Shear modulus [50%] = 0.0004 [G]
Yielded stiffness, Kr = 0.911 [G (Ag - Apl) / Tr]
For LRB,
C1, Co-efficient on Kr = 6.5 [Typical value]
C2, Co-efficient on Apl/Ab = 12 [Typical value]
Elastic stiffness, Kv = 7.53 [6.5 Kr (1 + (12 Apl / Abn))]
Yield force, Fy = 169.12 [Qd (1- (Kr / Kv))]
Yield displacement, ∆V = 22.45 [Fy / Kv]
Moment of inertia, I = 1.81 x 10¹⁰ [пBb4 / 64] (circular)
Buckling factors
Height free to buckle, Hr = 270 [Tr + tsl (N-1)]
Buckling modulus, Eb = 0.197 [E (1+0.742S12)]
Constant, T = 0.458 x 10¹⁰ [Eb I Hr / Tr]
Constant, R = 191.31 [Kr Tr]
Constant, Q = 0.0116 [п / Hr]
Factor on €U = 0.33 [factor of safety 3 for gravity]
Applied vertical load, PDL+LL = 3113.2
Applied displacement = 0

International Research Journal of Engineering and Technology (IRJET) e-ISSN: 2395 -0056
Volume: 03 Issue: 12 | Dec -2016 www.irjet.net p-ISSN: 2395-0072
© 2016, IRJET | Impact Factor value: 4.45 | ISO 9001:2008 Certified Journal | Page 609
Applied rotation = 0
Shape factor, S1 = 14.00 [from properties]
Constant, K = 0.87 [from properties]
E= 0.0014 [from properties]
Compressive modulus, Ec = 0.478 [E (1+2KS12)]
Reduced area, Ar = 477836 [пBb2 / 4]
Vertical stiffness, Kvi = 22840.56 [Ec Ar / t1] per layer
Compressive strain, €c = 0.0107 [P / Kvi t1]
Compressive shear strain, €sc = 0.9 [6 S1€c]
Displacement strain, €sl = 0
Rotational strain, €sv = 0
Total strain, € = 0.9 [€sc + €sl + €sv]
Allowable strain = 2.16 [€U / f]
Status Ok Satisfactory
If € < €V / f
Adjusted shear modulus = 0.00045 [G]
Adjusted stiffness, Kr* = 0.8[Kr ]
Vertical stiffness calculation
Kvi = 22480.5
Kv = 1070.5
Bulk modulus, E∞ = 1.5 [from material properties]
Vertical stiffness, KV = 811.80 [Kv / (1+ (Ec / E∞))]
DBE: (Performance)

International Research Journal of Engineering and Technology (IRJET) e-ISSN: 2395 -0056
Volume: 03 Issue: 12 | Dec -2016 www.irjet.net p-ISSN: 2395-0072
© 2016, IRJET | Impact Factor value: 4.45 | ISO 9001:2008 Certified Journal | Page 610
No of Isolators = 30
Elastic stiffness, KU = 7.53
Adjusted stiffness, Kr* = 0.8
Yield displacement, ∆V = 22.45
Characteristic strength, Qd = 192.4
Iteration 1
Seismic displacement, DD =160 [Assume a displacement adjust until SD / DD = 1]
Bearing force, F = 320.4 [Qd + DD Kr*]
Effective stiffness, Ke = 2.0 [F/DD] Ke x 30 = 60
Seismic Weight = 94896 dead load
Seismic Weight = 9.61 W / g
Effective period, TE = 2.51 [2п (M/ Ke) 0.5]
Loop area, Ah = 105858.48 [4 Qd (DD - ∆V)
Damping = 33. % [(1/2п) x (Ah / Ke DD2)]
Damping factor, B = 1.76 [UBC Table A-16-C]
Spectral acceleration, SA = 0.1 [CV / BTE]
Spectral displacement, SD = 160.44 [(g x CV x TE) / (4 п2B)]
Check convergence = 1 [ SD / DD]
MCE performance
No of isolator = 30
Elastic stiffness, KU = 7.53
Adjusted stiffness, Kr* = 0.8
Yield displacement, ∆V = 22.45

International Research Journal of Engineering and Technology (IRJET) e-ISSN: 2395 -0056
Volume: 03 Issue: 12 | Dec -2016 www.irjet.net p-ISSN: 2395-0072
© 2016, IRJET | Impact Factor value: 4.45 | ISO 9001:2008 Certified Journal | Page 611
Characteristic strength, Qd = 192.4\
Iteration 1
DM = 160
F = 320.4
Ke = 2.00
TE = 2.51
Loop area, Ah = 105858.48
Damping = 33%
Damping factor, B = 1.76
Spectral acceleration, SA = 0.1
Spectral displacement, SD = 160.44
Check convergence = 1 [ SD / DD]
Earthquake design
Eu = 0.75
Applied vertical load, PDL + SLL + E = 8206 [Max DL + SLL + E]
DBE displacement = 156 [DBE displacement DD]
Factor on displacement = 1.25 [DTD / DD]
Applied displacement = 195 [DD]
Applied rotation = 0
Shape factor, S1 = 14
Constant, K =0.87 [from properties]
E = 0.0014
EC = 0.6

International Research Journal of Engineering and Technology (IRJET) e-ISSN: 2395 -0056
Volume: 03 Issue: 12 | Dec -2016 www.irjet.net p-ISSN: 2395-0072
© 2016, IRJET | Impact Factor value: 4.45 | ISO 9001:2008 Certified Journal | Page 612
Ar = 318500
Kvi = 19110
€c = 0.042
€sc = 3.6
€sh = 0.928
€sr = 0
€ = 4.5, allowable strain = 4.88
Buckling load, Pcr = 19703
Status Ok [€ < €u / f & Pcr > PDL+LL]
MCE
Factor of mu€u = 1
Applied vertical load = 8206
MCE displacement = 156.2
Factor on displacement = 195.2
Factor on rotation = 0
Shape factor = 14
K = 0.87
E = 0.0014
Ec = 0.6
Ar = 318500
Kvi = 19110
€c = 0.042
€sc = 3.6
International Research Journal of Engineering and Technology (IRJET) e-ISSN: 2395 -0056
Volume: 03 Issue: 12 | Dec -2016 www.irjet.net p-ISSN: 2395-0072
© 2016, IRJET | Impact Factor value: 4.45 | ISO 9001:2008 Certified Journal | Page 613
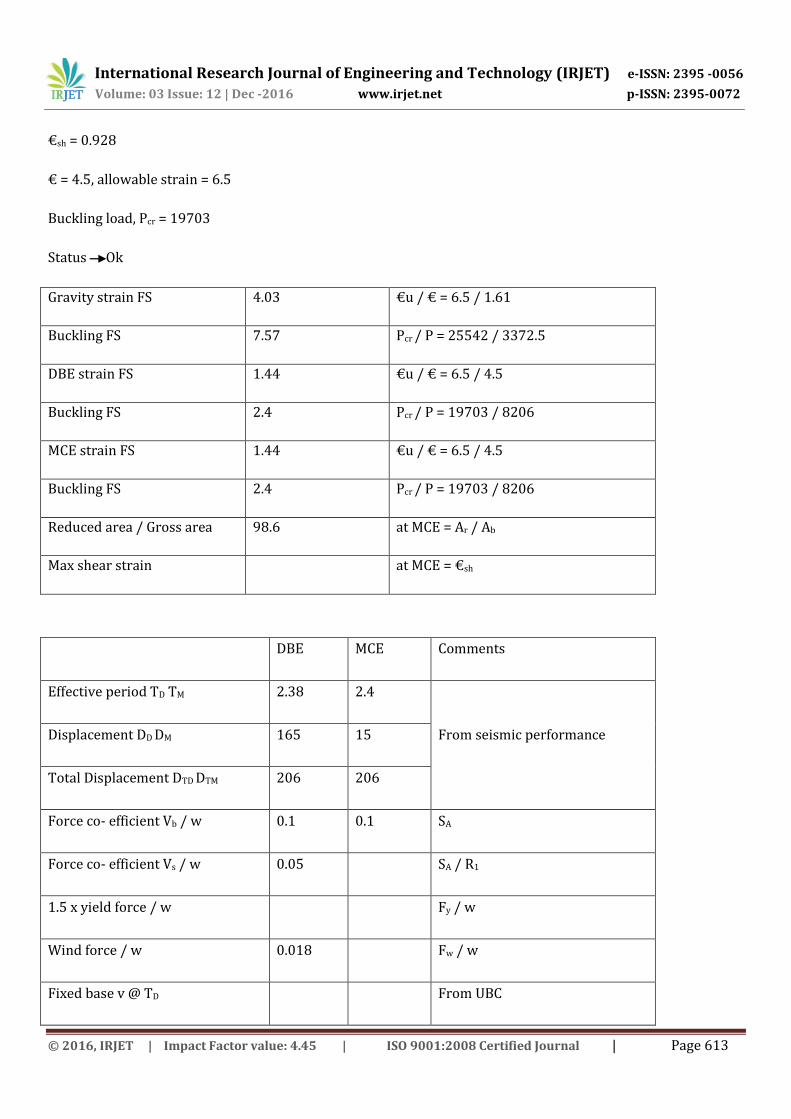
€sh = 0.928
€ = 4.5, allowable strain = 6.5
Buckling load, Pcr = 19703
Status Ok
Gravity strain FS 4.03 €u / € = 6.5 / 1.61
Buckling FS 7.57 Pcr / P = 25542 / 3372.5
DBE strain FS 1.44 €u / € = 6.5 / 4.5
Buckling FS 2.4 Pcr / P = 19703 / 8206
MCE strain FS 1.44 €u / € = 6.5 / 4.5
Buckling FS 2.4 Pcr / P = 19703 / 8206
Reduced area / Gross area 98.6 at MCE = Ar / Ab
Max shear strain at MCE = €sh
DBE MCE Comments
Effective period TD TM 2.38 2.4
From seismic performance Displacement DD DM 165 15
Total Displacement DTD DTM 206 206
Force co- efficient Vb / w 0.1 0.1 SA
Force co- efficient Vs / w 0.05 SA / R1
1.5 x yield force / w Fy / w
Wind force / w 0.018 Fw / w
Fixed base v @ TD From UBC
International Research Journal of Engineering and Technology (IRJET) e-ISSN: 2395 -0056
Volume: 03 Issue: 12 | Dec -2016 www.irjet.net p-ISSN: 2395-0072
© 2016, IRJET | Impact Factor value: 4.45 | ISO 9001:2008 Certified Journal | Page 614
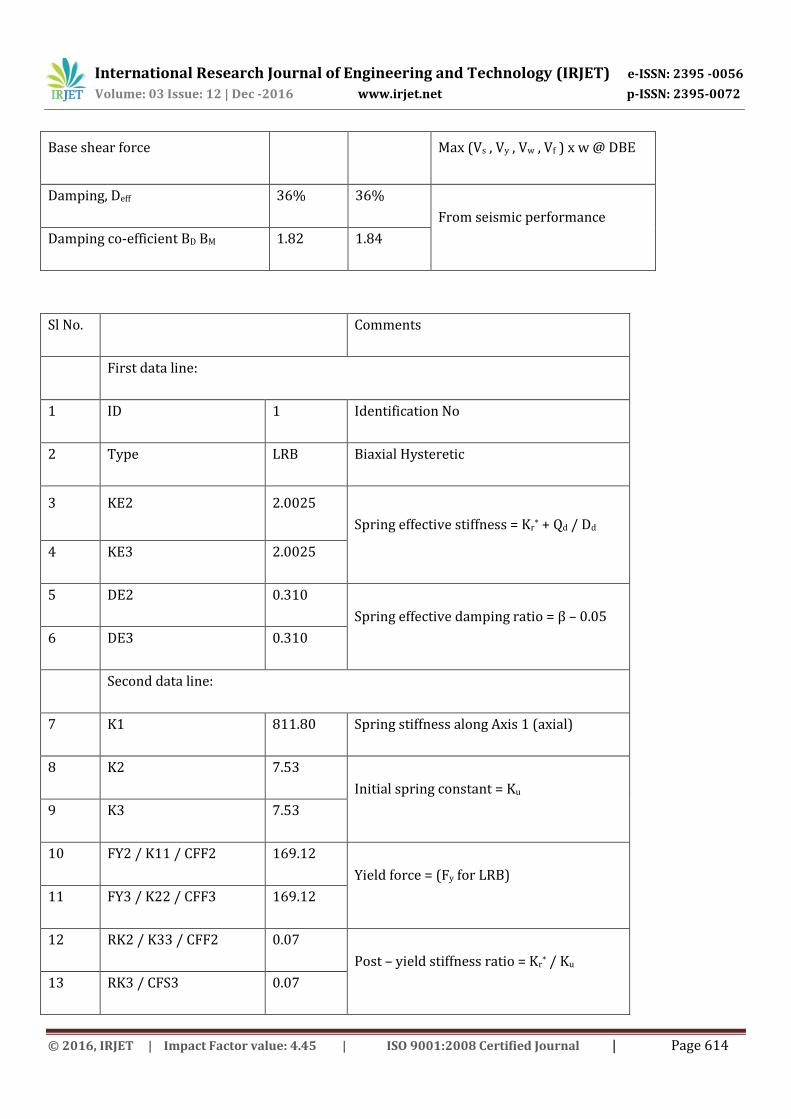
Base shear force Max (Vs , Vy , Vw , Vf ) x w @ DBE
Damping, Deff 36% 36%
From seismic performance
Damping co-efficient BD BM 1.82 1.84
Sl No. Comments
First data line:
1 ID 1 Identification No
2 Type LRB Biaxial Hysteretic
3 KE2 2.0025
Spring effective stiffness = Kr* + Qd / Dd
4 KE3 2.0025
5 DE2 0.310
Spring effective damping ratio = β – 0.05
6 DE3 0.310
Second data line:
7 K1 811.80 Spring stiffness along Axis 1 (axial)
8 K2 7.53
Initial spring constant = Ku
9 K3 7.53
10 FY2 / K11 / CFF2 169.12
Yield force = (Fy for LRB)
11 FY3 / K22 / CFF3 169.12
12 RK2 / K33 / CFF2 0.07
Post – yield stiffness ratio = Kr* / Ku
13 RK3 / CFS3 0.07

International Research Journal of Engineering and Technology (IRJET) e-ISSN: 2395 -0056
Volume: 03 Issue: 12 | Dec -2016 www.irjet.net p-ISSN: 2395-0072
© 2016, IRJET | Impact Factor value: 4.45 | ISO 9001:2008 Certified Journal | Page 615
Hysteresis properties
Displacement Force Comments
Yield displacement 22.45 Bearing properties
Design displacement 160 DBE properties
Yield force, Fy 169.12 Bearing properties
Origin 0 0 Start of plot
Point A 22.45 169.12
∆ = ∆Y
F = Fy
Point B 160 320.4
∆ = DD
F = QD + DD Kr*
Point C 115.1 -17.84
∆ = DD - 2∆Y
F = QD + DD Kr* - 2Fy
Point D -160 -320.4
∆ = -DD
F = - QD - DD Kr*
Point E -115.1 -17.84
∆ = - DD + 2∆Y
F = - QD - DD Kr* + 2Fy
Point A 22.45 169.12
∆ = ∆Y
F = Fy

International Research Journal of Engineering and Technology (IRJET) e-ISSN: 2395 -0056
Volume: 03 Issue: 12 | Dec -2016 www.irjet.net p-ISSN: 2395-0072
© 2016, IRJET | Impact Factor value: 4.45 | ISO 9001:2008 Certified Journal | Page 616
4. RESULT AND DISCUSSION
4.1 RESULTS:
It is compared for behavior of base isolated structure with fixed base structure under seismic load. From this it
have been observed that structural effects like story displacement, story drift, base shear of structure are reduced
due to use of the isolators. The above results-parameters of structural effects like story displacement, story drift.
4.1.1 Response of symmetric model of fixed base and LRB base isolated structure (G+4)
Table 4 max story displacement of (G + 4) structure
Story NO
Story displacement (m)
Symmetrical Plan (G+4)
Fixed base Base Isolation
Headroom 0.0125 0.0159
4 0.0102 0.0151
3 0.0084 0.0146
2 0.0045 0.0138
1 0.0025 0.0125
Base 0.0000 0.0102

International Research Journal of Engineering and Technology (IRJET) e-ISSN: 2395 -0056
Volume: 03 Issue: 12 | Dec -2016 www.irjet.net p-ISSN: 2395-0072
© 2016, IRJET | Impact Factor value: 4.45 | ISO 9001:2008 Certified Journal | Page 617
Graph 5.1 Floor level vs displacement of fixed base structure (G+4)
Graph 5.2 Floor level vs displacement of LRB base isolation structure (G+4)

International Research Journal of Engineering and Technology (IRJET) e-ISSN: 2395 -0056
Volume: 03 Issue: 12 | Dec -2016 www.irjet.net p-ISSN: 2395-0072
© 2016, IRJET | Impact Factor value: 4.45 | ISO 9001:2008 Certified Journal | Page 618
4.1.2 Response of symmetric of fixed base and LRB base isolated structure (G + 14)
Table 5 Max story displacement of (G + 14) structure
Story NO
Story displacement (m)
Symmetrical Plan (G+14)
Fixed base Base Isolation
Headroom 0.0201 0.0371
14 0.0197 0.0367
13 0.0191 0.0362
12 0.0184 0.0356
11 0.0175 0.0350
10 0.0166 0.0343
9 0.0154 0.0338
8 0.0141 0.0326
7 0.0127 0.0317
6 0.0112 0.0307
5 0.0095 0.0295
4 0.0078 0.0283
3 0.0059 0.0269
2 0.0040 0.0255
1 0.0020 0.0239
Base 0.0000 0.0221

International Research Journal of Engineering and Technology (IRJET) e-ISSN: 2395 -0056
Volume: 03 Issue: 12 | Dec -2016 www.irjet.net p-ISSN: 2395-0072
© 2016, IRJET | Impact Factor value: 4.45 | ISO 9001:2008 Certified Journal | Page 619
Graph 5.3 Floor level vs displacement of fixed structure (G+14)
Graph 5.4 Floor level vs displacement of LRB base isolation structure (G+14)

International Research Journal of Engineering and Technology (IRJET) e-ISSN: 2395 -0056
Volume: 03 Issue: 12 | Dec -2016 www.irjet.net p-ISSN: 2395-0072
© 2016, IRJET | Impact Factor value: 4.45 | ISO 9001:2008 Certified Journal | Page 620
4.1.3 Deformed shape of structure with fixed base and base isolation structure
Fig 5.1 Deformed shape of fixed base structure from ETABS window
Fig 5.2 Deformed shape of base isolation structure from ETABS window

International Research Journal of Engineering and Technology (IRJET) e-ISSN: 2395 -0056
Volume: 03 Issue: 12 | Dec -2016 www.irjet.net p-ISSN: 2395-0072
© 2016, IRJET | Impact Factor value: 4.45 | ISO 9001:2008 Certified Journal | Page 621
5. CONCLUSION & FUTURE SCOPE
Base isolation is very promising technology to protect different structures like buildings, bridges, airport terminals and nuclear
power plants etc. from seismic excitation.
Storey drift decreases whereas generally lateral displacement increases in base isolated building.
Fixed base buildings have zero storey acceleration at base of building whereas, in case of base isolated building appreciable
amount of storey acceleration will been found out at base.
The variation in maximum displacement of stories in base isolated model is very low while compared with fixed base model.
The significant characteristic of base isolation a system affect the superstructure to have a rigid movement and as a result
shows the relative story displacement & story drift of structural element will decrease and consequently the internal forces of
beams and columns will be reduced.
From the above points, it is concluded that the performance of isolated structure is efficient in the Earthquake prone areas.
The analysis of structure is carried out by considering ZONE II, but further it is to be analyzed by considering all zones in India.
In Future, the analysis is to be carried out by using other national codes such as Euro Codes& British Codes.
7. BIBILOGRAPHY
CODES:
1. IS 1893(Part I): 2002, “CRITERIA FOR EARTHQUAKE RESISTANT DESIGN OF STRUCTURES: PART I GENERAL
PROVISIONS AND BUILDINGS,” (Fifth Revision), Bureau of Indian Standards, New Delhi, February 2006.
2. IS 456: 2000, “PLAIN AND REINFORCED CONCRETE- CODE OF PRACTICE,” (Forth Revision), Bureau of Indian
Standards, New Delhi, November 2005.
3. IS 875(Part I): 1987, “CODE OF PRACTICE FOR DESIGN LOADS (OTHER THAN EARTHQUAKE) FOR BUILDINGS
AND STRUCTURES - DEAD LOADS”, Bureau of Indian Standards, New Delhi, February 1989.
4. IS 875(Part II): 1987, “CODE OF PRACTICE FOR DESIGN LOADS (OTHER THAN EARTHQUAKE) FOR BUILDINGS
AND STRUCTURES - IMPOSED LOADS”, Bureau of Indian Standards, New Delhi, March 1989.
5. IS 875(Part III): 1987, “CODE OF PRACTICE FOR DESIGN LOADS (OTHER THAN EARTHQUAKE) FOR BUILDINGS
AND STRUCTURES - WIND LOADS”, Bureau of Indian Standards, New Delhi, February 1989.
6. IS 875(Part V): 1987, “CODE OF PRACTICE FOR DESIGN LOADS (OTHER THAN EARTHQUAKE) FOR BUILDINGS
AND STRUCTURES - SPECIAL LOADS & LOAD COMBINATIONS”, Bureau of Indian Standards, New Delhi, February
1989.
7. 1997 UNIFORM BUILDING CODE (VOLUME-2)

International Research Journal of Engineering and Technology (IRJET) e-ISSN: 2395 -0056
Volume: 03 Issue: 12 | Dec -2016 www.irjet.net p-ISSN: 2395-0072
© 2016, IRJET | Impact Factor value: 4.45 | ISO 9001:2008 Certified Journal | Page 622
OTHER REFRENCES:
1. Izumi Masanory. Base Isolation and passive Seismic response control, Proceedings of Ninth World Conference on
Earthquake Engineering, VIII, (1988): pp. 385-396
2. Garevski A Mihail. Analysis of 3-D vibrations of the Base Isolated School Building "Pestalozzi" by analytical and
experimental approach, Proceedings of Ninth World Conference on Earthquake Engineering, 12 (2000): pp. 1-8.
3. Murty C.V.R... Earthquake Tips-Learning Earthquake Design and Construction, Kanpur, National Information
Centre for Earthquake Engineering, 2009
4. Constantinou M. C. et al. Non-linear dynamic analysis of multiple building base isolated structures, Computers
and Structures, 50, (1994): pp. 47-57
5. Jain S K and Thakkar S K. Effect of Superstructure Stiffening in Base Isolated Tall Buildings, IE (I) Journal.CV, 85,
(2004): pp. 142-148
6. Jangid R. S. and Kulkarni Jeevan A... Rigid body response of base-isolated structures, Journal of Structural Control,
9, (2002): pp. 171–188
7. Naharajaiah Satish and Sun Xiahong. Seismic Performance of base Isolated Buildings in the 1994 Northridge
Earthquake, Eleventh World Conference on Earthquake Engineering, 598, (1996): pp. 1-8
8. Hang et al. Multifunctional vibration-absorption RC mega frame structures and their seismic responses,
Earthquake Engineering and Structural Dynamics, 29, (2000): pp. 1239-1248
9. Mazza Fabio and Vulcano Alfonso. Base-Isolation techniques for the seismic protection of RC Framed Structures
subjected to near-fault ground motions, 13th World Conference on Earthquake Engineering, 2935, and (2004): pp. 1-
14
10. Palazzo B. and Petti L. Reduction factors for Base Isolated structures, Computers & structures, 60, (1996): pp.
94S-956.
11. Dutta T.K and Jangid R.S. Seismic Reliability of Base Isolated Building Frames, Eleventh World Conference on
Earthquake Engineering, 491, (1996): pp. 1-8
12. Mei C. In-plane Vibrations of Classical Planar Frame Structures – an Exact Wave based Analytical Solution,
Journal of Vibration and Control, 16(9), (2010): pp. 1265– 1285
13. Nagarajaiah Et Al. Nonlinear Dynamic Analysis of 3-D Base- Isolated Structures, Journal of Structural
Engineering, 117, (1991): pp. 2035-2054

International Research Journal of Engineering and Technology (IRJET) e-ISSN: 2395 -0056
Volume: 03 Issue: 12 | Dec -2016 www.irjet.net p-ISSN: 2395-0072
© 2016, IRJET | Impact Factor value: 4.45 | ISO 9001:2008 Certified Journal | Page 623
14. Deb Sajal Kanti. Seismic base isolation – An overview, Current Science, 87, (2004): pp. 1426-1430
15. Kitagawa Yoshikazu et al. Experimental Study on Base Isolation Building using Lead Rubber Bearing through
vibration tests, Ninth World Conference on Earthquake Engineering, V, (1988): pp. 711-716
16. Shenton H. W. and Lin A. N. Relative performance of Fixed-base and Base-isolated concrete frames, Journal of
Structural Engineering, 119, (1993): pp. 2952-2968
17. Luciano M. Bezerra and Rodolfo C. Carneiro. A Numerical Evaluation of Anti- Vibration Mechanisms Applied to
Frame Structures under Earthquake, 17th International Conference on Structural Mechanics in Reactor Technology
(SMIRT 17), 13-2, (2003): pp. 1-8
18. Kang Beom-Soo et al. Dynamic response characteristics of seismic isolation systems for building structures,
Journal of Mechanical Science and Technology, 23 (2009): pp. 2179-2192
19. Ibrahim R.A. Recent advances in nonlinear passive vibration isolators, Journal of Sound and Vibration, 314
(2008): pp. 371–452
20. Providakis C.P. Effect of LRB isolators and supplemental viscous dampers on seismic isolated buildings under
near-fault excitations, 30 (2008): pp. 1187–1198
21. Aiken Ian D. Observed behavior of Seismically Isolated buildings, Journal of Structural Engineering, 125 (1999):
pp. 955-964.
22. Hasebe Akiyoshi. Design experience of a Base-isolation system applied to a Computer Centre Building, Nuclear
Engineering and Design, 127 (1991): pp. 339- 347
23. Hang Dai. Multifunctional vibration-absorption RC mega frame structures and their seismic responses,
Earthquake Engineering and Structural Dynamics, 29 (2000): pp. 1239-1248.
24. Chang Y. F. and Mo Y. L. Application of Base Isolation Concept to Soft First Story Buildings, Computers &
Structures, 55 (1995): pp. 883-896.
25. Jangid R. S. Stochastic response of building frames isolated by lead–rubber bearings, Structural control and
Health Monitoring, 17 (2010):pp. 1–22
26. Dolce M. and Telesca F.R. The design of R/C framed building with nonlinear isolation systems, 7th international
seminar on Seismic isolation, Passive Energy Dissipation and Active Control of Vibrations of Structures, Assisi, Italy,
(2001): pp.1-9

International Research Journal of Engineering and Technology (IRJET) e-ISSN: 2395 -0056
Volume: 03 Issue: 12 | Dec -2016 www.irjet.net p-ISSN: 2395-0072
© 2016, IRJET | Impact Factor value: 4.45 | ISO 9001:2008 Certified Journal | Page 624
BIOGRAPHY
G. PRASHANTH KUMAR was received his bachelor of technology in civil engineering from
Indur Institute of Engineering and Technology in 2013.He is currently a final year student of
master of Technology in Structural Engineering from Indur Institute of Engineering and
Technology. His research covers COMPARATIVE STUDY ON DYNAMIC ANALYSIS OF MEDIUM
AND HIGH RISE RC STRUCTURE WITH AND WITHOUT BASE ISOLATION by using Etabs. He is
having work experience with soft wares such as SAFE, STAAD PRO, EPANET and AUTO CAD.