comparative study of a life cycle assessment for bio
TRANSCRIPT

processes
Article
Comparative Study of a Life Cycle Assessment for Bio-PlasticStraws and Paper Straws: Malaysia’s Perspective
Chun-Hung Moy 1 , Lian-See Tan 1 , Noor Fazliani Shoparwe 2 , Azmi Mohd Shariff 3 and Jully Tan 4,*
�����������������
Citation: Moy, C.-H.; Tan, L.-S.;
Shoparwe, N.F.; Shariff, A.M.; Tan, J.
Comparative Study of a Life Cycle
Assessment for Bio-Plastic Straws and
Paper Straws: Malaysia’s Perspective.
Processes 2021, 9, 1007. https://
doi.org/10.3390/pr9061007
Academic Editors: Pau Loke Show,
Aydin Berenjian, Kit Wayne Chew
and Anil K. Bhowmick
Received: 30 March 2021
Accepted: 2 June 2021
Published: 7 June 2021
Publisher’s Note: MDPI stays neutral
with regard to jurisdictional claims in
published maps and institutional affil-
iations.
Copyright: © 2021 by the authors.
Licensee MDPI, Basel, Switzerland.
This article is an open access article
distributed under the terms and
conditions of the Creative Commons
Attribution (CC BY) license (https://
creativecommons.org/licenses/by/
4.0/).
1 Malaysia-Japan International Institute of Technology, Universiti Teknologi Malaysia, Jalan Sultan Yahya Petra,Kuala Lumpur 54100, Malaysia; [email protected] (C.-H.M.); [email protected] (L.-S.T.)
2 Faculty of Bioengineering and Technology, Jeli Campus, Universiti Malaysia Kelantan, Jeli,Kelantan 17600, Malaysia; [email protected]
3 Chemical Engineering Department, Universiti Teknologi PETRONAS, Seri Iskandar, Perak 32610, Malaysia;[email protected]
4 School of Engineering, Monash University Malaysia, Jalan Lagoon Selatan, Bandar Sunway,Selangor 47500, Malaysia
* Correspondence: [email protected]
Abstract: Plastics are used for various applications, including in the food and beverage industry, forthe manufacturing of plastic utensils and straws. The higher utilization of plastic straws has indirectlyresulted in the significant disposal of plastic waste, which has become a serious environmentalissue. Alternatively, bio-plastic and paper straws have been introduced to reduce plastic waste.However, limited studies are available on the environmental assessment of drinking straws. Lifecycle assessment (LCA) studies for bio-plastic and paper straws have not been comprehensivelyperformed previously. Therefore, the impact of both bio-plastic and paper straws on the environmentare quantified and compared in this study. Parameters, such as the global warming potential (GWP),acidification potential (AP) and eutrophication potential (EP), were evaluated. The input–outputdata of the bio-plastic and paper straws processes from a gate-to-grave analysis were obtainedfrom the literature and generated using the SuperPro Designer V9 process simulator. The resultsshow that bio-plastic straws, which are also known as polylactic acid (PLA) straws, had reducedenvironmental impacts compared to paper straws. The outcomes of this work provide an insight intothe application of bio-plastic and paper straws in effectively reducing the impact on the environmentand in promoting sustainability, especially from the perspective of Malaysia.
Keywords: life cycle assessment; global warming potential; acidification potential; eutrophicationpotential; bio-plastic straws; paper straws
1. Introduction
Plastic pollution is a serious and long-standing issue that threatens human health at aglobal scale. The issue is alarming as plastic is non-biodegradable and does not completelydisintegrate [1]. In fact, Malaysia has been listed as the eighth-worst country worldwidefor the mismanagement of plastic waste [2]. It was estimated that there were almost onemillion tons of mismanaged plastic waste in Malaysia, of which 0.14 to 0.37 million tonsmay have been washed into the oceans in 2010 [3]. The incineration of plastic wastecould emit dioxin, which is carcinogenic and a hormone disruptor, and, with persistentexposure, dioxin can accumulate in human body fat [4] and cause toxicity. Moreover,plastic packaging and straws that have been washed into the ocean and were disposedof in landfills also threaten the lives of the marine and land animals [5]. According to theUnited States National Oceanographic and Atmospheric Administration, plastic debriskills an estimated 100,000 marine mammals and millions of birds and fishes annually [6].
One of the strategies to reduce plastic waste and the resulting pollution issues is toreplace conventional fossil-based plastics, such as polyethylene (PE) and polypropylene
Processes 2021, 9, 1007. https://doi.org/10.3390/pr9061007 https://www.mdpi.com/journal/processes
Processes 2021, 9, 1007 2 of 16
(PP), with bio-plastics. Bio-plastics can be produced from renewable feedstocks withoutdepleting natural resources, and they can biodegrade at a much faster rate than conven-tional plastics. Polylactic acid (PLA) is one of the most commonly used bio-plastics recentlydue to its versatility and biodegradable properties [7]. A previous study reported thatthe application of a polybutylene succinate (PBS) and PLA mixture to produce bio-plasticstraws resulted in a lower carbon footprint compared to conventional PP straws [8].
In addition to bio-plastic, paper is also an alternative to plastic. In comparison to theconventional fossil-based plastics, paper is manufactured from logs wood, which is also arenewable source. Therefore, paper is usually claimed to be more environmentally friendly.However, the usage of either paper straws or bio-plastic straws can also pose some impactson the environment [9].
To date, the study of environmental impacts has been conducted using differentanalytical tools, such as material flow analysis (MFA), environmental impact assessment(EIA), and life cycle assessment (LCA). LCA is defined as the compilation and evaluationof inputs, outputs, and environmental impacts of a product system throughout its life cycleaccording to the ISO 14,040 standard [10]. It is a structured step-by-step framework, whichdefines the goal and functional unit and leads to impact assessment [11].
Among the environmental impact categories, global warming potential (GWP) isan important indicator [12]. GWP represents the amount of carbon dioxide (CO2) andother greenhouse gases (GHGs) emitted over a full life cycle of a process or a product.Meanwhile, acidification potential (AP) is associated with atmospheric pollution arisingfrom anthropogenically derived sulfur (S) and nitrogen (N) as nitrogen oxides (NOx) orammonia (NH3). Anthropogenically derived pollutant deposition was found to enhancethe rate of acidification and increase the natural neutralizing capacity of soils [13]. Soil acid-ification is also one of the major contemporary environmental issues globally. Acidificationpotential is usually calculated in sulfur dioxide equivalents (SO2-eq) [14].
On the other hand, eutrophication potential (EP) is linked to the release of macronu-trients, such as nitrogen (N) and phosphorus (P), into the air, water, and land, which canaffect both aquatic and terrestrial environments. A high level of nutrients can cause adeplorable composition shift in species living in a polluted environment. The presenceof macronutrients in water systems often causes algal blooms, which impact the aquaticecosystem and domestic water quality.
About 300 million tons of plastic products are produced every year, and half of themare single-use types, such as cups, straws, and shopping bags. A preliminary investigationof marine litter pollution along a beach in India during the period of observation fromJanuary to March 2020 found plastic straws as the third most common debris at 9.3% [15]Meanwhile, straws and stirrers ranked fifth, representing 7.9% among the most commondebris found in the International Coastal Ocean Cleanup in year 2019 [16].
In Malaysia, it was estimated that each person uses one straw daily, amounting to30 million straws being used daily. This usage of straws per capita varies from country tocountry. For example, it was estimated that the straw usage in the United States of Americawas at an average daily rate of 1.6 straws per capita. This is a total of 500 million plasticstraws being used every day in the United States alone [17]. In addition, collectively, upto 8.3 billion plastic straws were estimated to pollute the world’s beaches [18]. Therefore,aligning with the global effort to reduce plastic waste, in 2019, the Malaysian governmentimplemented a ban on single-use plastic straws [19]. This increased the awareness ofsustainability and the use of alternative straws. While some may argue the effectiveness ofbanning plastic straw usage to promote a reduction in plastic waste, with the ban on single-use plastic straws, the shift towards alternative straws has been gaining momentum. Tothe best of our knowledge, there is limited environmental analysis of alternative drinkingstraws, especially from the Malaysian perspective. Thus far, there are limited studiesavailable on the environmental assessment of drinking straws. A search of the keyword“drinking straws” in the Scopus database showed 334 available published documents.However, further filtering using the additional search parameter “life cycle assessment”

Processes 2021, 9, 1007 3 of 16
showed seven published documents, of which only one paper was relevant. Limited resultsshowed environmental assessment for different types of plastics and/or straws. LCA ofPP, PLA, paper, glass, and stainless steel from cradle to grave was carried out by Chitakaet al. [20], and the results showed that paper straws had the least impact as compared tothe other types of raw materials. However, Rana [21] found that stainless steel straws hada significantly lower overall environmental impact than that of other straws. LCA for PP,stainless steel, borosilicate glass, paper, bamboo, and wheat stem straws from cradle tograve was performed by Zanghelini et al. [22], and it showed that plastic drinking strawsposed a lower environmental impact when compared to reusable straws. Meanwhile,Chang and Tan [23] developed an integrated sustainability assessment of drinking straws.The study was carried out to quantify the potential environmental impacts of differentdrinking straws based on the scenarios of different countries, such as South Africa [20] andBrazil [22]. However, no studies are found on the environmental assessments of drinkingstraws in a Malaysian scenario.
Information on the environmental impact of bio-plastic and paper is scarce. Hence,a significant research gap was noted in the evaluation of alternative natural drinkingstraws, especially from a Malaysian perspective. Therefore, this study aims to present theenvironmental impacts of both bio-plastic and paper straws from cradle to grave using theLCA approach. Specifically, the main environmental protection indicators, such as GWP,AP and EP, were evaluated. The work flow was arranged such that the methodology ofthe LCA was detailed, followed by the results and discussion. Finally, the conclusion andrecommendations are presented.
2. Methodology2.1. Life Cycle Assessment
There are four phases in a life cycle assessment, which are the goal and scope definition,inventory analysis, impact assessment and interpretation [11]. In this study, an LCA ofbio-plastic and paper straws was carried out to evaluate their impacts on the environment.
2.2. Goal and Scope Definition
The goal of this study was to determine the overall environmental impact of bio-plasticand paper straws from the manufacturing of the raw materials (gate) to their end-of-life(grave). To compare the environmental impacts of bio-plastic and paper drinking straws,data were normalized to a functional unit of 100 units of drinking straws produced whichwas equivalent to 133 g of bio-plastic straws (given 1.33 g per straw) or 260 g of paperstraws (given 2.60 g per straw).
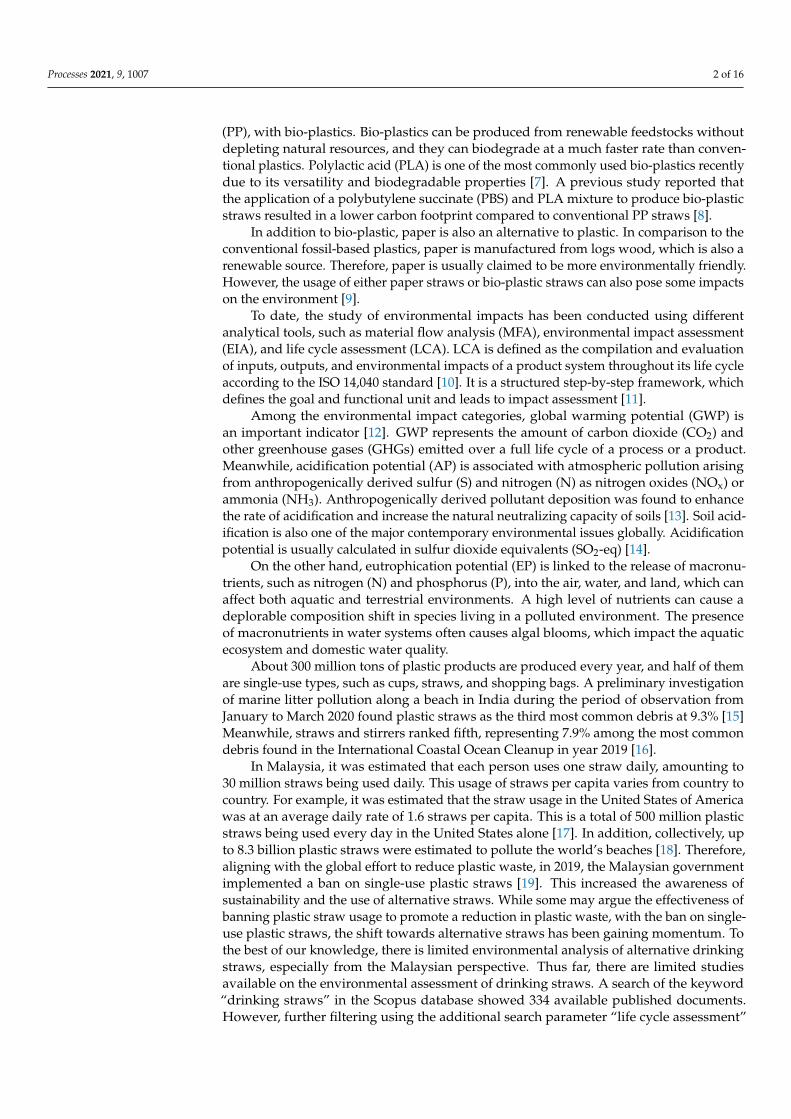
Figures 1 and 2 illustrate the bio-plastic straws and paper straws system boundariesin the study, respectively. The input and output data presented included each processthat releases environmental pollutants, such as carbon monoxide (CO), carbon dioxide(CO2), nitrogen oxide (NOx), nitrous oxide (N2O), methane (CH4), ammonia (NH3), sulfurdioxide (SO2) and volatile organic compounds (VOC) into the atmosphere. Based onFigure 1, raw materials (raw corns, NH3 solution, sulfuric acid, and protease), electricity,and diesel fuel are fed into the system. Meanwhile, for the quantification of GWP, AP, andEP, the pollutants (CO, CO2, NOx, N2O, CH4, NH3, SO2, and VOC) were considered asthe outputs.

Processes 2021, 9, 1007 4 of 16Processes 2021, 9, x FOR PEER REVIEW 4 of 17
Figure 1. Overall system boundary of bio-plastic straws from gate to grave. Figure 1. Overall system boundary of bio-plastic straws from gate to grave.

Processes 2021, 9, 1007 5 of 16Processes 2021, 9, x FOR PEER REVIEW 5 of 17
Figure 2. Overall system boundary of paper straws from gate to grave.
The manufacturing process of bio-plastic straws consists of six main steps: the pro-duction of corn starch, the production of lactic acid, the production of bio-plastic, the pro-duction of bio-plastic straws, delivery to consumers, disposal, and transportation. During the production of raw corn starch, processes involved include corn steeping and the sep-aration of germ, fiber, gluten, and starch, which were considered for the input–output data analysis [24]. Next, lactic acid was produced from corn starch by saccharification of starch followed by the fermentation of dextrose into lactic acid, microfiltration, acidifica-tion, rotary vacuum filtration, and, finally, evaporation. The bio-plastic production also included processes such as condensation, depolymerization, ring-opening polymeriza-tion, crystallization and granulation. Before the final step (straw delivery), extrusion, in-jection molding, labeling, and packaging steps were carried out. As bio-plastic straws are utilized for a single use, different disposal methods (landfills, incineration and compost-ing) were evaluated. The wastes were equally divided among three different disposal methods with 33% for each. Moreover, the transportation of raw materials to the produc-tion site and the transportation of products to the consumer and to the disposal site were also considered in this study. It should be noted that there is no transportation between Section 2 (lactic acid preparation), Section 3 (bio-plastic production), and Section 4 (bio-plastic straw production) as these sections are assumed to occur at the same manufactur-ing facility (as shown in the Figure 1).
Figure 2. Overall system boundary of paper straws from gate to grave.
The manufacturing process of bio-plastic straws consists of six main steps: the pro-duction of corn starch, the production of lactic acid, the production of bio-plastic, theproduction of bio-plastic straws, delivery to consumers, disposal, and transportation. Dur-ing the production of raw corn starch, processes involved include corn steeping and theseparation of germ, fiber, gluten, and starch, which were considered for the input–outputdata analysis [24]. Next, lactic acid was produced from corn starch by saccharification ofstarch followed by the fermentation of dextrose into lactic acid, microfiltration, acidifica-tion, rotary vacuum filtration, and, finally, evaporation. The bio-plastic production alsoincluded processes such as condensation, depolymerization, ring-opening polymerization,crystallization and granulation. Before the final step (straw delivery), extrusion, injectionmolding, labeling, and packaging steps were carried out. As bio-plastic straws are utilizedfor a single use, different disposal methods (landfills, incineration and composting) wereevaluated. The wastes were equally divided among three different disposal methods with

Processes 2021, 9, 1007 6 of 16
33% for each. Moreover, the transportation of raw materials to the production site and thetransportation of products to the consumer and to the disposal site were also considered inthis study. It should be noted that there is no transportation between Section 2 (lactic acidpreparation), Section 3 (bio-plastic production), and Section 4 (bio-plastic straw production)as these sections are assumed to occur at the same manufacturing facility (as shown in theFigure 1).
In addition, Figure 2 illustrates the overall system boundary of paper straws fromthe gate to the grave. The setting of the system boundaries was performed in mannersimilar to that of the bio-plastic straw products. The boundaries consisted of six sectionsof processes that started from the wood preparation, kraft pulping, papermaking, paperstraw production, delivery to consumer and disposal site and transportation. The firstthree steps are the extraction and manufacturing processes of raw materials for paperstraw production. The first step was the wood preparation, which consisted of debarking,chipping and conveying. The next step was the kraft pulping process, which consistedof three main units (energy generation, chemical recovery, and wastewater treatment).The papermaking process also involved paper refining and screening, paper reforming,pressing, finishing and drying before the production of paper straws. In the production ofpaper straws, there are five main units, which are the paper feeder, glue feeder, windingunit, cutting, and the collection unit. Similar to bio-plastic straws, paper straws are utilizedfor a single use. Therefore, the disposal methods of the bio-plastic straws, such as landfills,incineration, and composting, were included. The transportation of raw materials to theproduction site and the transportation of products to the consumer and the disposal sitewere also considered in this study. Similarly, for the bio-plastic straw, it should be notedthat there was no transportation between Section 1 (wood preparation), Section 2 (kraftpulping process), and Section 3 (papermaking process) as these sections are assumed tooccur at the same manufacturing facility (as shown in Figure 2).
2.3. Inventory Analysis
A process simulation model was developed using a SuperPro Designer V9.0 based onFigures 1 and 2. The process simulation flowsheet of bio-plastic and paper straws is shownin Figures S1–S7 (Supplementary Data). The following assumptions and limitations weremade for the inventory analysis:
• All calculations were based on 100 units of drinking straws produced, which wereequal to 133 g of bio-plastic straws and 260 g of paper straws.
• Corn starch production was adapted from the corn refinery simulation [24].• Similar physical properties in the injection molding of the PLA and the PP were
assumed as the PLA straws are very flexible and perform similarly to conventionalplastic straws made of PP [25].
• For the kraft pulping process, biomass combustion was used in the energy generation,which is commonly used in the pulp and paper industry [26].
• The disposal of bio-plastic and paper straws was equally divided between a compositefacility, landfill and incineration. A similar amount of bio-plastic paper straws for eachdisposal method was ensured. The equal division was assumed for different disposalmethods in order to analyze how each of the processes contributes to the GWP andAP [27].
• The landfill sites of bio-plastic and paper straws are located in Malaysia. Thus, bothlandfill sites have similar site characteristics, i.e., weather, humidity and temperature.
• The transportation of raw materials to the manufacturing site, the transportation of theproduct to the customer and the transportation of used bio-plastic and paper strawsto disposal sites were based on the actual location of the supply chain in PeninsularMalaysia as a case study.
The equipment set-up in the process simulator SuperPro Designer v9.0 (by IntelligenInc., Scotch Plains, NJ, USA) is illustrated in the Supplementary Data (Tables S1–S7). Basedon the input as stipulated in Tables S1–S7, SuperPro Designer performs thorough material

Processes 2021, 9, 1007 7 of 16
and energy balances and calculates each of the process’s environmentally significant streamproperties. Then, the data are tabulated for further analysis. Details of the process datainventory for bio-plastic and paper straws can be obtained from the Supplementary Data(Tables S8 to S10). The quantity of the power consumption and emission of pollutants(mass of pollutant, mi) from each of the unit processes of the bio-plastic and paper strawproduction are essential to calculate the environmental impact categories.
2.4. Impact Assessment
The purpose of the impact assessment is to convert and aggregate the inventoryanalysis findings into the relevant environmental indicator. This can be explained as thetransformation of the inventory results into the number of contributions to environmentalimpact categories (GWP, AP and EP). The main environmental effects identified by theEuropean Commission in the Economics and Cross-Media Effects document includesglobal warming, acidification, and eutrophication [28].
All the identified environmental potential indexes were evaluated using the expres-sions summarized in Table 1. The main parameters used in the formula are the mass (mi)in kilograms (kg) of a specific pollutant released to the air and pollutant specific weightingfactors (GWPi, APi and EPi). These factors are representative of potential environmentaleffects per mass unit of the specific pollutant.
Table 1. Potential index definitions of the considered environmental effects and respective units ofmeasurement [10,28].
Index Formula Unit of Measure
Global Warming Potential GWP = ∑ GWPi × mi kg CO2 equivalent (kg CO2-eq)
Acidification Potential AP = ∑ APi × mi kg SO2 equivalent (kg SO2-eq)
Eutrophication Potential EP = ∑ EPi × mi kg PO4 equivalent (kg PO4-eq)
Each of the environmental potential indexes was evaluated as the sum of the effectsof several pollutants based on the data tabulated in Tables S8 to S10. Each pollutantmass (mi) was weighted by a specific weighting factor, which was expressed based ona reference substance. This allows a direct comparison and summation of the effects ofseveral unrelated pollutants according to a cross-media effect assessment approach.
The specific weighting factor values for selected pollutants are listed in Table 2. Theweight of various pollutants can be different as displayed in Table 2. In general, the sumof each considered potential index can be calculated once the pollutant mass levels arespecified using the expression and specific factors reported in Tables 1 and 2, respectively.For instance, to calculate the GWP for Section 1 of bio-plastic straws production, all thepollutants related to GWP were taken into the calculation, as shown in Table 3. The totalGWP of individual process (such as corn steeping) can be calculated (0.26 × 2 + 0.03 ×3 + 1100)/1000 = 1.1). The total GWP of Section 1 is the summation of the GWP of eachindividual process.
Table 2. List of specific weighting factors for the pollutants [10,28,29].
Item of MeasurementGWPi APi EPi
kg CO2-eq/kg kg SO2-eq/kg kg PO4-eq/kg
CO 2 0 0NOx 0 0.7 0.13SOx 0 1 0VOC 3 0 0NH3 0 1.88 0.35CO2 1 0 0CH4 23 0 0N2O 310 0 0

Processes 2021, 9, 1007 8 of 16
Table 3. Example illustration of calculation for environmental impact category versus pollutants mass.
Pollutants GWPi
Corn Starch Production (Section 1)Corn
SteepingGerm
SeparationFiber
SeparationGluten
SeparationStarch
Separation
CO (g) 2 2.6 × 10⁻¹ 1.5 7.7 × 10⁻¹ 6.0 × 10⁻¹ 8.0 × 10⁻¹
VOC (g) 3 3.0 × 10⁻² 1.7 × 10⁻¹ 8.9 × 10⁻² 6.9 × 10⁻² 9.2 × 10⁻²
CO2 (g) 1 1.1 × 10³ 6.3 × 10³ 3.4 × 10³ 2.6 × 10³ 3.5 × 10³
Total GWP 1.1 6.3 3.4 2.6 3.5Overall GWP 16.9 kg CO2-eq/100 straws
The generation of 1 MJ of electricity emits a specific amount of pollutants [30,31] andfurther contributes to the GWP, AP and EP. The GWP is impacted by CO, CO2 and VOC,while the AP is impacted by SO2 and NOx. The EP is impacted by NOx. The GWP isimpacted by CO, CO2 and VOC, while the AP is impacted by SO2 and NOx. The EP isimpacted by NOx. These data were obtained from the power consumption of Tables S8–S10(Supplementary Data).
The transportation distances from the corn plantation site to the corn starch productionsite, corn starch production site to straw manufacturing plant, straw manufacturing plantto consumer and, finally, consumer to the disposal site (i.e., incinerator, composting facility,and landfill) were taken into consideration based on the sites in Malaysia. The total distanceof bio-plastic straws is tabulated in Table 4. Similarly, Table 5 illustrates the transportationdetails of the paper straws, which include the transportation of raw wood to the paper mill,paper to paper straws, paper straws to the consumers, and, lastly, the used paper strawstransferred for end-of-life processing.
Table 4. Transportation distance for bio-plastic straws.
Starting Point Destination Distance (km)
Raw Corn Corn Starch 187Corn Starch Bio-Plastic Straws 202
Bio-Plastic Straws Consumer 50
ConsumerIncineration Plant 562
Composting Facility 315Landfill 27
Total distance (km) 1343
Table 5. Transportation distance for paper straws.
Starting Point Destination Distance (km)
Wood Supplier Paper Mill 59Paper Mill Paper Straw 119
Paper Straw Consumer 50
ConsumerIncineration Plant 252
Composting Facility 31Landfill 33
Total distance (km) 544
The details of the different locations are referenced based on the existing sites lo-cated in Malaysia (Supplementary Data Figures S9 and S10 for bio-plastic and paperstraws, respectively). It was assumed that a medium- and heavy-duty truck was employedthroughout the transportation of the raw materials and products. The emission factors ofthe transport used are shown in Table 6 to calculate the environmental impact based on thetotal distances in Tables 4 and 5.
Processes 2021, 9, 1007 9 of 16
Table 6. Product transport emission factors [32].
Vehicle Type Medium- and Heavy-Duty Truck
CO2 Factor (kg/km) 0.904716CH4 Factor (g/km) 0.011185N2O Factor (g/km) 0.006835
2.5. Data Interpretation
The final step in the LCA according to the ISO 14,044 standard on environmentalmanagement is interpretation. There are three main objectives of LCA interpretation.The first objective is to identify significant issues based on the LCA results. Next isthe evaluation of completeness, sensitivity and consistency. The results were interpretedaccording to the goal and scope of the study, which includes an assessment and a sensitivityevaluation of the significant inputs, outputs and methodological choices to understand theuncertainty of the results. According to ISO 14044, the process of the completeness checkidentifies any missing or incomplete information which is related to the goal and scopeof the LCA, and, if there is any, it shall be recorded and justified. The consistency checkcan also be defined as a process to determine whether the assumptions, methods and dataare consistent with the goal and scope. The process addressed the data quality, regionaland/or temporal differences, system boundary, and consistency of impact assessment. Thefindings from this research were compared to those of other similar studies to detect anyincomplete or erroneous data. Note that the data input of the equipment setup during theinitial simulation is based on the judgement of the researchers after considering the expertinput and literature review. As such, the value may vary if the type of the equipmentis varied and the efficiency of the equipment is improved. In summary, data validationwas conducted and compared with the published research, and then the conclusions weredrawn in line with the study objectives.
3. Results and Discussion3.1. Overall Result of Bio-Plastic Straws
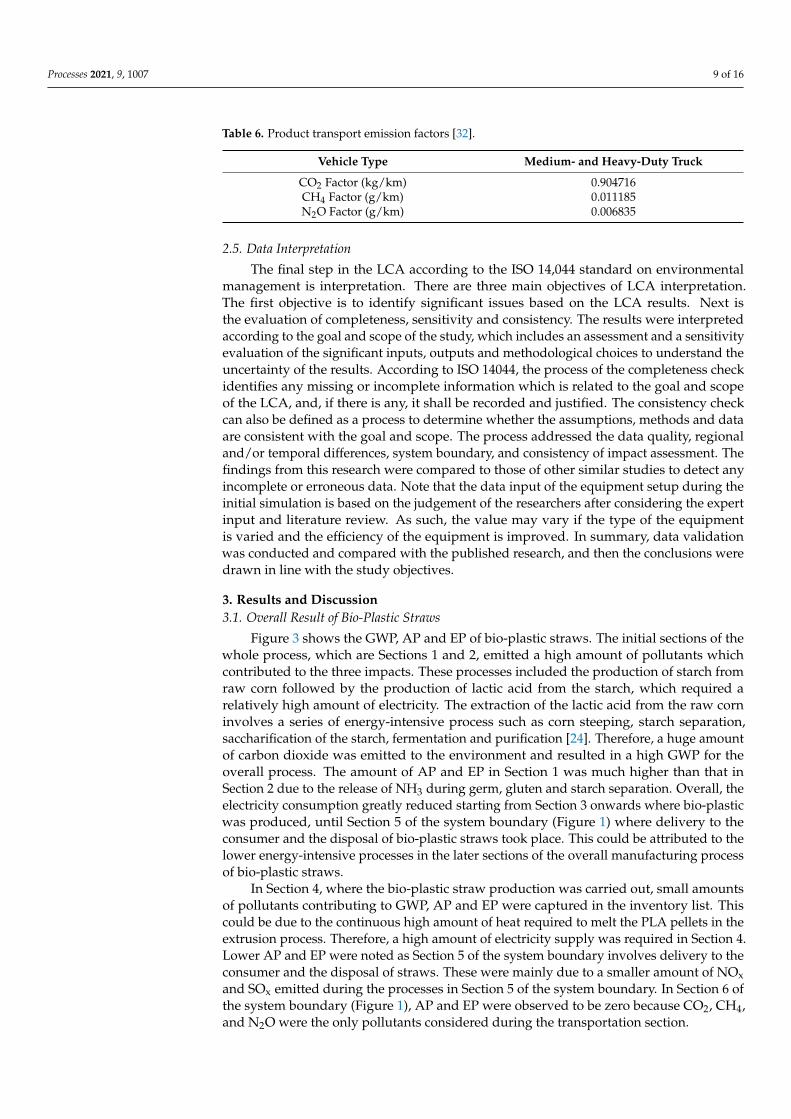
Figure 3 shows the GWP, AP and EP of bio-plastic straws. The initial sections of thewhole process, which are Sections 1 and 2, emitted a high amount of pollutants whichcontributed to the three impacts. These processes included the production of starch fromraw corn followed by the production of lactic acid from the starch, which required arelatively high amount of electricity. The extraction of the lactic acid from the raw corninvolves a series of energy-intensive process such as corn steeping, starch separation,saccharification of the starch, fermentation and purification [24]. Therefore, a huge amountof carbon dioxide was emitted to the environment and resulted in a high GWP for theoverall process. The amount of AP and EP in Section 1 was much higher than that inSection 2 due to the release of NH3 during germ, gluten and starch separation. Overall, theelectricity consumption greatly reduced starting from Section 3 onwards where bio-plasticwas produced, until Section 5 of the system boundary (Figure 1) where delivery to theconsumer and the disposal of bio-plastic straws took place. This could be attributed to thelower energy-intensive processes in the later sections of the overall manufacturing processof bio-plastic straws.
In Section 4, where the bio-plastic straw production was carried out, small amountsof pollutants contributing to GWP, AP and EP were captured in the inventory list. Thiscould be due to the continuous high amount of heat required to melt the PLA pellets in theextrusion process. Therefore, a high amount of electricity supply was required in Section 4.Lower AP and EP were noted as Section 5 of the system boundary involves delivery to theconsumer and the disposal of straws. These were mainly due to a smaller amount of NOxand SOx emitted during the processes in Section 5 of the system boundary. In Section 6 ofthe system boundary (Figure 1), AP and EP were observed to be zero because CO2, CH4,and N2O were the only pollutants considered during the transportation section.

Processes 2021, 9, 1007 10 of 16Processes 2021, 9, x FOR PEER REVIEW 10 of 17
Figure 3. (a) GWP, (b) AP, and (c) EP of 100 units of bio-plastic straws.
In Section 4, where the bio-plastic straw production was carried out, small amounts of pollutants contributing to GWP, AP and EP were captured in the inventory list. This could be due to the continuous high amount of heat required to melt the PLA pellets in the extrusion process. Therefore, a high amount of electricity supply was required in Sec-tion 4. Lower AP and EP were noted as Section 5 of the system boundary involves delivery to the consumer and the disposal of straws. These were mainly due to a smaller amount of NOx and SOx emitted during the processes in Section 5 of the system boundary. In Sec-tion 6 of the system boundary (Figure 1), AP and EP were observed to be zero because CO2, CH4, and N2O were the only pollutants considered during the transportation section.
3.2. Overall Result of Paper Straws Based on Figure 4, it can be observed that Section 2 contributed to the highest GWP,
AP and EP compared to other sections. Section 2 involves the kraft pulping process where wood chips were converted into pulp, which was further processed into paper. There are three main units in the kraft pulping process section, which are the energy generation, chemical recovery and wastewater treatment. The energy generation unit contributed to the highest GWP, AP and EP due to the biomass combustion, which released high amounts of carbon dioxide, methane, nitrous oxide and nitrogen oxides [26].
Figure 3. (a) GWP, (b) AP, and (c) EP of 100 units of bio-plastic straws.
3.2. Overall Result of Paper Straws
Based on Figure 4, it can be observed that Section 2 contributed to the highest GWP,AP and EP compared to other sections. Section 2 involves the kraft pulping process wherewood chips were converted into pulp, which was further processed into paper. There arethree main units in the kraft pulping process section, which are the energy generation,chemical recovery and wastewater treatment. The energy generation unit contributed tothe highest GWP, AP and EP due to the biomass combustion, which released high amountsof carbon dioxide, methane, nitrous oxide and nitrogen oxides [26].
Processes 2021, 9, x FOR PEER REVIEW 11 of 17
Figure 4. (a) GWP, (b) AP, and (c) EP of 100 units of paper straws.
Section 5 of the system boundary, which includes disposal of paper straws by com-posting, landfill or incineration, contributed to the highest GWP, followed by Sections 3 and 4. The highest GWP noted in Section 5 of the system boundary could be attributed to the emission of methane from the landfill. On the contrary, Section 1 (the wood prepara-tion process) contributed to the least GWP. No emission of pollutants was involved in the wood preparation process except a small amount of electricity that was used for the de-barking, chipping, and conveying process [33]. Section 3 (the papermaking process, which consumed a high amount of electricity) contributed to the highest AP compared to other sections. There were several processes in Section 3, which included paper refining and screening, paper forming, pressing, finishing and paper drying. Paper forming, pressing, and finishing processes required the most electricity annually and therefore resulted in a high AP. By contrast, the disposal of paper straws (Section 5 of the system boundary) contributed the least to AP.
3.3. Overall Comparison of Bio-Plastic Straws and Paper Straws Six sections of the life cycle of bio-plastic and paper straws were studied regarding
the GWP, AP and EP. The first three sections were the extraction and production of raw materials, which were the PLA for bio-plastic straws and paper for paper straws. There-fore, Sections 1–3 were grouped as one for comparison, as shown in Figure 5. Based on Figure 5a,b, paper straws contributed to a higher GWP and AP compared to bio-plastic straws concerning the extraction and production of raw materials. Section 1 for the prep-aration of corn starch for bio-plastic straws contributed to the higher GWP and AP com-pared to paper straws (Section 1: wood preparation). The production of starch from raw corn in Section 1 of bio-plastic straws generated a large portion of GWP and AP. This was due to the extraction process of starch, which involved corn steeping and germ, fiber, glu-ten and starch separation. On the contrary, the kraft pulping process in Section 2 of paper straws generated a large portion of GWP and AP due to higher energy generation that involved the combustion of biomasses. Moreover, the papermaking process for paper straws in Section 3 contributed to a higher GWP and AP than the polymerization of lactic acid for bio-plastic straws due to the higher electricity consumption. However, based on
Figure 4. (a) GWP, (b) AP, and (c) EP of 100 units of paper straws.

Processes 2021, 9, 1007 11 of 16
Section 5 of the system boundary, which includes disposal of paper straws by com-posting, landfill or incineration, contributed to the highest GWP, followed by Sections 3and 4. The highest GWP noted in Section 5 of the system boundary could be attributed tothe emission of methane from the landfill. On the contrary, Section 1 (the wood preparationprocess) contributed to the least GWP. No emission of pollutants was involved in the woodpreparation process except a small amount of electricity that was used for the debark-ing, chipping, and conveying process [33]. Section 3 (the papermaking process, whichconsumed a high amount of electricity) contributed to the highest AP compared to othersections. There were several processes in Section 3, which included paper refining andscreening, paper forming, pressing, finishing and paper drying. Paper forming, pressing,and finishing processes required the most electricity annually and therefore resulted ina high AP. By contrast, the disposal of paper straws (Section 5 of the system boundary)contributed the least to AP.
3.3. Overall Comparison of Bio-Plastic Straws and Paper Straws
Six sections of the life cycle of bio-plastic and paper straws were studied regardingthe GWP, AP and EP. The first three sections were the extraction and production of rawmaterials, which were the PLA for bio-plastic straws and paper for paper straws. There-fore, Sections 1–3 were grouped as one for comparison, as shown in Figure 5. Based onFigure 5a,b, paper straws contributed to a higher GWP and AP compared to bio-plasticstraws concerning the extraction and production of raw materials. Section 1 for the prepara-tion of corn starch for bio-plastic straws contributed to the higher GWP and AP comparedto paper straws (Section 1: wood preparation). The production of starch from raw corn inSection 1 of bio-plastic straws generated a large portion of GWP and AP. This was due tothe extraction process of starch, which involved corn steeping and germ, fiber, gluten andstarch separation. On the contrary, the kraft pulping process in Section 2 of paper strawsgenerated a large portion of GWP and AP due to higher energy generation that involvedthe combustion of biomasses. Moreover, the papermaking process for paper straws inSection 3 contributed to a higher GWP and AP than the polymerization of lactic acid forbio-plastic straws due to the higher electricity consumption. However, based on Figure 5c,bio-plastic straws contributed to a higher EP than paper straws, which could be ascribed tothe release of NH3 during germ, gluten, and starch separation in Section 1.
As for Section 4 where the production of drinking straws takes place, based onthe results shown in Figure 6, bio-plastic straws contributed to higher GWP, AP andEP compared to that of paper straws. This could be explained by the energy-intensiveproduction of bio-plastic straws compared to paper straws which involved the process ofextrusion and injection moulding. In contrast, paper straw production does not requirehigh electricity consumption. In Section 5 of the system boundary, delivery to the consumerand the disposal of drinking straws and paper straws contributed to the higher amountof GWP as compared to bio-plastic straws. This was due to the high emission of methaneand carbon dioxide as a result of anaerobic decomposition in the landfill for paper straws.However, both paper and bio-plastic straws contributed to the same amount of AP due tosimilar electricity consumption for composting, landfill and incineration. For Section 6 ofthe system boundary (transportation), bio-plastic straws contributed to a higher GWP ascompared to paper straws. This was due to longer distance travelled in the transport ofbio-plastic straws than paper straws, which was affected by the different locations of theplants in the supply chain of the respective drinking straws. There was no AP and EP foreither bio-plastic or paper straws due to zero AP pollutants for the transportation section.
The AP findings of the present study are consistent with those reported by Chaffeeand Yaros (2007) where an LCA study was conducted to evaluate the environmentalimpact of grocery bags. However, the authors stated that the GWP of paper grocery bagswas lower than that of bio-plastic grocery bags. This was due to the different systemboundary as their study involved the extraction of fuels and feedstocks from the earthwhich included the tree growing process. Therefore, the CO2 emissions, which are one of

Processes 2021, 9, 1007 12 of 16
the main GWP contributors, were greatly reduced, as most of the CO2 was absorbed duringthe photosynthesis process that takes place during the development of trees. Moreover,the raw material of paper bags consisted of a mixture of paper and recycled paper insteadof pure paper that was used for paper straw processing, which also reduced the overallGWP. In contrast, the raw material of bio-plastic does not only consist of PLA but also othercompostable plastics [34]. Therefore, the GWP trend for grocery bags is different from thatof drinking straws; however, the AP pattern is similar.
Processes 2021, 9, x FOR PEER REVIEW 12 of 17
Figure 5c, bio-plastic straws contributed to a higher EP than paper straws, which could be ascribed to the release of NH3 during germ, gluten, and starch separation in Section 1.
Figure 5. (a) GWP, (b) AP, and (c) EP of bio-plastic straws and paper straws for extraction and pro-duction of raw materials.
As for Section 4 where the production of drinking straws takes place, based on the results shown in Figure 6, bio-plastic straws contributed to higher GWP, AP and EP com-pared to that of paper straws. This could be explained by the energy-intensive production of bio-plastic straws compared to paper straws which involved the process of extrusion and injection moulding. In contrast, paper straw production does not require high elec-tricity consumption. In Section 5 of the system boundary, delivery to the consumer and the disposal of drinking straws and paper straws contributed to the higher amount of GWP as compared to bio-plastic straws. This was due to the high emission of methane and carbon dioxide as a result of anaerobic decomposition in the landfill for paper straws. However, both paper and bio-plastic straws contributed to the same amount of AP due to similar electricity consumption for composting, landfill and incineration. For Section 6 of the system boundary (transportation), bio-plastic straws contributed to a higher GWP as compared to paper straws. This was due to longer distance travelled in the transport of bio-plastic straws than paper straws, which was affected by the different locations of the plants in the supply chain of the respective drinking straws. There was no AP and EP for either bio-plastic or paper straws due to zero AP pollutants for the transportation section.
Figure 5. (a) GWP, (b) AP, and (c) EP of bio-plastic straws and paper straws for extraction andproduction of raw materials.
Processes 2021, 9, x FOR PEER REVIEW 13 of 17
Figure 6. (a) GWP, (b) AP, and (c) EP of bio-plastic straws and paper straws for drinking straw production, delivery to the consumer and production and transportation sections.
The AP findings of the present study are consistent with those reported by Chaffee and Yaros (2007) where an LCA study was conducted to evaluate the environmental im-pact of grocery bags. However, the authors stated that the GWP of paper grocery bags was lower than that of bio-plastic grocery bags. This was due to the different system boundary as their study involved the extraction of fuels and feedstocks from the earth which included the tree growing process. Therefore, the CO2 emissions, which are one of the main GWP contributors, were greatly reduced, as most of the CO2 was absorbed dur-ing the photosynthesis process that takes place during the development of trees. Moreo-ver, the raw material of paper bags consisted of a mixture of paper and recycled paper instead of pure paper that was used for paper straw processing, which also reduced the overall GWP. In contrast, the raw material of bio-plastic does not only consist of PLA but also other compostable plastics [34]. Therefore, the GWP trend for grocery bags is different from that of drinking straws; however, the AP pattern is similar.
Overall, as shown in Figure 7, paper straws have a higher GWP and AP compared to bio-plastic straws. However, bio-plastic straws have a slightly higher EP than paper straws, but, generally, the EP for both types of straw is very small and insignificant com-pared to the GWP and AP. The GWP and AP were mainly impacted by the extraction and production of raw materials for the production of drinking straws. This included corn starch production and wood preparation for Section 1, lactic acid production and kraft pulping process for Section 2, and polylactic acid production and papermaking process for Section 3. Overall, based on the simulated case study, bio-plastic straws are found to be a better option compared to paper straws for a milder impact on the environment con-cerning the GWP and AP.
Figure 6. (a) GWP, (b) AP, and (c) EP of bio-plastic straws and paper straws for drinking strawproduction, delivery to the consumer and production and transportation sections.

Processes 2021, 9, 1007 13 of 16
Overall, as shown in Figure 7, paper straws have a higher GWP and AP compared tobio-plastic straws. However, bio-plastic straws have a slightly higher EP than paper straws,but, generally, the EP for both types of straw is very small and insignificant compared to theGWP and AP. The GWP and AP were mainly impacted by the extraction and production ofraw materials for the production of drinking straws. This included corn starch productionand wood preparation for Section 1, lactic acid production and kraft pulping process forSection 2, and polylactic acid production and papermaking process for Section 3. Overall,based on the simulated case study, bio-plastic straws are found to be a better optioncompared to paper straws for a milder impact on the environment concerning the GWPand AP.
Processes 2021, 9, x FOR PEER REVIEW 14 of 17
Figure 7. Overall grand total of GWP, AP, and EP for bio-plastic straws and paper straws.
3.4. Sensitivity Analysis Sensitivity analysis was performed to demonstrate the effects of changing process
variables, i.e., power consumption, on the fluctuation of GWP, AP and EP values of bio-plastic straws and paper straws. The results would enable the analysis of uncertainty propagation in an LCA calculation. The results could also indicate how well the process coped with uncertainty under different conditions [35]. The sensitivity analysis was done by switching the simulation model to rating mode and tested for its robustness. The prob-abilities were calibrated for the LCA outcomes arising from uncertainty in the inventory and from data variation characteristics.
The power consumption for one of the unit operations, which was used for the ex-trusion process in bio-plastic straws production (Section 4), was varied using SuperPro Designer for sensitivity analysis. The effect of the power consumption variation towards the GWP, AP and EP values of bio-plastic straws is shown in Figure 8a. On the other hand, the power consumption for paper drinking straw machine in paper straws production (Section 4) was also varied using SuperPro Designer for similar sensitivity analysis. The result is shown in Figure 8b. The results shown in Figure 8 indicated that the LCA con-ducted in this study experienced a slight increase of its GWP, AP and EP values (at the range of 0.0004–0.500%) when the power consumption increased with an interval of 5–10%, respectively. Hence, the sensitivity analysis conducted in this study showed minimal fluctuations of GWP, AP, and EP values with the variation in the power consumption.
0.00
0.20
0.40
0.60
0.80
1.00
1.20
1.40
1.60
Bio-plastic straws Paper straws0
200
400
600
800
1000
1200
1400
Aci
dific
atio
n &
Eut
roph
icat
ion
Pote
ntia
l(k
g SO
2-eq
/ 100
uni
ts dr
inki
ng st
raw
s)
(kg
PO4-
eq/ 1
00 u
nits
drin
king
stra
ws)
Glo
bal W
arm
ing
Pote
ntia
l (k
g CO
2-eq
/ 100
uni
ts dr
inki
ng st
raw
s)
AP GWP EP
Figure 7. Overall grand total of GWP, AP, and EP for bio-plastic straws and paper straws.
3.4. Sensitivity Analysis
Sensitivity analysis was performed to demonstrate the effects of changing processvariables, i.e., power consumption, on the fluctuation of GWP, AP and EP values of bio-plastic straws and paper straws. The results would enable the analysis of uncertaintypropagation in an LCA calculation. The results could also indicate how well the processcoped with uncertainty under different conditions [35]. The sensitivity analysis wasdone by switching the simulation model to rating mode and tested for its robustness.The probabilities were calibrated for the LCA outcomes arising from uncertainty in theinventory and from data variation characteristics.
The power consumption for one of the unit operations, which was used for theextrusion process in bio-plastic straws production (Section 4), was varied using SuperProDesigner for sensitivity analysis. The effect of the power consumption variation towardsthe GWP, AP and EP values of bio-plastic straws is shown in Figure 8a. On the other hand,the power consumption for paper drinking straw machine in paper straws production(Section 4) was also varied using SuperPro Designer for similar sensitivity analysis. Theresult is shown in Figure 8b. The results shown in Figure 8 indicated that the LCAconducted in this study experienced a slight increase of its GWP, AP and EP values (at therange of 0.0004–0.500%) when the power consumption increased with an interval of 5–10%,respectively. Hence, the sensitivity analysis conducted in this study showed minimalfluctuations of GWP, AP, and EP values with the variation in the power consumption.

Processes 2021, 9, 1007 14 of 16Processes 2021, 9, x FOR PEER REVIEW 15 of 17
Figure 8. Overall GWP, AP, and EP values of (a) bio-plastic straws and (b) paper straws versus power consumption.
4. Conclusions The GWP, AP, and EP of bio-plastic straws were successfully evaluated using the
LCA with data obtained from process simulator. It was found that the corn starch produc-tion contributed to the highest GWP, AP and EP, which was ascribed to energy-intensive processes such as corn steeping and the separation of germ, fiber, gluten and starch. More-over, the GWP, AP, and EP of paper straws were also successfully investigated using the LCA with data obtained from both the literature and the process simulator. The kraft pulping process contributed to the highest GWP, AP, and EP due to the energy generation unit, which involved biomass combustion. The GWP, AP, and EP for both bio-plastic and paper straws were compared for an indication of straws with less environmental impact. It was found that bio-plastic straws have a lower GWP of 26 kg CO2-eq per 100 units of drinking straws, an AP of 0.12 kg SO2-eq per 100 units of drinking straws and an EP of 0.016 kg PO4-eq per 100 units of drinking straws. Additionally, paper straws have a GWP of 1225 kg CO2-eq per 100 units of drinking straws, an AP of 1.5 kg SO2-eq per 100 units of drinking straws and an EP of 0.0002 kg PO4-eq per 100 units of drinking straws. There-fore, concerning the GWP and AP, bio-plastic straws are a better option than paper straws for a milder impact on the environment. Previous studies have shown that plastic straws posed a lower environmental impact compared to reusable straws, and bio-plastic straws showed a lower carbon footprint compared to conventional plastic straws. From this point of view, bio-plastic straws could be a feasible replacement for conventional plastic straws. The outcome of this study is able to serve as a benchmark in selecting alternative straws in efforts towards zero-plastic straws in Malaysia. However, the decision to switch to bio-plastic straws should not be rushed. Comprehensive information related to their biodeg-radability as well as the water and land footprints could be included for consideration to provide a more holistic sustainability assessment of drinking straws.
Supplementary Materials: The following are available online at www.mdpi.com/xxx/s1, Table S1: Equipment details of corn starch production (Section 1) based on SuperPro Designer, Table S2: Equipment details of lactic acid production (Section 2) based on SuperPro Designer, Table S3: Equip-ment details of bio-plastic production (Section 3) based on SuperPro Designer, Table S4: Equipment details of bio-plastic straws production (Section 4) based on SuperPro Designer, Table S5: Equip-ment details of delivery to consumer and disposal of bio-plastic straws (Section 5) based on Su-perPro Designer, Table S6: Equipment details of paper straws production (Section 4) based on Su-perPro Designer, Table S7: Equipment details of delivery to consumer and disposal of paper straws (Section 5) based on SuperPro Designer, Table S8: Process data inventory of bio-plastic straws pro-duction obtained from SuperPro Designer simulator (based on 100 drinking straws unit functional), TableS9: Process data inventory of bio-plastic straws production obtained from SuperPro Designer
Figure 8. Overall GWP, AP, and EP values of (a) bio-plastic straws and (b) paper straws versus power consumption.
4. Conclusions
The GWP, AP, and EP of bio-plastic straws were successfully evaluated using the LCAwith data obtained from process simulator. It was found that the corn starch productioncontributed to the highest GWP, AP and EP, which was ascribed to energy-intensiveprocesses such as corn steeping and the separation of germ, fiber, gluten and starch.Moreover, the GWP, AP, and EP of paper straws were also successfully investigated usingthe LCA with data obtained from both the literature and the process simulator. The kraftpulping process contributed to the highest GWP, AP, and EP due to the energy generationunit, which involved biomass combustion. The GWP, AP, and EP for both bio-plastic andpaper straws were compared for an indication of straws with less environmental impact.It was found that bio-plastic straws have a lower GWP of 26 kg CO2-eq per 100 unitsof drinking straws, an AP of 0.12 kg SO2-eq per 100 units of drinking straws and an EPof 0.016 kg PO4-eq per 100 units of drinking straws. Additionally, paper straws have aGWP of 1225 kg CO2-eq per 100 units of drinking straws, an AP of 1.5 kg SO2-eq per100 units of drinking straws and an EP of 0.0002 kg PO4-eq per 100 units of drinking straws.Therefore, concerning the GWP and AP, bio-plastic straws are a better option than paperstraws for a milder impact on the environment. Previous studies have shown that plasticstraws posed a lower environmental impact compared to reusable straws, and bio-plasticstraws showed a lower carbon footprint compared to conventional plastic straws. Fromthis point of view, bio-plastic straws could be a feasible replacement for conventionalplastic straws. The outcome of this study is able to serve as a benchmark in selectingalternative straws in efforts towards zero-plastic straws in Malaysia. However, the decisionto switch to bio-plastic straws should not be rushed. Comprehensive information relatedto their biodegradability as well as the water and land footprints could be included forconsideration to provide a more holistic sustainability assessment of drinking straws.
Supplementary Materials: The following are available online at https://www.mdpi.com/article/10.3390/pr9061007/s1, Table S1: Equipment details of corn starch production (Section 1) basedon SuperPro Designer, Table S2: Equipment details of lactic acid production (Section 2) based onSuperPro Designer, Table S3: Equipment details of bio-plastic production (Section 3) based onSuperPro Designer, Table S4: Equipment details of bio-plastic straws production (Section 4) basedon SuperPro Designer, Table S5: Equipment details of delivery to consumer and disposal of bio-plastic straws (Section 5) based on SuperPro Designer, Table S6: Equipment details of paper strawsproduction (Section 4) based on SuperPro Designer, Table S7: Equipment details of delivery toconsumer and disposal of paper straws (Section 5) based on SuperPro Designer, Table S8: Processdata inventory of bio-plastic straws production obtained from SuperPro Designer simulator (based on100 drinking straws unit functional), TableS9: Process data inventory of bio-plastic straws productionobtained from SuperPro Designer simulator (based on 100 drinking straws unit functional) (continue),

Processes 2021, 9, 1007 15 of 16
Table S10: Process data inventory of paper straws production obtained from SuperPro Designersimulator (based on 100 drinking straws unit functional), Figure S1: Overall process flow diagram ofthe corn starch production (Section 1), Figure S2: Process flow diagram of the lactic acid production(Section 2), Figure S3: Process flow diagram of the bio-plastic production (Section 3), Figure S4:Process flow diagram of the bio-plastic straws production (Section 4), Figure S5: Process flowdiagram of the delivery consumer and disposal of bio-plastic straws (Section 5), Figure S6: Processflow of the production of paper straws (Section 2), Figure S7: Process flow diagram of the delivery toconsumer and disposal of paper straws (Section 5), Figure S8: Transportation detail for the overallprocess for bio-plastic straws from gate to grave, Figure S9: Transportation detail for the overallprocess for bio-plastic straws from gate to grave.
Author Contributions: C.-H.M.: designed the LCA model and the simulation of the processesand analyzed and interpreted the data. He also wrote the manuscript with input from all authors.L.-S.T.: was involved in planning and supervised the work, reviewed the results and gave finalapproval of the version to be published. N.F.S.: provided a critical review of the manuscript. A.M.S.:was involved in impact assessment and interpretation. J.T.: contributed to the study design andconceptual framework, reviewed the results and gave final approval of the version to be published.All authors have read and agreed to the published version of the manuscript.
Funding: This research was funded by Universiti Teknologi PETRONAS via the Joint ResearchProject (JRP8) funding and Universiti Teknologi Malaysia via Matching Grant (PY/2021/00347).
Institutional Review Board Statement: Not applicable.
Informed Consent Statement: Not applicable.
Data Availability Statement: The data presented in this study are available in the article andSupplementary Materials.
Acknowledgments: Inputs and suggestions from Yeap Swee Pin from UCSI University are gratefullyappreciated.
Conflicts of Interest: The authors declare no conflict of interest.
References1. Pavani, P.; Rajeswari, T.R. Impact of Heavy Metals on Environmental Pollution. J. Chem. Pharm. Sci. 2014, 94, 87–93.2. Tibbetts, J. Managing Marine Plastic Pollution. Environ. Health Perspect. 2015, 123, A90–A93. [CrossRef]3. Malaysian Plastics Manufacturers Association. An Advanced Plastics Recycling Industry for Malaysia; Malaysian Plastics Manufac-
turers Association: Petalin Jaya, Malaysia, 2019; pp. 1–31.4. Darbre, P.D. Overview of air pollution and endocrine disorders. Int. J. Gen. Med. 2018, 11, 191–207. [CrossRef] [PubMed]5. Wilcox, C.; van Sebille, E.; Hardesty, B.D.; Estes, J.A. Threat of plastic pollution to seabirds is global, pervasive, and increasing.
Proc. Natl. Acad. Sci. USA 2015, 112, 11899–11904. [CrossRef] [PubMed]6. Butterworth, A.; Clegg, I.; Bass, C. Untangled. Marine Debris: A Global Picture of the Impact on Animal Welfare and of Animal-Focused
Solutions; World Society for the Protection of Animals: London, UK, 2012; pp. 1–78.7. Prendiz, J.; Mena, M.; Vega-Baudrit, J.R. Polylactic Acid (PLA) As A Bioplastic And Its Possible Applications in the Food Industry.
Food Sci. Nutr. 2019, 5, 048.8. Boonniteewanich, J.; Pitivut, S.; Tongjoy, S.; Lapnonkawow, S.; Suttiruengwong, S. Evaluation of carbon footprint of bioplastic
straw compared to petroleum based straw products. Energy Procedia 2014, 56, 518–524. [CrossRef]9. Gironi, F.; Piemonte, V. Bioplastics and petroleum-based plastics: Strengths and weaknesses. Energy Sources A Recover. Util.
Environ. Eff. 2011, 33, 1949–1959. [CrossRef]10. Guinée, J.B. Handbook on Life Cycle Assessment; Kluwer Academic Publishers: Dordrecht, The Netherlands, 2002; Volume 7.11. Heijungs, R.; Sangwon, S. The Computational Structure of Life Cycle Assessment; Kluwer Academic Publishers: Dordrecht, The
Netherlands, 2002; Volume 11.12. Wu, W. Carbon Footprint A Case Study on the Municipality of Haninge. Master’s Thesis, School of Technology and Health (STH),
Stockholm, Sweden, 2011.13. Kunhikrishnan, A.; Thangarajan, R.; Bolan, N.; Xu, Y.; Mandal, S.; Gleeson, D.; Seshadri, B.; Zaman, M.; Barton, L.; Tang, C.; et al.
Functional Relationships of Soil Acidification, Liming, and Greenhouse Gas Flux. Adv. Agron. 2016, 139, 1–71.14. Hunter, K.A.; Liss, P.S.; Surapipith, L.V.; Dentener, F.; Duce, R.; Kanakidou, M.; Kubilay, N.; Mahowald, N.; Okin, G.; Sarin, M.;
et al. Impacts of anthropogenic SOx, NOx and NH3 on acidification of coastal waters and shipping lanes. Geophys. Res. Lett. 2011,38, 2–7. [CrossRef]
15. Behera, D.P.; Kolandhasamy, P.; Sigamani, S.; Devi, L.P.; Ibrahim, Y.S. A preliminary investigation of marine litter pollution alongMandvi beach, Kachchh, Gujarat. Mar. Pollut. Bull. 2021, 165, 112100. [CrossRef]

Processes 2021, 9, 1007 16 of 16
16. Statista. 2020. Available online: https://www-statista-com.iclibezp1.cc.ic.ac.uk/statistics/726724/weight-of-most-common-items-found-in-global-oceans/ (accessed on 25 May 2021).
17. The Star. Spare that Straw, Please. Available online: https://www.thestar.com.my/news/nation/2017/08/20/spare-that-straw-please-a-seemingly-harmless-tool-that-helps-you-enjoy-your-cold-drinks-is-sapping-t/ (accessed on 17 May 2021).
18. The Sun Daily. The Ban on Single-Use Plastic Straws. Available online: https://www.thesundaily.my/local/the-ban-on-single-use-plastic-straws-DL1836630 (accessed on 17 May 2021).
19. Wong, H.-Y.; Goh, Y.-N.; Kiumarsi, S. Single-Use Straw Ban: Malaysians Behavioural Intentions Towards Reusable Straws; ContemporaryIssues in Business and Management, Graduate School of Business, Universiti Sains Malaysia: Penang, Malaysia, 2019.
20. Chitaka, T.Y.; Russo, V.; von Blottnitz, H. In pursuit of environmentally friendly straws: A comparative life cycle assessment offive straw material options in South Africa. Int. J. Life Cycle Assess. 2020, 25, 1818–1832. [CrossRef]
21. Rana, K. Plasticless: A Comparative Life-Cycle, Socio-Economic, and Policy Analysis of Alternatives to Plastic Straws. Master’sThesis, Michigan Technological University, Houghton, MI, USA, 2020.
22. Zanghelini, G.M.; Cherubini, E.; Dias, R.; Kabe, Y.H.O.; Delgado, J.J.S. Comparative life cycle assessment of drinking straws inBrazil. J. Clean. Prod. 2020, 276, 123070. [CrossRef]
23. Chang, L.; Tan, J. An Integrated Sustainability Assessment of Drinking Straws. J. Environ. Chem. Eng. 2021, 9, 105527. [CrossRef]24. Ramírez, E.C.; Johnston, D.B.; McAloon, A.J.; Singh, V. Enzymatic corn wet milling: Engineering process and cost model.
Biotechnol. Biofuels 2009, 2, 1–9. [CrossRef] [PubMed]25. Mofokeng, J.P.; Luyt, A.S.; Tábi, T.; Kovács, J. Comparison of injection moulded, natural fibre-reinforced composites with PP and
PLA as matrices. J. Thermoplast. Compos. Mater. 2012, 25, 927–948. [CrossRef]26. Jawjit, W.; Kroeze, C.; Soontaranun, W.; Hordijk, L. An analysis of the environmental pressure exerted by the eucalyptus-based
kraft pulp industry in Thailand. Environ. Dev. Sustain. 2006, 8, 289–311. [CrossRef]27. Horan, E.; Norrish, M. Waste management options to control greenhouse gas emissions—Landfill, compost or incineration ? In
Paper for the International Solid Waste Association (ISWA) Conference; ISWA: Vienna, Austria, 2009.28. Branchini, L.; Cagnoli, P.; de Pascale, A.; Lussu, F.; Orlandini, V.; Valentini, E. Environmental assessment of renewable fuel energy
systems with cross-media effects approach. Energy Procedia 2015, 81, 655–664. [CrossRef]29. Morawicki, R.O.; Hager, T. Energy and Greenhouse Gases Footprint of Food Processing. Encycl. Agric. Food Syst. 2014, 3, 82–99.30. Poh, G.K.X.; Chew, I.M.L.; Tan, J. Life Cycle Optimization for Synthetic Rubber Glove Manufacturing. Chem. Eng. Technol. 2019,
42, 1771–1779. [CrossRef]31. Kuan, C.K.; Foo, D.C.Y.; Tan, R.R.; Kumaresan, S.; Aziz, R.A. Streamlined life cycle assessment of residue utilization options in
Tongkat Ali (Eurycoma longifolia) water extract manufacturing process. Clean Technol. Environ. Policy 2007, 9, 225–234. [CrossRef]32. Perumal, A.; Timmons, D. Contextual Density and US Automotive Carbon Dioxide Emissions across the Rural–Urban Continuum.
Int. Reg. Sci. Rev. 2017, 40, 590–615. [CrossRef]33. U.S. Department of Environment. Energy and Environmental Profile of the U.S. Pulp and Paper Industry; U.S. Department of
Environment: Washington, DC, USA, 2005.34. Chaffee, C.; Yaros, B.R. Life Cycle Assessment for Three Types of Grocery Bags -Recyclable Plastic; Compostable, Biodegradable
Plastic; and Recycled, Recyclable Paper. 2007. Available online: https://plastics.americanchemistry.com/Life-Cycle-Assessment-for-Three-Types-of-Grocery-Bags.pdf (accessed on 2 June 2021).
35. Ciroth, A.; Fleischer, G.; Steinbach, J. Uncertainty calculation in life cycle assessments: A combined model of simulation andapproximation. Int. J. Life Cycle Assess. 2004, 9, 216–226. [CrossRef]