comparative life cycle assessment of flooring materials ... · pdf filecomparative life cycle...
TRANSCRIPT
Journal of Cleaner Production 10 (2002) 283–296www.cleanerproduction.net
Comparative Life Cycle Assessment of flooring materials: ceramicversus marble tiles�
Giuseppe M. Nicolettia,*, Bruno Notarnicolab, Giuseppe Tassiellib
a Facolta di Economia, Universita degli Studi di Foggia, via IV Novembre 1, 71100 Foggia, Italyb Dipartimento di Scienze Geografiche e Merceologiche, Facolta di Economia, Universita degli Studi di Bari, via C. Rosalba 53,
70124 Bari, Italy
Received 1 April 2000; received in revised form 15 January 2001; accepted 26 June 2001
Abstract
Flooring materials, particularly ceramic and marble tiles, play a relevant role in the Italian economy since this country coversrespectively 23% and 18% of the world output in this sector. In this paper a comparative Life Cycle Assessment between thesetwo flooring materials has been carried out in order to identify the one with the best environmental profile and the hot spots of thetwo systems. The analysis has shown a better environmental profile for the marble tile, a particular relevance of the energy consump-tion in both the system and, in the ceramic system, the critical point has been found in the raw material used for the glazemanufacturing which are responsible, during the firing process, for the relevant arsenic emissions. 2002 Elsevier Science Ltd.All rights reserved.
Keywords: LCA; Flooring tile; Ceramic; Marble; Glaze
1. Introduction
Building materials represent an important researchfield in the environmentally responsible architecture [1].Different floor coverings have been already studied withthe Life Cycle Assessment (LCA) methodology in orderto identify the so-called environmental hot-spots of thesystems [2–4].
In this paper a comparative LCA between two flooringmaterials, not previously analysed, for buildings hasbeen carried out: marble and ceramic. The choice of thistypology of good is due to their relevance in the Italianeconomy and to the growing interest in environmentalconcerns in the building sector.
Italy is the most important producer of ceramic andmarble tiles for buildings, with a production respectivelyabout 18% and 23% of the world output in this sector[5,6].
� This paper has been presented at the II National Conference onLife Cycle Assessment, Melbourne, 23–24 February 2000.
* Corresponding author. Tel:+39-080-5049084; fax:+39-080-5049019.
E-mail address: [email protected] (G.M. Nicoletti).
0959-6526/02/$ - see front matter 2002 Elsevier Science Ltd. All rights reserved.PII: S0959-6526 (01)00028-2
There are three kinds of flooring ceramic tiles:unglazed (fired ware, red stoneware, porcelain stone-ware, clinker); double-fired glazed; single-fired glazed.Consequently there are three productive processes whichdiffer in the use of glaze and in the number of firingcycles (Table 1).
The 1998 Italian production of tiles for flooring andcoating exceeded 600 million m2, of which 57% wassingle-fired, 15% double-fired, 22% porcelain stoneware,and the remaining shared among other products as plain-fired and complements. In this study the single-firedflooring tiles are assessed.
Table 1Typologies of tiles and technological requirements
Glaze Firing cycles
Before AfterYes No
enamelling enamelling
Unglazed X 1Double-fired X 1 1Single fired X 1
284 G.M. Nicoletti et al. / Journal of Cleaner Production 10 (2002) 283–296
The world-wide production of marble is concentratedin a limited number of countries, particularly the Euro-pean Union which supplies 46% of the globally extractedmarble. Even in this sector Italy plays a primary role,since it is the main producer of raw and decorated mar-ble with 58% of the world exportations of marble pro-ducts [6].
2. Goal and scope definition
2.1. Goal of the study
The goal of the study is to compare the environmentalprofiles of the ceramic and marble tile in order to ident-ify the one with the best environmental profile and thehot spots of the two systems.
2.2. Scope of the study
2.2.1. Systems, function of the systems and functionalunit
The systems of the analysis are the single-fired cer-amic and the marble tile. The function of the system isto ensure a proper cover of a building floor. The func-tional unit chosen is 1 m2 of flooring tile over a periodof 40 years.
2.2.2. System boundariesThe study covers the entire life cycle of the two sys-
tems; only few operations, for which no good data wereavailable, have been excluded. In particular, for both thesystems we have excluded the materials used to fix thetiles, because of lack of good quality data and of theequivalency of the two systems (mortar and adhesives),and all the products used for cleaning and hygiene.
Moreover, for the ceramic tile we have excluded:
� The emissions coming from the neutralisation of theexhausted lime from the abatement of the combustionfumes (Soliroc process) [7] and the sludge comingfrom the treatment of the waste water.
For the marble tile we have excluded:
� The production and the consumption of floor waxused during the tile life, and the production, use anddisposal of the diamond wire.
2.2.3. AssumptionsFor both the systems the following assumptions have
been made:
1. the emissions of the electric energy production arethose relative to the Italian energy system;
2. the distance of the transport of the materials used forthe packaging of the functional unit from the collec-tion point to the municipal solid waste incinerator is10 km;
3. the distance of the transport of the tilling demolitionto the landfill is 20 km.
Ceramic tile:
1. Average weight 18 kg/m2[8].2. The foreground of the manufacturing operations is the
district of Sassuolo, Emilia-Romagna (North Italy).3. The main countries from which the raw materials are
imported have been identified using the ItalianTrade Statistics.
4. The composition of the flue gas are measured down-stream of the exhaust scrubber and of the abatementsplants. These values represent an average of differentplants operating in the district.
5. The manufacturing waste is recycled in the system.6. The average life of the tiles has been assumed to be
twenty years [9] on the basis of consumer preferencesand of their technical characteristics. Consequently,the ceramic tiles have to be replaced once in order tofit in with the functional unit.
Marble tile:
1. The thickness is 1.8 cm and the average weight 48.6kg/m2 [10].
2. The foreground of the manufacturing operations are:the towns of Massa and Carrara, Tuscany (centre ofItaly), which are 50 km from the extraction quarry.
3. The manufacturing waste is recycled out of the sys-tem after the required treatments.
4. The distance of the transport of the sludge from thesedimentation tank to the landfill is 10 km.
5. Disposal in landfill of the filter-press solid waste(called “marmettola” ), since the reuse in cement,paper, varnish and plastic mills is still experimental.
6. The distance of the transport of the marmettola fromthe filter-press to the landfill is 10 km.
7. The average life is 40 years [9], during which twoextraordinary maintenance operations of electric pol-ishing and buffing and 400 ordinary waxing oper-ations (length of each operation: 20 s/m2) with electricmachine by 0.4 kW power have been carried out.
2.2.4. AllocationNo allocation procedure has been done.
2.2.4.1. Ceramic system. The quantities and the pricesof the materials which go out of the system are verysmall compared to those of the main materials: therefore

285G.M. Nicoletti et al. / Journal of Cleaner Production 10 (2002) 283–296
allocation procedures on mass or economic basis aremeaningless.
2.2.4.2. Marble system. Although the quantities ofmaterials which go out of the system are relevant, theyrepresent a waste of the production process; thereforethere is no need to make an allocation on mass basis.Similarly, an economic-basis allocation is meaninglessbecause of the extreme difference in the waste pricescompared to those of the main products of the system.
2.2.5. Impact assessment methodologyThe impact assessment methodology used is the
“problem-oriented” [11] in which, as stated by the ISOseries 14040 [12–15], the inventory data are associatedwith specific environmental impact categories in orderto understand those impacts.
The impact categories which have been consideredare: depletion of abiotic resources; global warming;ozone layer depletion; human toxicity; aquatic toxicity;acidification; nutrification; photochemical oxidant cre-ation. The characterisation factors used are those statedin [11] with the exception of those cases in which factorshave been updated (i.e. new global warming potentialfactors suggested by the IPCC) [16].
The normalisation factors are those on the Europeanscale published by the Directoraat-Generaal Rijkswater-staat [17].
The weighting factors are those published by theNOGEPA (Netherland Oil and Gas Exploration and Pro-duction Association) panel [18].
3. Inventory analysis
3.1. Ceramic tile inventory analysis
The life cycle of the ceramic tile and the relativematerial balance are shown in Fig. 1.
3.1.1. Productive cycleThe ceramic tile productive cycle is made up by two
different stages: the first relative to the body manufactur-ing; (raw materials acquisition, mix preparation, for-ming, drying); and to the glaze manufacturing (rawmaterials acquisition, frit preparation and grinding); thesecond to the laying of the glaze on the body and thesubsequent firing of the glazed body.
3.1.2. Body preparationThe process starts with the wet grinding of the raw
materials in order to obtain a semi-manufactured that,after forming, is dried in kilns. 1.15–1.2 t raw materialsare required to obtain 1 t of finished product.
3.1.2.1. Raw materials. The mix for the body pro-duction is constituted from different raw materials, parti-cularly:
� Argillaceous materials (45%): they supply the wetmix with the plasticity required to obtain tiles which,in the raw state, already have proper mechanicalcharacteristics.
� Degreasing materials (15%): siliceous sand or bauxitewhose function is to rectify the plasticity and shapethe ceramic core. They supply the necessary functionto limit and control the dimensional variations takingplace during the drying and firing operations.
� Soldering materials (40%: feldspars, 25% and lime-stone 15%); they have the function to produce, duringthe firing, a melt phase of proper viscosity whichdetermines the compact and vitreous structure of thefinished product.
� Recovered materials: they are waste from the oper-ations of body preparation, enamelling, firing, exhaus-ted lime from the cleaning of the firing furnace gases.The material balance for the production of 1 m2 ofceramic tile body is shown in Table 2.
3.1.2.2. Mix preparation, forming, drying. Mix prep-aration: this consists of obtaining a material which has anhomogeneous composition and a proper granulometricdistribution. There are three main operations which makeup this productive phase: grinding; mixing-soaking; andregulation of the water content. The first two phases canbe carried out in different ways: dry (grinding of the rawmaterials and subsequent humidity regulation); wet (wetgrinding of the raw materials and subsequent spraydrying). The wet process is assumed in this study.
The main emissions in the atmosphere are relative tothe movement and grinding of the raw materials, withrelevant dust emissions, and to the combustion of natu-ral gas.
In this phase there are no releases into water: it partlyevaporates during drying, partly remains in the dusts. Ifthe forming is carried out with the pressing process thehumidity of the dusts will be between 4% and 7%, whilewith the extrusion process it will be between 15 and20%. In this study the forming with the pressing processhas been assumed.
Forming: the aim of the forming is to mould the tilein the specific “green” format. The result is a compactproduct with the mechanical characteristics required forthe following manufacturing operations.
Drying: this operation enables the removal of thewater required for the forming operation. The operativeconditions must be rigorously monitored in order to pre-vent writhing, breakthroughs or other damage. The driedtile has a water content of �1%. The dryers can be dif-ferent, but usually those with pressed hot air are used.

286 G.M. Nicoletti et al. / Journal of Cleaner Production 10 (2002) 283–296
Fig. 1. Ceramic tile life cycle (mass flow in kg).
3.1.2.3. Glaze manufacturing. The glazes are the vit-reous coating of the tile working surface. They areapplied to the surface of the body in order to make itimpermeable, harder and more resistant, easily cleanedand more attractive.
Part of the raw materials must go through a thermaltreatment, called fritting, which provides insolubility inwater.
3.1.2.4. Raw materials. The glaze raw materials areshown in Table 3. The glaze is made up by one or morefrits and other materials. It can be transparent, opaque,coloured. The opacifers and the colourings are generallymetal oxide compounds.
3.1.2.5. Frit preparation. The frit is prepared after thewet grinding of the raw materials and the subsequent

287G.M. Nicoletti et al. / Journal of Cleaner Production 10 (2002) 283–296
Table 2Materials used for the production of 1 m2 ceramic tile bodya
Raw materials Quantity (kg)
Clay 8.80Feldspars 4.89Soldering 2.93Silicious and feldspars sands 2.81Ground fired waste 0.12Ground raw waste 0.50Exhausted lime 0.004Boron concentrate 0.12Total 20.17
a Source: our elaboration of the ASSOPIASTRELLE data.
Table 3Average composition of the raw materials used in the manufacturingof the frit quantity used in the production of the functional unit
Raw materials Amount (kg)
Zinc oxide 0.076Zirconium powders 0.033Colemanite 0.130Dolomite 0.163Penta-hydrate borax 0.110Quartz and feldspar sands 0.251Feldspar 0.221Aluminium oxide 0.007Lead oxide 0.129Barium oxide 0.010Tin oxide 0.001Titanium oxide 0.002Total 1.13
fusion of the mixture. The vitreous material obtained isadded to the other raw materials, and then further wetground. Its average composition is shown in Table 4.
Table 4Average oxides composition of a frita
Oxides Composition (%)
Na2O 3.9K2O 1.3MgO 0.6CaO 9.1ZnO 8.1Al2O3 6.0ZrO2 2.3SiO2 42.0B2O3 11.4PbO 13.8BaO 1.1SnO2 0.2TiO2 0.2
a Source: our elaboration of the ASSOPIASTRELLE data.
3.1.2.6. Enamelling and firing of the glazed body. Theconventional technique of enamelling is the wet one.
Enamelling: the average quantity of glaze necessaryto cover the surface unit is 1 kg/m2. This operationrequires a relevant quantity of water with consequentgeneration of waste water.
Firing: this enables the tile to obtain the mechanicalcharacteristics required for the different uses and theproperties of chemical inertia. The firing can be conduc-ted in different types of kilns. The operative temperatureis about 1150–1200° and the fuel used is methane.
3.1.2.7. Waste water purification. The average waterrequirements in the production process taken in con-sideration is 0.024 m3/m2 of ceramic tile [19]. The oper-ations which require water are the wet grinding of theraw materials and the preparation and application of theglazes. During these operations about 50% of the wateris lost as steam. The waste water obtained during theglaze purification, about 0.012 m3/m2 of a glazed cer-amic, can be recycled in the grinding of the rawmaterials. Therefore the water requirement of the processis about 0.012 m3/m2 of a glazed tile. In this study it hasbeen supposed that �90% of the waste water is recycled[20] in the system, as shown in Fig. 2.
3.1.3. Packaging, use and disposalThe life cycle of the ceramic tile includes the oper-
ations of packaging, use and disposal. The distributionof tiles is carried out after packaging in cardboard boxeswith polythene sheets.
During the use phase there are no emissions (the useof detergents used for the cleaning of the floor has beenexcluded from the system).
At the end of the life cycle the disposal consists of
Fig. 2. Ceramic system waste water.

288 G.M. Nicoletti et al. / Journal of Cleaner Production 10 (2002) 283–296
demolishing the tiles and transporting these inertmaterials [21] to the landfill.
In Table 5 the energy consumption relative to the mainoperations of the ceramic tile productive cycle areshown.
3.2. Marble tile inventory analysis
The life cycle of the marble tile and the relativematerial balance are shown in Fig. 3.
3.2.1. Productive cycleThe productive cycle of the marble tile is constituted
by the following phases:
� quarry operations;� raw blocks cutting;� cutting of the standard size blocks (“ refilatura” );� polishing, buffing.
3.2.1.1. Quarry operations. The marble is extractedfrom the quarries using different techniques dependingon the characteristics of the rocks and deposits. The maintechnique utilises the diamond wire that, running on therocks, makes a linear cut. In the hollow a water and sandsuspension is thrown. The water has the function to coolthe diamond wire, while the sand is used to improve the
Table 5Primary energy consumption for the manufacturing of a 1 m2 ceramic tilea
Electric energy+thermal energy (MJ)b
Life cycle phase [a] phase Electric energy (kWh) [b] energy Thermal energy (MJ) [c][d=(b×9.2)+c]lectric
Pre-production 2.92 2.24 29.09Body raw materials 0.57 0.36 5.60Transport body raw materials 0.47 1.54 5.86Glaze raw materials 1.87 0.09 17.29Transport of the glaze raw materials 0.01 0.25 0.34
Body production 1.81 49.33 65.97Mix preparation 1.07 40.52 50.36Forming 0.45 4.14Drying 0.29 8.81 11.47
Glaze production 0.16 2.64 4.09Grinding of glaze raw materials 0.03 0.27Frit fusion 0.04 2.64 3.00Frit grinding 0.09 0.82
Production 0.74 52.92 59.72Enamelling 0.18 1.65Firing 0.56 52.92 58.07
Use 0 0 0Disposal 0 2.77 2.77TOTAL 5.63 109.90 161.67
a Source: our elaboration of ASSOPIASTRELLE data.b 1 kWh=9.2 MJ.
abrasive function. After the rocks have been cut thequarry operations end with sectioning and cutting of theblocks. The maximum dimension of the blocks are 24 t(about 8 m3), transportable on truck.
The main impact in this phase is essentially the pro-duction of unformed blocks called “ ravaneti” , scabbingand stony fragments coming from the extractions whichcan be used to fill land or for other economic activities.Other impacts are those related to the use of electricenergy and fuels for the functioning of the equipment.
3.2.1.2. Raw blocks cutting. In the factories the blocksare classified, sorted and cut. The cutting technology ofthe flooring marble tile features the cutting of the largerblocks in smaller sizes; (the length and the width of theseblocks are already those of the final format, the thicknessis five to six times that of the final product). In this phasethe solid waste are constituted by sawing sludge andstony fragments called “cocciame” .
3.2.1.3. Standard blocks cutting, polishing and buffing.The last sawmill operation is the cutting of the stan-
dard size blocks, in order to obtain products of therequired thickness. Usually from a reduced size blockone can obtain four raw marble tiles.
The polishing and buffing operations can be carriedout in factories but, more often, they take place after thelaying. In this study it has been assumed that the firstpolishing and buffing belong to the marble tile pro-duction phase.

289G.M. Nicoletti et al. / Journal of Cleaner Production 10 (2002) 283–296
Fig. 3. Marble tile life cycle (mass flow in kg).
In Table 6 the energy consumption, subdivided in thedifferent phases of the marble tile life cycle, is shown.
3.2.2. Packaging, use and disposalThe finished marble tiles are distributed after packag-
ing in wood boxes, about 0.75 kg wood/m2 of the marbletile. The disposal phase consists of the tilling demolitionand their transfer to the landfill.
4. Impact assessment
In Table 7 the contributions of the impact categoriesto the eco-indicator1. of both the systems are shown. The
1 This term does not refer to the methodologies “Eco-indicator 95”and “Eco-indicator 99” , but to the environmental final score of the sys-tems. For those methodologies see Goedkoop and Spriensma [23,24].
290 G.M. Nicoletti et al. / Journal of Cleaner Production 10 (2002) 283–296
Table 6Primary energy consumption for the production of a 1 m2 marble tile
Electric energy+thermal energy (MJ)a
Life cycle phase [a] Electric energy (kWh) [b] Thermal energy (MJ) [c][d=(b×9.2)+c]
Pre-production 5.94 9.1 63.75Marble extraction 5.94 1.67 56.32Transport 0 7.43 7.43
Production 6.48 0 59.61Raw blocks cutting 1.67 0 15.36Standard blocks cutting 1.94 0 17.85Polishing-buffing 2.87 0 26.40
Use 3.78 0 34.77Disposal 0 3.73 3.73TOTAL 16.2 12.83 161.83
a 1 kWh=9.2 MJ.
Table 7Contributions of the impact categories to the eco-indicator (inpercentages)
Impact categor- Ceramic Marbleies
Eco-indicator % Eco-indicator %
ADP 2.53E-16 0 4.09E-16 0GWP 1.93E-12 46 7.10E-13 37ODP 8.33E-15 0 1.43E-14 1HT 1.24E-12 29 4.47E-13 24ECA 1.36E-13 3 1.36E-13 7AP 6.70E-13 16 4.23E-13 22POCP 1.46E-13 4 5.49E-14 3NP 8.14E-14 2 1.18E-13 6TOTAL 4.21E-12 100 1.90E-12 100
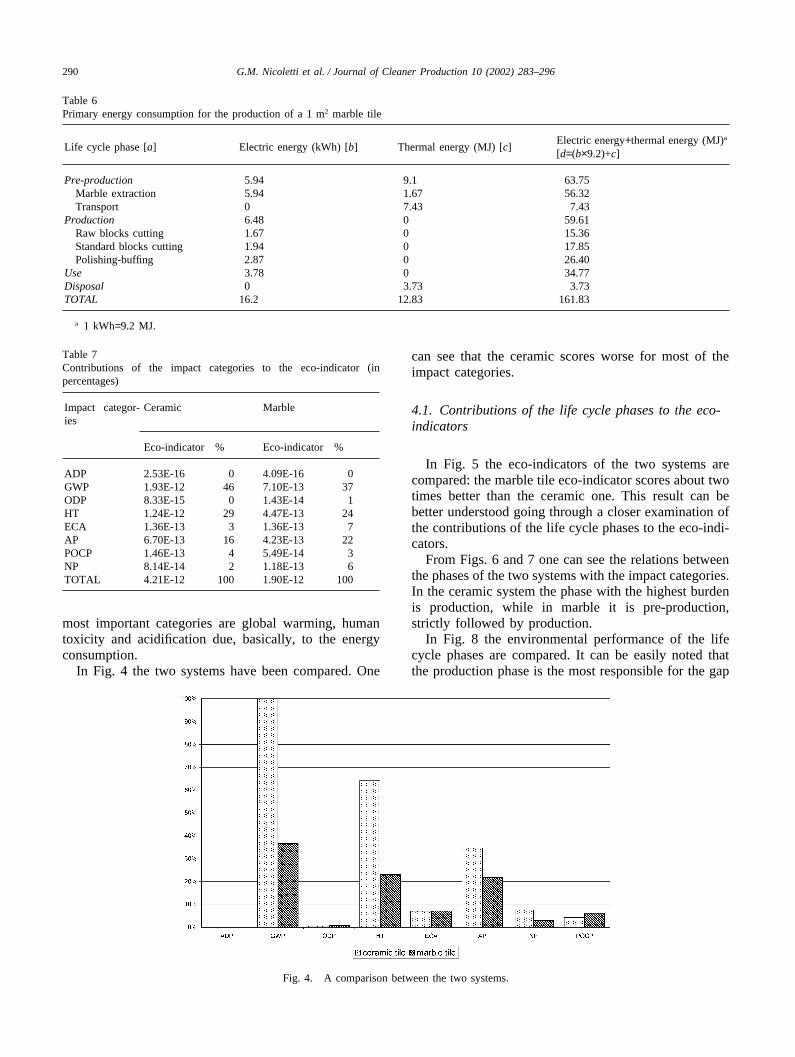
most important categories are global warming, humantoxicity and acidification due, basically, to the energyconsumption.
In Fig. 4 the two systems have been compared. One
Fig. 4. A comparison between the two systems.
can see that the ceramic scores worse for most of theimpact categories.
4.1. Contributions of the life cycle phases to the eco-indicators
In Fig. 5 the eco-indicators of the two systems arecompared: the marble tile eco-indicator scores about twotimes better than the ceramic one. This result can bebetter understood going through a closer examination ofthe contributions of the life cycle phases to the eco-indi-cators.
From Figs. 6 and 7 one can see the relations betweenthe phases of the two systems with the impact categories.In the ceramic system the phase with the highest burdenis production, while in marble it is pre-production,strictly followed by production.
In Fig. 8 the environmental performance of the lifecycle phases are compared. It can be easily noted thatthe production phase is the most responsible for the gap

291G.M. Nicoletti et al. / Journal of Cleaner Production 10 (2002) 283–296
Fig. 5. Eco-indicators.
Fig. 6. Ceramic tile — contributions of the life cycle phases to the eco-indicator.
between the two systems. The use phase also has a rel-evant difference between the two systems.
The environmental impact of the pre-production phasein the ceramic system is shared between the followingoperations: 33% to the extraction and transport of thebody raw materials and 67% to the extraction and trans-port of the glaze raw materials. The environmental rel-evance of the glaze raw material is much more evidentif one considers that the per cent values are relative tothe production of about 20 kg body raw materials andof just 1.13 kg for the glaze.
The production phase can be divided in three groupsof operations:
� body preparation;� glaze production;� production of the glazed tile.
The contribution of the production phase to the eco-indicator is due for the 40% to the body forming, 17%to the glaze production and 43% to the production ofthe glazed tile. In Fig. 9 and Table 8 the relationsbetween the unit operations of the production phase andthe impact categories are shown. The operations of fir-ing, preparation of the mix body and frit fusion appearas the most relevant. The impact categories which aremore involved in these three operations are:

292 G.M. Nicoletti et al. / Journal of Cleaner Production 10 (2002) 283–296
Fig. 7. Marble tile — contributions of the life cycle phases to the eco-indicator.
Fig. 8. Comparison of the life cycle of the two systems.
� Global warming in the operations of preparation ofthe body mix (35%) and of firing (36%), due to therelevant thermal energy consumption.
� Human toxicity in the operations of frit fusion (37%)and firing (30%), due to the emissions of arsenic andlead in the atmosphere.
� Acidification in the operations of firing (41%), prep-aration of the body mix (22%).
From Fig. 10 one can see that even in the marble sys-tem the impact categories mostly involved are global
warming, human toxicity and acidification. In Table 9the relations between the unit operations (marble extrac-tion, blocks cutting, standard blocks cutting, polishingand buffing) and the impact categories are shown. Theunit operation of “marble extraction” appears as the mostrelevant, and this is due to the higher energy consump-tion (see Table 6).
Other environmental effects could derive from the rel-evant quantity of sludge coming from the sawing, pol-ishing and buffing but, while the sludge coming fromthe production phase does not imply relevant disposal

293G.M. Nicoletti et al. / Journal of Cleaner Production 10 (2002) 283–296
Fig. 9. Ceramic tile — environmental profile of the production operations.
Table 8Contributions of the operations groups of the production phase at the impact categories in the ceramic system (in percentages)
Body preparation Glaze production Glazed tile production
Glaze rawMix preparation Forming Drying Frit fusion Frit grinding Glazing Firing
materials grinding
ADP 25 9 7 1 1 2 4 15GWP 35 2 8 0 5 0 1 36ODP 21 9 6 1 1 2 3 11HT 12 2 2 0 37 0 1 30ECA 13 6 4 0 0 1 7 7AP 22 3 3 0 1 1 1 41NP 42 2 4 0 3 0 1 31POCP 16 7 4 0 1 1 3 20TOTALa 25 2 5 0 14 0 1 34
a This total refers to the contribution of each operation to the eco-indicator.
problems, the waste water coming from the quarry oper-ations, if discharged directly in the surface water, couldcause serious damage to the all aquatic life forms.
4.2. Interventions contributions in both the systems
Table 10 shows the contributions of the interventionsto the eco-indicator.
It shows that almost the whole environmental impactof the two systems is due to the emission in the atmos-phere. The incidence of the raw material used as inputsis almost zero, since the raw materials which are usedin the two systems are not considered depletable in thenext 100 years.
As could be expected the most contributing emissionsin both the systems are connected to the electric andthermal energy use. In the case of the ceramic tile, onehas to add the metals emissions due to the specific typeof raw materials used in the glaze production. Parti-cularly the operations which cause these emissions arethe frit fusion and the tile firing (Table 11).
5. Interpretation
The results of the study show that the impacts of boththe systems are due mostly to the energy consumption.In the case of the ceramics there is a significant contri-

294 G.M. Nicoletti et al. / Journal of Cleaner Production 10 (2002) 283–296
Fig. 10. Marble tile — environmental profile of the extraction and production operations.
Table 9Contributions of the pre-production and production phases to the impact categories in the marble system (in percentages)
Pre-production (transport Productionexcluded)
Marble extraction Blocks cutting Standard blocks cutting Polishing and buffing Total
ADP 38 11 13 19 43GWP 36 10 12 17 39ODP 34 10 11 17 38HT 38 11 12 18 41ECA 37 11 12 18 41AP 34 10 11 16 37NP 33 9 10 14 33POCP 33 9 11 15 35TOTALa 36 10 12 17 39
a This total refers to the contribution of each operation to the eco-indicator.
Table 10Contribution of the interventions to the eco-indicator (in percentages)
Ceramic tile Marble tile
Raw materials 0 0Emissions to air 97 93Emissions to water 3 7Solid waste 0 0
bution of a different nature (emissions due to the compo-sition of the raw materials used for the production of theglaze). The arsenic compounds are contained in the rawmaterials used for the preparation of the frit mix, parti-cularly in the boron minerals as colemanite and borite;they are released during the high temperature treatments.The environmental relevance of this pollutant in the cer-amic sector is due to its toxicity and to its high concen-tration in the gaseous emissions coming from these oper-
Table 11Contributions of the main atmosphere emission in the two systems(in percentages)
Atmosphere emissions Ceramic tile Marble tile
CO2 46 36As 10SO2 9 29NOX 8 10SOX 8 2NO2 6NMVOC 1 6Pb 5Ni 3V 2TOTAL 93 88

295G.M. Nicoletti et al. / Journal of Cleaner Production 10 (2002) 283–296
ations. Environmental improvement in the whole profileof the ceramic tile should be directed to a greater yieldin the purification treatments of the flue gases.
Concerning lead, it represents an important element inthe ceramic glazes, where it has a soldering flux functionsupplying brightness. In recent years the lead emissionsof the ceramic sector have been reduced due to the grow-ing diffusion of single-fired tiles that, being manufac-tured at an high temperature, have helped the use of lead-free or low-lead content glazes. However, the growinguse of these typologies of glazes imply a greater use ofraw material with boron with consequent arsenic emis-sions. The choice of one of the different typologies ofglaze leads to a different impact (i.e lead emissions ver-sus arsenic emissions) which could be quantified andcompared in further LCA research. The trend is towardsthe use of boron glazes, which implies that growingarsenic emissions could be expected. Therefore, it is sug-gested that an environmental policy for this pollutantvery similar to that already made for the fluorine will becarried out in the ceramic tile sector.
Fluorine is one of the typical pollutants of the ceramicindustry. The presence of this compound in the atmos-phere emissions is due to the fact that many rawmaterials, particularly clays, contain traces of fluorine[22]. The emissions of these compounds are those com-ing from the firing processes. The surprising result foundwith this study is that the fluorine has a much lowerimpact than could be expected (0.06% of the eco-indicator). The reason has to be found in the new abate-ment technology, forced by new environmental legis-lation, and in the selection of clays with a very low flu-orine content. This is the path for the reduction of arsenicemissions on the basis of the effective example of fluor-ine.
6. Conclusions
The main results of this study are:
1. The life cycle score of the ceramic tile is over twiceas bad as the marble tile (4.21E-12 versus 1.90E-12).
2. The most important impact categories of the lifecycles of the two systems are global warming, humantoxicity and acidification.
3. The phases of the life cycles with the highest burdensare the pre-production in the marble system, the prep-aration of the body, the fusion of the frit and the firingof the glazed body in the ceramic system.
4. The most crucial interventions are among the atmos-phere emissions.
Marble system: CO2, SO2, NOx, NMVOC and met-als.Ceramic system: CO2, As, SO2, NOx, SOx, NO2
and Pb.
5. The source of these emissions has been determined:for the case of marble, during the conversion of fossilfuels in electric energy, which is used very much inthis system. In the ceramic system it is to be foundduring the thermal processes and in the high quantityof potential volatile pollutants that are contained inthe mix raw materials.
6. Better environmental performance can be reached inthe marble system by improving the efficiency of thetechnology in its whole production system in order tosave energy.
7. In the ceramic system the improvements are to befound in a further reduction of the thermal energyconsumption, in the research of plant solutions, whichcould lead to the abatement of the arsenic emissions,and in the research of raw materials with the leastarsenic and other potential pollutants.
References
[1] American Institute of Architects. Environmental resource guide.Chichester: Wiley, 1996.
[2] Sjoberg A, Ekvall T, Olund G. LCA in the environmental man-agement system at Perstorp flooring. In: Proceedings of the 5thLCA Case Studies Symposium SETAC-Europe, 1997:61–7.
[3] Gunther A, Langowsky HC. Life Cycle Assessment study onresilient floor coverings. The International Journal of Life CycleAssessment 1997;2(2):73–80.
[4] Potting J, Blok K. Life Cycle Assessment of four types of floorcovering. Journal of Cleaner Production 1995;3(4):201–13.
[5] Assopiastrelle, Centro Ceramico Bologna, Istituto di Economiadelle Fonti di Energia e dell’Ambiente dell’Universita Bocconi.Environment, Hygiene, Security. EdiCer spa; 1997 [in Italian].
[6] Santoprete G. Tuscanay. Some relevant economic sectors. Tor-ino: Giappicchelli Editore, 1993.
[7] Commissione delle Comunita Europee, Chemical–physical treat-ments of industrial waste. Giornate di Studio Europee a cura diIstituto Europeo delle Acque, le Risorse, la gestione, lo Sviluppo.C.I.P.A. Editore; 1997 [in Italian].
[8] Assopiatrelle. National statistics overview of the ceramic tile sec-tor; 1997 [in Italian].
[9] Carani G, Palmonari C, Timellini G. Flooring material costs. Cer-amica Acta 1997;6 [in Italian].
[10] Corbella E, Zini R. Handbook of marbles, stones and granites,vol. I. 1988 [in Italian].
[11] Heijungs R, Guinee JB, Huppes J, Lankreijer RM, Udo De HaesHA, Wegener Sleeswıjk A, Ansems AM, Eggels PG, Van DuinR, Goede HP. Environmental life cycle assessment of products.Guide and Backgrounds. Leiden (the Netherlands): CML, TNO,B&G, 1992.
[12] International Organization for Standardization. ISO/DIS 14040:Environmental management — Life Cycle Assessment — Prin-ciples and framework. 1997.
[13] International Organization for Standardization. ISO/DIS 14041:Environmental management — Life Cycle Assessment — Goaland scope definition and inventory analysis. 1997.
[14] International Organization for Standardization. ISO/DIS 14042:Environmental management — Life Cycle Assessment — Lifecycle impact assessment. 1998.
[15] International Organization for Standardization. ISO/DIS 14043:

296 G.M. Nicoletti et al. / Journal of Cleaner Production 10 (2002) 283–296
Environmental management — Life Cycle Assessment — Lifecycle interpretation. 1998.
[16] Houghton JT, Meira Filho LG, Callander BA, Harris N, Katten-berg A, Maskell K. Climate change. In: The Science of climatechange; contribution of WGI to the second assessment report ofthe intergovernamental panel on climate change. Cambridge:Cambridge University Press, 1995.
[17] Directoraat-Generaal Rijkswaterstaat. Drie referentieniveaus voornormalisatie in LCA, The Netherlands, 1997.
[18] Huppes G, Sas H, de Haan E, Kuyper J. Efficient environmentalinvestments. In: SENSE International Workshop session:Environmental Analysis and economics in Industrial Decisionmaking, 20 February 1997, Amsterdam (the Netherlands), 1997.
[19] Busani G, Palmonari C, Timellini G. Ceramic tiles and environ-ment. In: Atmospheric emissions, water, sludge, noise. Sassuolo:Edizioni EDI.CER, 1995.
[20] Assopiatrelle, Snam. Ceramic tiles: Report 1998. Environment,energy, security, health, quality. Sassuolo; 1998 [in Italian].
[21] Timellini G, Palmonari C, Cremonini F. Life Cycle Assessmentof ceramic tiles. General considerations. Ceramica Acta1998;1:5–18.
[22] Mazzali P, Busani G, Capuano F, Cavalchi B, Rossi P, TimelliniG. Risk factors in atmospheric emissions. In: Proceedings of thenational Symposium “Ceramica e Ambiente negli anni ’90” , Cas-algrande, 11–12 Ottobre 1993 [in Italian].
[23] Goedkoop M. The eco-indicator 1995. the Netherlands:Amersfoort, 1995.
[24] Goedkoop M, Spriensma R. The eco-indicator 99, a damage ori-ented method for Life Cycle Impact Assessment. the Netherlands:Amersfoort, 1999.