comparative network analysis - biostatistics & … · comparative network analysis bmi/cs 776...
TRANSCRIPT
Comparative Network
Analysis
BMI/CS 776
www.biostat.wisc.edu/bmi776/
Spring 2016
Anthony Gitter
These slides, excluding third-party material, are licensed under CC BY-NC 4.0 by Mark Craven, Colin Dewey, and Anthony Gitter
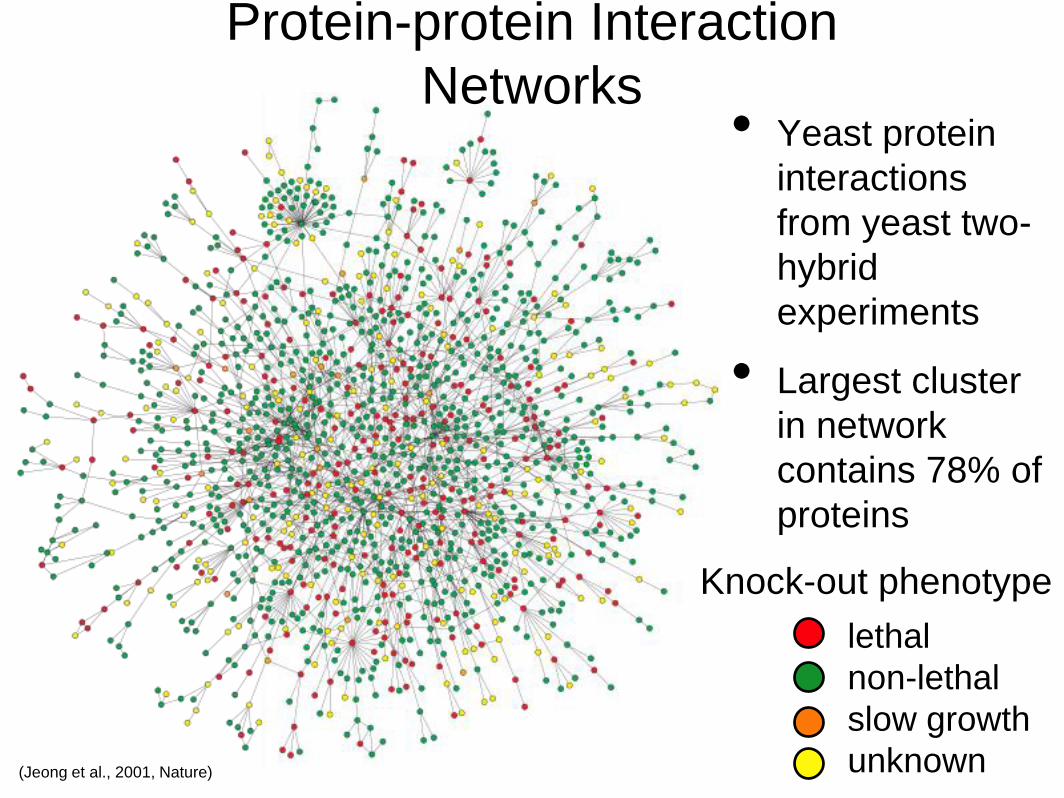
Protein-protein Interaction
Networks• Yeast protein
interactions
from yeast two-
hybrid
experiments
• Largest cluster
in network
contains 78% of
proteins
lethal
non-lethal
slow growth
unknown
Knock-out phenotype
(Jeong et al., 2001, Nature)
Overview
• Experimental techniques for determining
networks
• Comparative network tasks
Experimental techniques
• Yeast two-hybrid system
• Protein-protein interactions
• Microarrays or RNA-Seq
• Expression patterns of mRNAs
• Similar patterns imply involvement in same
regulatory or signaling network
• Knock-out or perturbation studies
• Identify genes required for synthesis of
certain molecules
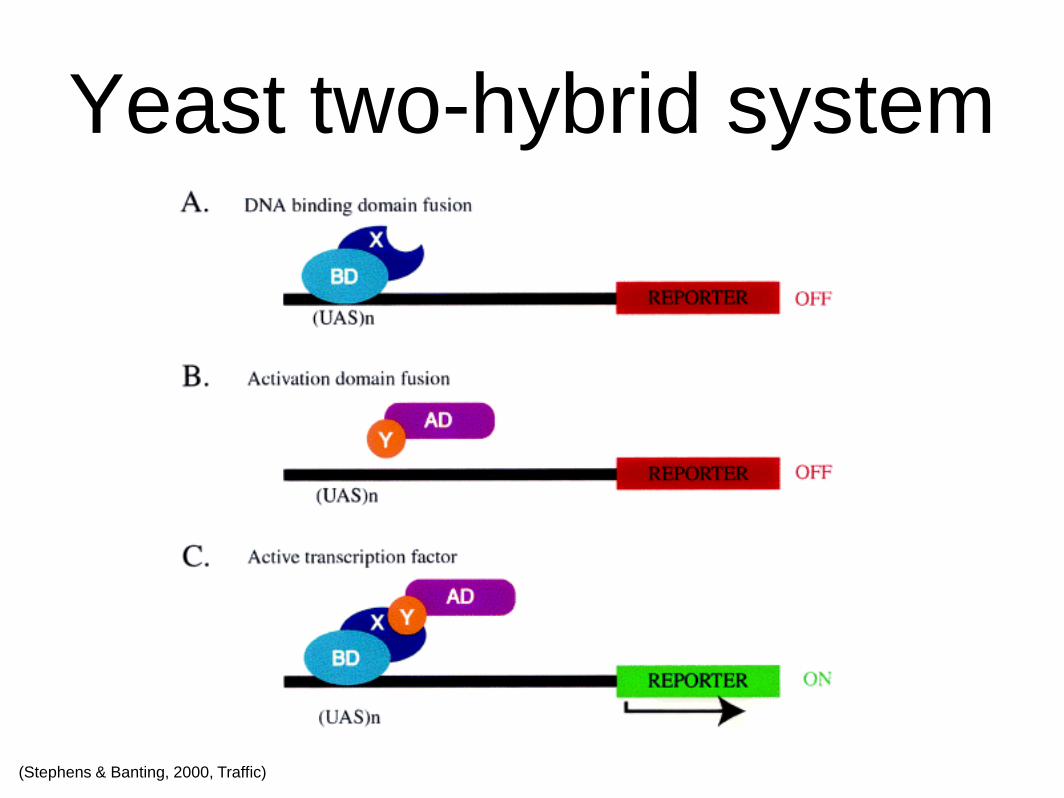
Yeast two-hybrid system
(Stephens & Banting, 2000, Traffic)
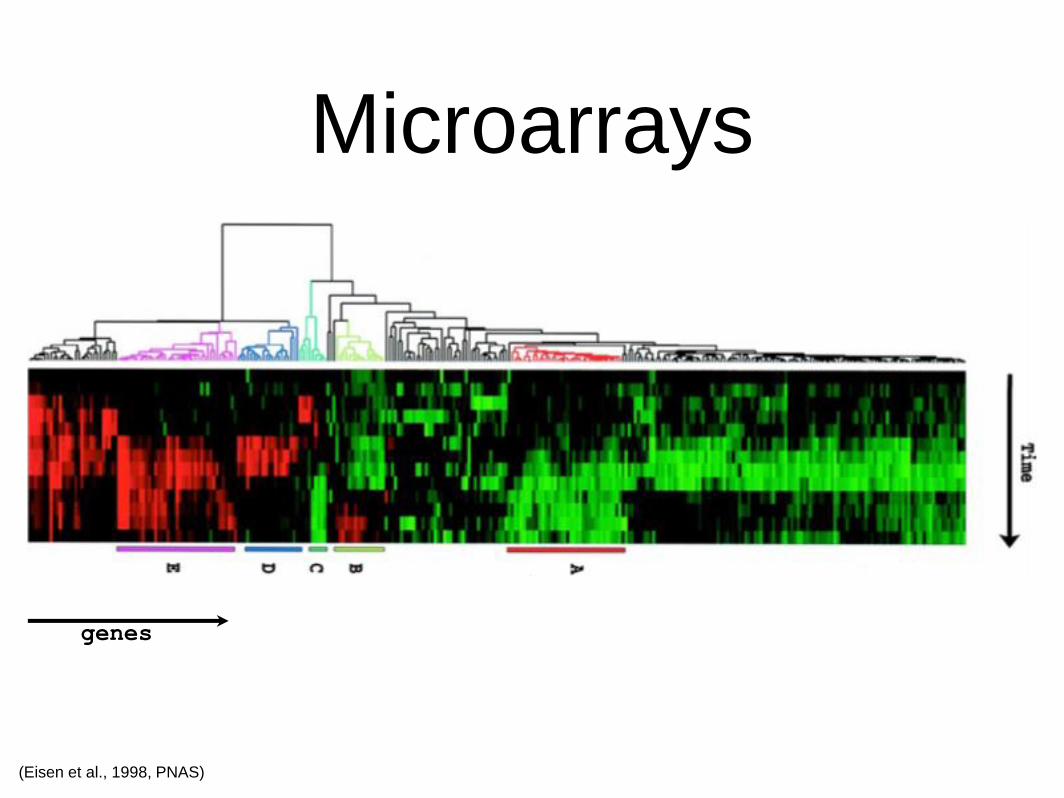
Microarrays
(Eisen et al., 1998, PNAS)
genes
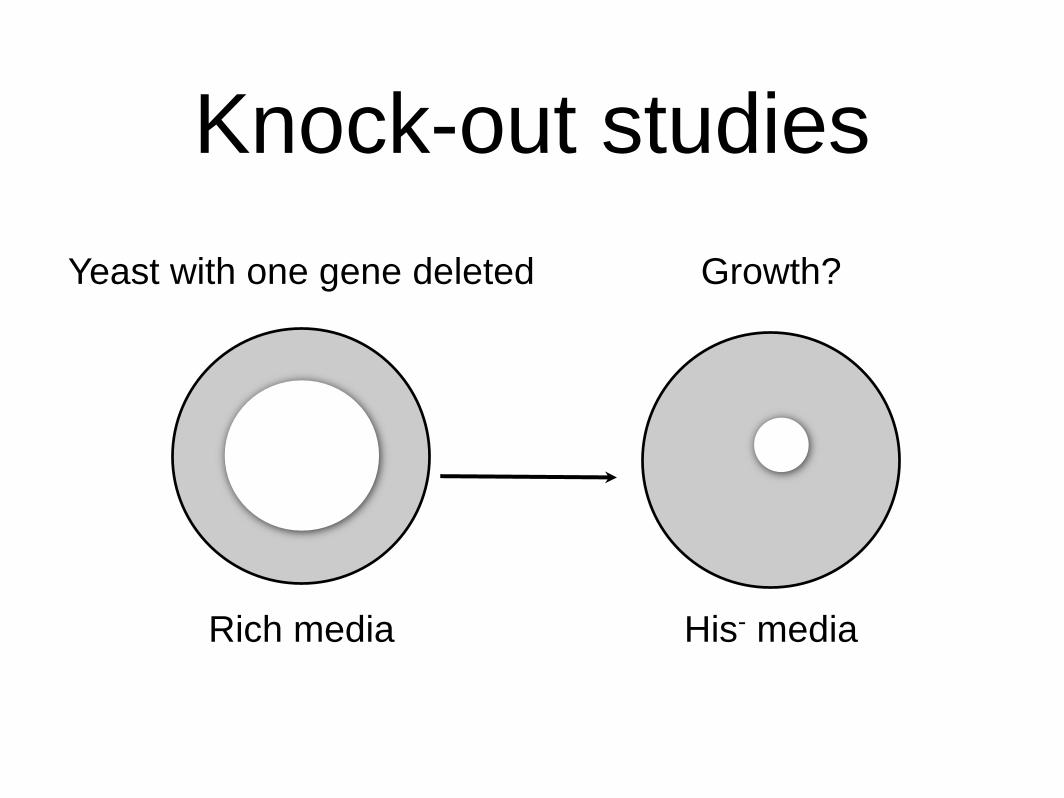
Knock-out studies
Rich media His- media
Growth?Yeast with one gene deleted
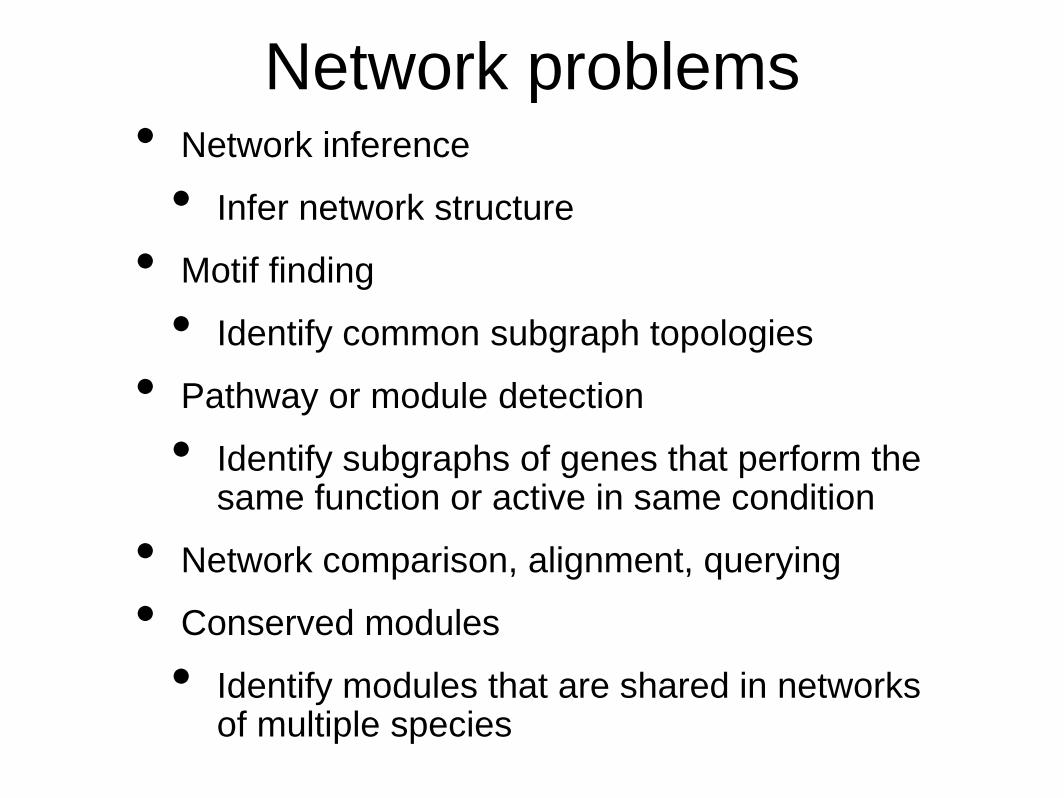
Network problems• Network inference
• Infer network structure
• Motif finding
• Identify common subgraph topologies
• Pathway or module detection
• Identify subgraphs of genes that perform the same function or active in same condition
• Network comparison, alignment, querying
• Conserved modules
• Identify modules that are shared in networks of multiple species
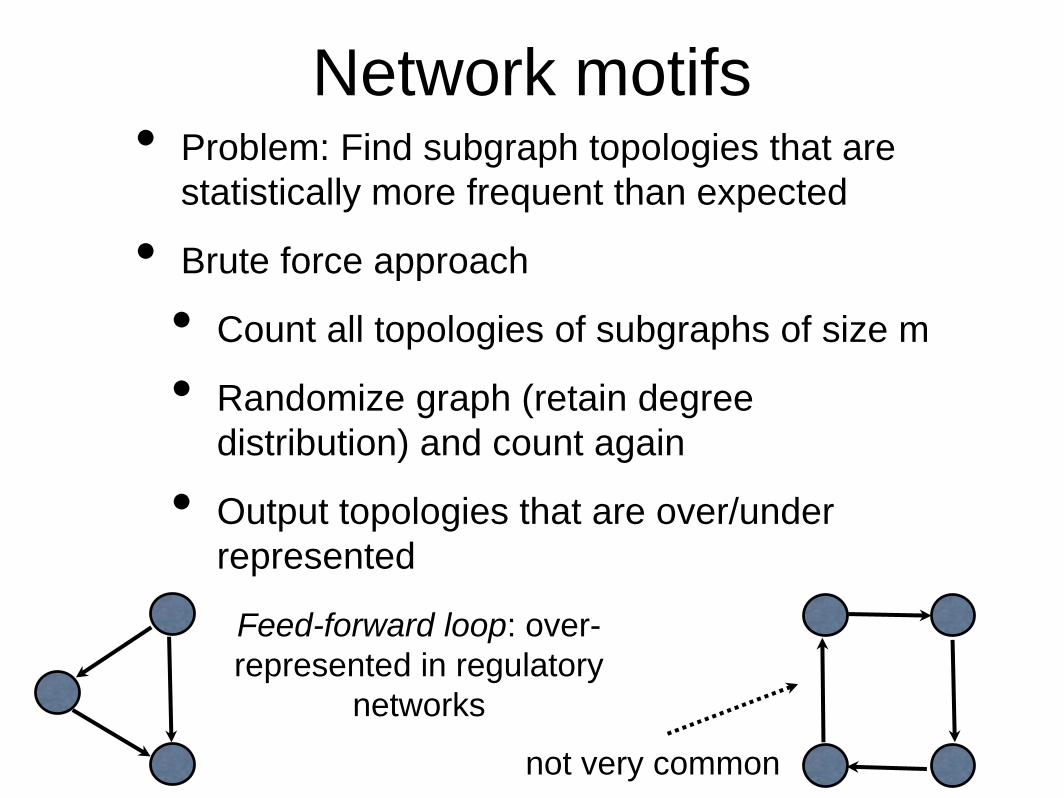
Network motifs• Problem: Find subgraph topologies that are
statistically more frequent than expected
• Brute force approach
• Count all topologies of subgraphs of size m
• Randomize graph (retain degree
distribution) and count again
• Output topologies that are over/under
represented
Feed-forward loop: over-
represented in regulatory
networks
not very common
Network modules
• Modules: dense (highly-connected) subgraphs
(e.g., large cliques or partially incomplete
cliques)
• Problem: Identify the component modules of a
network
• Difficulty: definition of module is not precise
• Hierarchical networks have modules at
multiple scales
• At what scale to define modules?
Comparative network analysis
• Compare or integrate networks from different...
• Interaction detection methods
• Yeast 2-hybrid, mass spectrometry, etc.
• Conditions
• Heat, media, other stresses
• Time points
• Development, cell cycle, stimulus response
• Species
Comparative tasks
• Integration
• Combine networks derived from different
methods (e.g. experimental data types)
• Alignment
• Identify nodes, edges, modules common to
two networks (e.g., from different species)
• Database query
• Identify subnetworks similar to query in
database of networks
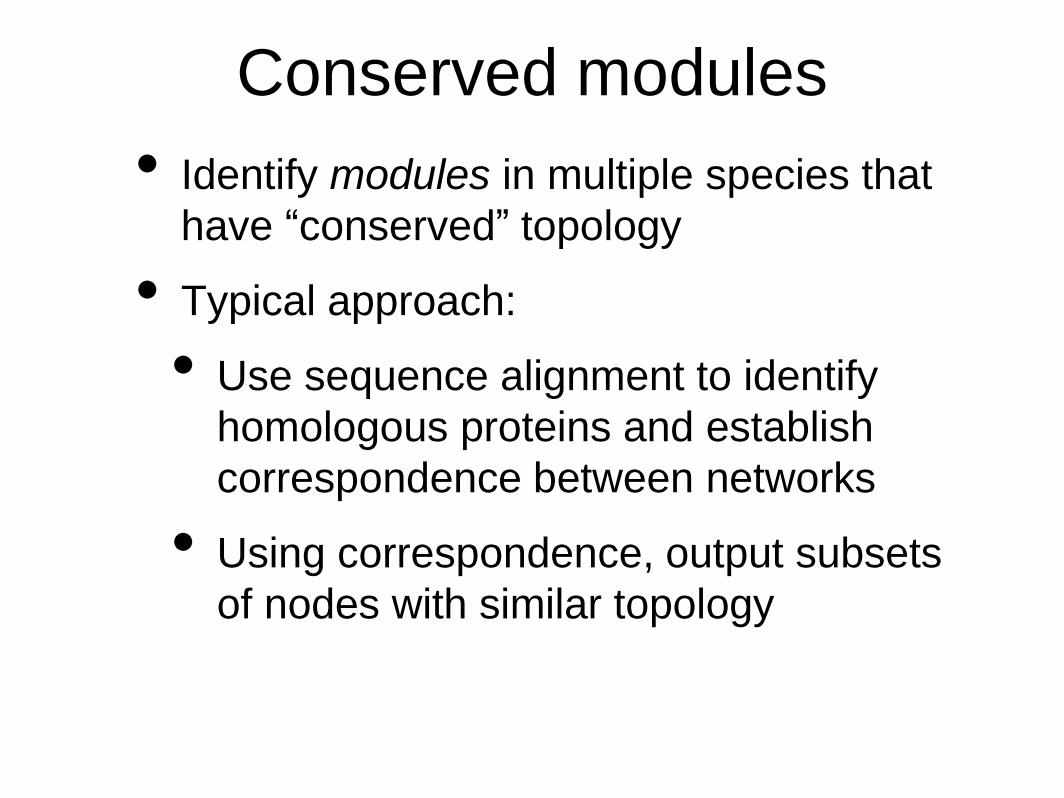
Conserved modules
• Identify modules in multiple species that
have “conserved” topology
• Typical approach:
• Use sequence alignment to identify
homologous proteins and establish
correspondence between networks
• Using correspondence, output subsets
of nodes with similar topology
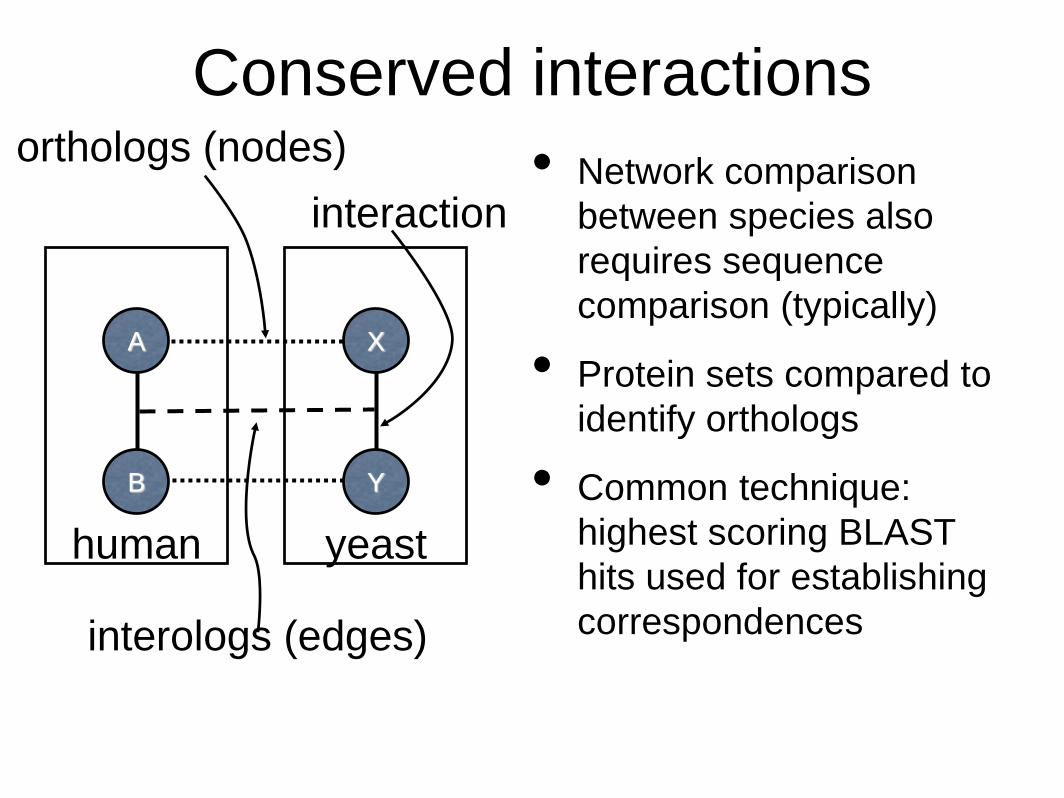
Conserved interactions
• Network comparison
between species also
requires sequence
comparison (typically)
• Protein sets compared to
identify orthologs
• Common technique:
highest scoring BLAST
hits used for establishing
correspondences
Y
X
B
A
human yeast
orthologs (nodes)
interologs (edges)
interaction
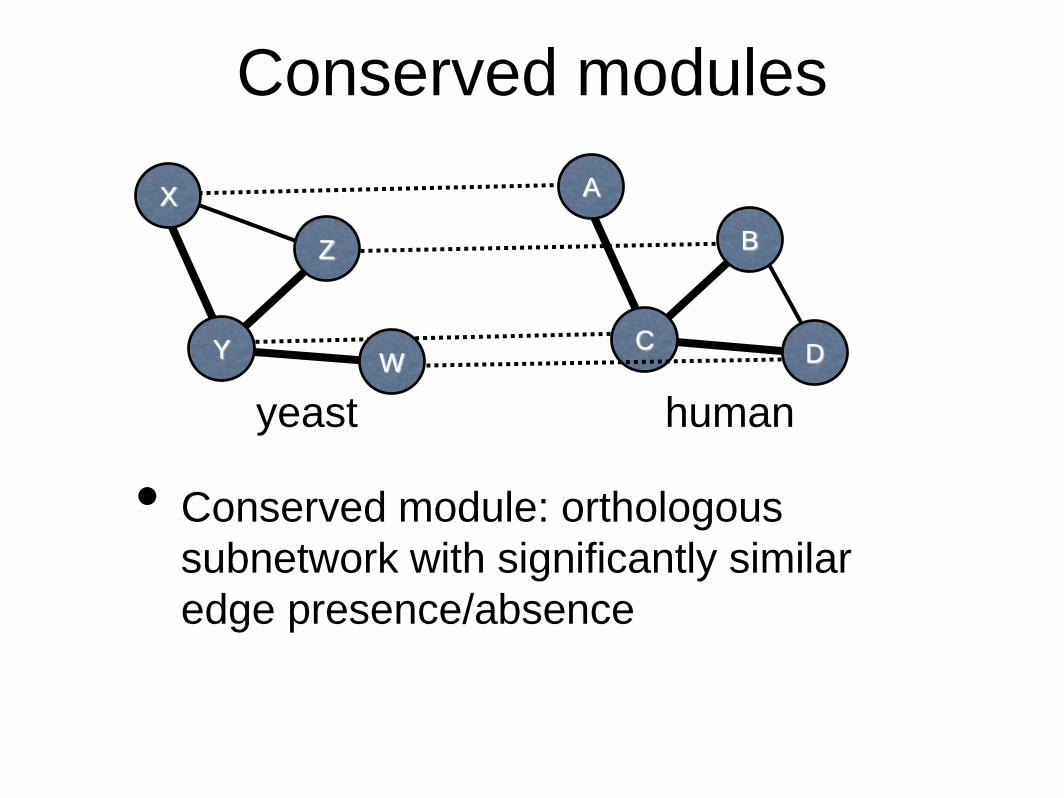
Conserved modules
• Conserved module: orthologous
subnetwork with significantly similar
edge presence/absence
Y
X
Z
WC
A
B
D
humanyeast
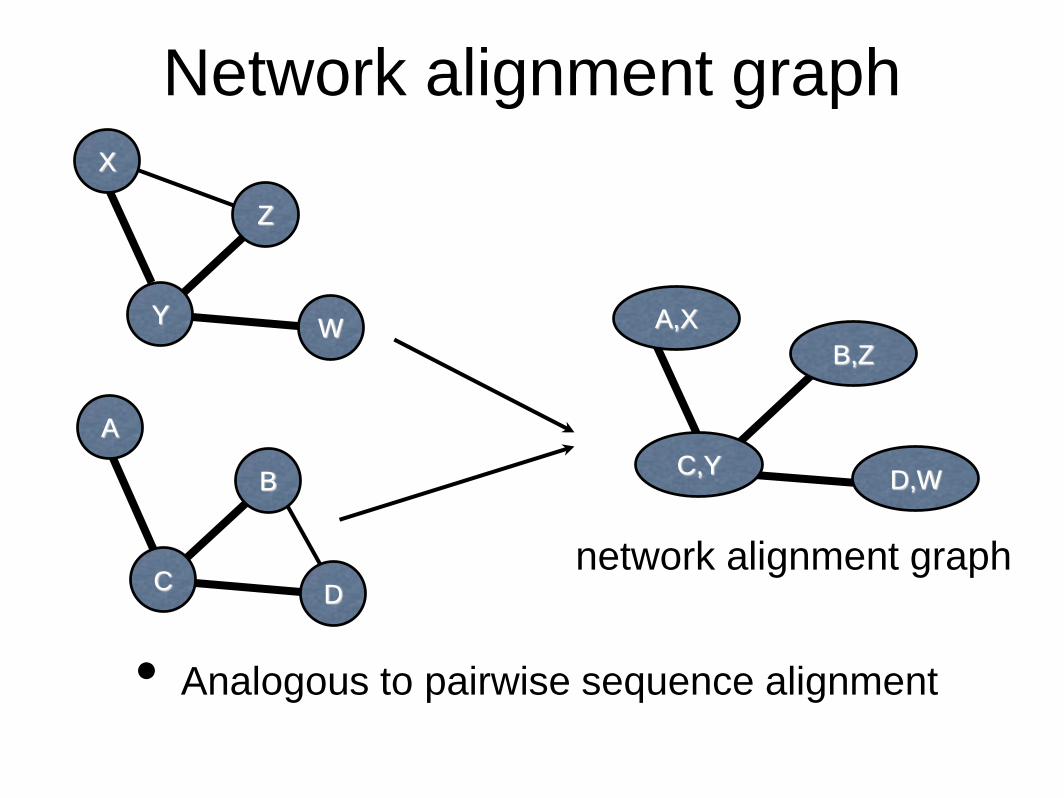
Network alignment graph
• Analogous to pairwise sequence alignment
Y
X
Z
W
C
A
B
D
A,X
B,Z
D,WC,Y
network alignment graph
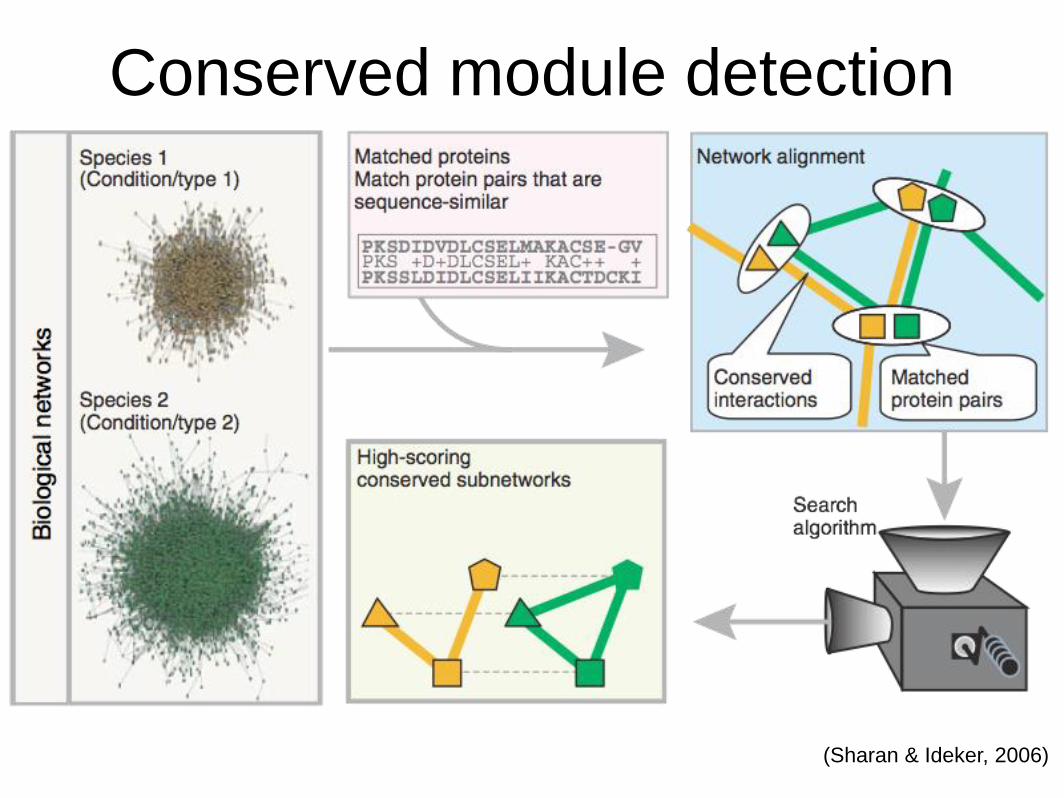
Conserved module detection
(Sharan & Ideker, 2006)
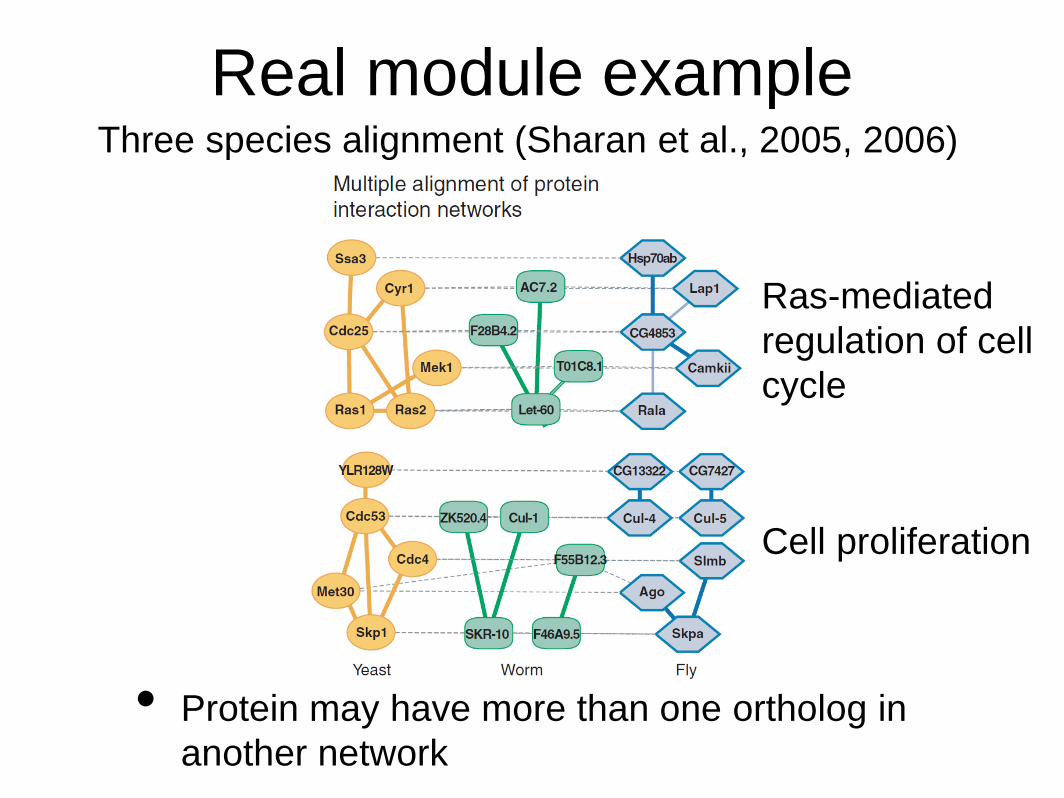
Real module example
• Protein may have more than one ortholog in
another network
Three species alignment (Sharan et al., 2005, 2006)
Ras-mediated
regulation of cell
cycle
Cell proliferation
Basic alignment strategy
• Define scoring function on subnetworks
• High score ⇒ conserved module
• Use BLAST to infer orthologous proteins
• Identify “seeds” around each protein:
small conserved subnetworks centered
around the protein
• Grow seeds by adding proteins that
increase alignment score
Scoring functions via subnetwork modeling
• We wish to calculate the likelihood of a certain
subnetwork U under different models
• Subnetwork model (Ms)
• Connectivity of U given by target graph H,
each edge in H appearing in U with
probability β (large)
• Null model (Mn)
• Each edge appears with probability
according to random graph distribution
(but with degree distribution fixed)
(Sharan et al., 2005)
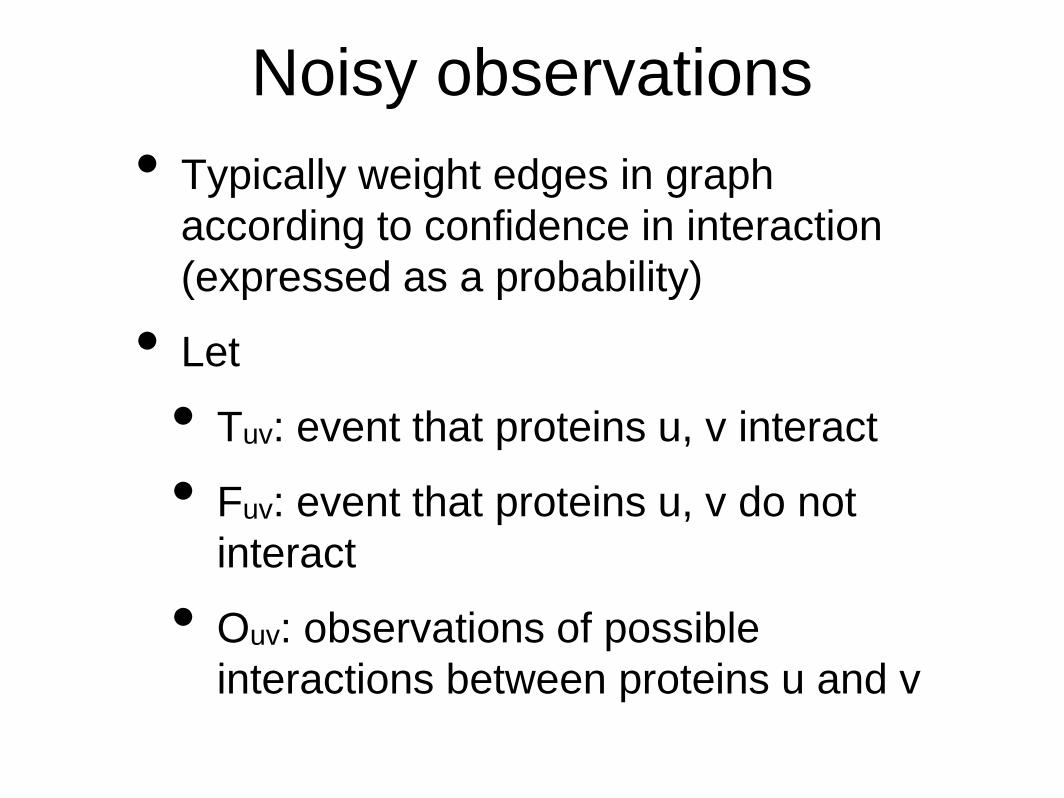
Noisy observations
• Typically weight edges in graph
according to confidence in interaction
(expressed as a probability)
• Let
• Tuv: event that proteins u, v interact
• Fuv: event that proteins u, v do not
interact
• Ouv: observations of possible
interactions between proteins u and v
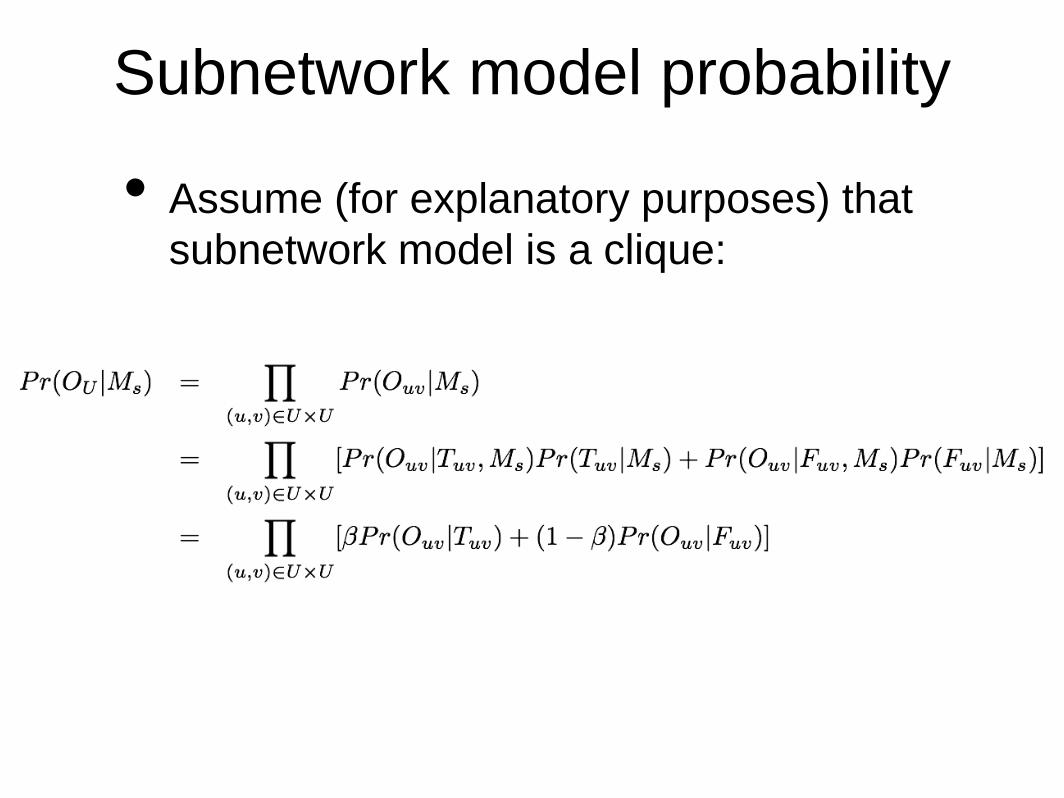
Subnetwork model probability
• Assume (for explanatory purposes) that
subnetwork model is a clique:
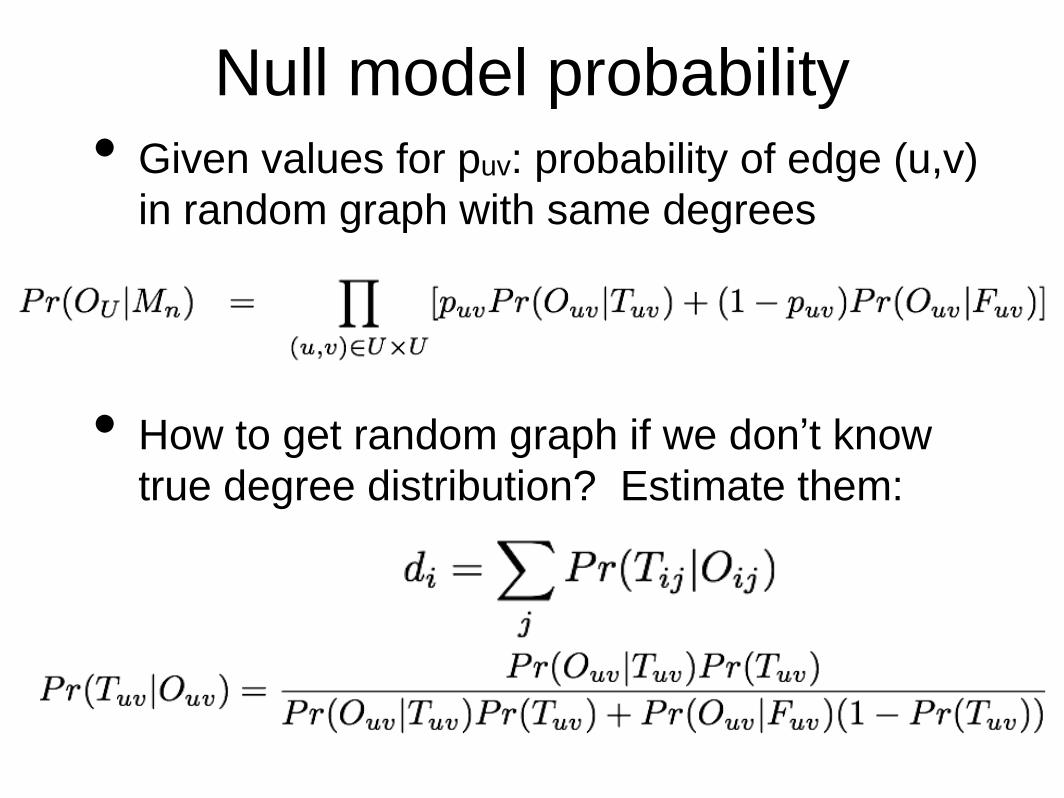
Null model probability• Given values for puv: probability of edge (u,v)
in random graph with same degrees
• How to get random graph if we don’t know
true degree distribution? Estimate them:
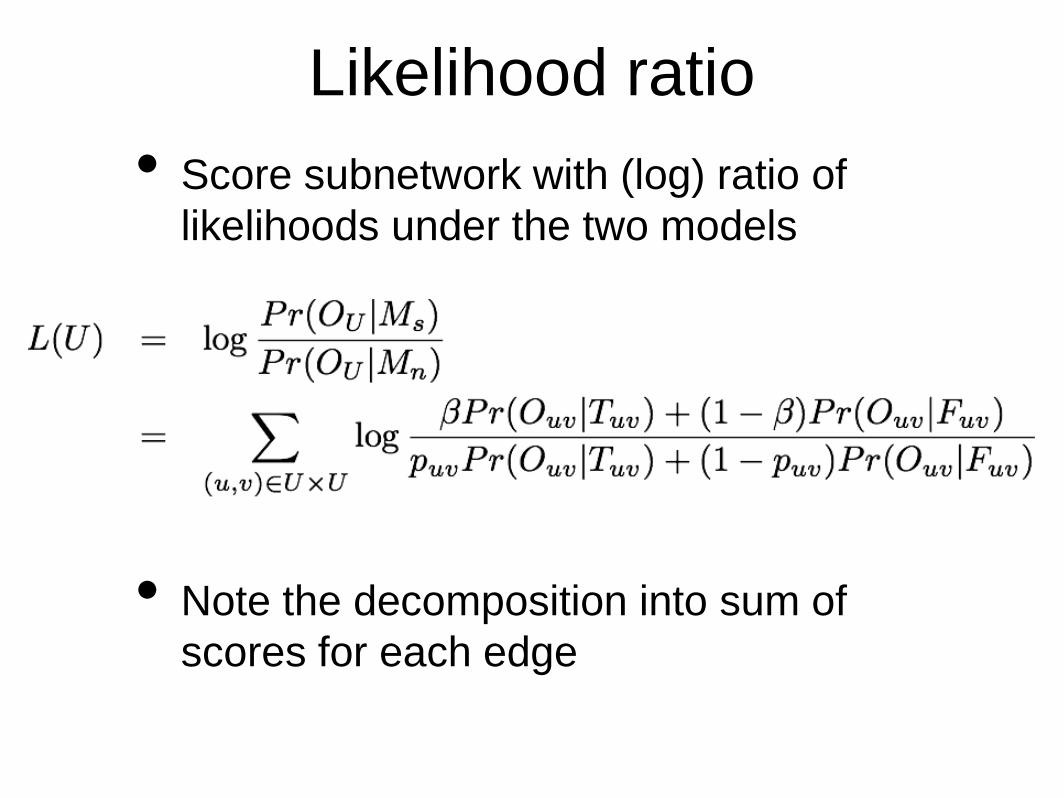
Likelihood ratio
• Score subnetwork with (log) ratio of
likelihoods under the two models
• Note the decomposition into sum of
scores for each edge
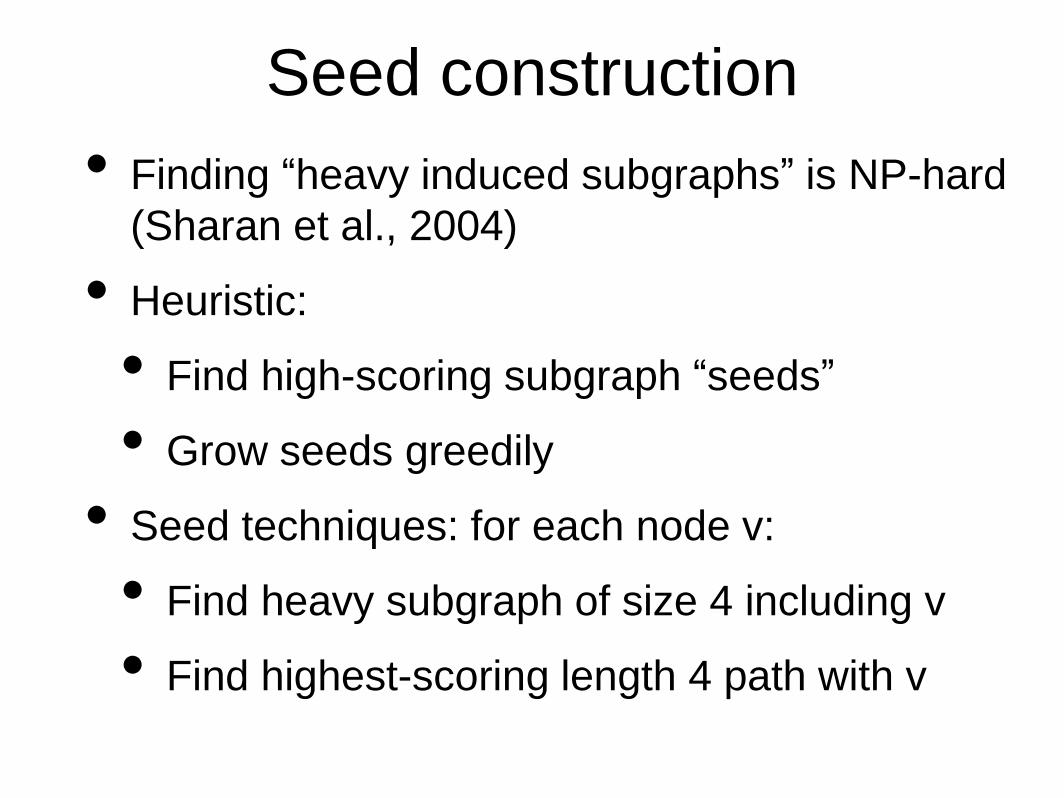
Seed construction
• Finding “heavy induced subgraphs” is NP-hard
(Sharan et al., 2004)
• Heuristic:
• Find high-scoring subgraph “seeds”
• Grow seeds greedily
• Seed techniques: for each node v:
• Find heavy subgraph of size 4 including v
• Find highest-scoring length 4 path with v
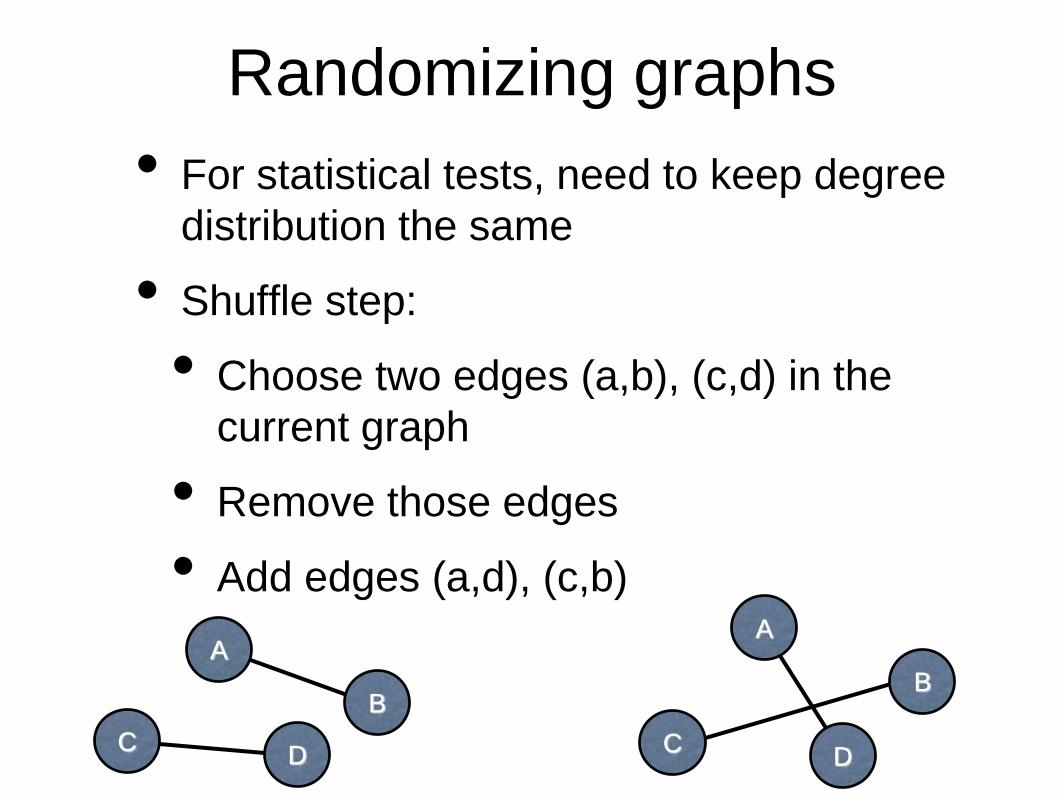
Randomizing graphs
• For statistical tests, need to keep degree
distribution the same
• Shuffle step:
• Choose two edges (a,b), (c,d) in the
current graph
• Remove those edges
• Add edges (a,d), (c,b)
C
A
B
D C
A
B
D
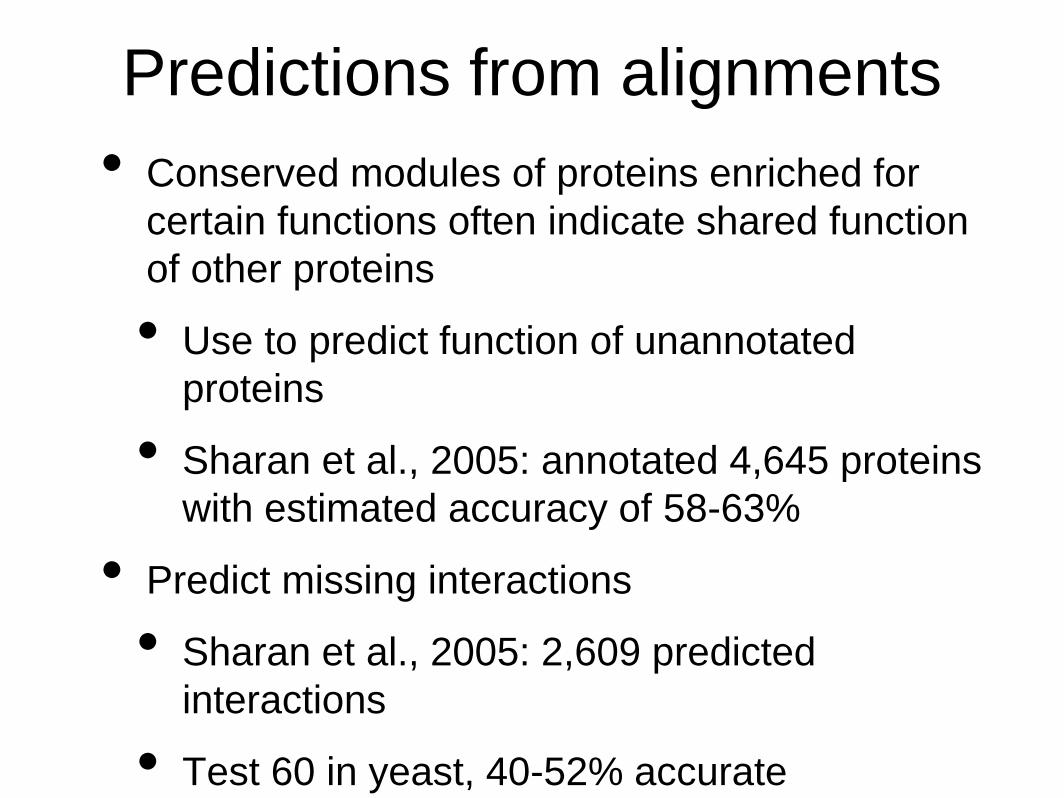
Predictions from alignments
• Conserved modules of proteins enriched for
certain functions often indicate shared function
of other proteins
• Use to predict function of unannotated
proteins
• Sharan et al., 2005: annotated 4,645 proteins
with estimated accuracy of 58-63%
• Predict missing interactions
• Sharan et al., 2005: 2,609 predicted
interactions
• Test 60 in yeast, 40-52% accurate
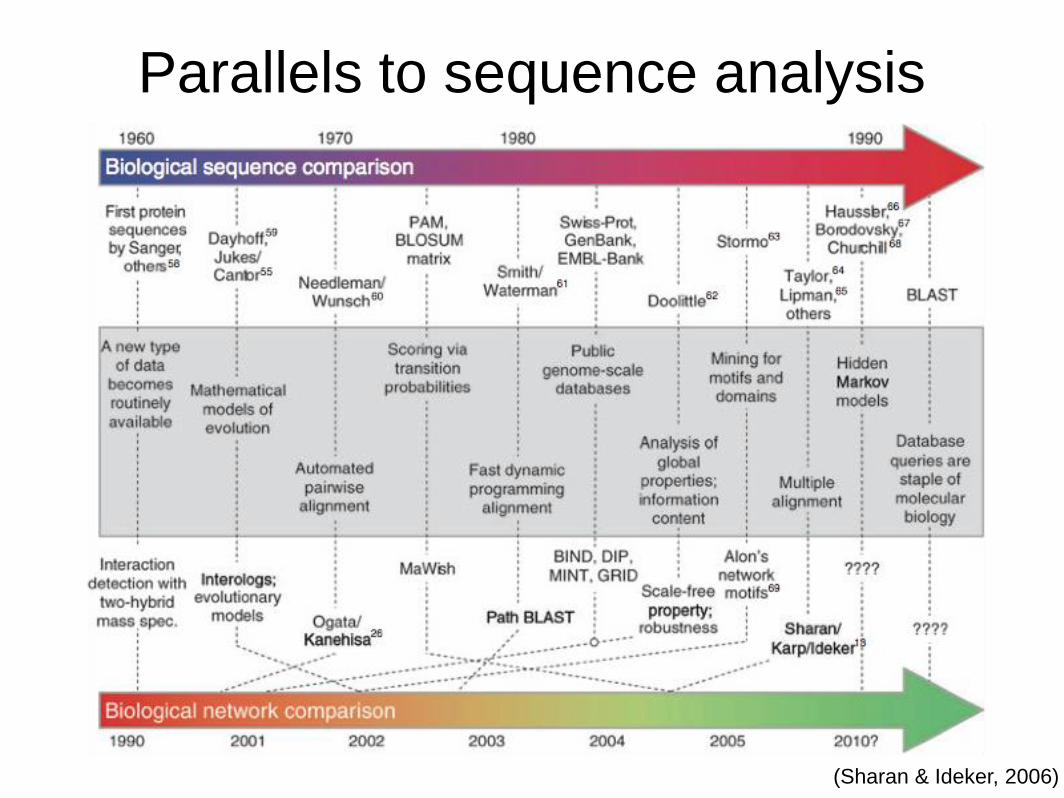
Parallels to sequence analysis
(Sharan & Ideker, 2006)