comparative measurement variation analysis on coordinate ... · comparative measurement variation...
TRANSCRIPT
http://www.iaeme.com/IJMET/index.asp 607 [email protected]
International Journal of Mechanical Engineering and Technology (IJMET) Volume 8, Issue 8, August 2017, pp. 607–614, Article ID: IJMET_08_08_066 Available online at http://www.iaeme.com/IJMET/issues.asp?JType=IJMET&VType=8&IType=8 ISSN Print: 0976-6340 and ISSN Online: 0976-6359 © IAEME Publication Scopus Indexed
COMPARATIVE MEASUREMENT VARIATION
ANALYSIS ON COORDINATE MEASURING
MACHINE AND WHITE LIGHT SCAN
SYSTEMS.
Ravi George, Dillibabu Vijayakumar
Gas Turbine Research Establishment, DRDO, C.V. Raman Nagar, Bengaluru, India
Murugesan R
REVA University, Yelahanka, Bengaluru, India
ABSTRACT
This study aims to compare and establish the relative variation in measurements of
contact and non-contact metrological inspection systems. Co-ordinate Measurement
Machine (CMM) and White Light Scanner (WLS) are used to measure standard
volumetric shapes viz. Sphere, Cylinder and Slip Gauges. Three dimensional
inspection data was analyzed using a statistical analysis software package and
compared to bring in the relative measurement variations. The variation in data in
terms of Mean, Standard Deviation and Variance were studied.
CMM data are consistently closer to the standard values. Standard deviation of
the CMM data is fraction of the standard deviation of WLS. However the standard
deviation values of WLS data are relatively consistent.
Keywords: Metrology inspection, CMM, White Light Scanner, Gauge Studies, Uncertainty.
Cite this Article: Ravi George, Dillibabu Vijayakumar and Murugesan R, Comparative Measurement Variation Analysis on Coordinate Measuring Machine and White Light Scan Systems, International Journal of Mechanical Engineering and Technology 8(8), 2017, pp. 607–614. http://www.iaeme.com/IJMET/issues.asp?JType=IJMET&VType=8&IType=8
1. INTRODUCTION
Metrology could be defined as the science of measurement, involving experimental and theoretical determinations at any level of uncertainty in any field of science and technology [1]. Metrology plays a vital role in scientific research especially aerospace projects. Activity of dimensional inspection followed by comparing the results with the design values, quality control and deviation analysis assist in systematic attainment of delivery of Quality product. [2]
Comparative Measurement Variation Analysis on Coordinate Measuring Machine and White Light Scan Systems
http://www.iaeme.com/IJMET/index.asp 608 [email protected]
Metrology is concerned with the instruments, gauges, calibration, inspection, traceability, accuracy, precision, uncertainty and quality control. Traceability ensures the result of a measurement process could be traced back to a primary reference measurement procedure through an unbroken chain of comparisons [3]. Uncertainty is a quantitative expression of the concept of accuracy. The degree of uncertainty is influenced by factors such as built-in errors, limitations of the instruments and the skill of the inspector. Geometrical Dimensioning & Tolerance helps the designers to communicate the design requirements effectively so that the intended quality can be achieved during manufacturing and assembly process. [4].
Gas Turbine components and assemblies involve close tolerances with high accuracy, complex shapes, aero foiled surfaces and precision fit requirements. Inspection of prototype components is different from production organization as the volume of parts is lower, frequent design iterations and quick turnaround time of inspection. In order to achieve the above requirement, it is preferred to have a measuring system which is precise, flexible and consistent in performance.
Dimensional measuring systems in general may be classified as Contact method and Non-contact method. Inspection method need to be chosen based on the application and nature of the components. In contact techniques, a mechanical probe is touched onto the surface to be measured. Probing can be point contact or continuous scanning mode. In non–contact methods, measurements are taken by optical method using a light source/ as images. In contact techniques, optical characteristics of the surface will not influence the inspection. Soft materials like rubbers and thin material will distort when probed and may not obtain accuracy and repeatability but all other materials which can withstand the probing force as low as 5gms can be inspected by contact methods. CMMs are known for very good accuracy and repeatability. In non–contact techniques such as photogrammetry, Laser or White Light Scanners etc. are usually very fast and are used even for thin and flexible rubber materials as the light is used on the surface for measuring the data. Clear and translucent materials such as glass components and highly polished materials pose a challenge in inspection due to shiny and reflective surfaces.
This paper attempts to study the deviation in measurement data of CMM and White light scanner in inspecting standard volumetric gauges.
2. LITERATURE SURVEY
Basilio Ramos and Elena Santos [5] have compared accuracies of five non-contact digitization techniques. It was observed that digitization with laser systems on small and complex components with rapid change in shapes posed challenge when line of sight was not available. It required multiple passes for digitization which in turn affected mesh quality. Further, it is stated that the white light and computational tomography systems performed relatively better than laser and vision based systems for components less than 300 × 500 mm.
Weckenmann et al. [6] observed that modern technologies, development in programming and processing methods will certainly reduce the effort involved in measurement and increase the reliability of the process due to higher measurement point densities during inspection.
3. EXPERIMENTAL SETUP
3.1. Standard Volumetric Shapes
The standard volumetric shapes of cylinders sphere and slip gauges which were used for experimentation are shown in Figure 1(a) and (b). Details of the standard shapes are presented in Table 1.

Ravi George, Dillibabu Vijayakumar and Murugesan R
http://www.iaeme.com/IJMET/index.asp 609 [email protected]
(a) (b)
Figure 1 standard volumetric shape (a) Cylinders and Sphere (b) Slip gauges
Sl.
No Description and Size Make
Calibration
Standard Material
1 Standard Sphere Ø 25.4mm STL ASME B89-4.22 Tungsten Carbide Grade 10
2 Standard Cylinder Ø 14.5mm Mitutoyo IS1103 Steel
3 Standard Cylinder Ø 15.0mm Mitutoyo IS1103 Steel
4 Slip gauge 50mm Mitutoyo IS2984 Steel Grade 0
5 Slip gauge 75mm Mitutoyo IS2984 Steel Grade 0
6 Slip gauge 100mm Mitutoyo IS2984 Steel Grade 0
Table 1 Details of standard shapes
3.2 White Light Scanner
A white light scanner (WLS) is a device to measure surface heights of an object using coherence scanning interferometry using white light illumination. The accuracy varies based upon the shape and size of the component, spray and thickness of the developer etc. White light scanners are useful especially for surface analysis, wear analysis, shape analysis, product comparison and reverse engineering. The white light scanner takes a series of photos to get every relevant data point almost instantly.
WLS model-REXCAN-4, make-SOLUTION X with the data capture speed of 760 – 980 mili sec and accuracy of 40 microns at 400mm field of view was used to carry out inspection of standard volumetric shapes. WLS is shown in Figure 2. Paper targets were stuck to the object to pick up the reference. The standard shapes were coated with a thin layer of developer (SKD-S2: Solvent based developer). Point cloud generated by the white light scanner was converted as geometrical shapes viz, cylinder, sphere and slip block. Various iterations of geometrical shapes at different planes have resulted in various dimensions. Shapes constructed using the point cloud and planes are shown in Figure 3 (a) and (b).
Figure 2 White Light Scanner with work table

Comparative Measurement Variation Analysis on Coordinate Measuring Machine and White Light Scan Systems
http://www.iaeme.com/IJMET/index.asp 610 [email protected]
(b) (b)
Figure 3 (a) Sphere (b) Cylinder
3.3 Coordinate Measuring Machine
Coordinate Measuring Machines are known for their accuracy and precision. In many applications especially in aero engine components; CMMs are widely used to obtain better accuracy and repeatability. CMMs hold the edge on polished metals, translucent materials and close tolerances where optical methods are not the choice. CMM model-Romer Absolute Arm-RA7312 , make- Hexagon, USA used for generating inspection data is shown in Figure 4. The CMM uses PC-DMIS CAD ++ VERSION 2017 R1 software to process inspection data. Uncertainty (U) of the used CMM is given by the formula (1)
U=5+L/40 (1)
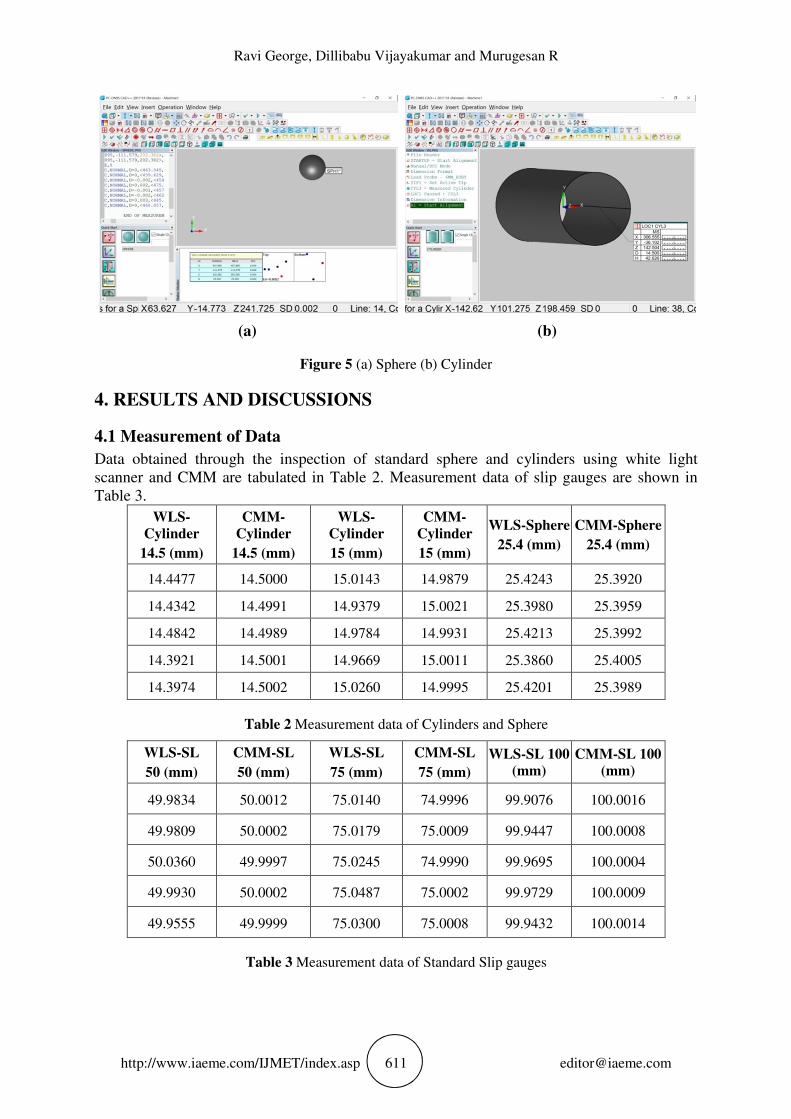
Where, L is the length of the measured range. Three dimensional data generated through construction of cylindrical and spherical geometries by CMM using PCDMIS software package are shown in Figure 5 (a) and (b)
Figure 4 CMM with control computer
Ravi George, Dillibabu Vijayakumar and Murugesan R
http://www.iaeme.com/IJMET/index.asp 611 [email protected]
(a) (b)
Figure 5 (a) Sphere (b) Cylinder
4. RESULTS AND DISCUSSIONS
4.1 Measurement of Data
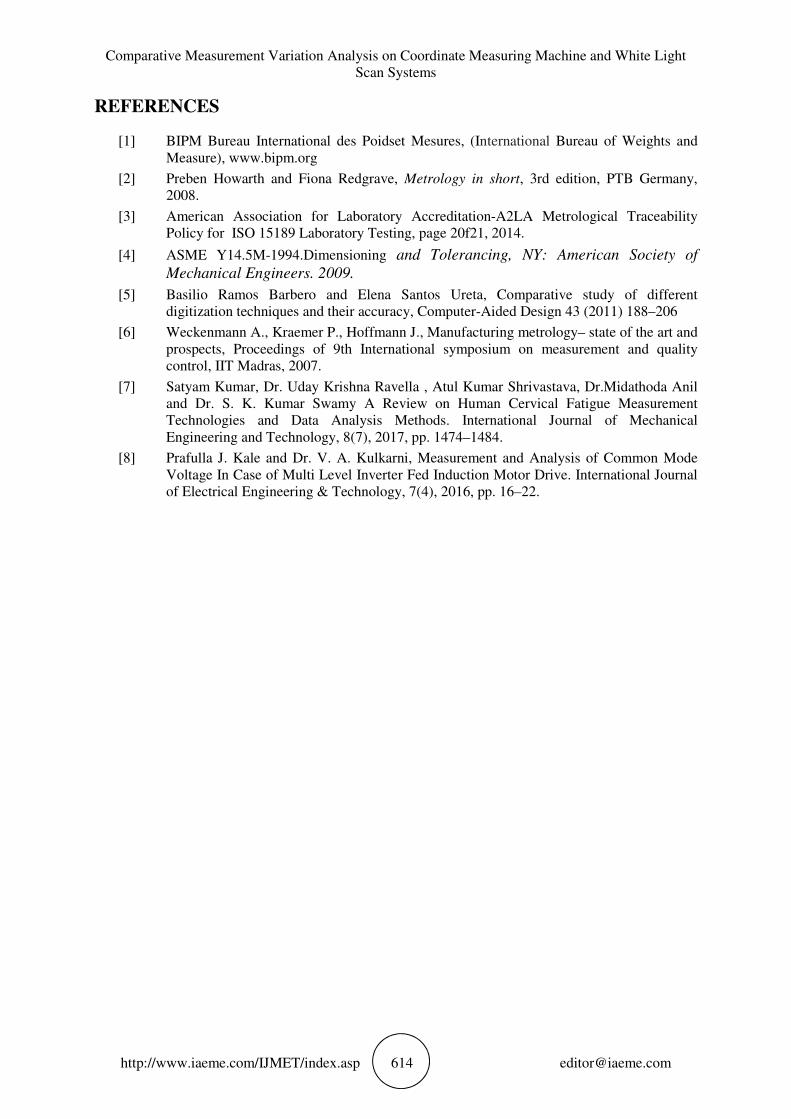
Data obtained through the inspection of standard sphere and cylinders using white light scanner and CMM are tabulated in Table 2. Measurement data of slip gauges are shown in Table 3.
WLS-
Cylinder
14.5 (mm)
CMM-
Cylinder
14.5 (mm)
WLS-
Cylinder
15 (mm)
CMM-
Cylinder
15 (mm)
WLS-Sphere
25.4 (mm)
CMM-Sphere
25.4 (mm)
14.4477 14.5000 15.0143 14.9879 25.4243 25.3920
14.4342 14.4991 14.9379 15.0021 25.3980 25.3959
14.4842 14.4989 14.9784 14.9931 25.4213 25.3992
14.3921 14.5001 14.9669 15.0011 25.3860 25.4005
14.3974 14.5002 15.0260 14.9995 25.4201 25.3989
Table 2 Measurement data of Cylinders and Sphere
WLS-SL
50 (mm)
CMM-SL
50 (mm)
WLS-SL
75 (mm)
CMM-SL
75 (mm)
WLS-SL 100
(mm)
CMM-SL 100
(mm)
49.9834 50.0012 75.0140 74.9996 99.9076 100.0016
49.9809 50.0002 75.0179 75.0009 99.9447 100.0008
50.0360 49.9997 75.0245 74.9990 99.9695 100.0004
49.9930 50.0002 75.0487 75.0002 99.9729 100.0009
49.9555 49.9999 75.0300 75.0008 99.9432 100.0014
Table 3 Measurement data of Standard Slip gauges

Comparative Measurement Variation Analysis on Coordinate Measuring Machine and White Light Scan Systems
http://www.iaeme.com/IJMET/index.asp 612 [email protected]
4.2 Analysis of Data
The measurement data was analyzed. Mean, median, standard deviation, variance, co-efficient of variance, minimum and maximum values were calculated using Minitab 17 statistical software. The calculated statistics are shown in Table 4.
Variables Mean Median Standard
Deviation Variance
Co-efficient
of Variance
Minimum
Value
Maximum
Value
WLS-C14.5 14.431 14.434 0.038 0.0014 0.26 14.392 14.484
CMM-C14.5 14.5 14.5 0.000611 0 0 14.499 14.5
WLS-C15 14.985 14.978 0.0358 0.0013 0.24 14.938 15.026
CMM-C15 14.997 14.999 0.00606 0.00004 0.04 14.988 15.002
WLS-SL50 49.99 49.983 0.0293 0.0009 0.06 49.956 50.036
CMM-SL50 50.0 50.0 0.000577 0 0 50.0 50.001
WLS-SL75 75.027 75.025 0.0136 0.00018 0.02 75.014 75.049
CMM-SL75 75.0 75.0 0.000806 0.000001 0 74.999 75.001
WLS-SL100 99.948 99.945 0.0262 0.0007 0.03 99.908 99.973
CMM-SL100 100.0 100.0 0.000482 0 0 100.0 100.0
WLS-SP25.4 25.41 25.42 0.017 0.00029 0.07 25.386 25.424
CMM-SP25.4 25.397 25.399 0.00341 0.00001 0.01 25.392 25.401
Table 4 Statistical Analysis
It is observed from the data that mean and median of WLS is lower than that of CMM for cylinders. But for spherical measurements, mean and median of WLS is higher than CMM. For slip gauges, mean and median of WLS is lower than CMM for 50mm and 100mm and higher than CMM for 75mm. Standard deviation of WLS is comparatively higher than CMM for all the measurements. Standard deviation of CMM is in the range of 1.6 % to 20% of standard deviation of WLS. Minimum measured value of WLS is lower than that of CMM but for 75mm slip gauge. Maximum measured value of WLS is higher than CMM except 14.5 mm Cylinder and 100mm slip gauge.
The variation of measured values of cylinders 14.5mm and 15mm are shown graphically in Figure 6 (a). Measured data of sphere 25.4mm is shown in Figure 6 (b).

Ravi George, Dillibabu Vijayakumar and Murugesan R
http://www.iaeme.com/IJMET/index.asp 613 [email protected]
(a) (b)
Figure 6 Measured data points (a) Cylinders (b) Sphere
Number of data points captured by WLS is of the order of 107to create the three dimensional surface models. In comparison a few 10s of points were captured at specific locations to construct the geometries.
5. CONCLUSIONS
When it comes to analysis of a part or product, a coordinate-measuring machine (CMM) and a white light scanner both serve complementary roles. But too often one is used where the other would be the appropriate choice. The CMM is suitable for a situation in which absolute accuracy is needed in a point-to-point measurement, and outperforms white light scanning.
a) Mean and Median of measured data using CMM are closer to the standard value.
b) Mean and median of the measured data through WLS for cylinders were found to be lower than that of the CMM data which is very close to the standard value.
c) Mean and median of the measured data through WLS for sphere were found to be higher than that of the CMM data which is very close to the standard value.
d) Standard deviation of CMM is in the range of 1.6 % to 20% of standard deviation of WLS for all the measured data.
e) Time taken for inspection by WLS is lower than that of CMM. Whereas time taken for preprocessing and post processing for WLS is relatively higher when compared to CMM.
f) Number of data points captured by WLS is in millions and in 10s for CMM.
g) Standard deviation values are generally consistent for WLS, whereas large variations in standard deviation values are noticed in CMM data.
6. FUTURE SCOPE
Comparative study of non-contact measurement systems viz. laser, white light and blue light scanners could be studied for regular and free form surfaces.
ACKNOWLEDGEMENTS
Authors sincerely acknowledge guidance and support extended by Director GTRE, Additional Director (Reliability and QA), Group Director and Divisional Head of Quality Assurance Group.
Authors further acknowledge the services of Nagesha .BK, Amith Kumar Tigga and Chiranjeevi .B for their support during experimental trials.
14.00
14.20
14.40
14.60
14.80
15.00
15.20
1 2 3 4 5
Cy
lin
de
r D
iam
ete
r (m
m)
Data PointsWL-C14.5 CMM-C14.5 WL-C15 CMM-C15
25.36
25.37
25.38
25.39
25.40
25.41
25.42
25.43
1 2 3 4 5
Sp
he
re D
iam
ete
r (m
m)
Data PointsWL-SP25.400 CMM-SP25.400
Comparative Measurement Variation Analysis on Coordinate Measuring Machine and White Light Scan Systems
http://www.iaeme.com/IJMET/index.asp 614 [email protected]
REFERENCES
[1] BIPM Bureau International des Poidset Mesures, (International Bureau of Weights and Measure), www.bipm.org
[2] Preben Howarth and Fiona Redgrave, Metrology in short, 3rd edition, PTB Germany, 2008.
[3] American Association for Laboratory Accreditation-A2LA Metrological Traceability Policy for ISO 15189 Laboratory Testing, page 20f21, 2014.
[4] ASME Y14.5M-1994.Dimensioning and Tolerancing, NY: American Society of
Mechanical Engineers. 2009.
[5] Basilio Ramos Barbero and Elena Santos Ureta, Comparative study of different digitization techniques and their accuracy, Computer-Aided Design 43 (2011) 188–206
[6] Weckenmann A., Kraemer P., Hoffmann J., Manufacturing metrology– state of the art and prospects, Proceedings of 9th International symposium on measurement and quality control, IIT Madras, 2007.
[7] Satyam Kumar, Dr. Uday Krishna Ravella , Atul Kumar Shrivastava, Dr.Midathoda Anil and Dr. S. K. Kumar Swamy A Review on Human Cervical Fatigue Measurement Technologies and Data Analysis Methods. International Journal of Mechanical Engineering and Technology, 8(7), 2017, pp. 1474–1484.
[8] Prafulla J. Kale and Dr. V. A. Kulkarni, Measurement and Analysis of Common Mode Voltage In Case of Multi Level Inverter Fed Induction Motor Drive. International Journal of Electrical Engineering & Technology, 7(4), 2016, pp. 16–22.