comparative analysis of the quality of institutions in the ... paper provides the comparative...
TRANSCRIPT
Associazione Italiana per lo Studio dei Sistemi Economici Comparati
XVIIth Scientific Conference
Growth and Development Patterns: The Role of Institutions in a Comparative Perspective
University of Perugia Perugia (Italy), Thursday 25 – Saturday 27 June 2009
Comparative Analysis of the Quality of Institutions in the European Countries
Krešimir Jurlin Research Fellow
IMO, Zagreb, Croatia [email protected]
Nevenka Čučković
Senior Research Fellow IMO, Zagreb, Croatia
Draft, please do not quote, comments welcome!
Abstract The paper focuses on the comparative analysis of the quality of public governance and underpinning institutional framework in the European countries. The paper attempts to identify typical groups of countries with similarities in the quality of general public institutions. The countries included in the analysis will be the EU countries, selected EFTA and Western Balkan Countries.. Generally, the institutional quality is not easy to measure and in principle relies to a large extent on qualitative assessments (Kaufman et al, 2008). Therefore, the analysis will rely on the results of the executive surveys conducted by the World Economic Forum, which provides for a solid analytical tool with identical survey questions answered in the same time by a defined and controlled sample of educated professionals within the business sector. However, the analysis has not focused on the standard “Institution” pillar, as defined by the WEF, created using the survey indicators on the legal protection, corruption, productivity of public spending, burden of regulation, security, quality of auditing standards and regulation on corporate governance. Apart from that, further survey indicators are used, including the quality of education; general infrastructure and effectiveness of anti-monopoly policy. We created a new five pillars’ composite indicator of the quality of institutions and measured it in terms of difference to average rank of survey response in the EU15 members to identify the relative quality of public institutions.
1
1. Introduction The paper provides the comparative analysis of the quality of economic governance and the underpinning institutional framework of the European countries and their impact on their international competitiveness. The paper attempts to identify typical groups of countries with similarities in the quality of general public institutions and determine the factors behind institutional similarities/differences in explaining their international competitiveness levels. In the second chapter we briefly deal with the question why the quality of institutional framework of a certain country (legislative framework, regulative norms, formal and informal rules and codes; governance arrangements and policies) matters for economic growth and competitiveness at both country and business sector levels. We briefly determine the components of institutional quality we will examine and our starting assumptions as a departing theoretical and policy framework for the analyses that follows. In third chapter we elaborate the methodological approach in the analysis of World Economic Forum (WEF) survey data made for Global Competitiveness Index on the basis of which we attempt to measure institutional quality. For the purpose of this exercise, we construct the composite institutional indicator which is not identical with the “Institution” pillar, as defined by the WEF. It is created by constructing 5 pillars based on 25 various survey indicators on the quality of legal protection, quality and burden of regulation, level of corruption, productivity of public spending, security, quality of auditing standards and regulation on corporate governance. Apart from that we have added survey indicators that are important for an overall assessment of the quality of institutional framework, including those of quality of education, general infrastructure and effectiveness of anti-monopoly policy. Selected indicators of institutional quality we use as an explanatory tool for attained levels of international competitiveness in 2003-3008 period. The analysis in fourth chapter attempts to find an answer to a question if there is a convergence between European countries in the “institutional quality index” and which countries demonstrate positive/negative trends and if there are any significant deviations when looking into the old and new members as well as the selected EU “outsiders” during the 2003-2008. In the fifth chapter we provide some more detailed findings of the main trends at the level of 5 sub indexes (pillars) of the institutions quality, in order to identify which institutional pillars and which countries make for the most of the identified trends of change of the quality of institutions. In the concluding sixth chapter we summarize the similarities and differences among European countries and attempt to identify the defining underlying factors in institutional competitiveness for clusters of countries that were determined on the basis of our analysis.
2
2. The quality of institutions in European countries and impact on economic growth and competitiveness- why does it matter? The link between quality of institutions and economic growth has been theoretically well founded, repeatedly studied and empirically tested (North, 1990; North 1997; Olson et al. 2000; Rodrik, 2004; Campbell, 2004; Pedersen 2008). In particularly since the beginning of the 1990s,the economists have widely acknowledged the idea that the good economic institutions in both public and private sectors are instrumental to economic growth1.The institutional framework conducive to functional market economy is primarily very important for the business community but ultimately for all citizens; their living standards and general quality of life. The well designed institutions could trigger economic growth and act as an important growth accelerators (Housemann, Prichett and Rodrik, 2004). At the business sector level, this link is most evident in investment decisions whereby investors take into account the quality of institutions as a very important factor for the ease of doing business and when assessing overall risk of future business conduct in one country. The institutional framework could create incentives but also disincentives for economic transactions and business decisions. Firms are generally keen to invest in countries with high respect and protection of property rights; developed legal framework and enforced rules of law; well developed public services without burdensome bureaucracy, redundant regulation and corruption. It is important that government policies are transparent, judiciary does not hinder business and there is a strong protection against crime and fraud. Institutional failures, on the other hand, significantly raise transaction costs for firms if public institutions fail to adequately enforce property rights, business contracts or fail to ensure adequate level of information on market to all market agents. Apart from that some rules of conduct and institutional dimensions that fall within the area of “ethical behaviour” were also included into our analysis, with indicators of business ethics and public trust in (financial) honesty of politicians, i.e. those created by the private sector subjects themselves are also very important. These are the elements we have taken into account when measuring the overall quality of current European institutional framework that affects the decisions of enterprises and market actors and consequently on the countries’ competitiveness rank. In short, our analysis departs from the assumption that the quality of institutional framework does matter for the efficiency of economic transactions and economic growth. It determines the path of economic growth of a country to large extent and increases our understanding of factors influencing the economic growth patterns (Pederson, 2008: Rodrik, 2004; Olson et al, 2000). We similarly argue that the international competitiveness is better in the countries which are better governed and that differences in performance could be also attributed to the quality of economic governance and institutional framework. We also consider institutional change as an important public policy instrument and institutional analyses as useful explanatory tool for policy makers. In the exercise done for the purpose of this paper by attempting to measure the quality of institutional framework we attempt to measure also the international economic competitiveness at the country and business sector levels. So what factors affect the quality of institutions and institutional competitiveness in European countries? Are there significant differences and what division lines, if any, could be noted? Our starting assumption is that being part of a EU single market affects the quality of economic governance to a large extent. One would expect that important differentiation or even division lines will be formed among EU members (insiders) and non-EU members (outsiders). The other expectation is that within the EU itself, clear division lines in the quality of institutional framework would be formed among Euro Area and non-Euro Area members.
1 The theoretical background could be found in the number of works of many neo-institutional economists started from North, 1990; Williamson (1994); Hodgson (1998); La Porta et al (1999); Boettke (2000), Pejovich (1995) and many others. For the good overview of literature of literature see Campbell (2004).
3
The analysis that follows would reveal if these assumptions were correct for the sample of countries analyzed (EU, selected EFTA and Western Balkan countries).
The current EU economic governance regime and practice as well as underpinning institutional framework reflects to a great extent the prevailing “soft” coordination methods as apart from the monetary policy, most economic policies remained in the competence of national policy-making. For that reason, the current economic governance mechanisms have leaned more towards the regime of soft intergovernmental coordination than implementing efficient and harmonized EU-wide mix of economic and social policies. The current economic governance also reflect s divisions among member countries functions of state and markets that is also present in economic theory and policy practice (Begg, 2008; Marcussen, 2006; Dyson, 2002; Umbach and Wessles, 2008; Dahausse, 2008). The divisions are also substantial between euro zone and non-euro zone members (Dyson, 2008).
In this paper we focus on how the quality of institutional framework affects the convergence to the EU-core countries (EU-15) as a “moving target goal”, measuring it by several World Economic Forum indicators of institutional competitiveness.
3. Measuring European Institutional Quality - Methodological Approach The analysis that follows is based on the data from the Executive Opinion Survey, published by the World Economic Forum in the Global Competitiveness Reports for the period between 2004 and 2008. The WEF survey indicators measure the business community perception of many competitiveness factors that can not be measured by the hard data. The survey is conducted every year in a large number of countries, with identical set of questions and clearly defined sample, providing for a sound base for analyses.
There is a general problem of the analysis of the WEF survey data that are subject to changes in the overall business sentiment i.e. perception that proved to be rather volatile. However, the executive survey complements the formal methods of measuring the institutional development, by trying to depict the impact of the quality of institutions, as witnessed by the end-users i.e. the business community.
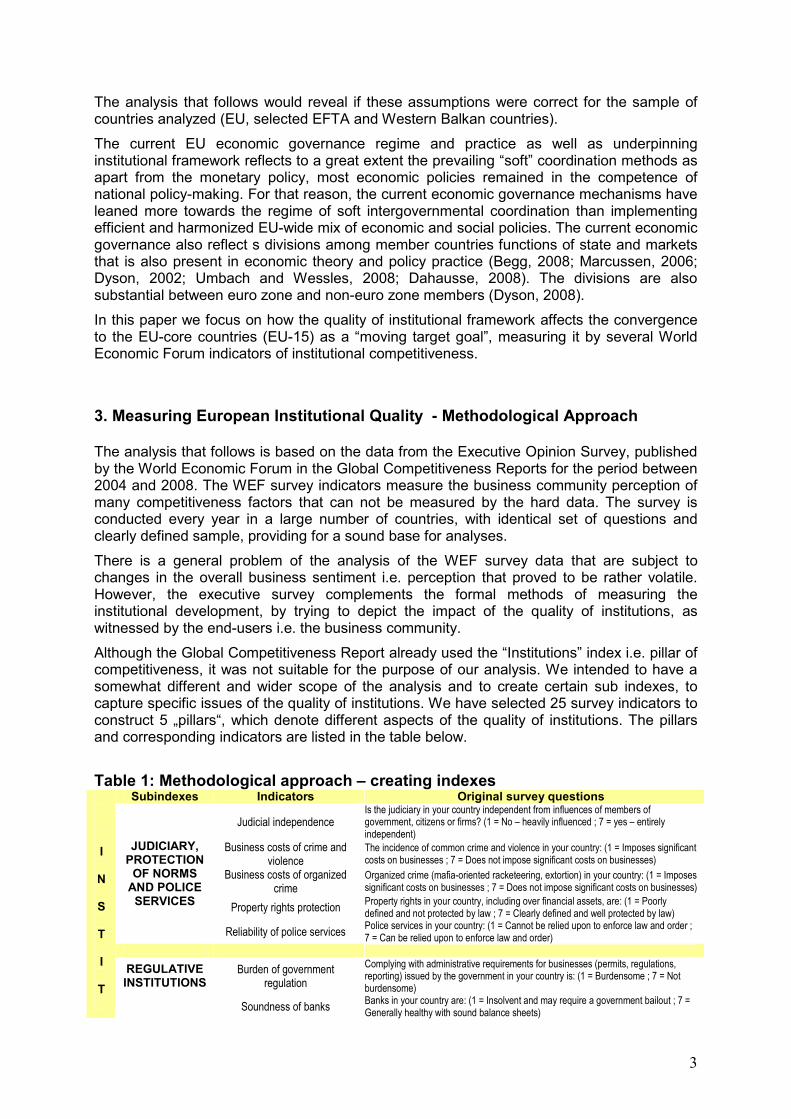
Although the Global Competitiveness Report already used the “Institutions” index i.e. pillar of competitiveness, it was not suitable for the purpose of our analysis. We intended to have a somewhat different and wider scope of the analysis and to create certain sub indexes, to capture specific issues of the quality of institutions. We have selected 25 survey indicators to construct 5 „pillars“, which denote different aspects of the quality of institutions. The pillars and corresponding indicators are listed in the table below.
Table 1: Methodological approach – creating indexes
Subindexes Indicators Original survey questions
Judicial independence Is the judiciary in your country independent from influences of members of government, citizens or firms? (1 = No – heavily influenced ; 7 = yes – entirely independent)
Business costs of crime and violence
The incidence of common crime and violence in your country: (1 = Imposes significant costs on businesses ; 7 = Does not impose significant costs on businesses)
Business costs of organized crime
Organized crime (mafia-oriented racketeering, extortion) in your country: (1 = Imposes significant costs on businesses ; 7 = Does not impose significant costs on businesses)
Property rights protection Property rights in your country, including over financial assets, are: (1 = Poorly defined and not protected by law ; 7 = Clearly defined and well protected by law)
JUDICIARY, PROTECTION OF NORMS AND POLICE SERVICES
Reliability of police services Police services in your country: (1 = Cannot be relied upon to enforce law and order ; 7 = Can be relied upon to enforce law and order)
Burden of government regulation
Complying with administrative requirements for businesses (permits, regulations, reporting) issued by the government in your country is: (1 = Burdensome ; 7 = Not burdensome)
I N S T I T
REGULATIVE INSTITUTIONS
Soundness of banks Banks in your country are: (1 = Insolvent and may require a government bailout ; 7 = Generally healthy with sound balance sheets)
4
Regulation of security exchanges
Regulation of securities exchanges in your country is: (1 = Not transparent, ineffective and subject to undue influence from industry and government ; 7 = Transparent, effective and independent of undue influence from industry and government)
Strength of auditing and accounting standards
Financial auditing and reporting standards regarding company financial performance in your country are: (1 = Extremely weak ; 7 = Extremely strong – the best in the world)
Protection of minority shareholders’ interests
Interests of minority shareholders in your country are: (1 = Not protected by law ; 7 = Protected by law and actively enforced)
Extent of market dominance Corporate activity in your country is: (1 = Dominated by a few business groups ; 7 = Spread among many firms)
Local competition Competition in the local market is: (1 = Limited in most industries ; 7 = Intense in most industries)
Effectiveness of antitrust policy
Anti-monopoly policy in your country is: (1 = Lax and not effective at promoting competition ; 7 = Effective and promotes competition)
Intellectual property protection
Intellectual property protection and anti-counterfeiting measures in your country are: (1 = Weak and not enforced ; 7 = Strong and enforced)
INSTITUTIONS FOR
PROTECTION OF MARKET COMPETITION Quality of competition in the
ISP sector
The competition among Internet Service Providers in your country ensures high quality, infrequent interruptions and low prices: (1 = Strongly disagree ; 7 = Strongly agree)
Business costs of corruption Do illegal payments to influence government policies, laws or regulations impose costs or otherwise negatively affect your company? (1 = Yes, they have a significant negative impact ; 7 = No, they have no impact)
Irregular payments in public contracts
In your country, how frequently would you estimate that firms make undocumented extra payments or bribes connected with the following: d. Awarding of public contracts and licenses: (1 = Common ; 7 = Never occurs)
Irregular payments for public utilities
In your country, how frequently would you estimate that firms make undocumented extra payments or bribes connected with the following: b. Public utilities (e.g., telephone or electricity): (1 = Common ; 7 = Never occurs)
Favoritism in decisions of government officials
When deciding upon policies and contracts, government officials in your country: (1 = Usually favor well-connected firms and individuals ; 7 = Are neutral)
ANTI-CORRUPTION INSTITUTIONS
Public trust of politicians Public trust in the financial honesty of politicians in your country is: (1 = Very low ; 7 = Very high)
Government spending wastefulness
The composition of public spending in your country: (1 = Is wasteful ; 7 = Efficiently provides necessary goods and services not provided by the market)
Agricultural policy cost Agricultural policy in your country: (1 = Is excessively burdensome for the economy ; 7 = Balances the interests of taxpayers, consumers and producers)
Quality of the educational system
The educational system in your country: (1 = Does not meet the needs of a competitive economy ; 7 = Meets the needs of a competitive economy)
Quality of public schools Primary schools in your country are: (1 = Of poor quality ; 7 = Among the best in the world)
U T I O N S
PUBLIC SECTOR
INSTITUTIONS
Overall infrastructure quality General infrastructure in your country is: (1 = Underdeveloped ; 7 = Extensive and efficient by international standards)
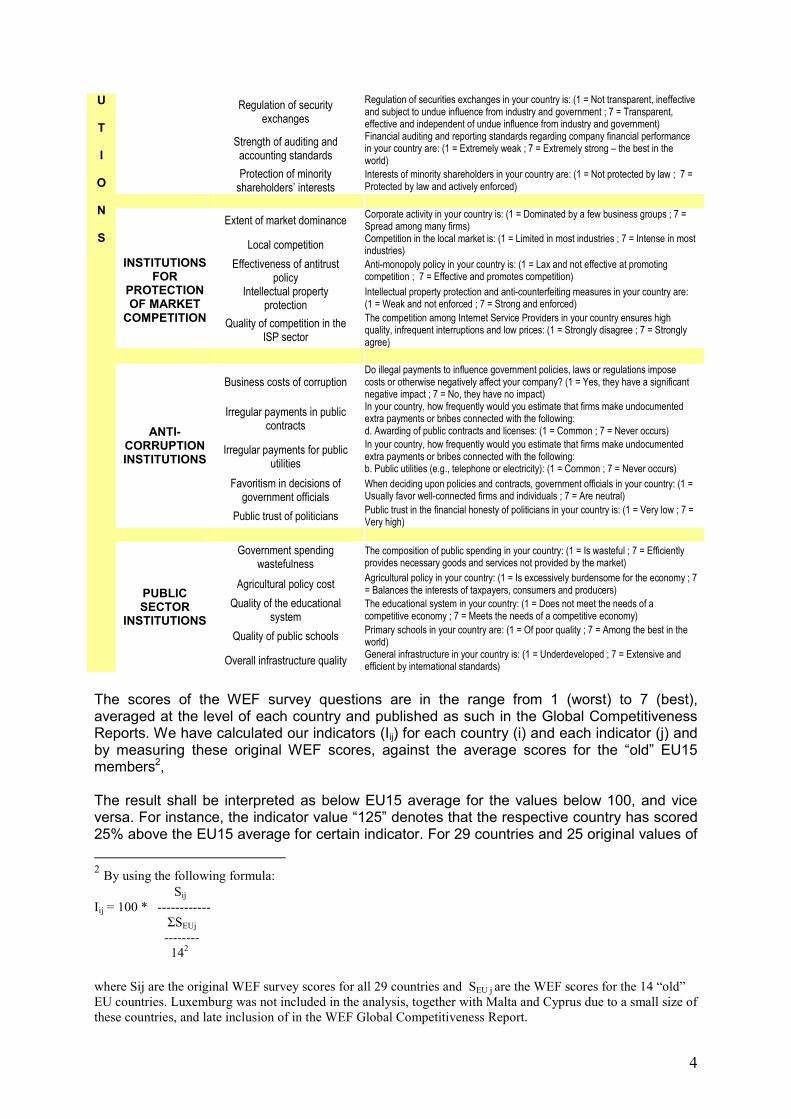
The scores of the WEF survey questions are in the range from 1 (worst) to 7 (best), averaged at the level of each country and published as such in the Global Competitiveness Reports. We have calculated our indicators (Iij) for each country (i) and each indicator (j) and by measuring these original WEF scores, against the average scores for the “old” EU15 members2, The result shall be interpreted as below EU15 average for the values below 100, and vice versa. For instance, the indicator value “125” denotes that the respective country has scored 25% above the EU15 average for certain indicator. For 29 countries and 25 original values of
2 By using the following formula: Sij
Iij = 100 * ------------
ΣSEUj
--------
142
where Sij are the original WEF survey scores for all 29 countries and SEU j are the WEF scores for the 14 “old”
EU countries. Luxemburg was not included in the analysis, together with Malta and Cyprus due to a small size of
these countries, and late inclusion of in the WEF Global Competitiveness Report.
5
survey quetions, we have calculated altogether 725 indicators, for each of 6 years under review. The calculated figures for each of 25 indicators were agregated (as simple averages) to the level of 5 subindexes. The identical procedure was applied to calculate the final “Institutions” index, from the 5 subindexes. Using that procedure, we have calculated 29 final “Institutions Quality” indicators for each year under review, to be able to depict more broad trends. The calculated 145 subindexes for each year provide us with a tool for in-depth assessment at the level of each of 5 subindexes. The analysis is focused on benchmarking the values of these indexes basically at two levels. First level is the “old” EU members that joined EU until 1995. However, Norway and Switzerland were also included in this group, since the two countries generally share a common path of institutional development with the “old” EU members, especially with former EFTA countries (Austria, Sweden, and Finland). The second group includes all other members, although containing also 3 SEE countries (Croatia, Macedonia and Serbia) in order to illustrate development of institutions in these countries that also intend to become EU members soon. The analysis has two main purposes. The first is to identify if there is a trend of convergence in the quality of institutions (within the scope of the method used), for both groups of countries. The second purpose of the analysis is to provide some more detailed findings of the main trends at the level of 5 sub indexes (pillars) of the institutions quality, in order to identify which institutional pillars and which countries make for the most of the identified trends of change of the quality of institutions. In our analyses we consider upgrading and convergence of the quality of institutions as an important indicator and illustration of positive link between good governance and economic performance.
6
4. Main trends – is there a convergence in the quality of institutions?
Good governance institutions have undoubtedly contributed to economic development and growth of EU countries over the last 50 years3, but especially since the formation of single market in 1992. Our analyses though focuses to the limited time horizon from 2003-2008 by attempting to measure if there is convergence in the levels of institutional quality both among EU insiders and outsiders. Although several analysed indicators of institutional quality in the EU-members, falls under the jurisdiction of the European Commission4, and these are mainly commonly agreed regulatory and legislative framework within acquis communautaire determined by the treaty on EMU, most of our selected indicators are still mainly under a competence of national legislation and policy-making. Out of our 5 pillars, only some regulatory and partly institutions of protection of market competition are under auspices of the EU institutions. However, several institutions are to a large extent subject to the national legislations and policies by accepting EU and international standards which relates in particularly to selected indicators such as fighting crime, enforcing property rights, accounting standards and education. Apart from that, certain elements of institutional quality, such as judiciary and anti-corruption are by any means to be improved in all member states, especially in the countries that historically faced the most significant problems. Therefore, a trend of convergence in the quality of regulatory and other institutions (broadly defined) shall illustrate extent of successful integration of the EU institutions. In our analyses we will examine the EU members and gravitating “outsiders” such as EFTA countries Switzerland and Norway, as well as selected Western Balkan candidate countries. As it seams, according to the analytical approach that we have used and in the period under review the „Old“ EU members have diverged rather than converged in the quality of selected institutions. Italy, Greece and Portugal were clearly falling down from the convergence line throughout 2003-2008 and even the United Kingdom in the last two years 2007-2008. On the other hand, Switzerland, Austria, Netherlands and Norway, Ireland went up above all the others, while France is, especially since 2005, struggling to catch-up an average EU-15 institutional quality line.
3 Easterly and Levine, 1997; Johnson, Kaufman and Schleifer, 1997; Lippert and Umbach 2005.
4 Renewed Lisbon Governance instruments within the OMC rely heavily on voluntary arrangements, leaving the individual member states to support the EU economic reform by own policies, taking more responsibility for it, and at the same time learning from other experiences (benchmarking), while viewing the Commission role more as a facilitator rather than the manager or controller of what is being done (EC, 2008)

7
FIGURE 1: Institutions quality index 2003-2008 – „Old members“
70
100
2003 2004 2005 2006 2007 2008
Finland
Denmark
Switzerland
Sweden
Austria
Netherlands
Norway
Germany
Belgium
Ireland
France
United Kingdom
Portugal
Spain
Greece
Italy
Source: WEF survey database, own calculation
It is interesting to observe that the “new” EU member states face a certain stalemate in the quality of institutions, without clear convergence towards the EU average. Only Estonia, Slovenia and Lithuania were moving towards the EU15 average level converging, others seam not. Hungary, Latvia and Poland have been significantly worsening their institutional quality, as perceived by their business communities measured in WEF indicators. One rather simplified explanation might be that the economic governance mechanisms within the EU within the OMC do not exert such pressures to converge as prior to the membership when the drive of Europeanization of their institutions was almost “a must”. The South-East European future members show upwards trend in the case of Macedonia and Croatia (as candidate countries both under strong pressure of Europeanization), while Serbia seems to have been lagging behind with reforms.

8
FIGURE 2: Institutions quality index 2003-2008 – New and future members
60
70
80
90
100
2003 2004 2005 2006 2007 2008
Estonia
Slovenia
Lithuania
Czech Republic
Latvia
Slovak Republic
Croatia
Hungary
Romania
Poland
Macedonia,
Bulgaria
Serbia
Source: WEF survey database, own calculation
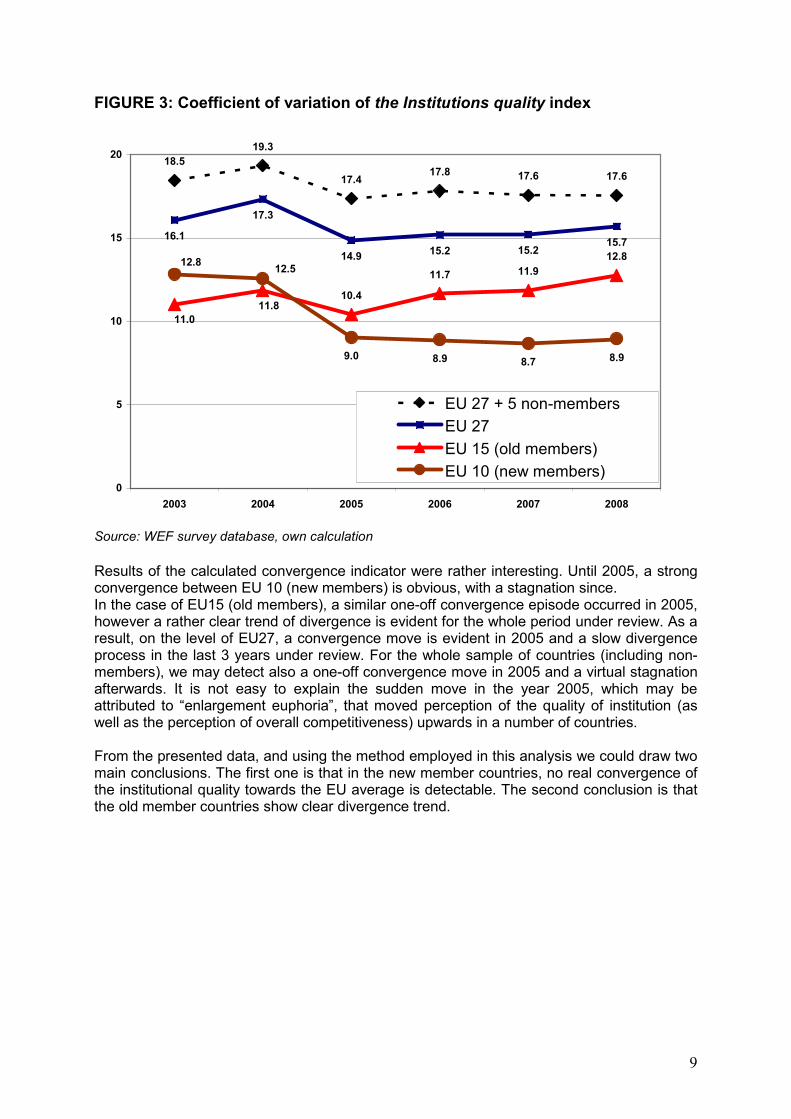
With an attempt to measure the level and direction of convergence, we have calculated simple Coefficient of variation5 for the selected groups of countries. The results are shown in Figure 3.
5 Coefficient of variation (CV) is a normalized measure of dispersion of a probability distribution. It is defined
as the ratio of the standard deviation to the mean (average value).
9
FIGURE 3: Coefficient of variation of the Institutions quality index
18.5
19.3
17.417.8 17.6 17.6
16.1
17.3
14.915.2 15.2
15.7
10.4
11.7 11.9
12.8
9.0 8.9 8.7 8.9
11.0
11.8
12.812.5
0
5
10
15
20
2003 2004 2005 2006 2007 2008
EU 27 + 5 non-members
EU 27
EU 15 (old members)
EU 10 (new members)
Source: WEF survey database, own calculation
Results of the calculated convergence indicator were rather interesting. Until 2005, a strong convergence between EU 10 (new members) is obvious, with a stagnation since. In the case of EU15 (old members), a similar one-off convergence episode occurred in 2005, however a rather clear trend of divergence is evident for the whole period under review. As a result, on the level of EU27, a convergence move is evident in 2005 and a slow divergence process in the last 3 years under review. For the whole sample of countries (including non-members), we may detect also a one-off convergence move in 2005 and a virtual stagnation afterwards. It is not easy to explain the sudden move in the year 2005, which may be attributed to “enlargement euphoria”, that moved perception of the quality of institution (as well as the perception of overall competitiveness) upwards in a number of countries. From the presented data, and using the method employed in this analysis we could draw two main conclusions. The first one is that in the new member countries, no real convergence of the institutional quality towards the EU average is detectable. The second conclusion is that the old member countries show clear divergence trend.
10
5. Detailed analysis – What has happened?
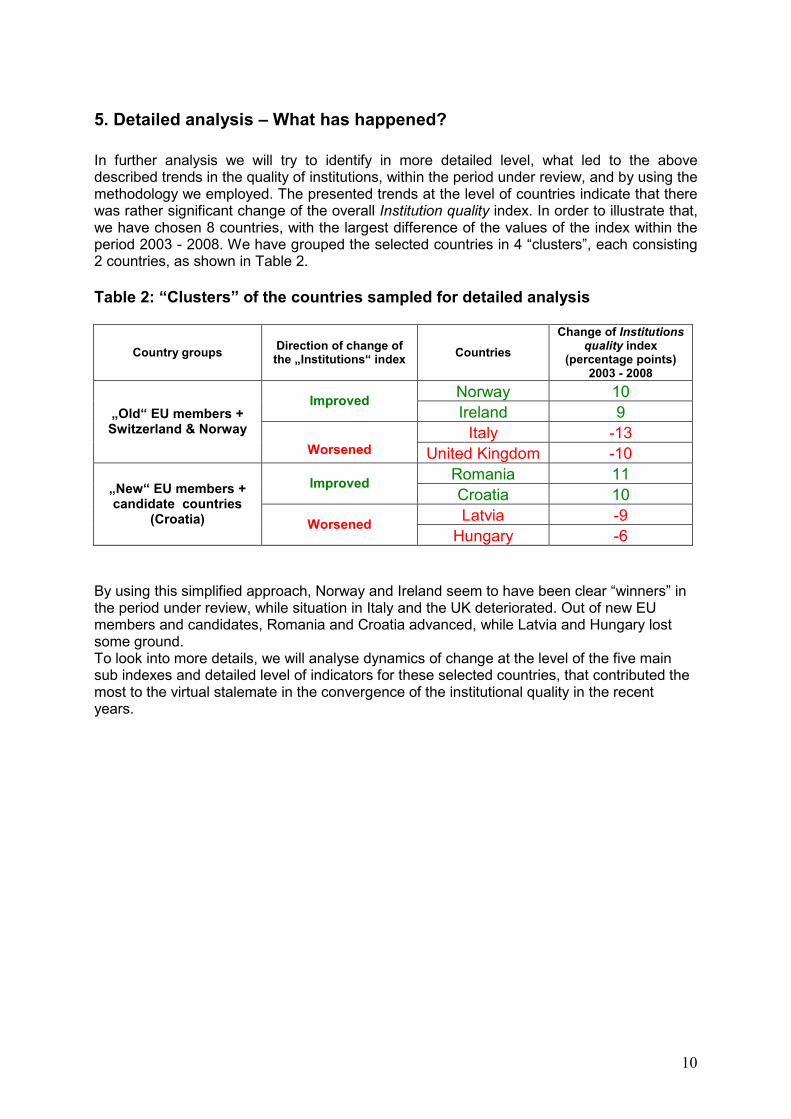
In further analysis we will try to identify in more detailed level, what led to the above described trends in the quality of institutions, within the period under review, and by using the methodology we employed. The presented trends at the level of countries indicate that there was rather significant change of the overall Institution quality index. In order to illustrate that, we have chosen 8 countries, with the largest difference of the values of the index within the period 2003 - 2008. We have grouped the selected countries in 4 “clusters”, each consisting 2 countries, as shown in Table 2.
Table 2: “Clusters” of the countries sampled for detailed analysis
Country groups Direction of change of the „Institutions“ index
Countries
Change of Institutions quality index
(percentage points) 2003 - 2008
Norway 10 Improved
Ireland 9
Italy -13
„Old“ EU members + Switzerland & Norway
Worsened United Kingdom -10
Romania 11 Improved
Croatia 10
Latvia -9
„New“ EU members + candidate countries
(Croatia) Worsened Hungary -6
By using this simplified approach, Norway and Ireland seem to have been clear “winners” in the period under review, while situation in Italy and the UK deteriorated. Out of new EU members and candidates, Romania and Croatia advanced, while Latvia and Hungary lost some ground. To look into more details, we will analyse dynamics of change at the level of the five main sub indexes and detailed level of indicators for these selected countries, that contributed the most to the virtual stalemate in the convergence of the institutional quality in the recent years.
11
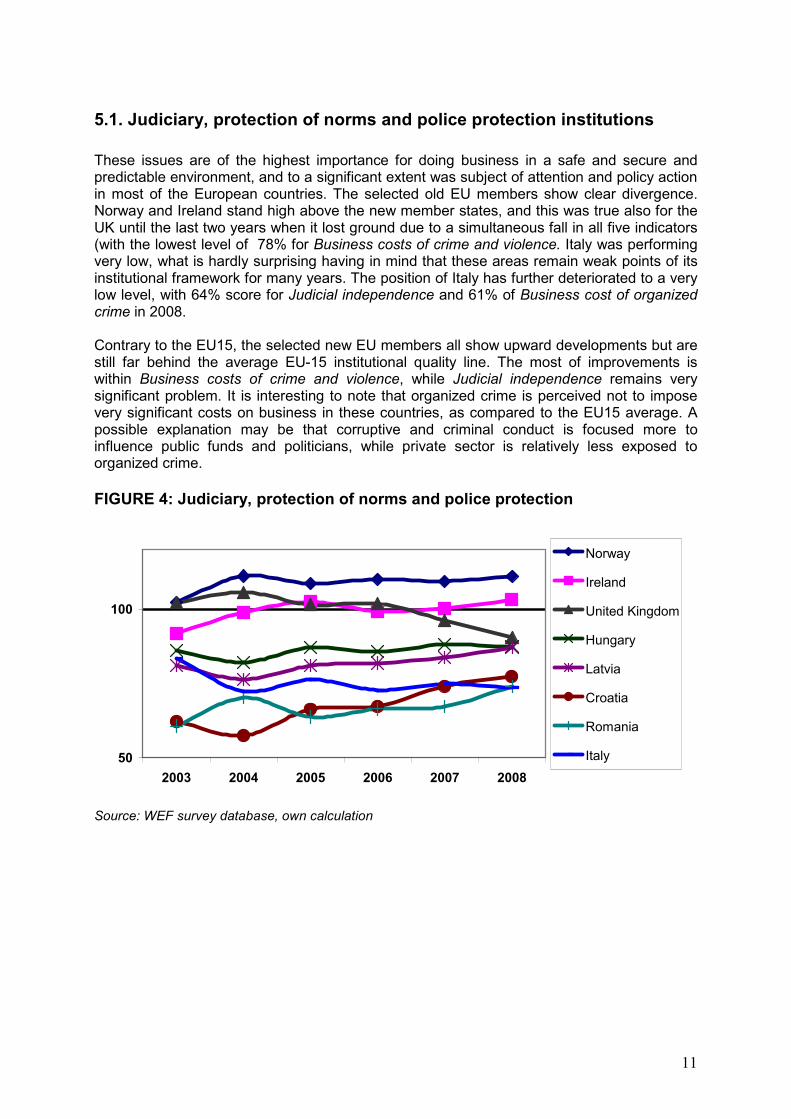
5.1. Judiciary, protection of norms and police protection institutions
These issues are of the highest importance for doing business in a safe and secure and predictable environment, and to a significant extent was subject of attention and policy action in most of the European countries. The selected old EU members show clear divergence. Norway and Ireland stand high above the new member states, and this was true also for the UK until the last two years when it lost ground due to a simultaneous fall in all five indicators (with the lowest level of 78% for Business costs of crime and violence. Italy was performing very low, what is hardly surprising having in mind that these areas remain weak points of its institutional framework for many years. The position of Italy has further deteriorated to a very low level, with 64% score for Judicial independence and 61% of Business cost of organized crime in 2008. Contrary to the EU15, the selected new EU members all show upward developments but are still far behind the average EU-15 institutional quality line. The most of improvements is within Business costs of crime and violence, while Judicial independence remains very significant problem. It is interesting to note that organized crime is perceived not to impose very significant costs on business in these countries, as compared to the EU15 average. A possible explanation may be that corruptive and criminal conduct is focused more to influence public funds and politicians, while private sector is relatively less exposed to organized crime.
FIGURE 4: Judiciary, protection of norms and police protection
50
100
2003 2004 2005 2006 2007 2008
Norway
Ireland
United Kingdom
Hungary
Latvia
Croatia
Romania
Italy
Source: WEF survey database, own calculation
12
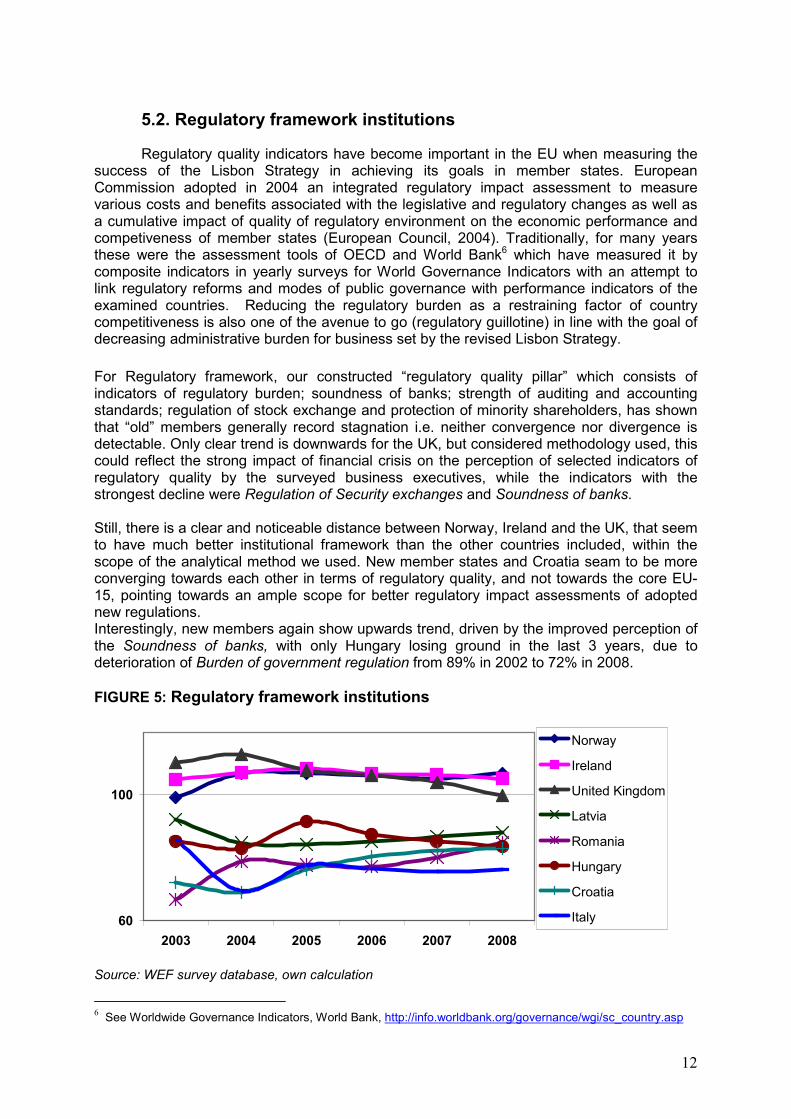
5.2. Regulatory framework institutions
Regulatory quality indicators have become important in the EU when measuring the success of the Lisbon Strategy in achieving its goals in member states. European Commission adopted in 2004 an integrated regulatory impact assessment to measure various costs and benefits associated with the legislative and regulatory changes as well as a cumulative impact of quality of regulatory environment on the economic performance and competiveness of member states (European Council, 2004). Traditionally, for many years these were the assessment tools of OECD and World Bank6 which have measured it by composite indicators in yearly surveys for World Governance Indicators with an attempt to link regulatory reforms and modes of public governance with performance indicators of the examined countries. Reducing the regulatory burden as a restraining factor of country competitiveness is also one of the avenue to go (regulatory guillotine) in line with the goal of decreasing administrative burden for business set by the revised Lisbon Strategy.
For Regulatory framework, our constructed “regulatory quality pillar” which consists of indicators of regulatory burden; soundness of banks; strength of auditing and accounting standards; regulation of stock exchange and protection of minority shareholders, has shown that “old” members generally record stagnation i.e. neither convergence nor divergence is detectable. Only clear trend is downwards for the UK, but considered methodology used, this could reflect the strong impact of financial crisis on the perception of selected indicators of regulatory quality by the surveyed business executives, while the indicators with the strongest decline were Regulation of Security exchanges and Soundness of banks. Still, there is a clear and noticeable distance between Norway, Ireland and the UK, that seem to have much better institutional framework than the other countries included, within the scope of the analytical method we used. New member states and Croatia seam to be more converging towards each other in terms of regulatory quality, and not towards the core EU-15, pointing towards an ample scope for better regulatory impact assessments of adopted new regulations. Interestingly, new members again show upwards trend, driven by the improved perception of the Soundness of banks, with only Hungary losing ground in the last 3 years, due to deterioration of Burden of government regulation from 89% in 2002 to 72% in 2008.
FIGURE 5: Regulatory framework institutions
60
100
2003 2004 2005 2006 2007 2008
Norway
Ireland
United Kingdom
Latvia
Romania
Hungary
Croatia
Italy
Source: WEF survey database, own calculation
6 See Worldwide Governance Indicators, World Bank, http://info.worldbank.org/governance/wgi/sc_country.asp

13
5.3. Institutions for the protection of market competition
This is a field of clear divergence between the selected new members when measured by selected indicators (effectiveness of antitrust policy, extent of market dominance, quality of competition in the ISP sector, intellectual property protection decentralisation of corporate activity). After joining the EU, the pressure for adjustments of market structure has eased, coupled with some imperfect mechanisms of control within the OMC to adjust to EU competition rules within the new members themselves, could be the possible reasons. Also, dealing with competition rules, especially in the areas such as state aid to loss-making heavy industries, for some new CEE and SEE members were hard to comply with successfully due to weak capacities of anti-trust agencies. The same was with Croatia with regard to its steel and shipbuilding industry.
Italy and the UK fell significantly due to perceived decrease of Competition in the ISP sector, as well as Effectiveness of antitrust policy. Norway improved significantly for all 5 indicators of market competition, which is worth noting as opposed to a common sense that Norway, as non-member country is less included in the trends of increased market competition.
It is also interesting to note a similar trend in Croatia, however at a much lower level, indicating that surveyed executives feel increased competitive pressure, presumably due to opening of markets within the process of alignment to the acquis communautaire.
The distinction between Norway, Ireland and the UK and the new members is large and clear, and the UK, notwithstanding the loss of (perceived) position was still postioned above the EU15 average in 2008.
FIGURE 6: Institutions for the protection of market competition
60
100
2003 2004 2005 2006 2007 2008
Norway
United Kingdom
Ireland
Italy
Hungary
Latvia
Romania
Croatia
Source: WEF survey database, own calculation

14
5.4. Anti-corruption institutions
In this particular field (with indicators such as irregular payments in public contracts, business costs of corruption, irregular payments for public utilities, favouritism in decisions by government officials, public trust of politicians); divergence is clear for the old members, consistent with the movements of the overall Institutions index. The fall in Italy was immense, due to deterioration of perceived corruption of public servants and politicians. In the UK the most notable fall occurred in Public trust of politicians, from a position 16% above the EU15 average in 2005 to 15% below the average in 2008. However, the 3 “old” EU members are still very much ahead with the (perceived) quality of anti-corruption institutions and policies, while the new members are further falling down from the already very low initial position. The only example is Romania, which significantly improved its initially quite disastrous position with immense improvement in the perception of corruption connected with public contracts and public utilities. The perception of the examined indicators in Latvia and Hungary worsened notably, mostly with regard to trust in financial honesty of politicians and neutrality of government officials when deciding upon public policies and public procurement contracts.
FIGURE 7: Anti-corruption institutions
50
100
2003 2004 2005 2006 2007 2008
Norway
Ireland
United Kingdom
Croatia
Latvia
Italy
Romania
Hungary
Source: WEF survey database, own calculation
15
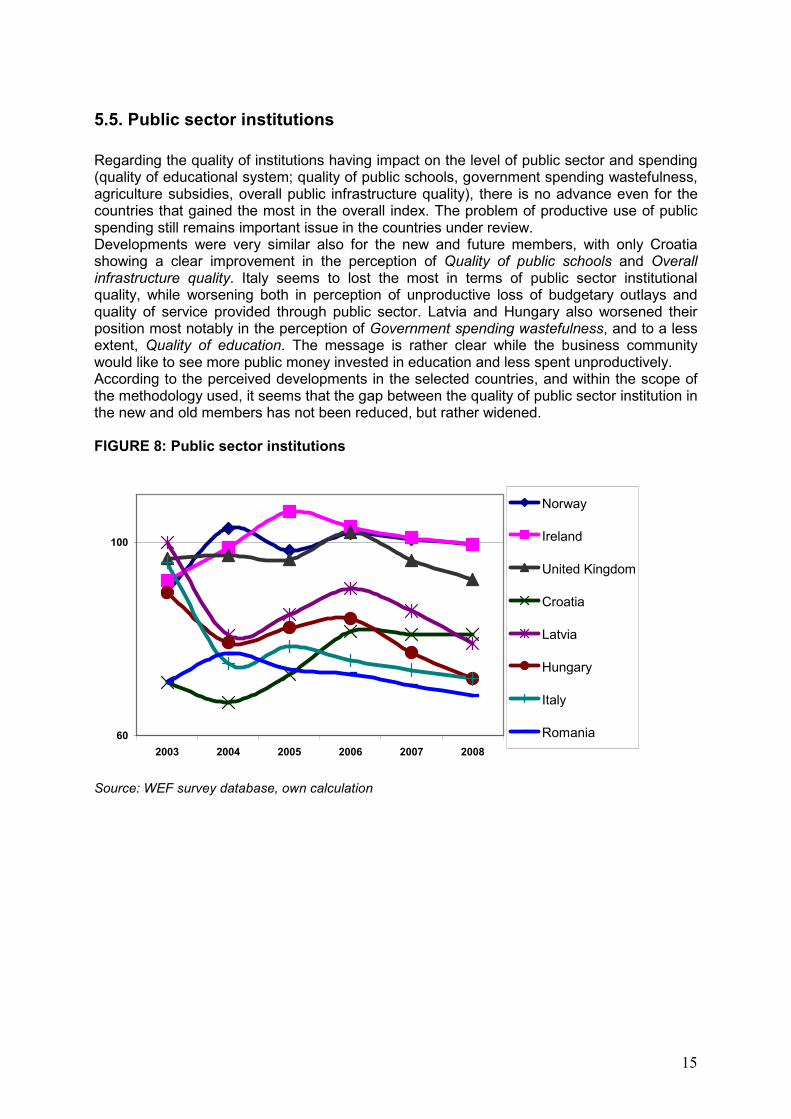
5.5. Public sector institutions
Regarding the quality of institutions having impact on the level of public sector and spending (quality of educational system; quality of public schools, government spending wastefulness, agriculture subsidies, overall public infrastructure quality), there is no advance even for the countries that gained the most in the overall index. The problem of productive use of public spending still remains important issue in the countries under review. Developments were very similar also for the new and future members, with only Croatia showing a clear improvement in the perception of Quality of public schools and Overall infrastructure quality. Italy seems to lost the most in terms of public sector institutional quality, while worsening both in perception of unproductive loss of budgetary outlays and quality of service provided through public sector. Latvia and Hungary also worsened their position most notably in the perception of Government spending wastefulness, and to a less extent, Quality of education. The message is rather clear while the business community would like to see more public money invested in education and less spent unproductively. According to the perceived developments in the selected countries, and within the scope of the methodology used, it seems that the gap between the quality of public sector institution in the new and old members has not been reduced, but rather widened. FIGURE 8: Public sector institutions
60
100
2003 2004 2005 2006 2007 2008
Norway
Ireland
United Kingdom
Croatia
Latvia
Hungary
Italy
Romania
Source: WEF survey database, own calculation

16
6. Concluding remarks
The paper attempted to demonstrate significant differences among the EU and selected non-EU countries in the 25 various indicators of institutional quality we measured by constructing our own “institutions” index based on WEF Executive Survey Indicators for Global Competitiveness Index Report.
Our analyses found interesting differences in terms of change of institutional quality even among the core EU-15 countries, and especially when compared with two most advanced EFTA countries. Some old EU members such as Italy, Greece and Portugal (throughout 2003-2008) and even the UK (especially in 2007-2008) were clearly demonstrating falling down convergence trends. Additionally, no real convergence trend of the new EU members could be detected from the presented data. Furthermore, the EU and future members from Western Balkans seam to be either stagnating or clearly diverging from an average EU institutional quality levels.
Leaving aside academic discussions7 on difficulties and limitations of measuring the quality of institutions by composite governance indicators such as regulatory quality, rule of law, control of corruption, government effectiveness in delivery of policy goals, government accountability, ensuring absence of violence etc) which rely heavily on assessments and perceptions from WEF survey, we still found it an useful explanatory tool for cross-country comparison of their impact on economic performance an international competitiveness levels.
Regardless the fact that the new EU-members have progressed considerably in complying with the formal convergence criteria, and also as measured by the general WEF Global Competitiveness Index, looking into more detailed indicators we have shown that they as well as Croatia as “soon to be” a member, still have much to reform, especially in several examined fields of the quality of institutions. Directed efforts are needed especially when it comes to improving judiciary independence; enforcement of business contracts as well as in fight against corruption and organized crime especially in Western Balkan countries.
More detailed examination of specific indicators of institutional quality that directly affect the business transactions costs show that nominal convergence and transposition of EU norms des not necessarily guarantee their enforcement. The gap between the adopted and enforced norms is still rather high while effectiveness of government to deliver the good governance and institutional quality still low. As many other similar studies have demonstrated8, converging institutional environment in terms of quality requirements especially in the new EU members and candidate countries is still very much a “work in progress”. This comes to be true even for some of “old” EU members.
7 See Kaufman et al. (2007) 8 World Governance Indicators, 2008; Doing Buisness, 2008, Transparency International Index, 2008.
17
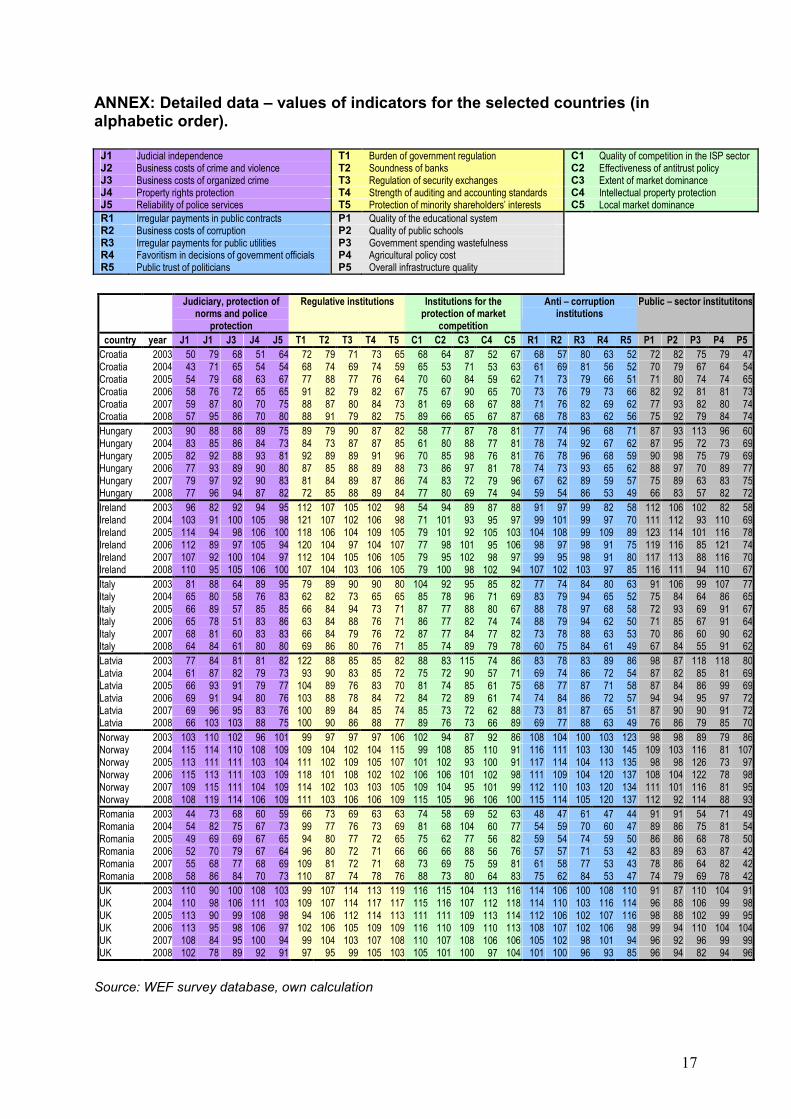
ANNEX: Detailed data – values of indicators for the selected countries (in alphabetic order).
J1 Judicial independence T1 Burden of government regulation C1 Quality of competition in the ISP sector J2 Business costs of crime and violence T2 Soundness of banks C2 Effectiveness of antitrust policy J3 Business costs of organized crime T3 Regulation of security exchanges C3 Extent of market dominance J4 Property rights protection T4 Strength of auditing and accounting standards C4 Intellectual property protection J5 Reliability of police services T5 Protection of minority shareholders’ interests C5 Local market dominance
R1 Irregular payments in public contracts P1 Quality of the educational system R2 Business costs of corruption P2 Quality of public schools R3 Irregular payments for public utilities P3 Government spending wastefulness R4 Favoritism in decisions of government officials P4 Agricultural policy cost R5 Public trust of politicians P5 Overall infrastructure quality
Judiciary, protection of
norms and police protection
Regulative institutions Institutions for the protection of market
competition
Anti – corruption institutions
Public – sector institutitons
country year J1 J1 J3 J4 J5 T1 T2 T3 T4 T5 C1 C2 C3 C4 C5 R1 R2 R3 R4 R5 P1 P2 P3 P4 P5
Croatia 2003 50 79 68 51 64 72 79 71 73 65 68 64 87 52 67 68 57 80 63 52 72 82 75 79 47Croatia 2004 43 71 65 54 54 68 74 69 74 59 65 53 71 53 63 61 69 81 56 52 70 79 67 64 54Croatia 2005 54 79 68 63 67 77 88 77 76 64 70 60 84 59 62 71 73 79 66 51 71 80 74 74 65Croatia 2006 58 76 72 65 65 91 82 79 82 67 75 67 90 65 70 73 76 79 73 66 82 92 81 81 73Croatia 2007 59 87 80 70 75 88 87 80 84 73 81 69 68 67 88 71 76 82 69 62 77 93 82 80 74Croatia 2008 57 95 86 70 80 88 91 79 82 75 89 66 65 67 87 68 78 83 62 56 75 92 79 84 74
Hungary 2003 90 88 88 89 75 89 79 90 87 82 58 77 87 78 81 77 74 96 68 71 87 93 113 96 60Hungary 2004 83 85 86 84 73 84 73 87 87 85 61 80 88 77 81 78 74 92 67 62 87 95 72 73 69Hungary 2005 82 92 88 93 81 92 89 89 91 96 70 85 98 76 81 76 78 96 68 59 90 98 75 79 69Hungary 2006 77 93 89 90 80 87 85 88 89 88 73 86 97 81 78 74 73 93 65 62 88 97 70 89 77Hungary 2007 79 97 92 90 83 81 84 89 87 86 74 83 72 79 96 67 62 89 59 57 75 89 63 83 75Hungary 2008 77 96 94 87 82 72 85 88 89 84 77 80 69 74 94 59 54 86 53 49 66 83 57 82 72
Ireland 2003 96 82 92 94 95 112 107 105 102 98 54 94 89 87 88 91 97 99 82 58 112 106 102 82 58Ireland 2004 103 91 100 105 98 121 107 102 106 98 71 101 93 95 97 99 101 99 97 70 111 112 93 110 69Ireland 2005 114 94 98 106 100 118 106 104 109 105 79 101 92 105 103 104 108 99 109 89 123 114 101 116 78Ireland 2006 112 89 97 105 94 120 104 97 104 107 77 98 101 95 106 98 97 98 91 75 119 116 85 121 74Ireland 2007 107 92 100 104 97 112 104 105 106 105 79 95 102 98 97 99 95 98 91 80 117 113 88 116 70Ireland 2008 110 95 105 106 100 107 104 103 106 105 79 100 98 102 94 107 102 103 97 85 116 111 94 110 67
Italy 2003 81 88 64 89 95 79 89 90 90 80 104 92 95 85 82 77 74 84 80 63 91 106 99 107 77Italy 2004 65 80 58 76 83 62 82 73 65 65 85 78 96 71 69 83 79 94 65 52 75 84 64 86 65Italy 2005 66 89 57 85 85 66 84 94 73 71 87 77 88 80 67 88 78 97 68 58 72 93 69 91 67Italy 2006 65 78 51 83 86 63 84 88 76 71 86 77 82 74 74 88 79 94 62 50 71 85 67 91 64Italy 2007 68 81 60 83 83 66 84 79 76 72 87 77 84 77 82 73 78 88 63 53 70 86 60 90 62Italy 2008 64 84 61 80 80 69 86 80 76 71 85 74 89 79 78 60 75 84 61 49 67 84 55 91 62
Latvia 2003 77 84 81 81 82 122 88 85 85 82 88 83 115 74 86 83 78 83 89 86 98 87 118 118 80Latvia 2004 61 87 82 79 73 93 90 83 85 72 75 72 90 57 71 69 74 86 72 54 87 82 85 81 69Latvia 2005 66 93 91 79 77 104 89 76 83 70 81 74 85 61 75 68 77 87 71 58 87 84 86 99 69Latvia 2006 69 91 94 80 76 103 88 78 84 72 84 72 89 61 74 74 84 86 72 57 94 94 95 97 72Latvia 2007 69 96 95 83 76 100 89 84 85 74 85 73 72 62 88 73 81 87 65 51 87 90 90 91 72Latvia 2008 66 103 103 88 75 100 90 86 88 77 89 76 73 66 89 69 77 88 63 49 76 86 79 85 70
Norway 2003 103 110 102 96 101 99 97 97 97 106 102 94 87 92 86 108 104 100 103 123 98 98 89 79 86Norway 2004 115 114 110 108 109 109 104 102 104 115 99 108 85 110 91 116 111 103 130 145 109 103 116 81 107Norway 2005 113 111 111 103 104 111 102 109 105 107 101 102 93 100 91 117 114 104 113 135 98 98 126 73 97Norway 2006 115 113 111 103 109 118 101 108 102 102 106 106 101 102 98 111 109 104 120 137 108 104 122 78 98Norway 2007 109 115 111 104 109 114 102 103 103 105 109 104 95 101 99 112 110 103 120 134 111 101 116 81 95Norway 2008 108 119 114 106 109 111 103 106 106 109 115 105 96 106 100 115 114 105 120 137 112 92 114 88 93
Romania 2003 44 73 68 60 59 66 73 69 63 63 74 58 69 52 63 48 47 61 47 44 91 91 54 71 49Romania 2004 54 82 75 67 73 99 77 76 73 69 81 68 104 60 77 54 59 70 60 47 89 86 75 81 54Romania 2005 49 69 69 67 65 94 80 77 72 65 75 62 77 56 82 59 54 74 59 50 86 86 68 78 50Romania 2006 52 70 79 67 64 96 80 72 71 66 66 66 88 56 76 57 57 71 53 42 83 89 63 87 42Romania 2007 55 68 77 68 69 109 81 72 71 68 73 69 75 59 81 61 58 77 53 43 78 86 64 82 42Romania 2008 58 86 84 70 73 110 87 74 78 76 88 73 80 64 83 75 62 84 53 47 74 79 69 78 42
UK 2003 110 90 100 108 103 99 107 114 113 119 116 115 104 113 116 114 106 100 108 110 91 87 110 104 91UK 2004 110 98 106 111 103 109 107 114 117 117 115 116 107 112 118 114 110 103 116 114 96 88 106 99 98UK 2005 113 90 99 108 98 94 106 112 114 113 111 111 109 113 114 112 106 102 107 116 98 88 102 99 95UK 2006 113 95 98 106 97 102 106 105 109 109 116 110 109 110 113 108 107 102 106 98 99 94 110 104 104UK 2007 108 84 95 100 94 99 104 103 107 108 110 107 108 106 106 105 102 98 101 94 96 92 96 99 99UK 2008 102 78 89 92 91 97 95 99 105 103 105 101 100 97 104 101 100 96 93 85 96 94 82 94 96
Source: WEF survey database, own calculation
18
REFERENCES
Begg, I. (2008) Economic Governance of the Enlarged Euro Area, EUROPEAN ECONOMY, Economic Papers no 311, DG Economic and Financial Affairs, European Commission, March.
Begg, I. and A. Larsson (2007), “The 2007 European challenge: taking world leadership for smarter growth,” European Economic and Employment Brief no. 1/2007, European Trade Union Institute.
Begg, I.(2006), “Economic policy and institutional transparency: the EC,” in Oxelheim, L. and J. Forssbaeck (eds.), Corporate and institutional transparency for economic growth in Europe, Oxford: Elsevier.
Begg, Iain; Hodson, Deromt and Maher, Imelda (2003); Economic Policy Co-ordination in the European Union, National Institute Economic Review 183 (2003), pp. 66-77.
Boettke, P. (2000), On Norms, Rules and Markets: A Comment on Samuels, Journal des Economistes des Etudes Humaines, 10(4): 547-552.
Cuckovic,N. and Jurlin, K. (2009) Determinants of Competitiveness and Economic Governance: Some Evidence from the New EU Member States and Croatia, paper presented at the 11th Biennial EUSA Conference, 23-25 April 2009, Los Angeles, California.
Campbell, John L. (2004) Institutional Change and Globalisation, Princeton University Press, Princeton.
Council of the European Union (2004), Outcome of the Proceedings of the Competitiveness Council on 24 September 2004- Council Conclusions”, Doc 12898/04, Brussels, 30 September 2004.
European Commission (2008), Lisbon Strategy: Between revolution and illusion: The Governance challenge for knowledge policies, LEG Synthesis Report, EUR 23469, DG for Research. Brussels.
Hausmann, R., Pritchett, L and D. Rodrik (2004), «Growth Accellerators», NBER Working paper no .10566, Washington. March
De Francesco, F. and Radaelli, C.M. (2007) Indicators of Regulatory Quality in Kirkpatrick, C. and Parker, D (eds): Regulatory Impact Assessment: Towards Better Regulation?, Edward Elgar Publishing, Cheltenham.
Dyson, K. (ed.) (2008), Euro at Ten: Europeanization, Power, and Convergence, Oxford University Press, Oxford.
Hodgson, G. (1998) ‘The Approach of Institutional Economics’, Journal of Economic
Literature, XXXVI, pp 166-192
Iwanow, T. and Kirkpatrick, C. (2007) “Trade Facilitation, Regulatory Quality and Export Performance”, Impact Assessment Research Centre, Working Paper Series no/19/2007, Manchester, University of Manchester.
Kaufmann, D; Kraay, A. and Mastruzzi, M. (2008), “Governance Matters VII: Aggregate and Individual Governance Indicators, 1996-2007”. World Bank Policy Research Working Paper No. 4654. Available at SSRN: http://ssrn.com/abstract=1148386
Kaufmann, D; Aart Kraay, A. and Mastruzzi, M. (2007) The worldwide The Worldwide Governance Indicators Project: Answering the Critics, World Bank Policy Research Working Paper Series no. 4149, World Bank. Washington D.C.

19
Jurlin, K. (2008), Assessment of Governance Quality in Europe and Latin America: What is Different?”, paper presented at the 12th EADI Conference “Global Governance for Sustainable Development”, Geneva, 24-28 June 2008.
La Porta, R. De Silanes,F.L.; Schleifer, A and R. Vishny (1999) The Quality of Government, Journal of Law, Economics and Organization, 15(1): 222-279.
Lippert, B. and Umbach, G. (2005) The Pressure of Europeanization: From Post-communist State Administrations to Normal Players of the EU, Nomos, Baden-Baden.
Lippert, B.; Umbach, G. and Wessels, W. (2001), Europeanization of CEE Executives; EU Membership Negotiations as a Shaping Power?, Journal of European Public Policy, 8 (6); 980-1012.
Marcussen, M.(2006), The Lisbon Process and Bench-Learning, Working Paper no. 3, Center for Democratic Network Governance, Roskilde University.
Marcussen, M. (2008) Institutional Competitiveness: The Lisbon Process, Soft Governance and Convergence in: Dyson, Kenneth (ed): Euro at Ten: Europeanization, Power, Convergence, Oxford University Press, Oxford.
North, D. (1990), Institutions, Institutional Change and Economic Performance, Cambridge University Press, Cambridge.
North, D. (1997): "The Contribution of the New Institutional Economics to an Understanding of the Transition Problem", WIDER Annual Lectures, 1, UNU/WIDER, Helsinki, March.
Olson, M and Kakhonen, S. (2001) A New Institutional Approach to Economic Development, IRIS, Maryland University, College Park.
Olson, M; Sarna, N; Swamy, A.W. (2000) Governance and Growth: A Simple Hypothesis Explaining Cross-Country Differences in Productivity Growth, Public Choice, 102 (3-4)341-364, Kluwer Academic Publishers, Netherlands
Pedersen, K. Ove (2008), Institutional Competitiveness: How Nations came to Compete, Working Paper no.47, Copenhagen Business School, Copenhagen.
Pejovich, S. (1995): Economic Analysis of Institutions and Systems, Dordrecht: Kluwer Academic Publishers.
Rodrik, D. (2004): Getting Institutions Right, CESifo DICE Report no. 2/2004.
Williamson, J. (1994), The Political Economy of Policy Reform, Washington D.C. Institute for International Economics.
World Economic Forum, The Global Competitiveness Report, issues 2004-2009, WEF, Geneva.
World Bank (2008a) Worldwide Governance Indicators, available at: http://info.worldbank.org/governance/wgi/sc_country.asp
World Bank and IFC (2008b); Doing Business 2009 available at: www.doingbusiness.org