comparative analysis of some volatility estimators: an
TRANSCRIPT

International Journal of Computational and Theoretical Statistics ISSN (2210-1519)
Int. J. Comp. Theo. Stat. 4, No. 1 (May-2017)
E-mail address: [email protected], [email protected]
http://journals.uob.edu.bh
Comparative Analysis of Some Volatility Estimators:
An Application to Historical Data from the Nigerian Stock
Exchange Market
Benjamin Oyediran Oyelami 1
and Eric Erenam Sambo 2
1 Department of Mathematics of the Plateau State University, Bokkos, Nigeria
2 Nigerian Export and Import Promotion Bank, Abuja, Nigeria
Received September 17, 2016, Revised December 2, 2016, Accepted December 13, 2016, Published May 1, 2017
Abstract: Several models exist for estimating volatility of stocks. In this paper, comparisons are made for the
performance characteristics of seven volatility estimators using the data for eleven Banks from the Nigerian Stock
Exchange (NSE) daily prices for the period 3rd
January 2006 to 31st December 2008. The estimations computed are:
Standard Deviation, Historical Close-to-Close, Parkinson, Garman-Klass, Rogers-Satchell, Modified Garman-Klass and
Yang Zhang volatility estimators. The volatility computations for the estimators employed the open, high, low and
close values of daily prices using 5, 10 and 20 days intervals with no overlapping. The Models are automated using
Microsoft Visual Basic Express Edition with the volatilities output generated by the estimators further analysed using
SPSS and Microsoft Excel software packages. The criteria used to evaluate the performances of these volatility
estimators are the Mean Absolute Deviation (MAD), Standard Error (STDERR) and Efficiency. The Efficiency test
compares the relative uncertainty of the various estimators using standard deviation as the benchmark while the MAD
and STDERR are used to find the mean absolute deviation and the standard error of the estimators respectively. In
terms of MAD and STDERR, the Parkinson model performs better than other estimators while the Garman-Klass
performs better than other estimators in Efficiency. The only common finding is that the Standard Deviation estimator
is the least performing of the estimators. Finally, the levels of correlation between volatility estimators are found to be
very high.
Keywords: Historical volatility, Stock price, Estimators , Efficiency
1. INTRODUCTION
Many research works are being carried out to make inquiry on volatility in the stock market worldwide. Volatility is
the measure of risk in a market that when used properly can increase trading profits and reduce risks to investments.
Volatility is traditionally associated with chaos and instability. Naturally, there are very few things that are consistent
enough not to exhibit volatility [15].
Historical volatility can be thought of as the speed (rate of change) of the underlying stock price. A stock or futures
contract moves at a speed that is measured as a rate too, but a rate of change per year. The higher the historical volatility,
the more movement the stock has experienced and, therefore, theoretically, the more it can move in the future, although
this does not provide insight into either direction or trend [17].
Daye et. al. [13] stated that volatility is the most basic statistical risk measure. It can be used to measure the
market risk of a single instrument or an entire portfolio of instruments. It can be expressed in different ways; the
typical definition used in finance is the standard deviation of a financial random variable [14,19-20].

14 B. Oyelami & E. Sambo: Comparative Analysis of Some Volatility Estimators …
http://journals.uob.edu.bh
Brandt and Kingsley [12] stated that Volatility estimation is of central importance to risk management, pricing and
Portfolio construction. A number of attempts have been made in the last three decades to improve upon the classical
standard deviation of daily returns as an estimator of asset volatility. Many of these estimators, are those developed by
Parkinson [21], Garman and Klass [16], Rogers and Satchell [22-23] and make use of information on daily trading.
Volatility generally stems from the arrival of new information. For example when investors received news
concerning corporate profits, interest rates, dividends or the economy, they use that information to make buying and
selling decisions[20].
Historical volatility is computed using past stock prices. It can be calculated using the standard deviation of stock’s
price changes from close to close of trading going back a specified number of days. Although 5, 10, 20, and 90 days are
often used. Classically, historical volatility is computed as the standard deviation of daily returns within a certain
period. It is unrealistic to assume that the volatility of asset returns remains constant during a long period; therefore the
volatility estimated with the classical estimator is essentially the average volatility over the specified period.
The volatility of various asset returns lies in the center of option pricing, portfolio allocation, and risk management
problems. Any financial economist or expert has to pay a huge amount of attention to the study on the measurement and
forecasting methods of volatility, because the volatility measures the risk of an investment in a stock. It is an important
piece of information in constructing an optimal portfolio. Historical volatility is also used by option traders as a proxy for
future volatility in evaluating options. Its value is directly related to the benchmark value of the option. There is
no doubt that volatility is a central concept in the theory and application of quantitative finance. Therefore,
correct modeling of volatility is always desirable to both practitioners and researchers [19-20].
Historical volatility is the most frequently used one, can be estimated as the simple standard deviation of returns
based on closing prices for a certain period. The idea of using information on the daily high and low prices, as well as
the opening and closing prices, goes back a long way, to Parkinson [21] and Garman and Klass [16] at least, with
further contributions by Beckers [11], Ball and Torous [10], Rogers and Satchell [13] and Yang and Zhang [29] among
others. These volatility estimators are classified as range estimators because they use information on daily trading
range.
Shu and Zhang [25] found that the range estimators all perform very well when an asset price follows a continuous
geometric Brownian motion. However, significant differences among various range estimators are detected if the assets
return distribution involves an opening jump or a large drift.
Recently, Alizadeh, et.al. [6] extended the range-based estimators to estimate stochastic volatility models.
Theoretically, range estimators are more efficient than the classical close-to-close estimator. It has been proven that the
Parkinson estimator is five times more efficient than the classical estimator and the Yang and Zhang estimator is 7.3
times more efficient than the classical volatility estimator. However, range estimators are built on the strict assumption
that an asset price follows a geometric Brownian motion, which is certainly not the case in real markets. People often
use the range estimators to study the volatility patterns of market data without taking into account the assumptions
made on developing the range estimators. It is obvious that deviation from a geometric Brownian motion will affect
the accuracy and efficiency of range estimators, but it is important to know the extent to which they remain useful in the
analysis of real market behaviour.
Another merit of range volatility estimators could be the greater informational contents because they are calculated
with opening prices, the highest prices, the lowest prices as well as closing prices. In spite of these appeals, the strict
assumptions of log-normal asset returns distribution and continuous trading have been a big obstacle for attracting
enough attention. For instance, Marsh and Rosenfeld [18] and Wiggins [27-28] show that the analyses using range
volatility estimators succeed in enhancing efficiency but fail to reduce biasness. The main cause of this finding
is the low liquidity of the assets under their studies which lead to the violation of continuous trading
assumption.
Furthermore, recent development of Information Technology (IT) and advance of financial Statistics have made
researchers jump over these obstacles with the availability of high frequency data. Quite useful results have been
reported that the assumption of log-normal asset returns distribution is not necessary [See 1-4, 8]. For instance, Bali
and Weinbaum [9] and Shu and Zhang [25] found that the range volatility estimators were not significantly biased and
were also robust to microstructure errors like bid-ask spread. The relative efficiency and simplicity of range volatility
estimators make a strong case for evaluating their performance further [26].

Int. J. Comp. Theo. Stat. 4, No. 1, 13-35 (May-2017) 15
http://journals.uob.edu.bh
The motivation for study in this paper is to compare the performance characteristics of seven volatility estimators
using the data from eleven Banks from the Nigerian Stock Exchange (NSE) using automated Microsoft Visual Basic
programs (see Appendix) used for calculating volatility on daily basis for the Nigerian Stock Exchange market prices.
This will guide stakeholders, investors, stockbrokers, Government etc. to have the opportunity of having enough and
available information about the market for decision making. The volatility we will consider in this paper is with respect
to the share price and the programs tested using the historical data for thirteen banks listed in the Nigerian stock market.
Volatility is often used as a measure of market quality in microstructure research, and there are a number of ways in
which it can be measured. Hence, it is important to determine how best to measure volatility [24]. Since an in-depth
knowledge of the stock market volatility is of paramount importance to the stock market players. This study has tried to
make an analysis of the concept for easy understanding by the players. The paper is significant because it has used the
basic historical volatility estimators to cause an understanding of the various aspects of the concept. Computer
programs are used to automate the models. It is important that an investor be very knowledgeable of this concept to
enable him take a buy or a sell decision. The study in this paper is expected to provide such medium.
2. STATEMENT OF THE PROBLEM
The primary aim of this paper is to compare the performance of seven volatility estimators which employs opening,
closing, high and low values of daily prices on the Nigerian Stock Exchange banking sector for the period 3rd
January
2006 to 31st December 2008.The period of study the Nigeria banking sector was faced with liquidity problem and banks
sampled for analysis was based on availability of data at that given period. It is hoped that after the analysis, useful
suggestions can be given as to which type of volatility estimator is most suited for the Nigerian Stock Exchange Banking
sector.
The knowledge of the capital market by the operators is limited to a very few professionals, particularly that of
volatility and volatility estimators. The teeming investors rely so much on their stockbrokers for the market analysis of
their stocks. Therefore, the understanding of the volatility of the prices of stocks becomes pertinent. Hence this paper
seeks to demonstrate the importance of understanding of the volatility of stocks prices using various estimators, since
investment decisions cannot be made in a vacuum.
NOTATIONS
Throughout this paper we will make use of the following notations:
Volatility
Z Number of closing prices in a year
n Number of historical prices used for the volatility estimate
The opening price
The high price
The low price
The close price
n Number of historical days used in the volatility estimate
Log return on the ith day
We shall also use the following notations too:
= Standard Deviation
ri= closing prices of an asset
r = mean of all closing prices in the period t=1 to n
3. METHODOLOGY
Volatility can be estimated using various estimators ranging from ordinary standard deviation to more sophisticated
estimators. In this study we shall be looking at the following well known volatility estimators to analyse the performance
and efficiency of the estimators using the historical data of eleven Banks listed in the Nigerian Stock Exchange Market.
A. The standard deviation
The easiest method to evaluate volatility is simply using the classical definition of standard deviation.
16 B. Oyelami & E. Sambo: Comparative Analysis of Some Volatility Estimators …
http://journals.uob.edu.bh
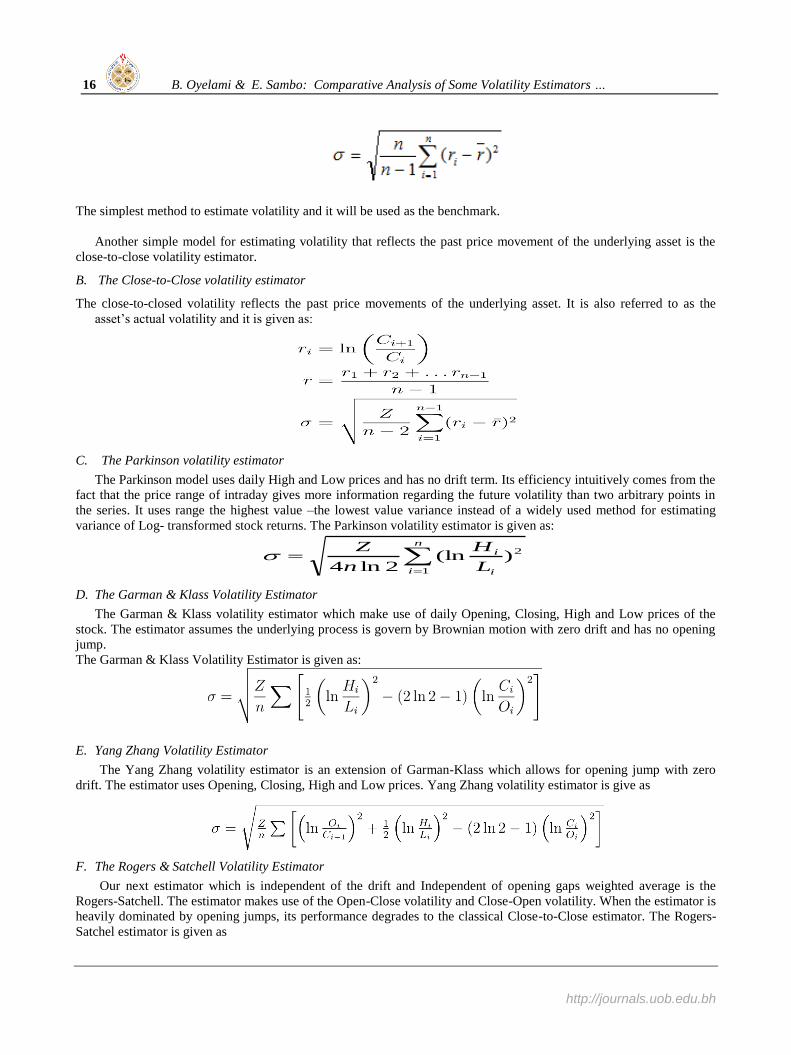
The simplest method to estimate volatility and it will be used as the benchmark.
Another simple model for estimating volatility that reflects the past price movement of the underlying asset is the
close-to-close volatility estimator.
B. The Close-to-Close volatility estimator
The close-to-closed volatility reflects the past price movements of the underlying asset. It is also referred to as the
asset’s actual volatility and it is given as:
C. The Parkinson volatility estimator
The Parkinson model uses daily High and Low prices and has no drift term. Its efficiency intuitively comes from the
fact that the price range of intraday gives more information regarding the future volatility than two arbitrary points in
the series. It uses range the highest value –the lowest value variance instead of a widely used method for estimating
variance of Log- transformed stock returns. The Parkinson volatility estimator is given as:
n
i i
i
L
H
n
Z
1
2)(ln2ln4
D. The Garman & Klass Volatility Estimator
The Garman & Klass volatility estimator which make use of daily Opening, Closing, High and Low prices of the
stock. The estimator assumes the underlying process is govern by Brownian motion with zero drift and has no opening
jump.
The Garman & Klass Volatility Estimator is given as:
E. Yang Zhang Volatility Estimator
The Yang Zhang volatility estimator is an extension of Garman-Klass which allows for opening jump with zero
drift. The estimator uses Opening, Closing, High and Low prices. Yang Zhang volatility estimator is give as
F. The Rogers & Satchell Volatility Estimator
Our next estimator which is independent of the drift and Independent of opening gaps weighted average is the
Rogers-Satchell. The estimator makes use of the Open-Close volatility and Close-Open volatility. When the estimator is
heavily dominated by opening jumps, its performance degrades to the classical Close-to-Close estimator. The Rogers-
Satchel estimator is given as

Int. J. Comp. Theo. Stat. 4, No. 1, 13-35 (May-2017) 17
http://journals.uob.edu.bh
G. Yang Zhang Volatility Estimator
Yang Zhang volatility estimator has the following properties:
1. Independent of the drift;
2. Independent of opening gaps weighted average of Rogers-Satchell, Open-Close and Close-Open volatility;
3. When heavily dominated by opening jumps, the performance degrades to classical Close-to-Close
volatility estimator.
The Yang Zhang volatility estimator is given as
H. Data
The baseline data used to evaluate the volatility estimators comprises of the NSE daily returns for eleven Banks for
the period 3rd
January 2006 to 31st December 2008. The data was downloaded from the www.cashcraft.com website. The
Banks were: Access, Afribank, FCMB, Fidelity, Firstbank, Guaranty, IBTC, Intercontinental, UBA, Wema and Zenith
Banks.
The models are automated using Microsoft Visual Basic 2008 Express edition and the volatilities output generated
using the data by the estimators models are further analysed using the SPSS and the Microsoft Excel software packages.
The program can accept any number of sample size n-day, 3n with no overlapping.
Here the focus of interest is on the relative performance of the aforementioned estimators on the dataset. The
estimators are calculated using samples of 5, 10 and 20 days interval on the dataset and with no overlapping.
I. Empirical Test
The empirical test of the performance of the estimators on the baseline data is carried out on year by year basis and
for (i) 5-day daily returns interval, (ii) 10-day daily returns interval and (iii) 20-day daily returns interval.
The measures used to access the performance of the estimators on the baseline data are as follows:
1) MAD (Mean Absolute Deviation)
MAD = |1
1
| i
N
iN
Where
i = estimated volatility for the ith Bank
= mean value for i , i=1 to N
N = total no of Banks used for the analysis

18 B. Oyelami & E. Sambo: Comparative Analysis of Some Volatility Estimators …
http://journals.uob.edu.bh
2) Standard Errors Mean
SEM= _
[ ] = N
Std i )(
Where
( )iStd = Standard deviation of i , for i=1 to N
N = total number of Banks collated in the data
3) Efficiency
Efficiency
( )
( )
S
K
Var
Var
where
S =volatility obtained by using the classical definition of standard deviation
K = the respective volatility obtained for the estimator K under consideration, e.g. K = Parkinson estimator. The
mean volatilities for each of the estimators are compared using the classical standard deviation as a benchmark.
4. RESULTS AND DISCUSSION
A. Performance Statistics on 5-day Interval Volatility Estimation
The summary of the performance statistic for the volatility estimators used in the 5-day interval with no overlapping
is as tabulated in Table 1.
Generally, the volatilities recorded by the estimators in 2008 are higher than the percentages in 2006 and 2007
respectively. This may be attributed to the bear run (downward stocks prices market trends) recorded in the 3rd
and 4th
quarter of 2008. On the other hand, the volatilities obtained for 2006 are higher than 2007 with the exception of Standard
deviation. This may be as result of the Banks consolidation exercise that was concluded in December 2005. Immediately
after the exercise, there was a bull run (upward stocks prices market trends).
The MAD values for 2006 are the highest, followed by 2007 values with the exception of CC. This may also be due
to the Bull Run. Similarly, the STDERR percentages for 2006 are higher followed by 2007 and 2008.
Generally, the efficiency values for 2007 are the highest when compared to 2006 and 2008. This is followed by 2008
with the exception of the CC values. This could be attributed to stability assumed after the consolidation exercise. The
2008 efficiency is low may be because of the financial meltdown.
Table 1: 5-day Interval Performance Statistic Summary
VOLATILITY ESTIMATORS
Year STDEV CC PARK GK GKYZ RS YZ Ranking in Ascending order
2006 48.16% 40.45% 29.63% 28.02% 48.61% 34.51% 63.29% GK, PARK, RS, CC, STDEV,GKYZ, YZ
2007 60.08% 33.78% 27.49% 25.57% 42.36% 29.68% 52.27% GK, PARK, RS, CC, GKYZ, YZ, STDEV
2008 76.91% 72.68% 34.00% 29.62% 69.55% 38.21% 95.61% GK, PARK, RS, GKYZ,CC, STDEV, YZ
MAD
Year STDEV CC PARK GK GKYZ RS YZ Ranking in Ascending order
2006 3.99 2.01 1.12 1.25 1.70 1.55 2.35 PARK, GK, RS, GKYZ, CC, YZ, STDEV
2007 3.74 0.99 0.91 0.87 1.21 1.04 1.42 GK, PARK, CC, RS, GKYZ, YZ, STDEV
2008 2.79 1.26 0.55 0.64 0.94 0.77 1.17 PARK, GK, RS, GKYZ, YZ, CC, STDEV
STDERR

Int. J. Comp. Theo. Stat. 4, No. 1, 13-35 (May-2017) 19
http://journals.uob.edu.bh
Year STDEV CC PARK GK GKYZ RS YZ Ranking in Ascending order
2006 13.4% 6.40% 3.77% 4.32% 5.39% 5.42% 7.19% PARK, GK, GKYZ, RS, CC, YZ, STDEV
2007 10.23% 3.38% 3.14% 3.00% 4.14% 3.54% 5.08% GK, PARK, CC, RS, GKYZ, YZ, STDEV
2008 8.82% 3.64% 1.42% 1.72% 2.81% 2.16% 3.54% PARK, GK, RS, GKYZ, YZ, CC, STDEV
Efficiency
Year STDEV CC PARK GK GKYZ RS YZ Ranking in Descending order
2006 1.19 1.63 1.72 0.99 1.40 0.76 GK, PARK, RS, CC, GKYZ, YZ
2007 1.78 2.19 2.35 1.42 2.02 1.15 GK, PARK, RS, CC, GKYZ, YZ
2008 1.06 2.26 2.60 1.11 2.01 0.80 GK, PARK, RS, GKYZ, CC, YZ
B. Performance Statistic on 10-day Interval Volatility Estimation
The summary of the performance statistic for the volatility estimators in the 10-day intervals with no overlapping is
tabulated in Table 2.
Generally the volatilities estimated for 2008 are the highest, followed by that of 2006 with 2007 having the lowest.
This may be attributed to the bear run (downward stocks prices market trends) recorded in the 3rd
and 4th
Quarter of 2008.
Again, the volatilities obtained for 2006 are higher than 2007. This may be as result of the consolidation exercise in 2005
where there was a bull run (upward stocks prices market trends) after the exercise.
The MAD values for 2006 are generally higher than that of 2007 and 2008 with the exception of the standard
deviation where values for 2007 are higher. The standard errors percentages for 2006 are also higher than the respective
percentages in 2007 and 2008 with the exception of standard deviation. Efficiency values are higher in 2007 as
compared to the respective values in 2006 and 2008. However, those of 2008 are also higher than the respective values in
2006.
Table 2: 10-day Interval Performance Statistic summary
VOLATILITY
Year STDEV CC PARK GK GKYZ RS YZ Ranking in Ascending order
2006 46.75% 41.81% 30.37% 28.57% 51.65% 36.30% 64.60% GK, PARK, RS, CC, STDEV, GKYZ, YZ
2007 145.37% 35.78% 29.80% 26.64% 45.69% 32.53% 52.43% GK, PARK, RS, CC, GKYZ, YZ, STDEV
2008 122.09% 71.10% 34.39% 29.21% 70.70% 38.89% 90.48% GK, PARK, RS, GKYZ, CC, YZ, STDEV
MAD
Year STDEV CC PARK GK GKYZ RS YZ Ranking in Ascending order
2006 4.43 2.22 1.21 1.41 2.01 1.76 2.70 PARK, GK, RS, GKYZ, CC, YZ, STDEV
2007 6.31 0.64 0.62 0.61 0.81 0.71 0.86 GK, PARK, CC, RS, GKYZ, YZ, STDEV
2008 4.93 1.32 0.55 0.70 0.97 0.77 1.20 PARK, GK, RS, GKYZ, YZ, CC, STDEV
STDERR
Year STDEV CC PARK GK GKYZ RS YZ Ranking in Ascending order
2006 15.06% 7.28% 4.22% 4.83% 6.43% 6.22% 8.60% PARK, GK, RS, GKYZ, CC, YZ, STDEV
2007 20.10% 2.32% 2.38% 2.49% 3.08% 2.87% 3.21% CC, PARK, GK, RS, GKYZ, YZ, STDEV
2008 15.18% 3.74% 1.43% 1.92% 2.86% 2.18% 3.55% PARK, GK, RS, GKYZ, YZ, CC, STDEV
EFFICIENCY
Year STDEV CC PARK GK GKYZ RS YZ Ranking in Descending order
2006 1.12 1.54 1.64 0.91 1.29 0.72 GK, PARK, RS, CC, GKYZ, YZ
2007 4.06 4.88 5.46 3.18 4.47 2.77 GK, PARK, RS, CC, GKYZ, YZ
2008 1.72 3.55 4.18 1.73 3.14 1.35 GK, PARK, RS, GKYZ, CC, YZ

20 B. Oyelami & E. Sambo: Comparative Analysis of Some Volatility Estimators …
http://journals.uob.edu.bh
C. Performance Statistics on 20-day Interval Volatility Estimation
The summary of the performance statistics for the volatility estimators in the 10-day intervals with no overlapping is
tabulated in Table 3. It follows also, that volatilities obtained in 2008 are generally higher than the respective percentages
in year 2006 and 2007 with the exception of standard deviation values which are highest in 2007. Note also that the
values for 2006 are higher than those obtained in 2007.
The MAD values obtained for 2006 are higher than the values obtained in 2007 and 2008. Those for 2008 are higher
than the respective values in 2007. The only exception is the standard deviation.
The standard errors are also peaked in 2006 as compared to 2007 and 2008. There are some variants with respect to
the values obtained in 2007 and 2008. The efficiency coefficients in 2007 are generally higher than the values obtained in
2006 and 2008. However, some variations are noticeable in 2006 and 2008.
Table 3. 20-day Interval Performance Statistic Summary
Volatility
Year STDEV CC PARK GK GKYZ RS YZ Ranking in Ascending order
2006 112.57% 43.26% 30.29% 27.65% 53.19% 36.89% 64.88% GK, PARK, RS, CC, GKYZ, YZ, STDEV
2007 212.99% 35.73% 29.39% 24.93% 45.66% 32.47% 49.86% GK, PARK, RS, CC, GKYZ, YZ, STDEV
2008 154.58% 69.10% 33.94% 27.57% 72.77% 38.69% 88.26% GK, PARK, RS, CC, GKYZ, YZ, STDEV
MAD
Year STDEV CC PARK GK GKYZ RS YZ Ranking in Ascending order
2006 9.47 3.00 1.56 1.75 2.85 2.31 3.87 PARK, GK, RS, GKYZ, CC, YZ, STDEV
2007 13.74 1.31 1.20 1.12 1.73 1.35 1.82 GK, PARK, CC, RS, GKYZ, YZ, STDEV
2008 7.57 1.86 0.87 1.00 1.90 1.14 2.37 PARK, GK, RS, CC, GKYZ, YZ, STDEV
STDERR
Year STDEV CC PARK GK GKYZ RS YZ Ranking in Ascending order
2006 28.06% 8.46% 4.61% 5.05% 7.34% 7.01% 9.90% PARK, GK, RS, GKYZ, CC, YZ, STDEV
2007 31.34% 2.08% 2.39% 2.65% 3.06% 3.00% 3.13% CC, PARK, GK, RS, GKYZ, YZ, STDEV
2008 18.08% 3.38% 1.37% 1.96% 3.34% 2.15% 4.22% PARK, GK, RS, GKYZ, CC, YZ, STDEV
Efficiency
Year STDEV CC PARK GK GKYZ RS YZ Ranking in Descending order
2006 2.60 3.72 4.07 2.12 3.05 1.74 GK, PARK, RS, CC, GKYZ, YZ
2007 5.96 7.25 8.54 4.66 6.56 4.27 GK, PARK, RS, CC, GKYZ, YZ
2008 2.24 4.55 5.61 2.12 4.00 1.75 GK, PARK, RS, CC, GKYZ, YZ
Int. J. Comp. Theo. Stat. 4, No. 1, 13-35 (May-2017) 21
http://journals.uob.edu.bh
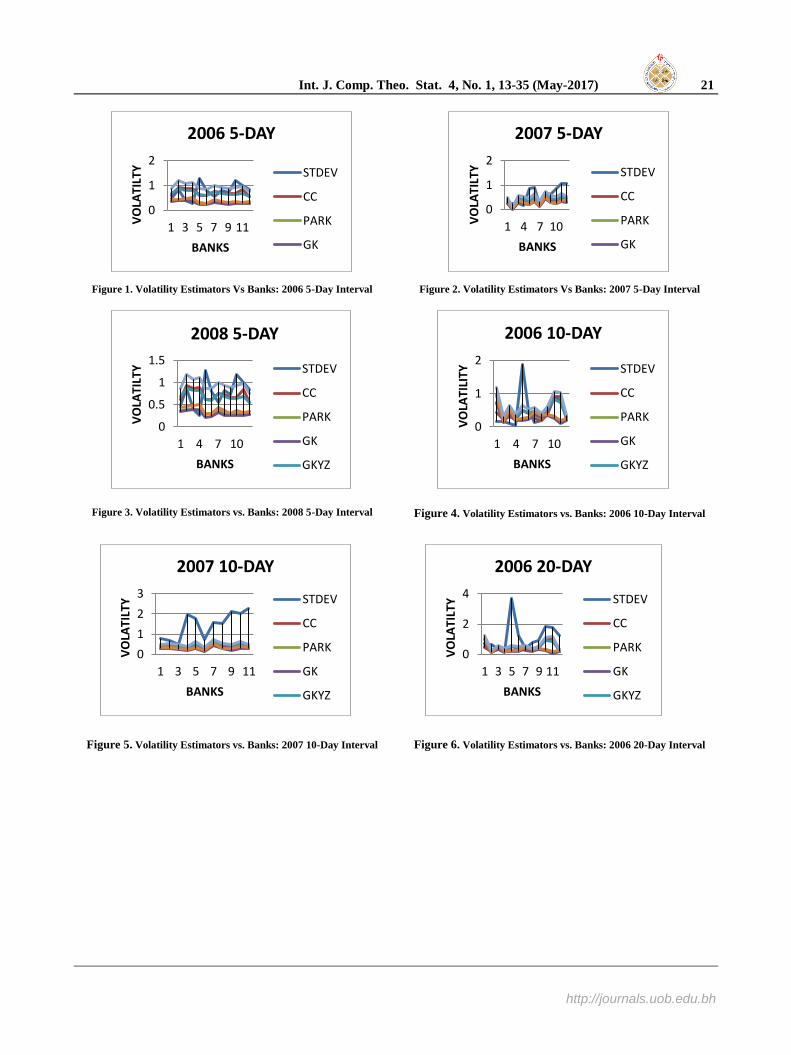
Figure 1. Volatility Estimators Vs Banks: 2006 5-Day Interval Figure 2. Volatility Estimators Vs Banks: 2007 5-Day Interval
Figure 3. Volatility Estimators vs. Banks: 2008 5-Day Interval Figure 4. Volatility Estimators vs. Banks: 2006 10-Day Interval
Figure 5. Volatility Estimators vs. Banks: 2007 10-Day Interval Figure 6. Volatility Estimators vs. Banks: 2006 20-Day Interval
0
1
2
1 3 5 7 9 11
VO
LATI
LTY
BANKS
2006 5-DAY
STDEV
CC
PARK
GK
0
1
2
1 4 7 10VO
LATI
LTY
BANKS
2007 5-DAY
STDEV
CC
PARK
GK
0
0.5
1
1.5
1 4 7 10
VO
LATI
LTY
BANKS
2008 5-DAY
STDEV
CC
PARK
GK
GKYZ
0
1
2
1 4 7 10
VO
LATI
LITY
BANKS
2006 10-DAY
STDEV
CC
PARK
GK
GKYZ
0
1
2
3
1 3 5 7 9 11
VO
LATI
LTY
BANKS
2007 10-DAY
STDEV
CC
PARK
GK
GKYZ
0
2
4
1 3 5 7 9 11
VO
LATI
LTY
BANKS
2006 20-DAY
STDEV
CC
PARK
GK
GKYZ

22 B. Oyelami & E. Sambo: Comparative Analysis of Some Volatility Estimators …
http://journals.uob.edu.bh
Figure 7. Volatility Estimators Vs. Banks: 2007 20-Day Interval
Figure 8. Volatility Estimators Vs Banks: 2008 20-Day Interval
Figure 9. The deployment of Microsoft Visual Basic Platform for computation for the volatility estimator
0
2
4
1 4 7 10
VO
LATI
LTY
BANKS
2007 20-DAY
STDEV
CC
PARK
GK
GKYZ
0
1
2
3
1 3 5 7 9 11
VO
LATI
LTY
BANKS
2008 20-DAY
STDEV
CC
PARK
GK
GKYZ
Int. J. Comp. Theo. Stat. 4, No. 1, 13-35 (May-2017) 23
http://journals.uob.edu.bh
D. Correlation
The idea of using measuring the correlation between estimators is to determine the inter-relationships between the
various estimators. High correlations between the estimators when applied to market data, which suggests that there are
fundamental behaviors of the market process which are not captured by the simulated process.
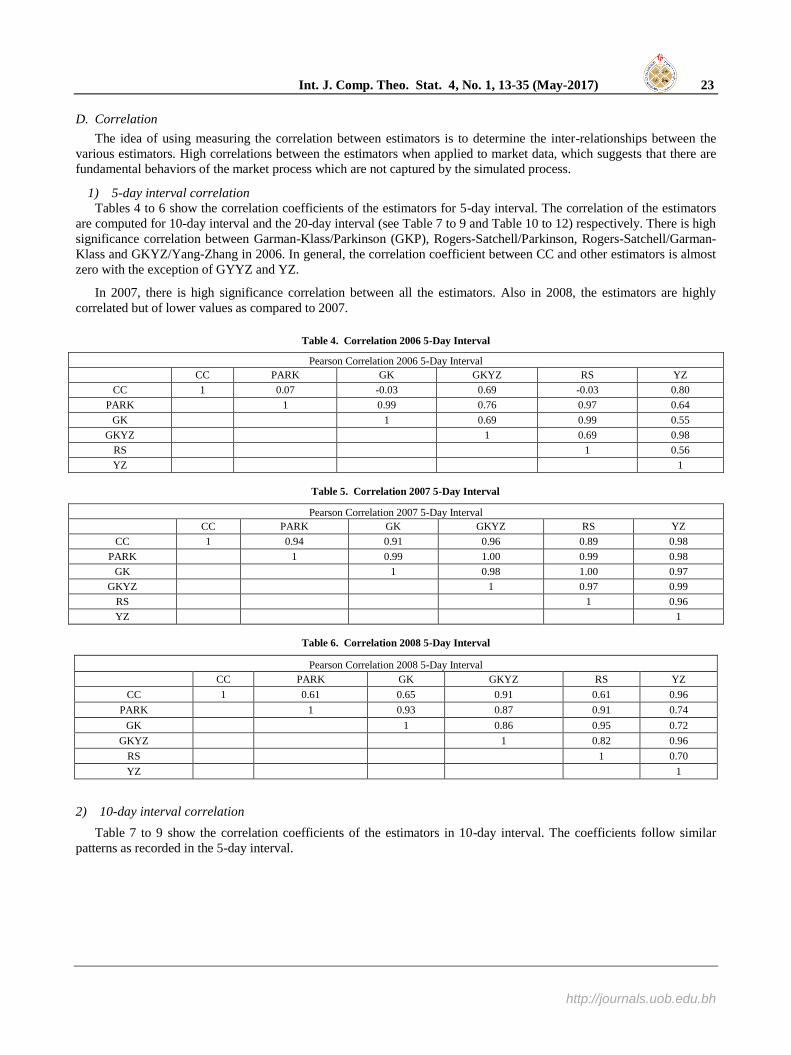
1) 5-day interval correlation
Tables 4 to 6 show the correlation coefficients of the estimators for 5-day interval. The correlation of the estimators
are computed for 10-day interval and the 20-day interval (see Table 7 to 9 and Table 10 to 12) respectively. There is high
significance correlation between Garman-Klass/Parkinson (GKP), Rogers-Satchell/Parkinson, Rogers-Satchell/Garman-
Klass and GKYZ/Yang-Zhang in 2006. In general, the correlation coefficient between CC and other estimators is almost
zero with the exception of GYYZ and YZ.
In 2007, there is high significance correlation between all the estimators. Also in 2008, the estimators are highly
correlated but of lower values as compared to 2007.
Table 4. Correlation 2006 5-Day Interval
Pearson Correlation 2006 5-Day Interval
CC PARK GK GKYZ RS YZ
CC 1 0.07 -0.03 0.69 -0.03 0.80
PARK 1 0.99 0.76 0.97 0.64
GK 1 0.69 0.99 0.55
GKYZ 1 0.69 0.98
RS 1 0.56
YZ 1
Table 5. Correlation 2007 5-Day Interval
Pearson Correlation 2007 5-Day Interval
CC PARK GK GKYZ RS YZ
CC 1 0.94 0.91 0.96 0.89 0.98
PARK
1 0.99 1.00 0.99 0.98
GK
1 0.98 1.00 0.97
GKYZ
1 0.97 0.99
RS
1 0.96
YZ
1
Table 6. Correlation 2008 5-Day Interval
Pearson Correlation 2008 5-Day Interval
CC PARK GK GKYZ RS YZ
CC 1 0.61 0.65 0.91 0.61 0.96
PARK
1 0.93 0.87 0.91 0.74
GK
1 0.86 0.95 0.72
GKYZ
1 0.82 0.96
RS
1 0.70
YZ
1
2) 10-day interval correlation
Table 7 to 9 show the correlation coefficients of the estimators in 10-day interval. The coefficients follow similar
patterns as recorded in the 5-day interval.

24 B. Oyelami & E. Sambo: Comparative Analysis of Some Volatility Estimators …
http://journals.uob.edu.bh
Table 7. Correlation 2006 10-Day Interval
Pearson Correlation 2006 10-Day Interval CC PARK GK GKYZ RS YZ
CC 1 0.03 -0.10 0.74 -0.05 0.80
PARK 1 0.98 0.69 0.98 0.59
GK 1 0.59 0.99 0.49
GKYZ 1 0.63 0.99
RS 1 0.55
YZ 1
Table 8. Correlation 2007 10-Day Interval
Pearson Correlation 2007 10-Day Interval
CC PARK GK GKYZ RS YZ
CC 1 0.86 0.76 0.92 0.76 0.93
PARK 1 0.98 0.98 0.97 0.98
GK 1 0.94 0.99 0.92
GKYZ 1 0.94 0.99
RS 1 0.93
YZ 1
Table 9. Correlation 2008 10-Day Interval
Pearson Correlation 2008 10-Day Interval
CC PARK GK GKYZ RS YZ
CC 1 0.67 0.64 0.93 0.63 0.92
PARK 1 0.91 0.87 0.90 0.81
GK 1 0.82 0.95 0.76
GKYZ 1 0.80 0.98
RS 1 0.78
YZ 1
3) 20-day interval correlation
Tables 10 to12 shows the correlation coefficients of the estimators in 20-day interval.
The coefficients follow similar patterns as recorded in the 5-day interval and 10-day interval.
Table 10. Correlation 2006 20-Day Interval
Pearson Correlation 2006 20-Day Interval
CC PARK GK GKYZ RS YZ
CC 1 0.02 -0.16 0.79 -0.04 0.83
PARK
1 0.98 0.62 0.98 0.53
GK
1 0.46 0.98 0.38
GKYZ
1 0.57 0.99
RS
1 0.51
YZ
1
Table 11. Correlation 2007 20-Day Interval
Pearson Correlation 2007 20-Day Interval
CC PARK GK GKYZ RS YZ
CC 1 0.78 0.63 0.88 0.66 0.84
PARK 1 0.97 0.98 0.98 0.98
GK 1 0.91 0.99 0.93
GKYZ 1 0.93 0.99
RS 1 0.95
YZ 1

Int. J. Comp. Theo. Stat. 4, No. 1, 13-35 (May-2017) 25
http://journals.uob.edu.bh
Table 12 Correlation 2008 20-Day Interval
Pearson Correlation 2008 20-Day Interval
CC PARK GK GKYZ RS YZ
CC 1 0.65 0.55 0.96 0.56 0.96
PARK 1 0.91 0.81 0.89 0.73
GK 1 0.75 0.92 0.70
GKYZ 1 0.74 0.98
RS 1 0.73
YZ 1
Generally, in terms of MAD and STDERR, the Parkinson is found to outperform other estimators with respect to
the minimum average values recorded for the dataset. For Efficiency, the Garman-Klass outperforms other estimators in
which the maximum average Efficiency coefficients are recorded for the dataset. The only common finding is that the
Standard Deviation is the least performed estimator used.
Furthermore, the levels of correlation between volatility estimators are very high with the exception of some few
cases with respect to the Close-to-Close estimator. It was also noted that the particular period analysed – 3/01/2006 to
31/12/2008 – were marked by strong market swings due to the banking sector consolidation exercise in Nigeria which
was concluded in December 2005 and the world-wide economic meltdown which commenced in 2008. Due to the
fragility of the market at the period, the volatility estimates evaluated tend to exhibit high values especially in 2006 and
2008. This is attributed to the bull run (upward stocks prices market trends) in 2006 especially in banking stocks where
banks stocks prices keep increasing and the bear run (downward stocks prices market trends) which started in 2008 due
to the world-wide economic meltdown.
5. CONCLUSION
In this study we compared the performance characteristics of a number of volatility estimators in an empirical test
on historical data from eleven Banks listed Nigerian Stock Exchange .The price movement for Banks were analysed
from January 3, 2006 to December 31, 2008. The estimators used were: Standard Deviation, Close-to-Close, Parkinson,
and Garman-Klass, Garman-Klass modified by Yang-Zhang, Rogers-Satchell and Yang-Zang volatility estimators. The
estimators used to evaluate the performances of the volatility estimators are the Mean Absolute Deviation (MAD),
Standard Error (STDERR) and Efficiency using Standard Deviation as the benchmark.
Conclusively, previous findings suggest that the standard deviation is not necessarily the best measure of stock price
volatility with daily stock price changes because of the statistical properties of stock market returns and this study has
equally confirmed that. From our study, it is found that the standard errors generated from the estimators are generally
high. Even the more recently developed models like the Yang-Zhang and Rogers-Satchells which have been tested and
proven to be more efficient on other indices world-wide were not in conformity with the data used. This in our own
opinion may require further modeling and or development of newer models that will generate minimum STDERR and
MAD values and higher efficiency particularly for Nigerian Stock Exchange Index.
Authors’ Contributions
The first author proposed the topic and the volatility estimators used and behavioral analysis using the historical
volatility data and the literature review. The second author implemented the Visual basic programs used together with
experimental data used. The two authors jointly did the analysis of the data and interpretation of results obtained and
made inputs into the writing of this paper.
The authors declare that no conflict of interests.
ACKNOWLEDGMENT
The authors hereby acknowledge the suggestions of the reviewers which improves the quality of the paper.
26 B. Oyelami & E. Sambo: Comparative Analysis of Some Volatility Estimators …
http://journals.uob.edu.bh
REFERENCES
[1] Anderson, T. G. and T. Bollerslev, (1998). Answering the Skeptics: Yes, Standard Volatility Models do provide Accurate
Forecasts, International Economic Review, 39, 885-905.
[2] Anderson, T. G., T. Bollerslev, F. X. Diebold, and P. Labys, (2001). The Distribution of Exchange Rate Volatility, Journal of the
American Statistical Association, 96, 42-55.
[3] Anderson, T. G., T. Bollerslev, F. X. Diebold, and P. Labys, (2002). Parametric and Nonparametric Volatility Measurement,
NBER working paper, 279.
[4] Andreou, E. and E. Ghysels, (2002). Rolling-Sample Volatility Estimators Some New Theoretical Simulation and Empirical
Results, Journal of Business and Economic Statistics, 20, 363-376.
[5] Alison E., (2002).A Course in Financial Calculus, Cambridge University Press,
New York.
[6] Alizadeh, S., Brandt, W. M., and Diebold, X.F., (2002). Range-based Estimation of Stochastic Volatility Models. Journal of
Finance 57: 1047-1091.
[7] Alizadeh, S., M. W. Brandt, and F. X. Diebold, (1999). Range-Based Estimator of Stochastic Volatility Models, working paper,
University of Pennsylvania.
[8] Barndorff-Nielsen O. E and Shepherd N. (2002).Econometric analysis of realized volatility and its use in estimating stochastic
volatility models. Journal of the Royal Statistical Society series B, 64,253-280.
[9] Bali, T. G. and D. Weinbaum (2005). A Comparative Study of Alternative Extreme-Value Volatility Estimators, Journal of
Futures Markets, 25, 873-892.
[10] Ball, C.A., and Torous, W., (1984). The Maximum Likelihood Estimation of Security Price Volatility: Theory, Evidence, and
Application to Option Pricing, Journal of Business, 57, 97-112.
[11] Beckers, S. (1983). Variance of security price returns based on high, low and closing prices. Journal of Business, 56:97–112.
[12] Brandt, M. and Kinsley, J., (2003). Estimating Historical Volatility, Journal of Business.
http://www.jonathankinlay.com/Articles/Estimating%20Historical%20Volatility.pdf
[13] Daye, Z. J., Leow, K. and Ding, S., (2001). Empirical evaluation of Volatility estimation.
[14] Ejiofor Ezinne Joy (2014). Comparative analysis of models for pricing and hedging exotic options using stochastic
volatility.M.sc dissertation submitted university of Abuja, Nigeria.
[15] Fontanills, G. A. and Gentile, T., (2003). The Volatility Course Workbook, John Wiley & Sons Inc., Hoboken, New Jersey.
[16] Garman, M., and Klass, M., (1980). On The Estimation of Security Price Volatilities from Historical Data. Journal of Business
53: 67-78.
[17] JOHN SUMMA OPTION VOLATILITY: HISTORICAL VOLATILITY. INVESTOPEDIA DOWNLOADED ON 21ST NOVEMBER 2016.
HTTP://WWW.INVESTOPEDIA.COM/UNIVERSITY/OPTIONVOLATILITY/VOLATILITY2.ASP
[18] Marsh, T. A. and E. R. Rosenfeld, (2003). Non-trading, market making, and Estimates of Stock Price Volatility, Journal of
Financial Economics, 15, 359-372.
[19] Oyelami Benjamin Oyediran and Ademola Adewumi Adedoyin (2015).Simulation for Pricing Electricity consumption and
hedging of generating and transmission cost. American journal of modelling and optimization, vol.1, no.1: 7-
21.doi:10.12691/ajmo-3-1-2.
[20] Oyelami Benjamin Oyediran and Ademola Adewumi Adedoyin (2014). Models for pricing the demand for electricity in Nigeria.
American Journal of Modelling and optimization, Vol2 (2), 2014.,25-http:/dx.doi.org/10.12691/ajmo-2-1-4
[21] Parkinson, M., (1980). The Extreme Value method for Estimating the Variance of The Rate of Return. Journal of Business 53:
61-68.
[22] Rogers L. C. G., and Satchell, S. E., and Yoon, Y., (1994). Estimating the Volatility of Stock prices: a comparison of methods
that use high and low prices. Applied Financial Economics 4: 241-247.

Int. J. Comp. Theo. Stat. 4, No. 1, 13-35 (May-2017) 27
http://journals.uob.edu.bh
[23] Rogers, L. C. G., and Satchell, S. E., (1991). Estimating Variance from High, Low and Closing Prices. Annals of Applied
Probability 1: 504-512.
[24] Sambo Eric Erenam (2009). A comparative analysis of some volatility estimators: An application to historical data from the
Nigerian Stock Exchange Market. Msc. Dissertation submitted to the University of Abuja, Nigeria.
[25] Shu, J. and J. E. Zhang, (2006). Testing Range Estimators of Historical Volatility, Journal of Future Market. Volume 26, Issue 3,
March 2006 Pages 297–313.
DOI: 10.1002/fut.20197
[26] Vipul and J. Jacob, (2007). Forecasting Performance of Extreme-Value Volatility Estimators, Journal of Futures Markets, 27,
1085-1105.
[27] Wiggins J .B (1991).Empirical tests of the Bias and efficiency of the extreme-value variance estimator for common stocks.
Journal of Business 64,417-432.
[28] Wiggins J .B (1991).Estimating the volatility of S&P 500 Future prices using the extreme-value method .Journal of Futures
markets, Vol.2, pp265-273.
[29] Yang, D., and Zhang Q., (2000). Drift Independent Volatility Estimation Based on High, Low, Open and Close Prices. Journal
of Business 73: 477-491.
[30] Zhang, L., P. A. Mykland and Y. Aït-Sahalia, (2005). A Tale of Two Time Scales: Determining Integrated Volatility with
Noisy High-Frequency Data, Journal of American Statistical Association, 100, 1394-1411.
28 B. Oyelami & E. Sambo: Comparative Analysis of Some Volatility Estimators …
http://journals.uob.edu.bh
APPENDIX
PROGRAMMES: Microsoft Visual Basic Programs
Public Class Form1
'GLOBAL DECLARATIONS
///////////////////////////////////////////////////////////////////////////////////////////////////////////////////////////////////////////////////////////// Dim priceMovementValueS_ As String 'buffer to store the price movement values retrieved from the csv text input
Dim highPriceMovementValueS_ As String ' buffer to contain the high values from the provided CSV input Dim lowPriceMovementValueS_ As String 'buffer to hold the low values from the provided CSV input
Dim startIndeX_ As Integer = 3 'the colunm to start operating from the csv tables
Private Sub Button1_Click(ByVal sender As System.Object, ByVal e As System.EventArgs) Handles ParkinsonButton.Click 'NOTE: For efficiency, the program is divided into three phases. Most of the summations are first performed in the first phase while the final
calculations are carried out in the second phase and the output is done in the last phase. 'DECLARATIONS ////////////////////////////////////////////////////////////////////////////////////////////////////////////////////////////////////////////////////////////////////
Dim currentOpenClosePriceMovementRoW_ As String, currentHighPriceMovementRoW_ As String, currentLowPriceMovementRoW_ As
String, rowCounteR_ As Integer = 0, columnCounteR_ As Integer = 1, samplingDayS_ As Integer = CType(NumberOfDaysTextbox.Text, Integer)
Dim closePlusOnE_ As Double, HighPricE_ As Double = -1, LowPricE_ As Double = -1, ClosingPricE_ As Double, OpeningPricE_ As
Double, priceMovementSampleSeT_() As Double, numberOfYearlyClosingPriceS_ As Integer, numberOfHistoricalPricesUseD_ As Integer ' = 5
'CType(ParkinsonHistoricalPricesTextbox.Text, Integer) Dim linHiDividedByLowSquared_ As Double, parkinsonVolatility_() As Double, logReturN_ As Double, closeToCloseHasBeenCalculateD_
As Boolean = False, stdDevHasBeenCalculateD_ As Boolean = False
Dim yangZangVolatilitY_() As Double, stDevVolatility_() As Double, satchellVolatility_() As Double, historicalVolatilitY_() As Double, garmanVolatilitY_() As Double, garmanYangZhangVolatilitY_() As Double, firstForumulA_ As Double, linHighOverClosingPricE_ As Double,
linHighOverOpeningPricE_ As Double, linCloseOverOpenSquareD_ As Double, linCloseOverOpeningPricE_ As Double,
linOpenOverCloseMinusOneSquareD_ As Double, linOpenOverCloseMinusOnE_ As Double, linOpenOverCloseSquareD_ As Double, linLowOverClosingPricE_ As Double, linLowOverOpeningPricE_ As Double
Dim parkinsonSummatioN_ As Double, stDevSummatioN_ As Double, satchellSummatioN_ As Double, historicalSummatioN_ As Double,
garmanSummatioN_ As Double, garmanYangZhangSummatioN_ As Double ParkinsonSolutionTextBox.Text = "" : SatchellSolutionTextBox.Text = "" : GarmanSolutionTextBox.Text = "" : GarmanYangTextBox.Text = ""
: HistoricalTextBox.Text = "" : YangZangTextBox.Text = "" : StdDevTextBox.Text = ""
Dim muO_ As Double, muO_SummatioN_ As Double, muC_ As Double, muC_SummatioN_ As Double, sigmaC_ As Double, sigmaC_SummatioN_ As Double, sigmaO_ As Double, sigmaO_SummatioN_ As Double, sigmaRS_, K_ As Double ', satchellResulT_ As Double =
0
Dim tempPriceMovementSeT_(samplingDayS_ - 1) As Double, numberOfSetsInPriceMovemetRoW_ As Integer, tempOpeningPricE_ As Double, tempClosingPricE_ As Double, tempCloseMinusOnE_ As Double, tempStdDevMeaN_ As Double
Dim tempHistoricalSummationBuffeR_ As Double, tempClosePlusOnE_ As Double
'INITIALIZATIONS ////////////////////////////////////////////////////////////////////////////////////////////////////////////////////////////////////////////////////////////////// ExtractDataFromCSVToBuffers() 'extract data from the provided csv text into the priceMovementValueS_, highPriceMovementValueS_ and
lowPriceMovementValueS_ buffers
Do 'The basic operation performed in this block is: Fetch a row from the raw data, calculate the results for all formulas and append the output to the result textboxes then repeat the process for the next row until all rows have been calculated.
rowCounteR_ += 1 'this counter tracks the next row to be read from the csv data
currentOpenClosePriceMovementRoW_ = GetRowOfPriceMovementData(rowCounteR_, priceMovementValueS_) 'get one year's data or a row from the open and close part of the csv data
currentHighPriceMovementRoW_ = GetRowOfPriceMovementData(rowCounteR_, highPriceMovementValueS_) 'get one year low data or a
row from the high prices part of the csv data currentLowPriceMovementRoW_ = GetRowOfPriceMovementData(rowCounteR_, lowPriceMovementValueS_) 'get one year lows data or a
row from the low prices part of the csv data
If currentOpenClosePriceMovementRoW_ = "" Then Exit Do ' if there no more rows of data then end the operation numberOfYearlyClosingPriceS_ = CountCharacterSeparatedValues(",", currentOpenClosePriceMovementRoW_) 'count how many prices or
days are in the current row
numberOfSetsInPriceMovemetRoW_ = (numberOfYearlyClosingPriceS_ - startIndeX_) / samplingDayS_ 'divide the total number of prices by the number of days used to group them. i.e. every five days.
numberOfHistoricalPricesUseD_ = samplingDayS_
columnCounteR_ = startIndeX_ ReDim parkinsonVolatility_(0), yangZangVolatilitY_(0), satchellVolatility_(0), historicalVolatilitY_(0), garmanVolatilitY_(0),
garmanYangZhangVolatilitY_(0), stDevVolatility_(0)
'PERFORM SUMMATIONS (FIRST PHASE)
////////////////////////////////////////////////////////////////////////////////////////////////////////////////////////////////////////////////////////////////////////
/////////////////////////////////////////////////////////// For setsCounteR_ As Integer = 1 To numberOfSetsInPriceMovemetRoW_ 'loop z/n number of times
'reset and redimension variables /////////////////////////////////////////////////////////////////////////////////////////////////////////////////////////
ReDim Preserve parkinsonVolatility_(setsCounteR_), yangZangVolatilitY_(setsCounteR_), satchellVolatility_(setsCounteR_), historicalVolatilitY_(setsCounteR_), _
garmanVolatilitY_(setsCounteR_), garmanYangZhangVolatilitY_(setsCounteR_), stDevVolatility_(setsCounteR_) closeToCloseHasBeenCalculateD_ = False : stdDevHasBeenCalculateD_ = False : tempStdDevMeaN_ = 0 :
tempHistoricalSummationBuffeR_ = 0

Int. J. Comp. Theo. Stat. 4, No. 1, 13-35 (May-2017) 29
http://journals.uob.edu.bh
parkinsonSummatioN_ = 0 : stDevSummatioN_ = 0 : satchellSummatioN_ = 0 : historicalSummatioN_ = 0 : garmanSummatioN_ = 0 : garmanYangZhangSummatioN_ = 0 : muO_SummatioN_ = 0 : muC_SummatioN_ = 0
sigmaC_SummatioN_ = 0 : sigmaO_SummatioN_ = 0
'\\\\\\\\\\\\\\\\\\\\\\\\\\\\\\\\\\\\\\\\\\\\\\\\\\\\\\\\\\\\\\\\\\\\\\\\\\\\\\\\\\\\\\\\\\\\\\\\\\\\\\\\\\\\\\\\\\\\\\\\\\\\\\\\\\\\\\\\\\\\\\\\\\\\\\\\
For samplingDaysCounteR_ As Integer = 1 To samplingDayS_ 'loop n number of times
'General //////////////////////////////////////////////////////////////////////////////////////////////////////////////////////////// HighPricE_ = GetCharacterSeparatedValue(",", currentHighPriceMovementRoW_, columnCounteR_, , , True)
LowPricE_ = GetCharacterSeparatedValue(",", currentLowPriceMovementRoW_, columnCounteR_, , , True)
OpeningPricE_ = GetCharacterSeparatedValue(",", currentOpenClosePriceMovementRoW_, columnCounteR_ - 1, , , True) ClosingPricE_ = GetCharacterSeparatedValue(",", currentOpenClosePriceMovementRoW_, columnCounteR_, , , True)
If OpeningPricE_ <> 0 And ClosingPricE_ <> 0 Then
linCloseOverOpenSquareD_ = Math.Log(ClosingPricE_ / OpeningPricE_) ^ 2 linCloseOverOpeningPricE_ = Math.Log(ClosingPricE_ / OpeningPricE_)
Else
linCloseOverOpenSquareD_ = 0
linCloseOverOpeningPricE_ = 0
End If
linOpenOverCloseMinusOneSquareD_ = GetCharacterSeparatedValue(",", currentOpenClosePriceMovementRoW_, columnCounteR_ - 2, , , True)
If linOpenOverCloseMinusOneSquareD_ <> 0 And OpeningPricE_ <> 0 Then
linOpenOverCloseMinusOneSquareD_ = Math.Log(OpeningPricE_ / linOpenOverCloseMinusOneSquareD_) ^ 2 'open divided by the previous close
Else
linOpenOverCloseMinusOneSquareD_ = 0 End If
'BREAK CODE ///////////////////////////////////// If columnCounteR_ = -1 Then
columnCounteR_ = -1
End If '///////////////////////////////////////////////////
'STDEV //////////////////////////////////////////////////////////////////////////////////////////////////////////////////////////
If Not stdDevHasBeenCalculateD_ Then For counteR7_ = columnCounteR_ To columnCounteR_ + numberOfHistoricalPricesUseD_ - 1
tempStdDevMeaN_ += GetCharacterSeparatedValue(",", currentOpenClosePriceMovementRoW_, counteR7_, , , True)
Next If tempStdDevMeaN_ <> 0 Then
tempStdDevMeaN_ = tempStdDevMeaN_ / numberOfHistoricalPricesUseD_ 'tempStdDevMeaN_ = tempStdDevMeaN_ /
NumberOfNonZeroArrayValues(GetSetOfPriceMovementValues(currentOpenClosePriceMovementRoW_, columnCounteR_,
numberOfHistoricalPricesUseD_)) Else
tempStdDevMeaN_ = 0
End If stdDevHasBeenCalculateD_ = True ' this indicates that tempStdDevMeaN_ has already been done so no need to re-do it
End If
stDevSummatioN_ += (ClosingPricE_ - tempStdDevMeaN_) ^ 2
'PARKINSON //////////////////////////////////////////////////////////////////////////////////////////////////////////////////////////
If LowPricE_ <> 0 And HighPricE_ <> 0 Then linHiDividedByLowSquared_ = Math.Log(HighPricE_ / LowPricE_) ^ 2
Else
linHiDividedByLowSquared_ = 0 End If
parkinsonSummatioN_ += linHiDividedByLowSquared_
'SATCHELL ////////////////////////////////////////////////////////////////////////////////////////////////////////////////////////////
If ClosingPricE_ <> 0 And HighPricE_ <> 0 And LowPricE_ <> 0 Then
linHighOverClosingPricE_ = Math.Log(HighPricE_ / ClosingPricE_) linLowOverClosingPricE_ = Math.Log(LowPricE_ / ClosingPricE_)
Else
linHighOverClosingPricE_ = 0 linLowOverClosingPricE_ = 0
End If
If OpeningPricE_ <> 0 And HighPricE_ <> 0 And LowPricE_ <> 0 Then linHighOverOpeningPricE_ = Math.Log(HighPricE_ / OpeningPricE_)
linLowOverOpeningPricE_ = Math.Log(LowPricE_ / OpeningPricE_)
Else

30 B. Oyelami & E. Sambo: Comparative Analysis of Some Volatility Estimators …
http://journals.uob.edu.bh
linHighOverOpeningPricE_ = 0 linLowOverOpeningPricE_ = 0
End If
satchellSummatioN_ += (linHighOverClosingPricE_ * linHighOverOpeningPricE_) + (linLowOverClosingPricE_ * linLowOverOpeningPricE_)
'GARMAN //////////////////////////////////////////////////////////////////////////////////////////////////////////////////////////// If LowPricE_ <> 0 And HighPricE_ <> 0 Then linHiDividedByLowSquared_ = Math.Log(HighPricE_ / LowPricE_) ^ 2 Else
linHiDividedByLowSquared_ = 0
garmanSummatioN_ += (0.5 * linHiDividedByLowSquared_) - ((((2 * Math.Log(2)) - 1) * linCloseOverOpenSquareD_))
'GARMAN YANG ZANG ////////////////////////////////////////////////////////////////////////////////////////////////////////////////
garmanYangZhangSummatioN_ += linOpenOverCloseMinusOneSquareD_ + (0.5 * linHiDividedByLowSquared_) - ((((2 * Math.Log(2)) - 1) * linCloseOverOpenSquareD_))
'YANG ZANG ////////////////////////////////////////////////////////////////////////////////////////////////////////////////
linOpenOverCloseMinusOnE_ = GetCharacterSeparatedValue(",", currentOpenClosePriceMovementRoW_, columnCounteR_ - 2, , ,
True)
If linOpenOverCloseMinusOnE_ <> 0 And OpeningPricE_ <> 0 Then linOpenOverCloseMinusOnE_ = Math.Log(OpeningPricE_ / linOpenOverCloseMinusOnE_) 'open divided by the previous close
Else
linOpenOverCloseMinusOnE_ = 0 End If
muO_SummatioN_ += linOpenOverCloseMinusOnE_
muC_SummatioN_ += linCloseOverOpeningPricE_
'HISTORICAL ////////////////////////////////////////////////////////////////////////////////////////////////////////////////////////////
If Not closeToCloseHasBeenCalculateD_ Then For counteR7_ = columnCounteR_ To columnCounteR_ + numberOfHistoricalPricesUseD_ - 1
tempClosingPricE_ = GetCharacterSeparatedValue(",", currentOpenClosePriceMovementRoW_, counteR7_, , , True)
tempClosePlusOnE_ = GetCharacterSeparatedValue(",", currentOpenClosePriceMovementRoW_, counteR7_ + 1, , , True) 'next close
If tempClosePlusOnE_ <> 0 And tempClosingPricE_ <> 0 Then
tempHistoricalSummationBuffeR_ += Math.Log(tempClosePlusOnE_ / tempClosingPricE_) End If
Next
closeToCloseHasBeenCalculateD_ = True ' this indicates that the above calculation has already been done so no need to re-do it tempHistoricalSummationBuffeR_ = tempHistoricalSummationBuffeR_ / (numberOfHistoricalPricesUseD_ - 1)
End If tempClosePlusOnE_ = GetCharacterSeparatedValue(",", currentOpenClosePriceMovementRoW_, columnCounteR_ + 1, , , True)
If ClosingPricE_ <> 0 And tempClosePlusOnE_ <> 0 Then
logReturN_ = Math.Log(tempClosePlusOnE_ / ClosingPricE_) 'next close divided by the close Else
logReturN_ = 0
End If historicalSummatioN_ += (logReturN_ - tempHistoricalSummationBuffeR_) ^ 2
columnCounteR_ += 1
Next 'FINAL CALCULATIONS (SECOND PHASE). Here every nth day summations are combined with the other formulae to get the final
results for each method /////////////////////////////////////////////////////////////////
'//////////////////////////////////////////////////////////////////////////////////////////////////////////////////////////////////////////////////////////////////////////////////////////////////////////////////
'BREAK CODE ///////////////////////////////////// If setsCounteR_ = 5 Then
setsCounteR_ = setsCounteR_
End If
'Standard Deviation ////////////////////////////////////////////////////////////////////////////////
If stDevSummatioN_ > 0 Then firstForumulA_ = 1 / (numberOfHistoricalPricesUseD_ - 1)
stDevVolatility_(setsCounteR_) = Math.Sqrt(firstForumulA_ * stDevSummatioN_)
Else stDevVolatility_(setsCounteR_) = 0
End If
'Parkinson ///////////////////////////////////////////////////////////////////////////////////////// If parkinsonSummatioN_ > 0 Then
firstForumulA_ = numberOfYearlyClosingPriceS_ / (numberOfHistoricalPricesUseD_ * 4 * Math.Log(2))
parkinsonVolatility_(setsCounteR_) = Math.Sqrt(firstForumulA_ * parkinsonSummatioN_)
Int. J. Comp. Theo. Stat. 4, No. 1, 13-35 (May-2017) 31
http://journals.uob.edu.bh
Else parkinsonVolatility_(setsCounteR_) = 0
End If
'Satchell ////////////////////////////////////////////////////////////////////////////////////////
If satchellSummatioN_ > 0 Then
firstForumulA_ = numberOfYearlyClosingPriceS_ / numberOfHistoricalPricesUseD_ satchellVolatility_(setsCounteR_) = Math.Sqrt(firstForumulA_ * satchellSummatioN_)
Else
satchellVolatility_(setsCounteR_) = 0 End If
'Garman ///////////////////////////////////////////////////////////////////////////////////////// If garmanSummatioN_ > 0 Then
firstForumulA_ = numberOfYearlyClosingPriceS_ / numberOfHistoricalPricesUseD_
garmanVolatilitY_(setsCounteR_) = Math.Sqrt(firstForumulA_ * garmanSummatioN_)
Else
garmanVolatilitY_(setsCounteR_) = 0
End If 'Garman Yang Zhang ////////////////////////////////////////////////////////////////////////////////
If garmanYangZhangSummatioN_ > 0 Then
firstForumulA_ = numberOfYearlyClosingPriceS_ / numberOfHistoricalPricesUseD_ garmanYangZhangVolatilitY_(setsCounteR_) = Math.Sqrt(firstForumulA_ * garmanYangZhangSummatioN_)
Else
garmanYangZhangVolatilitY_(setsCounteR_) = 0 End If
'Yang Zhang ///////////////////////////////////////////////////////////////////////////////////
muO_ = (1 / numberOfHistoricalPricesUseD_) * muO_SummatioN_ muC_ = (1 / numberOfHistoricalPricesUseD_) * muC_SummatioN_
For counteR7_ = columnCounteR_ To columnCounteR_ + numberOfHistoricalPricesUseD_ - 1
tempOpeningPricE_ = GetCharacterSeparatedValue(",", currentOpenClosePriceMovementRoW_, counteR7_ - 1, , , True) tempClosingPricE_ = GetCharacterSeparatedValue(",", currentOpenClosePriceMovementRoW_, counteR7_, , , True)
tempCloseMinusOnE_ = GetCharacterSeparatedValue(",", currentOpenClosePriceMovementRoW_, counteR7_ - 2, , , True)
If tempCloseMinusOnE_ <> 0 And tempOpeningPricE_ <> 0 Then sigmaO_SummatioN_ += (Math.Log(tempOpeningPricE_ / tempCloseMinusOnE_) - muO_) ^ 2 'open divided by the previous close
If tempOpeningPricE_ <> 0 And tempClosingPricE_ <> 0 Then sigmaC_SummatioN_ += (Math.Log(tempClosingPricE_ /
tempOpeningPricE_) - muC_) ^ 2 Next
K_ = 0.34 / (1 + ((numberOfHistoricalPricesUseD_ + 1) / (numberOfHistoricalPricesUseD_ - 1))) sigmaO_ = (numberOfYearlyClosingPriceS_ / (numberOfHistoricalPricesUseD_ - 1)) * sigmaO_SummatioN_
sigmaC_ = (numberOfYearlyClosingPriceS_ / (numberOfHistoricalPricesUseD_ - 1)) * sigmaC_SummatioN_
sigmaRS_ = satchellVolatility_(setsCounteR_) ^ 2 yangZangVolatilitY_(setsCounteR_) = Math.Sqrt(sigmaO_ + (K_ * sigmaC_) + ((1 - K_) * (sigmaRS_)))
muO_ = 0 : muC_ = 0 : sigmaO_ = 0 : sigmaC_ = 0 : sigmaRS_ = 0
'Historical CC ////////////////////////////////////////////////////////////////////////////////////////////
If historicalSummatioN_ > 0 Then
firstForumulA_ = numberOfYearlyClosingPriceS_ / (numberOfHistoricalPricesUseD_ - 2) historicalVolatilitY_(setsCounteR_) = Math.Sqrt(firstForumulA_ * historicalSummatioN_)
Else
historicalVolatilitY_(setsCounteR_) = 0 End If
Next
'LAST PHASE. CALCULATE MEANS AND OUTPUT TO THE NEXT LINE IN THE OUTPUT TEXTBOXES ////////////////////////////////////////////////////////////////////////////////////////////////////////////////////
'//////////////////////////////////////////////////////////////////////////////////////////////////////////////////////////////////////////////////////////////////////////////////////////////////////////////////////////
StdDevTextBox.Text += (stDevVolatility_.Sum() / stDevVolatility_.Length).ToString() & Chr(13) & Chr(10)
ParkinsonSolutionTextBox.Text += (parkinsonVolatility_.Sum() / parkinsonVolatility_.Length).ToString() & Chr(13) & Chr(10) SatchellSolutionTextBox.Text += (satchellVolatility_.Sum() / satchellVolatility_.Length).ToString & Chr(13) & Chr(10)
GarmanSolutionTextBox.Text += (garmanVolatilitY_.Sum() / garmanVolatilitY_.Length).ToString & Chr(13) & Chr(10)
GarmanYangTextBox.Text += (garmanYangZhangVolatilitY_.Sum() / garmanYangZhangVolatilitY_.Length).ToString & Chr(13) & Chr(10) YangZangTextBox.Text += (yangZangVolatilitY_.Sum() / yangZangVolatilitY_.Length).ToString & Chr(13) & Chr(10)
HistoricalTextBox.Text += (historicalVolatilitY_.Sum() / historicalVolatilitY_.Length).ToString & Chr(13) & Chr(10)
'StdDevTextBox.Text += (stDevVolatility_.Sum() / NumberOfNonZeroArrayValues(stDevVolatility_)).ToString() & Chr(13) & Chr(10)
'ParkinsonSolutionTextBox.Text += (parkinsonVolatility_.Sum() / NumberOfNonZeroArrayValues(parkinsonVolatility_)).ToString() &
Chr(13) & Chr(10)

32 B. Oyelami & E. Sambo: Comparative Analysis of Some Volatility Estimators …
http://journals.uob.edu.bh
'SatchellSolutionTextBox.Text += (satchellVolatility_.Sum() / NumberOfNonZeroArrayValues(satchellVolatility_)).ToString & Chr(13) & Chr(10)
'GarmanSolutionTextBox.Text += (garmanVolatilitY_.Sum() / NumberOfNonZeroArrayValues(garmanVolatilitY_)).ToString & Chr(13) &
Chr(10) 'GarmanYangTextBox.Text += (garmanYangZhangVolatilitY_.Sum() /
NumberOfNonZeroArrayValues(garmanYangZhangVolatilitY_)).ToString & Chr(13) & Chr(10)
'YangZangTextBox.Text += (yangZangVolatilitY_.Sum() / NumberOfNonZeroArrayValues(yangZangVolatilitY_)).ToString & Chr(13) & Chr(10)
'HistoricalTextBox.Text += (historicalVolatilitY_.Sum() / NumberOfNonZeroArrayValues(historicalVolatilitY_)).ToString & Chr(13) &
Chr(10)
Loop While Not currentOpenClosePriceMovementRoW_ = "" ' loop while there is still more data to be processed
End Sub
Function ExtractDataFromCSVToBuffers() As Integer
priceMovementValueS_ = Trim(GetCharacterSeparatedValue("@", PriceMovementsTextBox.Text, 1))
highPriceMovementValueS_ = Trim(GetCharacterSeparatedValue("@", PriceMovementsTextBox.Text, 2))
lowPriceMovementValueS_ = Trim(GetCharacterSeparatedValue("@", PriceMovementsTextBox.Text, 3))
End Function Function GetRowOfPriceMovementData(ByVal roW_ As Integer, ByVal rowS_ As String) As String
Dim finD_ As Integer = 0, prevFinD_ As Integer
If Len(rowS_) > 0 Then For counteR_ As Integer = 1 To roW_
prevFinD_ = finD_
finD_ = InStr(prevFinD_ + 1, rowS_, "#") If finD_ = 0 And counteR_ < roW_ Then Return ""
Next
If finD_ > 0 Then Return RemoveEmptyCharSeparatedValues(RemoveChars(Trim(Mid(rowS_, prevFinD_ + 1, finD_ - prevFinD_ - 1))), ",")
ElseIf finD_ = 0 And prevFinD_ + 1 < Len(rowS_) Then
Return RemoveEmptyCharSeparatedValues(RemoveChars(Trim(Mid(rowS_, prevFinD_ + 1))), ",") End If
End If
Return "" End Function
Function RemoveChars(ByVal strinG_ As String) As String
Dim charS_ As String = Chr(13) & Chr(10), buffeR_ As String = "", buffeR2_ As String, counteR2_ As Integer = 0 Do
counteR2_ += 1 buffeR2_ = Mid(strinG_, counteR2_, 1)
For counteR_ As Integer = 1 To Len(charS_)
buffeR_ = Mid(charS_, counteR_, 1) If buffeR2_ = buffeR_ Then
strinG_ = strinG_.Remove(counteR2_ - 1, 1)
counteR2_ -= 1 End If
Next
Loop Until buffeR2_ = "" Return Trim(strinG_)
End Function
Function RemoveEmptyCharSeparatedValues(ByVal strinG_ As String, ByVal chaR_ As String) As String Dim buffeR_ As String = ""
For counteR_ As Integer = 1 To Len(strinG_)
buffeR_ = Mid(strinG_, counteR_, 1) If Not buffeR_ = " " And Not buffeR_ = chaR_ Then
Return Mid(strinG_, counteR_)
End If Next
End Function
Function GetSetOfPriceMovementValues(ByVal priceMovementS_ As String, ByVal starT_ As Integer, ByVal numbeR_ As Integer) As Double() Dim counteR2_ As Integer = 0
'If startFromBeginninG_ Then nextLocatioN_ = 1
Dim priceMovementValuesBuffeR_(numbeR_ - 1) As Double Dim buffeR_ As String = ""
For counteR_ As Integer = starT_ To starT_ + numbeR_ - 1
buffeR_ = GetCharacterSeparatedValue(",", priceMovementS_, counteR_) 'buffeR_ = GetNextPriceMovementValue(lastLocatioN_)
buffeR_ = Trim(buffeR_)
If Len(buffeR_) > 0 And Not buffeR_ = " " Then
Int. J. Comp. Theo. Stat. 4, No. 1, 13-35 (May-2017) 33
http://journals.uob.edu.bh
priceMovementValuesBuffeR_(counteR2_) = CType(buffeR_, Double) Else
priceMovementValuesBuffeR_(counteR2_) = 0
'Dim tmP_(0) As Double 'Return tmP_
'priceMovementValuesBuffeR_(counteR2_) = -1
End If counteR2_ += 1
Next
GetSetOfPriceMovementValues = priceMovementValuesBuffeR_ End Function
Function GetNextPriceMovementValue(ByRef lastLocation_ As Integer) As Double ' useless function
Dim searchBuffeR_ As String For counteR_ As Integer = 1 To 10
searchBuffeR_ = Mid(PriceMovementsTextBox.Text, lastLocation_, 1)
If Not searchBuffeR_ = " " And Not searchBuffeR_ = "" Then
Dim starT_ As Integer = lastLocation_, enD_ As Integer = 0
enD_ = InStr(starT_, PriceMovementsTextBox.Text, " ")
If searchBuffeR_ > 0 Then Return Mid(PriceMovementsTextBox.Text, enD_ - starT_)
ElseIf searchBuffeR_ = 0 Then
lastLocation_ = -1 Return Mid(PriceMovementsTextBox.Text, starT_)
End If
ElseIf searchBuffeR_ = "" Then Return -1
End If
lastLocation_ += 1 Next
MsgBox("There is too much spacing between the price movement values. Please re-edit your data.", MsgBoxStyle.Exclamation)
Return -1 End Function
Function AllArrayValuesAreEmpty(ByVal arraY_() As Double) As Boolean
For counteR_ As Integer = 0 To arraY_.Length - 1 If Not arraY_(counteR_) = -1 Then Return False
Next
Return True End Function
Function NumberOfNonZeroArrayValues(ByVal arraY_() As Double, Optional ByVal startIndeX_ As Integer = 0, Optional ByVal endIndeX_ As Integer = 0) As Integer
NumberOfNonZeroArrayValues = 0
If endIndeX_ = 0 Then endIndeX_ = arraY_.Length - 1 For counteR_ As Integer = startIndeX_ To endIndeX_
If arraY_(counteR_) <> 0 Then NumberOfNonZeroArrayValues += 1
Next End Function
'Function GetHighestValue(ByVal valueS_() As Double) As Double
' For counteR_ As Integer = 0 To valueS_.Length - 1 ' If Not valueS_(counteR_) = -1 Then
' If valueS_(counteR_) > GetHighestValue Then GetHighestValue = valueS_(counteR_)
' End If ' Next
'End Function
'Function GetLowestValue(ByVal valueS_() As Double) As Double ' GetLowestValue = valueS_(0)
' For counteR_ As Integer = 1 To valueS_.Length - 1
' If Not valueS_(counteR_) = -1 Then ' If valueS_(counteR_) < GetLowestValue Then GetLowestValue = valueS_(counteR_)
' End If
' Next 'End Function
Function GetCharacterSeparatedValue(ByVal chaR_ As String, ByVal strinG_ As String, ByVal positioN_ As Integer, Optional ByVal starT_ As
Integer = 0, Optional ByVal limiT_ As Integer = 0, Optional ByVal returnZeroForNoResulT_ As Boolean = False) As String
If Len(strinG_) > 0 Then
If limiT_ = 0 Then limiT_ = Len(strinG_)
Dim counT_ As Integer, finD_ As Integer = starT_, prevFinD_ As Integer = 0
For counT_ = 1 To positioN_

34 B. Oyelami & E. Sambo: Comparative Analysis of Some Volatility Estimators …
http://journals.uob.edu.bh
finD_ = InStr(finD_ + 1, strinG_, chaR_, CompareMethod.Text) If finD_ = 0 Then
If counT_ = positioN_ Then
GetCharacterSeparatedValue = Trim(strinG_.Substring(prevFinD_, strinG_.Length - prevFinD_)) Else
If returnZeroForNoResulT_ Then
GetCharacterSeparatedValue = "0" Else
GetCharacterSeparatedValue = ""
End If Exit For
End If
ElseIf counT_ = positioN_ Then GetCharacterSeparatedValue = Trim(strinG_.Substring(prevFinD_, finD_ - prevFinD_ - 1))
If GetCharacterSeparatedValue = "" And returnZeroForNoResulT_ Then GetCharacterSeparatedValue = "0"
End If
prevFinD_ = finD_
Next
End If If Len(GetCharacterSeparatedValue) = 0 And returnZeroForNoResulT_ Then
GetCharacterSeparatedValue = "0"
End If End Function
Function CountCharacterSeparatedValues(ByVal chaR_ As String, ByVal strinG_ As String) As String
'This function counts the number of values separated by the given 'chaR_' inside strinG_ If Len(strinG_) > 0 Then
Dim counT_ As Integer, finD_ As Integer, prevFinD_ As Integer = 0
Do finD_ = InStr(finD_ + 1, strinG_, chaR_, CompareMethod.Text)
If finD_ - prevFinD_ > 1 Then
counT_ += 1 End If
'counT_ += 1
If finD_ = 0 Or (finD_ = Len(strinG_)) Then Return counT_
End If
prevFinD_ = finD_ Loop
End If Return 0
End Function
'Function GetOpeningPrice(ByVal valueS_() As Double) As Double ' If Not valueS_(0) = -1 Then Return valueS_(0)
'End Function
'Function GetClosingPrice(ByVal valueS_() As Double) As Double ' If Not valueS_(valueS_.Length - 1) = -1 Then Return valueS_(valueS_.Length - 1)
'End Function
Private Sub ExportButton_Click(ByVal sender As System.Object, ByVal e As System.EventArgs) Handles ExportButton.Click If ParkinsonSolutionTextBox.TextLength > 0 Then
SaveFileDialog.Filter = "Comma Separated Value files(*.csv)|*.csv"
SaveFileDialog.ShowDialog() Else
MsgBox("No results have been calculated yet.", MsgBoxStyle.Critical)
End If End Sub
Private Sub SaveFileDialog_FileOk(ByVal sender As Object, ByVal e As System.ComponentModel.CancelEventArgs) Handles
SaveFileDialog.FileOk 'this function processes saving the results to file
Dim buffeR_ As String, buffeR2_ As String = "", buffeR3_ As String
buffeR3_ = "StdDev,Parkinson,Rogers Satchell,Garman Klass,Garman Yang Zang,Historical Close-to-Close,Yang Zang" & Chr(13) & Chr(10)
For counteR_ As Integer = 0 To ParkinsonSolutionTextBox.Lines.Length - 1
buffeR_ = StdDevTextBox.Lines(counteR_) If Len(buffeR_) > 0 Then
If Not CType(buffeR_, Double) = 0 Or Not IgnoreZerosCheckBox.Checked Then
buffeR2_ += buffeR_ & "," Else
buffeR2_ = ""
Continue For
Int. J. Comp. Theo. Stat. 4, No. 1, 13-35 (May-2017) 35
http://journals.uob.edu.bh
End If End If
buffeR_ = ParkinsonSolutionTextBox.Lines(counteR_)
If Len(buffeR_) > 0 Then If Not CType(buffeR_, Double) = 0 Or Not IgnoreZerosCheckBox.Checked Then
buffeR2_ += buffeR_ & ","
Else buffeR2_ = ""
Continue For
End If End If
buffeR_ = SatchellSolutionTextBox.Lines(counteR_)
If Len(buffeR_) > 0 Then If Not CType(buffeR_, Double) = 0 Or Not IgnoreZerosCheckBox.Checked Then
buffeR2_ += buffeR_ & ","
Else
buffeR2_ = ""
Continue For
End If End If
buffeR_ = GarmanSolutionTextBox.Lines(counteR_)
If Len(buffeR_) > 0 Then If Not CType(buffeR_, Double) = 0 Or Not IgnoreZerosCheckBox.Checked Then
buffeR2_ += buffeR_ & ","
Else buffeR2_ = ""
Continue For
End If End If
buffeR_ = GarmanYangTextBox.Lines(counteR_)
If Len(buffeR_) > 0 Then If Not CType(buffeR_, Double) = 0 Or Not IgnoreZerosCheckBox.Checked Then
buffeR2_ += buffeR_ & ","
Else buffeR2_ = ""
Continue For
End If End If
buffeR_ = HistoricalTextBox.Lines(counteR_) If Len(buffeR_) > 0 Then
If Not CType(buffeR_, Double) = 0 Or Not IgnoreZerosCheckBox.Checked Then
buffeR2_ += buffeR_ & "," Else
buffeR2_ = ""
Continue For End If
End If
buffeR_ = YangZangTextBox.Lines(counteR_)
If Len(buffeR_) > 0 Then
If Not CType(buffeR_, Double) = 0 Or Not IgnoreZerosCheckBox.Checked Then buffeR2_ += buffeR_ & ","
Else
buffeR2_ = "" Continue For
End If
End If If Len(buffeR2_) > 0 Then buffeR3_ += buffeR2_ & Chr(13) & Chr(10)
buffeR2_ = ""
Next
My.Computer.FileSystem.WriteAllText(SaveFileDialog.FileName, buffeR3_, False)
End Sub
Private Sub PriceMovementsTextBox_TextChanged(ByVal sender As System.Object, ByVal e As System.EventArgs) Handles PriceMovementsTextBox.TextChanged
End Sub
End Class