comparative analysis of solar standalone and solar-biogas ... · shelter in a village of thane...
TRANSCRIPT

International Research Journal of Engineering and Technology (IRJET) e-ISSN: 2395-0056
Volume: 04 Issue: 08 | Aug -2017 www.irjet.net p-ISSN: 2395-0072
© 2017, IRJET | Impact Factor value: 5.181 | ISO 9001:2008 Certified Journal | Page 712
Comparative Analysis of Solar Standalone and Solar-Biogas Hybrid
Systems for Power Generation at an Animal Shelter
Jayrajsinh N. Zala1, Prashant Jain2
1Student of M.Tech (Energy Engineering), K J Somaiya College of Engineering Mumbai, Maharashtra, India, 400077
2Faculty (Mechanical Engineering) K J Somaiya College of Engineering Mumbai, Maharashtra, India, 400077
---------------------------------------------------------------------***---------------------------------------------------------------------
Abstract - Electricity is one of the cleanest energy transfer options and is therefore the basis for the development of any geographical area. In spite of energy access being one of the prime issues in the developmental plans on the part of government, many parts of India still suffer from scarcity of electricity. As per 68th round of National Sample Survey (2011-12), more than 96.68 % villages had access to electricity, but the total number of households having this access was just 72.7%. It is also important that renewable resources are given priority for generation of clean and green energy. India has world’s largest cattle inventory and huge number of animal shelters and dairies. This report explores into the self-sufficiency of standalone renewable power generation system for such an establishment. Comparative analysis of both the solar and solar-biogas hybrid systems has been done. The case study has been carried out at an animal shelter in a village of Thane district of Maharashtra. It was found that solar standalone system failed to supply sufficient power during monsoon while solar-biogas hybrid system was more reliable in this regard. Similar systems may be useful for small rural communities also. The scientific management of dung achieved through biogas generation at the animal shelters and generation of renewable electricity through solar-biogas hybrid systems will not only reduce the demand and supply gap of electricity but will also be instrumental in emission mitigation to a great extent.
Keywords – Solar Standalone System, Solar-Biogas Hybrid System, Energy Potential, Animal Shelter.
1. INTRODUCTION
Energy access is not only essential at the household level, but is also very critical to the provision of basic infrastructure such as hospitals, schools, industry and others. For a country like India, developmental goals and energy access are very closely linked but still many parts of rural India use traditional sources of energy and don’t have proper access to modern energy sources such as electricity. As per 2011 census report more than 68 % people in India live in rural area [1]. The data collected from NSSO in 68th round suggests a large number of people depend on biomass for their cooking and lighting requirements (27% for lighting purpose while more than
77% use biomass for cooking purpose) in rural India [2]. Power generation from renewable sources is on the rise in India, with the share of renewable energy in the country’s total energy mix rising from 7.8% in 2008 to 13.12% in 2015. India had about 35.8 GW installed renewable energy capacity as on 31 March 2015. India is rich in availability of solar energy, also it holds world’s largest cattle inventory [3] which makes good potential for biogas generation. Hence the solar-biogas hybrid energy system can be a very effective solution for the problem of rural energy access. Animal shelters can be used for generation of biogas and can be combined with other renewable resources such as solar and wind to form a hybrid renewable energy system. Such decentralized systems in remote locations can provide electricity to the surrounding areas while excess energy can be supplied to the grid wherever possible. This paper deals with how renewable energy resources in rural India can be utilized by means of integrated or hybrid energy systems, especially solar-biogas hybrid systems.
2. RURAL ELECTRIFICATION IN INDIA
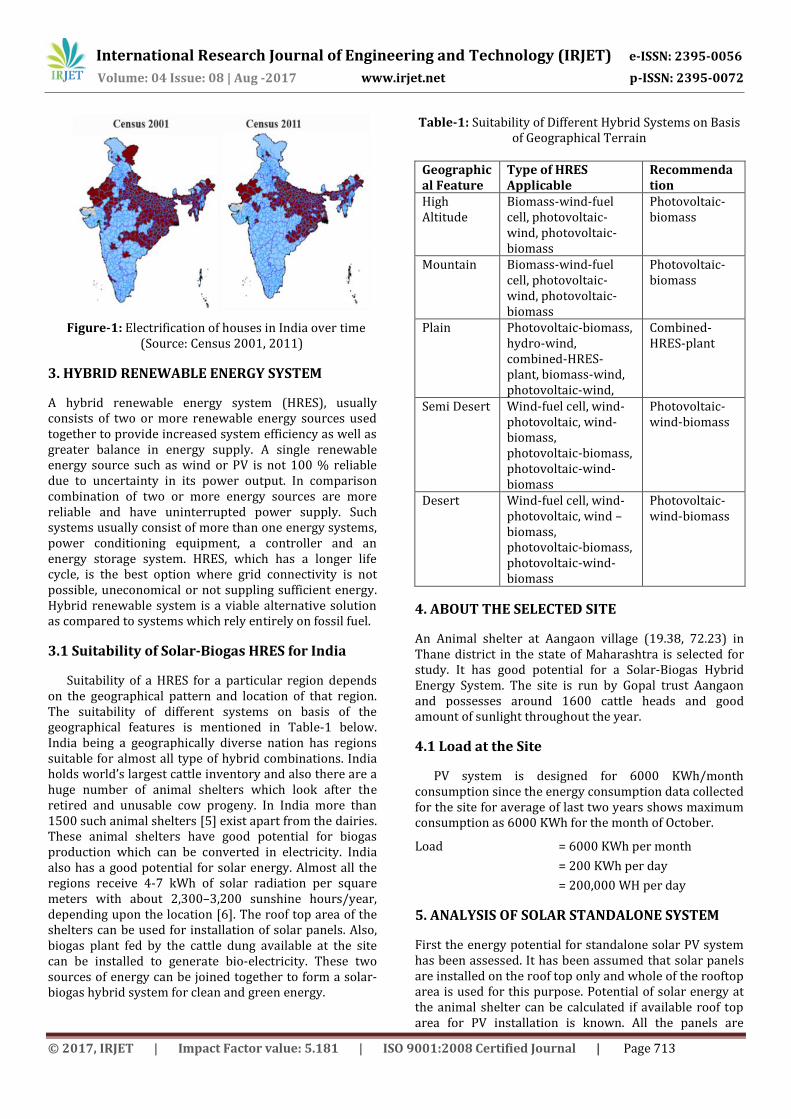
While large-scale reforms have repeatedly been attempted in the past, India’s achievement in the field of rural access to electricity leaves much to be desired. According to IEA India was home to 35% of the global population without access to electricity in 2002 [4] After many successful government programs such as Pradhan Mantri Gramodaya Yojna (PMGY), Kutir Jyoti Program (KJP), Accelerated Rural Electrification Program (AREP), Rural Electricity Supply Technology Mission (REST) and Rajiv Gandhi Grameen Vidyutikaran Yojna in India many villages were electrified. Over 95% villages have reportedly become electrified today but number of households electrified is comparatively much less. Figure 3 shows the rate of electrification of villages in India between 2001 and 2011.
International Research Journal of Engineering and Technology (IRJET) e-ISSN: 2395-0056
Volume: 04 Issue: 08 | Aug -2017 www.irjet.net p-ISSN: 2395-0072
© 2017, IRJET | Impact Factor value: 5.181 | ISO 9001:2008 Certified Journal | Page 713
Figure-1: Electrification of houses in India over time (Source: Census 2001, 2011)
3. HYBRID RENEWABLE ENERGY SYSTEM
A hybrid renewable energy system (HRES), usually consists of two or more renewable energy sources used together to provide increased system efficiency as well as greater balance in energy supply. A single renewable energy source such as wind or PV is not 100 % reliable due to uncertainty in its power output. In comparison combination of two or more energy sources are more reliable and have uninterrupted power supply. Such systems usually consist of more than one energy systems, power conditioning equipment, a controller and an energy storage system. HRES, which has a longer life cycle, is the best option where grid connectivity is not possible, uneconomical or not suppling sufficient energy. Hybrid renewable system is a viable alternative solution as compared to systems which rely entirely on fossil fuel.
3.1 Suitability of Solar-Biogas HRES for India
Suitability of a HRES for a particular region depends on the geographical pattern and location of that region. The suitability of different systems on basis of the geographical features is mentioned in Table-1 below. India being a geographically diverse nation has regions suitable for almost all type of hybrid combinations. India holds world’s largest cattle inventory and also there are a huge number of animal shelters which look after the retired and unusable cow progeny. In India more than 1500 such animal shelters [5] exist apart from the dairies. These animal shelters have good potential for biogas production which can be converted in electricity. India also has a good potential for solar energy. Almost all the regions receive 4-7 kWh of solar radiation per square meters with about 2,300–3,200 sunshine hours/year, depending upon the location [6]. The roof top area of the shelters can be used for installation of solar panels. Also, biogas plant fed by the cattle dung available at the site can be installed to generate bio-electricity. These two sources of energy can be joined together to form a solar-biogas hybrid system for clean and green energy.
Table-1: Suitability of Different Hybrid Systems on Basis of Geographical Terrain
Geographical Feature
Type of HRES Applicable
Recommendation
High Altitude
Biomass-wind-fuel cell, photovoltaic-wind, photovoltaic-biomass
Photovoltaic-biomass
Mountain Biomass-wind-fuel cell, photovoltaic-wind, photovoltaic-biomass
Photovoltaic-biomass
Plain Photovoltaic-biomass, hydro-wind, combined-HRES-plant, biomass-wind, photovoltaic-wind,
Combined-HRES-plant
Semi Desert Wind-fuel cell, wind-photovoltaic, wind-biomass, photovoltaic-biomass, photovoltaic-wind-biomass
Photovoltaic-wind-biomass
Desert Wind-fuel cell, wind-photovoltaic, wind –biomass, photovoltaic-biomass, photovoltaic-wind-biomass
Photovoltaic-wind-biomass
4. ABOUT THE SELECTED SITE
An Animal shelter at Aangaon village (19.38, 72.23) in Thane district in the state of Maharashtra is selected for study. It has good potential for a Solar-Biogas Hybrid Energy System. The site is run by Gopal trust Aangaon and possesses around 1600 cattle heads and good amount of sunlight throughout the year.
4.1 Load at the Site
PV system is designed for 6000 KWh/month consumption since the energy consumption data collected for the site for average of last two years shows maximum consumption as 6000 KWh for the month of October.
Load = 6000 KWh per month
= 200 KWh per day
= 200,000 WH per day
5. ANALYSIS OF SOLAR STANDALONE SYSTEM
First the energy potential for standalone solar PV system has been assessed. It has been assumed that solar panels are installed on the roof top only and whole of the rooftop area is used for this purpose. Potential of solar energy at the animal shelter can be calculated if available roof top area for PV installation is known. All the panels are

International Research Journal of Engineering and Technology (IRJET) e-ISSN: 2395-0056
Volume: 04 Issue: 08 | Aug -2017 www.irjet.net p-ISSN: 2395-0072
© 2017, IRJET | Impact Factor value: 5.181 | ISO 9001:2008 Certified Journal | Page 714
considered facing south direction to absorb maximum solar energy also any area which is not shade free or where panels cannot be installed facing direct south direction are not considered for PV installation. PV panels are assumed to be kept at fixed tilt angle trough out the year with the tilt angle equal to latitude i.e. 19.38 in this case for maximum solar energy absorption by panels [7]. System voltage has been selected as 24V and 100Ah batteries of 12V output have been selected for storing power generated by PV panels. Figure-2 depicts the energy flow for a solar PV standalone system.
Figure-2: Energy flow diagram for solar Standalone system
5.1 Array Spacing
The rays of sun falling on PV panel placed in inclined position will cast a shadow on ground and it is important to calculate this shadow since this shadow can fall on row of panels behind the first row of panels which is not desirable. Calculating distance between two rows to avoid losses due to shadow of first row of panel on second is known as Tilted Array Spacing. To calculate Tilted Array Spacing as shown in figure below it is important to find either zenith angle or angle of incidence.
Figure -3: Shadow calculation for tilted panel In the above figure, L is length of panel (1000 mm), H is height, Ø is zenith angle, α is incident angle and Inclination of panel is equal to latitude (19.38). By Appling trigonometry S and h can be found,
Total shadow length of panel = X + S
Inclination of panel = latitude = 19.38
For further calculations second chapter of ‘Solar Energy Engineering Processes and Systems’ by Sotiris Kalogeria has been referred. The angle of inclination has been found by the formula below, where L, δ and h are angle of latitude, angle of declination and hour angle respectively
Sin α = cos Ø = (sinL*sinδ) + (cosL*cosδ*cosh) (1)
δ = 23.45 * sin (
(284 + N)) (2)
h= (AST-12) * 15 (3) AST= LST + ET ± 4 (SL-LL) (4)
Where, AST = Apparent solar time LST = Local solar time ET = Equation of time SL = Standard longitude LL = Local longitude N = Number of day of the year
From the above calculation the incident angle (α) and x is found 24.65 and 724 mm respectively and hence,
Total shadow length = x + s =1677 mm =1.68 m
5.2 Computations for Number of Panels
Area occupied by one row of panel equal to the maximum shadow length within solar window (at 4 pm) which is 1.68 m while width of a single panel is 1.48 m,
Number of panels rows on shed =
(5)
Number of panels in one row =
(6)
Based on the above calculation total number of panels that can be placed on each shed is calculated which can be seen in table below
Table-2: Panel Installation Capacity of Each Cattle Shed
SN Shed Number of
Panels (210Wp)
KWP
1 Shed 1 207 43.47 2 Shed 2 172 36.12 3 Shed 3 69 14.49 4 Shed 4 132 27.72 5 Shed 5 96 20.16 6 Shed 6 132 27.72 7 Shed 7 132 27.72 8 Shed 8 722 151 9 Shed 9 144 30 10 Shed
10 144 30
11 Shed 11
270 56
Total 2220 466.2
5.3 System Efficiency
In a solar PV system various components are involved and these components are not 100% efficient and consideration of loss of power due to these components is important to estimate the total output we get. Controller, converter and battery are the major components of the Solar PV system. Let ȠOverall l be the overall system efficiency.
ȠOverall = ȠConverter * ȠController * ȠBattery (7)

International Research Journal of Engineering and Technology (IRJET) e-ISSN: 2395-0056
Volume: 04 Issue: 08 | Aug -2017 www.irjet.net p-ISSN: 2395-0072
© 2017, IRJET | Impact Factor value: 5.181 | ISO 9001:2008 Certified Journal | Page 715
Where ȠConverter, ȠController and ȠBattery are converter, controller and battery efficiency respectively. Considering converter controller and battery efficiency 90% each, we get overall efficiency as 72.9%. Available power after considering system losses will be 339.85 KWP.
5.4 Converter Efficiency
Converter efficiency may vary between 90–98%. Taking converter efficiency as 93%, power loss
=
= 215054 WH
5.5 Number of Batteries
Considering each battery of output 100 Ah, 12V with
depth of discharge 70% Current required =
=
8960.6Ah
a) Batteries in parallel (BP) =
=
=128
batteries in parallel meet the required current.
b) Batteries in series (BS) =
= 2 batteries in
series.
c) Total number of batteries = BP * BS = 256 batteries
5.6 Battery Efficiency
Considering battery efficiency as 90%
Loss due to battery efficiency =
= 238948.89 WH
5.7 Controller Efficiency
Considering controller efficiency as 90%
Loss due to controller efficiency =
= 265498.77
WH
5.8 Number of Panels Required
Considering 210 W (25.1 V, 8.37 A)
Current required =
= 11062.45 Ah =
=
= 2087.25 A
Number of panels in parallel (Np) =
=
= 250 Panels in parallel to meet the required
current
Number of panels in series (Ns) =
=
= 0.96 = 1 Panels in series
Total number of Panels = Np * Ns = 250 Panels.
5.9 Power Generated by Solar Standalone System
The PV system designed above gives monthly energy output of 6288.17 KWh. The average solar peak hours are taken for calculation as 5.3 hour, but the value of solar peak hours will vary throughout the year. Due to this
change in peak hour throughout the year the energy output of the system will also vary. Table-3 below shows monthly energy output of system based on varying solar peak hours for Mumbai [10].
Table-3: Power Generated by Solar Standalone System throughout the Year
SN Month
Average Monthly
Peak Hours
Monthly Energy
Generated
Net Energy Generated
(System Losses
24.67%)
1 January 6.43 8952.489 6743.91
2 February 7.06 9829.638 7404.67
3 March 6.53 9091.719 6848.79
4 April 6.48 9088.104 6846.07
5 May 6.99 9732.177 7331.25
6 June 3.61 5026.203 3786.24
7 July 2.14 2979.522 2244.47
8 August 2.33 3244.059 2443.75
9 September 3.91 5443.893 4100.88
10 October 6.19 8618.337 6492.19
11 November 6.39 8896.797 6701.96
12 December 6.30 8771.490 6607.56
Chart-1: Load vs Power Generated by Solar Standalone Comparison
The graph in Chart-1 shows comparison of average load of 2 years of site with the output from solar standalone system throughout the year. By observing the graph it can be seen that the solar stand alone system is sufficient to meet the load throughout the year barring the months during monsoon (June-September) since the sky is mostly cloudy. Table 4 shows the amount of energy deficite during the months of monsson. needed to meet the demand for energy of the animal selter.
0
2000
4000
6000
8000
Kilo
wat
t H
ou
r
Months
Power Output by Solar Standalone System
Load Solar Energy
International Research Journal of Engineering and Technology (IRJET) e-ISSN: 2395-0056
Volume: 04 Issue: 08 | Aug -2017 www.irjet.net p-ISSN: 2395-0072
© 2017, IRJET | Impact Factor value: 5.181 | ISO 9001:2008 Certified Journal | Page 716
Table-4: Energy Deficit from Solar Standalone System
SN Month Energy Deficit
(KWh) 1 June 713.76 2 July 2255.53 3 August 2056.25 4 September 1623
6. ANALYSIS OF SOLAR-BIOGAS HYBRID SYSTEM
The Solar Standalone system fails to provide sufficient electricity during the months of June to September. The maximum deficit is in the month of July i.e. 2255.53 kWh. A biogas generator of 4 kW running for 20 hours a day will produce 2400 kWh a month and can help to fulfill the deficit energy.
6.1 Biogas Digester to Avoid the Energy Deficit
To run a 4 kW biogas generator a biogas digester will be required to provide sufficient biogas. A 4 kW biogas Generator running for 20 hours will produce 80 kWh/day. One m3 of biogas digester can produce 2.14 kWh of energy considering 35% efficiency of the generator. So, a 38 m3 biogas digester will be sufficient to fulfill biogas need of the generator.
6.2 Biogas Potential at the Site
Total 1600 cattle heads are present at the site. Considering dung production rate for average Indian cattle as 10 kilogram per day, the total dung produced will be 16000 kg/day. Taking the average gas production as 40 liter/kg(fresh dung) or 0.04 m3 per kilogram of fresh dung the total biogas produced can be calculated as follows [8]. Here total number of cattle heads is N, dung production by each cattle per day is D and biogas generated per Kg of fresh dung is Bp.
Total biogas produced = N * D * Bp
= 1600 * 10 * 0.04
= 640 m3 of Biogas/ day
So, the biogas potential at the selected site is much more than it is needed to cater to the load at site. We may choose to convert whole of the biogas into electricity and sale out the surplus to the grid.
6.3 Maximum Potential of Biogas Energy
In order to calculate the electricity generated from biogas, we must first know the calorific value of biogas. Calorific value of 1 m3 biogas may vary around 21 to 23 MJ based on composition of gas. For further calculation calorific value of 1 m3 of biogas is taken as 22 MJ. One MJ of energy is equivalent to 0.278 kWh of energy. Hence 1 m3 of biogas is equivalent to 6.116 kWh. So the total energy produced from 640 m3 of biogas will be equivalent
to 3914.24 kWh. But conversion of biogas to electricity is not 100% efficient and the efficiency ranges from 30-40 percentage [9]. So the total electricity generated from biogas with 35 percentage conversion efficiency will be 1369.98 KWh daily.
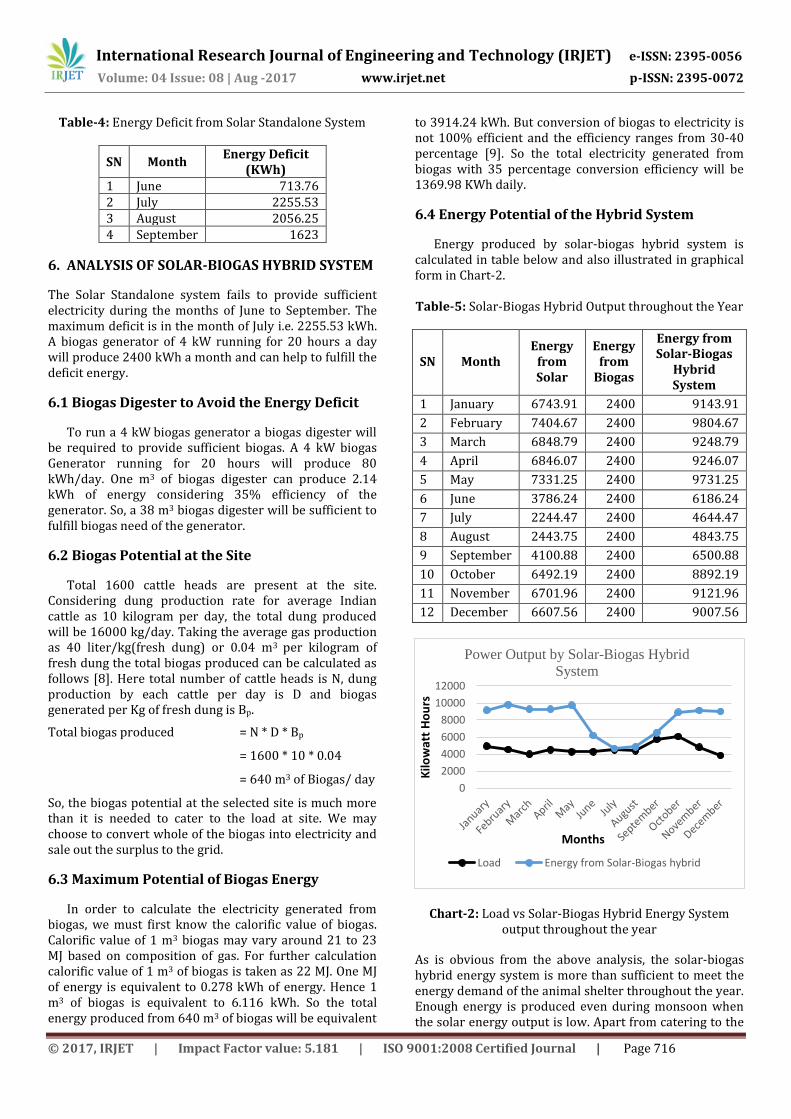
6.4 Energy Potential of the Hybrid System
Energy produced by solar-biogas hybrid system is calculated in table below and also illustrated in graphical form in Chart-2. Table-5: Solar-Biogas Hybrid Output throughout the Year
SN Month Energy
from Solar
Energy from
Biogas
Energy from Solar-Biogas
Hybrid System
1 January 6743.91 2400 9143.91
2 February 7404.67 2400 9804.67
3 March 6848.79 2400 9248.79
4 April 6846.07 2400 9246.07
5 May 7331.25 2400 9731.25
6 June 3786.24 2400 6186.24
7 July 2244.47 2400 4644.47
8 August 2443.75 2400 4843.75
9 September 4100.88 2400 6500.88
10 October 6492.19 2400 8892.19
11 November 6701.96 2400 9121.96
12 December 6607.56 2400 9007.56
Chart-2: Load vs Solar-Biogas Hybrid Energy System output throughout the year
As is obvious from the above analysis, the solar-biogas hybrid energy system is more than sufficient to meet the energy demand of the animal shelter throughout the year. Enough energy is produced even during monsoon when the solar energy output is low. Apart from catering to the
0
2000
4000
6000
8000
10000
12000
Kilo
wat
t H
ou
rs
Months
Power Output by Solar-Biogas Hybrid
System
Load Energy from Solar-Biogas hybrid

International Research Journal of Engineering and Technology (IRJET) e-ISSN: 2395-0056
Volume: 04 Issue: 08 | Aug -2017 www.irjet.net p-ISSN: 2395-0072
© 2017, IRJET | Impact Factor value: 5.181 | ISO 9001:2008 Certified Journal | Page 717
in-house need of energy, the proposed solar-biogas hybrid system generates good deal of excess electricity throughout the year. This excess energy can be sold out to the grid wherever possible. The revenue thus generated may be instrumental in recovering the maintenance cost of the system. Table-6 below gives the revenue generated if the excess electricity is sold to the grid at a rate of Rs. 5 per unit.
Table-6: Revenue Generated From Surplus Energy Produced By Solar-Biogas Hybrid System
SN Month Surplus Energy (kWh)
Revenue Generated
(Rs)
1 January 4208.91 21044
2 February 5274.67 26373.35
3 March 5281.79 26408
4 April 4746.07 23730
5 May 5469.25 27346
6 June 1926.24 9631
7 July 144.47 722
8 August 453.75 2268
9 September 777.88 3889
10 October 2847.19 14235
11 November 4337.96 21689
12 December 5169.56 25847
7. CONCLUSION
It has been observed that during the monsoon season the solar standalone system based on peak load at the animal shelter is not able to produce sufficient power even for in-house consumption while a solar-biogas hybrid system is able to give much more power output that it can be a source of revenue generation through grid connection. For a solar standalone system, building a battery backup for energy storage to meet the deficit during monsoon will entail huge cost while a solar-biogas hybrid system will be a much economical alternative. In areas where grid connectivity is not there, the solar component of power may be scaled down to minimize the installation cost while the biogas energy may be generated to its full potential for overall economy of the system. Such a scientific management of dung will not only fulfil the energy need but also prevent emission of methane in environment from decomposition of unmanaged dung, which is 28 to 36 time more potent for global warming [12].
8. REFERENCES
[1] Census of India 2011 Rural Urban Distribution of Population
[2] Source FAS/USDA head (Foreign Agricultural Service, US department of Agriculture
[3] Alternate Hydro Energy Centre, Indian Institute of Technology Roorkee, Roorkee,
Uttarakhand 247667, India, Integrated renewable energy systems for off grid rural electrification of remote area, introduction
[4] CGSD (Centre on Globalization and Sustainable Development) Working Paper No. 30 December 2005, Improving Electricity Services in Rural India, History of Rural Electrification in India. Introduction page 11
[5] www.cowbank.in
[6] The Ministry of New and Renewable Energy - http://mnre.gov.in/related-links/grid-connected/solar/
[7] Living on Solar power -https://livingonsolarpower.wordpress.com/2013/03/07/what-should-be-the-orientation-of-solar-panels/
[8] http://vikaspedia.in/energy/energy-production/bio-energy/biogashttp://vikaspedia.in/energy/energy-production/bio-energy/biogas
[9] Efficiency in electricity generation, Report by- “Upstream” Sub-Group in collaboration with VGB, 2003, Chapter 3, 3.2.4 Converting biomass and biogas into electricity, page 8
[10] http://www.synergyenviron.com/tools/solar-irradiance/mumbai
[11] Agriculture information Forum -http://www.agricultureinformation.com/forums/consultancy-services/22185-biogas-can-bottled-cylinder-like-lpg.html
[12] Environmental Protection Agency USA https://www.epa.gov/ghgemissions/understanding-global-warming-potentials