comparative analyses of dha-phosphatidylcholine and
TRANSCRIPT

RESEARCH Open Access
Comparative analyses of DHA-Phosphatidylcholine and recombination ofDHA-Triglyceride with Egg-Phosphatidylcholine orGlycerylphosphorylcholine on DHArepletion in n-3 deficient miceFang Wu1, Dan-dan Wang1, Min Wen3, Hong-xia Che1, Chang-hu Xue1,2, Teruyoshi Yanagita4,Tian-tian Zhang1* and Yu-ming Wang1,2*
Abstract
Background: Docosahexaenoic acid (DHA) is important for optimal neurodevelopment and brain function duringthe childhood when the brain is still under development.
Methods: The effects of DHA-Phosphatidylcholine (DHA-PC) and the recombination of DHA-Triglyceride with eggPC (DHA-TG + PC) or α-Glycerylphosphorylcholine (DHA-TG + α-GPC) were comparatively analyzed on DHA recoveryand the DHA accumulation kinetics in tissues including cerebral cortex, erythrocyte, liver, and testis were evaluatedin the weaning n-3 deficient mice.
Results: The concentration of DHA in weaning n-3 deficient mice could be recovered rapidly by dietary DHAsupplementation, in which DHA-PC exhibited the better efficacy than the recombination of DHA-Triglyceridewith egg PC or α-GPC. Interestingly, DHA-TG + α-GPC exhibited the greater effect on DHA accumulation thanDHA-TG + PC in cerebral cortex and erythrocyte (p < 0.05), which was similar to DHA-PC. Meanwhile, DHA-TG +PC showed a similar effect to DHA-PC on DHA repletion in testis, which was better than that of DHA-TG + α-GPC (p< 0.05).
Conclusion: We concluded that different forms of DHA supplements could be applied targetedly based on theDHA recovery in different tissues, although the supplemental effects of the recombination of DHA-Triglyceridewith egg PC or α-GPC were not completely equivalent to that of DHA-PC, which could provide some references to developfunctional foods to support brain development and function.
Keywords: DHA-Phosphatidylcholine, Tissue accretion kinetics, Repletion, N-3 Fatty acid deficiency, Weaning
* Correspondence: [email protected]; [email protected] of Food Science and Engineering, Ocean University of China, No. 5Yushan Road, Qingdao 266003, ChinaFull list of author information is available at the end of the article
© The Author(s). 2017 Open Access This article is distributed under the terms of the Creative Commons Attribution 4.0International License (http://creativecommons.org/licenses/by/4.0/), which permits unrestricted use, distribution, andreproduction in any medium, provided you give appropriate credit to the original author(s) and the source, provide a link tothe Creative Commons license, and indicate if changes were made. The Creative Commons Public Domain Dedication waiver(http://creativecommons.org/publicdomain/zero/1.0/) applies to the data made available in this article, unless otherwise stated.
Wu et al. Lipids in Health and Disease (2017) 16:234 DOI 10.1186/s12944-017-0623-2

BackgroundDocosahexaenoic acid (DHA) is highly accumulatedin the brain and retina, which is critical for normalnervous development and function [1, 2]. Docosa-hexaenoic acid can be synthesized from its essentialfatty acid precursor, α-linolenic acid (ALA). How-ever, the capacity of brain for synthesizing the long-chain polyunsaturated fatty acids is very limitedespecially in early life stage, thus DHA is mainlysupplied via the uteroplacental circulation duringpregnancy and the breast milk during nursing [3].Many pregnant women cannot intake sufficient n-3polyunsaturated fatty acids (PUFAs) during preg-nancy and lactation in modern western diets, whichis likely responsible for the DHA deficiency indeveloping brains of infants and the increasing inci-dence of neurological disorders [4, 5]. There havebeen many nutritional means such as the dietarysupplements of ALA and DHA to promote therecovery of organ DHA during the timeframe ofgestation and/or lactation [6, 7]. Moreover, particu-lar aspects of neurodevelopment such as synapticpruning and gliogenesis still continue in childhood,suggesting that the nutrition on brain function iscritical during this period [8]. Previous studiesshowed that direct DHA supplements could increasedendritic spine density and neuritogenesis in thehippocampus of mouse [9]. However, to the best ofour knowledge, very few studies have investigatedthe DHA accumulation kinetics in the brain andother tissues during the childhood.DHA in natural fish oil is normally esterified to tri-
glyceride (TG) and phospholipid (PL). DHA enrichedphosphatidylcholine (DHA-PC) is one of the import-ant forms in DHA-PLs. Several studies have shownthat DHA-PC exhibited the higher bioavailability andmore effective accumulation in brain compared withDHA-TG [10, 11]. Moreover, dietary ingestion ofDHA-PC produced a more significant improvementin cognitive performance and emotional well-beingthan DHA-TG [9]. This might be attributed to itsspecial molecular form including both DHA andphosphatidylcholine (PC). However, the source ofDHA-PC is relatively limited compared to DHA-TG,so we expected that whether recombination of DHA-TG with normal PC (not containing any DHA) couldbe a substitution of DHA-PC on DHA accumulationin tissues. Interestingly, DHA-PC containing onemolar of DHA (sn-2) and one molar of PC could behydrolyzed into sn-2-lysoPC and free DHA by pancre-atic phospholipase A2 in intestine. In addition, trigly-ceride enriched with high levels of DHA waspredominantly hydrolyzed into sn-2-monoacylglyceroland free DHA, and ordinary PC was hydrolyzed to
sn-2-lysoPC in the intestinal lumen [12].When re-esterification of absorbed fatty acids in erythrocytewas governed by pure availability of compounds, weexpected that the recombination of DHA-TG and or-dinary PL (not containing any DHA) could have thesame effect as intaking DHA-PC on DHA supplemen-tation. Egg PC is an economical and widely appliedfunctional food supplement, which is rich in saturatedfatty acids and monounsaturated fatty acids. α-glycerylphosphorylcholine (α-GPC) is water solublefor its special chemical form with one molecule ofcholine. The different chemical structure of PC mightinfluence the DHA supplement.Therefore, the present work was investigated to
comparatively analyze the effects of DHA- PC andrecombination of DHA-TG with egg PC or α-GPCon DHA repletion by weaning n-3 deficient micemodel. The results of this study could provide ameaningful reference to improve n-3 PUFAs defi-ciency by dietary DHA supplement during childhood.
MethodsPreparation of DHA-TG and DHA-PCDHA-PC was separated following the methods aspreviously performed [13]. Briefly, total lipids wereextracted from squid roe (S. oualaniensis) and thenmixed with one-fifth volume of 0.15 M NaCl solu-tion. The mixture was placed into a separatory funneland kept for 24 h to completely clear the bottom(chloroform) phase. The chloroform solution wasevaporated to dryness under vacuum. Then phospho-lipids were separated from neutral lipids and glyco-lipids by silica-gel column chromatography usingsequentially chloroform, acetone, and methanol aseluents. The methanol eluent was collected andDHA-PC was obtained after removal of organic solv-ent under vacuum. The purity of DHA-PC was con-firmed according to the HPLC-ELSD analysis (purity>90%). The fatty acid (FA) composition of the DHA-TG, DHA-PC and egg PC was given in Table 1. Diet-ary α-GPC (purity >99%), egg PC (purity >95%) andDHA-TG were obtained from Tianjin Bodi ChemicalCo., Ltd. (Tianjin, China), Suzhou Fushilai Pharma-ceutical Co., Ltd. (Suzhou, China) and Weihai BoowFoods Co., Ltd. (Weihai, China), respectively.
Animals and dietsAll aspects of the animal experiment were carried out inFood Science and Human Health Laboratory of OceanUniversity of China (Qingdao, P. R. China) and conductedaccording to guidelines provided by the Ethical Committeeof the University (Approval No.: SPXY2015012). The studydesign was depicted in Fig. 1. Female ICR strain mice aged7 weeks were purchased from Vital River (Beijing, China)
Wu et al. Lipids in Health and Disease (2017) 16:234 Page 2 of 12

on the second day after conception and immediately ran-domized into n-3 adequate or n-3 deficient groups, whichwere fed with n-3 adequate or n-3 deficient diets duringpregnancy, respectively. On the first postnatal day,pups were adjusted to 8 per dam and the dams werecontinually fed with their assigned diets during lacta-tion. All pups were weaned on the 21st postnatalday. The n-3 deficient pups were randomly assignedto four groups as follows: n-3 deficient (n-3 Def )group fed with n-3 deficient diet; DHA-PC groupfed with n-3 deficient diet including DHA-PC; DHA-TG + PC group fed with n-3 deficient diet includingDHA-TG and egg PC; DHA-TG + α-GPC group fedwith n-3 deficient diet including DHA-TG and α-GPC. In addition, the n-3 adequate pups fed with n-3 adequate diet were served as the reference point.The mice were maintained in individual cages undera 12-h light/dark cycle at 23 °C with a 60 ± 10% rela-tive humidity and provided with food and water ad
libitum. The basal diets were prepared according tothe AIN-93G growth diet and the fatty acid concen-tration of all diets were summarized in Table 2. TheDHA-supplemented diets comprised equal content ofDHA+ EPA at a dose of 5% of total fatty acid. And thecontent of PC was adjusted to equimolar ratio ofDHA to PC in different DHA-containing diets. Thediets were stored at −20 °C and fresh supplies weregiven to the mice every day. Mice were sacrificed bydecapitation after 12-h fast either at weaning or after2, 4, 7 and 14 days postweaning.Erythrocytes were obtained from trunk blood by
centrifugation and washed with phosphate-bufferedsaline. The cerebral cortex was separated from thewhole brain on ice and weighed. The liver and testisfrom each pup were dissected out and weighed imme-diately before snap frozen in liquid nitrogen and thenstored at −80 °C until further use. Body weights andfood intake were recorded every day throughout theexperimental period.
Fatty acid analysisTotal lipids were extracted from samples with a mix-ture of pentadecanoic acid (15:0) as an internalstandard according to the Folch method [14]. Thesamples with internal standard were extracted bychloroform/methanol (2:1, v/v). The lipid extract wasevaporated to dryness under nitrogen flux for ana-lysis of fatty acid composition. The total lipids fromliver were separated by thin layer chromatographywith a mobile phase of petroleum ether: diethylether: acetic acid (82:18:1, v/v/v) as previous study[15]. The hepatic phospholipids and triglycerideswere scraped off the plate and the obtained lipidswere transmethylated to fatty acid methyl esters(FAMEs) with HCl/methanol by shaking at 90 °C for3 h. The derivatives were extracted by hexane forfatty acids analysis using standard mixture containing28 kinds of components to identify the retentiontimes. FAMEs were analyzed by an Agilent 6890 gaschromatograph equipped with aflame-ionization
Table 1 Fatty acid composition of DHA-TG, DHA-PC and egg-PC
Main fatty acids (%) DHA-TG DHA-PC Egg PC
16:0 0.59 17.51 36.2
18:0 0.34 9.09 12.5
18:1n-9 0.25 8.15 28.9
18:2n-6 0.68 0.28 16.1
18:3n-3 0.42 0.24 0.16
20:1n-9 0.27 9.68 0.18
20:4n-6 0.43 2.78 4.3
20:5n-3 7.82 8.94 nd
22:6n-3 72.56 39.89 0.7
SFAs 12.43 27.77 48.95
MUFAs 5.34 18.82 29.37
N6 1.65 4.28 20.72
N3 80.58 49.13 0.96
nd: trace (< 0.05% of fatty acids)SFA saturated fatty acid, MUFA monounsaturated fatty acid, PUFApolyunsaturated fatty acid, N-6 n-6 polyunsaturated fatty acids, N-3 n-3polyunsaturated fatty acids
Fig. 1 Flow schematic depiction of study design. The dams were sacrificed by decapitation and tissues were collected at days 0, 2, 4, 7, 14 afterweaning for fatty acid composition analysis by gas chromatography
Wu et al. Lipids in Health and Disease (2017) 16:234 Page 3 of 12

detector and an HPINNOW-AX capillary column(30 m × 0.32 mm × 0.25 μm). The detector andinjector temperatures were kept at 250 °C and 240 °C, respectively. The oven temperature was increasedfrom 170 °C to 240 °C at 3 °C/min and then held at240 °C for 15 min. Nitrogen was used as the carriergas at the flow rate of 1.2 mL/min.
Statistical analysisData were expressed as the mean ± the standarderror of the mean (SEM). All the statistical testswere performed with SPSS 18.0 and Figures weremade by Graphpad Prism 13.0. Student’s t test wasused to compare means between n-3 Def and n-3
Adq groups at 3 weeks of age. Differences betweenall dietary groups after 3 weeks of age were analyzedby one-way ANOVA. The difference was consideredstatistically significant when p < 0.05.
Results and discussionTime course of fatty acids alteration in cerebral cortexPrevious clinical and preclinical studies suggestedthat the early postnatal period was a critical intervalwhen insufficient ingestion of n-3 PUFAs might bevery detrimental [16]. During this period, particularaspects of neurodevelopment were continuing [17]and the impact of lower n-3 PUFA level was corre-lated with a greater number of further learning andbehavior problems [18]. Therefore, a rapid and effi-cient recovery of DHA in developing brain was im-portant for optimal function, so we studied the DHAaccumulation kinetics in weaning n-3 deficient micesupplemented with different forms of DHA.There were no significant differences observed in
food intake, body and tissues weight among allgroups during this experiment (data not shown).Interestingly, the initial DHA content in the brain ofweaning pups was 14.3% of total fatty acids in n-3Adq group, but only 7.5% in n-3 Def group, repre-senting a decrease of 47.5% (Fig. 2a; Table 3). Asseen in Fig. 2a, the present results also showed arapid DHA recovery in cerebral cortex, especially then-3 deficient weaning mice was capable of restoringDHA to the level of the n-3 adequate mice withintwo weeks by DHA supplementation. All groupsincluding DHA-PC, DHA-TG + PC and DHA-TG+ α-GPC exhibited a slight increase of DHA contentat 4 post-weaning days but a substantially greatamount relative to the n-3 Def group from 4 to7 days, rising to 12.2, 11.9 and 12.7%, respectively.After 2 weeks, the DHA levels in DHA-PC (16.5%)and DHA-TG + α-GPC (16.1%) groups displayed con-siderable recovery and nearly reached that of n-3Adq group (16.2%), which were significantly higherthan the DHA-TG + PC group (14.7%). Moreover, theDHA contents of n-3 Def and n-3 Adq groups wereonly marginally increased within two weeks (n-3 Defgroup: 7.5–8.1%; n-3 Adq group: 14.3–16.2%). Acontinually rapid decline in brain DPA was observedin the three DHA-supplemented groups over thesubsequent 2 weeks (Fig. 2b; Table 2). The DPAlevels of DHA-PC, DHA-TG + PC and DHA-TG + α-GPC groups significantly decreased by 61.3, 62.3 and57.4% compared to n-3 Def group. The brain DTAand AA patterns for the five dietary groups werequite similar to that of DPA (Fig. 2c and d; Table 3).Compared with n-3 Adq group, the content of DTAand AA in n-3 Def group increased by 55.1 and
Table 2 Ingredient and fatty acid compositions of experimentaldiets
Amount (g/100 g diet)
n-3 Adq n-3 Def DHA-PC DHA-TG + PC DHA-TG + α-GPC
Casein,vitamin free
20 20 20 20 20
Sucrose 10 10 10 10 10
Cornstarch 39.749 39.749 39.749 39.749 39.749
Maltose-dextrin 13.2 13.2 13.2 13.2 13.2
Cellulose 5 5 5 5 5
Mineral-saltmix
3.5 3.5 3.5 3.5 3.5
Vitamin mix 1 1 1 1 1
L-Cystine 0.3 0.3 0.3 0.3 0.3
Choline bitartrate 0.25 0.25 0.25 0.25 0.25
TBHQ 0.002 0.002 0.002 0.002 0.002
Fat
Hydrogenatedcoconut oil
5.33 5.59 4.22 3.88 4.56
Safflower oil 1.33 1.41 1.41 1.41 1.41
Flaxseed oil 0.34 0 0 0 0
DHA-PC 0 0 1.37 0 0
DHA-TG 0 0 0 0.63 0.63
Egg-PC 0 0 0 1.08 0
α-GPC 0 0 0 0 0.40
Fatty acidcomposition (%)
SFAs 73.01 79.79 71.33 70.1 72.7
MUFAs 3.94 3.36 5.61 4.65 4.77
18:2n-6 15.16 14.83 14.51 14.45 14.69
18:3n-3 2.97 0.08 0.1 0.13 0.16
20:4n-6 nd nd nd nd nd
20:5n-3 nd nd 1.58 0.43 0.54
22:6n-3 nd nd 4.18 5.31 5.16
N-6/ N-3 5.10 185.38 2.52 2.52 2.58
nd: trace (< 0.05% of fatty acids)TBHQ tertiary butylhydroquinone, SFA saturated fatty acid, MUFAmonounsaturated fatty acid, PUFA polyunsaturated fatty acid, N-6 n-6polyunsaturated fatty acids, N-3 n-3 polyunsaturated fatty acids
Wu et al. Lipids in Health and Disease (2017) 16:234 Page 4 of 12

14.7% at the weaning day. The AA concentration inthe three DHA-containing (DHA-PC, DHA-TG + PCand DHA-TG + α-GPC) mice exhibited a contiguousdecline to 9.32, 9.17 and 8.31%, respectively, afterDHA supplementation for 4 days. Kitson et al.showed that the DHA content of brain in adult n-3deficient rat could increase to the normal level after4 weeks of DHA supplementation [19]. The timecourses for the DHA recovery of brain also indicatedthat the mice required 8 weeks to reach the n-3adequate level after dietary supplementation of ALAin n-3 deficient mice at 7 weeks of old [20]. Inter-estingly, the data in present study showed a fasterDHA recovery (only 2 weeks required) in the n-3deficient weaning mice, which was possible that theactivity of desaturase enzymes in the young animalswas much higher than mature animals [21].The fatty acid composition analysis of brain
showed that there were no significant differences inthe total saturated fatty acids, monounsaturatedfatty acids and PUFAs among all dietary groups,which was consistent with the previous results [6](Table 3). The ratios of n-6 / n-3 PUFAs of n-3
Adq group (1.05) was significantly lower than thatof n-3 Def group (2.88). The ratios of n-6 / n-3PUFAs in DHA-containing groups exhibited a con-siderable ecovery after dietary DHA supplementa-tion and reached the normal level by the end ofexperiment (Table 3). The present results showedthat the DHA content of brain was substituted byn-6 PUFAs were likely due to the competitionbetween the n-3 and n-6 families for elongation anddesaturation enzymes [22].
Time course of PUFAs alteration in hepatic phospholipidsand triglyceridesThe liver was the most rapidly recovery of all tissuesexamined in this study. The initial DHA values inhepatic PL and TG of n-3 deficient mice were sig-nificantly decreased by 73.3 and 89.3%, respectively,compared to n-3 Adq group (Fig. 3a and e). TheDHA levels in hepatic TG and PL had fully recov-ered to the normal values when the n-3 Def micewere supplied with the three DHA-containing dietsfor two days. There were continually marked in-crease of DHA levels in hepatic PL and TG after
Fig. 2 Time course curves of DHA (a), DPA (b), AA(c), DTA(d) in cerebral cortex after dietary DHA supplementation from 0 to 14 days. Datas atvarious time points are given as mean percent ± SEM (n = 5 mice per time point). ** p < 0.01, significant difference compared to the n-3 Adqgroup at 3 weeks of age determined by Student’s t-test. Different letters indicate significant difference at p < 0.05 among all dietary groups after3 weeks of age
Wu et al. Lipids in Health and Disease (2017) 16:234 Page 5 of 12

DHA supplementation for 4 days. Interestingly,DHA-TG + PC (21.5%) and DHA-TG+ α-GPC (20.24%)groups had higher DHA levels than that of DHA-PCgroup in hepatic PL (17.3%) (Fig. 3a). For liver TG, theDHA concentration of DHA-PC group (2.46%) was alsosignificantly lower than those of DHA-TG+ PC (3.49%)and DHA-TG+ α-GPC (3.61%) groups (P < 0.05) (Fig. 3e).Previous results found that the ester specific differ-ences were observed only in the livers of normal 10-week-old rats, where the labeled 4C-DHA-PL deliv-ered a 2-fold and 1.5-fold higher accretion of radio-activity compared with 14C-DHA-TG and 14C-DHA-TG + PL, respectively [23]. It was possible that theefficiency of DHA repletion might be influenced bydevelopmental stage of tissue and the initial nutri-tional status [24]. Compared with the normal adultrats, the mice used in present study were weaningn-3 deficient pups which still in developmental stageand required a mass of n-3 PUFAs to satisfy normalgrowth. Therefore, we hypothesized that the decreas-ing DHA accumulation in liver might be beneficialto the availability of DHA for other tissues [11].Accompanying the loss of DHA, the initial DPA levels in
hepatic PL and TG of n-3 Def group were significantly
increased by 3.7 and 3.6 folds compared with n-3 Adqgroup (Fig. 3c and g). After 4 days of DHA supplementa-tion, the DPA content in hepatic PL of DHA-supplemented groups decreased rapidly to nearly 0.5%.And the DPA content in hepetic TG of mice supplied withDHA-PC, DHA-TG+ PC and DHA-TG+ α-GPC de-creased dramatically to 1.11, 0.78 and 0.87%, respectively.In hepatic PL and TG, the AA and DTA levels in n-3 Adqgroup were significantly lower than those in n-3 Def group.In hepatic PL, the concentration of AA in DHA-
PC, DHA-TG + PC and DHA-TG + α-GPC groupssignificantly fell from 17 to 8.32%, 7.84%, 7.91%,respectively after 4 days DHA supplementation(Fig. 3c). The AA values in liver TG drastically de-creased from 3.26 to 0.45%, 0.61 and 0.42%, respect-ively after DHA supplementation with DHA-PC,DHA-TG + PC and DHA-TG + α-GPC for 4 days(Fig. 3g). The hepatic DTA pattern for all DHA-supplemented groups was quite similar to that ofAA (Fig. 3d and h).
Time course of PUFAs alteration in erythrocyteThe phospholipids have been observed to be cleavedoff into lysophospholipids and free fatty acids by
Table 3 Brain fatty acid composition
Fattyacid (%)
0 day after weaning 4 days after weaning 7 days after weaning
n-3 Adq n-3 Def n-3 Adq n-3 Def DHA-PC DHA-TG + PC DHA-TG + α-GPC n-3 Adq n-3 Def
14:0 0.55 ± .0.04 0.61 ± 0.04 0.63 ± 0.03 0.65 ± 0.04 0.69 ± 0.03 0.60 ± 0.04 0.61 ± 0.03 0.49 ± 0.01 0.44 ± 0.06
16:0 22.26 ± 0.27 22.54 ± 0.16 21.23 ± 0.40 21.52 ± 0.30 21.07 ± 0.25 21.48 ± 0.18 21.86 ± 0.17 21.17 ± 0.28 21.09 ± 0.21
18:0 20.53 ± 0.22 19.95 ± 0.23 19.51 ± 0.31 19.32 ± 0.29 20.06 ± 0.25 19.42 ± 0.25 19.59 ± 0.19 19.38 ± 0.18 19.51 ± 0.21
SFAs 47.84 ± 0.46 47.42 ± 0.36 47.63 ± 0.36 47.48 ± 0.47 48.14 ± 0.40 47.57 ± 0.54 47.35 ± 0.36 46.55 ± 0.44 46.34 ± 0.33
16:1n-7 1.32 ± 0.09 1.01 ± 0.12 1.35 ± 0.08 1.21 ± 0.08 1.37 ± 0.09 1.26 ± 0.07 1.37 ± 0.06 1.27 ± 0.03 1.24 ± 0.05
18:1n-9 14.34 ± 0.24 13.04 ± 0.33 14.96 ± 0.39 14.76 ± 0.27 15.36 ± 0.20 14.75 ± 0.25 14.89 ± 0.23 15.16 ± 0.19 14.98 ± 0.19
18:1n-7 2.78 ± 0.18 2.89 ± 0.14 2.68 ± 0.15 2.74 ± 0.13 2.69 ± 0.14 2.61 ± 0.11 2.53 ± 0.09 2.55 ± 0.19 2.49 ± 0.16
MUFAs 22.20 ± 0.47 20.76 ± 0.48 21.86 ± 0.29 21.55 ± 0.33 22.31 ± 0.23 22.51 ± 0.18 22.59 ± 0.22 22.54 ± 0.33 22.86 ± 0.31
18:2n-6 0.35 ± 0.02 0.46 ± 0.03* 0.42 ± 0.03a 0.54 ± 0.03b 0.61 ± 0.02c 0.58 ± 0.01bc 0.53 ± 0.02b 0.49 ± 0.03 0.52 ± 0.02
20:4n-6 10.19 ± 0.20 11.97 ± 0.27** 10.20 ± 0.16a 11.72 ± 0.17b 10.34 ± 0.18a 10.17 ± 0.16a 10.14 ± 0.14a 10.04 ± 0.21a 11.70 ± 0.25b
22:4n-6 2.13 ± 0.16 3.32 ± 0.25** 2.22 ± 0.08a 3.12 ± 0.05c 2.80 ± 0.11b 22.92 ± 0.07bc 3.02 ± 0.06bc 2.30 ± 0.11a 3.05 ± 0.12b
22:5n-6 1.40 ± 0.15 7.20 ± 0.19** 1.30 ± 0.07a 7.01 ± 0.12d 4.84 ± 0.09b 5.55 ± 0.11c 5.30 ± 0.07c 1.21 ± 0.12a 6.57 ± 0.19c
N-6 15.37 ± 0.25 23.75 ± 0.27** 15.04 ± 0.15a 23.31 ± 0.19c 19.58 ± 0.24b 20.01 ± 0.35b 19.74 ± 0.17b 14.79 ± 0.33a 22.89 ± 0.18d
22:6n-3 14.30 ± 0.15 7.50 ± 0.16** 15.01 ± 0.17c 7.60 ± 0.15a 9.31 ± 0.19b 9.50 ± 0.15b 9.82 ± 0.24b 15.54 ± 0.25d 7.79 ± 0.18a
N-3 14.50 ± 0.23 8.07 ± 0.19** 15.49 ± 0.19c 7.75 ± 0.16a 9.97 ± 0.18b 9.91 ± 0.19b 10.32 ± 0.18b 16.12 ± 0.23d 7.91 ± 0.22a
PUFAs 29.96 ± 0.63 31.82 ± 0.65 30.51 ± 0.43 31.06 ± 0.51 29.55 ± 0.73 29.92 ± 0.50 30.06 ± 0.39 30.91 ± 0.56 30.80 ± 0.39
N-6/ N-3 1.06 ± 0.02 2.94 ± 0.04** 0.97 ± 0.01a 3.02 ± 0.07c 1.96 ± 0.04b 2.01 ± 0.03b 1.91 ± 0.04b 0.92 ± 0.01a 2.89 ± 0.07d
Total 100.00 100.00 100.00 100.00 100.00 100.00 100.00 100 100
Only major Fatty acid methyl esters were presented; thus they do not add up to 100%. EPA (20:5n-3) were not detected (<0.01%, trace). Each parameter waspresented as the mean ± SEM (n = 6). * p < 0.05, ** p < 0.01, significant difference compared to the n-3 Adq group at 3 weeks of age determined by Student’s t-test.Different letters indicate significant difference at p < 0.05 among all dietary groups after 3 weeks of ageSFA saturated fatty acid, MUFA monounsaturated fatty acid,PUFA polyunsaturated fatty acid, N-6 n-6 polyunsaturated fatty acids, N-3 n-3 polyunsaturated fatty acids
Wu et al. Lipids in Health and Disease (2017) 16:234 Page 6 of 12

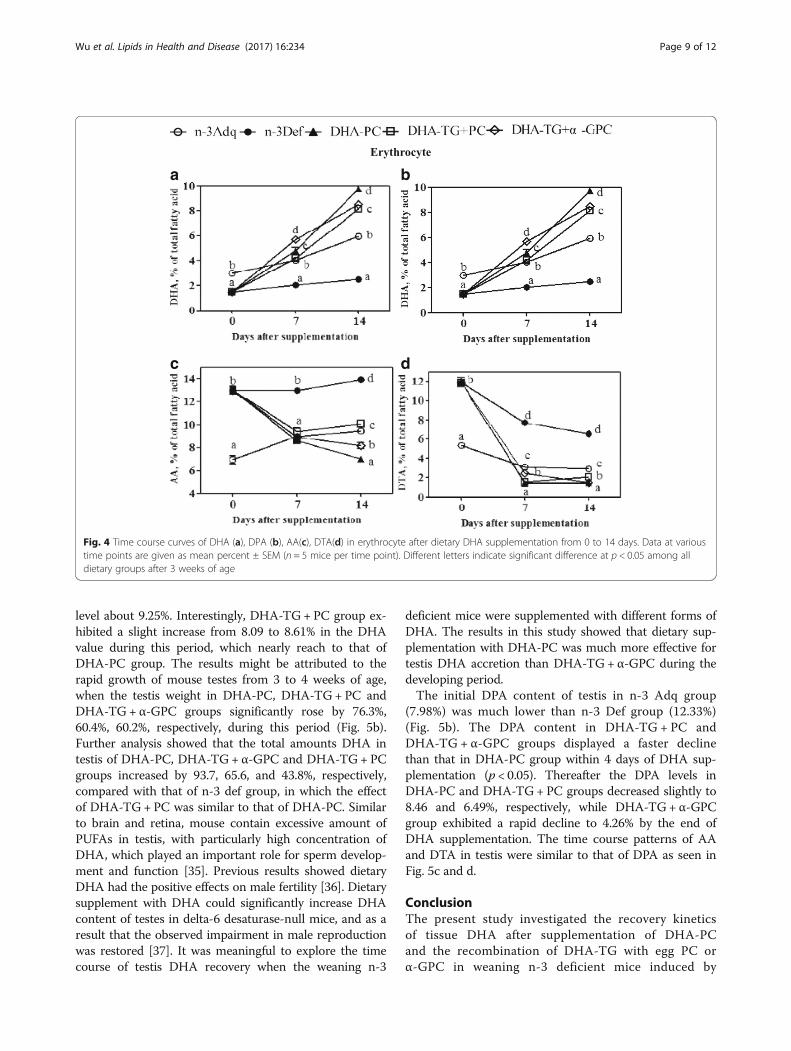
phospholipase A2 mediated partial hydrolysis [25]. Previ-ous reports showed that lyso-DHA-PC combined withalbumin was the main source of DHA for theerythrocyte using fatty acid labeled with 13C [26]. Inerythrocytes, the DHA concentration was significantlylower in n-3 Def group (1.5%) compared to n-3 Adqgroup (3%), indicating a decrease of 50% at 3 weeksof old (Fig. 4a). Then the DHA value in n-3 Defgroup rose very slowly to 2.3% over the course of ex-periment. When the n-3 Def group was supplied withDHA-PC, DHA-TG+ PC, DHA-TG+ α-GPC during thefirst week, the DHA content increased rapidly to 4.75, 4.2and 5.63%, respectively, with a completely recovery com-pared to n-3 Adq group (4.03%). Then the DHA-TG+ PCand DHA-TG + α-GPC groups exhibited a relative in-crease of DHA level to 8.12 and 8.5% after 2 weeks of sup-plementation. A faster ascent of DHA from 4.2 to 9.73%was noticed in DHA-PC group. One possible explanationof these results was that a portion of phospholipids mightbe directly absorbed without phospholipase A2 partialhydrolysis [27]. Ingestion of DHA-PC could increaseerythrocyte DHA more effectively compared with DHA-TG [11]. Although the n-3 deficient mice were supple-mented with equimolar PC in the three DHA-containinggroups, the lyso-DHA-PC concentration in blood ofDHA-TG + PC and DHA-TG + α-GPC groups might beless than that in DHA-PC group.
Moreover, DHA in the chemical form of lysopho-sphatidylcholine was uptake to brain by the primarytransporter named MFSD2a across the blood-brainbarrier [28, 29], and lyso-DHA-PC represented themajor part of DHA supplementation in erythrocyte[30]. A previous study indicated that the DHA levelof erythrocyte could been taken as a marker ofDHA accumulation in brain during the circulatinglife span [31]. As seen in this paper, we found asimilar time course of DHA reversal in erythrocyteand brain, in which the DHA concentration in DHA-PCgroup was significantly higher than the other DHA-supplemented groups.The erythrocyte AA content in n-3 Adq pups
(6.93%) was much lower than that of n-3 Def pups(13%, Fig. 4c). The DHA-supplemented groupsexhibited a considerable decline of AA after DHAsupplementation for 1 week, which nearly reachedthe level of n-3 Adq group (9%). Then the AA valuesin DHA-PC and DHA-TG + α-GPC groups decreasedgradually to 7 and 8.1% while the DHA-TG + PCgroup rose slightly to 10% after 2 weeks of repletion.For n-3 Adq group, there was a gradual but continu-ous increment to 9.48% for AA concentration overthe experiment. The initial DPA and DTA levels inn-3 Def groups were significantly higher than that ofn-3 Adq group and recovered with a time course
Table 3 Brain fatty acid composition (Continued)
Fattyacid (%)
7 days after weaning 14 days after weaning
DHA-PC DHA-TG + PC DHA-TG + α-GPC n-3 Adq n-3 Def DHA-PC DHA-TG + PC DHA-TG + α-GPC
14:0 0.45 ± 0.03 0.52 ± 0.03 0.56 ± 0.03 0.70 ± 0.03 0.76 ± 0.02 0.66 ± 0.03 0.66 ± 0.04 0.74 ± 0.05
16:0 20.89 ± 0.17 21.13 ± 0.31 21.54 ± 0.15 20.28 ± 0.31 20.34 ± 0.27 20.41 ± 0.21 20.55 ± 0.23 20.73 ± 0.31
18:0 19.64 ± 0.27 19.84 ± 0.20 19.88 ± 0.23 19.17 ± 0.25 19.35 ± 0.31 19.37 ± 0.22 19.72 ± 0.23 19.61 ± 0.28
SFAs 46.69 ± 0.25 46.13 ± 0.27 45.84 ± 0.39 45.79 ± 0.36 45.92 ± 0.44 45.65 ± 0.25 46.69 ± 0.27 45.69 ± 0.25
16:1n-7 1.44 ± 0.04 1.29 ± 0.10 1.26 ± 0.08 1.38 ± 0.07 1.27 ± 0.05 1.34 ± 0.02 1.34 ± 0.05 1.27 ± 0.01
18:1n-9 15.57 ± 0.28 15.01 ± 0.18 15.08 ± 0.13 15.32 ± 0.32 15.48 ± 0.17 15.96 ± 0.26 15.97 ± 0.18 15.41 ± 0.31
18:1n-7 2.41 ± 0.14 2.82 ± 0.10 2.44 ± 0.14 2.57 ± 0.17 2.35 ± 0.06 2.49 ± 0.11 2.68 ± 0.06 2.53 ± 0.08
MUFAs 22.43 ± 0.27 22.50 ± 0.20 22.58 ± 0.30 22.76 ± 0.30 23.37 ± 0.39 23.07 ± 0.19 23.78 ± 0.27 23.39 ± 0.31
18:2n-6 0.56 ± 0.03 0.54 ± 0.02 0.51 ± 0.02 0.57 ± 0.02 0.89 ± 0.03 0.42 ± 0.03 0.46 ± 0.02 0.39 ± 0.02
20:4n-6 10.01 ± 0.14a 9.96 ± 0.27a 9.97 ± 0.11a 10.35 ± 0.09c 11.45 ± 0.09d 9.32 ± 0.10b 9.17 ± 0.11b 8.81 ± 0.10a
22:4n-6 2.53 ± 0.24a 2.58 ± 0.07a 2.42 ± 0.09a 2.02 ± 0.08b 3.13 ± 0.07c 1.79 ± 0.06ab 1.86 ± 0.08ab 1.73 ± 0.08a
22:5n-6 4.19 ± 0.17b 4.39 ± 0.18b 4.44 ± 0.14b 1.19 ± 0.07a 6.31 ± 0.12c 2.44 ± 0.11b 2.38 ± 0.13b 2.69 ± 0.09b
N-6 18.01 ± 0.31b 18.97 ± 0.32bc 18.31 ± 0.21ab 14.63 ± 0.46a 22.77 ± 0.69b 14.05 ± 0.39a 14.31 ± 0.43a 14.17 ± 0.26a
22:6n-3 12.21 ± 0.21bc 11.90 ± 0.19b 12.70 ± 0.20c 16.20 ± 0.15c 8.10 ± 0.09a 16.51 ± 0.09c 14.72 ± 0.12b 16.12 ± 0.14c
N-3 12.87 ± 0.12bc 12.40 ± 0.23b 13.27 ± 0.15c 16.82 ± 0.15c 8.26 ± 0.12a 17.23 ± 0.13c 15.22 ± 0.14b 16.75 ± 0.19c
PUFAs 30.88 ± 0.43 31.37 ± 0.55 31.58 ± 0.36 31.45 ± 0.47 31.03 ± 0.77 31.28 ± 0.38 29.53 ± 0.45 30.92 ± 0.36
N-6/ N-3 1.40 ± 0.01b 1.53 ± 0.01c 1.38 ± 0.01b 0.87 ± 0.03b 2.76 ± 0.07a 0.82 ± 0.03b 0.94 ± 0.03b 0.85 ± 0.02b
Total 100 100 100 100 100 100 100 100
Wu et al. Lipids in Health and Disease (2017) 16:234 Page 7 of 12

similar to that of AA after DHA supplementation(Fig. 4b and d). As previous studies, the n-6 PUFAscontent of erythrocyte in n-3 deficient mice would besubstitited by DHA after dietary DHA supplementa-tion [32].
Time course of PUFAs alteration in testisTestis fatty acid profiles could be influenced by diet-ary fat and sensitive to n-3 PUFAs [33]. In mice,high levels of DHA, AA, DPA were observed inmembrane phospholipids of round spermatids and
mature mouse spermatozoa, which suggested animportant role for proper spermatogenesis [34]. Inthis study, the testis DHA concentration in n-3 Defgroup reduced by 66.2% (p < 0.05) compared to n-3Adq group (8.22%) at the weaning day (Fig. 5a). TheDHA levels in dietary DHA-containing groupsshowed an obvious and continuous increment from0 to 7 days after weaning. Thereafter, the DHA con-tent in DHA-TG + α-GPC group exhibited a relativedecrease from 8.33 to 6.62% from 1 to 2 weeks of DHAsupplementation, and DHA-PC group remained the DHA
Fig. 3 Variation in DHA (a), DPA (b), AA (c), DTA (d) in hepatic phosphplipids and DHA (e), DPA (f), AA (g), DTA (h) in hepatic thracylglycerolsafter dietary DHA supplementation from 0 to 4 days. Each parameter is presented as the mean ± SEM (n = 6). ** p < 0.01, significant differencecompared to the n-3 Adq group at 3 weeks of age determined by Student’s t-test. Different letters indicate significant difference atp < 0.05 among all dietary groups after 3 weeks of age
Wu et al. Lipids in Health and Disease (2017) 16:234 Page 8 of 12
level about 9.25%. Interestingly, DHA-TG+ PC group ex-hibited a slight increase from 8.09 to 8.61% in the DHAvalue during this period, which nearly reach to that ofDHA-PC group. The results might be attributed to therapid growth of mouse testes from 3 to 4 weeks of age,when the testis weight in DHA-PC, DHA-TG+ PC andDHA-TG + α-GPC groups significantly rose by 76.3%,60.4%, 60.2%, respectively, during this period (Fig. 5b).Further analysis showed that the total amounts DHA intestis of DHA-PC, DHA-TG+ α-GPC and DHA-TG+ PCgroups increased by 93.7, 65.6, and 43.8%, respectively,compared with that of n-3 def group, in which the effectof DHA-TG+ PC was similar to that of DHA-PC. Similarto brain and retina, mouse contain excessive amount ofPUFAs in testis, with particularly high concentration ofDHA, which played an important role for sperm develop-ment and function [35]. Previous results showed dietaryDHA had the positive effects on male fertility [36]. Dietarysupplement with DHA could significantly increase DHAcontent of testes in delta-6 desaturase-null mice, and as aresult that the observed impairment in male reproductionwas restored [37]. It was meaningful to explore the timecourse of testis DHA recovery when the weaning n-3
deficient mice were supplemented with different forms ofDHA. The results in this study showed that dietary sup-plementation with DHA-PC was much more effective fortestis DHA accretion than DHA-TG+ α-GPC during thedeveloping period.The initial DPA content of testis in n-3 Adq group
(7.98%) was much lower than n-3 Def group (12.33%)(Fig. 5b). The DPA content in DHA-TG + PC andDHA-TG + α-GPC groups displayed a faster declinethan that in DHA-PC group within 4 days of DHA sup-plementation (p < 0.05). Thereafter the DPA levels inDHA-PC and DHA-TG+ PC groups decreased slightly to8.46 and 6.49%, respectively, while DHA-TG+ α-GPCgroup exhibited a rapid decline to 4.26% by the end ofDHA supplementation. The time course patterns of AAand DTA in testis were similar to that of DPA as seen inFig. 5c and d.
ConclusionThe present study investigated the recovery kineticsof tissue DHA after supplementation of DHA-PCand the recombination of DHA-TG with egg PC orα-GPC in weaning n-3 deficient mice induced by
Fig. 4 Time course curves of DHA (a), DPA (b), AA(c), DTA(d) in erythrocyte after dietary DHA supplementation from 0 to 14 days. Data at varioustime points are given as mean percent ± SEM (n = 5 mice per time point). Different letters indicate significant difference at p < 0.05 among alldietary groups after 3 weeks of age
Wu et al. Lipids in Health and Disease (2017) 16:234 Page 9 of 12

maternal dietary deprivation of ALA during preg-nancy and lactation. Results showed that dietaryDHA supplementation could rapidly recover the DHAconcentration of tissues in n-3 deficient mice during thechildhood, in which DHA-PC exhibited the optimal effi-cacy on DHA repletion. Interestingly, the hepatic DHAlevels of DHA-TG + PC and DHA-TG+ α-GPC groupswere significantly higher than that of DHA-PC group aftershort-term DHA supplementation for 4 days. In addition,DHA-TG + α-GPC exhibited the greater effect on DHAaccumulation than DHA-TG+ PC in cerebral cortex anderythrocyte, which was similar to DHA-PC. Conversely,DHA-TG + PC was more effective on DHA repletion
compared with DHA-TG+ α-GPC in testis. Therefore,DHA-PC could not be completely substituted by therecombination of DHA-TG and ordinary PC (notcontaining any DHA) for DHA supplementation.These findings could pave the way for dietary DHAsupplementation in n-3 deficiency conditions espe-cially during childhood, which could provide somereferences to develop functional foods to supportbrain development and function.
AbbreviationsAA: Arachidonic acid (20:4n6); ALA: a-linolenic acid (18:3n3);DHA: Docosahexaenoic acid (22:6n3); DPAn-6: Docosapentaenoic acid(22:5n6); DTA: Docosatetraenoic acid (22:4n6); n-3 Adq: n-3 adequate; n-3
Fig. 5 Time course curves of DHA, DPA, AA, DTA (a, d, e, f), the weight of testis (b) and total quantities of DHA (c) in testis after dietary DHAsupplementation from 0 to 14 days. Different letters indicate significant difference at p < 0.05 among all dietary groups after 3 weeks of age
Wu et al. Lipids in Health and Disease (2017) 16:234 Page 10 of 12

Def: n-3 deficient; PC: Phosphatidylcholine; PL: Phospholipid;PUFAs: Polyunsaturated fatty acids; TG: Triglyceride; α-GPC: α-Glycerylphosphorylcholine
FundingThis work was funded by the National Natural Science Foundation of China(No. 31371757), State Key Program of National Natural Science of China (No.31330060), National Natural Science Foundation of China-Shandong Joint Fundfor Marine Science Research Centers (U1606403) and Fundamental ResearchFunds for the Central Universities (No. 201762028).
Availability of data and materialsAll data generated or analyzed during the current study are available fromthe corresponding author on reasonable request.
Authors’ contributionsFW, YW and TZ conceived and designed the experiments; FW, DW, MW andHC performed the experiments; FW, DW, MW, YW and TZ analyzed the data;FW, DW, TY and CX contributed reagents/materials/analysis tools; FW wrotethe paper. All authors have read and approved the final manuscript.
Ethics approvalAnimal experiments described in our study were approved by the EthicalCommittee of Food Science and Human Health Laboratory of Ocean Universityof China.
Consent for publicationAll authors agree to publish this article in the journal of Lipids in Healthand Disease.
Competing interestsThe authors declare that they have no competing interests.
Publisher’s NoteSpringer Nature remains neutral with regard to jurisdictional claims inpublished maps and institutional affiliations.
Author details1College of Food Science and Engineering, Ocean University of China, No. 5Yushan Road, Qingdao 266003, China. 2Qingdao National Laboratory forMarine Science and Technology, Laboratory of Marine Drugs & BiologicalProducts, Qingdao, Shandong Province 266237, China. 3Institute ofBioPharmaceutical Research, Liaocheng University, Liaocheng 252059, China.4Laboratory of Nutrition Biochemistry, Department of Applied Biochemistryand Food Science, Saga University, Saga 840-8502, Japan.
Received: 14 November 2017 Accepted: 26 November 2017
References1. Brand A, Crawford MA, Yavin E. Retailoring docosahexaenoic acid-
containing phospholipid species during impaired neurogenesis followingomega-3 α-linolenic acid deprivation. J Neurochem. 2010;114:1393–404.
2. Jr DMJ, Ma K, Bell JM, Rapoport SI. Half-lives of docosahexaenoic acid in ratbrain phospholipids are prolonged by 15 weeks of nutritional deprivation ofn-3 polyunsaturated fatty acids. J Neurochem. 2004;91:1125.
3. Neuringer M, Connor WE, Bendich A. Infant vision and retinal function instudies of dietary long-chain polyunsaturated fatty acids: methods, results,and implications. Am J Clin Nutr. 2000;71:256S.
4. Denomme J, Stark KD, Holub BJ. Directly quantitated dietary (n-3) fatty acidintakes of pregnant Canadian women are lower than current dietaryrecommendations. J Nutr. 2005;135:206.
5. Mccann JC, Ames BN. Is docosahexaenoic acid, an n 3 long-chainpolyunsaturated fatty acid, required for development of normal brainfunction? An overview of evidence from co. Am J Clin Nutr. 2005;82:281–95.
6. Moriguchi T, Loewke J, Garrison M, Catalan JN, Salem N Jr. Reversal ofdocosahexaenoic acid deficiency in the rat brain, retina, liver, and serum. JLipid Res. 2001;42:419–27.
7. Schiefermeier M, Yavin E. n-3 Deficient and docosahexaenoic acid-enriched diets during critical periods of the developing prenatal ratbrain. J Lipid Res. 2002;43:124.
8. Hughes D, Bryan J. The assessment of cognitive performance in children:considerations for detecting nutritional influences. Nutr Rev. 2003;61:413.
9. He C, Qu X, Cui L, Wang J, Kang JX. Improved spatial learning performanceof fat-1 mice is associated with enhanced neurogenesis and neuritogenesisby docosahexaenoic acid. Proc Natl Acad Sci U S A. 2009;106:11370–5.
10. Ramprasath VR, Eyal I, Zchut S, Jones PJ. Enhanced increase of omega-3index in healthy individuals with response to 4-week n-3 fatty acidsupplementation from krill oil versus fish oil. Lipids Health Dis. 2013;12:178.
11. Liu L, Bartke N, Van DH, Lawrence P, Qin X, Park HG, Kothapalli K, WindustA, Bindels J, Wang Z. Higher efficacy of dietary DHA provided as aphospholipid than as a triglyceride for brain DHA accretion in neonatalpiglets. J Lipid Res. 2014;55:531.
12. Tsushima T, Ohkubo T, Onoyama K, Linder M, Takahashi K.Lysophosphatidylserine form DHA maybe the most effective as substrate forbrain DHA accretion. Biocatal Agric Biotechnol. 2014;3:303–9.
13. Wen M, Ding L, Zhang L, Zhou M, Xu J, Wang J, Wang Y, Xue C. DHA-PCand DHA-PS improved Aβ1-40 induced cognitive deficiency uncoupledwith an increase in brain DHA in rats. J Funct Foods. 2016;22:417–30.
14. Folch J, Lees M, Sloane Stanley GH. A simple method for the isolation andpurification of total lipides from animal tissues. J Biol Chem. 1957;226:497–509.
15. Ding N, Xue Y, Tang X, Sun ZM, Yanagita T, Xue CH, Wang YM. Short-term effectsof different fish oil formulations on tissue absorption of docosahexaenoic acid inmice fed high- and low-fat diets. J Oleo Sci. 2013;62:883.
16. Skinner MK, Manikkam M, Guerrero-Bosagna C. Epigenetic transgenerationalactions of environmental factors in disease etiology. Trends EndocrinolMetab. 2010;21:214–22.
17. Crews F, He J, Hodge C. Adolescent cortical development: a critical periodof vulnerability for addiction. Pharmacol Biochem Behav. 2007;86:189–99.
18. Robertson RC, Oriach CS, Murphy K, Moloney GM, Cryan JF, Dinan TG, PaulRR, Stanton C. Omega-3 polyunsaturated fatty acids critically regulatebehaviour and gut microbiota development in adolescence and adulthood.Brain Behav Immun. 2016;59:21.
19. Kitson AP, Metherel AH, Chen CT, Domenichiello AF, Trépanier MO, BergerA, Bazinet RP. Effect of dietary docosahexaenoic acid (DHA) inphospholipids or triglycerides on brain DHA uptake and accretion. J NutrBiochem. 2016;33:91.
20. Moriguchi T, Harauma A, Salem N Jr. Plasticity of mouse braindocosahexaenoic acid: modulation by diet and age. Lipids. 2013;48:343–55.
21. Bourre JM, Piciotti M. Delta-6 desaturation of alpha-linolenic acid inbrain and liver during development and aging in the mouse. NeurosciLett. 1992;141:65–8.
22. Brenner RR, Peluffo RO, Nervi AM, Tomas MED. Competitive effect of α- andγ-linolenyl-CoA and arachidonyl-CoA in linoleyl-CoA desaturation to γ-linolenyl-CoA. Biochim Biophys Acta, Lipids Lipid Metab. 1969;176:420–2.
23. Graf BA, Duchateau GSMJE, Patterson AB, Mitchell ES, Bruggen PV, Koek JH,Melville S, Verkade HJ. Age dependent incorporation of 14 C-DHA into ratbrain and body tissues after dosing various 14 C-DHA-esters. ProstaglandinsLeukot Essent Fatty Acids. 2010;83:89–96.
24. Harauma A, Salem N Jr, Moriguchi T. Repletion of n-3 fatty acid deficientdams with α-linolenic acid: effects on fetal brain and liver fatty acidcomposition. Lipids. 2010;45:659.
25. Porter CJ, Trevaskis NL, Charman WN. Lipids and lipid-based formulations:optimizing the oral delivery of lipophilic drugs. Nat Rev Drug Discov. 2007;6:231.
26. Brossard N, Croset M, Normand S, Pousin J, Lecerf J, Laville M, Tayot JL,Lagarde M. Human plasma albumin transports [13C]docosahexaenoic acidin two lipid forms to blood cells. J Lipid Res. 1997;38:1571.
27. Bloom B, Kiyasu JY, Reinhardt WO, Chaikoff IL. Absorption of phospholipides;manner of transport from intestinal lumen to lacteals. Am J Phys. 1954;177:84–6.
28. Nguyen LN, Ma D, Shui G, Wong P, Cazenavegassiot A, Zhang X, Wenk MR,Goh EL, Silver DL. Mfsd2a is a transporter for the essential omega-3 fattyacid docosahexaenoic acid. Nature. 2014;509:503–6.
29. Zhang TT, Li W, Meng G, Wang P, Liao W. Strategies for transportingnanoparticles across the blood-brain barrier. Biomater Sci. 2016;4:219.
30. Brossard N, Croset M, Lecerf J, Pachiaudi C, Normand S, Chirouze V, Macovschi O,Riou JP, Tayot JL, Lagarde M. Metabolic fate of an oral tracer dose of[13C]docosahexaenoic acid triglycerides in the rat. Am J Physiol. 1996;270:846–54.
31. Kuratko CN, Jr SN. Biomarkers of DHA status. Prostaglandins Leukot EssentFatty Acids. 2009;81:111.
32. Levant B, Ozias MK, Carlson SE. Diet (n-3) polyunsaturated fatty acid contentand parity affect liver and erythrocyte phospholipid fatty acid compositionin female rats. J Nutr. 2007;137:2425–30.
Wu et al. Lipids in Health and Disease (2017) 16:234 Page 11 of 12

33. Chanmugam PS, Boudreau MD, Hwang DH. Dietary (n-3) fatty acids alterfatty acid composition and prostaglandin synthesis in rat testis. J Nutr.1991;121:1173.
34. Rejraji H, Sion B, Prensier G, Carreras M, Motta C, Frenoux JM, Vericel E,Grizard G, Vernet P, Drevet JR. Lipid remodeling of murine epididymosomesand spermatozoa during epididymal maturation. Biol Reprod. 2006;74:1104.
35. Martínezsoto JC, Landeras J, Gadea J. Spermatozoa and seminal plasma fattyacids as predictors of cryopreservation success. Andrology. 2013;1:365–75.
36. Wathes DC, Abayasekara DRE, Aitken RJ. Polyunsaturated fatty acids in maleand female Reproduction1. Biol Reprod. 2007;77:190–201.
37. Roquetarivera M, Stroud CK, Haschek WM, Akare SJ, Segre M, Brush RS,Agbaga MP, Anderson RE, Hess RA, Nakamura MT. Docosahexaenoic acidsupplementation fully restores fertility and spermatogenesis in male delta-6desaturase-null mice. J Lipid Res. 2010;51:360–7.
• We accept pre-submission inquiries
• Our selector tool helps you to find the most relevant journal
• We provide round the clock customer support
• Convenient online submission
• Thorough peer review
• Inclusion in PubMed and all major indexing services
• Maximum visibility for your research
Submit your manuscript atwww.biomedcentral.com/submit
Submit your next manuscript to BioMed Central and we will help you at every step:
Wu et al. Lipids in Health and Disease (2017) 16:234 Page 12 of 12