· pdf filecontents company profile 1 ... petrochemical products based on the turnover in...
TRANSCRIPT

CONTENTS
Company Profile 1Principal Financial Data and Indicators 2Changes in Share Capital and Shareholdings of Principal Shareholders 9Chairman’s Statement 12Business Review and Prospects 17Health, Safety and Environment 41Management’s Discussion and Analysis 42Disclosure of Significant Events 56Connected Transactions 60Corporate Governance 64Summary of Shareholders’ Meetings 66Report of the Board of Directors 67Report of the Supervisory Committee 70Directors, Supervisors, Senior Management and Employees 72Principal Wholly-owned and Non Wholly-owned Subsidiaries 78Financial Accounting Report 80Corporate Information 150Documents for Inspection 152
This annual report includes “forward-looking statements”. All statements, other than statements of
historical facts, that address activities, events or developments that the Company expects or anticipates
will or may occur in the future (including but not limited to projections, targets, estimates and business
plans) are forward-looking statements. The Company’s actual results or developments may differ
materially from those indicated by these forward-looking statements as a result of various factors and
uncertainties. The Company makes the forward-looking statements referred to herein as at 28 March,
2003 and undertakes no obligation to update these statements.
1C
omp
any
Pro
file
COMPANY PROFILESinopec Corp. is the first company in Chinalisted in Hong Kong, New York, London andShanghai, and is also an integrated energy andchemical company with upstream, midstreamand downstream operations. The principaloperations of Sinopec Corp. and its subsidiaries(the “Company”) include :� exploring for and developing, producing and
trading petroleum and natural gas� processing petroleum into refined oil products,
producing refined oil products and trading,transporting, distributing and marketingrefined oil products
� producing, distributing and tradingpetrochemical products
Based on the turnover in 2002, Sinopec Corp. isthe largest listed company in China. TheCompany is also :
� one of the largest petroleum andpetrochemical companies in China and in Asia
� one of the largest producers and distributorsof gasoline, diesel, jet fuel and other majorrefined oil products in China and in Asia
� the second largest producer of petroleum andnatural gas in China
The Company’s competitive strengths are mainlyreflected in :
� its leading market position in the productionand sale of refined oil products
� its status as the largest petrochemicalproducer in China
� its strategic market position in China’s highesteconomic growth areas
� its well-established, highly efficient and costeffective sales and distribution network
� its integrated operation structure withstronger resistance against industry cyclicalrisks
� its well-recognized brand and excellentreputation
� its status as a primary choice for partnershipby multinational companies seekinginvestment in China
� its sound financial position, with the highestcredit rating for PRC enterprises — BBB creditrating by Standard & Poor
The Company has been focusing on capturingprofit growth and expanding opportunities,optimizing its capital allocation and investmentactivities, developing and effectively depolyingtechnologies and human resources, promotingthe efficient use of resources, seeking to
improve its overall competitiveness andstrengths and pursuing a higher return oncapital employed and sustained developmentand thereby increasing shareholders’ value andreturns. In the year to come, the Companystrives to achieve new breakthroughs inexpanding resources and markets, reducingcost, improving efficiency and disciplininginvestments. The Company works towards thegoal of becoming an integrated energy andpetrochemical company with outstanding corebusinesses, quality assets, innovativetechnologies, professional management,prudent financial practice and a competitivecompany in the global market.
1
2
3
4
1 Chemicals2 Marketing and Distribution3 Refining4 Exploration and Production
IMPORTANT: THE BOARD OF CHINA PETROLEUM & CHEMICAL CORPORATION (“SINOPEC CORP.”) AND ITS DIRECTORS WARRANTTHAT THERE ARE NO MATERIAL OMISSIONS FROM, OR MISREPRESENTATIONS OR MISLEADING STATEMENTS CONTAINED IN, THISREPORT, AND SEVERALLY AND JOINTLY ACCEPT FULL RESPONSIBILITY FOR THE AUTHENTICITY, ACCURACY AND COMPLETENESS OFTHE INFORMATION CONTAINED IN THIS REPORT. MR MOU SHULING, MR WANG YI, MR ZHANG ENZHAO, MR LIU GUOGUANG ANDMR HO TSU KWOK CHARLES, DIRECTORS OF SINOPEC CORP., COULD NOT ATTEND THE 31ST MEETING OF THE FIRST SESSION OFTHE BOARD FOR REASON OF OFFICIAL DUTIES, AND MR MOU SHULING AND MR ZHANG ENZHAO AUTHORISED MR CAO XIANGHONGAND MR WANG JIMING RESPECTIVELY TO VOTE ON THEIR BEHALF, AND MR WANG YI, MR LIU GUOGUANG AND MR HO TSU KWOKCHARLES AUTHORISED MR LI YIZHONG, CHAIRMAN OF THE BOARD, TO VOTE ON THEIR BEHALF, IN RESPECT OF THE RESOLUTIONS PUTFORWARD IN THE MEETING OF THE BOARD. MR LI YIZHONG, CHAIRMAN OF THE BOARD, MR WANG JIMING, PRESIDENT OF SINOPECCORP., MR ZHANG JIAREN, VICE PRESIDENT & CHIEF FINANCIAL OFFICER OF SINOPEC CORP. AND MR LIU YUN, HEAD OF THEACCOUNTING DIVISION OF SINOPEC CORP. HEREBY WARRANT THE AUTHENTICITY AND COMPLETENESS OF THE FINANCIALSTATEMENTS CONTAINED IN THIS ANNUAL REPORT.

PRINCIPAL FINANCIAL DATA AND INDICATORS
2P
rinc
ipal
Fin
anci
al D
ata
and
Ind
icat
ors
1 FINANCIAL DATA AND OPERATING DATA PREPARED IN ACCORDANCE WITH THE PRCACCOUNTING RULES AND REGULATIONS
(1) Summary of principal financial data and operating data of the Company for the year 2002
Profit before taxation and minority interests : RMB 22,012 millionNet profit : RMB 14,121 millionNet profit before non-operating profits/losses : RMB 14,999 millionProfit from principal operations : RMB 61,150 millionProfit from other operations : RMB 889 millionOperating profit : RMB 22,817 millionInvestment income : RMB 505 millionNet non-operating income/expenses : RMB -1,310 millionNet cash flow from operating activities : RMB 60,069 millionNet decrease in cash and cash equivalents : RMB 3,324 million
Non-operating profits/losses include non-operating income of RMB333 million and non-operating expenses of RMB1,643 million, and an adjustment of RMB432 million ofreduction in taxation for the above items.
(2) Principal financial data and indicators prepared in accordance with the PRC AccountingRules and Regulations
For the year ended 31 December2002 2001 2000
(Note) RMB millions RMB millions RMB millionsIncome from principal
operations 324,184 304,347 322,932Net profit 14,121 14,018 16,154Earnings per share (RMB)
Fully diluted (i) 0.163 0.162 0.193Weighted average (ii) 0.163 0.165 0.227
Net cash-flow from operatingactivities per share (RMB) 0.693 0.688 0.411
Return on net assets (%)Fully diluted (iii) 9.638 10.08 13.37Weighted average (iv) 9.723 10.61 16.29
At 31 December2002 2001 2000
RMB millions RMB millions RMB millionsTotal assets 368,375 360,294 340,918Shareholders’ funds
(excluding minority interests) 146,515 139,039 120,793Net assets per share (RMB) 1.690 1.604 1.440Adjusted net assets per share (RMB) 1.676 1.584 1.420

3P
rinc
ipal
Fin
anci
al D
ata
and
Ind
icat
ors
Notes:
(i) Fully diluted earnings per share = netprofit for the year / total number ofshares in issue at the end of the year
(ii) Weighted average earnings per share = netprofit for the year / (number of shares atthe beginning of the year + number ofshares increased due to the transfer fromreserves to capital or share dividenddispatched + (increase in number ofshares during the year due to issuance ofnew shares or the capitalization of debt xnumber of months from the monthfollowing the increase of shares to the endof the year / number of months in theyear) - (number of shares decreased dueto share repurchases or reduction in sharecapital x number of months from themonth following the decrease of shares tothe end of the year / number of monthsfor the year))
(iii) Fully diluted return on net assets basis =(net profit for the year / shareholders’equity at the end of the year) x 100%
(iv) Weighted average return on net assetsbasis = net profit for the year /((shareholders’ equity at the beginning ofthe year + net profit for the year / 2 +shareholders’ funds increased due toissuance of new shares or thecapitalization of debt during the year xnumber of months from the monthfollowing the increase of shareholders’funds to the end of the year / number ofmonths in the year) - (shareholders’ fundsdecreased due to share repurchases orcash dividends during the year x number ofmonths from the month following thedecrease of shareholders’ funds to the endof the year / number of months in theyear)) x 100%
(3) Appendix to income statement prepared in accordance with the PRC Accounting Rules andRegulations
For the year ended For the year ended31 December 2002 31 December 2001
Return on net assets Return on net assetsFully Weighted Fully Weighted
diluted average diluted averageProfit from principal operations 41.74% 42.10% 40.53% 42.63%Operation profit 15.57% 15.71% 17.15% 18.04%Net profit 9.64% 9.72% 10.08% 10.61%Net profit before non-operating
profits/losses 10.24% 10.33% 11.40% 11.99%
For the year ended For the year ended31 December 2002 31 December 2001Earnings per share Earnings per share
Fully Weighted Fully Weighteddiluted average diluted average
RMB RMB RMB RMBProfit from principal operations 0.705 0.705 0.650 0.662Operation profit 0.263 0.263 0.275 0.280Net profit 0.163 0.163 0.162 0.165Net profit before non-operating
profits/losses 0.173 0.173 0.183 0.186
PRINCIPAL FINANCIAL DATA AND INDICATORS (CONTINUED)
4P
rinc
ipal
Fin
anci
al D
ata
and
Ind
icat
ors
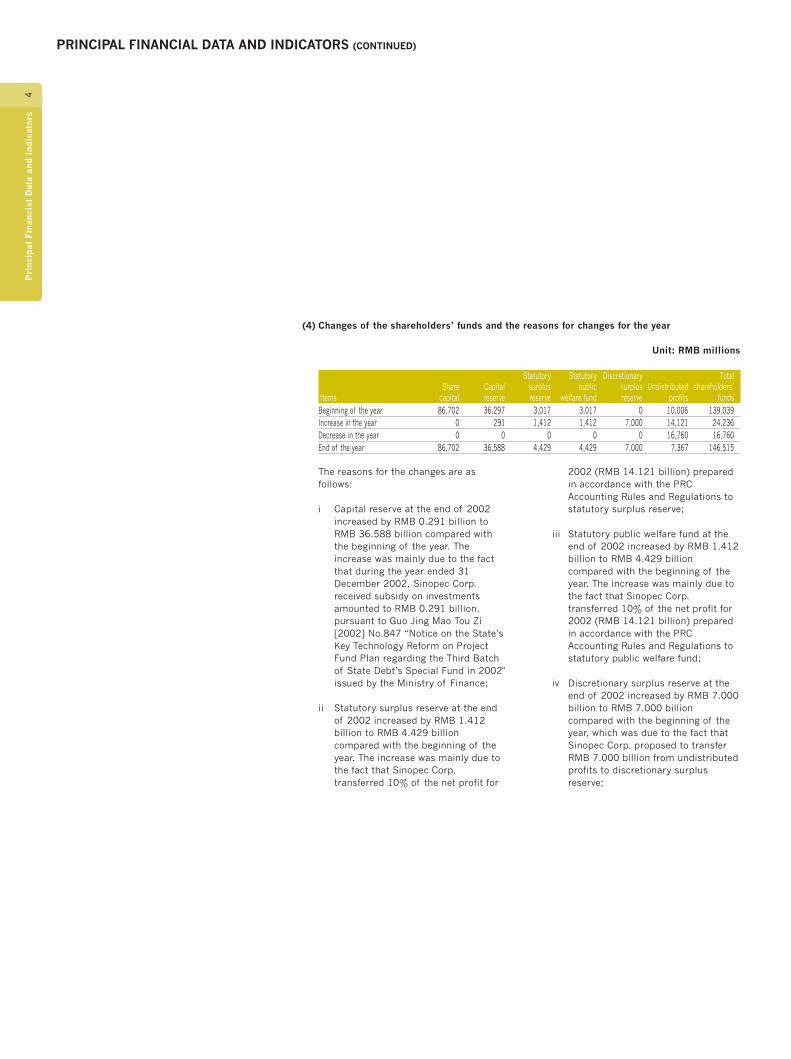
(4) Changes of the shareholders’ funds and the reasons for changes for the year
Unit: RMB millions
Statutory Statutory Discretionary TotalShare Capital surplus public surplus Undistributed shareholders’
Items capital reserve reserve welfare fund reserve profits fundsBeginning of the year 86,702 36,297 3,017 3,017 0 10,006 139,039Increase in the year 0 291 1,412 1,412 7,000 14,121 24,236Decrease in the year 0 0 0 0 0 16,760 16,760End of the year 86,702 36,588 4,429 4,429 7,000 7,367 146,515
The reasons for the changes are asfollows:
i Capital reserve at the end of 2002increased by RMB 0.291 billion toRMB 36.588 billion compared withthe beginning of the year. Theincrease was mainly due to the factthat during the year ended 31December 2002, Sinopec Corp.received subsidy on investmentsamounted to RMB 0.291 billion,pursuant to Guo Jing Mao Tou Zi[2002] No.847 “Notice on the State’sKey Technology Reform on ProjectFund Plan regarding the Third Batchof State Debt’s Special Fund in 2002"issued by the Ministry of Finance;
ii Statutory surplus reserve at the endof 2002 increased by RMB 1.412billion to RMB 4.429 billioncompared with the beginning of theyear. The increase was mainly due tothe fact that Sinopec Corp.transferred 10% of the net profit for
2002 (RMB 14.121 billion) preparedin accordance with the PRCAccounting Rules and Regulations tostatutory surplus reserve;
iii Statutory public welfare fund at theend of 2002 increased by RMB 1.412billion to RMB 4.429 billioncompared with the beginning of theyear. The increase was mainly due tothe fact that Sinopec Corp.transferred 10% of the net profit for2002 (RMB 14.121 billion) preparedin accordance with the PRCAccounting Rules and Regulations tostatutory public welfare fund;
iv Discretionary surplus reserve at theend of 2002 increased by RMB 7.000billion to RMB 7.000 billioncompared with the beginning of theyear, which was due to the fact thatSinopec Corp. proposed to transferRMB 7.000 billion from undistributedprofits to discretionary surplusreserve;
5P
rinc
ipal
Fin
anci
al D
ata
and
Ind
icat
ors
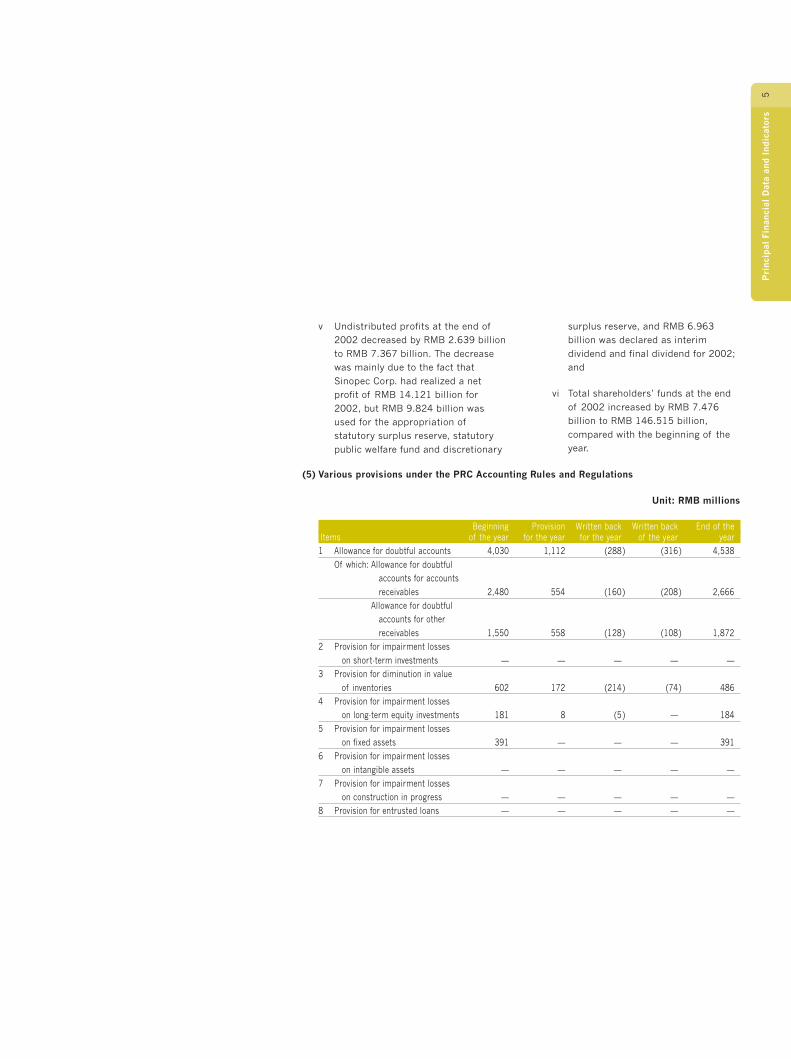
v Undistributed profits at the end of2002 decreased by RMB 2.639 billionto RMB 7.367 billion. The decreasewas mainly due to the fact thatSinopec Corp. had realized a netprofit of RMB 14.121 billion for2002, but RMB 9.824 billion wasused for the appropriation ofstatutory surplus reserve, statutorypublic welfare fund and discretionary
surplus reserve, and RMB 6.963billion was declared as interimdividend and final dividend for 2002;and
vi Total shareholders’ funds at the endof 2002 increased by RMB 7.476billion to RMB 146.515 billion,compared with the beginning of theyear.
(5) Various provisions under the PRC Accounting Rules and Regulations
Unit: RMB millions
Beginning Provision Written back Written back End of theItems of the year for the year for the year of the year year1 Allowance for doubtful accounts 4,030 1,112 (288) (316) 4,538
Of which: Allowance for doubtfulaccounts for accountsreceivables 2,480 554 (160) (208) 2,666
Allowance for doubtfulaccounts for otherreceivables 1,550 558 (128) (108) 1,872
2 Provision for impairment losseson short-term investments — — — — —
3 Provision for diminution in valueof inventories 602 172 (214) (74) 486
4 Provision for impairment losseson long-term equity investments 181 8 (5) — 184
5 Provision for impairment losseson fixed assets 391 — — — 391
6 Provision for impairment losseson intangible assets — — — — —
7 Provision for impairment losseson construction in progress — — — — —
8 Provision for entrusted loans — — — — —
PRINCIPAL FINANCIAL DATA AND INDICATORS (CONTINUED)
6P
rinc
ipal
Fin
anci
al D
ata
and
Ind
icat
ors
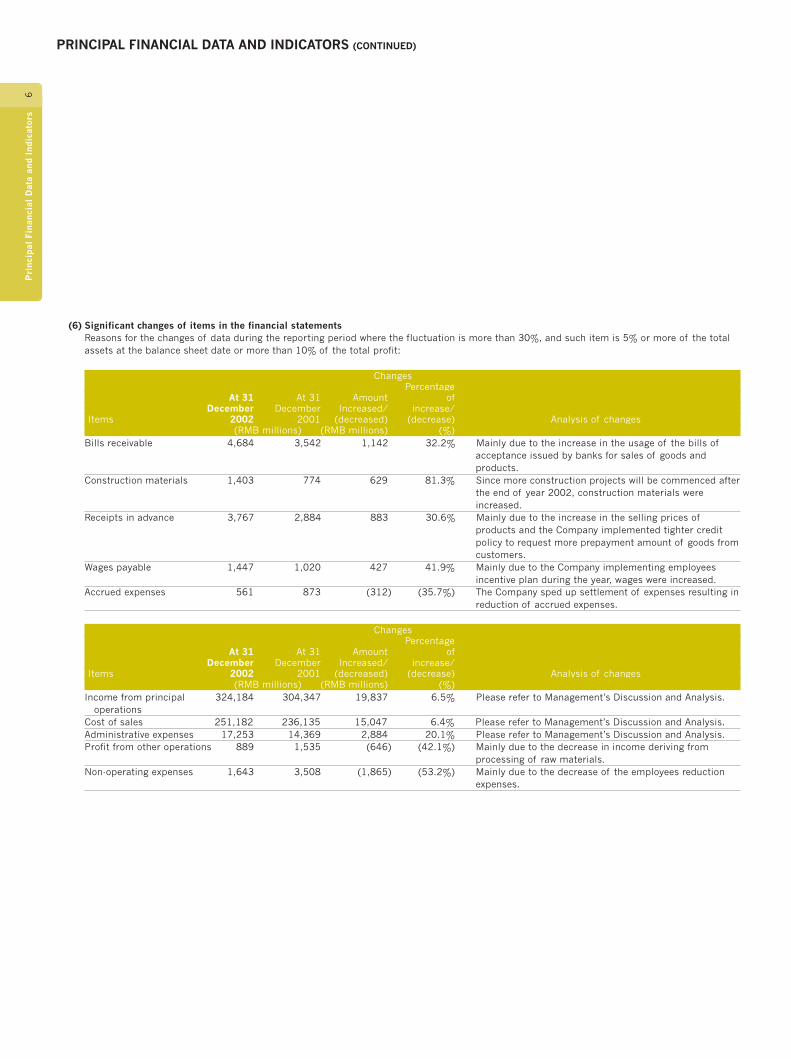
(6) Significant changes of items in the financial statementsReasons for the changes of data during the reporting period where the fluctuation is more than 30%, and such item is 5% or more of the totalassets at the balance sheet date or more than 10% of the total profit:
ChangesPercentage
At 31 At 31 Amount ofDecember December Increased/ increase/
Items 2002 2001 (decreased) (decrease) Analysis of changes(RMB millions) (RMB millions) (%)
Bills receivable 4,684 3,542 1,142 32.2% Mainly due to the increase in the usage of the bills ofacceptance issued by banks for sales of goods andproducts.
Construction materials 1,403 774 629 81.3% Since more construction projects will be commenced afterthe end of year 2002, construction materials wereincreased.
Receipts in advance 3,767 2,884 883 30.6% Mainly due to the increase in the selling prices ofproducts and the Company implemented tighter creditpolicy to request more prepayment amount of goods fromcustomers.
Wages payable 1,447 1,020 427 41.9% Mainly due to the Company implementing employeesincentive plan during the year, wages were increased.
Accrued expenses 561 873 (312) (35.7%) The Company sped up settlement of expenses resulting inreduction of accrued expenses.
ChangesPercentage
At 31 At 31 Amount ofDecember December Increased/ increase/
Items 2002 2001 (decreased) (decrease) Analysis of changes(RMB millions) (RMB millions) (%)
Income from principal 324,184 304,347 19,837 6.5% Please refer to Management’s Discussion and Analysis.operations
Cost of sales 251,182 236,135 15,047 6.4% Please refer to Management’s Discussion and Analysis.Administrative expenses 17,253 14,369 2,884 20.1% Please refer to Management’s Discussion and Analysis.Profit from other operations 889 1,535 (646) (42.1%) Mainly due to the decrease in income deriving from
processing of raw materials.Non-operating expenses 1,643 3,508 (1,865) (53.2%) Mainly due to the decrease of the employees reduction
expenses.
7P
rinc
ipal
Fin
anci
al D
ata
and
Ind
icat
ors
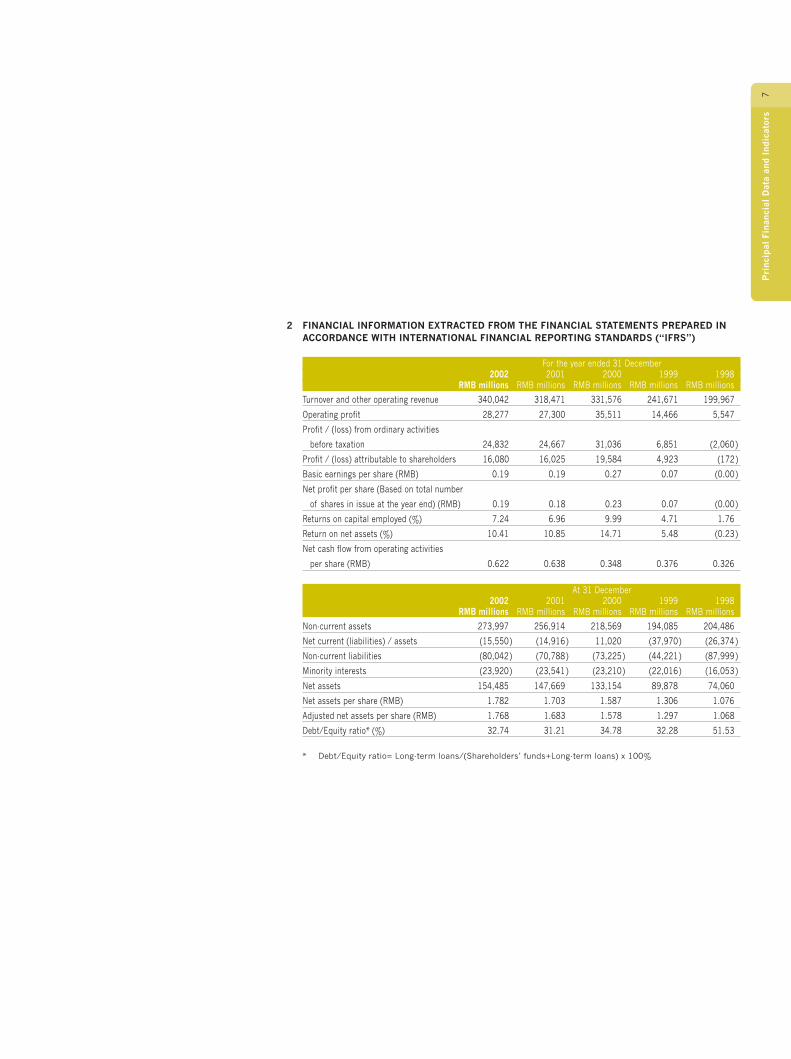
2 FINANCIAL INFORMATION EXTRACTED FROM THE FINANCIAL STATEMENTS PREPARED INACCORDANCE WITH INTERNATIONAL FINANCIAL REPORTING STANDARDS (“IFRS”)
For the year ended 31 December2002 2001 2000 1999 1998
RMB millions RMB millions RMB millions RMB millions RMB millions
Turnover and other operating revenue 340,042 318,471 331,576 241,671 199,967
Operating profit 28,277 27,300 35,511 14,466 5,547
Profit / (loss) from ordinary activities
before taxation 24,832 24,667 31,036 6,851 (2,060)
Profit / (loss) attributable to shareholders 16,080 16,025 19,584 4,923 (172)
Basic earnings per share (RMB) 0.19 0.19 0.27 0.07 (0.00)
Net profit per share (Based on total number
of shares in issue at the year end) (RMB) 0.19 0.18 0.23 0.07 (0.00)
Returns on capital employed (%) 7.24 6.96 9.99 4.71 1.76
Return on net assets (%) 10.41 10.85 14.71 5.48 (0.23)
Net cash flow from operating activities
per share (RMB) 0.622 0.638 0.348 0.376 0.326
At 31 December2002 2001 2000 1999 1998
RMB millions RMB millions RMB millions RMB millions RMB millions
Non-current assets 273,997 256,914 218,569 194,085 204,486
Net current (liabilities) / assets (15,550) (14,916) 11,020 (37,970) (26,374)
Non-current liabilities (80,042) (70,788) (73,225) (44,221) (87,999)
Minority interests (23,920) (23,541) (23,210) (22,016) (16,053)
Net assets 154,485 147,669 133,154 89,878 74,060
Net assets per share (RMB) 1.782 1.703 1.587 1.306 1.076
Adjusted net assets per share (RMB) 1.768 1.683 1.578 1.297 1.068
Debt/Equity ratio* (%) 32.74 31.21 34.78 32.28 51.53
* Debt/Equity ratio= Long-term loans/(Shareholders’ funds+Long-term loans) x 100%

PRINCIPAL FINANCIAL DATA AND INDICATORS (CONTINUED)
8P
rinc
ipal
Fin
anci
al D
ata
and
Ind
icat
ors
3 MAJOR DIFFERENCES BETWEEN THE PRC ACCOUNTING RULES AND REGULATIONS ANDIFRS ON NET INCOME FOR THE YEAR 2002 AND SHAREHOLDERS’ FUNDS AT THE END OFTHE REPORTING PERIOD
(1) Analysis Of The Effects Of Major Differences Between The PRC Accounting Rules AndRgulations And IFRS On Net Income:
For the yearended 31 December2002 2001
RMB millions RMB millionsNet profit under the PRC Accounting
Rules and Regulations 14,121 14,018Adjustments:
Depreciation of oil and gas properties 2,311 2,429Capitalisation of general borrowing costs 338 398Acquisition of Sinopec National Star 117 117Revaluation of land use rights 18 —Effects of the above adjustments on taxation (825) (937)
Net profit under IFRS 16,080 16,025
(2) Analysis Of The Effects Of Major Differences Between The PRC Accounting Rules AndRegulations And IFRS On Shareholders' Funds:
At 31 December2002 2001
RMB millions RMB millionsShareholders’ funds under the PRCAccounting Rules and Regulations 146,515 139,039Adjustments:
Depreciation of oil and gas properties 9,112 6,801Capitalisation of general borrowing costs 736 398Acquisition of Sinopec National Star (2,929) (3,046)Revaluation of land use rights (822) —Impairment losses on long-lived assets (113) (113)Government grants (291) —Dividends 5,202 6,936Effects of the above adjustments on taxation (2,925) (2,346)
Shareholders’ funds under IFRS 154,485 147,669
CHANGES IN SHARE CAPITAL AND SHAREHOLDINGS OF PRINCIPAL SHAREHOLDERS
9C
hang
es i
n S
hare
Cap
ital
and
Sha
reho
ldin
gs o
f P
rinc
ipal
Sha
reho
lder
s
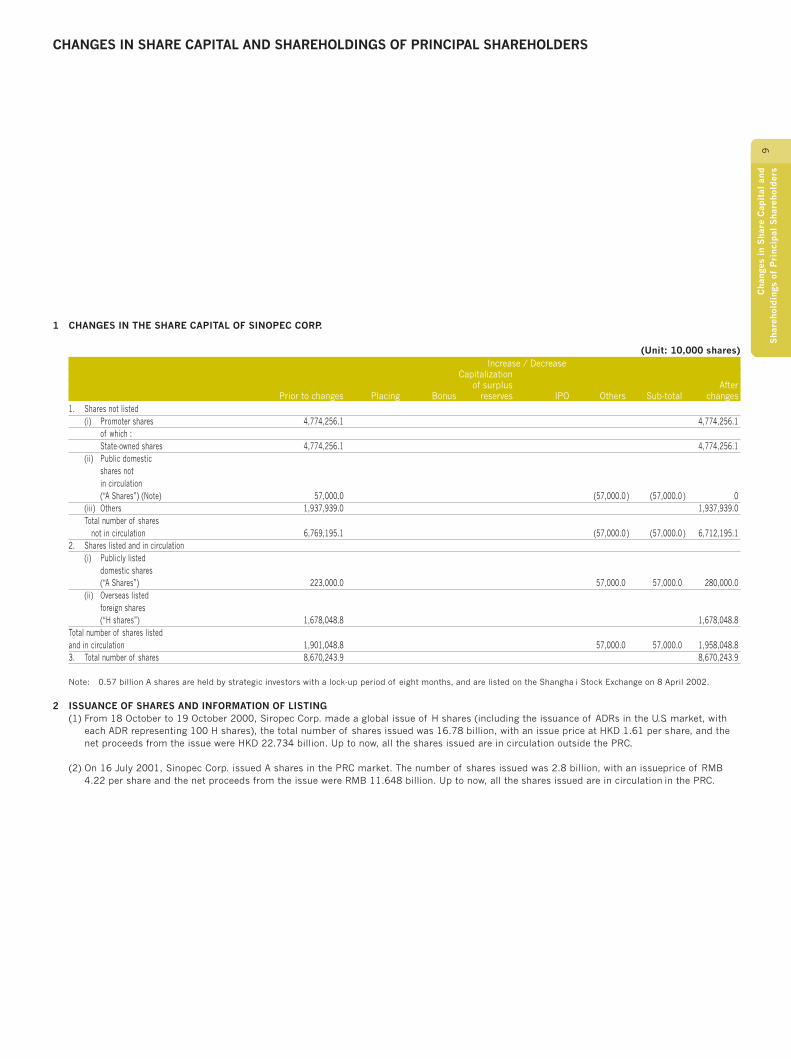
1 CHANGES IN THE SHARE CAPITAL OF SINOPEC CORP.
(Unit: 10,000 shares)Increase / Decrease
Capitalizationof surplus After
Prior to changes Placing Bonus reserves IPO Others Sub-total changes1. Shares not listed
(i) Promoter shares 4,774,256.1 4,774,256.1of which :State-owned shares 4,774,256.1 4,774,256.1
(ii) Public domesticshares notin circulation(“A Shares”) (Note) 57,000.0 (57,000.0 ) (57,000.0 ) 0
(iii) Others 1,937,939.0 1,937,939.0Total number of shares
not in circulation 6,769,195.1 (57,000.0 ) (57,000.0 ) 6,712,195.12. Shares listed and in circulation
(i) Publicly listeddomestic shares(“A Shares”) 223,000.0 57,000.0 57,000.0 280,000.0
(ii) Overseas listedforeign shares(“H shares”) 1,678,048.8 1,678,048.8
Total number of shares listedand in circulation 1,901,048.8 57,000.0 57,000.0 1,958,048.83. Total number of shares 8,670,243.9 8,670,243.9
Note: 0.57 billion A shares are held by strategic investors with a lock-up period of eight months, and are listed on the Shanghai Stock Exchange on 8 April 2002.
2 ISSUANCE OF SHARES AND INFORMATION OF LISTING(1) From 18 October to 19 October 2000, Siropec Corp. made a global issue of H shares (including the issuance of ADRs in the U.S. market, with
each ADR representing 100 H shares), the total number of shares issued was 16.78 billion, with an issue price at HKD 1.61 per share, and thenet proceeds from the issue were HKD 22.734 billion. Up to now, all the shares issued are in circulation outside the PRC.
(2) On 16 July 2001, Sinopec Corp. issued A shares in the PRC market. The number of shares issued was 2.8 billion, with an issue price of RMB4.22 per share and the net proceeds from the issue were RMB 11.648 billion. Up to now, all the shares issued are in circulation in the PRC.
CHANGES IN SHARE CAPITAL AND SHAREHOLDINGS OF PRINCIPAL SHAREHOLDERS (CONTINUED)
10
Cha
nges
in
Sha
re C
apit
al a
ndS
hare
hold
ings
of
Pri
ncip
al S
hare
hold
ers
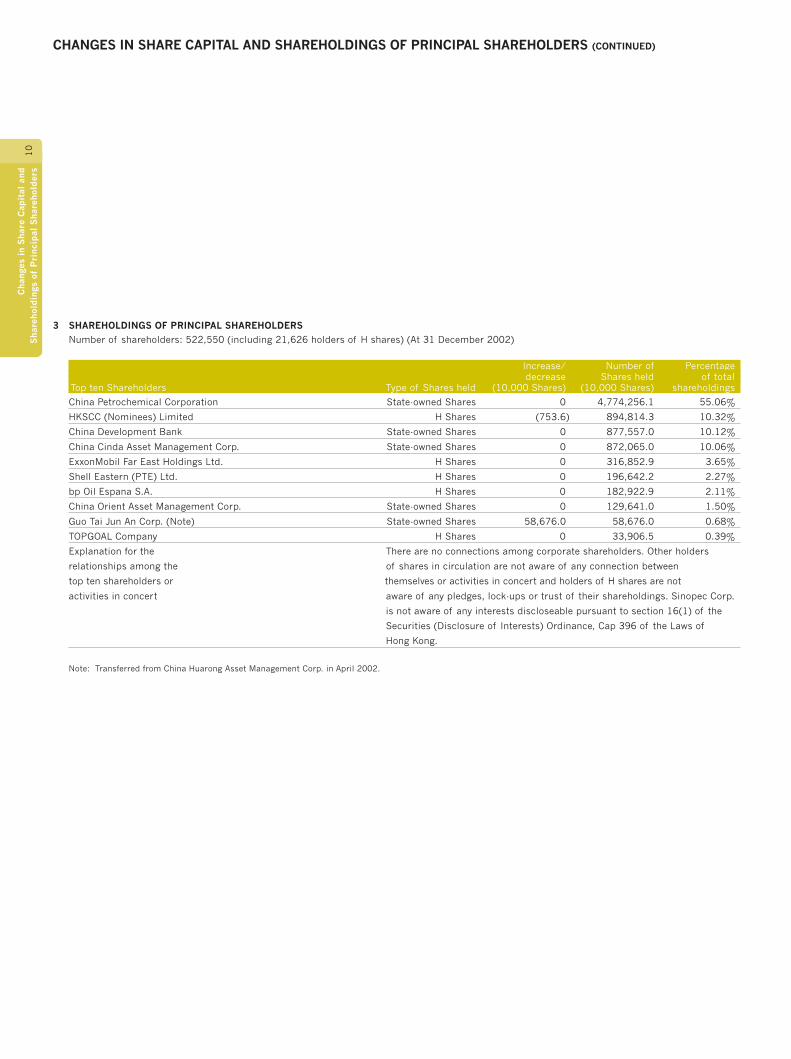
3 SHAREHOLDINGS OF PRINCIPAL SHAREHOLDERSNumber of shareholders: 522,550 (including 21,626 holders of H shares) (At 31 December 2002)
Increase/ Number of Percentagedecrease Shares held of total
Top ten Shareholders Type of Shares held (10,000 Shares) (10,000 Shares) shareholdings
China Petrochemical Corporation State-owned Shares 0 4,774,256.1 55.06%
HKSCC (Nominees) Limited H Shares (753.6) 894,814.3 10.32%
China Development Bank State-owned Shares 0 877,557.0 10.12%
China Cinda Asset Management Corp. State-owned Shares 0 872,065.0 10.06%
ExxonMobil Far East Holdings Ltd. H Shares 0 316,852.9 3.65%
Shell Eastern (PTE) Ltd. H Shares 0 196,642.2 2.27%
bp Oil Espana S.A. H Shares 0 182,922.9 2.11%
China Orient Asset Management Corp. State-owned Shares 0 129,641.0 1.50%
Guo Tai Jun An Corp. (Note) State-owned Shares 58,676.0 58,676.0 0.68%
TOPGOAL Company H Shares 0 33,906.5 0.39%
Explanation for the There are no connections among corporate shareholders. Other holders
relationships among the of shares in circulation are not aware of any connection between
top ten shareholders or themselves or activities in concert and holders of H shares are not
activities in concert aware of any pledges, lock-ups or trust of their shareholdings. Sinopec Corp.
is not aware of any interests discloseable pursuant to section 16(1) of the
Securities (Disclosure of Interests) Ordinance, Cap 396 of the Laws of
Hong Kong.
Note: Transferred from China Huarong Asset Management Corp. in April 2002.
11
Cha
nges
in
Sha
re C
apit
al a
ndS
hare
hold
ings
of
Pri
ncip
al S
hare
hold
ers
4 CONTROLLING SHAREHOLDER ANDACTUAL CHANGES TO THE BENEFICIALOWNERSDuring the reporting period, there was nochange to the controlling shareholder or theactual beneficial owners.
(1) Controlling ShareholderThe controlling shareholder of SinopecCorp. is China Petrochemical Corporation(“Sinopec Group Company”), establishedin July 1998, and is the State authorisedinvestment arm and State-ownedcontrolling company. Its registeredcapital is RMB 104.9 billion, and thelegal representative is Mr Li Yizhong.Through reorganisation in 2000, SinopecGroup Company injected its principalpetroleum and petrochemical operationsinto Sinopec Corp., and retainedoperations in certain smaller scalepetrochemical facilities and refineries,provision of well drilling services, oiltesting services, in-well operationservices, manufacture and maintenanceof production equipment, engineeringconstruction and utility services andsocial services.
(2) Basic Situtation of Other Legal PersonShareholders Holding 10% or More,Other Than HKSCC (Nominees) Limitedi China Development Bank: established
in 1994, with a registered capital ofRMB 50 billion. Its authorised legalperson is Mr Chen Yuan. ChinaDevelopment Bank is primarilyengaged in the management and
operation of the operatingconstruction funds and interestdiscount funding business with theState budget; providing loans tosignificant infrastructure industriesand projects and pillar industries;handling of re-lending in relation toloans from foreign governments andinternational financial institutions;issuance of corporate bonds;appraisal, consultation andguarantees of construction projectloans; underwriting enterprise bondsand indirect syndications etc.
ii China Cinda Asset Management Corp.: China Cinda Asset ManagementCorp. was established on 20th April1999, with a registered capital ofRMB 10 billion. Its legalrepresentative is Mr Zhu Dengshan.China Cinda Asset Management Corp.is primarily engaged in theacquisition and operation of inferiorassets segregated from ChinaConstruction Bank; debt collections,exchange, transfer and sale of assets;debt reorganisation and enterprisereorganisation; capitalization ofdebts and capitalization in stages;securitisation of assets; listingrecommendations within the scope ofasset management and underwritingof bonds and stocks; issue of bondsand commercial borrowings;borrowing from financial institutions;valuation of assets and projects;enterprise audits and winding up.

12
Cha
irm
an’s
Sta
tem
ent
CHAIRMAN’S STATEMENT
Mr. Li Yizhong, Chairman
To all shareholders,
On behalf of the Board of Directors of SinopecCorp., I would like to extend my sincereappreciation to our employees for their hardwork, and to our shareholders for their constantsupport.
While the global economy continued toexperience turbulences without momentum forgrowth in 2002, China’s economy still achieveda fast and healthy development, and registereda GDP growth rate of 8%. China’s robustdemand for major petroleum and petrochemicalproducts created tremendous market demandfor the Company’s products and thus room forits business expansion. In 2002, the first yearafter China’s accession to WTO, the Companyfaced more fierce competition as the Chinesemarket is now opened wider to the rest of theworld. In 2002, due to various factors, theglobal energy market also experiencedsignificant fluctuations. At the beginning of2002, international prices of crude oil andrefined oil products were at a rather low level,and the chemical market cycle remained in thetrough. In addition, the Chinese governmentfurther reduced its import tariff on petroleumand petrochemical products. As a result, theprices of crude oil, refined oil products andchemical products all plunged in January andFebruary of 2002. The combination of thesefactors quickly drove down the Company’sprofitability for these months. After March2002, the prices of crude oil and refined oilproducts significantly improved and the pricesof chemical products also began to recover. Asthe market conditions improved, the Company’soperating results also improved.
In response to the severely harsh businessenvironment in the beginning months of 2002,the Company closely monitored the marketconditions both at home and abroad, andeffected a series of countermeasures, including
13
Cha
irm
an’s
Sta
tem
ent
adjustments of its operating strategy,reinforcement of internal management, as wellas striving proactively for improvement of themarket environment. Thanks to the generoussupport from our shareholders and the jointefforts by our employees, we managed to seizethe opportunities presented when the productprices and market orders began to improve byexpanding our market and resources, reducingour costs and enhancing our operationefficiency. As a result, we overcame thesedifficulties and since March 2002 our operatingresults have improved significantly andcontinued to maintain a fair growth momentum.Over the year, our upstream operationsmaintained at a fair level of profitability, therefining and marketing and distributionsegments significantly improved theirprofitability level, and the chemicals segmentgradually turned operating loss into operatingprofit. The Company’s competitive strength asan integrated operator of upstream, midstreamand downstream activities also helped theCompany achieve its reasonably satisfactoryoperating results in 2002.
Year 2002 was unusual for the internationalcapital market. After the exposure of suchcorporate governance scandals like Enron andWorldCom, regulators in China and overseasbegan to implement more stringent corporategovernance standards upon public companies.Responding to the new regulatory requirementsand market environment, the Company intendedto establish a modern corporate system. Asdirected by the Listed Company CorporateGovernance Standards promulgated by ChinaSecurities Regulatory Commission (CSRC) andthe former State Economic and TradeCommission (SETC), and with reference to therelevant U.S. corporate reform acts, theCompany proposed, in a systematic manner, anumber of amendments to the Company’sArticles of Association and other corporategovernance documents to enhance its corporategovernance standards. Moreover, the Companycontinued to adhere to its corporate culture of“competition, openness, standardization andintegrity” and emphasized the importance of
business integrity and corporate responsibility.In addition, we have strengthened the role ofthe Board of Directors as the decision-makingbody as well as the distinctive function of eachof the three committees under the Board, sothat the corporate decisions of the Company arenow made in a more accountable way. As aresult of our enduring efforts, the Company’scorporate governing practices won broaderrecognition in the capital market.
Year 2002 also saw the Company furtherstrengthen its corporate reform. To adapt to themarket changes and ensure the effectiveimplementation of its business strategies, theCompany further improved its corporatestructure. In the exploration and productionsegment, the Company established SouthernExploration and Production Company andShanghai Offshore Oil and Gas Company andstrengthened the exploration and productionwork force in the newly explored areas inwestern China. In the refining segment, theCompany established a lubricants subsidiary formore specialized marketing management, andimproved crude oil purchasing procedures tofurther optimize the deployment of crude oilresources. The refining, chemicals andmarketing and distribution segments continuedto implement measures to further flatten themanagement hierarchy in order to improveoperating efficiency and marketcompetitiveness. In 2002, the Company wasfurther restructured by swapping the Company’snon-core assets for certain assets of SinopecGroup Company, and as a result, profitabilityimproved. Through capital operations, theCompany acquired the remaining petrochemicalassets of Hubei Xinghua, an A-share listedsubsidiary of Sinopec Corp. During the reformprocess, the Company has constantly paidattention to keep the reform at the right depthand at the right pace, so as to strike a balanceamong the various impacts it would have on theemployees, the Company and the society as wellas between its benefits to the whole andbenefits to a part of the concern. As a result,the Company’s reform programmes were carriedout smoothly.

14
Cha
irm
an’s
Sta
tem
ent
CHAIRMAN’S STATEMENT (CONTINUED)
In 2002, to capture the market opportunitypresented, the Board made proper businessdecisions and proactively endeavored to improvethe external market climate. The managementcontinued to carry out the Company’s strategyof “expanding resources and market, reducingcost and disciplining investment”, and achievedreasonably satisfactory operating results. Inrespect of resource expansion, throughstrengthened exploration efforts andtechnological improvements, the Companymade breakthroughs in its new areas in westernChina and increased its oil and gas reserves andproductions. The Company increased provedreserves by 391 million barrels of oil equivalentand the reserve composite structure has beenimproved remarkably. The Company has realizeda reserve replacement ratio of over 100% for 6consecutive years in a row. In respect of marketexpansion, the marketing subsidiaries of refinedoil products played a leading role in theimprovement of distribution structure. Retail,distribution and direct distribution sales weresignificantly enhanced. As a result, theCompany’s retail volume in 2002 rose by 14.1%over that in 2001 and retail market share in itsprincipal markets climbed to 68% from 65% in2001. Refining subsidiaries’ through scienceand technology advancements improved thequality and the product mix of refined products.In addition, the Company strengthened itsmarketing efforts of refined products other thangasoline, diesel and kerosene including jet fueland increased the production proportion ofproducts with higher added value. As a result,the refining margin improved. With theexpanded market, the Company processed 105million tonnes of crude oil, up by 3.5% overthat in 2001. With the advantages of beingclose to the markets and various technologicaladvancements, the chemical subsidiarieslowered costs, made active efforts in promotingdirect sales and online transactions, andincreased the sales of higher value-addedproducts. Two ethylene production facilitiescompleted revamping and were put intooperation. The total ethylene production in 2002was 2.716 million tonnes, 26.2% higher thanthat in 2001. Major chemical productsmaintained 100% production/sales ratio. Inrespect of cost reduction, the Company reducedcosts by RMB 2.52 billion, fulfilled the cost-saving objective for year 2002 and various unitcash operating costs were reduced to some
extent. Operation efficiency in upstream,midstream and downstream businesses allincreased. As for disciplining investment, wecontinued to adhere to the investment policy of“capital expenditure based on operating cashflow; controlled total investment size;centralizing decision-making, rationalizinginvestment variety; individually optimizingprojects and increasing returns on investment”.As a result, the total investment size wassignificantly reduced in comparison to that in2001, and the investment structure was furtheroptimized. The total capital expenditure in 2002was RMB 41.6 billion, down by 29.3% from thatin 2001, which would lay down a firmfoundation for the Company’s businessexpansion in the future.
In 2002, under the PRC Accounting Rules andRegulations, the Company’s income from theprincipal operations was RMB 324.184 billion,up by 6.5% from that in 2001; net profit wasRMB 14.121 billion, 0.7% up from that in 2001.Based on the number of shares outstanding atthe end of 2002, earnings per share were RMB0.16. Under the International FinancialReporting Standards, the Company’s turnoverand other operating revenues were RMB340.042 billion, up by 6.8% from that in 2001.Profit attributable to shareholders amounted toRMB 16.08 billion, up by 0.34% from that in2001. Based on the number of sharesoutstanding at the end of 2002, earnings pershare were RMB 0.19.
The Board of Directors now proposes a finaldividend of RMB 0.08 per share for the yearended 31 December 2002. After deducting theinterim dividends distribution of RMB 0.02 pershare, the year-end dividend is RMB 0.06 pershare, which is equivalent to RMB 6 per ADS.
Having reviewed the results in year 2002, theBoard of Directors rationally realized thatcertain aspects of the Company’s operationsrequire further improvement. Firstly, though wehave laid down a fundamental framework ofmodern corporate structure system, we have toreinforce our internal organizational coherenceand centralized management. Secondly, theintegration of our industrial chain of upstream,midstream and downstream businesses couldbe further improved and the industrial structurecould be further optimized. Thirdly, the intensity
of reform and restructure could be furtherenhanced. The Board of Directors intends toimprove upon these areas.
Looking into year 2003, the global economybegins to show signs of recovery. Crude oilprices and refining margin are expected toremain at a relatively high level and thechemical cycle has started turning up since thesecond half of last year. The combination ofthese factors would make it possible for theCompany to increase downstream profitabilitywhile maintaining profits in the upstreambusinesses. Domestically, China’s economy willkeep growing at a healthy speed, with anestimated GDP growth rate of above 7%. Suchgrowth certainly would push up domesticdemands for petroleum and petrochemicalproducts, hence allowing the Company toincrease both its production and sales. At thesame time, the Company will continue itscooperation with other domestic refined oilproducts market participants to improve themarket conditions. In addition, the Companywill also benefit from the achievements of itsown reform and development, the additionalproduction capacity gained through revampingand newly constructed facilities, as well as thedevelopment and the application of newtechnologies. These factors will be conducive tocost reduction and will support the growth ofthe Company’s profitability. We have alsoconsidered the unfavorable factors and certainchallenges. First, the uneasy situation in theMiddle East and the war in Iraq may cause hugefluctuations of crude oil prices, which will havea direct impact on the operating conditions ofthe Company; second, the war may delay therecovery of the world economy anduncertainties still exist about whether thechemical cycle could pick up its recovery speedas previously expected; third, year 2003 is thesecond year after China’s WTO accession andChina will further reduce tariffs and opendomestic market, which would bring even morecompetition to the market. Therefore, we shouldmore closely examine those adverse factors andtry to adopt proactive countermeasures.
Considering the above-mentionedcharacteristics of the macro environment in2003, the Company will continue to carry out itsexisting development strategy with emphasis onthe following areas:
15
Cha
irm
an’s
Sta
tem
ent
� The expansion of crude oil and natural gasresources will always be one of our strategicpriorities. The Company will maintain stableoperations in the existing oil fields in easternChina, and expedite its developments inwestern China. We will make efforts to keepand even increase our production output ofcrude oil and natural gas; maintain thereplacement ratio over 100%; and improve thereserve composite structure of our resources,thus to facilitate our continued businessexpansion in the future. In addition, we willmake full use of our resources at home andabroad to ensure the safety of resources.
� Expanding the markets to increase throughputand sales volume is the pivotal point of ourmarketing strategy. We will seize theincreasing domestic demands, optimize ourproduction elements in a comprehensive way,adjust our product mix, expand the market,reinforce and improve the competitiveness anddominant market position of the Company’srefined oil products and chemical products.The Company will endeavor to increase thecapacity and utilization of refining andchemical facilities to improve the efficiency.
� Marketing of refined oil products is not onlyour competitive strength but also a drivingforce for the Company’s profit growth. In themarketing and distribution segment, we willnot only strive for increasing the totaldomestic sales volume, but also endeavor toimprove and expand our marketing network.Aiming to push up domestic sales volume andexport volume of refined oil products, and inparticular, to increase retail and directdistribution volume, so as to maintain ourdominant market share and sustainedprofitability. In respect of the sales ofchemicals, we will further reform and optimizeour marketing network and mechanism with aview to leading our competition through betterprices, better quality and better service.
� The Company will continue implementing itscost-cutting strategy, with emphasis on crudeoil and raw material procurement, energy-saving and expenses control. The Company willkeep carrying out measures to reduce costand, enhance assets efficiency and overallcompetitiveness. For 2003, the Company plansto cut costs by RMB 2.5 billion.
� We will concentrate our R&D efforts aroundour core technologies and proprietarytechnologies, and expedite implementation oftechnology achievements. Furthermore,through more extensive use of informationtechnology, the Company intends to enhanceits production and operation management,improve market competitiveness, and reinforceinternal control and improve efficiency.
� The Company will continue to adhere to theexisting investment policy, and will constantlyoptimize investment plan to strive forincreasing investment returns. For 2003, theCompany planned its capital expenditure to beapproximately RMB 37.6 billion, so as toensure the long-term corporate developmentstrategy could be implemented.
Year 2003 is the first year since the Chinesegovernment launches the drive for building anall round well-off society. The Company willseize this historical development opportunityand cling to the principle of “new idea for betterstrategies, new breakthrough for further reform,new measures for better performance andcontinued growth for sustained profitability”through “team work, motivation, innovation anddelivery” to embrace even better operatingresults. In the meantime, the Company willfurther optimize its development plan for the10th Five-Year Plan Period to identify andformulate the medium- and long-termdevelopment plans and strategic positioning. Allthese efforts should aim at increasing theCompany’s global competitiveness andmaximizing profit for the shareholders.
Li YizhongChairman
March 28, 2003Beijing, China

16
Bus
ines
s R
evie
w a
nd P
rosp
ects
BUSINESS REVIEW AND PROSPECTS (CONTINUED)
17
Bus
ines
s R
evie
w a
nd P
rosp
ects
BUSINESS REVIEW AND PROSPECTS
the cancellation of tariff on crude oil, therealized annual average price of theCompany’s self-produced crude oil was US$22.42 per barrel in 2002, representing adecrease of 4.02% over the previous year.
(2) The market for refined oil productsIn 2002, affected by the fluctuation inthe prices of refined oil products in theinternational market, domestic prices ofrefined oil products fell to a trough inJanuary and February and graduallyrecovered throughout the rest of the year.In accordance with the domestic refinedoil products pricing mechanism, the PRCgovernment raised domestic prices ofrefined oil products in March, April, Mayand October. With the international
refining margin rose gradually, theCompany’s refining margin has also beenincreased gradually. Meanwhile, the PRCgovernment further disciplined therefined oil products market order byclosing down the domestic refineries andpetrol stations that failed to meet thegovernment standards and requirements,thereby greatly improved the efficiency ofthe domestic refined oil products market.
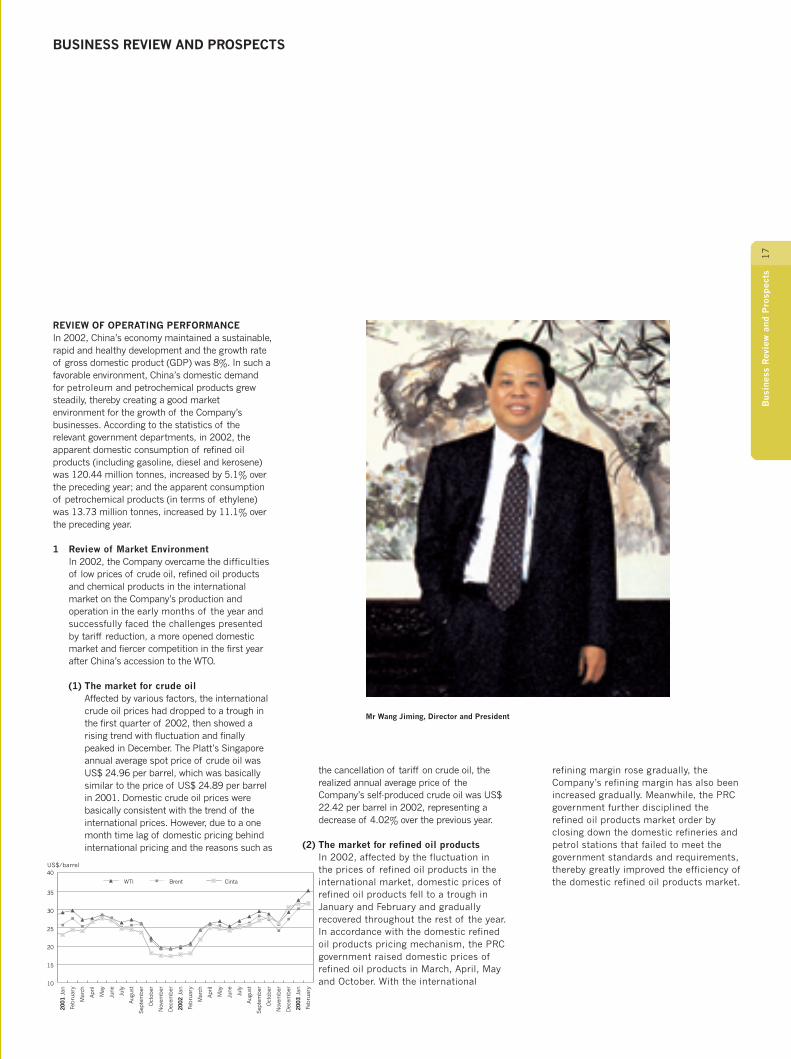
Mr Wang Jiming, Director and President
REVIEW OF OPERATING PERFORMANCEIn 2002, China’s economy maintained a sustainable,rapid and healthy development and the growth rateof gross domestic product (GDP) was 8%. In such afavorable environment, China’s domestic demandfor petroleum and petrochemical products grewsteadily, thereby creating a good marketenvironment for the growth of the Company’sbusinesses. According to the statistics of therelevant government departments, in 2002, theapparent domestic consumption of refined oilproducts (including gasoline, diesel and kerosene)was 120.44 million tonnes, increased by 5.1% overthe preceding year; and the apparent consumptionof petrochemical products (in terms of ethylene)was 13.73 million tonnes, increased by 11.1% overthe preceding year.
1 Review of Market EnvironmentIn 2002, the Company overcame the difficultiesof low prices of crude oil, refined oil productsand chemical products in the internationalmarket on the Company’s production andoperation in the early months of the year andsuccessfully faced the challenges presentedby tariff reduction, a more opened domesticmarket and fiercer competition in the first yearafter China’s accession to the WTO.
(1) The market for crude oilAffected by various factors, the internationalcrude oil prices had dropped to a trough inthe first quarter of 2002, then showed arising trend with fluctuation and finallypeaked in December. The Platt’s Singaporeannual average spot price of crude oil wasUS$ 24.96 per barrel, which was basicallysimilar to the price of US$ 24.89 per barrelin 2001. Domestic crude oil prices werebasically consistent with the trend of theinternational prices. However, due to a onemonth time lag of domestic pricing behindinternational pricing and the reasons such as
10
15
20
25
30
35
40
2001
Jan
Febru
ary
Mar
ch
April
May
June
July
Augu
st
Sep
tem
ber
Oct
ober
Nov
embe
r
Dec
embe
r
2002
Jan
Febru
ary
Mar
ch
April
May
June
July
Augu
st
Sep
tem
ber
Oct
ober
Nov
embe
r
Dec
embe
r
2003
Jan
Febru
ary
US$/barrel
WTI Brent Cinta

18
Bus
ines
s R
evie
w a
nd P
rosp
ects
BUSINESS REVIEW AND PROSPECTS (CONTINUED)
EXPLORATION AND PRODUCTIONEXPANDING RESOURCES IS THE COMPANY’S PRIMARY STRATEGY.IN 2002, THE COMPANY’S PRODUCTION OF CRUDE OIL ANDNATURAL GAS AMOUNTED TO 299.6 MMBOE. THE COMPANY ISTHE SECOND LARGEST CRUDE OIL PRODUCER IN CHINA WITHPROVED RESERVES OF 3,875 MMBOE.

19
Bus
ines
s R
evie
w a
nd P
rosp
ects
BUSINESS REVIEW AND PROSPECTS

20
Bus
ines
s R
evie
w a
nd P
rosp
ects
BUSINESS REVIEW AND PROSPECTS (CONTINUED)
(3) The market for chemical productsBenefited from the continuous and rapideconomic growth of China, China’sdomestic demand for chemical productsmaintained a fast growing trend in 2002.Annual apparent consumptions ofsynthetic resins, synthetic fibers,monomers and polymers for syntheticfibers and synthetic rubbers reached26.09 million tonnes, 10.68 milliontonnes, 17.09 million tonnes and 2.02million tonnes respectively, representingan increase of 7.5%, 19.7%, 24.6% and19.7% respectively over 2001.
As the global economy recovered slowlyin 2002, the gross chemical margingradually and slowly rallies from thebottom. Though domestic prices ofchemical products rose and the averageprices of some products were higher
than those in the preceding year, theaverage prices of the Company’s majorchemical products of synthetic resinsand synthetic fibers were still lower thanthose of the preceding year, representinga decrease of 5.62% and 0.91%respectively.
2 Review of Production OperationsIn 2002, the Company adhered to marketorientation, conscientiously implementedits established development strategy,flexibly adjusted its production andmarketing plan and quickly changed thepassive situation of operations in the firstquarter. The Company’s economicefficiency was significantly improvedbeginning from the second quarter andmaintained a rising trend, and theCompany achieved reasonably satisfactoryresults in production operations.
(1) Exploration and ProductionIn 2002, the Companyconscientiously implemented thedevelopment strategy of “stabilizingproduction of the existing fields ineastern China, developing thepotential fields in western China,searching for potential reserves insouthern China, laying equal stresson oil and natural gas, relying onscience and technology and reducingcosts for increasing efficiency” andsatisfactorily fulfilled the annualexploration and production plan.
In upstream exploration, theCompany completed 26,461km of
two-dimensional seismic prospectingand 4,345km2 of three-dimensionalseismic prospecting and drilled 506exploratory wells with total drillingdepth of 1,373km. The Companymade significant achievements inexploring the burial hills, and newand subtle layers of oil and naturalgas reserves in Shengli Oilfield ineastern China, thereby stabilizingproduction and increasing reservesfor the near term. In western China,the Company’s exploration of TarimBasin and Jungel Basin also achievedimportant discoveries, with five keyareas preliminarily identified asvaluable for future breakthroughs andreserves increase (including themiddle part of Jungel Basin, Tahearea of Tarim Basin, Tazhong area,south Kuche area of Tianshan andthe slope of Kongque River), therebypreparing important replacementresources for the Company’s increaseof reserves and production in the lastthree years of the 10th Five-Year-PlanPeriod. In upstream development, theCompany totally drilled 2,186development wells with a drillingdepth of 4,566km and a new crudeoil production capacity of 5.54million tonnes and a new natural gasproduction capacity of 928 millioncubic meters. In 2002, the Companyproduced a total of 38 million tonnesof crude oil and 5.06 billion cubicmeters of natural gas, representingan increase of 0.2% and 9.8%respectively over the preceding year.
200
300
400
500
600
700
800
900
1000
2001
Jan
Febru
ary
Mar
ch
April
May
June
July
Augu
st
Sep
tem
ber
Oct
ober
Nov
embe
r
Dec
embe
r
2002
Jan
Febru
ary
Mar
ch
April
May
June
July
Augu
st
Sep
tem
ber
Oct
ober
Nov
embe
r
Dec
embe
r
2003
Jan
Febru
ary
PTA
PET (Fiber Grade)
PP (Injection Grade)
LDPE (Film Grade)

21
Bus
ines
s R
evie
w a
nd P
rosp
ects
SUMMARY OF OPERATIONS OF THE EXPLORATION AND PRODUCTION SEGMENT
Change in 2002
comparedto
2002 2001 2000 2001 (%)
Crude oil production (mmbbls) 269.80 269.16 247.35 0.2
Natural gas production (bcf) 178.8 162.8 80.3 9.8
Newly added proved crude oil reserves (mmbbls) 375 316 318 18.7
Newly added proved gas reserves (bcf) 20.2 309.0 297.0 –93.5
Year-end proved reserves of crude oil (mmbbls) 3,320 3,215 2,952 3.3
Year-end proved reserves of natural gas (bcf) 3,329.4 3,488.0 999.0 –4.5
Year-end proved reserves of oil and gas (mmboe) 3,875 3,796 3,118 2.1
Shengli Oilfield also made remarkable achievements in production.
Summary of Production and Operation of Shengli Oilfield
Change in 2002
comparedto
2002 2001 2000 2001 (%)
Crude oil production (mmbbls) 189.68 189.43 189.97 0.1
Natural gas production (bcf) 26.5 30.01 24.3 –11.7
Newly added proved crude oil reserves (mmbbls) 240 250 265.97 –4.0
Newly added proved gas reserves (bcf) –5.1 24.9 44.1 –120.5
Year-end proved reserves of crude oil (mmbbls) 2,264 2,214 2,153 2.3
Year-end proved reserves of natural gas (bcf) 267.4 299.0 304.0 –10.6
Year-end proved reserves of oil and gas (mmboe) 2,308 2,264 2,204 1.9
22
Bus
ines
s R
evie
w a
nd P
rosp
ects
BUSINESS REVIEW AND PROSPECTS (CONTINUED)
REFININGTHE COMPANY IS THE LARGEST REFINED OIL PRODUCTS PRODUCER INCHINA, WITH AN ANNUAL CRUDE OIL PROCESSING CAPACITY OF 132.42MILLION TONNES. IN 2002, THIS SEGMENT’s PROFIT SIGNIFICANTLYINCREASED BECAUSE OF BETTER PRODUCT-MIX, HIGHER PRODUCTQUALITY, AND IMPROVED TECHNOLOGICAL AND ECONOMIC PERFORMANCEINDICES THROUGH TECHNOLOGICAL ADVANCEMENTS. THE TOTAL CRUDEOIL PROCESSED FOR THE YEAR WAS 150 MILLION TONNES.

23
Bus
ines
s R
evie
w a
nd P
rosp
ects
24
Bus
ines
s R
evie
w a
nd P
rosp
ects
BUSINESS REVIEW AND PROSPECTS (CONTINUED)
25
Bus
ines
s R
evie
w a
nd P
rosp
ects
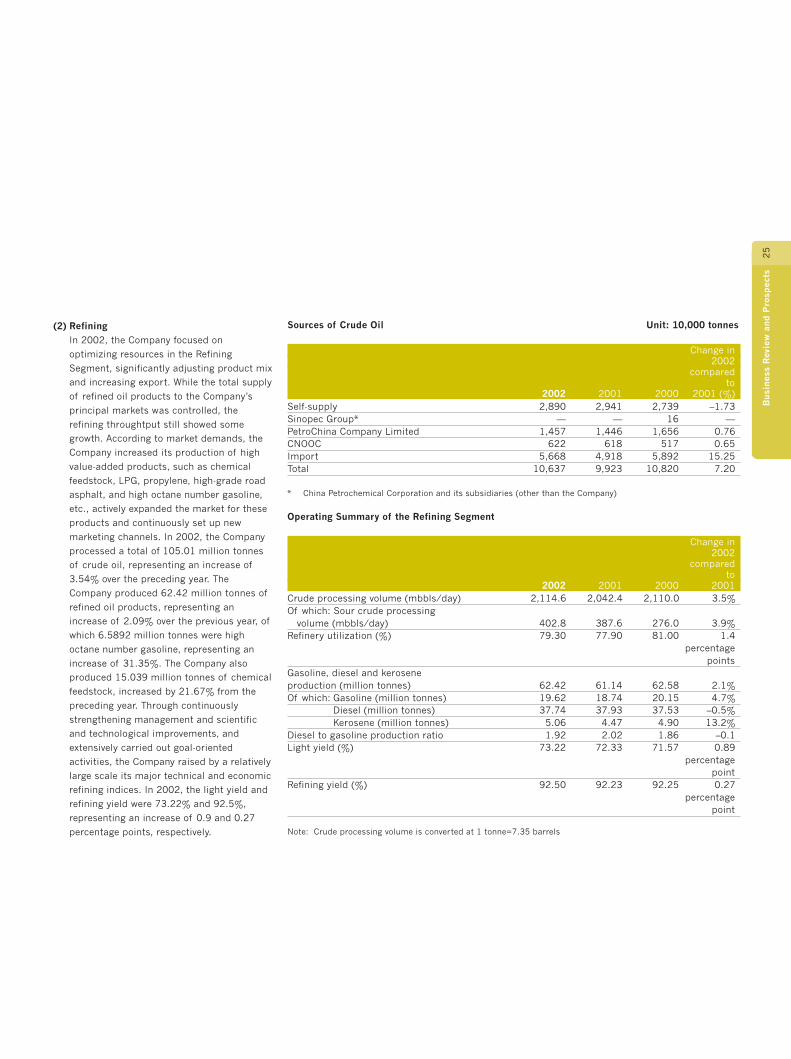
(2) RefiningIn 2002, the Company focused on
optimizing resources in the Refining
Segment, significantly adjusting product mix
and increasing export. While the total supply
of refined oil products to the Company’s
principal markets was controlled, the
refining throughtput still showed some
growth. According to market demands, the
Company increased its production of high
value-added products, such as chemical
feedstock, LPG, propylene, high-grade road
asphalt, and high octane number gasoline,
etc., actively expanded the market for these
products and continuously set up new
marketing channels. In 2002, the Company
processed a total of 105.01 million tonnes
of crude oil, representing an increase of
3.54% over the preceding year. The
Company produced 62.42 million tonnes of
refined oil products, representing an
increase of 2.09% over the previous year, of
which 6.5892 million tonnes were high
octane number gasoline, representing an
increase of 31.35%. The Company also
produced 15.039 million tonnes of chemical
feedstock, increased by 21.67% from the
preceding year. Through continuously
strengthening management and scientific
and technological improvements, and
extensively carried out goal-oriented
activities, the Company raised by a relatively
large scale its major technical and economic
refining indices. In 2002, the light yield and
refining yield were 73.22% and 92.5%,
representing an increase of 0.9 and 0.27
percentage points, respectively.
Sources of Crude Oil Unit: 10,000 tonnes
Change in 2002
comparedto
2002 2001 2000 2001 (%)Self-supply 2,890 2,941 2,739 –1.73Sinopec Group* — — 16 —PetroChina Company Limited 1,457 1,446 1,656 0.76CNOOC 622 618 517 0.65Import 5,668 4,918 5,892 15.25Total 10,637 9,923 10,820 7.20
* China Petrochemical Corporation and its subsidiaries (other than the Company)
Operating Summary of the Refining Segment
Change in 2002
comparedto
2002 2001 2000 2001Crude processing volume (mbbls/day) 2,114.6 2,042.4 2,110.0 3.5%Of which: Sour crude processing
volume (mbbls/day) 402.8 387.6 276.0 3.9%Refinery utilization (%) 79.30 77.90 81.00 1.4
percentagepoints
Gasoline, diesel and keroseneproduction (million tonnes) 62.42 61.14 62.58 2.1%Of which: Gasoline (million tonnes) 19.62 18.74 20.15 4.7%
Diesel (million tonnes) 37.74 37.93 37.53 –0.5%Kerosene (million tonnes) 5.06 4.47 4.90 13.2%
Diesel to gasoline production ratio 1.92 2.02 1.86 –0.1Light yield (%) 73.22 72.33 71.57 0.89
percentagepoint
Refining yield (%) 92.50 92.23 92.25 0.27percentage
point
Note: Crude processing volume is converted at 1 tonne=7.35 barrels

26
Bus
ines
s R
evie
w a
nd P
rosp
ects
BUSINESS REVIEW AND PROSPECTS (CONTINUED)
MARKETING AND DISTRIBUTIONTHE COMPANY HAS THE MOST COMPLETE REFINED OIL PRODUCTSDISTRIBUTION NETWORK IN CHINA AND HAS 28,127 SINOPECBRANDED PETROL STATIONS. IN 2002, THIS SEGMENT’S PROFITIMPROVED SIGNIFICANTLY AS A RESULT OF FURTHER OPTIMIZATIONOF ITS DISTRIBUTION NETWORK AND THE COMPANY FURTHERIMPROVED COMPANY-WIDE OPERATING EFFICIENCY. IN 2002, THISSEGMENT SOLD 70.09 MILLION TONNES OF REFINED OIL PRODUCTSIN THE DOMESTIC MARKET, AND THE RETAIL SALES VOLUMEREACHED 34.73 MILLION TONNES.

27
Bus
ines
s R
evie
w a
nd P
rosp
ects

28
Bus
ines
s R
evie
w a
nd P
rosp
ects
BUSINESS REVIEW AND PROSPECTS (CONTINUED)

29
Bus
ines
s R
evie
w a
nd P
rosp
ects
(3) Marketing and Distribution SegmentIn 2002, the Company faced a harshsituation and huge pressures arising fromthe excessive supply of refined oil productsin the Company’s principal markets, higherinventory and the drop of prices to a troughin early 2002, however, the Company hasbeen able to raise total sales volume, retailvolume, distribution volume of refined oilproducts and its operating resultssignificantly and further increased theCompany’s market control and profitabilitythrough adjusting market perceptions, multi-channel marketing, marketing structureadjustment, improving information systemconstruction, strengthening structuralreform, improving management andestablishing a sales incentive system.
In 2002, the Company’s total domesticrefined oil products sales volume increasedto 70.09 million tonnes, representing anincrease of 3.5% over the preceding year, inwhich, the retail volume was 34.73 milliontonnes, representing an increase of 14%over the preceding year. The Company’s
retail share in its principal markets reached68%, representing an increase of threepercentage points over the previous year. Inthe retail volume, gasoline of high octanenumber of 93# and above was 4.3 milliontonnes, representing an increase of 44.7%over the previous year. The efficiency ofpetrol stations has continuously beenimproving and the annual averagethroughput per station reached 1,560tonnes, representing an increase of 87tonnes over the previous year. The totaldistribution volume in 2002 was 12.63million tonnes, representing an increase of8.5% over the previous year. The retail anddistribution volume of refined oil productsaccounted for 67.6% of the Company’s totaldomestic sales volume, representing anincrease of 5.5 percentage points over thepreceding year. By the end of 2002, theCompany had 24,000 COCO (CompanyOwned and Company Operated) petrolstations and 4,127 franchised petrolstations. The Jingmen-Shashi Pipeline andZhenhai-Kangqiao Pipeline had been put intooperation and the marketing network wasfurther improved. In 2002, the Company
also actively explored international marketsand exported 5.02 million tonnes of refinedoil products, representing an increase of34.58% over the preceding year.
In 2002, the Company continuously sped upthe progress of reform in the MarketingSegment, improved the integratedmanagement of prefecture- and county-levelsales companies, reduced administrativelevels, promoted intensive operation, furtheroptimized the transportation and storagefacilities, closed down inefficient and smallstorage terminals and consequently raisedits operating efficiency. The Companycontinuously used advanced informationtechnology to improve sales enterprisemanagement. The successful operation ofERP in Tianjin and Jiangsu sales companies,the start of primary and secondary logisticsoptimization, the information systemimprovement of sales management and thepilot application of IC card for petrolstations all brought about new vigor toincrease the competitiveness of theCompany’s Marketing and DistributionSegment.
Summary of the Marketing and Distribution Segment
Change in 2002
compared2002 2001 2000 to 2001 (%)
Total domestic sales of refined oilproducts (thousand tonnes) 70,090 67,740 67,690 3.5
Of which: Retail volume (thousand tonnes) 34,730 30,430 23,940 14.1Distribution volume (thousand tonnes) 12,630 11,640 – 8.5Wholesale volume (thousand tonnes) 22,730 25,670 43,750 –11.5
Average annual throughput / petrol station(tonne/station) 1,560 1,473 1,402 5.9
Total number of petrol stations underSinopec Corp. brand 28,127 28,246 25,493 –0.4
Of which: Number of COCO petrol stations 24,000 24,062 20,259 –0.3Number of franchised petrol stations 4,127 4,184 5,234 –1.4
Proportion of retail volume to totaldomestic sales (%) 49.6 44.9 35.4 4.7
percentage points
Year-end capacity of oil storage(thousand cubic metres) 13,970 15,134 14,640 –7.7

30
Bus
ines
s R
evie
w a
nd P
rosp
ects
BUSINESS REVIEW AND PROSPECTS (CONTINUED)

31
Bus
ines
s R
evie
w a
nd P
rosp
ects
CHEMICALSTHE COMPANY IS THE LARGEST PRODUCER AND THE LARGESTDISTRIBUTOR OF CHEMICAL PRODUCTS IN CHINA, WITH AN YEAR-ENDETHYLENE PRODUCTION CAPACITY OF APPROXIMATELY 2.8 MILLIONTONNES. IN 2002, THIS SEGMENT PRODUCED 2.716 MILLION TONNES OFETHYLENE, AND PRODUCTION OF ALL MAJOR CHEMICAL PRODUCTS WASINCREASED AFTER THE COMPLETION OF CERTAIN CHEMICAL FACILITIES.
32
Bus
ines
s R
evie
w a
nd P
rosp
ects
BUSINESS REVIEW AND PROSPECTS (CONTINUED)

33
Bus
ines
s R
evie
w a
nd P
rosp
ects
(4) Chemicals Segment
The Company maintained a high utilization
rate of the major chemical facilities in 2002
and concurrently sped up the revamping of
existing chemical facilities. With the
completion of the second round revamping
of Beijing Yanhua Petrochemical’s ethylene
facilities, the second round revamping of
ethylene facilities of Sinopec Shanghai
Petrochemical Company Limited (“Shanghai
Petrochemical”) and Sinopec Yangzi
Petrochemical Company Limited (“Yangzi
Petrochemical”) which was also completed
in 2001 and such facilities were put into
production, thereby further improving
product mix, increasing productivity and
significantly raising the outputs of the major
petrochemical products. The total output of
ethylene in 2002 was 2.7164 million tonnes,
representing an increase of 26.17% over the
preceding year. The output of major
chemical products such as synthetic resins,
synthetic fibers, monomers and polymers for
synthetic fibers, synthetic rubbers and urea
also showed relatively large increases. To
meet the market demand and increase its
profit margin, the Company further
increased its production volume of higher
value-added products. In 2002, the
Company produced 1.8469 million tonnes of
performance compound resins and 402
thousand tonnes of differential fibers,
representing an increase of 38.66% and
23.3% respectively over those in the
preceding year. The proportion of direct
sales of chemical products was increased
and the petrochemical products sales
through the e-commerce network reached
RMB 16.942 billion, accounting for about
24.35% of the total chemical products sales
revenue.
Production of Major Chemicals Unit: 10,000 tonnes
Change in 2002
compared2002 2001 2000 to 2001 (%)
Ethylene 271.64 215.3 217.0 26.2
Synthetic resins 400.48 320.4 318.3 25.0
Of which: Performance compound resins 184.69 133.2 128.0 38.7
Synthetic rubbers 45.77 39.8 31.7 15.0
Monomers/polymers for synthetic fibers 383.35 359.8 379.5 6.5
Synthetic fibers 115.30 102.8 106.8 12.2
Of which: Differential fibers 40.2 32.6 28.3 23.3
Urea 266.63 234.2 292.3 13.8
34
Bus
ines
s R
evie
w a
nd P
rosp
ects
BUSINESS REVIEW AND PROSPECTS (CONTINUED)
(5) Research and DevelopmentIn 2002, the Company made a number ofimportant achievements in scientific andtechnological innovation and won one firstprize for national technologicaladvancement, two second prizes for nationalinvention and seven second prizes fornational technological advancement. TheCompany applied for 760 patents in China in2002, of which 320 have been awardedpatent rights.
Exploration and production: To enhancecrude oil recovery rate and reduce costs, theCompany successfully developed under-balance pressure drilling technology, largedisplacement well drilling technology andintegrated technique of acquisition,processing and interpretation in full three-dimensional seismic exploration. TheCompany also achieved satisfactory progressin the geological studies of the new areas inwestern China, e.g. Tarim Basin, JungelBasin and old areas in eastern China,thereby providing a technological support forincreasing its oil and natural gas reserves.
Refining: To upgrade the quality of cleangasoline and diesel, the Companysuccessfully developed a 1.3 million tonnes/year RIPP (Sinopec Research Institute ofPetrochemical Processing) medium-pressurehydrocracking (RMC) technology, aMaximizing Iso-Paraffins technology (MIP),the second generation Gasoline OlefineReduction-II (GOR-II) and Additives (LAP-2),a Flexible Dual-riser Fluid Catalytic Crackingtechnology (FDFCC) and a RIPP IncreaseCetane Index Hydroprocessing technology(RICH).
Chemicals: To reduce investment andincrease competitiveness of technology andproducts, the Company developed acomplete set of 30,000 tonnes/year acrylicfiber production technology and a 30,000tonnes/year melt-direct spinning technologyfor PET staple fiber. In addition, theCompany’s co-developed 100 thousand
tonnes/year ethylene cracking furnace wassuccessfully applied to the ethylene facilitiesrevamping projects of ShanghaiPetrochemical and Yangzi Petrochemical,and the self-developed 200 thousandtonnes/year second generation loop reactorpolypropylene production facilities were alsosuccessfully put into operation. To increasehigher value-added products production, theCompany successfully developed 18 newsynthetic resin products (e.g. high speed Bi-Oriented Polypropylene Process (BOPP)) and22 types of new synthetic fiber productswith 40 specifications (e.g. superfine sea-island bicomponent fiber).
(6) Cost ReductionIn 2002, the Company made great efforts incarrying out its cost reduction plan. On thebasis of reducing major procurement costsof raw materials (e.g. crude oil), specialfocus was given to concrete measures suchas to minimize material and energyconsumption and administrative expenses.As a result, cost reduction achieved relativelygood results.
In 2002, the Company reduced costs byRMB 2.52 billion, and fulfilled the originaltarget of cost reduction. Cost reduction inexploration and production segment wasRMB 700 million and the cash operatingcost was reduced from US$ 6.15/barrel toUS$ 6.12/barrel; the cost in the refiningsegment was reduced by RMB 700 millionand the cash operating cost was reducedfrom US$ 2.07/barrel to US$ 2.03/barrel;the cost in the chemicals segment wasreduced by RMB 500 million and the cashoperating cost of ethylene production wasreduced from US$ 160/tonne to US$ 150/tonne; and the cost in the marketingsegment was reduced by RMB 620 millionand the cash operating cost was limited toRMB 166/tonne while continuouslyincreasing the ratio of retail anddistribution. Moreover, the Companycontinuously implemented its employeereduction plan and reduced about 25,000employees in the year.
35
Bus
ines
s R
evie
w a
nd P
rosp
ects
(7) Capital ExpenditureIn 2002, the Company continuously adheredto the investment policy of “Capitalexpenditure based on operating cash flow;controlling total investment size; centralizingdecision making, rationalizing investmentvariety, individually optimizing projects andincreasing return on investment”. TheCompany’s total capital expenditure wasabout RMB 41.6 billion, in which the capitalexpenditure for the Exploration andProduction Segment was RMB 20.23 billion.With the investment, the Company raisedproduction of crude oil and production ofnatural gas significantly. In certainpromising areas, a number of oil and gaswells of high production potential andblocks with high reserves were identified.The Company’s year-end proven recoverableeconomic reserves of oil and gas furtherincreased and the Company had a greaterthan 100% annual reserve replacement ratioin six consecutive years. The capitalexpenditure in the Refining Segment wasRMB 6.53 billion. 21 sets of new andrevamped facilities were put intocommissioning test run successively, therebyraising the Company’s clean fuel productioncapacity and sour crude oil processingcapacity. The commencement of theconstruction of the Ningbo-Shanghai-Nanjing Crude Oil Pipeline would facilitateoptimizing crude oil resources allocation andreducing the cost of crude oil purchase. Theexpenditure in the Chemicals Segment wasRMB 7.32 billion. A total of 12 new andrevamped facilities were put intocommissioning test run successively, anadditional production capacity of 600thousand tonnes/year for ethylene, 885thousand tonnes/year for synthetic resinsand 223.9 thousand tonnes/year formonomers/polymers for synthetic fiberswere achieved. The capital expenditure in theMarketing and Distribution Segment wasRMB 6.98 billion, which was mainly used tobuild new pipelines and further improve therefined oil products marketing networkthrough building new and revamped petrolstations and transforming old ones, therebyreinforcing the Company’s leading positionin principal markets and further raising itsbrand recognition and customer loyalty in itsprincipal markets. Other capital expenditurewas RMB 550 million, which was mainlyused for construction of information system.
The Company’s actual capital expenditure in2002 was RMB 5.4 billion more than theamount RMB 36.2 billion as originallyestimated. The excess was mainly due to thefollowing reasons: first, the success rate ofexploration in the Exploration andProduction Segment increased from 42.3%to 43.9%, which led to about RMB 500million more than the amount originallyestimated; secondly, the capital expenditurein the Marketing and Distribution Segmentwas RMB1.8 billion more than the amountoriginally estimated because of theacquisitions of the petrol stations in 2001which became the Company’s fixed assetsafter transfer in 2002 and the constructionof more petrol stations on expressways andin rural areas in order to seize marketopportunities at the end of the year; andthirdly, the capital expenditure in theRefining and Chemicals Segments was aboutRMB 1.4 billion more than the amountoriginally estimated for the early completionand commissioning of new and revampingfacilities in order to meet the strongdomestic market demand.
(8) Cooperation with Foreign PartiesIn 2002, the Company also made remarkableprogress in foreign cooperation. The jointventure ethylene projects implemented bythe Company with BASF in Nanjing and bp inShanghai respectively are both in all-roundconstruction stage and will be put intoproduction by the end of 2004 and early2005 respectively. The coal gasificationproject jointly implemented by the Companyand Shell in Hunan is in the stage ofconstruction and is expected to becompleted and put into production in 2005.The feasibility study report of the Fujianintegrated refining and chemical projectjointly implemented by the Company,ExxonMobil and Saudi Aramco has beenapproved by the State, and the Company ismaking preparations for the commencementof the project. Through these joint ventureprojects, the Company could learn theadvanced technologies and managementexperience from multi-national corporations,increase the Company’s competitiveness inthe market and meet the growing demand inChina’s domestic market and the market inthe Asia-Pacific region.

36
Bus
ines
s R
evie
w a
nd P
rosp
ects
BUSINESS REVIEW AND PROSPECTS (CONTINUED)
BUSINESS PROSPECTS
1 Market AnalysisThe Company anticipates that themacroeconomic situation in 2003 will havethe following characteristics:
(1) OpportunitiesAlthough there are many uncertaintiesregarding global economic growth, thePRC government will continuouslyimplement the policy of increasingdomestic demand, and the growth rateof China’s GDP is expected to exceed 7%in 2003; according to these estimates,the domestic demand for refined oilproducts is expected to grow by morethan 4% and the demand for chemicalproducts (in terms of ethylene) isexpected to maintain a growth rate ofmore than 10%, thereby providingfavorable environment for the growth ofthe Company’s production and sales ofrefined oil and petrochemical products.The PRC government’s achievements indisciplining domestic refined oil productsmarket in 2002 and the Company’scontinuous enhancement of itscoordination with other domestic refinedoil products marketing entities in 2003may further improve the domesticmarket environment for refined oilproducts. At the same time, the newproduction capacity resulting from therevamping and construction of facilities,the application of new technologies andthe continuous internal reform willstrongly support the Company’s costreduction for increasing efficiency.
(2) ChallengesWhile fully recognizing the above-mentioned opportunities, the Companyalso recognises many challenges, whichare mainly reflected in the followingaspects: first, the slow growth of globaleconomy and, in particular, the tensesituation in the Middle East will probablylead to drastic fluctuation of prices ofcrude oil, refined oil products andchemical products in the internationalmarket and consequently bringchallenges against the Company’sunderstanding of the market,
production, operation and management.Secondly, the year of 2003 is the secondyear after China’s accession to the WTO.The impacts arising from the reduction intariff and the opening of the market willincrease gradually. The increase ofimport quotas for non-State-owned oilproducts traders and the continuousreduction of import tariff rate forchemical products by 1 to 3 percentagepoints will lead to a more fierce marketcompetition.
2 ProductionFacing both opportunities and challenges in2003, the Company will adopt flexibleoperating strategies and focus on thefollowing aspects of work:
Exploration and Production: The Company willcontinue to adhere to the oil and natural gasdevelopment strategy of “stabilizingproduction of the existing fields in easternChina, developing the potential fields inwestern China, searching for the potentialreserves in southern China, laying equalstress on oil and natural gas, relying onscience and technology and reducing costfor increasing efficiency”, insist on theprinciple of controlling reserves, output andefficiency as a whole, speed up theexploration of the new areas in westernChina and the other key blocks, steadilyincrease replacement resources and oil andnatural gas production, carry out adjustmentand potential tapping in the old areas,maintain the stable production of quality oiland natural gas and ensure the realizationof a replacement ratio over 100%. TheCompany plans to build an additional crudeoil production facility with capacity of 5.58million tonnes and an additional natural gasproduction facility with capacity of 674million cubic meters and produce 38.1million tonnes of crude oil and 5.3 billioncubic meters of natural gas in 2003.
Refining Segment: Oriented to marketdemand and backed by managerialinnovation and scientific and technologicaladvancement, the Company will strengthenmanagement, optimize resources, adjustproduct mix and strive for enhancing itsprofit ability. The Company plans to process
a total of 110.92 million tonnes of crude oiland produce 60.96 million tonnes of refinedoil products and 17.15 million tonnes ofchemical feedstock in 2003. The Companywill continuously expand the market andstrive to increase the output of high value-added products, such as LPG, propylene,high-grade asphalt and lubricants,continuously raise the major technical andeconomic indicators of refining and increaseits light yield to 73.5% and its refining to92.55%.
Chemicals Segment: To satisfy the growingmarket demand, the Company willstrengthen management and maintain safe,stable and full-utilization production in along period. The Company plans to producea total of 3.05 million tonnes of ethylene,4.46 million tonnes of synthetic resins, 470thousand tonnes of synthetic rubbers, 1.24million tonnes of synthetic fibers and 4.21million tonnes of monomers and polymersfor synthetic fibers in 2003. Layingparticular stress on product quality, typesand cost, the Company will enhance thecompetitiveness of its products, furtherraise the output of performance compoundresins and differential fibers, strengthen itsefforts in marketing and services andendeavor to increase the proportion of thedirect sales of major chemical products.
Marketing and Distribution Segment: TheCompany will continuously strengthen itssense of market, competition and service,give full play to its role as a market leader,actively expand market, further improve itsmarketing network, build petrol stations onnew expressways, on waterways and in ruralareas, enhance its market control and sustainprofit ability, further adjust its marketingstructure, strive to raise the volume of retail,distribution and franchised sales, increase itsshare in the retail market, continuouslystrengthen its coordination and cooperationwith other domestic refined oil productsoperators, improve the operating environmentand reasonably arrange its domestic supplyand export of refined oil products accordingto domestic and international demands tobalance the supply and demand in thedomestic market. While expanding thedomestic market, the Company will further
37
Bus
ines
s R
evie
w a
nd P
rosp
ects
increase its export volume, continuouslyoptimize the flow direction of refined oilproducts, reduce costs and increaseefficiency. The Company plans to sell a totalof 73 million tonnes of refined oil products inthe domestic market (including a retailvolume of 37.5 million tonnes anddistribution of 14 million tonnes) and export5.5 million tonnes of refined oil products.
Cost reduction: In 2003, the Company willcontinuously rely on scientific andtechnological advancement to strengthenmanagement, intensify reform andcontinuously increase efficiency. It plans toreduce cost by RMB 2.5 billion, includingRMB 1 billion in the Exploration andProduction Segment, RMB 600 million in theRefining Segment, RMB 400 million in theChemicals Segment and RMB 500 million inthe Marketing and Distribution Segment.
Prudent investment: The Company’s plannedcapital expenditure in 2003 is RMB 37.6billion which will mainly be attributable fromthe cash flow from business operations andfinancings from sources in China or outsideChina. This includes RMB 18 billion in theExploration and Production Segment, RMB6.34 billion in the Refining Segment, RMB7.64 billion in the Chemicals Segment, RMB5 billion in the Marketing and DistributionSegment and RMB 620 million forconstruction of ERP system and otherpurposes. The focuses of capital expenditurein 2003 will be on (1) further optimizing thestructure of investment, maintaining theinvestment efforts in the Exploration andProduction Segment and striving forincrease in replacement resources, (2) morevigorously tapping the potential andincreasing the efficiency of the old blocks ofoilfields and the existing refining andchemical enterprises, (3) continuouslyupgrading petrol stations in central citiesand build petrol stations in new urban areasand on newly built expressways, (4)completing the construction of the long-distance Ningbo-Shanghai-Nanjing crude oilpipeline, and (5) fully launch of the ethylenefacilities revamping project of QiluPetrochemical Corp and ensuring the
completion and commissioning of theparaxylene project of Zhenhai Refining andChemical Co., Ltd. and the PTA project ofYizheng Chemical Fiber Co., Ltd.
In addition, the two world-scale ethylenejoint venture projects between the Company,and BASF and bp, respectively, will alsoenter the peak construction period. TheCompany will make investment in theproportion of the shares held by theCompany in the joint venture companies atappropriate time according to theconstruction plans made by the joint venturecompanies’ boards of directors, and willthen include the investments in its capitalexpenditure. It is estimated that the totalconstruction investment for the two jointventure projects in 2003 will be about RMB10 billion.
Information system construction: TheCompany will continue to extensively adoptinformation technology, speed upconstruction of its information system andmake new achievements in increasing itstechnical level, enhancing its marketadaptability and raising its internal controlability and efficiency. The Company willstrengthen the construction of informationinfrastructure in all aspects, continuouslyexpand the experimentation andpopularization of ERP system, furtherimprove the two management informationsystems for financial management andrefined oil products sales management andthe two e-commerce networks for purchaseof resources and chemical productsmarketing, apply computer-aided decision-making system to crude oil resourcesoptimization and supply chain optimizationin an in-depth way, build and popularize anrefined oil products distribution optimizingsystem and promote the application of IC oilfilling card.
Facing both opportunities and challenges in theyear ahead, the Company will, depending on theunremitting efforts of all its employees, furtherenhance its competitiveness and maintainexcellent performance in production andoperation.

38
Bus
ines
s R
evie
w a
nd P
rosp
ects
BUSINESS REVIEW AND PROSPECTS (CONTINUED)
HEALTH, SAFETY AND ENVIRONMENT (HSE)SINOPEC CORP. HAS ALWAYS BEEN STRIVING FOR HARMONYBETWEEN HEALTH, SAFETY AND ENVIRONMENT AND ECONOMICDEVELOPMENT AND THE ESTABLISHMENT OF A SAFE AND CLEANPRODUCTION MECHANISM.

39
Bus
ines
s R
evie
w a
nd P
rosp
ects

BUSINESS REVIEW AND PROSPECTS (CONTINUED)
40
Bus
ines
s R
evie
w a
nd P
rosp
ects
Bus
ines
s R
evie
w a
nd P
rosp
ects
41
Hea
lth,
Saf
ety
and
Env
iron
men
tSinopec Corp. has always been striving forharmony between HSE (health, safety andenvironment) and economic development andthe establishment of a safe productionmechanism with long-term effects. TheCompany has scrupulously undertaken itsresponsibility for the society andconscientiously implemented the policy of“regarding safety the utmost, laying particularstress on prevention, relying on the efforts of allpeople, carrying out comprehensivemanagement, improving environment,protecting health, realizing scientificmanagement and achieving sustainabledevelopment”. In 2002, the Companymaintained safe and stable production,endeavored to provide the public with safe,reliable, quality and environment-friendlyproducts, made vigorous efforts to protect theenvironment and take care of the employees’health, continuously improved its relationshipwith the peripheral communities, established agood corporate image and made greaterachievements in health, safety and environmentmanagement.
� Steady promotion of HSE management
Since Sinopec Corp. publicly announced itsimplementation of HSE management systemin 2001, all its employees have made activeresponse and strived for minimizing theincidence of accidents, hazards to personalhealth and environment damages and buildingSinopec Corp. into a world-class enterprise interms of HSE management, and the Companyhas invited an international HSE consultingservice company to instruct its subsidiaries’building of HSE management systems. By theend of 2002, 25 branch companies orsubsidiaries of Sinopec Corp. have alreadyestablished fairly complete HSE managementsystems and put them into operation.
� Implementation of safety pre-appraisal fornew projects according to the policy of layingthe first stress on prevention
In 2002, the Company completed safety pre-appraisal for a number of revamping andexpansion projects, including the 900thousand tonnes/year ethylene project ofShanghai Secco and Ningbo-Shanghai-NanjingPipeline Project. For the equipment, facilitiesand public engineering systems that hadalready been completed and put intoproduction, the Company carried out regularrisk appraisal. The Company also implementeddynamic monitoring for key equipment and keyparts with designated persons to managethem. For the problems discovered duringappraisal, the Company traced and managedthe whole process of hidden perils until allhidden perils were eliminated to ensure safeproduction.
� Active promotion of clean production, watersaving and pollution reduction
In 2002, the Company completed cleanproduction demonstration for seven sets ofequipment, selected five clean productiontechnologies valuable for popularization,actively developed water-saving technologyand implemented water consumption controlon the basis of fixed quotas. The Company’sindustrial water consumption was reduced by6.6% as compared with that in 2001.
� Development of a number of technologies forimproving the quality of refined oil productsto provide cleaner fuels
Sinopec Corp. began completely implementingthe new national standard for light diesel fromJuly 1, 2002 and reduced the sulfur content inits light diesel products from 1.0%(m/m)under the old standard to 0.2%(m/m) underthe new one. Sinopec Corp. will completelyimplement the new national standard forautomotive gasoline from July 1, 2003.
HEALTH, SAFETY AND ENVIRONMENT

MANAGEMENT’S DISCUSSION AND ANALYSIS
42
Man
agem
ent’
s D
iscu
ssio
n an
d A
naly
sis
1 CONSOLIDATED RESULTS OF OPERATIONSIn 2002, the Company’s turnover andoperating profit were RMB 324.2 billion andRMB 28.3 billion, respectively, up by 6.5%and 3.7%, respectively, from those in 2001.The increase in the Company’s turnover andoperating profit was largely attributable tothe Company’s flexible adjustment of itsoperation in response to the opportunitiespresented by the better prices and the moreorderly market, and the Company quicklyturned around the poor performance it wentthrough in January and February 2002 byexpanding the market and carrying outvarious measures to cut cost and improveefficiency. Since March 2002, the Company’soperating results have improved significantlyand continued to maintain a fair growthmomentum. In particular, the refiningsegment and marketing and distributionsegment have significantly increased theiroperating profits and the chemicals segmenthas turned operating loss into operatingprofit.
The table below shows the main revenue andexpense items from the consolidated incomestatement of the Company for the indicatedperiods.
THE FOLLOWING DISCUSSION AND ANALYSIS SHOULD BE READ IN CONJUNCTION WITH THE COMPANY’AUDITED FINANCIAL STATEMENTS AND THE ACCOMPANYING NOTES ON PAGE 114 TO 142 OF THEANNUAL REPORT. THE FINANCIAL INFORMATION PRESENTED IN THE SECTION ARE DERIVED FROM THECOMPANY’S AUDITED FINANCIAL STATEMENTS THAT HAVE BEEN PREPARED IN ACCORDANCE WITHINTERNATIONAL FINANCIAL REPORTING STANDARDS (“IFRS”).
Other operating revenues primarily consistof sales revenue generated by the Companyfrom sale of certain ancillary products andraw materials to Sinopec Group Companyand third parties as well as rendering ofvarious services. Turnover and otheroperating revenues are mainly composed ofthe following sales:
Sales of crude oil and natural gas
The Company produces crude oil and naturalgas principally to supply its refining andchemical operations. Natural gas and arelatively small portion of the Company’scrude oil products are sold to the refineriesowned by Sinopec Group Company and thirdparty customers.
In 2002, external sales revenues of crude oiland natural gas contributed RMB 10.9billion, or 3.2%, of the turnover and otheroperating revenues of the Company, down byRMB 0.2 billion compared with those in2001. This decrease was primarily due to adecline of 5.3% in the average realized priceof crude oil from RMB 1,255.67 per tonne in2001 to RMB 1,189.38 per tonne in 2002.However, the average realized price ofnatural gas slightly rose by 0.7% from RMB570.14 per thousand cubic meter in 2001 toRMB 574.21 per thousand cubic meter in2002. The external sales volume of crude oilincreased from 6.05 million tonnes in 2001to 6.35 million tonnes in 2002, and externalsales volume of natural gas increased from2.9 billion cubic meters in 2001 to 3.2billion cubic meters in 2002. The increasedexternal sales volume of crude oil andnatural gas partially offset the negativeimpact of the price decline of crude oil onthe sales revenues of crude oil and naturalgas.
Sales of petroleum products
Both the refining and the marketing anddistribution segments make external salesof refined petroleum products (whichconsist primarily of gasoline, diesel,kerosene and jet fuel and other refinedproducts). External sales revenues ofpetroleum products from the two segmentsin 2002 were RMB 231.9 billion,
(1) Turnover and other operating revenuesIn 2002, the Company’s turnover and otheroperating revenues increased by 6.8%, orRMB 21.5 billion, from RMB 318.5 billion in2001 to RMB 340 billion in 2002. Turnoverincreased by RMB 19.8 billion, or 6.5%,from RMB 304.4 billion in 2001 to RMB324.2 billion in 2002. The increase inturnover was primarily due to:
� the prices of crude oil, refined productsand chemical products increased as theinternational market conditions of therespective products gradually improvedsince March 2002;
� a number of chemicals productionfacilities have been revamped to increasecapacity; and
� the sales volume of refined products andchemical products increased as a result ofthe management’s efforts to expanddomestic as well as international marketand capture the profit-making opportunity.Other operating revenues increased by12.1%, or RMB 1.7 billion, from RMB 14.1billion in 2001 to RMB 15.8 billion in2002.
Year ended 31 December Percentage Change(RMB billion yuan) from 2001 to 2002
2002 2001 (%)Turnover and other operating revenues 340.0 318.5 6.8Of which: turnover 324.2 304.4 6.5Other operating revenues 15.8 14.1 12.1Operating expenses (311.7) (291.2) 7.0Purchased crude oil, products and operating
supplies and expenses (235.2) (220.3) 6.8Selling, general and administrative expenses (21.1) (17.1) 23.4Depreciation, depletion and amortization (24.2) (22.4) 8.0Exploration expenses (including dry holes) (4.4) (3.8) 15.8Personnel expenses (13.6) (12.9) 5.4Employee reduction expenses (0.2) (2.6) (92.3)Taxes other than income tax (11.9) (11.9) 0.0Other operating expenses (net) (1.1) (0.2) 450.0
Operating profit 28.3 27.3 3.7Net finance costs (4.0) (3.2) 25.0Investment income and share of profit less losses
from associates and jointly controlled entities 0.5 0.5 0.0Profit from ordinary activities before taxation 24.8 24.6 0.8Income tax (7.6) (8.0) (5.0)Profit from ordinary activities after taxation 17.2 16.6 3.6Minority interests (1.1) (0.6) 83.3Profit attributable to shareholders 16.1 16.0 0.6
43
Man
agem
ent’
s D
iscu
ssio
n an
d A
naly
sis
contributing 68.2% of the Company’sturnover and other operating revenues, andrepresenting an increase of RMB 1.8 billion,or 0.8%, compared with RMB 230.1 billionin 2001. The sales revenues of gasoline anddiesel were RMB 169.3 billion, contributing73% of the sales revenues of refinedpetroleum products, and representing anincrease of RMB 4.9 billion, or 3%,compared with RMB 164.4 billion in 2001.The sales revenues of gasoline increased by4.8%, or RMB 2.9 billion, from RMB 60.4billion in 2001 to RMB 63.3 billion in 2002;the sales revenues of diesel increased by1.9%, or RMB 2 billion, from RMB 104billion in 2001 to RMB 106 billion in 2002.The increases in sales revenues of gasolineand diesel were mainly due to the increasedrealized gasoline price and the increasedsales volume of diesel, which increases wereattributable to the gradual recovery ofrefined products prices on the internationalmarket as well as the Company’s efforts toincrease the retail proportion of its salesand to further expand its market. In 2002,the average external sales price of gasolinewas RMB 2,806.04 per tonne, representingan increase of 5.4% over that in 2001; theaverage external sales price of diesel wasRMB 2,407.58 per tonne, representing adecline of 1.3% compared with that in2001. The sales volume of gasoline was22.54 million tonnes, down by 0.7%compared with that in 2001 and salesvolume of diesel was 44.03 million tonnes,up by 3.3% compared with that in 2001. Thetotal sales volume of gasoline and dieselrose by 1.9% compared with that in 2001.
Sales of chemicals
The external sales revenues of chemicalproducts were RMB 58.4 billion in 2002, upby RMB 9.5 billion, or 19.4%, comparedwith RMB 48.9 billion in 2001. This increasewas primarily due to the significant increaseof output and sales volume of the chemicalproducts as the Company completedrevamping of a number of chemicalsproduction facilities to expand capacity, andthe gradual recovery of chemical productsprices in 2002. The external sales volume ofsynthetic resin, synthetic rubber, syntheticfiber and monomers and polymers for
synthetic fiber were 3.3 million tonnes, 0.46million tonnes, 1.18 million tonnes and 1.7million tonnes, respectively, in 2002,representing an increase of 23.6%, 11%,8.5% and 0.3%, respectively, from those in2001. The average realized prices of theseproducts were RMB 5,238.22 per tonne,RMB 6,450.13 per tonne, RMB 8,435.24 pertonne and RMB 5,454.12 per tonne,respectively. Compared with 2001, theaverage realized prices of synthetic rubberand monomers and polymers for syntheticfiber went up by 4.5% respectively and thoseof synthetic resin and synthetic fiberdeclined by 5.6% and 0.9%, respectively. Asthe prices of various chemical productswent up and others went down in 2002, theaverage realized external sales prices of allchemical products in 2002 were at a similarlevel to those in 2001.
(2) Operating expensesThe Company’s operating expenses in 2002were RMB 311.7 billion, representing anincrease of RMB 20.5 billion, or 7%, fromthose in 2001. Operating expenses primarilyconsist of the following expense items:
Purchased crude oil, products and operatingsupplies and expenses
In 2002, purchased crude oil, products andoperating supplies and expenses of theCompany were RMB 235.2 billion,accounting for 75.5% of its total operatingexpenses, and representing an increase ofRMB 14.9 billion, or 6.8%, compared withRMB 220.3 billion in 2001.
� Purchased crude oil were RMB 118.3billion in 2002, accounting for 38% of thetotal operating expenses, and representingan increase of RMB 2.3 billion, or 2%,compared with RMB 116 billion in 2001.The increase was mainly due to theincreased crude oil throughput of theCompany as a result of the strong marketdemand associated with the fast growingChinese economy.
� The volume of purchased crude oilincreased partially due to the decrease inthe volume of crude oil supplied by theCompany’s own production. The
throughput of crude oil in 2002 were104.15 million tonnes (excluding crude oilprocessed for third parties), up by 3.11million tonnes, or 3.1%, compared with101.04 million tonnes in 2001. In 2002,the Company processed 28.98 milliontonnes of crude oil supplied by theCompany’s own exploration and productionsegment, down by 2.29 million tonnes, or7.3%, compared to 31.27 million tonnes in2001. The throughput of internallyproduced crude oil accounted for 27.8% ofthe total throughput of crude oil, while thethroughput of externally sourced crude oilwere 75.17 million tonnes, accounting for72.2% of the total throughput of crude oil(among which, 53.81 million tonnes weresourced from imports, 14.96 milliontonnes from PetroChina and 6.4 milliontonnes from CNOOC), and representing anincrease of 5.4 million tonnes, or 7.7%,compared with 69.77 million tonnes in2001. Although the international crude oilprices gradually went up after March 2002,the Company’s average purchase price ofexternally sourced crude oil in 2002 wentdown by RMB 88.52 per tonne, or 5.3%,from RMB 1,662.59 per tonne in 2001 toRMB 1,574.07 per tonne in 2002.
� In 2002, other purchased products andoperating supplies and expenses of theCompany accounted for RMB 116.9 billion,or 37.5% of the total operating expenses,up by 12.1%, or RMB 12.6 billion,compared with RMB 104.3 billion in 2001.This increase was primarily due to theincreased externally purchased chemicalfeedstock and the increased purchasedexpense associated with the increasedsales revenues of the Company’s overseastrading subsidiaries as they increased theirtrading activities of crude oil and refinedproducts in 2002.

MANAGEMENT’S DISCUSSION AND ANALYSIS (CONTINUED)
44
Man
agem
ent’
s D
iscu
ssio
n an
d A
naly
sis
Selling, general and administrative expenses
Selling, general and administrative expensesof the Company were RMB 21.1 billion in2002, up 23.4% compared with RMB 17.1billion in 2001. This increase was primarilydue to:
� An increase of RMB 0.85 billion intransportation and contracted laborexpenses as a result of the increases ofthe retail proportion of the sales ofgasoline and diesel and the total salesvolume of refined products;
� An increase of RMB 0.6 billion in theselling expenses associated with theincreased sales volume of chemicalproducts as a result of the expandedproduction capacity of certain chemicalproduction facility after revamp;
� An increase of approximately RMB 0.5billion in the selling, general andadministrative expenses in 2002 due to theincreased sales volume of products otherthan gasoline, diesel and kerosene;
� An increase of RMB 0.2 billion for researchand development;
� An increase of RMB 0.1 billion for theimplementation of the Company’smanagement information system; and
� The Company in 2001 strengthened theadministration of accounts receivable andcollected certain long outstanding debtsand reduced 2001 allowance for doubtfulaccounts accordingly.
Depreciation, depletion and amortization
Depreciation, depletion and amortization ofthe Company were RMB 24.2 billion in 2002,up by RMB 1.8 billion, or 8%, from RMB22.4 billion in 2001. This increase wasprimarily due to the commencement ofoperation of newly developed or acquiredproperties, plants and equipment includingoil and gas properties as a result of theCompany’s capital expenditure programmes.
Exploration expenses
Exploration expenses of the Company wereRMB 4.4 billion in 2002, up by RMB 0.6billion, or 15.8%, from RMB 3.8 billion in2001. This increase was primarily due to theCompany’s implementation of its strategy ofcontinuously expanding resources, wherebythe Company increased its explorationexpenditure in certain important areas inChina’s western region and southern marinebed formation areas so as to lay a firmfoundation for the potential future expansionof the Company’s crude oil reserves andproduction.
Personnel expenses
In 2002, personnel expenses of theCompany were RMB 13.6 billion, up by RMB0.7 billion, or 5.4%, from RMB 12.9 billionin 2001. The increase was mainly becausethe Company reinforced its performance-based incentive schemes, and in certainsubsidiaries special salaries were awardedfor certain special positions, resulting in anincrease of RMB 0.9 billion in salaryexpenses. In addition, expenses related towelfare and social security increased byRMB 0.3 billion in 2002. Despite theincrease, the personnel expenses in 2002have been effectively controlled as a whole.
Employee reduction expenses
Pursuant to the asset swap agreement betweenthe Company and Sinopec Group Company, theCompany made payment of RMB 0.24 billionrelating to 11,000 employees transferred toSinopec Group Company.
Taxes other than income tax
Taxes other than income tax of the Companywere RMB 11.9 billion, which is similar tothat in 2001.
Other operating expenses
The net amount of the Company’s otheroperating expenses were RMB 1.1 billion in2002, up by RMB 0.9 billion compared toRMB 0.2 billion in 2001. The increase wasprimarily attributable to the increased
expenses incurred for the disposal of certainobsolete and retired equipments aftervarious facilities’ upgrade.
(3) Operating profitIn 2002, the operating profit of theCompany was RMB 28.3 billion, up by RMB1 billion, or 3.7%, from RMB 27.3 billion in2001. This increase was resulted from acombination of various factors including: therecovery of crude oil and chemicals priceson the international market since March2002, and the management changed theCompany’s operating strategy in response toa more favorable market condition, and theCompany’s implementation of variousmeasures to strengthen the managementcontrol and to further expand the market.Over the year, the operating profit hasimproved over each quarter, in particular,operating profit in the first, second, thirdand fourth quarter were RMB 1.6 billion,RMB 9.1 billion, RMB 8.5 billion and RMB9.1 billion, respectively.
(4) Net finance costIn 2002, net finance cost of the Companywas RMB 4 billion, up by 25% comparedwith RMB 3.2 billion in 2001. The increasewas largely due to the following factors:
� Adversely affected by the fluctuation ofexchange rates, the Company had a netforeign exchange loss of approximatelyRMB 0.3 billion, representing an increasedfinance cost of RMB 0.7 billion comparedwith approximately RMB 0.4 billion of netforeign exchange gain in 2001;
� Net interest income in 2002 decreased byRMB 0.85 billion from that in 2001 as aresult of the reduction of time depositsassociated with the use of the offeringproceeds and the lower interest rate set byPeople’s Bank of China since February2002; and
� Interest expense in 2002 decreased byRMB 0.69 billion from 2001 as a result ofthe lower average interest rate in 2002 andthe Company’s effort to tighten itsoperational cash management and toimprove its financing structure, includingreducing the amount of short-term loans.
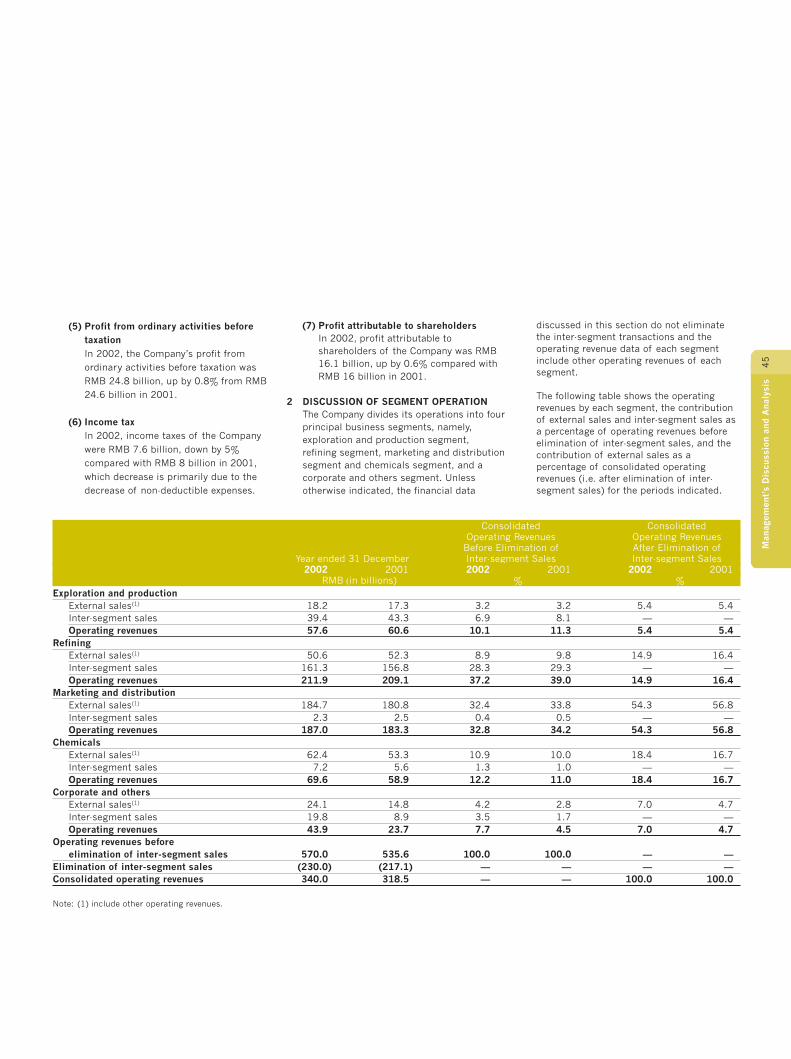
45
Man
agem
ent’
s D
iscu
ssio
n an
d A
naly
sis
(5) Profit from ordinary activities beforetaxationIn 2002, the Company’s profit fromordinary activities before taxation wasRMB 24.8 billion, up by 0.8% from RMB24.6 billion in 2001.
(6) Income taxIn 2002, income taxes of the Companywere RMB 7.6 billion, down by 5%compared with RMB 8 billion in 2001,which decrease is primarily due to thedecrease of non-deductible expenses.
(7) Profit attributable to shareholdersIn 2002, profit attributable toshareholders of the Company was RMB16.1 billion, up by 0.6% compared withRMB 16 billion in 2001.
2 DISCUSSION OF SEGMENT OPERATIONThe Company divides its operations into fourprincipal business segments, namely,exploration and production segment,refining segment, marketing and distributionsegment and chemicals segment, and acorporate and others segment. Unlessotherwise indicated, the financial data
discussed in this section do not eliminatethe inter-segment transactions and theoperating revenue data of each segmentinclude other operating revenues of eachsegment.
The following table shows the operatingrevenues by each segment, the contributionof external sales and inter-segment sales asa percentage of operating revenues beforeelimination of inter-segment sales, and thecontribution of external sales as apercentage of consolidated operatingrevenues (i.e. after elimination of inter-segment sales) for the periods indicated.
Consolidated ConsolidatedOperating Revenues Operating Revenues
Before Elimination of After Elimination ofYear ended 31 December Inter-segment Sales Inter-segment Sales
2002 2001 2002 2001 2002 2001RMB (in billions) % %
Exploration and productionExternal sales(1) 18.2 17.3 3.2 3.2 5.4 5.4Inter-segment sales 39.4 43.3 6.9 8.1 — —Operating revenues 57.6 60.6 10.1 11.3 5.4 5.4
RefiningExternal sales(1) 50.6 52.3 8.9 9.8 14.9 16.4Inter-segment sales 161.3 156.8 28.3 29.3 — —Operating revenues 211.9 209.1 37.2 39.0 14.9 16.4
Marketing and distributionExternal sales(1) 184.7 180.8 32.4 33.8 54.3 56.8Inter-segment sales 2.3 2.5 0.4 0.5 — —Operating revenues 187.0 183.3 32.8 34.2 54.3 56.8
ChemicalsExternal sales(1) 62.4 53.3 10.9 10.0 18.4 16.7Inter-segment sales 7.2 5.6 1.3 1.0 — —Operating revenues 69.6 58.9 12.2 11.0 18.4 16.7
Corporate and othersExternal sales(1) 24.1 14.8 4.2 2.8 7.0 4.7Inter-segment sales 19.8 8.9 3.5 1.7 — —Operating revenues 43.9 23.7 7.7 4.5 7.0 4.7
Operating revenues beforeelimination of inter-segment sales 570.0 535.6 100.0 100.0 — —
Elimination of inter-segment sales (230.0) (217.1) — — — —Consolidated operating revenues 340.0 318.5 — — 100.0 100.0
Note: (1) include other operating revenues.

MANAGEMENT’S DISCUSSION AND ANALYSIS (CONTINUED)
46
Man
agem
ent’
s D
iscu
ssio
n an
d A
naly
sis
The following table shows the operating revenues, operating expenses and operating profit by eachsegment before elimination of the inter-segment transactions for the periods indicated.
Percentage changeYear ended 31 December from 2001 to 2002
2002 2001 (%)RMB (billion)
Exploration and productionOperating revenues 57.6 60.6 (5.0)Operating expenses (42.8) (37.4) 14.4Operating profit 14.8 23.2 (36.2)
RefiningOperating revenues 211.9 209.1 1.3Operating expenses (206.0) (207.0) (0.5)Operating profit 5.9 2.1 181.0
Marketing and distributionOperating revenues 187.0 183.3 2.0Operating expenses (178.6) (180.9) (1.3)Operating profit 8.4 2.4 250.0
ChemicalsOperating revenues 69.6 58.9 18.2Operating expenses (69.5) (59.6) 16.6Operating profit 0.1 (0.7) (114.3)
Corporate and othersOperating revenues 43.9 23.7 85.2Operating expenses (44.9) (23.4) 91.9Operating profit (1.0) 0.3 (433.3)
(1) Exploration and Production SegmentExploration and production segmentconsists of the activities of the Companyrelated to exploring for and developing,producing and selling of crude oil andnatural gas.
In 2002, the operating revenues from theexploration and production segment wereRMB 57.6 billion, down by RMB 3 billion, or5%, from RMB 60.6 billion in 2001. Thedecline in operating revenues was primarilydue to the decrease of the average realizedprices and sales volume of crude oil.Despite that crude oil prices on theinternational market have graduallyincreased since March 2002, the Company’saverage realized crude oil price in 2002 wasstill lower than that of 2001, partly becausethe crude oil pricing mechanism in China,though links to the international marketprices, lags behind them for approximatelyone month.
In 2002, the segment’s average realizedprice of crude oil was RMB 1,317.82 per
tonne, down by 4% compared with RMB1,373.06 per tonne in 2001. Averagerealized price of natural gas was RMB571.69 per thousand cubic meter in 2002,up by 1.9% compared with RMB 561.08 perthousand cubic meter in 2001.
In 2002, the exploration and productionsegment sold 35.53 million tonnes of crudeoil, down by 0.48 million tonnes, or 1.3%,from 36.01 million tonnes in 2001. It alsosold 3.3 billion cubic meters of natural gas,up by 0.2 billion cubic meters, or 6.5%,from 3.1 billion cubic meters in 2001. Theproduction volume of crude oil in 2002 issimilar to that in 2001. While the crude oilproduction volume in 2002 remained at thesimilar level with 2001, the decline in crudeoil sales volume was primarily because theCompany sold an additional amount of 0.38million tonnes of inventory crude oil storedin the pipelines in 2001 compared with2002. The increase in natural gas salesvolume was primarily due to the increasedproduction of natural gas from SinopecNational Star and China’s western regions.
The operating expenses for the explorationand production segment were RMB 42.8billion, up by RMB 5.4 billion, or 14.4%, fromRMB 37.4 billion in 2001, which increase isprimarily due to the following reasons:
� The depreciation, depletion and amortizationincreased by RMB 0.9 billion from RMB 8.1billion in 2001 to RMB 9 billion in 2002 asmore fixed assets commenced operation asa result of the Company’s various capitalexpenditure programmes;
� The Company continued to implement itsstrategy of expanding resources in 2002,and increased its exploration expenditure incertain important areas in western Chinaand southern China’s marine bed formationareas so as to lay a firm foundation for thepotential future increase of crude oilreserve and production. Explorationexpenses (including dry holes expenses)were up by RMB 0.6 billion from RMB 3.8billion in 2001 to RMB 4.4 billion in 2002;
� In 2001, the Company collectedapproximately RMB 0.2 billion longoutstanding debts, while in 2002,allowance for doubtful accounts ofapproximately RMB 0.4 billion wasprovided for. The related expenses in 2002thus increased by approximately RMB 0.6billion compared with 2001.
� As a result of the segment’s reinforcementof its performance based incentiveschemes as well as the implementation ofnew incentive schemes in certainsubsidiaries such as special salaries forspecial positions, expenses related tosalaries, welfare and social securityincreased approximately by RMB 0.3billion in 2002 compared with 2001;
� The segment disposed certain obsoleteand retired equipment after variousfacilities’ upgrade, which resulted in anincrease of the related expenses byapproximately RMB 0.3 billion; and
� Other operating expenses of the segmentincluding supplies of raw materials in2002 were increased by RMB 0.9 billioncompared with 2001.
47
Man
agem
ent’
s D
iscu
ssio
n an
d A
naly
sis
Compared with 2001, while this segmentincreased some expenditure in 2002 thatwere necessary to maintain a stableproduction of crude oil, it continued toimprove measures on water injectionefficiency and other cost-cutting initiatives.As a result, the cash operating costs forcrude oil and natural gas productiondecreased by US$ 0.03 per barrel, or 0.5%,from US$ 6.15 per barrel in 2001 to US$6.12 per barrel in 2002.
In 2002, the operating profit of theexploration and production segment wasapproximately RMB 14.8 billion, down byRMB 8.4 billion, or 36.2%, from RMB 23.2billion in 2001. The decline was primarilydue to the decline of realized prices ofcrude oil as well as the increase ofdepreciation, depletion and amortizationexpenses and exploration expenses.
(2) Refining SegmentRefining segment consists of the operationsof the Company related to purchasing crudeoil from the Company’s exploration andproduction segment and from third parties,processing crude oil into refined products,selling refined products principally to theCompany’s marketing and distributionsegment and to other domestic and overseascustomers. To operate more efficiently as anintegrated company with distinct refiningand marketing and distribution segments,substantially all of the refining segment’ssale of gasoline, diesel and keroseneincluding jet fuel, other than exports, weremade to the marketing and distributionsegment, and other refined products weresold to domestic and overseas customers.
In 2002, the operating revenues from therefining segment were RMB 211.9 billion, upby 1.3% compared with RMB 209.1 billion in2001. The increase in operating revenueswas primarily due to the significant increasein revenues from the sales of chemicalfeedstock as well as some refined productsother than gasoline and diesel.
In 2002, the refining segment sold 19.3million tonnes of gasoline at an averagerealized price of RMB 2,280.51 per tonne,and realized sales revenues of RMB 44billion, accounting for 20.8% in the total
operating revenues of the refining segment.In 2001, the refining segment sold 18.72million tonnes of gasoline at an averagerealized price of RMB 2,386.88 per tonne,and realized sales revenues of RMB 44.7billion, accounting for 21.4% in the totaloperating revenues of the refining segmentin 2001.
Compared with 2001, the sales volume ofgasoline in 2002 increased by 0.58 milliontonnes, or 3.1%; the realized gasoline pricefell by RMB 106.37 per tonne, or 4.5%;sales revenues of gasoline decreased byRMB 0.7 billion, and that as a percentage ofthe refining segment’s total operatingrevenues declined by 0.6 percentage point.
In 2002, the refining segment sold 37.39million tonnes of diesel at an averagerealized price of RMB 2,126.55 per tonne,and realized sales revenues of RMB 79.5billion, accounting for 37.5% of the totaloperating revenues of the refining segment.In 2001, the refining segment sold 38.08million tonnes of diesel at an averagerealized price of RMB 2,199.94 per tonne,and realized sales revenues of RMB 83.8billion, accounting for 40.1% of the totaloperating revenues of the refining segmentin 2001.
Compared with 2001, the sales volume ofdiesel in 2002 decreased by 0.69 milliontonnes, or 1.8%; the realized diesel price fellby RMB 73.39 per tonne, or 3.3%; salesrevenues of diesel decreased by RMB 4.3billion, and that as a percentage of therefining segment’s total operating revenuesdeclined by 2.6 percentage points.
In 2002, the refining segment sold 20.09million tonnes of chemical feedstock at anaverage realized price of RMB 1,934.24 pertonne, and realized sales revenues of RMB38.9 billion, accounting for 18.4% of thetotal operating revenues of the refiningsegment. In 2001, the refining segment sold17.12 million tonnes of chemical feedstockat an average realized price of RMB1,990.49 per tonne, and realized salesrevenues of RMB 34.1 billion, accounting for16.3% of the total operating revenues of therefining segment in 2001.
Compared with 2001, the sales volume ofchemical feedstock in 2002 increased by2.97 million tonnes, or 17.3%; sales pricefell by RMB 56.25 per tonne, or 2.8%; salesrevenues increased by RMB 4.8 billion, andthat as a percentage of the refiningsegment’s total operating revenuesincreased by 2.1 percentage points. In 2002,as part of its optimization plan for resourceallocations, the segment adjusted itsproduct mix in accordance with theincreased demand on chemical segment andsignificantly increased its sales volume ofchemical feedstock.
In 2002, the refining segment sold 24.98million tonnes of other refined productsthan gasoline, diesel and chemical feedstockat an average realized price of RMB1,860.99 per tonne, and realized salesrevenues, of RMB 46.5 billion, accountingfor 21.9% of the total operating revenues ofthe refining segment. In 2001, the refiningsegment sold 23.43 million tonnes of theseother refined products at an average realizedprice of RMB 1,872.36 per tonne, andrealized sales revenues of RMB 43.9 billion,accounting for 21% of the total operatingrevenues of the refining segment in 2001.
Compared with 2001, the sale volume ofthese other refined products increased by1.55 million tonnes, or 6.6%; averagerealized sales price fell by RMB 11.37 pertonne, or 0.6%; sales revenues increased byRMB 2.6 billion, and that as a percentage ofthe segment’s total operating revenuesincreased by 0.9 percentage point. Theincrease in the sales volume of these otherrefined products outpaced that of gasolineand diesel, as the Company intended tocapture the favorable opportunitiespresented in the changing market bystrengthening the management control ofthese other refined products and increasingthe production of those products with higheradded value.
In 2002, the operating expenses of therefining segment were RMB 206 billion,down by RMB 1 billion, or 0.5%, from RMB207 billion in 2001. The decrease wasprimarily due to the reduction of averagecost of crude oil. In 2002, average cost ofcrude oil was RMB 1,532.48 per tonne,
MANAGEMENT’S DISCUSSION AND ANALYSIS (CONTINUED)
48
Man
agem
ent’
s D
iscu
ssio
n an
d A
naly
sis
down by RMB 85.41 per tonne, or 5.3%,from RMB 1,617.89 per tonne in 2001. In2002, the segment processed 104.15million tonnes of crude oil (excluding crudeoil processed for third parties), up by 3.11million tonnes from 101.04 million tonnes in2001, which increase was partially offset bythe decline of the average cost of crude oil.In 2002, total purchase expenses of crudeoil was RMB 159.6 billion, accounting for77.5% of the total operating expenses of therefining segment. In 2001, total purchaseexpenses of crude oil was RMB 163.5billion, accounting for 79% of the totaloperating expenses of the refining segment.Compared with 2001, the total purchaseexpenses of crude oil for the segment in2002 decreased by RMB 3.9 billion, and thatas a percentage of the segment’s totaloperating expenses decreased by 1.5percentage points.
In 2002, the Company’s refining margin(defined as the segment’s sales revenuesless crude oil expenses, feedstock expensesand taxes other than income tax; anddivided by the volume of crude oil andfeedstock processed) was US$3.95 perbarrel, which increased by US$0.38 perbarrel, or 10.6%, from US$3.57 per barrelin 2001.
In 2002, the unit cash operating cost of thissegment (defined as the segment’soperating expenses less purchase expensesof crude oil and feedstock, depreciation andamortization, taxes other than income taxand other operating expenses andadjustments, and divided by the volume ofcrude oil and feedstock processed) wasUS$2.03 per barrel, down by US$0.04 perbarrel from that of US$2.07 per barrel in2001. Such decrease was largely due to theimplementation of various cost reductionmeasures by the refining segment.
In 2002, the operating profit of the refiningsegment was RMB 5.9 billion, up by RMB3.8 billion, or 181%, from RMB 2.1 billion in2001. The increase was largely due to theincreased refining margins as a result of,among others, the increase of crude oilthroughput, the adjustment of product mix,the expansion of the market and the
increased production of refined productswith higher added value.
(3) Marketing and Distribution SegmentThe activities of the marketing anddistribution segment consist of purchasingrefined products from the refining segmentand third parties, wholesale of such refinedproducts to domestic customers (includingdirect distribution and direct sales to specialcustomers), retail sales and distribution ofsuch products through the Company’s retaildistribution network, and provision ofrelated services.
In 2002, the operating revenues of thissegment were RMB 187 billion, up by RMB3.7 billion, or 2%, from RMB 183.3 billion in2001. The increase was mainly due to theincrease of total sales volume of the refinedproducts. The total sales volume of therefined products by the segment in 2002was 73.61 million tonnes, up by 4.26 milliontonnes, or 6.1%, from 69.35 million tonnesin 2001.
� Retail sales as a percentage of thesegment’s total sales revenues furtherincreased in 2002. The retail sales revenueof gasoline and diesel accounted for43.7% of the segment’s operatingrevenues in 2002, up from 39.7% in 2001.Wholesale sales revenues of gasoline anddiesel accounted for 46.1% of theoperating revenues of this segment in2002, down from approximately 53% in2001.
In 2002, wholesale sales volume accountedfor 55.2% of the total sales volume ofgasoline and diesel, down by 2.4 percentagepoints from 57.6% in 2001. Retail salesvolume accounted for 44.8% of the totalsales volume of gasoline and diesel in 2002,up by 2.4 percentage points from 42.4% in2001. The increase in retail sales revenueand retail sales volume was mainly a resultof the increased average throughput at eachgas station, which increase was attributableto the Company’s continued effort toenhance its retail distribution network, tofurther optimize the locations of its existinggas stations and to improve its qualityof service.
In 2002, the sales revenues of gasoline wereRMB 61 billion, up by RMB 5.3 billion, or9.5%, from RMB 55.7 billion in 2001. Thisincrease was primarily due to the increasedsales volume as well as the increased salesprices of gasoline. Gasoline sales priceincreased because of the increased retailsales proportion as well as the increasedsales volume of higher grade gasoline. In2002, the sales volume of gasoline was21.36 million tonnes, up by 1.09 milliontonnes, or 5.4%, from 20.27 million tonnesin 2001. In addition, the sales volume ofgasoline with grade above #90 as apercentage of the segment’s total gasolinesales volume was further enhanced, up by31% from 4.41 million tonnes in 2001 to5.78 million tonnes in 2002. In 2002, theaverage realized sales price of gasoline wasRMB 2,856.68 per tonne, up by RMB 107.56per tonne, or 3.9%, compared with RMB2,749.12 per tonne in 2001.
� In 2002, the retail sales volume of gasolineincreased to 12.34 million tonnes, up by1.5 million tones, or 13.9%, from 10.84million tonnes in 2001; and the averagerealized retail sales price of gasoline wasRMB 3,061.82 per tonne, up by 4.3%compared with RMB 2,934.55 per tonne in2001;
� In 2002, the wholesale sales volume ofgasoline (excluding direct distribution salesvolume and those directly sold to specialcustomers) was 7.25 million tonnes, downby 0.69 million tonnes, or 8.7%, from 7.94million tonnes in 2001; and the averagerealized wholesale sales price of gasolinewas RMB 2,585.31 per tonne, up by 1.9%compared with RMB 2,536.2 per tonne in2001;
� In 2002, the direct distribution salesvolume of gasoline was 1.04 milliontonnes, up by 0.41 million tonnes, or64.5%, from 0.63 million tonnes in 2001;and the average realized price for thedirect distribution sales of gasoline wasRMB 2,693.28 per tonne, up by 1.9%compared with RMB 2,642.34 per tonne in2001; and

49
Man
agem
ent’
s D
iscu
ssio
n an
d A
naly
sis
� In 2002, the direct sales volume ofgasoline to special customers was 0.72million tonnes, down by 0.14 milliontonnes, or 16.3%, from 0.86 million tonnesin 2001; and the average realized price ofgasoline sold to special customers wasRMB 2,312.75 per tonne, down by 5.9%compared with RMB 2,457.12 per tonne in2001.
In 2002, the sales revenues of diesel wereRMB 107 billion, up by RMB 3.2 billion, or3.1%, from RMB 103.8 billion in 2001. Theincrease was primarily due to the increasedsales volume of diesel. In 2002, the salesvolume of diesel was 44.5 million tonnes, upby 1.95 million tonnes, or 4.6%, from 42.55million tonnes in 2001; the average realizedsales price of diesel was RMB 2,404.85 pertonne, down by RMB 35.6 per tonne, or1.5%, compared with RMB 2,440.45 pertonne in 2001.
� In 2002, the retail sales volume of dieselincreased to 17.16 million tonnes, up by1.34 million tonnes, or 8.5%, from 15.82million tonnes in 2001; and the averagerealized retail sales price of diesel wasRMB 2,562.49 per tonne, down by 1.1%compared with RMB 2,590.59 per tonnein 2001;
� In 2002, the wholesale sales volume ofdiesel (excluding the direct distributionsales volume and those directly sold tospecial customers) was 17.85 milliontonnes, down by 1.12 million tonnes, or5.9%, from 18.97 million tonnes in 2001;and the average realized wholesale salesprice of diesel was RMB 2,297.06 pertonne, down by 2.6% compared with RMB2,357.51 per tonne in 2001;
� In 2002, the direct distribution salesvolume of diesel was 5.48 million tonnes,up by 2.38 million tonnes, or 76.8%, from3.1 million tonnes in 2001; and the averagerealized price for the direct distributionsales of diesel was RMB 2,397.89 pertonne, down by 1.7% compared withRMB 2,438.83 per tonne in 2001;
� In 2002, the direct sales volume of dieselto special customers was 4.01 milliontonnes, down by 0.65 million tonnes, or13.9%, from 4.66 million tonnes in 2001;and the average realized price of dieselsold to special customers was RMB2,219.39 per tonne, down by 2.2%compared with RMB 2,269.32 per tonnein 2001.
In 2002, the sales revenue of keroseneincluding jet fuel was RMB 9.2 billion, downby RMB 1.1 billion, or 11.3%, from RMB10.3 billion in 2001. The decrease wasprimarily due to the decline of the averagerealized prices of kerosene including jet fuel.The average realized diesel price of keroseneincluding jet fuel was RMB 2,111.92 pertonne in 2002, down by 23.4% comparedwith RMB 2,757 per tonne in 2001.
In 2002, the operating expenses of themarketing and distribution segment wereRMB 178.6 billion, down by RMB 2.3 billion,or 1.3%, from RMB 180.9 billion in 2001.The purchase costs of gasoline and diesel in2002 were RMB 146.2 billion, accounting for81.9% of the total operating expenses ofthis segment. The average purchase costs ofgasoline and diesel decreased from 2001 by8.6% and 6.4%, respectively, to RMB2,357.28 per tonne and RMB 2,155.17 pertonne in 2002, respectively. However, thesales volume of gasoline and dieselincreased from 2001 by 5.4% and 4.6%,respectively, to 21.36 million tonnes and44.5 million tonnes in 2002, respectively.
In 2002, this segment’s cash operating cost(defined as the operating expenses lesspurchased products expenses, taxes otherthan income tax, depreciation andamortization; and divided by the salesvolume) was RMB 166 per tonne, up by1.84% compared with RMB 163 per tonne in2001. The increase was largely due to theincreased retail proportion in the salesvolume of gasoline and diesel, which led tothe increased transportation and contractedlabor expenses.
In 2002, the operating profit of themarketing and distribution segment wasRMB 8.4 billion, up by RMB 6 billion, or250%, from 2001. Such increase wasprimarily because, as the general marketconditions improved, the total sales volumeof refined products increased. The increasewas also due to the increased retailproportion in the total sales volume as wellas the increased sales volume of highergrade gasoline.
Over the year, the operating profit of themarketing and distribution segmentgradually improved from a sluggish start inJanuary and February 2002, at which timethe refined products prices were at thelowest level for the entire year. With thegradual recovery of prices of crude oil andrefined products on the international marketsince March 2002, the Company closelymonitored the market changes with a view tocapturing the favorable opportunitiespresented and further optimizing thedeployment of the resources for refinedproducts. In response to the market demand,the Company, adopted a number of effectiveinitiatives including tighter control of theCompany’s crude oil throughput and thevolume of refined products in domesticmarket. As a result, the performance of themarketing and distribution segmentimproved significantly over the year.
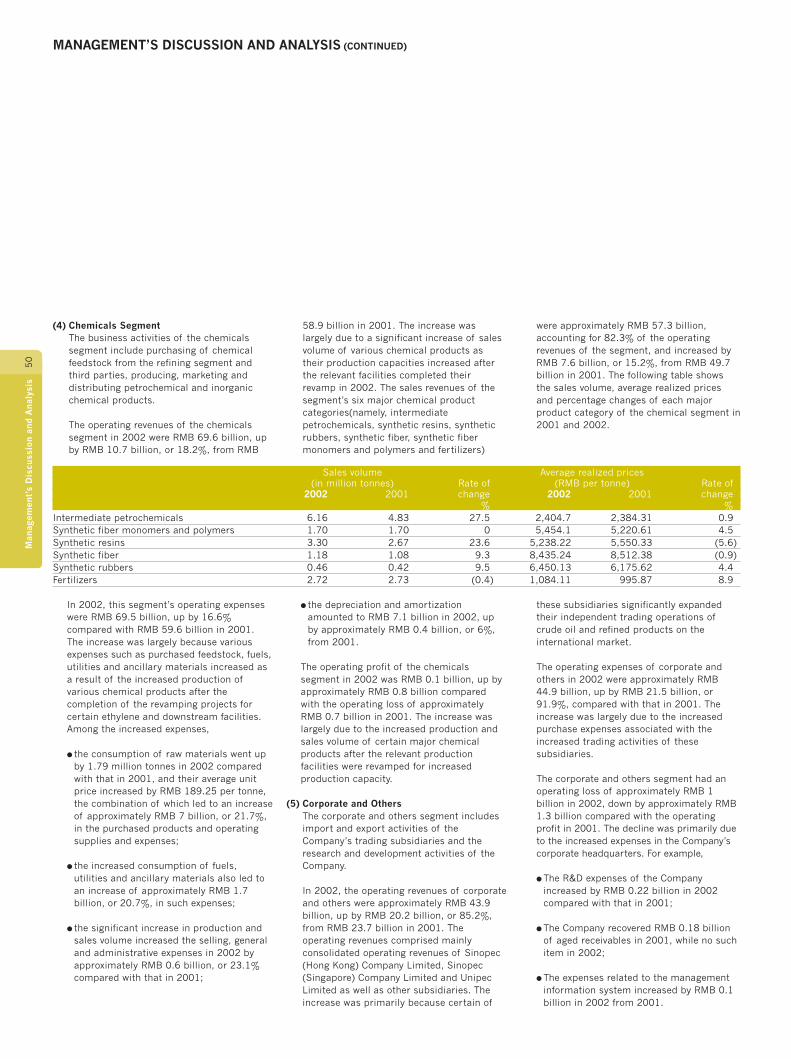
MANAGEMENT’S DISCUSSION AND ANALYSIS (CONTINUED)
50
Man
agem
ent’
s D
iscu
ssio
n an
d A
naly
sis
(4) Chemicals SegmentThe business activities of the chemicalssegment include purchasing of chemicalfeedstock from the refining segment andthird parties, producing, marketing anddistributing petrochemical and inorganicchemical products.
The operating revenues of the chemicalssegment in 2002 were RMB 69.6 billion, upby RMB 10.7 billion, or 18.2%, from RMB
58.9 billion in 2001. The increase waslargely due to a significant increase of salesvolume of various chemical products astheir production capacities increased afterthe relevant facilities completed theirrevamp in 2002. The sales revenues of thesegment’s six major chemical productcategories(namely, intermediatepetrochemicals, synthetic resins, syntheticrubbers, synthetic fiber, synthetic fibermonomers and polymers and fertilizers)
were approximately RMB 57.3 billion,accounting for 82.3% of the operatingrevenues of the segment, and increased byRMB 7.6 billion, or 15.2%, from RMB 49.7billion in 2001. The following table showsthe sales volume, average realized pricesand percentage changes of each majorproduct category of the chemical segment in2001 and 2002.
Sales volume Average realized prices(in million tonnes) Rate of (RMB per tonne) Rate of
2002 2001 change 2002 2001 change % %
Intermediate petrochemicals 6.16 4.83 27.5 2,404.7 2,384.31 0.9Synthetic fiber monomers and polymers 1.70 1.70 0 5,454.1 5,220.61 4.5Synthetic resins 3.30 2.67 23.6 5,238.22 5,550.33 (5.6)Synthetic fiber 1.18 1.08 9.3 8,435.24 8,512.38 (0.9)Synthetic rubbers 0.46 0.42 9.5 6,450.13 6,175.62 4.4Fertilizers 2.72 2.73 (0.4) 1,084.11 995.87 8.9
In 2002, this segment’s operating expenseswere RMB 69.5 billion, up by 16.6%compared with RMB 59.6 billion in 2001.The increase was largely because variousexpenses such as purchased feedstock, fuels,utilities and ancillary materials increased asa result of the increased production ofvarious chemical products after thecompletion of the revamping projects forcertain ethylene and downstream facilities.Among the increased expenses,
� the consumption of raw materials went upby 1.79 million tonnes in 2002 comparedwith that in 2001, and their average unitprice increased by RMB 189.25 per tonne,the combination of which led to an increaseof approximately RMB 7 billion, or 21.7%,in the purchased products and operatingsupplies and expenses;
� the increased consumption of fuels,utilities and ancillary materials also led toan increase of approximately RMB 1.7billion, or 20.7%, in such expenses;
� the significant increase in production andsales volume increased the selling, generaland administrative expenses in 2002 byapproximately RMB 0.6 billion, or 23.1%compared with that in 2001;
� the depreciation and amortizationamounted to RMB 7.1 billion in 2002, upby approximately RMB 0.4 billion, or 6%,from 2001.
The operating profit of the chemicalssegment in 2002 was RMB 0.1 billion, up byapproximately RMB 0.8 billion comparedwith the operating loss of approximatelyRMB 0.7 billion in 2001. The increase waslargely due to the increased production andsales volume of certain major chemicalproducts after the relevant productionfacilities were revamped for increasedproduction capacity.
(5) Corporate and OthersThe corporate and others segment includesimport and export activities of theCompany’s trading subsidiaries and theresearch and development activities of theCompany.
In 2002, the operating revenues of corporateand others were approximately RMB 43.9billion, up by RMB 20.2 billion, or 85.2%,from RMB 23.7 billion in 2001. Theoperating revenues comprised mainlyconsolidated operating revenues of Sinopec(Hong Kong) Company Limited, Sinopec(Singapore) Company Limited and UnipecLimited as well as other subsidiaries. Theincrease was primarily because certain of
these subsidiaries significantly expandedtheir independent trading operations ofcrude oil and refined products on theinternational market.
The operating expenses of corporate andothers in 2002 were approximately RMB44.9 billion, up by RMB 21.5 billion, or91.9%, compared with that in 2001. Theincrease was largely due to the increasedpurchase expenses associated with theincreased trading activities of thesesubsidiaries.
The corporate and others segment had anoperating loss of approximately RMB 1billion in 2002, down by approximately RMB1.3 billion compared with the operatingprofit in 2001. The decline was primarily dueto the increased expenses in the Company’scorporate headquarters. For example,
� The R&D expenses of the Companyincreased by RMB 0.22 billion in 2002compared with that in 2001;
� The Company recovered RMB 0.18 billionof aged receivables in 2001, while no suchitem in 2002;
� The expenses related to the managementinformation system increased by RMB 0.1billion in 2002 from 2001.
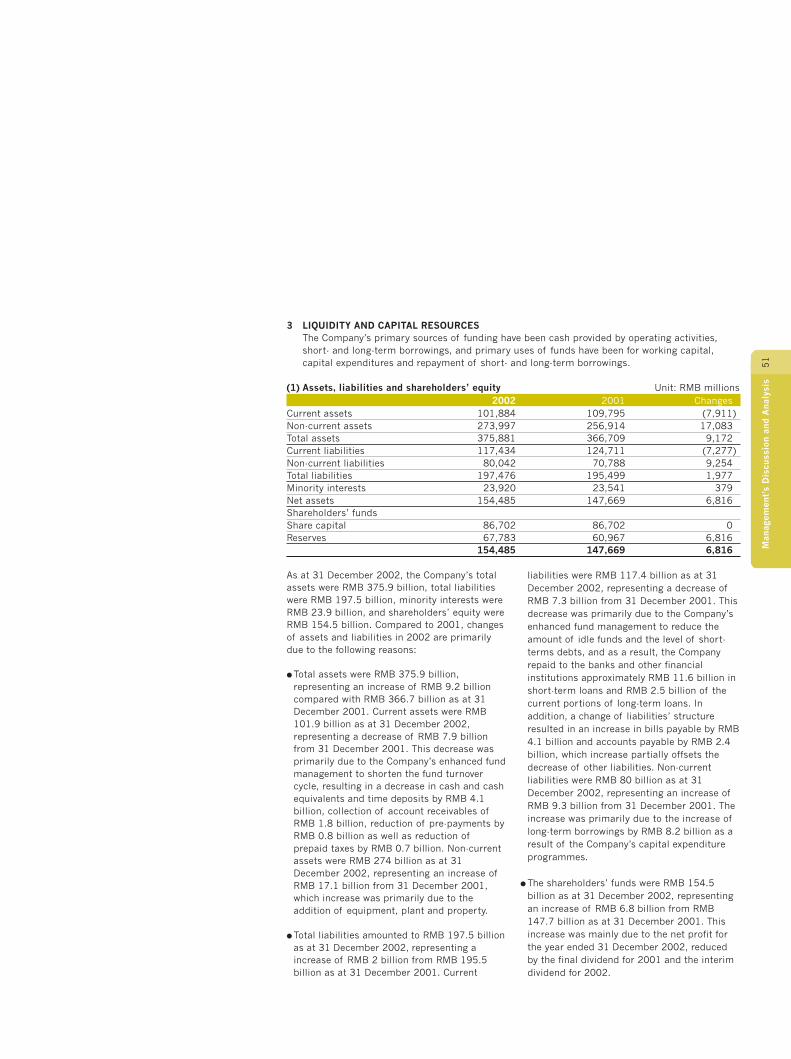
51
Man
agem
ent’
s D
iscu
ssio
n an
d A
naly
sis
3 LIQUIDITY AND CAPITAL RESOURCESThe Company’s primary sources of funding have been cash provided by operating activities,short- and long-term borrowings, and primary uses of funds have been for working capital,capital expenditures and repayment of short- and long-term borrowings.
(1) Assets, liabilities and shareholders’ equity Unit: RMB millions2002 2001 Changes
Current assets 101,884 109,795 (7,911)Non-current assets 273,997 256,914 17,083Total assets 375,881 366,709 9,172Current liabilities 117,434 124,711 (7,277)Non-current liabilities 80,042 70,788 9,254Total liabilities 197,476 195,499 1,977Minority interests 23,920 23,541 379Net assets 154,485 147,669 6,816Shareholders’ fundsShare capital 86,702 86,702 0Reserves 67,783 60,967 6,816
154,485 147,669 6,816
As at 31 December 2002, the Company’s totalassets were RMB 375.9 billion, total liabilitieswere RMB 197.5 billion, minority interests wereRMB 23.9 billion, and shareholders’ equity wereRMB 154.5 billion. Compared to 2001, changesof assets and liabilities in 2002 are primarilydue to the following reasons:
� Total assets were RMB 375.9 billion,representing an increase of RMB 9.2 billioncompared with RMB 366.7 billion as at 31December 2001. Current assets were RMB101.9 billion as at 31 December 2002,representing a decrease of RMB 7.9 billionfrom 31 December 2001. This decrease wasprimarily due to the Company’s enhanced fundmanagement to shorten the fund turnovercycle, resulting in a decrease in cash and cashequivalents and time deposits by RMB 4.1billion, collection of account receivables ofRMB 1.8 billion, reduction of pre-payments byRMB 0.8 billion as well as reduction ofprepaid taxes by RMB 0.7 billion. Non-currentassets were RMB 274 billion as at 31December 2002, representing an increase ofRMB 17.1 billion from 31 December 2001,which increase was primarily due to theaddition of equipment, plant and property.
� Total liabilities amounted to RMB 197.5 billionas at 31 December 2002, representing aincrease of RMB 2 billion from RMB 195.5billion as at 31 December 2001. Current
liabilities were RMB 117.4 billion as at 31December 2002, representing a decrease ofRMB 7.3 billion from 31 December 2001. Thisdecrease was primarily due to the Company’senhanced fund management to reduce theamount of idle funds and the level of short-terms debts, and as a result, the Companyrepaid to the banks and other financialinstitutions approximately RMB 11.6 billion inshort-term loans and RMB 2.5 billion of thecurrent portions of long-term loans. Inaddition, a change of liabilities’ structureresulted in an increase in bills payable by RMB4.1 billion and accounts payable by RMB 2.4billion, which increase partially offsets thedecrease of other liabilities. Non-currentliabilities were RMB 80 billion as at 31December 2002, representing an increase ofRMB 9.3 billion from 31 December 2001. Theincrease was primarily due to the increase oflong-term borrowings by RMB 8.2 billion as aresult of the Company’s capital expenditureprogrammes.
� The shareholders’ funds were RMB 154.5billion as at 31 December 2002, representingan increase of RMB 6.8 billion from RMB147.7 billion as at 31 December 2001. Thisincrease was mainly due to the net profit forthe year ended 31 December 2002, reducedby the final dividend for 2001 and the interimdividend for 2002.
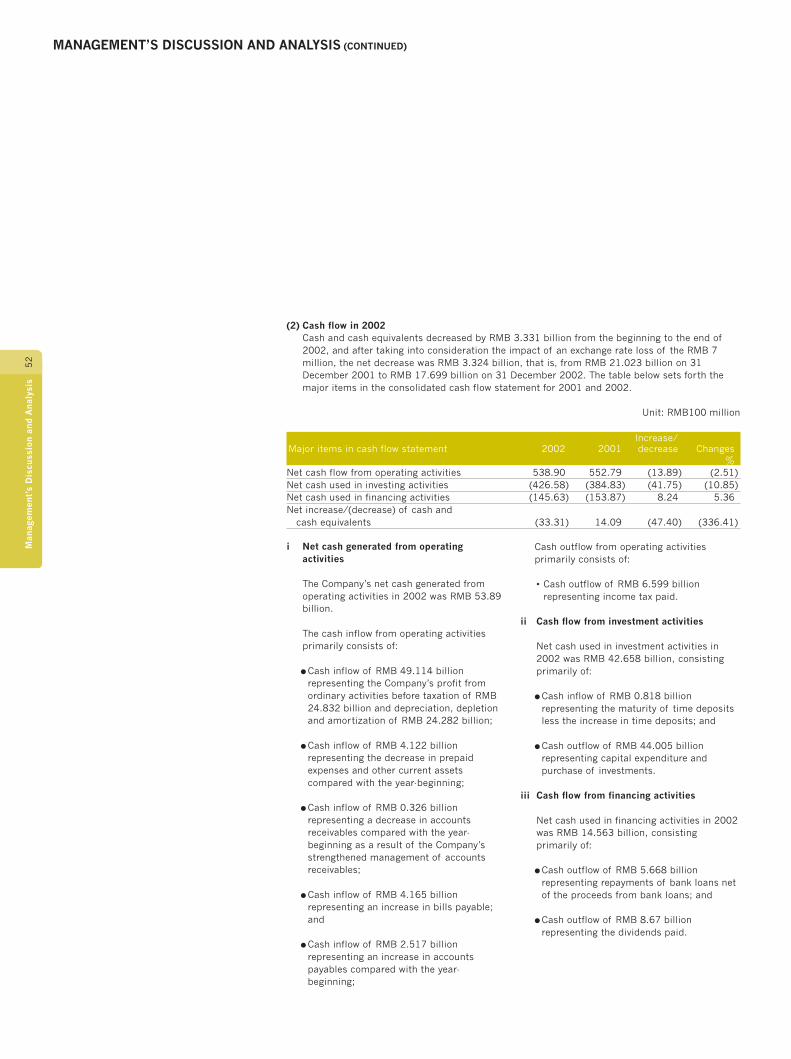
MANAGEMENT’S DISCUSSION AND ANALYSIS (CONTINUED)
52
Man
agem
ent’
s D
iscu
ssio
n an
d A
naly
sis
(2) Cash flow in 2002Cash and cash equivalents decreased by RMB 3.331 billion from the beginning to the end of2002, and after taking into consideration the impact of an exchange rate loss of the RMB 7million, the net decrease was RMB 3.324 billion, that is, from RMB 21.023 billion on 31December 2001 to RMB 17.699 billion on 31 December 2002. The table below sets forth themajor items in the consolidated cash flow statement for 2001 and 2002.
Unit: RMB100 million
Increase/Major items in cash flow statement 2002 2001 decrease Changes
%Net cash flow from operating activities 538.90 552.79 (13.89) (2.51)Net cash used in investing activities (426.58) (384.83) (41.75) (10.85)Net cash used in financing activities (145.63) (153.87) 8.24 5.36Net increase/(decrease) of cash and
cash equivalents (33.31) 14.09 (47.40) (336.41)
i Net cash generated from operatingactivities
The Company’s net cash generated fromoperating activities in 2002 was RMB 53.89billion.
The cash inflow from operating activitiesprimarily consists of:
� Cash inflow of RMB 49.114 billionrepresenting the Company’s profit fromordinary activities before taxation of RMB24.832 billion and depreciation, depletionand amortization of RMB 24.282 billion;
� Cash inflow of RMB 4.122 billionrepresenting the decrease in prepaidexpenses and other current assetscompared with the year-beginning;
� Cash inflow of RMB 0.326 billionrepresenting a decrease in accountsreceivables compared with the year-beginning as a result of the Company’sstrengthened management of accountsreceivables;
� Cash inflow of RMB 4.165 billionrepresenting an increase in bills payable;and
� Cash inflow of RMB 2.517 billionrepresenting an increase in accountspayables compared with the year-beginning;
Cash outflow from operating activitiesprimarily consists of:
• Cash outflow of RMB 6.599 billionrepresenting income tax paid.
ii Cash flow from investment activities
Net cash used in investment activities in2002 was RMB 42.658 billion, consistingprimarily of:
� Cash inflow of RMB 0.818 billionrepresenting the maturity of time depositsless the increase in time deposits; and
� Cash outflow of RMB 44.005 billionrepresenting capital expenditure andpurchase of investments.
iii Cash flow from financing activities
Net cash used in financing activities in 2002was RMB 14.563 billion, consistingprimarily of:
� Cash outflow of RMB 5.668 billionrepresenting repayments of bank loans netof the proceeds from bank loans; and
� Cash outflow of RMB 8.67 billionrepresenting the dividends paid.
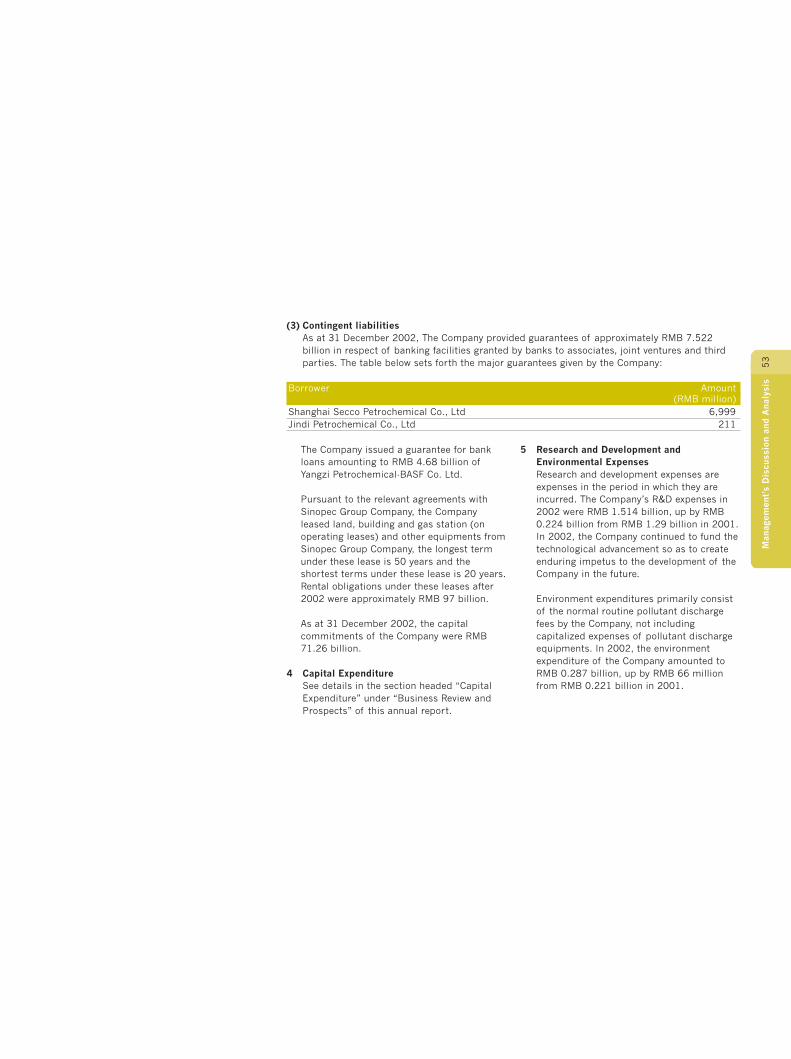
53
Man
agem
ent’
s D
iscu
ssio
n an
d A
naly
sis
(3) Contingent liabilitiesAs at 31 December 2002, The Company provided guarantees of approximately RMB 7.522billion in respect of banking facilities granted by banks to associates, joint ventures and thirdparties. The table below sets forth the major guarantees given by the Company:
Borrower Amount(RMB million)
Shanghai Secco Petrochemical Co., Ltd 6,999Jindi Petrochemical Co., Ltd 211
The Company issued a guarantee for bankloans amounting to RMB 4.68 billion ofYangzi Petrochemical-BASF Co. Ltd.
Pursuant to the relevant agreements withSinopec Group Company, the Companyleased land, building and gas station (onoperating leases) and other equipments fromSinopec Group Company, the longest termunder these lease is 50 years and theshortest terms under these lease is 20 years.Rental obligations under these leases after2002 were approximately RMB 97 billion.
As at 31 December 2002, the capitalcommitments of the Company were RMB71.26 billion.
4 Capital ExpenditureSee details in the section headed “CapitalExpenditure” under “Business Review andProspects” of this annual report.
5 Research and Development andEnvironmental ExpensesResearch and development expenses areexpenses in the period in which they areincurred. The Company’s R&D expenses in2002 were RMB 1.514 billion, up by RMB0.224 billion from RMB 1.29 billion in 2001.In 2002, the Company continued to fund thetechnological advancement so as to createenduring impetus to the development of theCompany in the future.
Environment expenditures primarily consistof the normal routine pollutant dischargefees by the Company, not includingcapitalized expenses of pollutant dischargeequipments. In 2002, the environmentexpenditure of the Company amounted toRMB 0.287 billion, up by RMB 66 millionfrom RMB 0.221 billion in 2001.
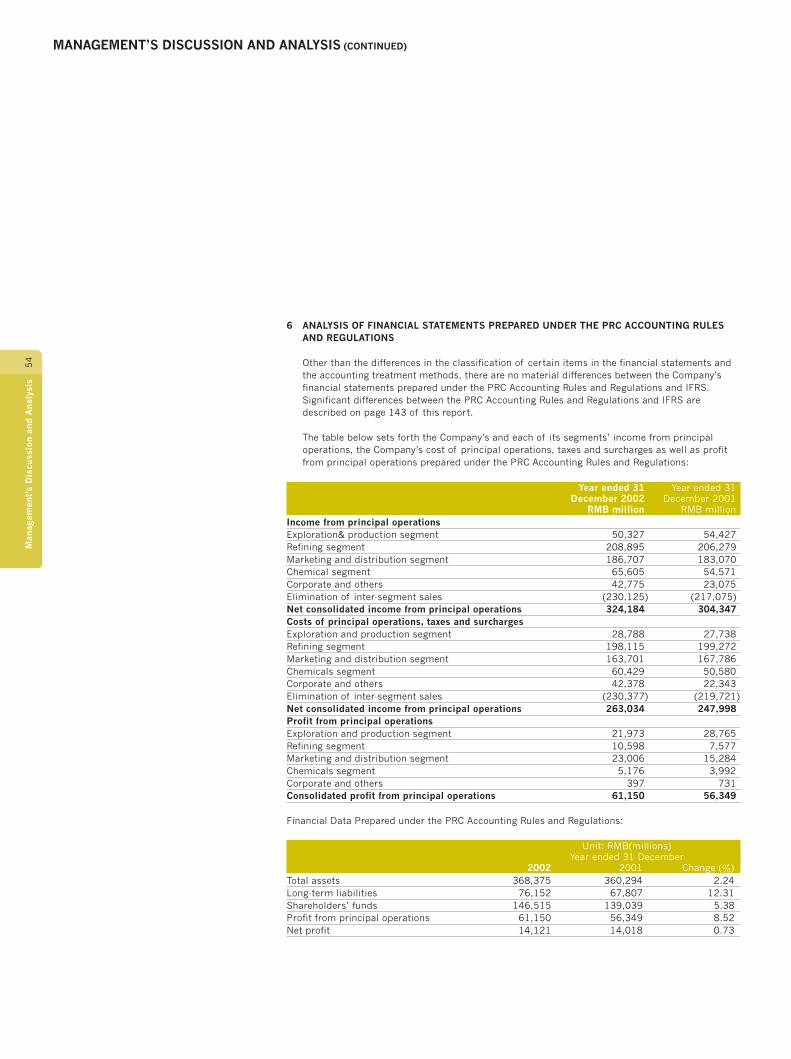
MANAGEMENT’S DISCUSSION AND ANALYSIS (CONTINUED)
54
Man
agem
ent’
s D
iscu
ssio
n an
d A
naly
sis
6 ANALYSIS OF FINANCIAL STATEMENTS PREPARED UNDER THE PRC ACCOUNTING RULESAND REGULATIONS
Other than the differences in the classification of certain items in the financial statements andthe accounting treatment methods, there are no material differences between the Company’sfinancial statements prepared under the PRC Accounting Rules and Regulations and IFRS.Significant differences between the PRC Accounting Rules and Regulations and IFRS aredescribed on page 143 of this report.
The table below sets forth the Company’s and each of its segments’ income from principaloperations, the Company’s cost of principal operations, taxes and surcharges as well as profitfrom principal operations prepared under the PRC Accounting Rules and Regulations:
Year ended 31 Year ended 31December 2002 December 2001
RMB million RMB millionIncome from principal operationsExploration& production segment 50,327 54,427Refining segment 208,895 206,279Marketing and distribution segment 186,707 183,070Chemical segment 65,605 54,571Corporate and others 42,775 23,075Elimination of inter-segment sales (230,125) (217,075)Net consolidated income from principal operations 324,184 304,347Costs of principal operations, taxes and surchargesExploration and production segment 28,788 27,738Refining segment 198,115 199,272Marketing and distribution segment 163,701 167,786Chemicals segment 60,429 50,580Corporate and others 42,378 22,343Elimination of inter-segment sales (230,377) (219,721)Net consolidated income from principal operations 263,034 247,998Profit from principal operationsExploration and production segment 21,973 28,765Refining segment 10,598 7,577Marketing and distribution segment 23,006 15,284Chemicals segment 5,176 3,992Corporate and others 397 731Consolidated profit from principal operations 61,150 56,349
Financial Data Prepared under the PRC Accounting Rules and Regulations:
Unit: RMB(millions)Year ended 31 December
2002 2001 Change (%)Total assets 368,375 360,294 2.24Long-term liabilities 76,152 67,807 12.31Shareholders’ funds 146,515 139,039 5.38Profit from principal operations 61,150 56,349 8.52Net profit 14,121 14,018 0.73

55
Man
agem
ent’
s D
iscu
ssio
n an
d A
naly
sis
Analysis of changes:
Total assets: As at 31 December 2002, theCompany’s total assets were RMB 368.375billion, up by RMB 8.081 billion, or 2.24%,compared with RMB 360.294 billion as at 31December 2001. In 2002, the Companyincreased investment in fixed assets resultingin an increase of RMB 13.042 billion in fixedassets. Other non-current assets increasedby RMB 1.797 billion. Total current assetsdecreased by RMB 6.758 billion due to theCompany’s strengthened administration ofdaily balance of cash and cash equivalentand accounts receivable as well as inventorycontrol.
Long-term liabilities: As at 31 December2002, the Company’s total long-termliabilities were RMB 76.152 billion, up byRMB 8.345 billion, or 12.31%, comparedwith RMB 67.807 billion as at 31 December2001. The increase was largely because theCompany’s long-term loans increased byRMB 8.207 billion as a result of itsinvestment programmes.
Shareholder’s funds: As at 31 December2002, the Company’s shareholders’ fundswere RMB 146.515 billion, up by RMB 7.476billion, or 5.38%, compared with RMB139.039 billion as at 31 December 2001.The increase was largely due to: (i) therealization of RMB 14.121 billion of netprofit in 2002; (ii) the distribution of RMB1.734 billion as interim dividends RMB5.202 billion as final dividends in 2002; and(iii) the subsidy of RMB 0.291 billionappropriated by the State to the Company toimprove its technology and equipment.
Profit from principal operations: In 2002, theCompany’s realized profit from principaloperations were RMB 61.15 billion, up byRMB 4.801 billion, or 8.52%, compared withRMB 56.349 billion in 2001. The increasewas primarily because the Company quicklyadjusted its business strategy to capture thefavorable opportunities presented by therecovery of market price and market order,and additionally, the Company implementedvarious measures to expand markets andreduce costs, which are particularlybeneficial to the refining segment and themarketing and distribution segment, both ofwhich realized significant profit growth in2002, and additionally, the Company’scompetitive strength in terms of integratedoperation came into play.
Net profit: The Company’s realized net profitin 2002 was RMB 14.121 billion, up by RMB0.103 billion, or 0.73%, compared with RMB14.018 billion in 2001. The increase wasprimarily due to the increase of profit fromprincipal operations, while the increasedexpenses partially offset the increase of netprofit.
7 SIGNIFICANT DIFFERENCES BETWEENIFRS AND US GAAP
Other than the differences in theclassification of certain items in thefinancial statements and the accountingtreatment methods, there are no materialdifferences between the Company’s financialstatements prepared under IFRS and USGAAP. Significant differences between IFRSand US GAAP that affect the Company’saccounting policies are set out on page 144to 147 of this annual report.

DISCLOSURE OF SIGNIFICANT EVENTS
56
Dis
clos
ure
of S
igni
fica
nt E
vent
s
1 MATERIAL GUARANTEE CONTRACTS ANDTHEIR PERFORMANCEAt the 14th meeting of the first session of theBoard of Directors of Sinopec Corp., theBoard approved the Sinopec Corp. toconditionally provide guarantee in domesticcurrency and foreign currency for ShanghaiSeco’s project loan, and the amount ofguarantee was equal to RMB6.999 billion. Fordetails, see Sinopec Corp.’s 2001 annualresults announcement published in ChinaSecurities News, Shanghai Securities Newsand Securities Times in China and SouthChina Morning Post and Hong Kong EconomicTimes in Hong Kong on April 2, 2002.
At the 22nd meeting of the first session of theBoard of Directors of Sinopec Corp., the Boardapproved the proposal concerning SinopecCorp.’s providing of equity mortgage for theYangzi-BASF project loan on the condition thatBASF shall povide equity mortgage on thesame terms. The Board also approved theproposal concerning Sinopec Corp.’s provisionof guarantee for Yueyang Sinopec Shell CoalGasification Co. Ltd., and the amount ofguarantee was RMB378.5 million.
Except the guarantee for the project ofShanghai Secco, Sinopec Corp. signed noguarantee agreement for the benefit of anyother party by December 31, 2002.
Sinopec Corp. signed a Guarantee toComplete Work with domestic and foreignbanks on March 7, 2003, whereby itguarantees 40% of a domestic and foreigncurrencies denominated loan equivalent toaround RMB11.7 billion provided by suchbanks to Yangzi-BASF Company Limited forcompletion of work.
2 IMPLEMENTATION OF THE COMMITMENTSOF SINOPEC CORP. AND ITSSHAREHOLDERS HOLDING 5% OR MOREOF THE TOTAL SHARE CAPITAL, NAMELY,SINOPEC GROUP COMPANY, CHINADEVELOPMENT BANK AND CHINA CINDAASSET MANAGEMENT CORPORATION
(1) As at the end of the reporting period, theundertakings made by Sinopec Corp.included:
i Carrying out the reorganization of itsthree subsidiaries, namely, Sinopec
Shengli Oilfield Company Limited,Sinopec Sales Company Limited andSinopec International CompanyLimited, in accordance with the PRCCompany Law within a specific periodof time;
ii Changing the logo at the petrolstations within a specific period oftime;
iii Setting up separate office buildingsbetween Sinopec Group Company andSinopec Corp. within a specific periodof time; and
iv Complying with the relevantapplicable provisions and rules of theStock Exchange of Hong KongLimited (the “Hong Kong StockExchange”) regarding the waiver ofconnected transactions.
(2) As at the end of the reporting period, themajor undertakings given by SinopecGroup Company included:i Complying with the agreements
concerning connected transactions;
ii Resolving the issues arising from theland use right certificates andbuilding ownership certificates withina specific period of time;
iii Implementing the ReorganizationAgreement (as referred to in theprospectus for the issue of H shares);
iv Granting licenses for intellectualproperty;
v Avoiding competition within theindustry; and
vi Resolving the business competitionand conflict of interests with SinopecCorp.
(3) As at the end of the reporting period,China Development Bank and ChinaCinda Asset Management Corporationgave the material undertakings that theywould not sell or transfer the shares ofSinopec Corp. held by them within aspecific period of time.
Details of the above undertakings wereincluded in the preliminary prospectuspublished by Sinopec Corp. in the ChinaSecurities News, Shanghai SecuritiesNews and Securities Times on June 22,2001.
In this reporting period, Sinopec Corp.did not breach and was not aware itselfor any of the principal shareholdersabove having breached the undertakings.
3 PLAN FOR PROFIT APPROPRIATION ANDPLAN FOR TRANSFER OF STATUTORYSURPLUS RESERVE TO EQUITY FOR 2002As determined in accordance with the PRCAccounting Rules and Regulations and IFRS,Sinopec Corp.’s audited net profits in 2002were RMB14.121 billion and RMB16.08billion respectively. In accordance with theprovisions of the Articles of Association ofSinopec Corp., the allocation of the profitafter tax for the relevant fiscal year would beconducted on the basis of the net profit aftertax as determined in accordance with thePRC Accounting Rules and Regulations andunder IFRS, whichever is lesser. Thus, theprofit after tax to be allocated in 2002 wouldbe RMB14.121 billion. After deducting 10%to be transferred to the statutory surplusreserve, other 10% to be transferred to thestatutory public welfare fund and RMB7billion to be transferred to discretionarysurplus reserve, the remaining net profitavailable for distribution would be RMB4.297billion. Together with the undistributed profitof RMB10.006 billion brought forward fromthe preceding year and deducting RMB1.734billion of interim cash dividend paid in 2002,the retained profit available for distributionto shareholders was RMB12.569 billion intotal. On the basis of the total number of86,702,439,000 shares in issue as at the endof 2002 and according to the resolutionadopted by the 31st meeting of the firstsession of the Board of Directors of SinopecCorp., cash dividend would be distributed asRMB0.08 per share (including tax). After theinterim cash dividend is deducted, the finalcash dividend per share for distribution atthe end of 2002 would be RMB0.06 pershare and the total cash dividend for the fullyear would be RMB6.936 billion. Theremaining undistributed profit would beRMB7.367 billion and would be carried

57
Dis
clos
ure
of S
igni
fica
nt E
vent
s
forward to 2003. No statutory surplus reservewould be transferred to capital this year. Theproposal will be effective subject toconsideration and approval at the 2002Annual General Meeting.
4 USE OF PROCEEDS FROM H SHARE ISSUEAND A SHARE ISSUEThe proceeds from the issue of H shares ofSinopec Corp. in 2000 amounted toRMB25.802 billion. After deducting theissuance expenses, the net proceeds fromthe issue of H shares amounted toRMB24.326 billion, of which, RMB4.5 billionwas used in 2000 for repayment of loans;RMB13.735 billion was used in 2001entirely to cover capital expenditure mainlyfor oil and natural gas exploration andbuilding up production capacity, refiningproject construction and petrol station andoil depot acquisition. By the end of 2001,the remaining amount of the proceeds fromthe issue of H shares was RMB6.091 billion.In this reporting period, RMB2.818 billionwas used, including RMB1.926 billion usedfor exploration and production, RMB792million invested in Shanghai Seco, theYangzi-BASF Integrated Site Project and thenitrogen facilities upgrading project ofYueyang and RMB100 million used by theheadquarters and some subsidiaries ofSinopec Corp. for ERP system building. ByDecember 31, 2002, RMB3.273 billion ofthe proceeds from the issue of H sharesremained unused.
The proceeds from the issue of A shares ofSinopec Corp. in 2001 amounted toRMB11.816 billion. After deducting theissuance expenses, the net proceeds fromthe issue of A shares amounted to RMB11.648 billion, in which RMB7.766 billionwas used in 2001 mainly for acquiringSinopec National Star and the Southwest OilProducts Pipeline Project andsupplementing the Company’s workingcapital. By the end of 2001, the remainingamount of the proceeds from the issue of Ashares was RMB3.882 billion. In thisreporting period, RMB696 million was used,including RMB46 million used for coveringthe prophase cost of the Southwest OilProducts Pipeline Project and RMB650million for building the Ningbo-Shanghai-Nanjing Crude Oil Pipeline. By December 31,
2002, the remaining amount of theproceeds from the issue of A shares wasRMB3.186 billion.
5 PROGRESS OF MAJOR JOINT VENTURES(1) West-east Pipeline Project
In July 2002, Sinopec Corp., PetroChinaand the International Investment Groupentered into a Framework Agreement ofCooperation for West-East GasTransportation for jointly makinginvestment in the construction of theWest-East Pipeline Project (theproportion of the three parties in theregistered capital is 5%, 50% and 45%respectively). To cooperate with theconstruction of the West-East PipelineProject, Sinopec Corp. strengthened itsefforts in exploring natural gas inwestern China and made importantbreakthrough in developing Ku 1 Wellwhich will provide rich natural gasresources for the West-East PipelineProject. Sinopec Corp.’s preparatorywork in developing natural gas marketadvanced smoothly and the Companymade technological transformation to 10natural gas utilization projects with anannual natural gas consumption volumeof 2.5 billion cubic meters.
(2) East China Sea Natural Gas CooperationProjectIn this reporting period, Sinopec Corp. andCNOOC jointly carried out negotiationswith the relevant foreign party concerningthe East China Sea Natural GasCooperation Project, established EastChina Sea West Lake Natural Gas WorkingCompany and started the construction ofChunxiao Natural Gas Group FieldsDevelopment Project.
(3) Fujian Petrochemical Integration ProjectThe joint feasibility study report for theFujian Petrochemical Integration Projectjointly funded by Sinopec Fujian Refiningand Chemical Co., Ltd., a subsidiary ofSinopec Corp., ExxonMobil China Co.,Ltd. and Aramco Overseas Company (theproportion of the three parties in theregistered capital is 50%, 25% and 25%respectively) was approved by the StateCouncil of the People’s Republic of Chinain October 2002. The three companies
are carrying out negotiation in a timelymanner to finalize the joint venturecontract and submitting the contract tothe Ministry of Foreign Trade andEconomic Cooperation of China forapproval.
(4) Joint Establishment of Shandong ShihuaNatural Gas Co., Ltd. and ShandongNatural Gas Pipeline Co., Ltd.In February 2002, Sinopec Corp.established Shandong Shihua NaturalGas Co., Ltd. and Shandong Natural GasPipeline Co., Ltd. through joint venturerespectively with Shandong InternationalTrust and Investment Corporation andShandong Luxin Investment and HoldingCo., Ltd. respectively. Shandong ShihuaNatural Gas Co., Ltd.’s registered capitalis RMB100 million. The proportion of thetwo parties in the registered capital is50%:50%. This company is mainlyresponsible for expanding the natural gasmarket of Shandong as well asmarketing in this market. This company’sparticular scope of business covers thesales of pipelined natural gas, the salesof natural gas to urban residents, theconstruction of CNG, LNG , LPG gas andpetrol filling stations, the development ofcomprehensive natural gas utilizationprojects and the sales and maintenanceof gas-fired utensils. Shandong NaturalGas Pipeline Co., Ltd.’s registered capitalis RMB200 million and the proportion ofequity held by the two investors is65%:35%. The scope of business of thiscompany covers the construction,operation and maintenance of naturalgas pipelines and the relevantsupplementary services.
(5) Qingdao Large-scale Refining ProjectAt the 27th meeting of the first sessionof the Board of Directors of SinopecCorp. held on January 20, 2003, theBoard conditionally approved theFeasibility Study Report for the QingdaoLarge-scale Refining Project andsubmitted the Report to the StateDevelopment Planning Commissionjointly with the People’s Government ofShandong Province and the People’sGovernment of Qingdao City.

DISCLOSURE OF SIGNIFICANT EVENTS (CONTINUED)
58
Dis
clos
ure
of S
igni
fica
nt E
vent
s
6 MATTERS CONCERNING THE TRANSFEROF THE STATE SHARES OF SINOPEC HUBEIXINGHUA CO., LTD.At the 20th meeting of the first session ofthe Board of Directors of Sinopec Corp., theBoard considered and approved the transferof Hubei Xinghua Co., Ltd.’s state sharesheld by Sinopec Corp. to China Developmentand Investment Corporation. At the 24thmeeting of the first session of the Board ofDirectors of Sinopec Corp., the Boardapproved Sinopec Corp.’s purchase of HubeiXinghua’s core assets, and the proceduresof share transfer were completed on October15, 2002. For details, see the relevantannouncements published by Sinopec Corp.in China Securities News, ShanghaiSecurities News and Securities Times inChina and South China Morning Post andHong Kong Economic Times in Hong Kongon April 30, 2002 and October 10, 2002.
7 STATUS AND PLAN OF EMPLOYEEREDUCTIONIn order to improve its efficiency andprofitability, Sinopec Corp. planned toreduce its employees by 100,000 by way ofretirement, voluntary resignation and/or layoff in the five years from 2001 to 2005. In2002, the Company actually reduced 25,000employees by way of retirement, voluntaryresignation and termination of laborcontract in combination with assets swap.By the end of 2002, Sinopec Corp. reducedabout 89,000 employees in total in twoyears. On the basis of reasonably allocatingthe existing human resources, the Companyplans to reduce 10,000 employees by way ofretirement and voluntary resignation in 2003.
8 LITIGATION AND ARBITRATION OFMATERIAL IMPORTANCEThere was no litigation and arbitration ofmaterial importance to the Company in thisreporting period.
9 AMENDMENT TO THE ARTICLES OFASSOCIATION, ELECTION OF DIRECTORSAND SUPERVISORS FOR THE NEWSESSION OF OFFICE AND EXTRAORDINARYGENERAL MEETINGAt the 2001 Annual General Meeting held onJune 13, 2002, the proposal on theamendments to Article 13, item 2 of theArticles of Association of Sinopec Corp. wasapproved. For details about the amendment,see the relevant announcements publishedby Sinopec Corp. in China Securities News,Shanghai Securities News and SecuritiesTimes in China and South China MorningPost and Hong Kong Economic Times inHong Kong on June 14, 2002.
At the 28th meeting of the first session ofthe Board of Directors of Sinopec Corp. heldon January 21, 2003, the Board consideredand approved the publishing of anannouncement about the holding of the first2003 extraordinary general meeting onMarch 21, 2003 for considering theproposals on the amendments to theArticles of Association of Sinopec Corp. andselection of the members of the secondsession of the Board of Directors and thesecond session of the SupervisoryCommittee of Sinopec Corp. Sinopec Corp.published an announcement on March 13,2003, deciding to postpone the date of thefirst 2003 extraordinary general meeting toApril 22, 2003. Therefore, the relevantproposals will be submitted to thepostponed general meeting forconsideration. For details, see the relevantannouncements published by Sinopec Corp.in China Securities News, Shanghai
Securities News and Securities Times inChina and South China Morning Post andHong Kong Economic Times in Hong Kongon January 23, 2003 and March 14, 2003.
10 TRUSTEESHIP, CONTRACT ANDLEASEHOLDIn this reporting period, Sinopec Corp. didnot have any significant trusteeship, contractand lease of any other company’s assets norplaced its assets to or under any othercompany’s trusteeship, contract or leasewhich were required to be disclosed.
11 TRUST FINANCIAL MANAGEMENTIn this reporting period, Sinopec Corp. didnot entrust or continuously entrust any otherparty to carry out cash asset managementfor it.
12 ASSET MORTGAGEBy December 31,2002, the details regardingthe Company’s asset mortgage is listed innote 26 to the Financial Statementsprepared under IFRS in the annual report.
13 AUDITORSThe 2001 Annual General Meeting held onJune 13, 2002 approved Sinopec Corp. toreappoint KPMG Huazhen and KPMGrespectively as its domestic andinternational auditors for the year of 2002and authorized the Board of Directors todecide the remunerations for them. Asapproved by the 31st meeting of the firstsession of the Board of Directors of SinopecCorp., the total audit fee for 2002 would beHK$55 million.

59
Dis
clos
ure
of S
igni
fica
nt E
vent
s
Beginning from the second half of 2000, the consecutive period of auditing service provided byKPMG Huazhen and KPMG to Sinopec Corp. are two and half years and the first auditing serviceagreement was signed in March 2001.
Auditors appointed KPMG Huazhen (domestic) KPMG (international)Audit fee for 2002* HK$3 million (unpaid) HK$52 million (unpaid)Audit fee for 2001 HK$3 million (paid) HK$57 million (paid)Travel expenses and other expenses Borne by the firm Borne by the firm
Note:*Most of Sinopec Corp.’s subsidiaries listed in the PRC and overseas appointed KPMG Huazhen and KPMG astheir auditors. However, some subsidiaries listed in the PRC or overseas appointed other firms as their auditors.Please refer to their annual reports for details about such subsidiaries’ appointments and dismissals of auditingfirms.
14 OTHER SIGNIFICANT EVENTS(1) In this reporting period, neither Sinopec
Corp., the Board of Sinopec Corp. northe directors received any investigationfrom the CSRC, nor was there anyadministrative penalty and circular ofcriticism issued by the CSRC, theSecurities and Futures Commission ofHong Kong and the Securities andExchange Committee of United Statesnor any reprimands published by theShanghai Stock Exchange, the Hong KongStock Exchange, the New York StockExchange and the London StockExchange.
(2) Basic medical insurance for employeesSinopec Corp.’s basic medical insurancefor employees was implemented inaccordance with the Decision of theState Council on the Establishment ofBasic Medical Insurance System forUrban Workers (GF [1998] No. 44Document of the State Council), whilethe subsidiaries of Sinopec Corp.implemented the local governments’regulations on basic medical insurancerespectively in accordance with the localrules of administration. The times ofvarious local governments’ promulgationof the policy on basic medical insurance
were different. The developed areasbegan implementing this policy from anearlier time and the other areas shouldimplement it before 2002. Sinopec Corp.had required that all its subsidiariesmust ensure, after effecting medicalinsurance for employees in accordancewith the local governments’ regulations,that the medical insurance expenseshould firstly be covered by depositedemployee welfare fund and included inthe accounting item of “welfare expensepayable”; in case the welfare fund isinsufficient, the deficit could be includedin the account item “labor insuranceexpense” after approved by the SinopecCorp’s headquarters. In 2002, the basicmedical insurance expense paid bySinopec Corp. was RMB457 million,which was less than 14% of the totalamount of wages paid in the same year.Since employee welfare fund had alreadybeen deposited in that proportion andincluded in the Company’s cost in thepast, the implementation of the systemof basic medical insurance foremployees was only an systematicimprovement, constituted no new burdenof cost and produced few influences onthe Sinopec Corp.’s overall profit, loss,assets and liabilities.
CONNECTED TRANSACTIONS
60
Con
nect
ed T
rans
acti
ons
1 AGREEMENTS CONCERNING CONNECTEDTRANSACTIONS ENTERED INTO BETWEENTHE COMPANY AND SINOPEC GROUPCOMPANYIn order to ensure the normal operation ofproduction and businesses of the Companyand Sinopec Group Company, the twoparties entered into a number ofagreements on connected transactionsbefore Sinopec Corp. was listed overseas.The particular connected transactionsinclude the following:
(1) Agreement for Mutual Provision ofAncillary Services Including Products,Production and Construction Services(“Mutual Supply Agreement”);
(2) Sinopec Group Company providestrademarks and patents proprietary andcomputer software licence to theCompany for free of charge;
(3) Sinopec Group Company providescultural, educational, hygiene andcommunity services to the Company;
(4) Sinopec Group Company provides leasingof land and certain buildings to theCompany;
(5) Sinopec Group Company providesconsolidated insurance to the Company;
(6) Sinopec Group Company providesshareholders’ loan to the Company;
(7) The Company provides agency marketingservices on products to Sinopec GroupCompany; and
(8) The Company provides petrol stationsfranchise to Sinopec Group Company.
2 WAIVER IN RESPECT OF THE CONNECTEDTRANSACTIONS BETWEEN THE COMPANYAND SINOPEC GROUP COMPANYGRANTED BY THE HONG KONG STOCKEXCHANGEIn accordance to the Listing Rules of theHong Kong Stock Exchange, the above
transactions are subject to full disclosure,depending on their nature and the value ofconsideration, with prior approval fromindependent directors and the Hong KongStock Exchange. At the time of listing,Sinopec Corp. applied for waivers from theHong Kong Stock Exchange from fullcompliance with the Listing Rules for thetransactions mentioned above. The HongKong Stock Exchange conditionally exemptedSinopec Corp. from undertaking theobligation of continuous disclosure.
At the extraordinary general meeting ofSinopec Corp. held on August 24, 2001, theConnected Transaction AdjustmentAgreement was approved, and the connectedtransactions were adjusted accordingly.Please refer to the relevant description insection 7 of the prospectus published bySinopec Corp. in China Securities News,Shanghai Securities News and SecuritiesTimes on June 22, 2001.
On June 29, 2001, the Hong Kong StockExchange conditionally agreed to grant thenew waivers on continuous disclosureobligations to Sinopec Corp. and grantedSinopec Corp. a waiver from compliance withthe relevant requirements of the ListingRules in respect of these transactions for aperiod of three financial years expiring onDecember 31, 2003, but Sinopec Corp. mustsatisfy the conditions of waiver. Theconditions for the waivers on continuousdisclosure obligations were set out inSection 8 of the Letter from the Chairmanthat was incorporated in the circular toholders of H Shares concerning theconnected transactions and on-goingconnected transactions which wasdispatched on June 30, 2001 and publishedin Annex 3 to the Announcement on the2001 Extraordinary General Meeting ofSinopec Corp. as published in ChinaSecurities News, Shanghai Securities Newsand Securities Times on July 10, 2001.
61
Con
nect
ed T
rans
acti
ons
3 THE PROVISIONS FOR THE WAIVER ONDISCLOSURE AND APPROVALREGULATIONS OF CONNECTEDTRANSACTIONS ENTERED INTO BETWEENSINOPEC CORP. AND SINOPEC GROUPCOMPANY UNDER THE LISTING RULES OFTHE SHANGHAI STOCK EXCHANGEIn the prospectus for the issue of A sharesof Sinopec Corp., the above connectedtransactions together with agreements andarrangements between the Company andSinopec Group Company were fullydisclosed. In accordance with the ListingRules of the Shanghai Stock Exchange, inthe event that there is no significant changein the agreements governing the aboveconnected transactions during the periodunder review, Sinopec Corp. would beexempted from the disclosure and approvalregulations for connected transactions underthe Listing Rules of the Shanghai StockExchange.
4 CONNECTED TRANSACTIONS ENTEREDINTO BY THE COMPANY DURING THISYEARAs reviewed by the auditors of SinopecCorp., the amount of the connectedtransactions entered into by the Companyduring this year amounted to an aggregateamount of RMB87.156 billion. Of which,incoming trade amounted to RMB50.672billion and outgoing trade amounted toRMB36.484 billion (including outgoingproducts and services amounted toRMB36.343 billion, total amount of interestreceived was RMB0.104 billion, the agencyfee receivable was RMB37 million). Thesesatisfied the conditions of the waiverimposed by the Hong Kong Stock Exchange.In 2002, the products and services providedby Sinopec Group Company (purchase,storage, exploration and production servicesand production-related services) to theCompany amounted to RMB45.365 billion,representing 14.55% of the Company’sannual operating expenses, with a 1.81%increase and was within the cap of 18%; theauxiliary and community services providedby Sinopec Group Company to the Company
amounted to RMB1.945 billion, representing0.62% of operating expenses, with a slightdecrease when compared with 0.69% in thepreceding year and was within the cap of3%. In 2002, the product sales from theCompany to Sinopec Group Companyamounted to RMB36.343 billion,representing 10.69% of the Company’soperating income, and was within the cap of16%. With regard to the Land Use RightLeasing Agreement, the amount of rentalpayable by the Company for the year endedDecember 31, 2002 was approximatelyRMB2.018 billion. With regard to thepremium payable according to the SPI FundDocument, the amount payable by theCompany per annum should not be less thanthe amount as stipulated in the SPI FundDocument.
Please refer to Note 31 of the FinancialStatement prepared in accordance with IFRSin this Annual Report for the details of theconnected transactions actually incurredduring this year.
The above mentioned connectedtransactions in 2002 were already approvedat the 31st meeting of the first session ofthe Board of Directors of Sinopec Corp.
The auditors of Sinopec Corp. haveconfirmed to the Board of Directors inwriting that:
(a) The transactions have been approved bythe Board of Directors;
(b) The transactions have been entered intoat amounts consistent with the pricingpolicies as stated in the relevantagreements;
(c) The transactions have been entered intoin accordance with the terms of therespective agreements and documentsgoverning the transactions; and
(d) The relevant amount has not exceededthe relevant cap amount.
After reviewing the above relevanttransactions, the independent directors ofSinopec Corp. have confirmed that:
(a) The transactions have been entered intoby Sinopec Corp. in its ordinary andusual course of businesses;
(b) The transactions have been concluded:
i on normal commercial terms;
ii on terms no less favorable than thoseavailable from/to independent thirdparties; or
iii where there is no availablecomparison for the purpose ofdetermining whether Item i or ii issatisfied, on terms that are fair andreasonable so far as the shareholdersof Sinopec Corp. are concerned; and
(c) The total values of the transactions havenot exceeded the respective limits.
5 OTHER MATERIAL CONNECTEDTRANSACTIONS ENTERED INTO DURINGTHIS YEAR
(1) Connected Transaction for Assets SwapAt the 26th meeting of the first sessionof the Board of Directors of SinopecCorp. held on December 19, 2002, theBoard approved the proposal on assetsswap with Sinopec Group Company andthe two parties signed an assets swapagreement on the same day of themeeting. According to the agreement,Sinopec Corp. swapped some of thewater plants, maintenance and repairequipment and physical and chemicalexploration assets owned by it (includingsome relevant liabilities) for some petrolstations, oil depots (including therelevant liabilities) and owned by SinopecGroup Company on the basis of an equalvalue. Sinopec Corp. paid the valuedifference of RMB2.1321 million (aboutHK$2.0095 million) in cash to Sinopec
CONNECTED TRANSACTIONS (CONTINUED)
62
Con
nect
ed T
rans
acti
ons
Group Company. Upon completion of theassets swap, industry competition inancillary production will be reduced. Theassets to be swapped by Sinopec Corp.are mainly the ancillary and serviceassets of its main production services,including water plants, inspection andmaintenance and exploration which fallunder the business scope of SinopecGroup Company and should be whollyoperated and managed by Sinopec GroupCompany. The incorporation of suchassets into Sinopec Group Company ispropitious to reducing the industrycompetition between Sinopec Corp. andSinopec Group Company in such areaand the development of Sinopec GroupCompany and will enhance theprofitability of Sinopec Corp. As SinopecGroup Company is the controllingshareholder of Sinopec Corp., the AssetsSwap and the Assets Swap Agreementconstituted a connected transaction forSinopec Corp. under the Listing Rules ofthe Shanghai Stock Exchange andparagraph 14.25(1) of the Listing Rulesof the Hong Kong Stock Exchange. Fordetails, see the relevant announcementpublished in China Securities News,Shanghai Securities News and SecuritiesTimes in China and South China MorningPost and Hong Kong Economic Times inHong Kong on December 21, 2002.
In accordance with the Assets SwapAgreement and the documents filed tothe Ministry of Finance, the two partiesappropriately adjusted the relevantassets. As jointly confirmed by SinopecCorp. and Sinopec Group Company, theappraised value of Sinopec GroupCompany’s assets included in this assettransaction was RMB1,039,986,200(about HK$980,194,300); the appraisedvalue of Sinopec Corp.’s assets wasRMB1,021,424,900 (aboutHK$962,700,200); the difference
RMB18,561,300 (about HK$17,494,200)was paid by Sinopec Corp. to SinopecGroup Company in cash; and the transferof both physical assets and fund wascompleted on December 31, 2002.
(2) Connected Transaction for Leasing ofPetrol StationsOn April 29, 2002, Sinopec Corp. issuedan announcement about the lease ofpetrol stations by a number of SinopecCorp.’s subsidiaries from somesubsidiaries of Sinopec Group Company;the two parties signed lease agreementsfor the lease of 2,138 petrol stations andexpected to sign new lease agreementsfor the lease of around 460 other petrolstations in 2002. Due to the situations,geographical locations and sizes of somepetrol stations, the lease of about 988petrol stations already expired or therelevant agreements were not signed atall. The total amount of rental occurringin this reporting period was RMB87.88million, which was in conformity with theconditions of waiver approved by theHong Kong Stock Exchange for suchconnected transactions. The auditors ofSinopec Corp. have issued a letter to theBoard of Directors to certify that:
(a) the leasing agreements mentionedabove have been approved by theBoard of Directors;
(b) the leasing agreements mentionedabove have been completed accordingto relevant terms; and
(c) the rentals paid in accordance withthe leasing agreements did notexceed the cap amount.
After reviewing the connectedtransactions above, the independentdirectors of Sinopec Corp. confirmedthe following:
(a) the leasing agreements mentionedabove:
(i) have been concluded on normalbusiness and procedures;
(ii) have been completed oncommercial terms (theterminology hereby referred tothat applicable to transactions ofsimilar nature, and shall be madeby similar Chinese entities);or (b)(where there is no availablecomparison), on terms that arefair and reasonable so far as theindependent shareholders ofSinopec Corp. are concerned; and
(iii)have been completed inaccordance with the formalprovisions of the standard leasingagreement;
(b) The total rentals incurred in SinopecCorp.’s fiscal year under the leasingagreement have not exceeded the capamount for the relevant fiscal year.
In 2003, the Company will rent around983 petrol stations from certainsubsidiaries of Sinopec Group Company,and will sign around 983 leasingagreements. Each new agreement shallexpire on December 31, 2003, with aterm of one year. It is expected that therentals incurred in 2003 under the newleasing agreements shall be aroundRMB120 million (or about HK$113.1million). For details, see the relevantannouncements published in ChinaSecurities News, Shanghai SecuritiesNews and Securities Times in China andSouth China Morning Post and HongKong Economic Times in Hong Kong onApril 29, 2002 and January 20, 2003.
63
Con
nect
ed T
rans
acti
ons
(3) Connected Transactions Regarding 450thousand tonnes PTA per yearSinopec Yizheng Chemical FibreCompany Limited (“Yizheng”) enteredinto the following agreements in respectof the construction and design of a PTAproduction plant with annual productioncapacity of 450,000 tonnes of PTA andthe construction of auxiliary facilitieswith five legal persons of SinopecGroup Company.
(I) Construction design agreement
a Date of signing: August 13, 2001b Parties: Yizheng and CPC
Construction Co., Ltd.c This agreement is mainly for the
detail design of the PTA Projectand the auxiliary facilities inrelation to the PTA Project.
d The consideration payable byYizheng under this agreement isRMB42,760,000 payable in cash(equivalent to approximately byHK$40,301,602) which wasdetermined after arm’s lengthnegotiations.
(II) Component installation constructionagreement
a Date of signing: November 16, 2001b Parties: Yizheng and CPC The
Second Construction Co., Ltd.c This agreement is mainly for the
construction of the maincomponent of the PTA project andrelevant auxiliary facilities.
d After an open tender process theconsideration payable by Yizhengunder this agreement isRMB40,409,330 payable in cash(equivalent to approximatelyHK$38,086,079).
(III) PX storing section and relevantauxiliary facilities constructionagreement
a Date of signing: November 16, 2001b Parties: Yizheng and CPC The
Fifth Construction Co., Ltd.
c This agreement is mainly for theconstruction of storage tanker inPX storing section of the PTAProject and relevant auxiliaryfacilities.
d After an open tender process theconsideration payable by Yizhengunder this agreement isRMB8,000,000 payable in cash(equivalent to approximatelyHK$7,540,056).
(IV) Waste water treatment plantconstruction contract
a Date of signing: August 31, 2001b Parties: Yizheng and CPC The
Fifth Construction Co., Ltd.c This agreement is mainly for the
construction of waster watertreatment plant for the PTAProject.
d After an open tender process theconsideration payable by Yizhengunder the Agreement isRMB31,000,000 payable in cash(equivalent to approximatelyHK$29,217,719).
(V) Construction of auxiliary facilitieswithin the PTA Project’s constructionsite and some tankers outside theproject site agreement
a Date of signing: November 16, 2001b Parties: Yizheng and Yizheng
Chemical Installation &Maintenance EngineeringCompany
c This agreement is mainly for theconstruction of auxiliary facilitieswithin the PTA Project’sconstruction site and sometankers outside the PTA Projectsite.
d After an open tender process theconsideration payable by Yizhengunder this agreement isRMB75,000,000 payable in cash(equivalent to approximatelyHK$70,688,030).
(VI) Construction of non-standardauxiliary facilities within the PTAProject site agreement.
a Date of signing: November 16, 2001b Parties: Yizheng and Yizheng
Chemical Installation &Maintenance EngineeringCompany
c This agreement is mainly for theconstruction of non-standardauxiliary facilities within the PTAProject site.
d After an open tender process theconsideration payable by Yizhengunder this agreement isRMB2,171,066.38 payable incash (equivalent to approximatelyHK$2,046,245).
The aggregate consideration for theabove six agreements isRMB199,340,396.38 (equivalent toapproximately HK$187,879,732), and40% of the agreements’ totalconsideration is to be paid from internalresource of Yizheng. The remaining 60%is financed by bank loan.
As those legal persons are either directlyor indirectly wholly-owned subsidiaries ofSinopec Group Company and SinopecGroup Company is the holding companyof Sinopec Corp. and Yizheng, andYizheng is a subsidiary of Sinopec Corp.Under Chapter 14 of the Listing Rules ofthe Hong Kong Stock Exchange, the legalpersons are connected persons ofSinopec Corp. Thus, the transactionsconstitute connected transactions ofSinopec Corp. under the Listing Rules.
CORPORATE GOVERNANCE
64
Cor
por
ate
Gov
erna
nce
1 IMPROVEMENT OF CORPORATEGOVERNANCEThe year 2002 was a year of corporategovernance initiated by domestic and foreignregulatory authorities and the capitalmarket. In 2002, China SecuritiesRegulatory Commission and the StateEconomic and Trade Commission jointlyannounced the Principles for the CorporateGovernance of Listed Companies; the HongKong Stock Exchange announced theConsultation Paper on ProposedAmendments to the Listing Rules Relating toCorporate Governance; and the USGovernment announced Sarbanes-Oxley Actof 2002. Sinopec Corp. timely followed andpaid great attentions to the trends of theregulations in the places where it is listed,conscientiously studied and rapidly putforward the relevant measures and furtherimproved its corporate governancemechanism. In 2002, Sinopec Corp. mainlydid the following jobs in respect of corporategovernance:
(1) Taking advantage of the opportunity ofthe Examination of the Establishment ofModern Enterprise System in ListedCompanies jointly initiated by the StateEconomic and Trade Commission andChina Securities Regulatory Committeeand the circuit examination carried outby Beijing Securities AdministrationOffice under China Securities RegulatoryCommittee, Sinopec Corp. organizedtrainings to strengthen the sense of goodfaith and responsibility among thedirectors, supervisors and the othersenior executives and enhanced andpromoted all the employee’s awarenessof working in a listed company.
(2) In strict compliance with the latest laws,rules and regulations promulgated by therelevant domestic and foreign regulatoryauthorities, Sinopec Corp.comprehensively and systematicallyconstituted and amended its Articles ofAssociation, Rules of Procedures forShareholders’ General Meeting, Rules ofProcedures for the Board of Directors
and Rules of Procedures for theSupervisory Committee. The abovedocuments have been passed at the 28thmeeting of the first session of the Boardof Directors and are subject to approvalby the first 2003 extraordinary generalmeeting and the relevant governmentauthority.
(3) Sinopec Corp. disclosed information tothe investors in a prudent andresponsible way for increasing SinopecCorp.’s transparency. By these meanssuch as public announcement, roadshow, teleconference, one-to-oneinterview and Sinopec Corp.’s website,Sinopec Corp. accurately, completely andtimely briefed the domestic and foreigninvestors on the situations of theCompany, prepared and signed annualreport with a prudent and responsibleattitude and strengthenedcommunication with the investors forfurther increasing Sinopec Corp.’stransparency.
Sinopec Corp.’s efforts and practice in theaspect of corporate governance has beenfully affirmed by the capital market. In July2002, Sinopec Corp. was elected by themagazine “Europe Currency” as the secondin Hong Kong and China region and the firstin China in respect of corporate governancein the emerging capital market; in December2002, as one of the ten advanced listedcompanies, Sinopec Corp. introduced itsexperience at the Conference for Exchangingand Summarizing the Experience of ModernEnterprise System Construction in ListedCompanies jointly held by the StateEconomic and Trade Commission and ChinaSecurities Regulatory Commission; and inDecember 2002, Sinopec Corp. was grantedthe Prize for China’s Top Ten Companies inCorporate Governance in 2002 by the AssetBenchmark Research Center.

65
Cor
por
ate
Gov
erna
nce
In 2003, Sinopec Corp. will further optimizethe composition of the members of theBoard of Directors and the SupervisoryCommittee when electing members for anew term of office, strengthen training forthe newly elected members of the secondsession of the Board of Directors and thesecond session of the SupervisoryCommittee and the other senior executives,give full play to the functions of theprofessional committees (especially theAudit Committee) under the Board ofDirectors, promptly understand and strictlyabide by the latest requirements of thesecurities regulatory authorities of theplaces where Sinopec Corp. is listed(especially the securities regulatoryauthority of the US), improve its internalcontrol system, set up an informationdisclosure committee for ensuring high-quality information disclosure to theinvestors and formulate a code of seniorexecutives’ occupational ethics and conductsfor continuously improving Sinopec Corp.’scorporate governance level.
2 INDEPENDENT DIRECTORS’PERFORMANCE OF THEIR DUTIESIn this reporting period, the independentdirectors performed their duties in strictcompliance with the relevant laws, rules andregulations and actively participated inSinopec Corp.’s decision making with adiligent and responsible attitude, and allmeetings of the Board of Directors wereattended by independent directors. In theaspects such as Sinopec Corp.’sdevelopment strategy, the promotion ofcompetitiveness and investment, theindependent directors put forward manyconstructive comments and advices andindependently examined the importantconnected transactions, including thetransactions concerning Sinopec Corp.’sexchange of some of its assets forsupplementary businesses with the parentcompany’s petrol stations, Sinopec Corp.’slease of Sinopec Group Company’s petrolstations and the 450 thousand tones peryear PTA project of Yizheng Chemical FiberCo., Ltd.
3 SEPARATION OF SINOPEC CORP. FROM ITSCONTROLLING SHAREHOLDERSinopec Corp. has already been separatedfrom its controlling shareholder, SinopecGroup Company, in the aspects such asbusiness, personnel, assets, organizationand finance and has its own independentand complete businesses and the ability ofindependent management and operation.
4 EXAMINATION AND INCENTIVEMECHANISM FOR SENIOR EXECUTIVESSinopec Corp. has established andcontinuously pursues a fair and transparentstandard of performance appraisal and anincentive and constraint mechanism for thedirectors, supervisors and the other seniorexecutives. It has formulated andimplemented such incentive policies as theKey Performance Appraisal and SalaryIncentive Plan for the Senior Executives ofSinopec Corp., the Plan of StockAppreciation Right for the Senior Executivesof Sinopec Corp. and the Detailed Rules onthe first Granting of Stock AppreciationRight for the Senior Executives of SinopecCorp. The stock appreciation right was notexercised yet in this reporting period.

SUMMARY OF SHAREHOLDERS’ MEETINGS
66
Sum
mar
y of
Sha
reho
lder
s’ M
eeti
ngs
During this reporting period, Sinopec Corp. heldone Shareholders’ General Meeting, being the2001 Annual General Meeting, in strictcompliance with the procedures of notification,convening and holding as stipulated in therelevant laws, rules and regulations and SinopecCorp.’s Articles of Association. The followingresolutions were examined and adopted at themeeting held at 21st Century Hotel, Beijing onJune 13, 2002:
i Report of the Board of Directors of SinopecCorp. for the year 2001.
ii Report of the Supervisory Committee ofSinopec Corp. for the year 2001.
iii Audited financial statements andconsolidated financial statements ofSinopec Corp. for the year 2001.
iv Profit distribution plan of Sinopec Corp. andthe appropriation of year-end dividend forthe year 2001.
v Approval of the reappointment of KPMGPeat Marwick Huazhen and KPMGrespectively as the domestic andinternational auditors of Sinopec Corp. forthe year 2002 and the resolution ofauthorizing the Board of Directors todetermine their remunerations.
vi Authorization of the Board of Directors todecide on matters concerning theappropriation of interim dividend.
vii The special resolution of approving theamendment to Section 2, Article 13 of theArticles of Association.
Details of the Annual General Meeting ofSinopec Corp. for the year 2001 and HaiwenLaw Firm’s participation in the meeting andpresentation of its legal opinion were set out inthe announcements published in ChinaSecurities News, Shanghai Securities News,Securities Times, Hong Kong Economic Timesand South China Morning Post (in English) onJune 14, 2002.
REPORT OF THE BOARD OF DIRECTORS
67
Rep
ort
of t
he B
oard
of
Dir
ecto
rs
Coal Gasification Co., Ltd.,resolutions on connected transactionsbetween Sinopec Yizheng ChemicalFiber Co., Ltd. and five subsidiariesof Sinopec Group Company in the450,000 tonnes/year PTA Companyproject and the resolutions onproviding stock mortgage to YangziBASF joint venture project werereviewed and approved.
vii The twenty-third meeting of the firstsession of the Board of Directors washeld on August 16, 2002 at theheadquarters of Sinopec Corp. TheReport on Operations in the first halfof 2002 and Operations Plan for thesecond half of the year, the Report onOperating Performance and FinancialPosition in the first half of 2002, theprofit distribution plan for the firsthalf of 2002, the financialstatements for the first half of 2002audited by KPMG Huazhen andKPMG, the 2002 Interim Report ofSinopec Corp. and the Summary ofthe 2002 Interim Report werereviewed and approved.
viii The twenty-fourth meeting of the firstsession of the Board of Directors washeld on September 25, 2002 by wayof written resolutions, whereby theproposal on the redemption of thecore petrochemical assets of SinopecHubei Xinghua Co., Ltd. and therelevant authorization were reviewedand approved.
ix The twenty-fifth meeting of the firstsession of the Board of Directors washeld on October 30, 2002 by way ofwritten resolutions, whereby theQuarterly Report for the ThirdQuarter of 2002 was reviewed andapproved.
x The twenty-sixth meeting of the firstsession of the Board of Directors washeld on December 19, 2002 at theheadquarters of Sinopec Corp.,whereby the Work Report of thePresident’s Team, the resolutions oncapital operation and the relevant
The Board of Directors of Sinopec Corp. haspleasure in presenting their report for the yearended December 31, 2002.
1 THE BOARD OF DIRECTORS
All the members of the Board of Directorsof Sinopec Corp. have carried out theirduties in accordance with the relevant lawsand regulations and the Articles ofAssociation of Sinopec Corp., and havefaithfully implemented the resolutionspassed at the Annual General Meeting andproceeded with such matters proactively.
During this reporting period, ten Boardmeetings were held, of which sevenmeetings were held by way of writtenresolutions, details of which are as follows:
(1) Board Meetingsi The seventeenth meeting of the first
session of the Board of Directors washeld on January 10, 2002 by way ofwritten resolutions. Resolutions forproviding relevant documents for theloan to the Shanghai Secco jointventure project as well as resolutionsfor adjusting the functions of theMaterials and Supply Departmentwere reviewed and passed.
ii The eighteenth meeting of the firstsession of the Board of Directors washeld on March 11, 2002 by way ofwritten resolutions. Resolutionsregarding capital operation werereviewed and passed.
iii The nineteenth meeting of the firstsession of the Board of Directors washeld at the headquarters of SinopecCorp. on March 28, 2002. The reportof 2001 Business Review and 2002Business Prospects of Sinopec Corp.,the preliminary profit appropriationplan for 2001 and the policy fordividend appropriation in 2002, theReport on Operating Performance andFinancial Position in 2001, the 2001Financial Statements audited byKPMG Huazhen and KPMG, the 2001Work Report of the Board ofDirectors and the submission of the
report to the 2001 Annual GeneralMeeting for approval, the 2001Annual Report, the summary of theannual report and the report onsubmission of Form 20-F to U.S.Securities and Exchange Commission,and the Report on 2002 FinancialBudget were reviewed and passed.Details of the nineteenth meeting ofthe first session of the Board ofDirectors of Sinopec Corp. were setout in the announcement of theresolutions published in ChinaSecurities News, Shanghai SecuritiesNews, Securities Times, Hong KongEconomic Times and South ChinaMorning Post (in English) in HongKong on March 29, 2002.
iv The twentieth meeting of the firstsession of the Board of Directors washeld on April 26, 2002 by way ofwritten resolutions. The QuarterlyReport for the First Quarter of 2002,the announcement of the 2001Annual General Meeting, the proposalon the transfer of the holding rightsof Sinopec Hubei Xinghua Co., Ltd.,the proposal on the amendment toSection 2, Article 13 of the Articlesof Association and the proposal onthe lease of Sinopec GroupCompany’s petrol stations werereviewed and passed.
v The twenty-first meeting of the firstsession of the Board of Directors washeld on June 28, 2002 by way ofwritten resolutions, whereby the Self-examination Report on theEstablishment of Modern EnterpriseSystem in the Listed Company andthe Report of Self-examination byControlling Shareholders of theListed Company were reviewed andapproved.
vi The twenty-second meeting of thefirst session of the Board of Directorswas held on August 9, 2002 by wayof written resolutions. Resolutions onthe realization of forecasted profit in2001, resolutions on providingguarantee to Yueyang Sinopec Shell

REPORT OF THE BOARD OF DIRECTORS (CONTINUED)
68
Rep
ort
of t
he B
oard
of
Dir
ecto
rs
authorization, the resolutions on theCompany’s swap of some of itsassets of supplementary businesseswith Sinopec Group Company’s petrolstations and the relevantauthorization were reviewedand passed.
2 MEETINGS OF PROFESSIONALCOMMITTEESDuring this reporting period, the AuditCommittee under the Board of Directorsheld two meetings.
i The first meeting of the first session ofthe Audit Committee was held on March26, 2002 at the headquarters of SinopecCorp., whereby the Explanations on theOperating Performance and FinancialPosition in 2001 and the Explanations onKPMG’s Annual Audit Adjustment for2001 were reviewed and the Opinions onthe Review of the 2001 FinancialStatements was issued.
ii The second meeting of the first sessionof the Audit Committee was held onAugust 15, 2002 at the headquarters ofSinopec Corp., whereby the Explanationson the 2002 Interim OperatingPerformance and Financial Position andthe Explanations on KPMG’s 2002Interim Audit Adjustment were reviewedand the Opinions on the Review of 2002Interim Financial Statements was issued.
3 RESULTSThe results of the Company for the yearended December 31, 2002 and its financialposition as at that date and its analysis areset out on page 114 to page 142 in thisAnnual Report.
4 DIVIDENDAt the 31st meeting of the first session ofthe Board of Directors of Sinopec Corp., theBoard approved the proposal to declareallcoation of a final dividend of RMB 0.08per share (including tax). After the interimcash dividend is deducted, the year enddividend/share for allocation would be RMB0.06 and the total cash dividend for the fullyear would amount to RMB 6.936 billion.The allocation proposal will be effective after
the submission has been approved at the2002 Annual General Meeting of SinopecCorp. The proposed year end dividend will bepaid on or before Friday, July 18, 2003 tothose shareholders whose names appear onthe register of members of Sinopec Corp. atthe close of business on Friday, June 20,2003. The register of members of SinopecCorp.’s H shares will be closed from Monday,June 16, 2003 to Friday, June 20, 2003(both dates inclusive). In order to qualify forthe year end dividend for H shares, all sharecertificates, accompanied by the transferforms, must be lodged with Hong KongRegistrars Limited, at Shops 1712 to 1716,17th Floor, Hopewell Centre, 183 Queen’sRoad East, Hong Kong by 4:00 pm on Friday,June 13, 2003 for registration.
Dividend will be denominated and declaredin Renminbi. The dividend for domesticshares will be paid in Renminbi and thedividend for foreign shares will be paid inHong Kong dollars. The exchange rate for thedividend to be paid in Hong Kong dollars isthe mean of the average rate of Hong Kongdollars to Renminbi as announced by thePeople’s Bank of China during the weekprior to the date of declaration of dividend.
Generally, an individual shareholder of Hshares or a holder of American DepositoryReceipts (ADRs) who is resident anddomiciled in the UK will be liable to UKincome tax on the dividend received fromSinopec Corp. Where a shareholder of Hshares receives dividend from Sinopec Corp.without deduction of tax, the amountincluded as income for the purposes ofcomputing his or her UK tax liability is thegross amount of the dividend and this istaxed at the appropriate rate (currently 10 %in the case of a taxpayer of a basic rate alower rate, and 32.5 % in the case of ataxpayer of higher rate). Where tax iswithheld from the dividend, credit will begiven against UK income tax for any taxwithheld from the dividend up to the amountof the UK income tax liability. Sinopec Corp.will assume responsibility for withholding taxat source within the PRC if such awithholding is required. The current Chinese-UK Double Taxation Agreement provides thatthe maximum withholding tax on dividend

69
Rep
ort
of t
he B
oard
of
Dir
ecto
rs
payable by a Chinese-domiciled company toUK residents is 10% of the gross dividend.
UK resident shareholders of H shares orholders of ADRs who are individuals notdomiciled in the UK will only be liable toincome tax on any dividend from SinopecCorp. to the extent that it is remitted tothe UK.
Generally, a shareholder of H shares or aholder of ADRs which is a UK tax residentcompany will be liable to UK corporation taxon dividend received from Sinopec Corp.,with double tax relief available forwithholding tax imposed. In certain cases(not to be discussed here), a shareholder ofH shares or a holder of ADRs which is a UKtax resident company may be entitled torelief for “underlying” tax paid by SinopecCorp. or its subsidiaries.
5 MAJOR SUPPLIERS AND CUSTOMERSThe total purchase from the five largestsuppliers represented 35% of the totalpurchase of the Company and the totalpurchase from the largest supplierrepresented 13% of the total purchase ofthe Company. Sales to the five largestcustomers of the Company represented 16%of the total annual sales of the Company.
During this reporting period, except for theconnected transactions with the controllingshareholder, Sinopec Group Company, asdisclosed in Section IX of this AnnualReport, none of the directors, supervisors ofSinopec Corp. and their associates or anyshareholders holding over 5% in SinopecCorp. had any interest in any of the above-mentioned major suppliers and customers.
6 BANK LOANS AND OTHER BORROWINGSDetails of bank loans and other borrowingsof the Company as at December 31, 2002are set out in Note 26 of the FinancialStatements prepared under with IFRS in thisAnnual Report.
7 FIXED ASSETSDuring this reporting period, changes to thefixed assets of the Company are set out inNote 17 of the Financial Statementsprepared under IFRS in this Annual Report.
8 RESERVESDuring this reporting period, changes to thereserves of the Company are set out in theConsolidated Statement of Changes inShareholders’ Equity in the FinancialStatements prepared under IFRS in thisAnnual Report.
9 DONATIONSDuring this reporting period, donationsmade for charitable purposes amounted toapproximately RMB 66 million.
10 PRE-EMPTIVE RIGHTSPursuant to the Articles of Association ofSinopec Corp. and the laws of the PRC,Sinopec Corp. is not subject to any pre-emptive rights requiring it to offer new issueof its shares to its existing shareholders inproportion to their shareholdings.
11 PURCHASE, SALES AND REDEMPTION OFSHARESDuring this reporting period, the Companyhas not purchased, sold or redeemed anysecurities of Sinopec Corp.
12 COMPLIANCE WITH THE CODE OF BESTPRACTICEThe Board of Directors believes that, duringthis reporting period, Sinopec Corp.complied with the Code of Best Practice asset out in Appendix 14 of the Listing Rulesof the Hong Kong Stock Exchange.
By Order of the BoardLi YizhongChairman
Beijing, the PRC, 28 March 2003
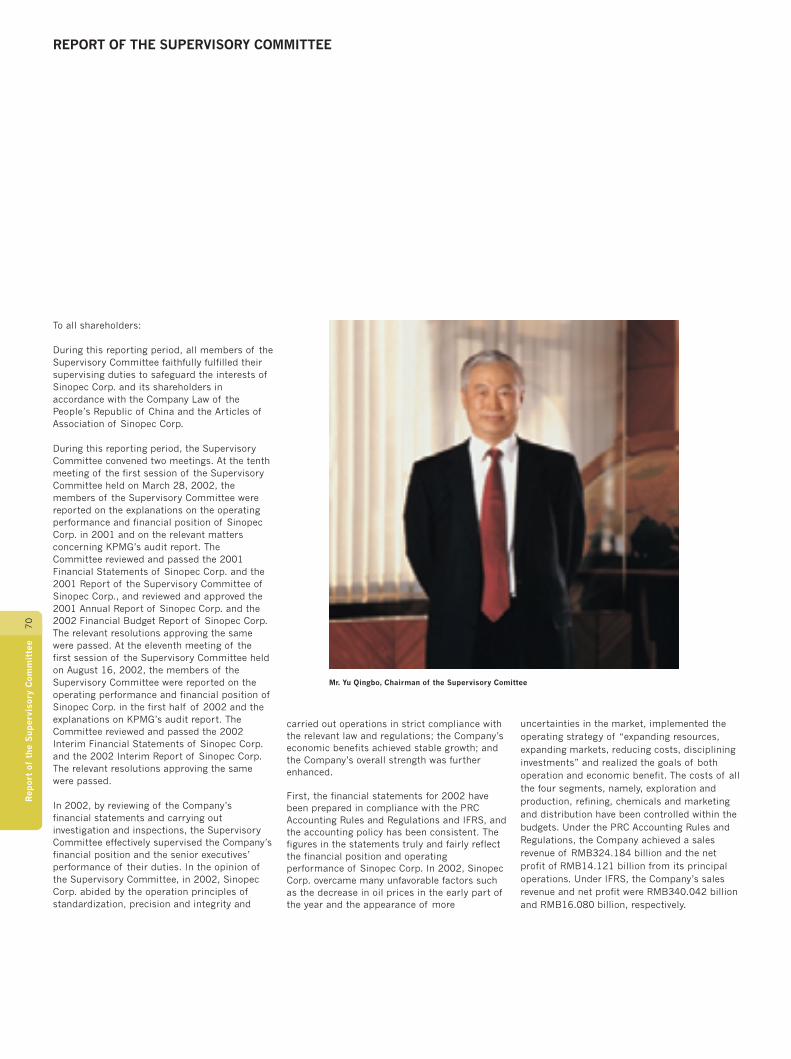
70
Rep
ort
of t
he S
uper
viso
ry C
omm
itte
e
REPORT OF THE SUPERVISORY COMMITTEE
To all shareholders:
During this reporting period, all members of theSupervisory Committee faithfully fulfilled theirsupervising duties to safeguard the interests ofSinopec Corp. and its shareholders inaccordance with the Company Law of thePeople’s Republic of China and the Articles ofAssociation of Sinopec Corp.
During this reporting period, the SupervisoryCommittee convened two meetings. At the tenthmeeting of the first session of the SupervisoryCommittee held on March 28, 2002, themembers of the Supervisory Committee werereported on the explanations on the operatingperformance and financial position of SinopecCorp. in 2001 and on the relevant mattersconcerning KPMG’s audit report. TheCommittee reviewed and passed the 2001Financial Statements of Sinopec Corp. and the2001 Report of the Supervisory Committee ofSinopec Corp., and reviewed and approved the2001 Annual Report of Sinopec Corp. and the2002 Financial Budget Report of Sinopec Corp.The relevant resolutions approving the samewere passed. At the eleventh meeting of thefirst session of the Supervisory Committee heldon August 16, 2002, the members of theSupervisory Committee were reported on theoperating performance and financial position ofSinopec Corp. in the first half of 2002 and theexplanations on KPMG’s audit report. TheCommittee reviewed and passed the 2002Interim Financial Statements of Sinopec Corp.and the 2002 Interim Report of Sinopec Corp.The relevant resolutions approving the samewere passed.
In 2002, by reviewing of the Company’sfinancial statements and carrying outinvestigation and inspections, the SupervisoryCommittee effectively supervised the Company’sfinancial position and the senior executives’performance of their duties. In the opinion ofthe Supervisory Committee, in 2002, SinopecCorp. abided by the operation principles ofstandardization, precision and integrity and
carried out operations in strict compliance withthe relevant law and regulations; the Company’seconomic benefits achieved stable growth; andthe Company’s overall strength was furtherenhanced.
First, the financial statements for 2002 havebeen prepared in compliance with the PRCAccounting Rules and Regulations and IFRS, andthe accounting policy has been consistent. Thefigures in the statements truly and fairly reflectthe financial position and operatingperformance of Sinopec Corp. In 2002, SinopecCorp. overcame many unfavorable factors suchas the decrease in oil prices in the early part ofthe year and the appearance of more
uncertainties in the market, implemented theoperating strategy of “expanding resources,expanding markets, reducing costs, disciplininginvestments” and realized the goals of bothoperation and economic benefit. The costs of allthe four segments, namely, exploration andproduction, refining, chemicals and marketingand distribution have been controlled within thebudgets. Under the PRC Accounting Rules andRegulations, the Company achieved a salesrevenue of RMB324.184 billion and the netprofit of RMB14.121 billion from its principaloperations. Under IFRS, the Company’s salesrevenue and net profit were RMB340.042 billionand RMB16.080 billion, respectively.
Mr. Yu Qingbo, Chairman of the Supervisory Comittee

71
Rep
ort
of t
he S
uper
viso
ry C
omm
itte
e
cash management and cost control. In respectof materials procurement management, theCompany newly promulgated regulations suchas the Detailed Rules for the Implementation ofCentralized Materials Procurement by theHeadquarters of Sinopec Corp., which furtherstandardized the behavior of materialsprocurement and achieved progress incentralized management by dedicateddepartments, centralized procurement andonline procurement.
Fourthly, the operation of connectedtransactions was in conformity with the relevantregulations. The Supervisory Committee is ofthe opinion that all connected transactionsbetween the Company and Sinopec GroupCompany were in conformity with the relevantregulations of the Hong Kong Stock Exchangeand Shanghai Stock Exchange, and that thepricing of the connected transaction of assetsswap that happened was reasonable, fair and incompliance with the principle of “fairness,justness and openness”. Neither the interests ofthe non-connected shareholders nor SinopecCorp. were found infringed.
Fifthly, the senior management including theDirectors and the President of Sinopec Corp.adhered to the principles of diligence andintegrity, and faithfully carried out businessoperations aiming at maximizing the interestsof the Company. The Supervisory Committeewas not aware of any violation of laws,regulations and the Articles of Association ofSinopec Corp., or any infringement of theshareholders’ interests by the above personnelduring the discharge of their duties in thisreporting period.
In the year ahead, the Supervisory Committeewill focus on the research and investigations onthe execution of the fixed asset investment plan,asset acquisition or swap, the operation ofconnected transactions, the improvement andimplementation of internal control and theexecution of financial budget. The SupervisoryCommittee will further strengthen itssupervision and investigation on the Company’sfinancial conditions and, based on the principleof moving ahead in an aggressive spirit and ofintegrity, perform its supervisory functionsthoroughly promoting the growth of theCompany’s profit in 2003 and safeguarding theshareholders’ interests.
Yu QingboChairman of the Supervisory Committee
Beijing, the PRC, March 28, 2003
Secondly, the Company’s asset reorganizationand capital operation were in conformity withthe relevant regulations and effective. By takingsuch measures as asset reorganization, SinopecCorp. further optimized its upstream oil and gasresources and enhanced the integration of assetresources, production and marketing of itslubricating oil subsidiaries. The use of proceedsraised did not exceed the boundary of what theCompany had promised. Sound capitaloperation further clarified the relationshipbetween Sinopec Corp. and its subsidiaries. Asfor the transactions such as the transfer of thestate-owned shares of Hubei Xinghua Co., Ltd.and the redemption of the said company’s corepetrochemical assets, the SupervisoryCommittee is of the opinion that the pricing oftransfer and redemption are fair andreasonable, and neither the shareholders’interests were infringed nor it caused areduction of the assets of Sinopec Corp.
Thirdly, the Company’s internal managementwas further strengthened. In respect ofproduction and marketing, the Companyestablished a mechanism of co-ordination andcentralized decision-making, strengthened thelinking of industrial chain which gave full play tothe advantages of the integration of theupstream, midstream and downstreambusinesses, adjusted its marketing strategy,flexibly adapted itself to changes in the marketand realized the maximum overall efficiency. TheCompany also made progress in the pilotprogram in refining and marketing subsidiariesfor management hierarchy reduction andspecialization. In respect of financialmanagement, the Company emphaticallystrengthened budget management, centralized
DIRECTORS, SUPERVISORS, SENIOR MANAGEMENT AND EMPLOYEES
72
Dir
ecto
rs,
Sup
ervi
sors
,S
enio
r M
anag
emen
t an
d E
mp
loye
es
1990 to April 1997, Mr. Mou served asDeputy Director and Director of JiangsuPetroleum Exploration Bureau. From April1997 to April 1998, Mr. Mou served asDirector of Shengli PetroleumAdministration Bureau. Mr. Mou served asVice President of China PetrochemicalCorporation from April 1998 to February2000. Mr. Mou is Vice President ofSinopec Corp. and was also elected asDirector in February 2000.
Zhang Jiaren, 58, Director, Vice Presidentand Chief Financial Officer of SinopecCorp. Mr. Zhang graduated from HefeiIndustrial University in July 1966specialising in electrical engineering. Mr.Zhang is a professor level senior economistwith over 30 years’ managementexperience in China’s petrochemicalindustry. From August 1987 to July 1994,Mr. Zhang served as Vice President andPresident of Zhenhai Petroleum andPetrochemical Plant under Old Sinopec.From July 1994 to April 1998, Mr. Zhangserved as Chairman and President ofZhenhai Refining and Chemical Company.Mr. Zhang served as Vice President ofChina Petrochemical Corporation fromApril 1998 to February 2000. Mr. Zhang isVice President of Sinopec Corp. and wasalso elected as Director of Sinopec Corp.in February 2000 and then Chief FinancialOfficer in March 2000.
Cao Xianghong, 57, Director and VicePresident of Sinopec Corp. Mr. Caograduated from Nanjing PetrochemicalInstitute in July 1967 specialising in macromolecular chemistry. Mr. Cao is aprofessor level senior engineer and anacademician of the China Academy ofEngineering. Mr. Cao has over 30 years’management experience in China’spetrochemical industry. From July 1984 toAugust 1997, Mr. Cao served as VicePresident and Chief Engineer of BeijingYansan Petrochemical Company under OldSinopec. From August 1997 to February2000, Mr. Cao served as President, ViceChairman and Chairman of Beijing YansanPetrochemical Company Limited andChairman of Beijing Yanhua Petrochemical
1 GENERAL INFORMATION ON DIRECTORS,SUPERVISORS AND SENIOR MANAGEMENT
(1) Directors
Li Yizhong, 57, Chairman of the Board ofDirectors of Sinopec Corp. Mr. Li is alsoPresident of China PetrochemicalCorporation. Mr. Li graduated from BeijingPetroleum Institute in July 1966specialising in refining engineering. Mr. Liis a professor level senior engineer and hasover 30 years’ management experience inChina’s petroleum and petrochemicalindustry. From December 1984 to July1987, Mr. Li was President of QiluPetroleum and Petrochemical Companyunder China Petrochemical Corporationbefore the industry reorganisation (“OldSinopec”). From July 1987 to August1997, Mr. Li was Vice President and thenManaging Vice President of Old Sinopec .From August 1997 to April 1998, Mr. Liserved as Chairman and President ofChina East United Petrochemical GroupCompany Limited, and Chairman ofYizheng Chemical Fibre Company Limited.Mr. Li has been President of ChinaPetrochemical Corporation since April1998. Mr. Li was elected as 2002 CCTVCelebrity of Economy, and he was alsoelected as the member of 16th sessioncentral committee of the ChineseCommunist Party in November 2002. Mr Liwas elected as Director and Chairman ofthe Board of Directors of Sinopec Corp. inFebruary 2000.
Chen Tonghai, 54, Vice Chairman of theBoard of Directors of Sinopec Corp. Mr.Chen is also Vice President of ChinaPetrochemical Corporation. Mr. Chengraduated from Northeast PetroleumInstitute in September 1976 specialising inexploration engineering. Mr. Chen is asenior economist. He has extensiveexperience in petrochemical industryadministration and macro-economicmanagement. From March 1983 toDecember 1986, Mr. Chen was DeputyHead and then Head of Zhenhai Petroleumand Petrochemical Plant under OldSinopec. From December 1986 to July1989, Mr. Chen served as Deputy Mayor of
Ningbo City. From July 1989 to June 1991,Mr. Chen served as Deputy ManagingDirector of Planning and EconomicCommittee of Zhejiang Province. FromJune 1991 to February 1992, Mr. Chenserved as Acting Mayor of Ningbo City.From February 1992 to January 1994 , Mr.Chen served as Mayor of Ningbo City,Zhejiang Province. From January 1994 toApril 1998, Mr. Chen served as ViceMinister of the State Development andPlanning Commission. Mr. Chen has beenVice President of China PetrochemicalCorporation since April 1998. Mr. Chenwas elected as Director and Vice Chairmanof the Board of Directors of Sinopec Corp.in February 2000.
Wang Jiming, 60, Director and Presidentof Sinopec Corp. Mr. Wang graduated fromEast China Chemical Institute inSeptember 1964 specialising in petroleumrefining. Mr. Wang is a professor levelsenior engineer with over 30 years’management experience in China’spetroleum and petrochemical industry.From November 1984 to June 1993, Mr.Wang served as Vice President, ActingPresident and President of ShanghaiPetrochemical Plant under Old Sinopec.Mr. Wang served as Chairman andPresident of Shanghai PetrochemicalCompany Limited from June 1993 toFebruary 1994. He served as VicePresident of Old Sinopec and Chairman ofShanghai Petrochemical Company fromFebruary 1994 to April 1998. Mr. Wangserved as Vice President of ChinaPetrochemical Corporation from April1998 to February 2000. Mr. Wang isPresident of Sinopec Corp. and was alsoelected as Director in February 2000.Since December 2001, Mr. Wang has alsobeen Chairman of Shanghai SECCOPetrochemical Company Limited.
Mou Shuling, 58, Director and VicePresident of Sinopec Corp. Mr. Mougraduated from Beijing Petroleum Institutein July 1968 specialising in petroleumexploration engineering. Mr. Mou is aprofessor level senior engineer and hasover 30 years’ management experience inChina’s petroleum industry. From February

73
Dir
ecto
rs,
Sup
ervi
sors
,S
enio
r M
anag
emen
t an
d E
mp
loye
es
Company Limited. Mr. Cao is VicePresident of Sinopec Corp. and was alsoelected as Director in February 2000.
Wang Yi, 46, Director of Sinopec Corp. Mr.Wang graduated from Peking Universitymajoring in Chinese history in August1982. He then obtained a master’s degreefrom Peking University in contemporaryChinese history in December 1984. InJune 1997, Mr. Wang obtained a doctoratedegree in economics from SouthwestFinance University. Mr. Wang was engagedin policy research, financial securitiesadministration and management over along period of time, and has accumulatedextensive experience in these areas. FromOctober 1985 to September 1992, he wasSecretary of the Bureau of CentralGovernment Consultant Committee . FromSeptember 1992 to October 1995, he wasDeputy Director of Office of SecuritiesCommission under the State Council. FromOctober 1995 to January 1999, he wasVice Chairman of China SecuritiesRegulatory Commission (“CSRC”). He hasbeen Vice President of China DevelopmentBank since January 1999. Mr. Wang waselected as Director of Sinopec Corp. inAugust 2001.
Zhang Enzhao, 56, Director of SinopecCorp. Mr. Zhang graduated from FudanUniversity specialising in Finance in July1984. He is a senior economist. Mr. Zhanghas been working in the financialmanagement for many years, and hasaccumulated extensive experience in thisarea. From July 1984 to January 1986, hewas Vice President of China InvestmentBank Shanghai Branch. From January1986 to June 1987, he was Vice Presidentof China Construction Bank ShanghaiBranch. From June 1987 to September1999, he was President of ChinaConstruction Bank Shanghai Branch. FromSeptember 1999 to January 2002, he wasVice President of China ConstructionBank. He has been President of ChinaConstruction Bank since January 2002. Mr.Zhang was elected as Director of SinopecCorp. in August 2001.
Chen Qingtai, 65, Independent Non-executive Director of Sinopec Corp. Mr.Chen graduated from Tsinghua Universityin February 1964 specialising in power anddynamics engineering. Mr. Chen is aresearcher and professor. From October1982 to July 1992, Mr. Chen was ChiefEngineer, President and Chairman ofChina No. 2 Automobile Works andChairman of Shenlong Automobile WorksLtd.. From July 1992 to April 1993, Mr.Chen served as Deputy Director of theState Council Economic and Trade Office.From April 1993 to March 1998, Mr. Chenserved as Deputy Director of StateEconomic and Trade Commission. Mr.Chen has been Vice Minister of StateCouncil Development and Research Centerand a member of the 9th session ofChinese People’s Political ConsultativeConference since March 1998. Since July2000, he has been Director of the PublicManagement College under TsinghuaUniversity. Mr. Chen was elected asIndependent Non-executive Director ofSinopec Corp. in February 2000.
Liu Guoguang, 79, Independent Non-executive Director of Sinopec Corp. Mr. Liuis a well-known economist in China and isa Member of the Standing Committee ofthe 8th National People’s Congress. Mr. Liugraduated from National Southwest UnitedUniversity in 1946 specialising ineconomics. He later graduated from theGraduate School of Moscow NationalInstitute of Economics in 1955, where heobtained a researcher qualification anddoctorate degree. From 1955 to 1982, Mr.Liu served as Researcher and VicePresident of Economic Research Instituteof China Academy of Social Science andas Deputy Director of the NationalStatistics Bureau. From 1982 to 1983, Mr.Liu served as Vice Chancellor of ChinaAcademy of Social Science and Presidentof Economic Research Institute of ChinaAcademy of Social Science. Since 1993,Mr. Liu has been a special consultant forChina Academy of Social Science. Mr. Liuwas elected as Independent Non-executiveDirector of Sinopec Corp. in February 2000.
Ho Tsu Kwok Charles, 53, IndependentNon-executive Director of Sinopec Corp.Mr. Ho is Chairman of Hong Kong TobaccoCompany Limited, a cigarettemanufacturer and distributor in the AsiaPacific. Mr. Ho is also Chairman andDirector of Global China InvestmentsLimited, a joint venture between aCanadian provincial government pensionfund and the Ontario Municipal EmployeesRetirement System. He is responsible fordevising investment and managementstrategies for Global China InvestmentsLimited. Mr. Ho is Chairman of GlobalChina Investments Holdings Limited andNon-executive Director of Sing TaoHoldings Limited, and a non-executivedirector of China National AviationCompany Limited, each listed on the HongKong Stock Exchange. Mr. Ho is also amember of the Chinese People’s PoliticalConsultative Conference and a member ofEconomic Consultative Advisor toShandong provincial government. He is amember of the Board of Trustees of theUniversity of International Business andEconomics of China and Honorarymember of the Board of Trustees ofPeking University and Chinese Universityof Hong Kong. Mr. Ho was elected asIndependent Non-executive Director ofSinopec Corp. in June 2000.
Huang Min, female, 59, EmployeeRepresentative Director of Sinopec Corp.Ms. Huang graduated from BeijingPetroleum Institute in July 1968specialising in petroleum explorationengineering. She is a professor leveleconomist. Ms. Huang has extensiveexperience in personnel management inpetroleum industry. Ms. Huang wasPresident of the Labour Union of ShengliPetroleum Administration Bureau fromDecember 1992 to December 2002. Shewas elected as Employee RepresentativeDirector of Sinopec Corp. in February2000.
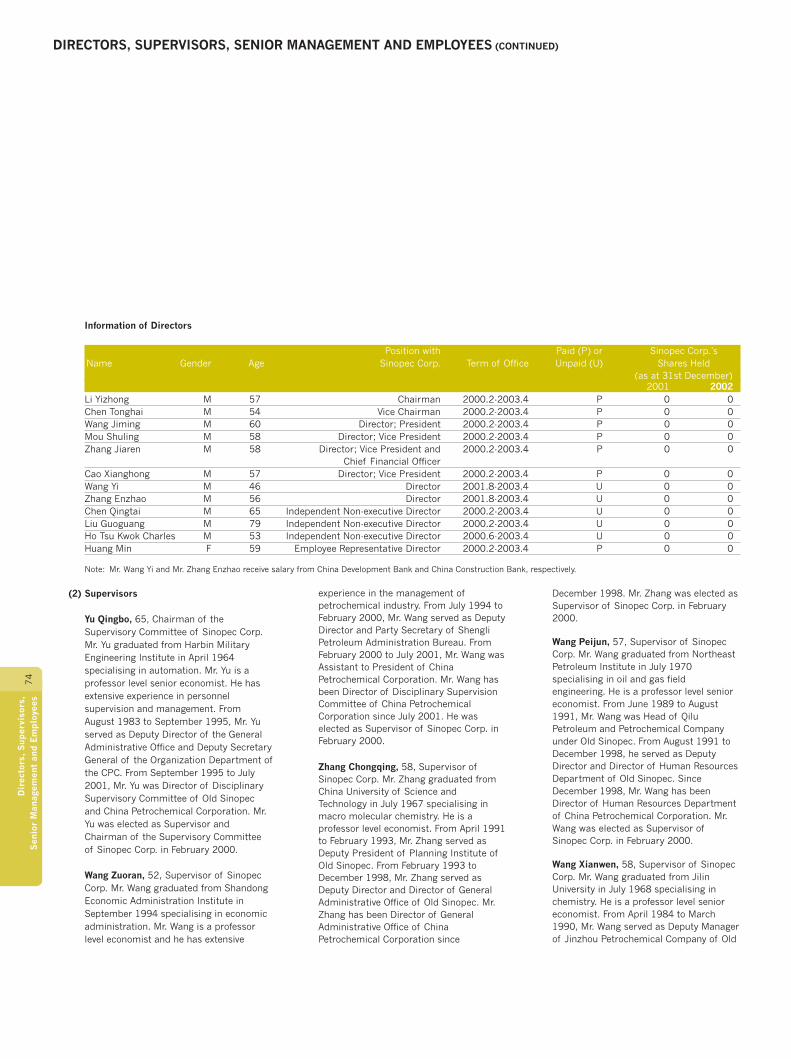
DIRECTORS, SUPERVISORS, SENIOR MANAGEMENT AND EMPLOYEES (CONTINUED)
74
Dir
ecto
rs,
Sup
ervi
sors
,S
enio
r M
anag
emen
t an
d E
mp
loye
es
Information of Directors
Position with Paid (P) or Sinopec Corp.’sName Gender Age Sinopec Corp. Term of Office Unpaid (U) Shares Held
(as at 31st December)2001 2002
Li Yizhong M 57 Chairman 2000.2-2003.4 P 0 0Chen Tonghai M 54 Vice Chairman 2000.2-2003.4 P 0 0Wang Jiming M 60 Director; President 2000.2-2003.4 P 0 0Mou Shuling M 58 Director; Vice President 2000.2-2003.4 P 0 0Zhang Jiaren M 58 Director; Vice President and 2000.2-2003.4 P 0 0
Chief Financial OfficerCao Xianghong M 57 Director; Vice President 2000.2-2003.4 P 0 0Wang Yi M 46 Director 2001.8-2003.4 U 0 0Zhang Enzhao M 56 Director 2001.8-2003.4 U 0 0Chen Qingtai M 65 Independent Non-executive Director 2000.2-2003.4 U 0 0Liu Guoguang M 79 Independent Non-executive Director 2000.2-2003.4 U 0 0Ho Tsu Kwok Charles M 53 Independent Non-executive Director 2000.6-2003.4 U 0 0Huang Min F 59 Employee Representative Director 2000.2-2003.4 P 0 0
Note: Mr. Wang Yi and Mr. Zhang Enzhao receive salary from China Development Bank and China Construction Bank, respectively.
(2) Supervisors
Yu Qingbo, 65, Chairman of theSupervisory Committee of Sinopec Corp.Mr. Yu graduated from Harbin MilitaryEngineering Institute in April 1964specialising in automation. Mr. Yu is aprofessor level senior economist. He hasextensive experience in personnelsupervision and management. FromAugust 1983 to September 1995, Mr. Yuserved as Deputy Director of the GeneralAdministrative Office and Deputy SecretaryGeneral of the Organization Department ofthe CPC. From September 1995 to July2001, Mr. Yu was Director of DisciplinarySupervisory Committee of Old Sinopecand China Petrochemical Corporation. Mr.Yu was elected as Supervisor andChairman of the Supervisory Committeeof Sinopec Corp. in February 2000.
Wang Zuoran, 52, Supervisor of SinopecCorp. Mr. Wang graduated from ShandongEconomic Administration Institute inSeptember 1994 specialising in economicadministration. Mr. Wang is a professorlevel economist and he has extensive
experience in the management ofpetrochemical industry. From July 1994 toFebruary 2000, Mr. Wang served as DeputyDirector and Party Secretary of ShengliPetroleum Administration Bureau. FromFebruary 2000 to July 2001, Mr. Wang wasAssistant to President of ChinaPetrochemical Corporation. Mr. Wang hasbeen Director of Disciplinary SupervisionCommittee of China PetrochemicalCorporation since July 2001. He waselected as Supervisor of Sinopec Corp. inFebruary 2000.
Zhang Chongqing, 58, Supervisor ofSinopec Corp. Mr. Zhang graduated fromChina University of Science andTechnology in July 1967 specialising inmacro molecular chemistry. He is aprofessor level economist. From April 1991to February 1993, Mr. Zhang served asDeputy President of Planning Institute ofOld Sinopec. From February 1993 toDecember 1998, Mr. Zhang served asDeputy Director and Director of GeneralAdministrative Office of Old Sinopec. Mr.Zhang has been Director of GeneralAdministrative Office of ChinaPetrochemical Corporation since
December 1998. Mr. Zhang was elected asSupervisor of Sinopec Corp. in February2000.
Wang Peijun, 57, Supervisor of SinopecCorp. Mr. Wang graduated from NortheastPetroleum Institute in July 1970specialising in oil and gas fieldengineering. He is a professor level senioreconomist. From June 1989 to August1991, Mr. Wang was Head of QiluPetroleum and Petrochemical Companyunder Old Sinopec. From August 1991 toDecember 1998, he served as DeputyDirector and Director of Human ResourcesDepartment of Old Sinopec. SinceDecember 1998, Mr. Wang has beenDirector of Human Resources Departmentof China Petrochemical Corporation. Mr.Wang was elected as Supervisor ofSinopec Corp. in February 2000.
Wang Xianwen, 58, Supervisor of SinopecCorp. Mr. Wang graduated from JilinUniversity in July 1968 specialising inchemistry. He is a professor level senioreconomist. From April 1984 to March1990, Mr. Wang served as Deputy Managerof Jinzhou Petrochemical Company of Old
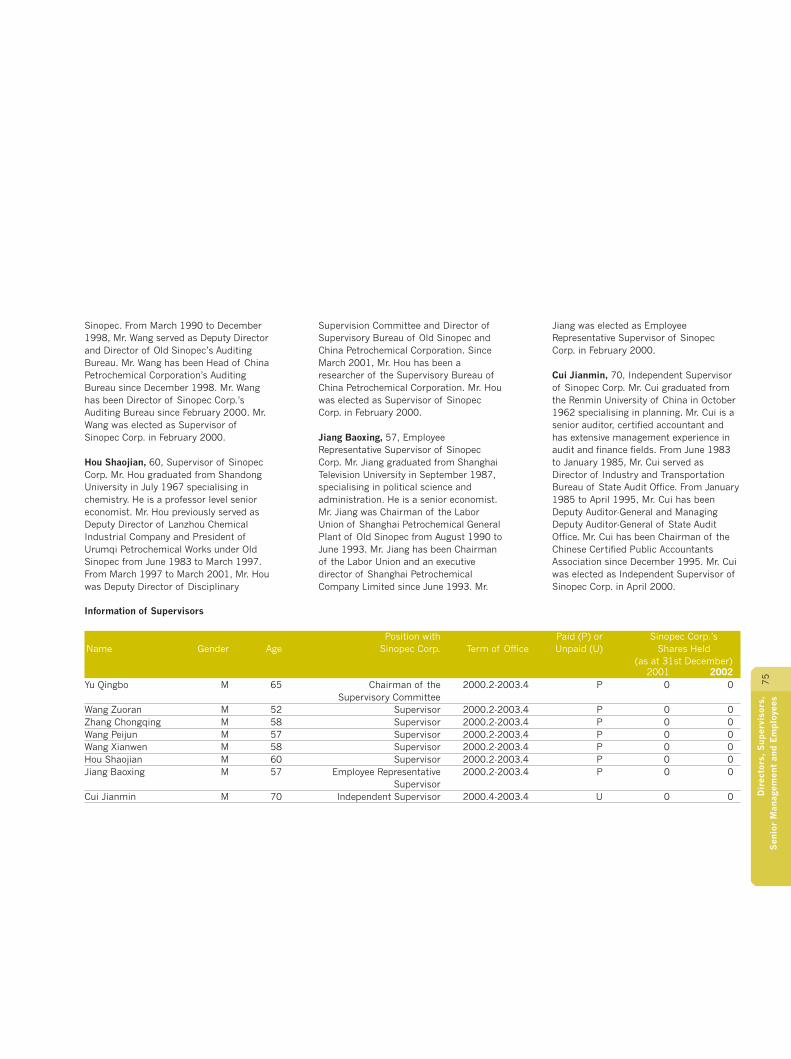
75
Dir
ecto
rs,
Sup
ervi
sors
,S
enio
r M
anag
emen
t an
d E
mp
loye
es
Sinopec. From March 1990 to December1998, Mr. Wang served as Deputy Directorand Director of Old Sinopec’s AuditingBureau. Mr. Wang has been Head of ChinaPetrochemical Corporation’s AuditingBureau since December 1998. Mr. Wanghas been Director of Sinopec Corp.’sAuditing Bureau since February 2000. Mr.Wang was elected as Supervisor ofSinopec Corp. in February 2000.
Hou Shaojian, 60, Supervisor of SinopecCorp. Mr. Hou graduated from ShandongUniversity in July 1967 specialising inchemistry. He is a professor level senioreconomist. Mr. Hou previously served asDeputy Director of Lanzhou ChemicalIndustrial Company and President ofUrumqi Petrochemical Works under OldSinopec from June 1983 to March 1997.From March 1997 to March 2001, Mr. Houwas Deputy Director of Disciplinary
Supervision Committee and Director ofSupervisory Bureau of Old Sinopec andChina Petrochemical Corporation. SinceMarch 2001, Mr. Hou has been aresearcher of the Supervisory Bureau ofChina Petrochemical Corporation. Mr. Houwas elected as Supervisor of SinopecCorp. in February 2000.
Jiang Baoxing, 57, EmployeeRepresentative Supervisor of SinopecCorp. Mr. Jiang graduated from ShanghaiTelevision University in September 1987,specialising in political science andadministration. He is a senior economist.Mr. Jiang was Chairman of the LaborUnion of Shanghai Petrochemical GeneralPlant of Old Sinopec from August 1990 toJune 1993. Mr. Jiang has been Chairmanof the Labor Union and an executivedirector of Shanghai PetrochemicalCompany Limited since June 1993. Mr.
Jiang was elected as EmployeeRepresentative Supervisor of SinopecCorp. in February 2000.
Cui Jianmin, 70, Independent Supervisorof Sinopec Corp. Mr. Cui graduated fromthe Renmin University of China in October1962 specialising in planning. Mr. Cui is asenior auditor, certified accountant andhas extensive management experience inaudit and finance fields. From June 1983to January 1985, Mr. Cui served asDirector of Industry and TransportationBureau of State Audit Office. From January1985 to April 1995, Mr. Cui has beenDeputy Auditor-General and ManagingDeputy Auditor-General of State AuditOffice. Mr. Cui has been Chairman of theChinese Certified Public AccountantsAssociation since December 1995. Mr. Cuiwas elected as Independent Supervisor ofSinopec Corp. in April 2000.
Information of Supervisors
Position with Paid (P) or Sinopec Corp.’sName Gender Age Sinopec Corp. Term of Office Unpaid (U) Shares Held
(as at 31st December)2001 2002
Yu Qingbo M 65 Chairman of the 2000.2-2003.4 P 0 0Supervisory Committee
Wang Zuoran M 52 Supervisor 2000.2-2003.4 P 0 0Zhang Chongqing M 58 Supervisor 2000.2-2003.4 P 0 0Wang Peijun M 57 Supervisor 2000.2-2003.4 P 0 0Wang Xianwen M 58 Supervisor 2000.2-2003.4 P 0 0Hou Shaojian M 60 Supervisor 2000.2-2003.4 P 0 0Jiang Baoxing M 57 Employee Representative 2000.2-2003.4 P 0 0
SupervisorCui Jianmin M 70 Independent Supervisor 2000.4-2003.4 U 0 0
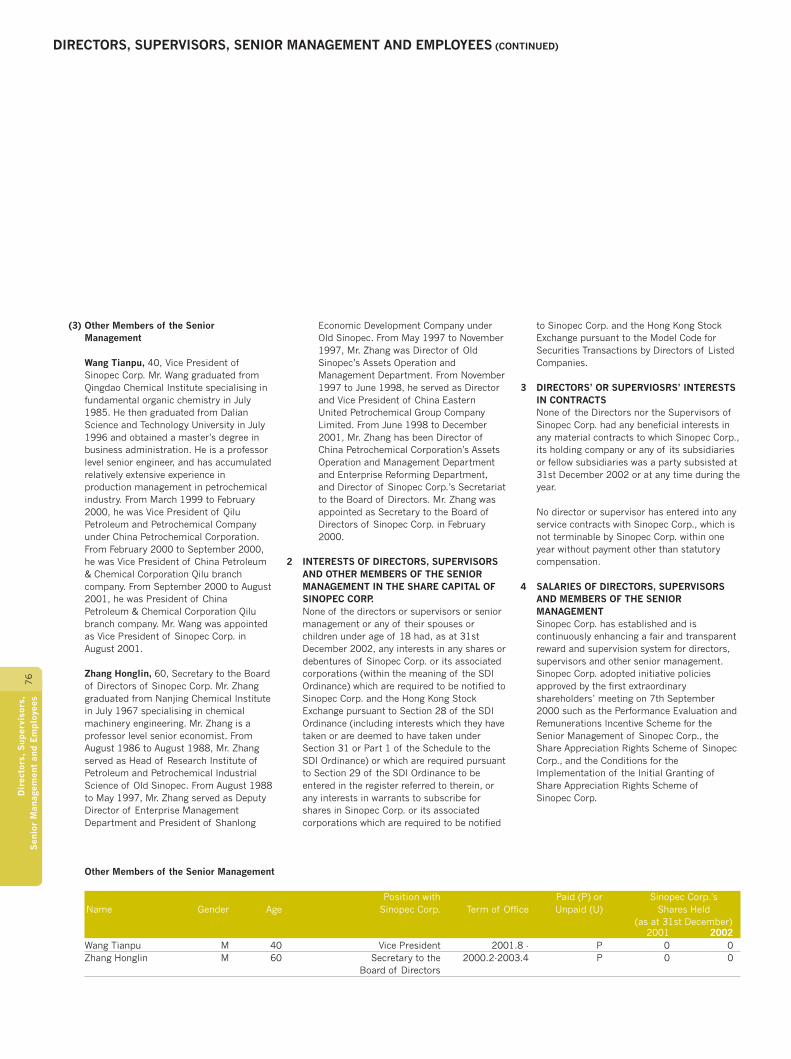
DIRECTORS, SUPERVISORS, SENIOR MANAGEMENT AND EMPLOYEES (CONTINUED)
76
Dir
ecto
rs,
Sup
ervi
sors
,S
enio
r M
anag
emen
t an
d E
mp
loye
es
(3) Other Members of the SeniorManagement
Wang Tianpu, 40, Vice President ofSinopec Corp. Mr. Wang graduated fromQingdao Chemical Institute specialising infundamental organic chemistry in July1985. He then graduated from DalianScience and Technology University in July1996 and obtained a master’s degree inbusiness administration. He is a professorlevel senior engineer, and has accumulatedrelatively extensive experience inproduction management in petrochemicalindustry. From March 1999 to February2000, he was Vice President of QiluPetroleum and Petrochemical Companyunder China Petrochemical Corporation.From February 2000 to September 2000,he was Vice President of China Petroleum& Chemical Corporation Qilu branchcompany. From September 2000 to August2001, he was President of ChinaPetroleum & Chemical Corporation Qilubranch company. Mr. Wang was appointedas Vice President of Sinopec Corp. inAugust 2001.
Zhang Honglin, 60, Secretary to the Boardof Directors of Sinopec Corp. Mr. Zhanggraduated from Nanjing Chemical Institutein July 1967 specialising in chemicalmachinery engineering. Mr. Zhang is aprofessor level senior economist. FromAugust 1986 to August 1988, Mr. Zhangserved as Head of Research Institute ofPetroleum and Petrochemical IndustrialScience of Old Sinopec. From August 1988to May 1997, Mr. Zhang served as DeputyDirector of Enterprise ManagementDepartment and President of Shanlong
Economic Development Company underOld Sinopec. From May 1997 to November1997, Mr. Zhang was Director of OldSinopec’s Assets Operation andManagement Department. From November1997 to June 1998, he served as Directorand Vice President of China EasternUnited Petrochemical Group CompanyLimited. From June 1998 to December2001, Mr. Zhang has been Director ofChina Petrochemical Corporation’s AssetsOperation and Management Departmentand Enterprise Reforming Department,and Director of Sinopec Corp.’s Secretariatto the Board of Directors. Mr. Zhang wasappointed as Secretary to the Board ofDirectors of Sinopec Corp. in February2000.
2 INTERESTS OF DIRECTORS, SUPERVISORSAND OTHER MEMBERS OF THE SENIORMANAGEMENT IN THE SHARE CAPITAL OFSINOPEC CORP.None of the directors or supervisors or seniormanagement or any of their spouses orchildren under age of 18 had, as at 31stDecember 2002, any interests in any shares ordebentures of Sinopec Corp. or its associatedcorporations (within the meaning of the SDIOrdinance) which are required to be notified toSinopec Corp. and the Hong Kong StockExchange pursuant to Section 28 of the SDIOrdinance (including interests which they havetaken or are deemed to have taken underSection 31 or Part 1 of the Schedule to theSDI Ordinance) or which are required pursuantto Section 29 of the SDI Ordinance to beentered in the register referred to therein, orany interests in warrants to subscribe forshares in Sinopec Corp. or its associatedcorporations which are required to be notified
to Sinopec Corp. and the Hong Kong StockExchange pursuant to the Model Code forSecurities Transactions by Directors of ListedCompanies.
3 DIRECTORS’ OR SUPERVIOSRS’ INTERESTSIN CONTRACTSNone of the Directors nor the Supervisors ofSinopec Corp. had any beneficial interests inany material contracts to which Sinopec Corp.,its holding company or any of its subsidiariesor fellow subsidiaries was a party subsisted at31st December 2002 or at any time during theyear.
No director or supervisor has entered into anyservice contracts with Sinopec Corp., which isnot terminable by Sinopec Corp. within oneyear without payment other than statutorycompensation.
4 SALARIES OF DIRECTORS, SUPERVISORSAND MEMBERS OF THE SENIORMANAGEMENTSinopec Corp. has established and iscontinuously enhancing a fair and transparentreward and supervision system for directors,supervisors and other senior management.Sinopec Corp. adopted initiative policiesapproved by the first extraordinaryshareholders’ meeting on 7th September2000 such as the Performance Evaluation andRemunerations Incentive Scheme for theSenior Management of Sinopec Corp., theShare Appreciation Rights Scheme of SinopecCorp., and the Conditions for theImplementation of the Initial Granting ofShare Appreciation Rights Scheme ofSinopec Corp.
Other Members of the Senior Management
Position with Paid (P) or Sinopec Corp.’sName Gender Age Sinopec Corp. Term of Office Unpaid (U) Shares Held
(as at 31st December)2001 2002
Wang Tianpu M 40 Vice President 2001.8 - P 0 0Zhang Honglin M 60 Secretary to the 2000.2-2003.4 P 0 0
Board of Directors

77
Dir
ecto
rs,
Sup
ervi
sors
,S
enio
r M
anag
emen
t an
d E
mp
loye
es
The directors and supervisors of SinopecCorp. received their remuneration in the formof basic salary and performance rewards,including the amount granted by SinopecCorp. to the directors and supervisorsaccording to the retirement pension plan.During the reporting period, no shareappreciation right is exercised.
During this reporting period, directors in office(excluding directors and independent non-executive directors who do not hold anyworking post with Sinopec Corp.), supervisors(excluding independent supervisors) andsenior management were paid RMB1,822,757in total as annual emoluments. The threehighest paid directors and senior managementrespectively received RMB418,372 andRMB452,192 emoluments in total.Independent Non-executive Directors Mr. ChenQingtai, Mr. Liu Guoguang and Mr. Ho TsuKwok Charles and Independent Supervisor Mr.Cui Jianmin each received RMB16,000remuneration. Directors Mr. Wang Yi and Mr.Zhang Enzhao are not paid any emolument bySinopec Corp.
During this reporting period, amongst the 16directors (excluding directors and independentnon-executive directors who do not hold anyworking post with Sinopec Corp.), supervisors(excluding independent supervisors) andsenior management who are in office, one ofthem received annual emoluments for anamount of above RMB150,000, 11 of themreceived annual emoluments betweenRMB100,000 and RMB150,000, and 4 ofthem received annual emoluments betweenRMB50,000 and RMB100,000.
5 THE COMPANY’S EMPLOYEESAs at 31st December 2002, the Company had a total of 418,871 employees, details are shown asfollows:
Breakdown according to operation departments structure:
Number of Percentage toEmployees Total Employees
Exploration and Production 144,142 34.4%Refining 82,921 19.8%Marketing and Distribution 91,169 21.8%Chemicals 96,009 22.9%R&D and Others 4,630 1.1%Total 418,871 100%
Breakdown according to functions:
Number of Percentage toEmployees Total Employees
Production 187,574 44.8%Sales 89,901 21.5%Technical 47,178 11.3%Finance 11,471 2.7%Administration 34,446 8.2 %Others 48,301 11.5%Total 418,871 100%
Breakdown according to education level:
Number of Percentage toEmployees Total Employees
Master’s degree or above 2,657 0.6%University 42,669 10.2%Tertiary education 64,757 15.5%Technical/polytechnic school 51,437 12.3%Secondary, technical/polytechnic school or below 257,351 61.4%Total 418,871 100%
6 EMPLOYEES’ RETIREMENT SCHEMEDetails of the employees’ retirement scheme of the Company are set out in note 32 on the financialstatements prepared under IFRS in this Annual Report.
As at 31st December 2002, the Company had a total of 91,912 retired employees, and all of themhave participated in basic pension schemes administered by provincial (autonomous regions andmunicipalities) governments. Government-administered pension schemes are responsible for thepayments of basic pensions.
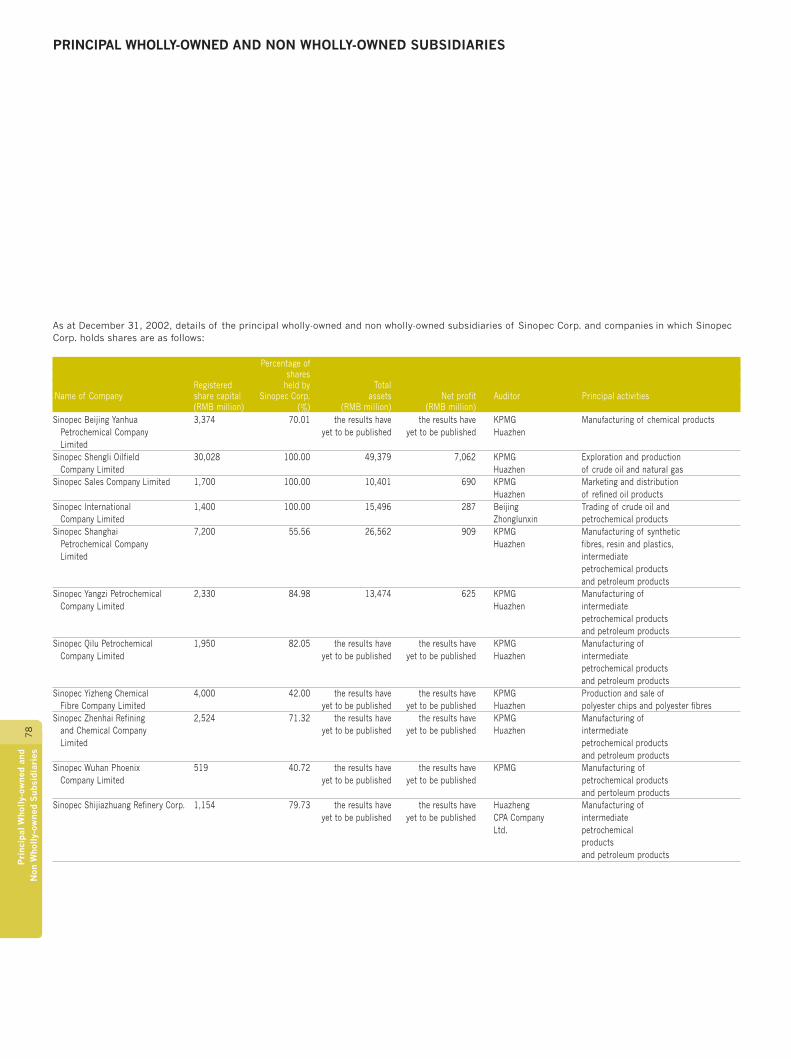
PRINCIPAL WHOLLY-OWNED AND NON WHOLLY-OWNED SUBSIDIARIES
78
Pri
ncip
al W
holl
y-ow
ned
and
Non
Who
lly-
owne
d S
ubsi
diar
ies
As at December 31, 2002, details of the principal wholly-owned and non wholly-owned subsidiaries of Sinopec Corp. and companies in which SinopecCorp. holds shares are as follows:
Percentage ofshares
Registered held by TotalName of Company share capital Sinopec Corp. assets Net profit Auditor Principal activities
(RMB million) (%) (RMB million) (RMB million)Sinopec Beijing Yanhua 3,374 70.01 the results have the results have KPMG Manufacturing of chemical products
Petrochemical Company yet to be published yet to be published HuazhenLimited
Sinopec Shengli Oilfield 30,028 100.00 49,379 7,062 KPMG Exploration and productionCompany Limited Huazhen of crude oil and natural gas
Sinopec Sales Company Limited 1,700 100.00 10,401 690 KPMG Marketing and distributionHuazhen of refined oil products
Sinopec International 1,400 100.00 15,496 287 Beijing Trading of crude oil andCompany Limited Zhonglunxin petrochemical products
Sinopec Shanghai 7,200 55.56 26,562 909 KPMG Manufacturing of syntheticPetrochemical Company Huazhen fibres, resin and plastics,Limited intermediate
petrochemical productsand petroleum products
Sinopec Yangzi Petrochemical 2,330 84.98 13,474 625 KPMG Manufacturing ofCompany Limited Huazhen intermediate
petrochemical productsand petroleum products
Sinopec Qilu Petrochemical 1,950 82.05 the results have the results have KPMG Manufacturing ofCompany Limited yet to be published yet to be published Huazhen intermediate
petrochemical productsand petroleum products
Sinopec Yizheng Chemical 4,000 42.00 the results have the results have KPMG Production and sale ofFibre Company Limited yet to be published yet to be published Huazhen polyester chips and polyester fibres
Sinopec Zhenhai Refining 2,524 71.32 the results have the results have KPMG Manufacturing ofand Chemical Company yet to be published yet to be published Huazhen intermediateLimited petrochemical products
and petroleum productsSinopec Wuhan Phoenix 519 40.72 the results have the results have KPMG Manufacturing of
Company Limited yet to be published yet to be published petrochemical productsand pertoleum products
Sinopec Shijiazhuang Refinery Corp. 1,154 79.73 the results have the results have Huazheng Manufacturing ofyet to be published yet to be published CPA Company intermediate
Ltd. petrochemicalproductsand petroleum products
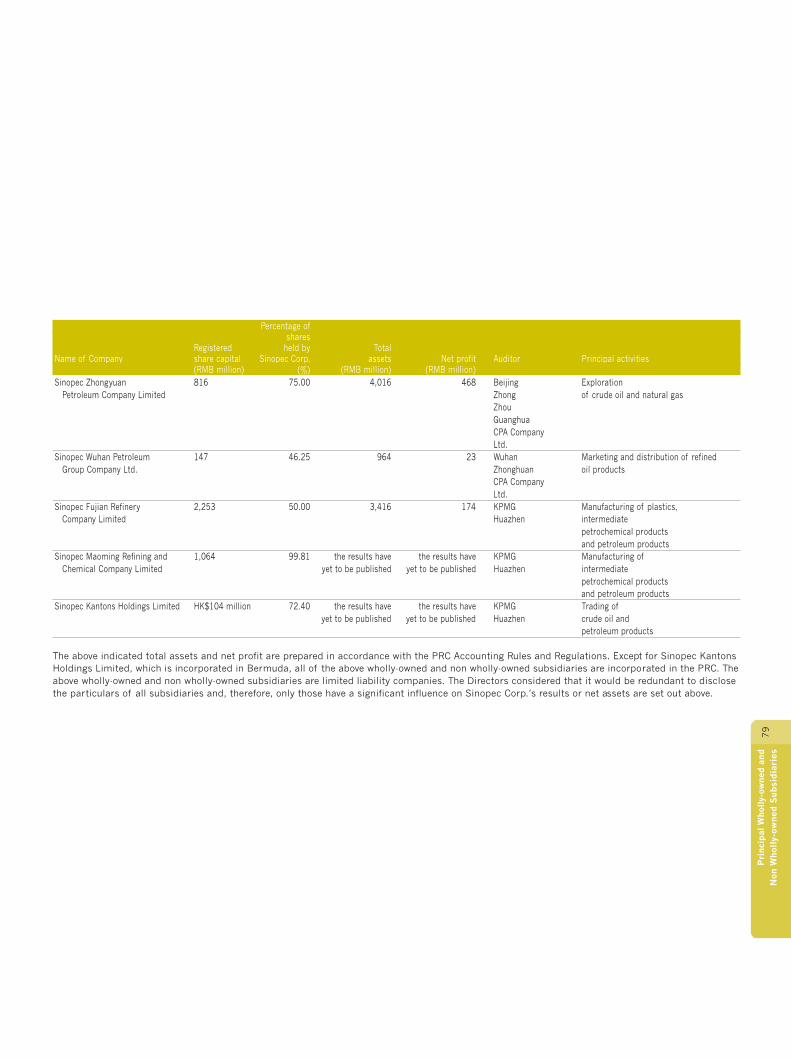
79
Pri
ncip
al W
holl
y-ow
ned
and
Non
Who
lly-
owne
d S
ubsi
dia
ries
Percentage ofshares
Registered held by TotalName of Company share capital Sinopec Corp. assets Net profit Auditor Principal activities
(RMB million) (%) (RMB million) (RMB million)Sinopec Zhongyuan 816 75.00 4,016 468 Beijing Exploration
Petroleum Company Limited Zhong of crude oil and natural gasZhouGuanghuaCPA CompanyLtd.
Sinopec Wuhan Petroleum 147 46.25 964 23 Wuhan Marketing and distribution of refinedGroup Company Ltd. Zhonghuan oil products
CPA CompanyLtd.
Sinopec Fujian Refinery 2,253 50.00 3,416 174 KPMG Manufacturing of plastics,Company Limited Huazhen intermediate
petrochemical productsand petroleum products
Sinopec Maoming Refining and 1,064 99.81 the results have the results have KPMG Manufacturing ofChemical Company Limited yet to be published yet to be published Huazhen intermediate
petrochemical productsand petroleum products
Sinopec Kantons Holdings Limited HK$104 million 72.40 the results have the results have KPMG Trading ofyet to be published yet to be published Huazhen crude oil and
petroleum products
The above indicated total assets and net profit are prepared in accordance with the PRC Accounting Rules and Regulations. Except for Sinopec KantonsHoldings Limited, which is incorporated in Bermuda, all of the above wholly-owned and non wholly-owned subsidiaries are incorporated in the PRC. Theabove wholly-owned and non wholly-owned subsidiaries are limited liability companies. The Directors considered that it would be redundant to disclosethe particulars of all subsidiaries and, therefore, only those have a significant influence on Sinopec Corp.’s results or net assets are set out above.

REPORT OF THE PRC AUDITORS
80
Fina
ncia
l A
ccou
ntin
g R
epor
t
Huazhen
To the shareholders of China Petroleum & Chemical Corporation:
We accepted the appointment and have audited the Company’s consolidated balance sheet and balance sheet at 31 December 2002, and theconsolidated income statement and profit appropriation statement, income statement and profit appropriation statement, consolidated cash flowstatement and cash flow statement for the year then ended. These financial statements are the responsibility of the Company. Our responsibility is toexpress an audit opinion on these financial statements based on our audit. We have conducted our audit in accordance with the “Independent AuditingStandards for Chinese Certified Public Accountants”. In the course of our audit, we considered the circumstances of the Company and its subsidiaries,and carried out such audit procedures, including an examination of the accounting records on a test basis, as we deemed necessary.
In our opinion, the above-mentioned financial statements comply with the relevant requirements of the “Accounting Standards for BusinessEnterprises” and the “Accounting Regulations for Business Enterprises” and present fairly, in all material respects, the Company’s consolidatedfinancial position and financial position at 31 December 2002, and the consolidated results of operations, results of operations, consolidated cashflows and cash flows for the year then ended, and the accounting policies have been consistently applied.
KPMG Huazhen Certified Public AccountantsRegistered in the People’s Republic of China
Level 16 Luo ZhengChina World Tower 2 Jin NaiwenChina World Trade CentreNo. 1, Jian Guo Men Wai Avenue 28 March 2003Beijing, The People’s Republic of ChinaPost Code: 100004
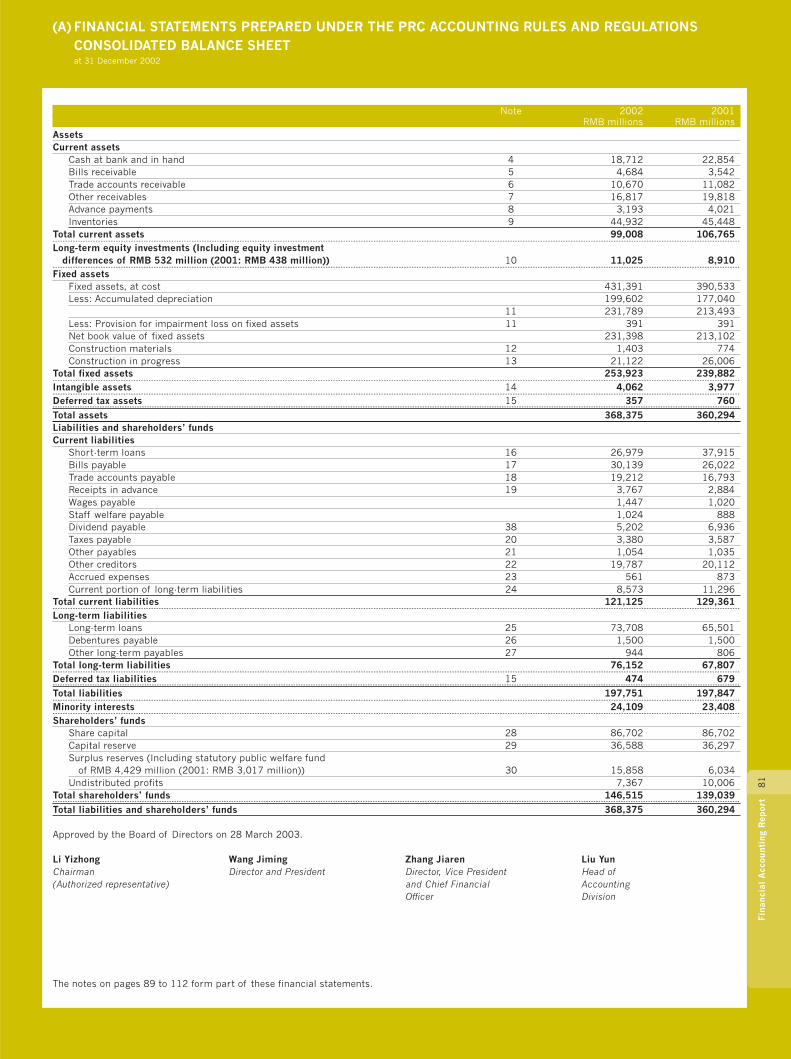
(A) FINANCIAL STATEMENTS PREPARED UNDER THE PRC ACCOUNTING RULES AND REGULATIONSCONSOLIDATED BALANCE SHEETat 31 December 2002
81
Fina
ncia
l A
ccou
ntin
g R
epor
t
Note 2002 2001RMB millions RMB millions
AssetsCurrent assets
Cash at bank and in hand 4 18,712 22,854Bills receivable 5 4,684 3,542Trade accounts receivable 6 10,670 11,082Other receivables 7 16,817 19,818Advance payments 8 3,193 4,021Inventories 9 44,932 45,448
Total current assets 99,008 106,765-- - - - - - - - - - - - - - - - - - - - - - - - - - - - - - - - - - - - - - - - - - - - - - - - - - - - - - - - - - - - - - - - - - - - - - - - - - - - - - - - - - - - - - - - - - - - - - - - - - - - - - - - - - - - - - - - - - - - - - - - - - - - - - - - - - - - - - - - - - - - - - - - - - - - - - - - - - - - - - - - - - - - - - - - - - - - - - - - - - - - - - - - - - - - - - - - - - - - - - - - - - - - - - - - - - - - - - - - - - - - - - - - - - - - - - - - - - - - - - - - - - - - - - - - - - - - - - - - - - - - - - - - - - - - - - -
Long-term equity investments (Including equity investmentdifferences of RMB 532 million (2001: RMB 438 million)) 10 11,025 8,910
-- - - - - - - - - - - - - - - - - - - - - - - - - - - - - - - - - - - - - - - - - - - - - - - - - - - - - - - - - - - - - - - - - - - - - - - - - - - - - - - - - - - - - - - - - - - - - - - - - - - - - - - - - - - - - - - - - - - - - - - - - - - - - - - - - - - - - - - - - - - - - - - - - - - - - - - - - - - - - - - - - - - - - - - - - - - - - - - - - - - - - - - - - - - - - - - - - - - - - - - - - - - - - - - - - - - - - - - - - - - - - - - - - - - - - - - - - - - - - - - - - - - - - - - - - - - - - - - - - - - - - - - - - - - - - - -
Fixed assetsFixed assets, at cost 431,391 390,533Less: Accumulated depreciation 199,602 177,040
11 231,789 213,493Less: Provision for impairment loss on fixed assets 11 391 391Net book value of fixed assets 231,398 213,102Construction materials 12 1,403 774Construction in progress 13 21,122 26,006
Total fixed assets 253,923 239,882-- - - - - - - - - - - - - - - - - - - - - - - - - - - - - - - - - - - - - - - - - - - - - - - - - - - - - - - - - - - - - - - - - - - - - - - - - - - - - - - - - - - - - - - - - - - - - - - - - - - - - - - - - - - - - - - - - - - - - - - - - - - - - - - - - - - - - - - - - - - - - - - - - - - - - - - - - - - - - - - - - - - - - - - - - - - - - - - - - - - - - - - - - - - - - - - - - - - - - - - - - - - - - - - - - - - - - - - - - - - - - - - - - - - - - - - - - - - - - - - - - - - - - - - - - - - - - - - - - - - - - - - - - - - - - - -
Intangible assets 14 4,062 3,977-- - - - - - - - - - - - - - - - - - - - - - - - - - - - - - - - - - - - - - - - - - - - - - - - - - - - - - - - - - - - - - - - - - - - - - - - - - - - - - - - - - - - - - - - - - - - - - - - - - - - - - - - - - - - - - - - - - - - - - - - - - - - - - - - - - - - - - - - - - - - - - - - - - - - - - - - - - - - - - - - - - - - - - - - - - - - - - - - - - - - - - - - - - - - - - - - - - - - - - - - - - - - - - - - - - - - - - - - - - - - - - - - - - - - - - - - - - - - - - - - - - - - - - - - - - - - - - - - - - - - - - - - - - - - - - -
Deferred tax assets 15 357 760--- - - - - - - - - - - - - - - - - - - - - - - - - - - - - - - - - - - - - - - - - - - - - - - - - - - - - - - - - - - - - - - - - - - - - - - - - - - - - - - - - - - - - - - - - - - - - - - - - - - - - - - - - - - - - - - - - - - - - - - - - - - - - - - - - - - - - - - - - - - - - - - - - - - - - - - - - - - - - - - - - - - - - - - - - - - - - - - - - - - - - - - - - - - - - - - - - - - - - - - - - - - - - - - - - - - - - - - - - - - - - - - - - - - - - - - - - - - - - - - - - - - - - - - - - - - - - - - - - - - - - - - - - - - - - - - - - - -
Total assets 368,375 360,294Liabilities and shareholders’ fundsCurrent liabilities
Short-term loans 16 26,979 37,915Bills payable 17 30,139 26,022Trade accounts payable 18 19,212 16,793Receipts in advance 19 3,767 2,884Wages payable 1,447 1,020Staff welfare payable 1,024 888Dividend payable 38 5,202 6,936Taxes payable 20 3,380 3,587Other payables 21 1,054 1,035Other creditors 22 19,787 20,112Accrued expenses 23 561 873Current portion of long-term liabilities 24 8,573 11,296
Total current liabilities 121,125 129,361-- - - - - - - - - - - - - - - - - - - - - - - - - - - - - - - - - - - - - - - - - - - - - - - - - - - - - - - - - - - - - - - - - - - - - - - - - - - - - - - - - - - - - - - - - - - - - - - - - - - - - - - - - - - - - - - - - - - - - - - - - - - - - - - - - - - - - - - - - - - - - - - - - - - - - - - - - - - - - - - - - - - - - - - - - - - - - - - - - - - - - - - - - - - - - - - - - - - - - - - - - - - - - - - - - - - - - - - - - - - - - - - - - - - - - - - - - - - - - - - - - - - - - - - - - - - - - - - - - - - - - - - - - - - - - - -
Long-term liabilitiesLong-term loans 25 73,708 65,501Debentures payable 26 1,500 1,500Other long-term payables 27 944 806
Total long-term liabilities 76,152 67,807-- - - - - - - - - - - - - - - - - - - - - - - - - - - - - - - - - - - - - - - - - - - - - - - - - - - - - - - - - - - - - - - - - - - - - - - - - - - - - - - - - - - - - - - - - - - - - - - - - - - - - - - - - - - - - - - - - - - - - - - - - - - - - - - - - - - - - - - - - - - - - - - - - - - - - - - - - - - - - - - - - - - - - - - - - - - - - - - - - - - - - - - - - - - - - - - - - - - - - - - - - - - - - - - - - - - - - - - - - - - - - - - - - - - - - - - - - - - - - - - - - - - - - - - - - - - - - - - - - - - - - - - - - - - - - - -
Deferred tax liabilities 15 474 679--- - - - - - - - - - - - - - - - - - - - - - - - - - - - - - - - - - - - - - - - - - - - - - - - - - - - - - - - - - - - - - - - - - - - - - - - - - - - - - - - - - - - - - - - - - - - - - - - - - - - - - - - - - - - - - - - - - - - - - - - - - - - - - - - - - - - - - - - - - - - - - - - - - - - - - - - - - - - - - - - - - - - - - - - - - - - - - - - - - - - - - - - - - - - - - - - - - - - - - - - - - - - - - - - - - - - - - - - - - - - - - - - - - - - - - - - - - - - - - - - - - - - - - - - - - - - - - - - - - - - - - - - - - - - - - - - - - -
Total liabilities 197,751 197,847-- - - - - - - - - - - - - - - - - - - - - - - - - - - - - - - - - - - - - - - - - - - - - - - - - - - - - - - - - - - - - - - - - - - - - - - - - - - - - - - - - - - - - - - - - - - - - - - - - - - - - - - - - - - - - - - - - - - - - - - - - - - - - - - - - - - - - - - - - - - - - - - - - - - - - - - - - - - - - - - - - - - - - - - - - - - - - - - - - - - - - - - - - - - - - - - - - - - - - - - - - - - - - - - - - - - - - - - - - - - - - - - - - - - - - - - - - - - - - - - - - - - - - - - - - - - - - - - - - - - - - - - - - - - - - - -
Minority interests 24,109 23,408-- - - - - - - - - - - - - - - - - - - - - - - - - - - - - - - - - - - - - - - - - - - - - - - - - - - - - - - - - - - - - - - - - - - - - - - - - - - - - - - - - - - - - - - - - - - - - - - - - - - - - - - - - - - - - - - - - - - - - - - - - - - - - - - - - - - - - - - - - - - - - - - - - - - - - - - - - - - - - - - - - - - - - - - - - - - - - - - - - - - - - - - - - - - - - - - - - - - - - - - - - - - - - - - - - - - - - - - - - - - - - - - - - - - - - - - - - - - - - - - - - - - - - - - - - - - - - - - - - - - - - - - - - - - - - - -
Shareholders’ fundsShare capital 28 86,702 86,702Capital reserve 29 36,588 36,297Surplus reserves (Including statutory public welfare fund
of RMB 4,429 million (2001: RMB 3,017 million)) 30 15,858 6,034Undistributed profits 7,367 10,006
Total shareholders’ funds 146,515 139,039--- - - - - - - - - - - - - - - - - - - - - - - - - - - - - - - - - - - - - - - - - - - - - - - - - - - - - - - - - - - - - - - - - - - - - - - - - - - - - - - - - - - - - - - - - - - - - - - - - - - - - - - - - - - - - - - - - - - - - - - - - - - - - - - - - - - - - - - - - - - - - - - - - - - - - - - - - - - - - - - - - - - - - - - - - - - - - - - - - - - - - - - - - - - - - - - - - - - - - - - - - - - - - - - - - - - - - - - - - - - - - - - - - - - - - - - - - - - - - - - - - - - - - - - - - - - - - - - - - - - - - - - - - - - - - - - - - - -
Total liabilities and shareholders’ funds 368,375 360,294
Approved by the Board of Directors on 28 March 2003.
Li Yizhong Wang Jiming Zhang Jiaren Liu YunChairman Director and President Director, Vice President Head of(Authorized representative) and Chief Financial Accounting
Officer Division
The notes on pages 89 to 112 form part of these financial statements.
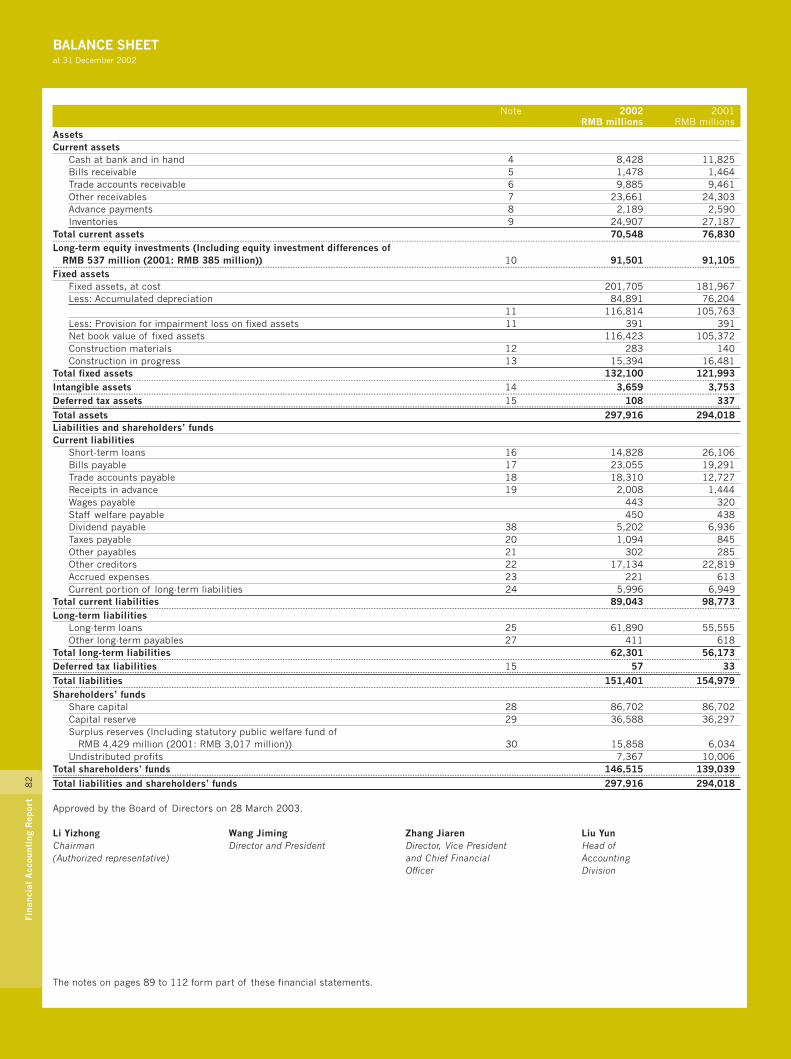
82
Fina
ncia
l A
ccou
ntin
g R
epor
t
BALANCE SHEETat 31 December 2002
Note 2002 2001RMB millions RMB millions
AssetsCurrent assets
Cash at bank and in hand 4 8,428 11,825Bills receivable 5 1,478 1,464Trade accounts receivable 6 9,885 9,461Other receivables 7 23,661 24,303Advance payments 8 2,189 2,590Inventories 9 24,907 27,187
Total current assets 70,548 76,830-- - - - - - - - - - - - - - - - - - - - - - - - - - - - - - - - - - - - - - - - - - - - - - - - - - - - - - - - - - - - - - - - - - - - - - - - - - - - - - - - - - - - - - - - - - - - - - - - - - - - - - - - - - - - - - - - - - - - - - - - - - - - - - - - - - - - - - - - - - - - - - - - - - - - - - - - - - - - - - - - - - - - - - - - - - - - - - - - - - - - - - - - - - - - - - - - - - - - - - - - - - - - - - - - - - - - - - - - - - - - - - - - - - - - - - - - - - - - - - - - - - - - - - - - - - - - - - - - - - - - - - - - - - - - - - -
Long-term equity investments (Including equity investment differences ofRMB 537 million (2001: RMB 385 million)) 10 91,501 91,105
-- - - - - - - - - - - - - - - - - - - - - - - - - - - - - - - - - - - - - - - - - - - - - - - - - - - - - - - - - - - - - - - - - - - - - - - - - - - - - - - - - - - - - - - - - - - - - - - - - - - - - - - - - - - - - - - - - - - - - - - - - - - - - - - - - - - - - - - - - - - - - - - - - - - - - - - - - - - - - - - - - - - - - - - - - - - - - - - - - - - - - - - - - - - - - - - - - - - - - - - - - - - - - - - - - - - - - - - - - - - - - - - - - - - - - - - - - - - - - - - - - - - - - - - - - - - - - - - - - - - - - - - - - - - - - - -
Fixed assetsFixed assets, at cost 201,705 181,967Less: Accumulated depreciation 84,891 76,204
11 116,814 105,763Less: Provision for impairment loss on fixed assets 11 391 391Net book value of fixed assets 116,423 105,372Construction materials 12 283 140Construction in progress 13 15,394 16,481
Total fixed assets 132,100 121,993-- - - - - - - - - - - - - - - - - - - - - - - - - - - - - - - - - - - - - - - - - - - - - - - - - - - - - - - - - - - - - - - - - - - - - - - - - - - - - - - - - - - - - - - - - - - - - - - - - - - - - - - - - - - - - - - - - - - - - - - - - - - - - - - - - - - - - - - - - - - - - - - - - - - - - - - - - - - - - - - - - - - - - - - - - - - - - - - - - - - - - - - - - - - - - - - - - - - - - - - - - - - - - - - - - - - - - - - - - - - - - - - - - - - - - - - - - - - - - - - - - - - - - - - - - - - - - - - - - - - - - - - - - - - - - - -
Intangible assets 14 3,659 3,753-- - - - - - - - - - - - - - - - - - - - - - - - - - - - - - - - - - - - - - - - - - - - - - - - - - - - - - - - - - - - - - - - - - - - - - - - - - - - - - - - - - - - - - - - - - - - - - - - - - - - - - - - - - - - - - - - - - - - - - - - - - - - - - - - - - - - - - - - - - - - - - - - - - - - - - - - - - - - - - - - - - - - - - - - - - - - - - - - - - - - - - - - - - - - - - - - - - - - - - - - - - - - - - - - - - - - - - - - - - - - - - - - - - - - - - - - - - - - - - - - - - - - - - - - - - - - - - - - - - - - - - - - - - - - - - -
Deferred tax assets 15 108 337--- - - - - - - - - - - - - - - - - - - - - - - - - - - - - - - - - - - - - - - - - - - - - - - - - - - - - - - - - - - - - - - - - - - - - - - - - - - - - - - - - - - - - - - - - - - - - - - - - - - - - - - - - - - - - - - - - - - - - - - - - - - - - - - - - - - - - - - - - - - - - - - - - - - - - - - - - - - - - - - - - - - - - - - - - - - - - - - - - - - - - - - - - - - - - - - - - - - - - - - - - - - - - - - - - - - - - - - - - - - - - - - - - - - - - - - - - - - - - - - - - - - - - - - - - - - - - - - - - - - - - - - - - - - - - - - - - - -
Total assets 297,916 294,018Liabilities and shareholders’ fundsCurrent liabilities
Short-term loans 16 14,828 26,106Bills payable 17 23,055 19,291Trade accounts payable 18 18,310 12,727Receipts in advance 19 2,008 1,444Wages payable 443 320Staff welfare payable 450 438Dividend payable 38 5,202 6,936Taxes payable 20 1,094 845Other payables 21 302 285Other creditors 22 17,134 22,819Accrued expenses 23 221 613Current portion of long-term liabilities 24 5,996 6,949
Total current liabilities 89,043 98,773-- - - - - - - - - - - - - - - - - - - - - - - - - - - - - - - - - - - - - - - - - - - - - - - - - - - - - - - - - - - - - - - - - - - - - - - - - - - - - - - - - - - - - - - - - - - - - - - - - - - - - - - - - - - - - - - - - - - - - - - - - - - - - - - - - - - - - - - - - - - - - - - - - - - - - - - - - - - - - - - - - - - - - - - - - - - - - - - - - - - - - - - - - - - - - - - - - - - - - - - - - - - - - - - - - - - - - - - - - - - - - - - - - - - - - - - - - - - - - - - - - - - - - - - - - - - - - - - - - - - - - - - - - - - - - - -
Long-term liabilitiesLong-term loans 25 61,890 55,555Other long-term payables 27 411 618
Total long-term liabilities 62,301 56,173-- - - - - - - - - - - - - - - - - - - - - - - - - - - - - - - - - - - - - - - - - - - - - - - - - - - - - - - - - - - - - - - - - - - - - - - - - - - - - - - - - - - - - - - - - - - - - - - - - - - - - - - - - - - - - - - - - - - - - - - - - - - - - - - - - - - - - - - - - - - - - - - - - - - - - - - - - - - - - - - - - - - - - - - - - - - - - - - - - - - - - - - - - - - - - - - - - - - - - - - - - - - - - - - - - - - - - - - - - - - - - - - - - - - - - - - - - - - - - - - - - - - - - - - - - - - - - - - - - - - - - - - - - - - - - - -
Deferred tax liabilities 15 57 33--- - - - - - - - - - - - - - - - - - - - - - - - - - - - - - - - - - - - - - - - - - - - - - - - - - - - - - - - - - - - - - - - - - - - - - - - - - - - - - - - - - - - - - - - - - - - - - - - - - - - - - - - - - - - - - - - - - - - - - - - - - - - - - - - - - - - - - - - - - - - - - - - - - - - - - - - - - - - - - - - - - - - - - - - - - - - - - - - - - - - - - - - - - - - - - - - - - - - - - - - - - - - - - - - - - - - - - - - - - - - - - - - - - - - - - - - - - - - - - - - - - - - - - - - - - - - - - - - - - - - - - - - - - - - - - - - - - -
Total liabilities 151,401 154,979-- - - - - - - - - - - - - - - - - - - - - - - - - - - - - - - - - - - - - - - - - - - - - - - - - - - - - - - - - - - - - - - - - - - - - - - - - - - - - - - - - - - - - - - - - - - - - - - - - - - - - - - - - - - - - - - - - - - - - - - - - - - - - - - - - - - - - - - - - - - - - - - - - - - - - - - - - - - - - - - - - - - - - - - - - - - - - - - - - - - - - - - - - - - - - - - - - - - - - - - - - - - - - - - - - - - - - - - - - - - - - - - - - - - - - - - - - - - - - - - - - - - - - - - - - - - - - - - - - - - - - - - - - - - - - - -
Shareholders’ fundsShare capital 28 86,702 86,702Capital reserve 29 36,588 36,297Surplus reserves (Including statutory public welfare fund of
RMB 4,429 million (2001: RMB 3,017 million)) 30 15,858 6,034Undistributed profits 7,367 10,006
Total shareholders’ funds 146,515 139,039--- - - - - - - - - - - - - - - - - - - - - - - - - - - - - - - - - - - - - - - - - - - - - - - - - - - - - - - - - - - - - - - - - - - - - - - - - - - - - - - - - - - - - - - - - - - - - - - - - - - - - - - - - - - - - - - - - - - - - - - - - - - - - - - - - - - - - - - - - - - - - - - - - - - - - - - - - - - - - - - - - - - - - - - - - - - - - - - - - - - - - - - - - - - - - - - - - - - - - - - - - - - - - - - - - - - - - - - - - - - - - - - - - - - - - - - - - - - - - - - - - - - - - - - - - - - - - - - - - - - - - - - - - - - - - - - - - - -
Total liabilities and shareholders’ funds 297,916 294,018
Approved by the Board of Directors on 28 March 2003.
Li Yizhong Wang Jiming Zhang Jiaren Liu YunChairman Director and President Director, Vice President Head of(Authorized representative) and Chief Financial Accounting
Officer Division
The notes on pages 89 to 112 form part of these financial statements.
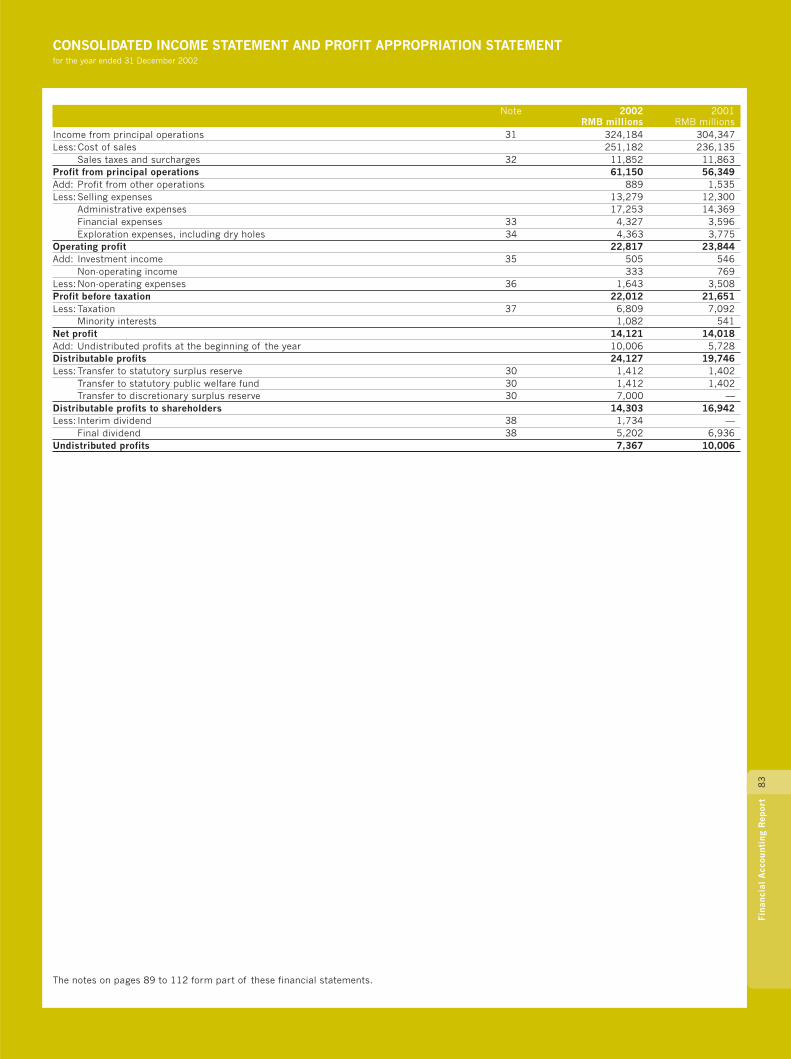
83
Fina
ncia
l A
ccou
ntin
g R
epor
t
CONSOLIDATED INCOME STATEMENT AND PROFIT APPROPRIATION STATEMENTfor the year ended 31 December 2002
Note 2002 2001RMB millions RMB millions
Income from principal operations 31 324,184 304,347Less:Cost of sales 251,182 236,135
Sales taxes and surcharges 32 11,852 11,863Profit from principal operations 61,150 56,349Add: Profit from other operations 889 1,535Less:Selling expenses 13,279 12,300
Administrative expenses 17,253 14,369Financial expenses 33 4,327 3,596Exploration expenses, including dry holes 34 4,363 3,775
Operating profit 22,817 23,844Add: Investment income 35 505 546
Non-operating income 333 769Less:Non-operating expenses 36 1,643 3,508Profit before taxation 22,012 21,651Less:Taxation 37 6,809 7,092
Minority interests 1,082 541Net profit 14,121 14,018Add: Undistributed profits at the beginning of the year 10,006 5,728Distributable profits 24,127 19,746Less:Transfer to statutory surplus reserve 30 1,412 1,402
Transfer to statutory public welfare fund 30 1,412 1,402Transfer to discretionary surplus reserve 30 7,000 —
Distributable profits to shareholders 14,303 16,942Less: Interim dividend 38 1,734 —
Final dividend 38 5,202 6,936Undistributed profits 7,367 10,006
The notes on pages 89 to 112 form part of these financial statements.
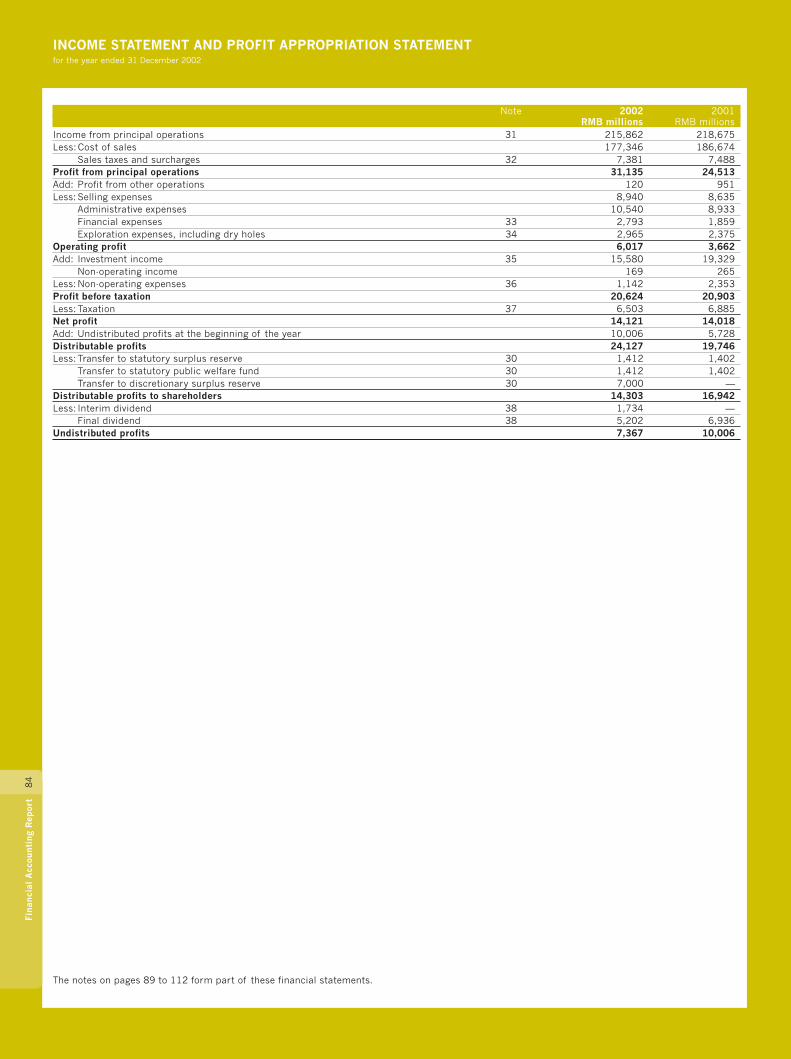
84
Fina
ncia
l A
ccou
ntin
g R
epor
t
INCOME STATEMENT AND PROFIT APPROPRIATION STATEMENTfor the year ended 31 December 2002
Note 2002 2001RMB millions RMB millions
Income from principal operations 31 215,862 218,675Less:Cost of sales 177,346 186,674
Sales taxes and surcharges 32 7,381 7,488Profit from principal operations 31,135 24,513Add: Profit from other operations 120 951Less:Selling expenses 8,940 8,635
Administrative expenses 10,540 8,933Financial expenses 33 2,793 1,859Exploration expenses, including dry holes 34 2,965 2,375
Operating profit 6,017 3,662Add: Investment income 35 15,580 19,329
Non-operating income 169 265Less:Non-operating expenses 36 1,142 2,353Profit before taxation 20,624 20,903Less:Taxation 37 6,503 6,885Net profit 14,121 14,018Add: Undistributed profits at the beginning of the year 10,006 5,728Distributable profits 24,127 19,746Less:Transfer to statutory surplus reserve 30 1,412 1,402
Transfer to statutory public welfare fund 30 1,412 1,402Transfer to discretionary surplus reserve 30 7,000 —
Distributable profits to shareholders 14,303 16,942Less: Interim dividend 38 1,734 —
Final dividend 38 5,202 6,936Undistributed profits 7,367 10,006
The notes on pages 89 to 112 form part of these financial statements.
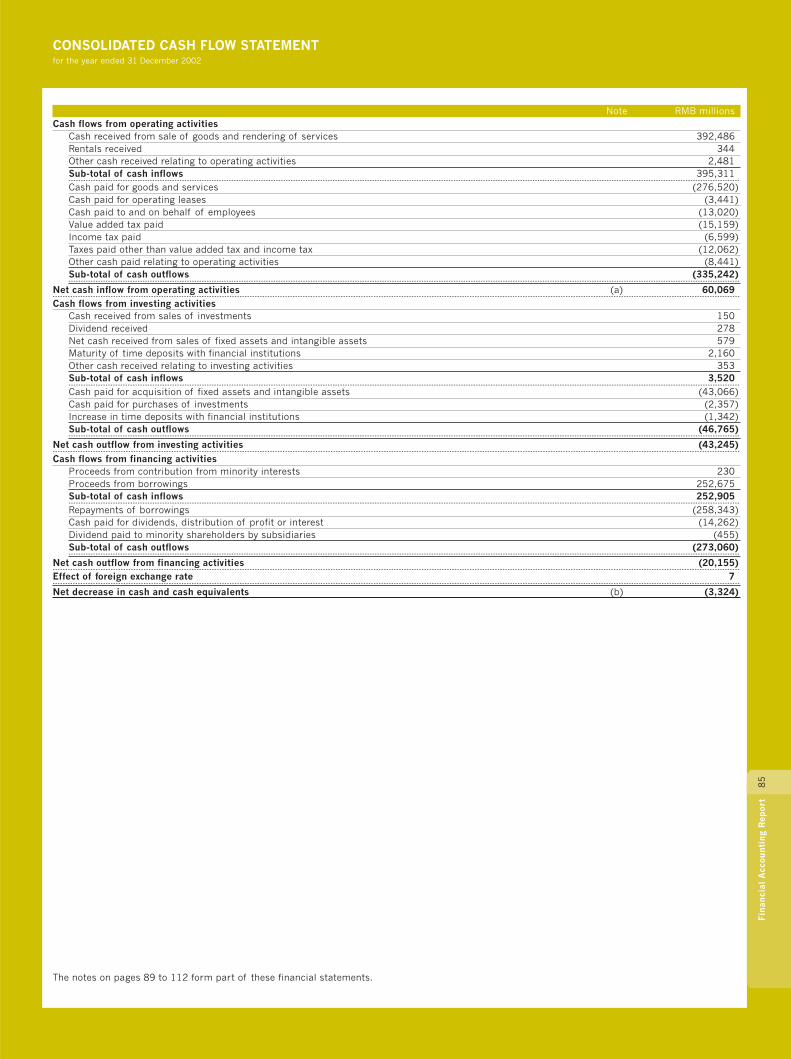
85
Fina
ncia
l A
ccou
ntin
g R
epor
t
CONSOLIDATED CASH FLOW STATEMENTfor the year ended 31 December 2002
Note RMB millionsCash flows from operating activities
Cash received from sale of goods and rendering of services 392,486Rentals received 344Other cash received relating to operating activities 2,481Sub-total of cash inflows 395,311- - - - - - - - - - - - - - - - - - - - - - - - - - - - - - - - - - - - - - - - - - - - - - - - - - - - - - - - - - - - - - - - - - - - - - - - - - - - - - - - - - - - - - - - - - - - - - - - - - - - - - - - - - - - - - - - - - - - - - - - - - - - - - - - - - - - - - - - - - - - - - - - - - - - - - - - - - - - - - - - - - - - - - - - - - - - - - - - - - - - - - - - - - - - - - - - - - - - - - - - - - - - - - - - - - - - - - - - - - - - - - - - - - - - - - - - - - - - - - - - - - - - - - - - - - - - - - - - - - - - - - - - - - - - - - - -
Cash paid for goods and services (276,520)Cash paid for operating leases (3,441)Cash paid to and on behalf of employees (13,020)Value added tax paid (15,159)Income tax paid (6,599)Taxes paid other than value added tax and income tax (12,062)Other cash paid relating to operating activities (8,441)Sub-total of cash outflows (335,242)-- - - - - - - - - - - - - - - - - - - - - - - - - - - - - - - - - - - - - - - - - - - - - - - - - - - - - - - - - - - - - - - - - - - - - - - - - - - - - - - - - - - - - - - - - - - - - - - - - - - - - - - - - - - - - - - - - - - - - - - - - - - - - - - - - - - - - - - - - - - - - - - - - - - - - - - - - - - - - - - - - - - - - - - - - - - - - - - - - - - - - - - - - - - - - - - - - - - - - - - - - - - - - - - - - - - - - - - - - - - - - - - - - - - - - - - - - - - - - - - - - - - - - - - - - - - - - - - - - - - - - - - - - - - - - - -
Net cash inflow from operating activities (a) 60,069-- - - - - - - - - - - - - - - - - - - - - - - - - - - - - - - - - - - - - - - - - - - - - - - - - - - - - - - - - - - - - - - - - - - - - - - - - - - - - - - - - - - - - - - - - - - - - - - - - - - - - - - - - - - - - - - - - - - - - - - - - - - - - - - - - - - - - - - - - - - - - - - - - - - - - - - - - - - - - - - - - - - - - - - - - - - - - - - - - - - - - - - - - - - - - - - - - - - - - - - - - - - - - - - - - - - - - - - - - - - - - - - - - - - - - - - - - - - - - - - - - - - - - - - - - - - - - - - - - - - - - - - - - - - - - - -
Cash flows from investing activitiesCash received from sales of investments 150Dividend received 278Net cash received from sales of fixed assets and intangible assets 579Maturity of time deposits with financial institutions 2,160Other cash received relating to investing activities 353Sub-total of cash inflows 3,520--- - - - - - - - - - - - - - - - - - - - - - - - - - - - - - - - - - - - - - - - - - - - - - - - - - - - - - - - - - - - - - - - - - - - - - - - - - - - - - - - - - - - - - - - - - - - - - - - - - - - - - - - - - - - - - - - - - - - - - - - - - - - - - - - - - - - - - - - - - - - - - - - - - - - - - - - - - - - - - - - - - - - - - - - - - - - - - - - - - - - - - - - - - - - - - - - - - - - - - - - - - - - - - - - - - - - - - - - - - - - - - - - - - - - - - - - - - - - - - - - - - - - - - - - - - - - - - - - - - - - - - - - - - - - - -
Cash paid for acquisition of fixed assets and intangible assets (43,066)Cash paid for purchases of investments (2,357)Increase in time deposits with financial institutions (1,342)Sub-total of cash outflows (46,765)-- - - - - - - - - - - - - - - - - - - - - - - - - - - - - - - - - - - - - - - - - - - - - - - - - - - - - - - - - - - - - - - - - - - - - - - - - - - - - - - - - - - - - - - - - - - - - - - - - - - - - - - - - - - - - - - - - - - - - - - - - - - - - - - - - - - - - - - - - - - - - - - - - - - - - - - - - - - - - - - - - - - - - - - - - - - - - - - - - - - - - - - - - - - - - - - - - - - - - - - - - - - - - - - - - - - - - - - - - - - - - - - - - - - - - - - - - - - - - - - - - - - - - - - - - - - - - - - - - - - - - - - - - - - - - - -
Net cash outflow from investing activities (43,245)-- - - - - - - - - - - - - - - - - - - - - - - - - - - - - - - - - - - - - - - - - - - - - - - - - - - - - - - - - - - - - - - - - - - - - - - - - - - - - - - - - - - - - - - - - - - - - - - - - - - - - - - - - - - - - - - - - - - - - - - - - - - - - - - - - - - - - - - - - - - - - - - - - - - - - - - - - - - - - - - - - - - - - - - - - - - - - - - - - - - - - - - - - - - - - - - - - - - - - - - - - - - - - - - - - - - - - - - - - - - - - - - - - - - - - - - - - - - - - - - - - - - - - - - - - - - - - - - - - - - - - - - - - - - - - - -
Cash flows from financing activitiesProceeds from contribution from minority interests 230Proceeds from borrowings 252,675Sub-total of cash inflows 252,905--- - - - - - - - - - - - - - - - - - - - - - - - - - - - - - - - - - - - - - - - - - - - - - - - - - - - - - - - - - - - - - - - - - - - - - - - - - - - - - - - - - - - - - - - - - - - - - - - - - - - - - - - - - - - - - - - - - - - - - - - - - - - - - - - - - - - - - - - - - - - - - - - - - - - - - - - - - - - - - - - - - - - - - - - - - - - - - - - - - - - - - - - - - - - - - - - - - - - - - - - - - - - - - - - - - - - - - - - - - - - - - - - - - - - - - - - - - - - - - - - - - - - - - - - - - - - - - - - - - - - - - - - - - - - - -
Repayments of borrowings (258,343)Cash paid for dividends, distribution of profit or interest (14,262)Dividend paid to minority shareholders by subsidiaries (455)Sub-total of cash outflows (273,060)-- - - - - - - - - - - - - - - - - - - - - - - - - - - - - - - - - - - - - - - - - - - - - - - - - - - - - - - - - - - - - - - - - - - - - - - - - - - - - - - - - - - - - - - - - - - - - - - - - - - - - - - - - - - - - - - - - - - - - - - - - - - - - - - - - - - - - - - - - - - - - - - - - - - - - - - - - - - - - - - - - - - - - - - - - - - - - - - - - - - - - - - - - - - - - - - - - - - - - - - - - - - - - - - - - - - - - - - - - - - - - - - - - - - - - - - - - - - - - - - - - - - - - - - - - - - - - - - - - - - - - - - - - - - - - - -
Net cash outflow from financing activities (20,155)-- - - - - - - - - - - - - - - - - - - - - - - - - - - - - - - - - - - - - - - - - - - - - - - - - - - - - - - - - - - - - - - - - - - - - - - - - - - - - - - - - - - - - - - - - - - - - - - - - - - - - - - - - - - - - - - - - - - - - - - - - - - - - - - - - - - - - - - - - - - - - - - - - - - - - - - - - - - - - - - - - - - - - - - - - - - - - - - - - - - - - - - - - - - - - - - - - - - - - - - - - - - - - - - - - - - - - - - - - - - - - - - - - - - - - - - - - - - - - - - - - - - - - - - - - - - - - - - - - - - - - - - - - - - - - - -
Effect of foreign exchange rate 7-- - - - - - - - - - - - - - - - - - - - - - - - - - - - - - - - - - - - - - - - - - - - - - - - - - - - - - - - - - - - - - - - - - - - - - - - - - - - - - - - - - - - - - - - - - - - - - - - - - - - - - - - - - - - - - - - - - - - - - - - - - - - - - - - - - - - - - - - - - - - - - - - - - - - - - - - - - - - - - - - - - - - - - - - - - - - - - - - - - - - - - - - - - - - - - - - - - - - - - - - - - - - - - - - - - - - - - - - - - - - - - - - - - - - - - - - - - - - - - - - - - - - - - - - - - - - - - - - - - - - - - - - - - - - - - -
Net decrease in cash and cash equivalents (b) (3,324)
The notes on pages 89 to 112 form part of these financial statements.

86
Fina
ncia
l A
ccou
ntin
g R
epor
t
NOTES TO THE CONSOLIDATED CASH FLOW STATEMENTfor the year ended 31 December 2002
RMB millions(a) Reconciliation of net profit to cash flows from operating activities
Net profit 14,121Add: Depreciation of fixed assets 26,327
Amortisation of intangible assets 286Net loss on disposal of fixed assets and intangible assets 663Financial expenses 4,306Dry hole costs 1,771Investment income (315)Deferred tax credits 198Decrease in inventories 482Decrease in operating receivables 2,530Increase in operating payables 8,618Minority interests 1,082
Net cash inflow from operating activities 60,069
RMB millions(b) Net decrease in cash and cash equivalents
Cash and cash equivalents at the end of the year 17,699Less: Cash and cash equivalents at the beginning of the year 21,023Net decrease in cash and cash equivalents (3,324)
The notes on pages 89 to 112 form part of these financial statements.
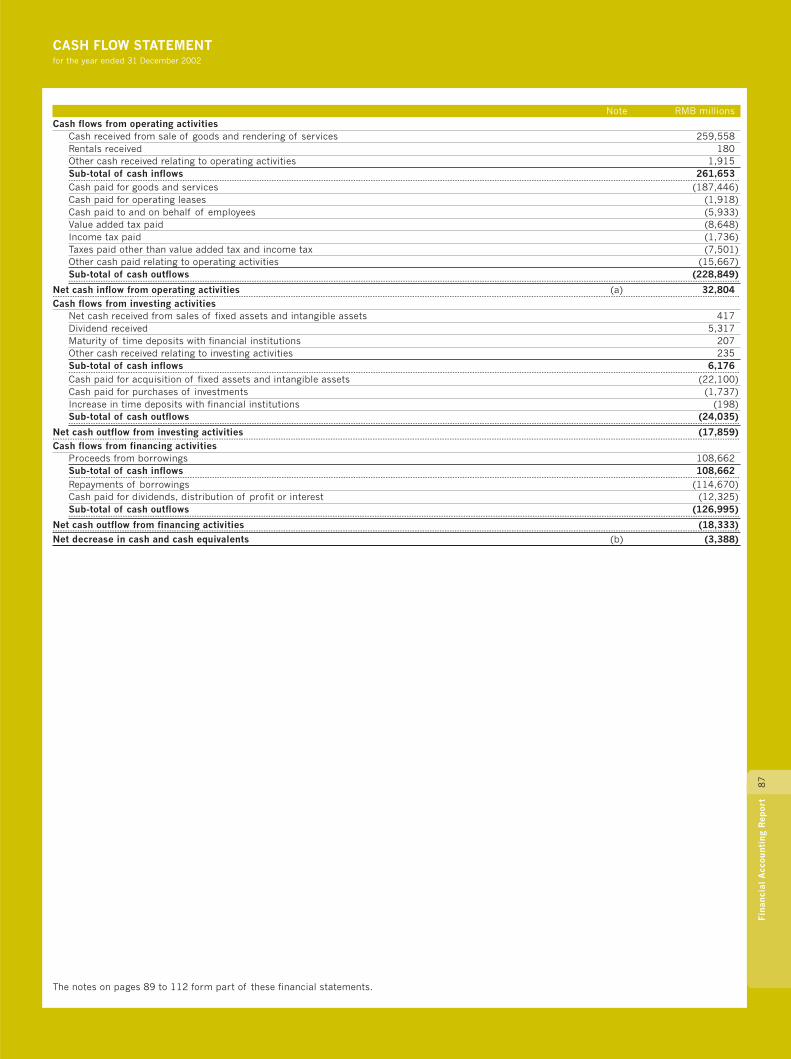
CASH FLOW STATEMENTfor the year ended 31 December 2002
87
Fina
ncia
l A
ccou
ntin
g R
epor
t
Note RMB millionsCash flows from operating activities
Cash received from sale of goods and rendering of services 259,558Rentals received 180Other cash received relating to operating activities 1,915Sub-total of cash inflows 261,653--- - - - - - - - - - - - - - - - - - - - - - - - - - - - - - - - - - - - - - - - - - - - - - - - - - - - - - - - - - - - - - - - - - - - - - - - - - - - - - - - - - - - - - - - - - - - - - - - - - - - - - - - - - - - - - - - - - - - - - - - - - - - - - - - - - - - - - - - - - - - - - - - - - - - - - - - - - - - - - - - - - - - - - - - - - - - - - - - - - - - - - - - - - - - - - - - - - - - - - - - - - - - - - - - - - - - - - - - - - - - - - - - - - - - - - - - - - - - - - - - - - - - - - - - - - - - - - - - - - - - - - - - - - - - -
Cash paid for goods and services (187,446)Cash paid for operating leases (1,918)Cash paid to and on behalf of employees (5,933)Value added tax paid (8,648)Income tax paid (1,736)Taxes paid other than value added tax and income tax (7,501)Other cash paid relating to operating activities (15,667)Sub-total of cash outflows (228,849)-- - - - - - - - - - - - - - - - - - - - - - - - - - - - - - - - - - - - - - - - - - - - - - - - - - - - - - - - - - - - - - - - - - - - - - - - - - - - - - - - - - - - - - - - - - - - - - - - - - - - - - - - - - - - - - - - - - - - - - - - - - - - - - - - - - - - - - - - - - - - - - - - - - - - - - - - - - - - - - - - - - - - - - - - - - - - - - - - - - - - - - - - - - - - - - - - - - - - - - - - - - - - - - - - - - - - - - - - - - - - - - - - - - - - - - - - - - - - - - - - - - - - - - - - - - - - - - - - - - - - - - - - - - - - - -
Net cash inflow from operating activities (a) 32,804--- - - - - - - - - - - - - - - - - - - - - - - - - - - - - - - - - - - - - - - - - - - - - - - - - - - - - - - - - - - - - - - - - - - - - - - - - - - - - - - - - - - - - - - - - - - - - - - - - - - - - - - - - - - - - - - - - - - - - - - - - - - - - - - - - - - - - - - - - - - - - - - - - - - - - - - - - - - - - - - - - - - - - - - - - - - - - - - - - - - - - - - - - - - - - - - - - - - - - - - - - - - - - - - - - - - - - - - - - - - - - - - - - - - - - - - - - - - - - - - - - - - - - - - - - - - - - - - - - - - - - - - - - - - - - - - - - - -
Cash flows from investing activitiesNet cash received from sales of fixed assets and intangible assets 417Dividend received 5,317Maturity of time deposits with financial institutions 207Other cash received relating to investing activities 235Sub-total of cash inflows 6,176--- - - - - - - - - - - - - - - - - - - - - - - - - - - - - - - - - - - - - - - - - - - - - - - - - - - - - - - - - - - - - - - - - - - - - - - - - - - - - - - - - - - - - - - - - - - - - - - - - - - - - - - - - - - - - - - - - - - - - - - - - - - - - - - - - - - - - - - - - - - - - - - - - - - - - - - - - - - - - - - - - - - - - - - - - - - - - - - - - - - - - - - - - - - - - - - - - - - - - - - - - - - - - - - - - - - - - - - - - - - - - - - - - - - - - - - - - - - - - - - - - - - - - - - - - - - - - - - - - - - - - - - - - - - - -
Cash paid for acquisition of fixed assets and intangible assets (22,100)Cash paid for purchases of investments (1,737)Increase in time deposits with financial institutions (198)Sub-total of cash outflows (24,035)-- - - - - - - - - - - - - - - - - - - - - - - - - - - - - - - - - - - - - - - - - - - - - - - - - - - - - - - - - - - - - - - - - - - - - - - - - - - - - - - - - - - - - - - - - - - - - - - - - - - - - - - - - - - - - - - - - - - - - - - - - - - - - - - - - - - - - - - - - - - - - - - - - - - - - - - - - - - - - - - - - - - - - - - - - - - - - - - - - - - - - - - - - - - - - - - - - - - - - - - - - - - - - - - - - - - - - - - - - - - - - - - - - - - - - - - - - - - - - - - - - - - - - - - - - - - - - - - - - - - - - - - - - - - - - -
Net cash outflow from investing activities (17,859)-- - - - - - - - - - - - - - - - - - - - - - - - - - - - - - - - - - - - - - - - - - - - - - - - - - - - - - - - - - - - - - - - - - - - - - - - - - - - - - - - - - - - - - - - - - - - - - - - - - - - - - - - - - - - - - - - - - - - - - - - - - - - - - - - - - - - - - - - - - - - - - - - - - - - - - - - - - - - - - - - - - - - - - - - - - - - - - - - - - - - - - - - - - - - - - - - - - - - - - - - - - - - - - - - - - - - - - - - - - - - - - - - - - - - - - - - - - - - - - - - - - - - - - - - - - - - - - - - - - - - - - - - - - - - - - - - - - - -
Cash flows from financing activitiesProceeds from borrowings 108,662Sub-total of cash inflows 108,662--- - - - - - - - - - - - - - - - - - - - - - - - - - - - - - - - - - - - - - - - - - - - - - - - - - - - - - - - - - - - - - - - - - - - - - - - - - - - - - - - - - - - - - - - - - - - - - - - - - - - - - - - - - - - - - - - - - - - - - - - - - - - - - - - - - - - - - - - - - - - - - - - - - - - - - - - - - - - - - - - - - - - - - - - - - - - - - - - - - - - - - - - - - - - - - - - - - - - - - - - - - - - - - - - - - - - - - - - - - - - - - - - - - - - - - - - - - - - - - - - - - - - - - - - - - - - - - - - - - - - - - - - - - - - -
Repayments of borrowings (114,670)Cash paid for dividends, distribution of profit or interest (12,325)Sub-total of cash outflows (126,995)-- - - - - - - - - - - - - - - - - - - - - - - - - - - - - - - - - - - - - - - - - - - - - - - - - - - - - - - - - - - - - - - - - - - - - - - - - - - - - - - - - - - - - - - - - - - - - - - - - - - - - - - - - - - - - - - - - - - - - - - - - - - - - - - - - - - - - - - - - - - - - - - - - - - - - - - - - - - - - - - - - - - - - - - - - - - - - - - - - - - - - - - - - - - - - - - - - - - - - - - - - - - - - - - - - - - - - - - - - - - - - - - - - - - - - - - - - - - - - - - - - - - - - - - - - - - - - - - - - - - - - - - - - - - - - - -
Net cash outflow from financing activities (18,333)-- - - - - - - - - - - - - - - - - - - - - - - - - - - - - - - - - - - - - - - - - - - - - - - - - - - - - - - - - - - - - - - - - - - - - - - - - - - - - - - - - - - - - - - - - - - - - - - - - - - - - - - - - - - - - - - - - - - - - - - - - - - - - - - - - - - - - - - - - - - - - - - - - - - - - - - - - - - - - - - - - - - - - - - - - - - - - - - - - - - - - - - - - - - - - - - - - - - - - - - - - - - - - - - - - - - - - - - - - - - - - - - - - - - - - - - - - - - - - - - - - - - - - - - - - - - - - - - - - - - - - - - - - - - - - - - - - - - -
Net decrease in cash and cash equivalents (b) (3,388)
The notes on pages 89 to 112 form part of these financial statements.

88
Fina
ncia
l A
ccou
ntin
g R
epor
t
NOTES TO THE CASH FLOW STATEMENTfor the year ended 31 December 2002
RMB millions(a) Reconciliation of net profit to cash flows from operating activities
Net profit 14,121Add: Depreciation of fixed assets 11,012
Amortisation of intangible assets 378Net loss on disposal of fixed assets and intangible assets 412Financial expenses 2,736Dry hole costs 951Investment income (11,317)Deferred tax credits 253Decrease in inventories 2,283Decrease in operating receivables 619Increase in operating payables 11,356
Net cash inflow from operating activities 32,804
RMB millions(b) Net decrease in cash and cash equivalents
Cash and cash equivalents at the end of the year 8,207Less: Cash and cash equivalents at the beginning of the year 11,595Net decrease in cash and cash equivalents (3,388)
The notes on pages 89 to 112 form part of these financial statements.

89
Fina
ncia
l A
ccou
ntin
g R
epor
t
NOTES ON THE FINANCIAL STATEMENTSfor the year ended 31 December 2002
1 STATUS OF THE COMPANYChina Petroleum & Chemical Corporation (the “Company”) was established in the PRC on 25 February 2000 as a joint stock limited company.
According to the State Council’s approval to the “Preliminary Plan for the Reorganisation of China Petrochemical Corporation” ( the“Reorganisation”), the Company was established by China Petrochemical Corporation (“Sinopec Group Company”), which transferred its corebusinesses together with the related assets and liabilities at 30 September 1999 to the Company. Such assets and liabilities had been valued jointlyby China United Assets Appraisal Corporation, Beijing Zhong Zheng Appraisal Company, CIECC Assets Appraisal Corporation and Zhong FaInternational Properties Valuation Corporation (“registered valuers”). The net asset value was determined at RMB 98,249,084,000. The valuationwas reviewed and approved by the Ministry of Finance (“MOF”) (Cai Ping Zi [2000] No. 20 “Comments on the Review of the Valuation Regarding theFormation of a Joint Stock Limited Company by China Petrochemical Corporation”).
In addition, pursuant to the notice Cai Guan Zi [2000] No. 34 “Reply to the Issue Regarding Management of State-Owned Equity by China Petroleumand Chemical Corporation” issued by the MOF, 68.8 billion domestic state-owned shares with a par value of RMB 1.00 each were issued to SinopecGroup Company, the amount of which is equivalent to 70% of the above net asset value transferred from Sinopec Group Company to the Companyin connection with the Reorganization.
Pursuant to the notice Guo Jing Mao Qi Gai [2000] No. 154 “Reply on the Formation of China Petroleum and Chemical Corporation”, the Companyobtained the approval from the State Economic and Trade Commission on 21 February 2000 for the formation of a joint stock limited company.
The Company took over the exploration, development and production of crude oil and natural gas, refining, chemicals and related sales andmarketing business of Sinopec Group Company after the establishment of the Company.
Pursuant to the resolution passed at the extraordinary general meeting held on 24 August 2001, the Company acquired the entire equity interest ofSinopec National Star Petroleum Company (“Sinopec National Star”) from Sinopec Group Company for a consideration of RMB 6.45 billion(hereinafter referred to as the “Acquisition”).
2 SIGNIFICANT ACCOUNTING POLICIESThe significant accounting policies adopted by the Company and its subsidiaries (the “Group”) in the preparation of the financial statements are inconformity with the “Accounting Standards for Business Enterprises” and “Accounting Regulations for Business Enterprises”and other relevantregulations issued by the MOF.
(a) Accounting yearThe accounting year of the Group is from 1 January to 31 December.
(b) Basis of consolidationThe Group prepared the consolidated financial statements according to “Accounting Regulations for Business Enterprises” and Cai Kuai Zi[1995] No.11 “Provisional regulations on consolidated financial statements” issued by the MOF.
The consolidated financial statements include the financial statements of the Company and all of its principal subsidiaries made up to 31December each year. Subsidiaries are those entities controlled by the Company. Control exists when the Company has the power, directly orindirectly, to govern the financial and operating policies of an entity so as to obtain benefits from its activities. The consolidated incomestatement of the Company only includes the results of the subsidiaries during the period when such control effectively commences until thedate that control effectively ceases. The effect of minority interests on equity and profit/loss attributable to minority interests are separatelyshown in the consolidated financial statements.
Where the accounting policies adopted by the subsidiaries are different from the policies adopted by the Company, the financial statements ofthe subsidiaries have been adjusted in accordance with the accounting policies adopted by the Company on consolidation. All significant inter-company balances and transactions, and any unrealised gains arising from inter-company transactions, have been eliminated on consolidation.For those subsidiaries whose assets and results of operation are not significant and have no significant effect on the Group’s consolidatedfinancial statements, the Company does not consolidate these subsidiaries, but includes in the long-term equity investments.
For those jointly controlled entities which the Company has joint control with other investors under contractual arrangement, the Companyconsolidates their assets, liabilities, revenues, costs and expenses based on the proportionate consolidation method according to its percentageof holding of equity interest in those entities in the consolidated financial statements.
(c) Basis of preparationThe financial statements of the Group have been prepared on an accrual basis under the historical costs convention, unless otherwise stated.
(d) Reporting currency and translation of foreign currenciesThe Group’s financial statements are prepared in Renminbi. Foreign currency transactions during the year are translated into Renminbi atexchange rates quoted by the People’s Bank of China (‘’PBOC rates’’) prevailing on the transaction dates. Foreign currency monetary assets andliabilities are translated into Renminbi at the PBOC rates at the balance sheet date. Exchange differences, other than those arising from foreigncurrency loans using to finance the construction of fixed assets before they are ready for their intended use are capitalised, are recognised asincome or expenses in the income statement.
The results of overseas subsidiaries are translated into Renminbi at the annual average PBOC rates. The balance sheet items are translated intoRenminbi at the PBOC rates at the balance sheet date. The resulting exchange gains or losses are accounted for as foreign currency exchangedifferences in the income statement.
(e) Cash equivalentsCash equivalents are short-term and highly liquid investments which are readily convertible into known amounts of cash and are subject to aninsignificant risk of change in value, including time deposits with financial institutions with an initial term of less than three months.
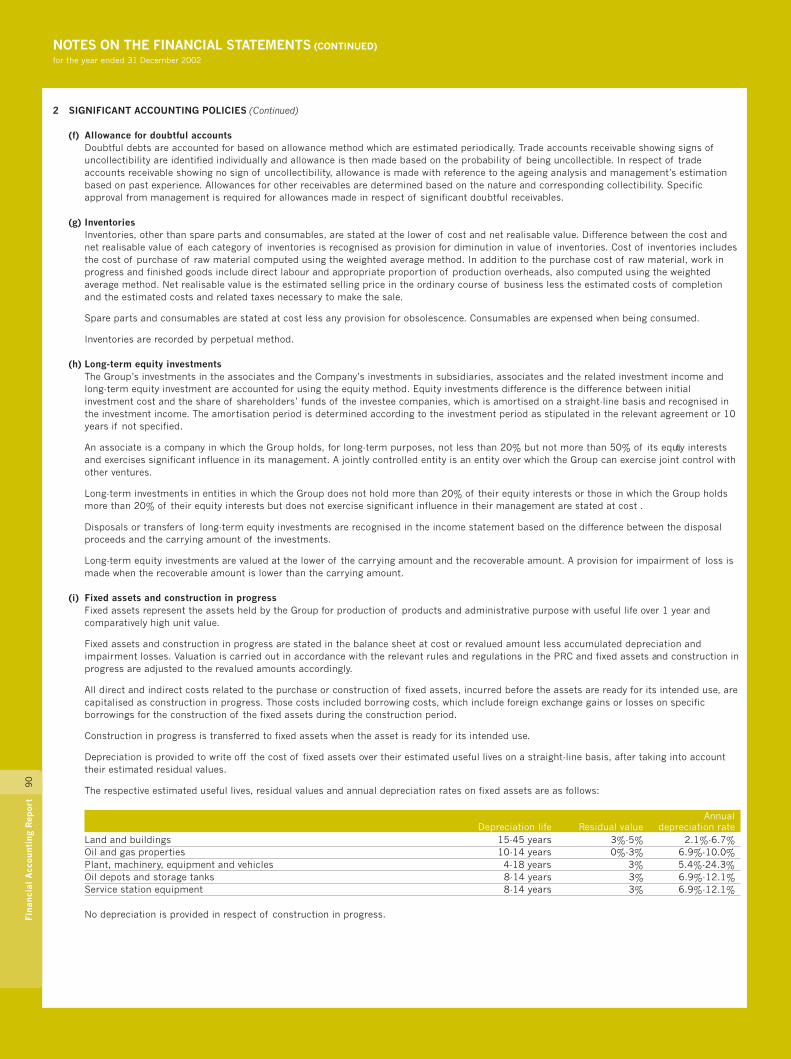
NOTES ON THE FINANCIAL STATEMENTS (CONTINUED)for the year ended 31 December 2002
90
Fina
ncia
l A
ccou
ntin
g R
epor
t
2 SIGNIFICANT ACCOUNTING POLICIES (Continued)
(f) Allowance for doubtful accountsDoubtful debts are accounted for based on allowance method which are estimated periodically. Trade accounts receivable showing signs ofuncollectibility are identified individually and allowance is then made based on the probability of being uncollectible. In respect of tradeaccounts receivable showing no sign of uncollectibility, allowance is made with reference to the ageing analysis and management’s estimationbased on past experience. Allowances for other receivables are determined based on the nature and corresponding collectibility. Specificapproval from management is required for allowances made in respect of significant doubtful receivables.
(g) InventoriesInventories, other than spare parts and consumables, are stated at the lower of cost and net realisable value. Difference between the cost andnet realisable value of each category of inventories is recognised as provision for diminution in value of inventories. Cost of inventories includesthe cost of purchase of raw material computed using the weighted average method. In addition to the purchase cost of raw material, work inprogress and finished goods include direct labour and appropriate proportion of production overheads, also computed using the weightedaverage method. Net realisable value is the estimated selling price in the ordinary course of business less the estimated costs of completionand the estimated costs and related taxes necessary to make the sale.
Spare parts and consumables are stated at cost less any provision for obsolescence. Consumables are expensed when being consumed.
Inventories are recorded by perpetual method.
(h) Long-term equity investmentsThe Group’s investments in the associates and the Company’s investments in subsidiaries, associates and the related investment income andlong-term equity investment are accounted for using the equity method. Equity investments difference is the difference between initialinvestment cost and the share of shareholders’ funds of the investee companies, which is amortised on a straight-line basis and recognised inthe investment income. The amortisation period is determined according to the investment period as stipulated in the relevant agreement or 10years if not specified.
An associate is a company in which the Group holds, for long-term purposes, not less than 20% but not more than 50% of its equity interestsand exercises significant influence in its management. A jointly controlled entity is an entity over which the Group can exercise joint control withother ventures.
Long-term investments in entities in which the Group does not hold more than 20% of their equity interests or those in which the Group holdsmore than 20% of their equity interests but does not exercise significant influence in their management are stated at cost .
Disposals or transfers of long-term equity investments are recognised in the income statement based on the difference between the disposalproceeds and the carrying amount of the investments.
Long-term equity investments are valued at the lower of the carrying amount and the recoverable amount. A provision for impairment of loss ismade when the recoverable amount is lower than the carrying amount.
(i) Fixed assets and construction in progressFixed assets represent the assets held by the Group for production of products and administrative purpose with useful life over 1 year andcomparatively high unit value.
Fixed assets and construction in progress are stated in the balance sheet at cost or revalued amount less accumulated depreciation andimpairment losses. Valuation is carried out in accordance with the relevant rules and regulations in the PRC and fixed assets and construction inprogress are adjusted to the revalued amounts accordingly.
All direct and indirect costs related to the purchase or construction of fixed assets, incurred before the assets are ready for its intended use, arecapitalised as construction in progress. Those costs included borrowing costs, which include foreign exchange gains or losses on specificborrowings for the construction of the fixed assets during the construction period.
Construction in progress is transferred to fixed assets when the asset is ready for its intended use.
Depreciation is provided to write off the cost of fixed assets over their estimated useful lives on a straight-line basis, after taking into accounttheir estimated residual values.
The respective estimated useful lives, residual values and annual depreciation rates on fixed assets are as follows:
AnnualDepreciation life Residual value depreciation rate
Land and buildings 15-45 years 3%-5% 2.1%-6.7%Oil and gas properties 10-14 years 0%-3% 6.9%-10.0%Plant, machinery, equipment and vehicles 4-18 years 3% 5.4%-24.3%Oil depots and storage tanks 8-14 years 3% 6.9%-12.1%Service station equipment 8-14 years 3% 6.9%-12.1%
No depreciation is provided in respect of construction in progress.
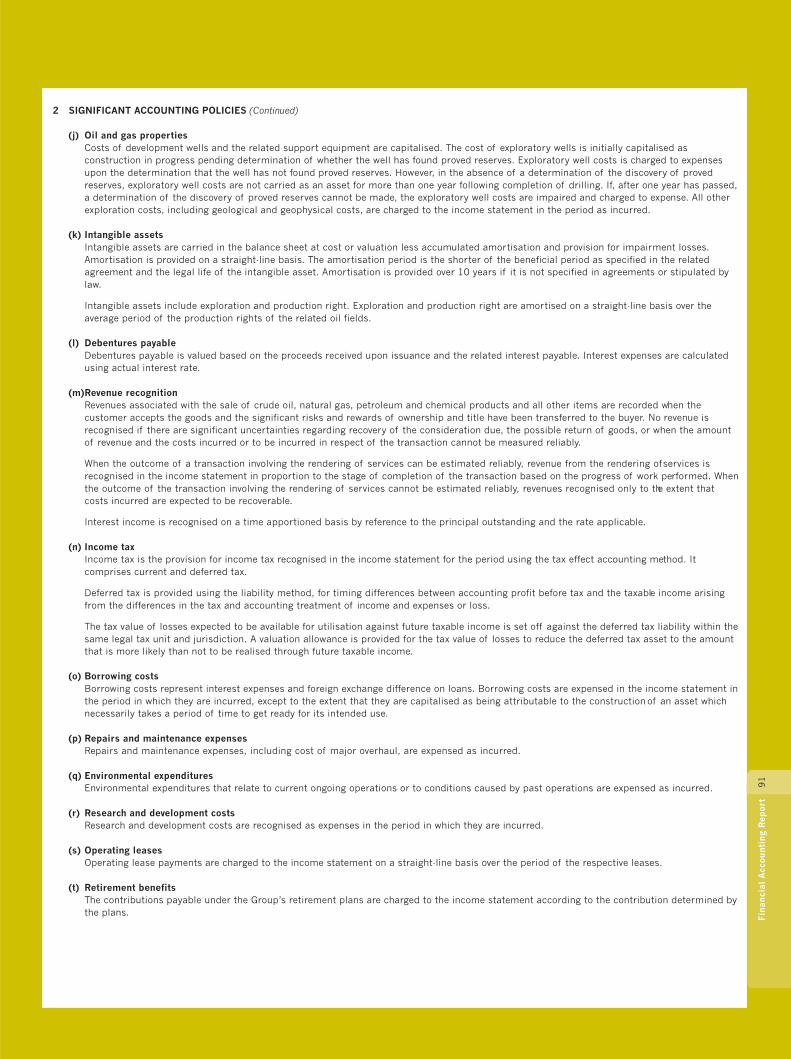
91
Fina
ncia
l A
ccou
ntin
g R
epor
t
2 SIGNIFICANT ACCOUNTING POLICIES (Continued)
(j) Oil and gas propertiesCosts of development wells and the related support equipment are capitalised. The cost of exploratory wells is initially capitalised asconstruction in progress pending determination of whether the well has found proved reserves. Exploratory well costs is charged to expensesupon the determination that the well has not found proved reserves. However, in the absence of a determination of the discovery of provedreserves, exploratory well costs are not carried as an asset for more than one year following completion of drilling. If, after one year has passed,a determination of the discovery of proved reserves cannot be made, the exploratory well costs are impaired and charged to expense. All otherexploration costs, including geological and geophysical costs, are charged to the income statement in the period as incurred.
(k) Intangible assetsIntangible assets are carried in the balance sheet at cost or valuation less accumulated amortisation and provision for impairment losses.Amortisation is provided on a straight-line basis. The amortisation period is the shorter of the beneficial period as specified in the relatedagreement and the legal life of the intangible asset. Amortisation is provided over 10 years if it is not specified in agreements or stipulated bylaw.
Intangible assets include exploration and production right. Exploration and production right are amortised on a straight-line basis over theaverage period of the production rights of the related oil fields.
(l) Debentures payableDebentures payable is valued based on the proceeds received upon issuance and the related interest payable. Interest expenses are calculatedusing actual interest rate.
(m)Revenue recognitionRevenues associated with the sale of crude oil, natural gas, petroleum and chemical products and all other items are recorded when thecustomer accepts the goods and the significant risks and rewards of ownership and title have been transferred to the buyer. No revenue isrecognised if there are significant uncertainties regarding recovery of the consideration due, the possible return of goods, or when the amountof revenue and the costs incurred or to be incurred in respect of the transaction cannot be measured reliably.
When the outcome of a transaction involving the rendering of services can be estimated reliably, revenue from the rendering of services isrecognised in the income statement in proportion to the stage of completion of the transaction based on the progress of work performed. Whenthe outcome of the transaction involving the rendering of services cannot be estimated reliably, revenues recognised only to the extent thatcosts incurred are expected to be recoverable.
Interest income is recognised on a time apportioned basis by reference to the principal outstanding and the rate applicable.
(n) Income taxIncome tax is the provision for income tax recognised in the income statement for the period using the tax effect accounting method. Itcomprises current and deferred tax.
Deferred tax is provided using the liability method, for timing differences between accounting profit before tax and the taxable income arisingfrom the differences in the tax and accounting treatment of income and expenses or loss.
The tax value of losses expected to be available for utilisation against future taxable income is set off against the deferred tax liability within thesame legal tax unit and jurisdiction. A valuation allowance is provided for the tax value of losses to reduce the deferred tax asset to the amountthat is more likely than not to be realised through future taxable income.
(o) Borrowing costsBorrowing costs represent interest expenses and foreign exchange difference on loans. Borrowing costs are expensed in the income statement inthe period in which they are incurred, except to the extent that they are capitalised as being attributable to the construction of an asset whichnecessarily takes a period of time to get ready for its intended use.
(p) Repairs and maintenance expensesRepairs and maintenance expenses, including cost of major overhaul, are expensed as incurred.
(q) Environmental expendituresEnvironmental expenditures that relate to current ongoing operations or to conditions caused by past operations are expensed as incurred.
(r) Research and development costsResearch and development costs are recognised as expenses in the period in which they are incurred.
(s) Operating leasesOperating lease payments are charged to the income statement on a straight-line basis over the period of the respective leases.
(t) Retirement benefitsThe contributions payable under the Group’s retirement plans are charged to the income statement according to the contribution determined bythe plans.
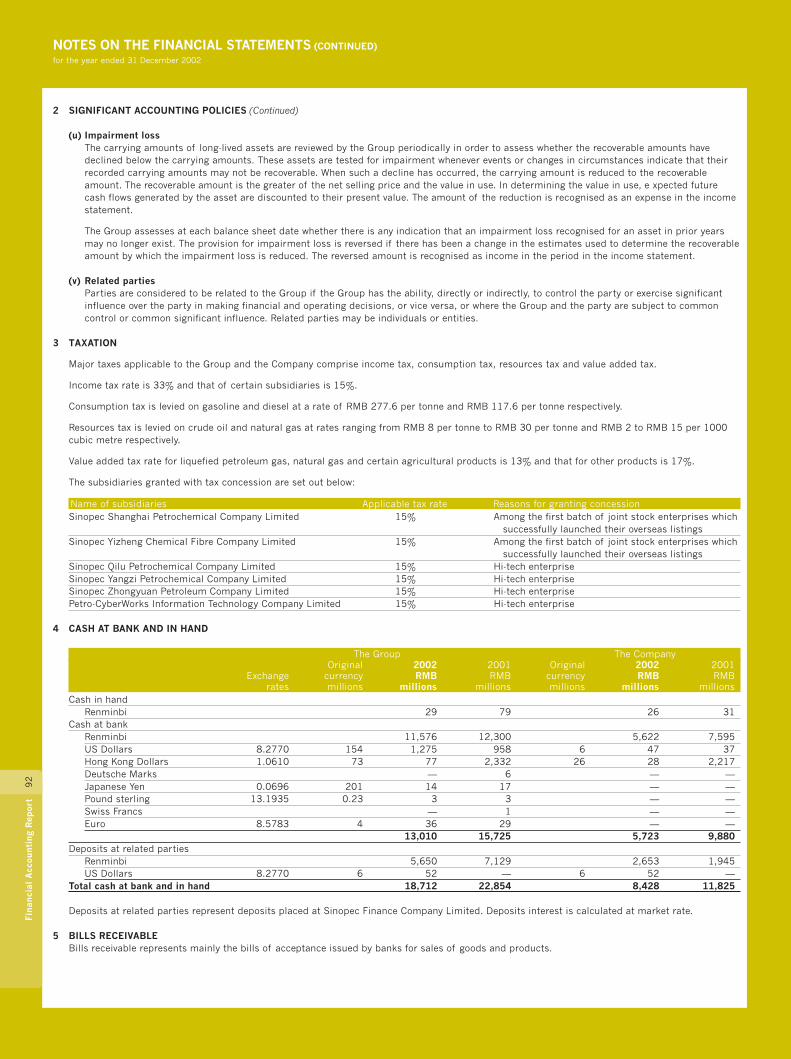
NOTES ON THE FINANCIAL STATEMENTS (CONTINUED)for the year ended 31 December 2002
92
Fina
ncia
l A
ccou
ntin
g R
epor
t
2 SIGNIFICANT ACCOUNTING POLICIES (Continued)
(u) Impairment lossThe carrying amounts of long-lived assets are reviewed by the Group periodically in order to assess whether the recoverable amounts havedeclined below the carrying amounts. These assets are tested for impairment whenever events or changes in circumstances indicate that theirrecorded carrying amounts may not be recoverable. When such a decline has occurred, the carrying amount is reduced to the recoverableamount. The recoverable amount is the greater of the net selling price and the value in use. In determining the value in use, expected futurecash flows generated by the asset are discounted to their present value. The amount of the reduction is recognised as an expense in the incomestatement.
The Group assesses at each balance sheet date whether there is any indication that an impairment loss recognised for an asset in prior yearsmay no longer exist. The provision for impairment loss is reversed if there has been a change in the estimates used to determine the recoverableamount by which the impairment loss is reduced. The reversed amount is recognised as income in the period in the income statement.
(v) Related partiesParties are considered to be related to the Group if the Group has the ability, directly or indirectly, to control the party or exercise significantinfluence over the party in making financial and operating decisions, or vice versa, or where the Group and the party are subject to commoncontrol or common significant influence. Related parties may be individuals or entities.
3 TAXATION
Major taxes applicable to the Group and the Company comprise income tax, consumption tax, resources tax and value added tax.
Income tax rate is 33% and that of certain subsidiaries is 15%.
Consumption tax is levied on gasoline and diesel at a rate of RMB 277.6 per tonne and RMB 117.6 per tonne respectively.
Resources tax is levied on crude oil and natural gas at rates ranging from RMB 8 per tonne to RMB 30 per tonne and RMB 2 to RMB 15 per 1000cubic metre respectively.
Value added tax rate for liquefied petroleum gas, natural gas and certain agricultural products is 13% and that for other products is 17%.
The subsidiaries granted with tax concession are set out below:
Name of subsidiaries Applicable tax rate Reasons for granting concessionSinopec Shanghai Petrochemical Company Limited 15% Among the first batch of joint stock enterprises which
successfully launched their overseas listingsSinopec Yizheng Chemical Fibre Company Limited 15% Among the first batch of joint stock enterprises which
successfully launched their overseas listingsSinopec Qilu Petrochemical Company Limited 15% Hi-tech enterpriseSinopec Yangzi Petrochemical Company Limited 15% Hi-tech enterpriseSinopec Zhongyuan Petroleum Company Limited 15% Hi-tech enterprisePetro-CyberWorks Information Technology Company Limited 15% Hi-tech enterprise
4 CASH AT BANK AND IN HAND
The Group The CompanyOriginal 2002 2001 Original 2002 2001
Exchange currency RMB RMB currency RMB RMBrates millions millions millions millions millions millions
Cash in handRenminbi 29 79 26 31
Cash at bankRenminbi 11,576 12,300 5,622 7,595US Dollars 8.2770 154 1,275 958 6 47 37Hong Kong Dollars 1.0610 73 77 2,332 26 28 2,217Deutsche Marks — 6 — —Japanese Yen 0.0696 201 14 17 — —Pound sterling 13.1935 0.23 3 3 — —Swiss Francs — 1 — —Euro 8.5783 4 36 29 — —
13,010 15,725 5,723 9,880Deposits at related parties
Renminbi 5,650 7,129 2,653 1,945US Dollars 8.2770 6 52 — 6 52 —
Total cash at bank and in hand 18,712 22,854 8,428 11,825
Deposits at related parties represent deposits placed at Sinopec Finance Company Limited. Deposits interest is calculated at market rate.
5 BILLS RECEIVABLEBills receivable represents mainly the bills of acceptance issued by banks for sales of goods and products.
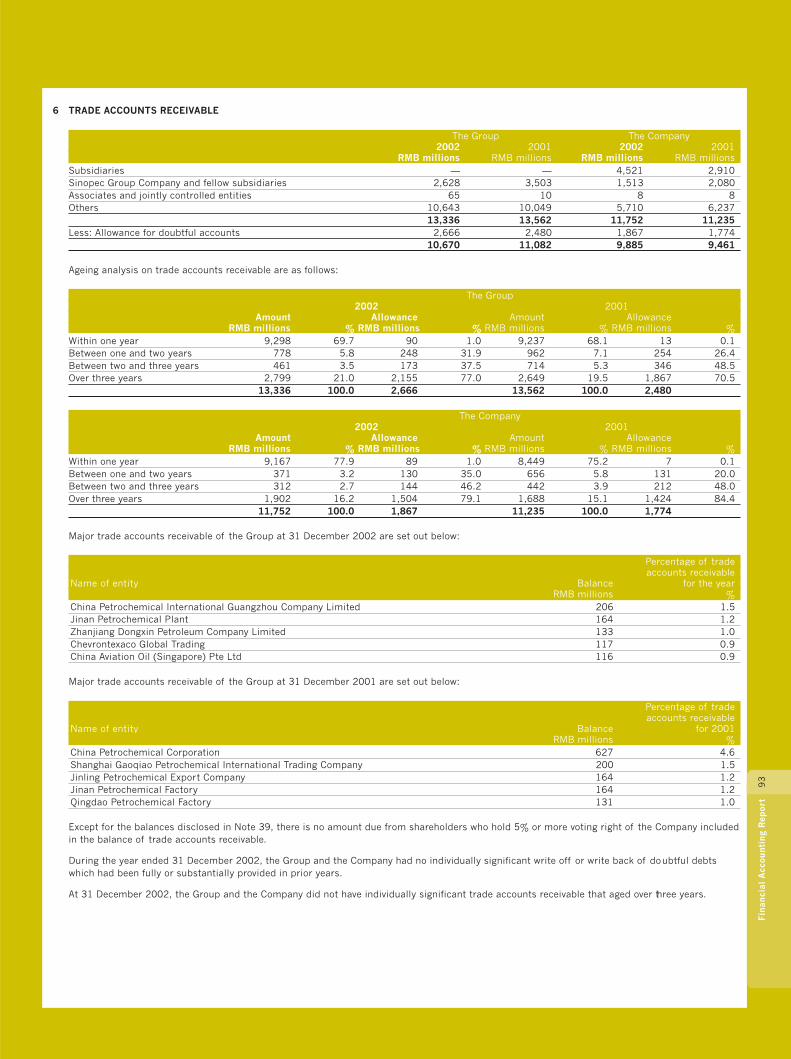
93
Fina
ncia
l A
ccou
ntin
g R
epor
t
6 TRADE ACCOUNTS RECEIVABLE
The Group The Company2002 2001 2002 2001
RMB millions RMB millions RMB millions RMB millionsSubsidiaries — — 4,521 2,910Sinopec Group Company and fellow subsidiaries 2,628 3,503 1,513 2,080Associates and jointly controlled entities 65 10 8 8Others 10,643 10,049 5,710 6,237
13,336 13,562 11,752 11,235Less: Allowance for doubtful accounts 2,666 2,480 1,867 1,774
10,670 11,082 9,885 9,461
Ageing analysis on trade accounts receivable are as follows:
The Group2002 2001
Amount Allowance Amount AllowanceRMB millions % RMB millions % RMB millions % RMB millions %
Within one year 9,298 69.7 90 1.0 9,237 68.1 13 0.1Between one and two years 778 5.8 248 31.9 962 7.1 254 26.4Between two and three years 461 3.5 173 37.5 714 5.3 346 48.5Over three years 2,799 21.0 2,155 77.0 2,649 19.5 1,867 70.5
13,336 100.0 2,666 13,562 100.0 2,480
The Company2002 2001
Amount Allowance Amount AllowanceRMB millions % RMB millions % RMB millions % RMB millions %
Within one year 9,167 77.9 89 1.0 8,449 75.2 7 0.1Between one and two years 371 3.2 130 35.0 656 5.8 131 20.0Between two and three years 312 2.7 144 46.2 442 3.9 212 48.0Over three years 1,902 16.2 1,504 79.1 1,688 15.1 1,424 84.4
11,752 100.0 1,867 11,235 100.0 1,774
Major trade accounts receivable of the Group at 31 December 2002 are set out below:
Percentage of tradeaccounts receivable
Name of entity Balance for the yearRMB millions %
China Petrochemical International Guangzhou Company Limited 206 1.5Jinan Petrochemical Plant 164 1.2Zhanjiang Dongxin Petroleum Company Limited 133 1.0Chevrontexaco Global Trading 117 0.9China Aviation Oil (Singapore) Pte Ltd 116 0.9
Major trade accounts receivable of the Group at 31 December 2001 are set out below:
Percentage of tradeaccounts receivable
Name of entity Balance for 2001RMB millions %
China Petrochemical Corporation 627 4.6Shanghai Gaoqiao Petrochemical International Trading Company 200 1.5Jinling Petrochemical Export Company 164 1.2Jinan Petrochemical Factory 164 1.2Qingdao Petrochemical Factory 131 1.0
Except for the balances disclosed in Note 39, there is no amount due from shareholders who hold 5% or more voting right of the Company includedin the balance of trade accounts receivable.
During the year ended 31 December 2002, the Group and the Company had no individually significant write off or write back of doubtful debtswhich had been fully or substantially provided in prior years.
At 31 December 2002, the Group and the Company did not have individually significant trade accounts receivable that aged over three years.

NOTES ON THE FINANCIAL STATEMENTS (CONTINUED)for the year ended 31 December 2002
94
Fina
ncia
l A
ccou
ntin
g R
epor
t
7 OTHER RECEIVABLES
The Group The Company2002 2001 2002 2001
RMB millions RMB millions RMB millions RMB millionsSubsidiaries — — 9,961 8,802Sinopec Group Company and fellow subsidiaries 11,130 8,289 9,562 6,763Associates and jointly controlled entities 310 373 310 373Others 7,249 12,706 5,021 9,607
18,689 21,368 24,854 25,545Less: Allowance for doubtful accounts 1,872 1,550 1,193 1,242
16,817 19,818 23,661 24,303
Ageing analyses of other receivables are as follows:
The Group2002 2001
Amount Allowance Amount AllowanceRMB millions % RMB millions % RMB millions % RMB millions %
Within one year 12,156 65.0 310 2.6 10,800 50.5 16 0.1Between one and two years 2,513 13.5 126 5.0 7,715 36.1 3 0.0Between two and three years 2,258 12.1 211 9.3 585 2.7 201 34.4Over three years 1,762 9.4 1,225 69.5 2,268 10.7 1,330 58.6
18,689 100.0 1,872 21,368 100.0 1,550
The Company2002 2001
Amount Allowance Amount AllowanceRMB millions % RMB millions % RMB millions % RMB millions %
Within one year 19,334 77.8 21 0.1 16,538 64.7 8 0.0Between one and two years 2,110 8.5 28 1.3 7,563 29.6 1 0.0Between two and three years 2,123 8.5 169 8.0 226 0.9 150 66.4Over three years 1,287 5.2 975 75.8 1,218 4.8 1,083 88.9
24,854 100 1,193 25,545 100.0 1,242
Major other receivables of the Group at 31 December 2002 are set out below:
Percentage ofother receivables
Name of entity Particulars Balance for the yearRMB millions %
China Petroleum Corporation Current Account 3,509 18.8Baling Petrochemical Company Limited Current Account 967 5.2Yuelian Wanda Petrochemical Company Limited Current Account 423 2.3Jinhuang Real Estate Company Limited Current Account 370 2.0Changling Petrochemical Company Limited Current Account 315 1.7
Major other receivables of the Group at 31 December 2001 are set out below:
Percentage ofother receivables
Name of entity Particulars Balance for 2001RMB millions %
Daqing Petrochemical Company Current Account 2,105 9.9Fushun Petrochemical Company Current Account 1,194 5.6Baling Petrochemical Company Limited Current Account 967 4.5Yuelian Wanda Petrochemical Company Limited Current Account 543 2.5Lanzhou Chemical Industrial Company Current Account 447 2.1
Except for the balances disclosed in Note 39, there is no amount due from shareholders who hold 5% or more voting right of the Company includedin the balance of other receivables.
During the year ended 31 December 2002, the Group and the Company had no individually significant write off of other receivables.
At 31 December 2002, the Group and the Company did not have individually significant other receivables that aged over three years.
During the year ended 31 December 2002, pursuant to Cai Qi [2002] No. 625 “Reply to the adjustment on State Capital of China NationalPetroleum Corporation and China Petrochemical Corporation” issued by the MOF, the receivable and payable of the Group with China NationalPetroleum Corporation of RMB 4,014 million and RMB 505 million respectively is eliminated. The net amounts of RMB 3,509 million is borne bySinopec Group Company.
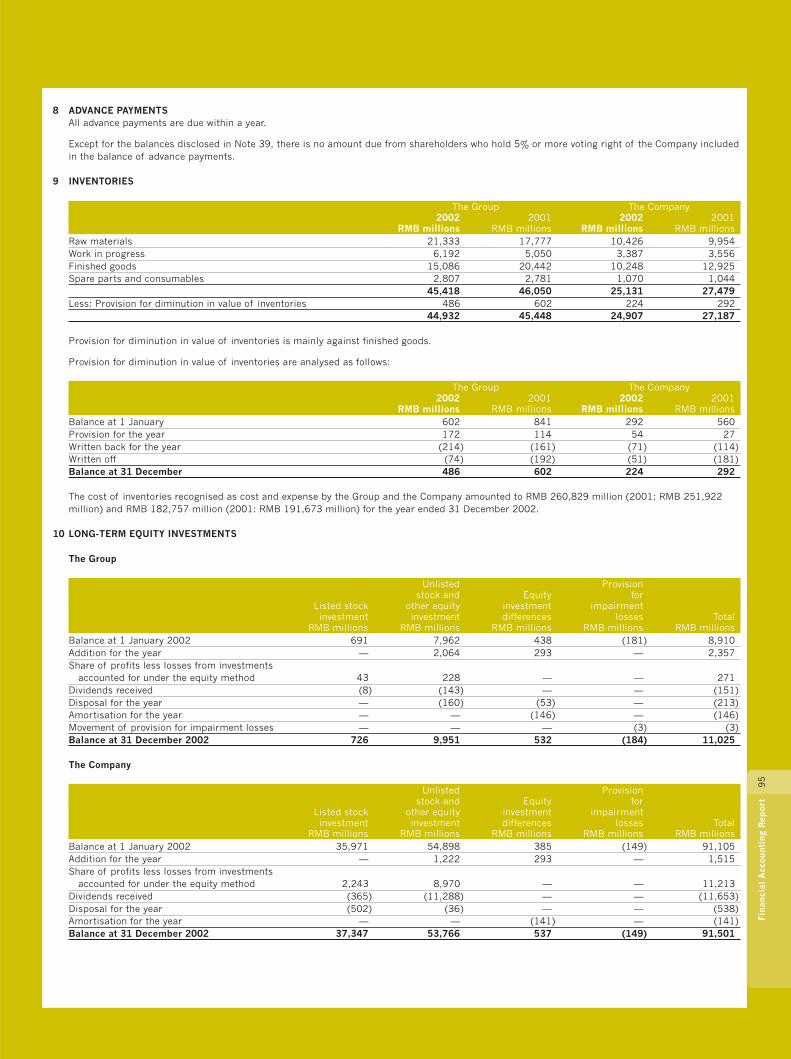
95
Fina
ncia
l A
ccou
ntin
g R
epor
t
8 ADVANCE PAYMENTSAll advance payments are due within a year.
Except for the balances disclosed in Note 39, there is no amount due from shareholders who hold 5% or more voting right of the Company includedin the balance of advance payments.
9 INVENTORIES
The Group The Company2002 2001 2002 2001
RMB millions RMB millions RMB millions RMB millionsRaw materials 21,333 17,777 10,426 9,954Work in progress 6,192 5,050 3,387 3,556Finished goods 15,086 20,442 10,248 12,925Spare parts and consumables 2,807 2,781 1,070 1,044
45,418 46,050 25,131 27,479Less: Provision for diminution in value of inventories 486 602 224 292
44,932 45,448 24,907 27,187
Provision for diminution in value of inventories is mainly against finished goods.
Provision for diminution in value of inventories are analysed as follows:
The Group The Company2002 2001 2002 2001
RMB millions RMB millions RMB millions RMB millionsBalance at 1 January 602 841 292 560Provision for the year 172 114 54 27Written back for the year (214) (161) (71) (114)Written off (74) (192) (51) (181)Balance at 31 December 486 602 224 292
The cost of inventories recognised as cost and expense by the Group and the Company amounted to RMB 260,829 million (2001: RMB 251,922million) and RMB 182,757 million (2001: RMB 191,673 million) for the year ended 31 December 2002.
10 LONG-TERM EQUITY INVESTMENTS
The Group
Unlisted Provisionstock and Equity for
Listed stock other equity investment impairmentinvestment investment differences losses Total
RMB millions RMB millions RMB millions RMB millions RMB millionsBalance at 1 January 2002 691 7,962 438 (181) 8,910Addition for the year — 2,064 293 — 2,357Share of profits less losses from investments
accounted for under the equity method 43 228 — — 271Dividends received (8) (143) — — (151)Disposal for the year — (160) (53) — (213)Amortisation for the year — — (146) — (146)Movement of provision for impairment losses — — — (3) (3)Balance at 31 December 2002 726 9,951 532 (184) 11,025
The Company
Unlisted Provisionstock and Equity for
Listed stock other equity investment impairmentinvestment investment differences losses Total
RMB millions RMB millions RMB millions RMB millions RMB millionsBalance at 1 January 2002 35,971 54,898 385 (149) 91,105Addition for the year — 1,222 293 — 1,515Share of profits less losses from investments
accounted for under the equity method 2,243 8,970 — — 11,213Dividends received (365) (11,288) — — (11,653)Disposal for the year (502) (36) — — (538)Amortisation for the year — — (141) — (141)Balance at 31 December 2002 37,347 53,766 537 (149) 91,501
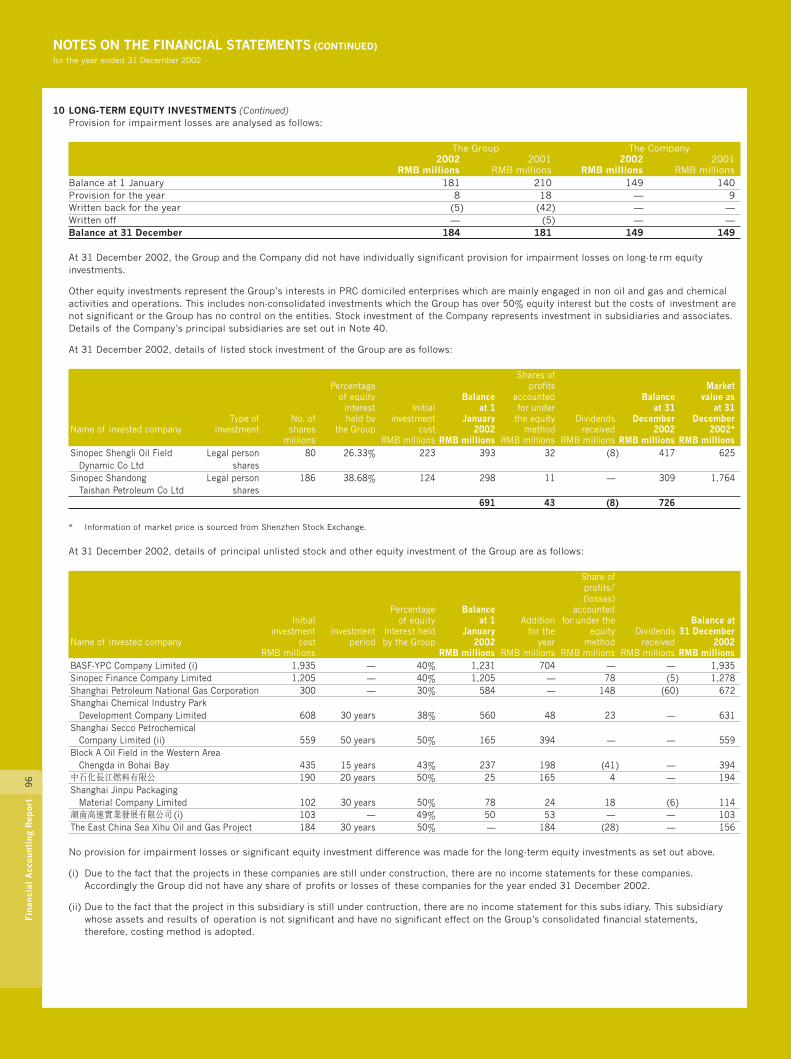
NOTES ON THE FINANCIAL STATEMENTS (CONTINUED)for the year ended 31 December 2002
96
Fina
ncia
l A
ccou
ntin
g R
epor
t
10 LONG-TERM EQUITY INVESTMENTS (Continued)Provision for impairment losses are analysed as follows:
The Group The Company2002 2001 2002 2001
RMB millions RMB millions RMB millions RMB millionsBalance at 1 January 181 210 149 140Provision for the year 8 18 — 9Written back for the year (5) (42) — —Written off — (5) — —Balance at 31 December 184 181 149 149
At 31 December 2002, the Group and the Company did not have individually significant provision for impairment losses on long-term equityinvestments.
Other equity investments represent the Group’s interests in PRC domiciled enterprises which are mainly engaged in non oil and gas and chemicalactivities and operations. This includes non-consolidated investments which the Group has over 50% equity interest but the costs of investment arenot significant or the Group has no control on the entities. Stock investment of the Company represents investment in subsidiaries and associates.Details of the Company’s principal subsidiaries are set out in Note 40.
At 31 December 2002, details of listed stock investment of the Group are as follows:
Shares ofPercentage profits Market
of equity Balance accounted Balance value asinterest Initial at 1 for under at 31 at 31
Type of No. of held by investment January the equity Dividends December DecemberName of invested company investment shares the Group cost 2002 method received 2002 2002*
millions RMB millions RMB millions RMB millions RMB millions RMB millions RMB millionsSinopec Shengli Oil Field Legal person 80 26.33% 223 393 32 (8) 417 625
Dynamic Co Ltd sharesSinopec Shandong Legal person 186 38.68% 124 298 11 — 309 1,764
Taishan Petroleum Co Ltd shares691 43 (8) 726
* Information of market price is sourced from Shenzhen Stock Exchange.
At 31 December 2002, details of principal unlisted stock and other equity investment of the Group are as follows:
Share ofprofits/(losses)
Percentage Balance accountedInitial of equity at 1 Addition for under the Balance at
investment Investment interest held January for the equity Dividends 31 DecemberName of invested company cost period by the Group 2002 year method received 2002
RMB millions RMB millions RMB millions RMB millions RMB millions RMB millionsBASF-YPC Company Limited (i) 1,935 — 40% 1,231 704 — — 1,935Sinopec Finance Company Limited 1,205 — 40% 1,205 — 78 (5) 1,278Shanghai Petroleum National Gas Corporation 300 — 30% 584 — 148 (60) 672Shanghai Chemical Industry Park
Development Company Limited 608 30 years 38% 560 48 23 — 631Shanghai Secco Petrochemical
Company Limited (ii) 559 50 years 50% 165 394 — — 559Block A Oil Field in the Western Area
Chengda in Bohai Bay 435 15 years 43% 237 198 (41) — 394中石化長江燃料有限公司 190 20 years 50% 25 165 4 — 194Shanghai Jinpu Packaging
Material Company Limited 102 30 years 50% 78 24 18 (6) 114湖南高速實業發展有限公司 (i) 103 — 49% 50 53 — — 103The East China Sea Xihu Oil and Gas Project 184 30 years 50% — 184 (28) — 156
No provision for impairment losses or significant equity investment difference was made for the long-term equity investments as set out above.
(i) Due to the fact that the projects in these companies are still under construction, there are no income statements for these companies.Accordingly the Group did not have any share of profits or losses of these companies for the year ended 31 December 2002.
(ii) Due to the fact that the project in this subsidiary is still under contruction, there are no income statement for this subsidiary. This subsidiarywhose assets and results of operation is not significant and have no significant effect on the Group’s consolidated financial statements,therefore, costing method is adopted.
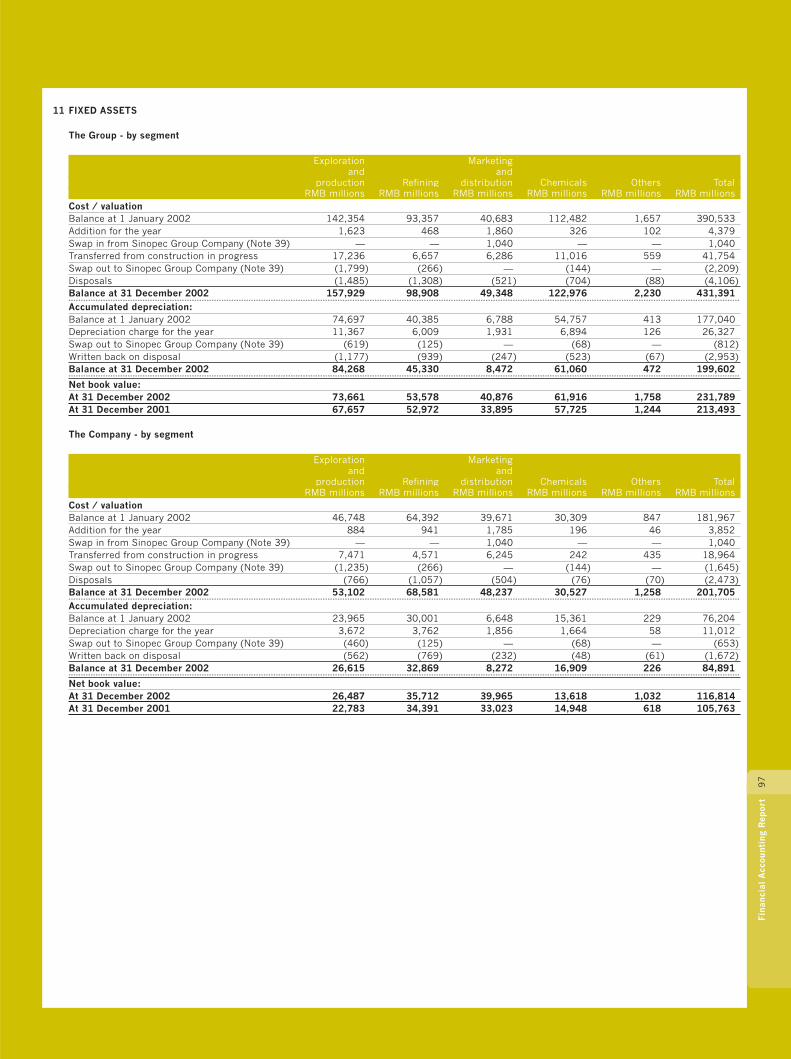
97
Fina
ncia
l A
ccou
ntin
g R
epor
t
11 FIXED ASSETS
The Group - by segment
Exploration Marketingand and
production Refining distribution Chemicals Others TotalRMB millions RMB millions RMB millions RMB millions RMB millions RMB millions
Cost / valuationBalance at 1 January 2002 142,354 93,357 40,683 112,482 1,657 390,533Addition for the year 1,623 468 1,860 326 102 4,379Swap in from Sinopec Group Company (Note 39) — — 1,040 — — 1,040Transferred from construction in progress 17,236 6,657 6,286 11,016 559 41,754Swap out to Sinopec Group Company (Note 39) (1,799) (266) — (144) — (2,209)Disposals (1,485) (1,308) (521) (704) (88) (4,106)Balance at 31 December 2002 157,929 98,908 49,348 122,976 2,230 431,391--- - - - - - - - - - - - - - - - - - - - - - - - - - - - - - - - - - - - - - - - - - - - - - - - - - - - - - - - - - - - - - - - - - - - - - - - - - - - - - - - - - - - - - - - - - - - - - - - - - - - - - - - - - - - - - - - - - - - - - - - - - - - - - - - - - - - - - - - - - - - - - - - - - - - - - - - - - - - - - - - - - - - - - - - - - - - - - - - - - - - - - - - - - - - - - - - - - - - - - - - - - - - - - - - - - - - - - - - - - - - - - - - - - - - - - - - - - - - - - - - - - - - - - - - - - - - - - - - - - - - - - - - - - - - - -
Accumulated depreciation:Balance at 1 January 2002 74,697 40,385 6,788 54,757 413 177,040Depreciation charge for the year 11,367 6,009 1,931 6,894 126 26,327Swap out to Sinopec Group Company (Note 39) (619) (125) — (68) — (812)Written back on disposal (1,177) (939) (247) (523) (67) (2,953)Balance at 31 December 2002 84,268 45,330 8,472 61,060 472 199,602--- - - - - - - - - - - - - - - - - - - - - - - - - - - - - - - - - - - - - - - - - - - - - - - - - - - - - - - - - - - - - - - - - - - - - - - - - - - - - - - - - - - - - - - - - - - - - - - - - - - - - - - - - - - - - - - - - - - - - - - - - - - - - - - - - - - - - - - - - - - - - - - - - - - - - - - - - - - - - - - - - - - - - - - - - - - - - - - - - - - - - - - - - - - - - - - - - - - - - - - - - - - - - - - - - - - - - - - - - - - - - - - - - - - - - - - - - - - - - - - - - - - - - - - - - - - - - - - - - - - - - - - - - - - - - -
Net book value:At 31 December 2002 73,661 53,578 40,876 61,916 1,758 231,789At 31 December 2001 67,657 52,972 33,895 57,725 1,244 213,493
The Company - by segment
Exploration Marketingand and
production Refining distribution Chemicals Others TotalRMB millions RMB millions RMB millions RMB millions RMB millions RMB millions
Cost / valuationBalance at 1 January 2002 46,748 64,392 39,671 30,309 847 181,967Addition for the year 884 941 1,785 196 46 3,852Swap in from Sinopec Group Company (Note 39) — — 1,040 — — 1,040Transferred from construction in progress 7,471 4,571 6,245 242 435 18,964Swap out to Sinopec Group Company (Note 39) (1,235) (266) — (144) — (1,645)Disposals (766) (1,057) (504) (76) (70) (2,473)Balance at 31 December 2002 53,102 68,581 48,237 30,527 1,258 201,705--- - - - - - - - - - - - - - - - - - - - - - - - - - - - - - - - - - - - - - - - - - - - - - - - - - - - - - - - - - - - - - - - - - - - - - - - - - - - - - - - - - - - - - - - - - - - - - - - - - - - - - - - - - - - - - - - - - - - - - - - - - - - - - - - - - - - - - - - - - - - - - - - - - - - - - - - - - - - - - - - - - - - - - - - - - - - - - - - - - - - - - - - - - - - - - - - - - - - - - - - - - - - - - - - - - - - - - - - - - - - - - - - - - - - - - - - - - - - - - - - - - - - - - - - - - - - - - - - - - - - - - - - - - - - - -
Accumulated depreciation:Balance at 1 January 2002 23,965 30,001 6,648 15,361 229 76,204Depreciation charge for the year 3,672 3,762 1,856 1,664 58 11,012Swap out to Sinopec Group Company (Note 39) (460) (125) — (68) — (653)Written back on disposal (562) (769) (232) (48) (61) (1,672)Balance at 31 December 2002 26,615 32,869 8,272 16,909 226 84,891--- - - - - - - - - - - - - - - - - - - - - - - - - - - - - - - - - - - - - - - - - - - - - - - - - - - - - - - - - - - - - - - - - - - - - - - - - - - - - - - - - - - - - - - - - - - - - - - - - - - - - - - - - - - - - - - - - - - - - - - - - - - - - - - - - - - - - - - - - - - - - - - - - - - - - - - - - - - - - - - - - - - - - - - - - - - - - - - - - - - - - - - - - - - - - - - - - - - - - - - - - - - - - - - - - - - - - - - - - - - - - - - - - - - - - - - - - - - - - - - - - - - - - - - - - - - - - - - - - - - - - - - - - - - - - -
Net book value:At 31 December 2002 26,487 35,712 39,965 13,618 1,032 116,814At 31 December 2001 22,783 34,391 33,023 14,948 618 105,763

NOTES ON THE FINANCIAL STATEMENTS (CONTINUED)for the year ended 31 December 2002
98
Fina
ncia
l A
ccou
ntin
g R
epor
t
11 FIXED ASSETS (Continued)
The Group - by asset class
Oil depots,storage Plant,
Oil tanks and machinery,Land and and gas service equipmentbuildings properties stations and others Total
RMB millions RMB millions RMB millions RMB millions RMB millionsCost/valuation:Balance at 1 January 2002 35,804 125,119 33,321 196,289 390,533Addition for the year 400 52 1,160 2,767 4,379Swap in from Sinopec Group Company (Note 39) — — 1,040 — 1,040Transferred from construction in progress 1,407 16,431 5,889 18,027 41,754Reclassification 1,077 295 (4,361) 2,989 —Swap out to Sinopec Group Company (Note 39) (185) (196) — (1,828) (2,209)Disposals (317) (769) (252) (2,768) (4,106)Balance at 31 December 2002 38,186 140,932 36,797 215,476 431,391--- - - - - - - - - - - - - - - - - - - - - - - - - - - - - - - - - - - - - - - - - - - - - - - - - - - - - - - - - - - - - - - - - - - - - - - - - - - - - - - - - - - - - - - - - - - - - - - - - - - - - - - - - - - - - - - - - - - - - - - - - - - - - - - - - - - - - - - - - - - - - - - - - - - - - - - - - - - - - - - - - - - - - - - - - - - - - - - - - - - - - - - - - - - - - - - - - - - - - - - - - - - - - - - - - - - - - - - - - - - - - - - - - - - - - - - - - - - - - - - - - - - - - - - - - - - - - - - - - - - - - - - - - - - - - -
Accumulated depreciation:Balance at 1 January 2002 13,226 69,055 5,902 88,857 177,040Depreciation charge for the year 1,589 9,900 1,387 13,451 26,327Reclassification 384 118 (748) 246 —Swap out to Sinopec Group Company (Note 39) (56) (51) — (705) (812)Written back on disposal (116) (667) (163) (2,007) (2,953)Balance at 31 December 2002 15,027 78,355 6,378 99,842 199,602--- - - - - - - - - - - - - - - - - - - - - - - - - - - - - - - - - - - - - - - - - - - - - - - - - - - - - - - - - - - - - - - - - - - - - - - - - - - - - - - - - - - - - - - - - - - - - - - - - - - - - - - - - - - - - - - - - - - - - - - - - - - - - - - - - - - - - - - - - - - - - - - - - - - - - - - - - - - - - - - - - - - - - - - - - - - - - - - - - - - - - - - - - - - - - - - - - - - - - - - - - - - - - - - - - - - - - - - - - - - - - - - - - - - - - - - - - - - - - - - - - - - - - - - - - - - - - - - - - - - - - - - - - - - - - -
Net book value:At 31 December 2002 23,159 62,577 30,419 115,634 231,789At 31 December 2001 22,578 56,064 27,419 107,432 213,493
The Company - by asset class
Oil depots,storage Plant,
Oil tanks and machinery,Land and and gas service equipmentbuildings properties stations and others Total
RMB millions RMB millions RMB millions RMB millions RMB millionsCost/valuation:Balance at 1 January 2002 17,221 39,869 32,397 92,480 181,967Addition for the year 316 52 1,132 2,352 3,852Swap in from Sinopec Group Company (Note 39) — — 1,040 — 1,040Transferred from construction in progress 1,024 6,899 5,708 5,333 18,964Reclassification 175 (380) (4,361) 4,566 —Swap out to Sinopec Group Company (Note 39) (91) (196) — (1,358) (1,645)Disposals (206) (272) (251) (1,744) (2,473)Balance at 31 December 2002 18,439 45,972 35,665 101,629 201,705--- - - - - - - - - - - - - - - - - - - - - - - - - - - - - - - - - - - - - - - - - - - - - - - - - - - - - - - - - - - - - - - - - - - - - - - - - - - - - - - - - - - - - - - - - - - - - - - - - - - - - - - - - - - - - - - - - - - - - - - - - - - - - - - - - - - - - - - - - - - - - - - - - - - - - - - - - - - - - - - - - - - - - - - - - - - - - - - - - - - - - - - - - - - - - - - - - - - - - - - - - - - - - - - - - - - - - - - - - - - - - - - - - - - - - - - - - - - - - - - - - - - - - - - - - - - - - - - - - - - - - - - - - - - - - -
Accumulated depreciation:Balance at 1 January 2002 5,651 22,196 5,828 42,529 76,204Depreciation charge for the year 836 3,174 1,315 5,687 11,012Reclassification 67 (165) (748) 846 —Swap out to Sinopec Group Company (Note 39) (36) (51) — (566) (653)Written back on disposal (89) (217) (163) (1,203) (1,672)Balance at 31 December 2002 6,429 24,937 6,232 47,293 84,891--- - - - - - - - - - - - - - - - - - - - - - - - - - - - - - - - - - - - - - - - - - - - - - - - - - - - - - - - - - - - - - - - - - - - - - - - - - - - - - - - - - - - - - - - - - - - - - - - - - - - - - - - - - - - - - - - - - - - - - - - - - - - - - - - - - - - - - - - - - - - - - - - - - - - - - - - - - - - - - - - - - - - - - - - - - - - - - - - - - - - - - - - - - - - - - - - - - - - - - - - - - - - - - - - - - - - - - - - - - - - - - - - - - - - - - - - - - - - - - - - - - - - - - - - - - - - - - - - - - - - - - - - - - - - - -
Net book value:At 31 December 2002 12,010 21,035 29,433 54,336 116,814At 31 December 2001 11,570 17,673 26,569 49,951 105,763
The fixed assets and construction in progress of the Group at 30 September 1999 were valued by registered valuers in the PRC. The valuation wasreviewed and approved by the MOF (Note 1). Surplus on revaluation was RMB 29,093 million and deficit on revaluation was RMB 3,210 million. Anet surplus on revaluation of RMB 25,883 million was resulted which has been incorporated in the Group’s financial statements since the yearended 31 December 1999.
In accordance with the relevant rules and regulations in respect of the acquisition of Sinopec National Star, the fixed assets and construction inprogress of Sinopec National Star have been valued by a firm of independent valuers in the PRC. Surplus on revaluation of RMB 541 million hasbeen incorporated in the Group’s financial statements since the year ended 31 December 2001.
At 31 December 2002, the carrying amounts of fixed assets that were pledged by the Group and the Company are RMB 146 million (2001: RMB233 million) and RMB 20 million (2001: RMB 104 million) respectively.

99
Fina
ncia
l A
ccou
ntin
g R
epor
t
11 FIXED ASSETS (Continued)
Provision for impairment losses on fixed assets are analysed as follows:
The Group andthe CompanyRMB millions
Balance at 1 January and 31 December 2002 391
The Group’s and the Company’s provision for impairment losses on fixed asset were with respect to the exploration and production segment for theyear ended 31 December 2002.
At 31 December 2002, the Group and the Company had no individually significant fixed assets which are temporarily idle or ready for disposal.
12 CONSTRUCTION MATERIALSAt 31 December 2002, the Group’s and the Company’s construction materials mainly represent the actual cost of materials such as steel andcopper to be used for construction projects.
13 CONSTRUCTION IN PROGRESS
The Group
Exploration Marketingand and
production Refining distribution Chemicals Others TotalRMB millions RMB millions RMB millions RMB millions RMB millions RMB millions
Balance at 1 January 2002 3,163 6,468 8,592 7,274 509 26,006Addition for the year 20,376 5,918 4,982 6,938 443 38,657Dry hole costs written off (1,771) — — — — (1,771)Swap out to Sinopec Group Company (Note 39) (6) (10) — — — (16)Transferred to fixed assets (17,236) (6,657) (6,286) (11,016) (559) (41,754)Balance at 31 December 2002 4,526 5,719 7,288 3,196 393 21,122
The interest rates at which borrowing costs were capitalised during the year by the Group was ranging from 3.1% to 6.2% p.a (2001: 3.4% to 8.0%p.a).
At 31 December 2002, major projects of the Group are as follows:
Balance at Balance at Percentage InterestBudgeted 1 January Additions 31 December of Source capitalised
Project name amount 2002 for the year 2002 completion of funding for the yearRMB millions RMB millions RMB millions RMB millions RMB millions
450,000 tonnes PTA Project 2,055 380 508 888 43% Bank loans & 29self-financing
Ningbo - Shanghai Pipeline Project 2,855 40 425 465 16% Bank loans & 1self-financing
PX United Project 1,201 93 317 410 34% Bank loans & 6self-financing
Union Equipment Reforming Project 399 18 301 319 80% Bank loans 4Zibo - Qingdao Gas Pipeline Project 360 — 281 281 78% Self-financing —
The Company
Exploration Marketingand and
production Refining distribution Chemicals Others TotalRMB millions RMB millions RMB millions RMB millions RMB millions RMB millions
Balance at 1 January 2002 1,893 5,046 8,346 728 468 16,481Addition for the year 9,653 3,660 4,806 382 343 18,844Dry hole costs written off (951) — — — — (951)Swap out to Sinopec Group Company (Note 39) (6) (10) — — — (16)Transferred to fixed assets (7,471) (4,571) (6,245) (242) (435) (18,964)Balance at 31 December 2002 3,118 4,125 6,907 868 376 15,394
The interest rates at which borrowing costs were capitalised during the year by the Company was ranging from 3.1% to 6.2% p.a (2001: 3.4% to8.0% p.a).

NOTES ON THE FINANCIAL STATEMENTS (CONTINUED)for the year ended 31 December 2002
10
0Fi
nanc
ial
Acc
ount
ing
Rep
ort
14 INTANGIBLE ASSETS
The Group
ExplorationComputer andSoftware Technical production
licence know-how right Others TotalRMB millions RMB millions RMB millions RMB millions RMB millions
Cost:Balance at 1 January 2002 296 993 3,163 100 4,552Addition for the year 72 316 — 73 461Disposals (37) (20) — (71) (128)Balance at 31 December 2002 331 1,289 3,163 102 4,885--- - - - - - - - - - - - - - - - - - - - - - - - - - - - - - - - - - - - - - - - - - - - - - - - - - - - - - - - - - - - - - - - - - - - - - - - - - - - - - - - - - - - - - - - - - - - - - - - - - - - - - - - - - - - - - - - - - - - - - - - - - - - - - - - - - - - - - - - - - - - - - - - - - - - - - - - - - - - - - - - - - - - - - - - - - - - - - - - - - - - - - - - - - - - - - - - - - - - - - - - - - - - - - - - - - - - - - - - - - - - - - - - - - - - - - - - - - - - - - - - - - - - - - - - - - - - - - - - - - - - - - - - - - - - - -
Accumulated Amortisation:Balance at 1 January 2002 38 367 117 53 575Amortisation charge for the year 29 122 117 18 286Written back on disposal (20) (2) — (16) (38)Balance at 31 December 2002 47 487 234 55 823--- - - - - - - - - - - - - - - - - - - - - - - - - - - - - - - - - - - - - - - - - - - - - - - - - - - - - - - - - - - - - - - - - - - - - - - - - - - - - - - - - - - - - - - - - - - - - - - - - - - - - - - - - - - - - - - - - - - - - - - - - - - - - - - - - - - - - - - - - - - - - - - - - - - - - - - - - - - - - - - - - - - - - - - - - - - - - - - - - - - - - - - - - - - - - - - - - - - - - - - - - - - - - - - - - - - - - - - - - - - - - - - - - - - - - - - - - - - - - - - - - - - - - - - - - - - - - - - - - - - - - - - - - - - - - -
Net book value:At 31 December 2002 284 802 2,929 47 4,062At 31 December 2001 258 626 3,046 47 3,977
Except for exploration and production right, the above intangible assets were acquired from third parties. The Company acquired Sinopec NationalStar together with the exploration and production right from Sinopec Group Company. The exploration and production right was valued withreference to the proved reserves of the associated oil fields. The amortisation period and remaining amortisation period of exploration andproduction right was 27 years and 25 years respectively. The amortisation periods of other intangible assets range from 4 to 10 years.
The Company
ExplorationComputer andSoftware Technical production
licence know-how right Others TotalRMB millions RMB millions RMB millions RMB millions RMB millions
Cost:Balance at 1 January 2002 156 918 3,163 43 4,280Addition for the year 46 101 — 23 170Disposals (31) (12) — (12) (55)Balance at 31 December 2002 171 1,007 3,163 54 4,395--- - - - - - - - - - - - - - - - - - - - - - - - - - - - - - - - - - - - - - - - - - - - - - - - - - - - - - - - - - - - - - - - - - - - - - - - - - - - - - - - - - - - - - - - - - - - - - - - - - - - - - - - - - - - - - - - - - - - - - - - - - - - - - - - - - - - - - - - - - - - - - - - - - - - - - - - - - - - - - - - - - - - - - - - - - - - - - - - - - - - - - - - - - - - - - - - - - - - - - - - - - - - - - - - - - - - - - - - - - - - - - - - - - - - - - - - - - - - - - - - - - - - - - - - - - - - - - - - - - - - - - - - - - - - - -
Accumulated Amortisation:Balance at 1 January 2002 24 358 117 28 527Amortisation charge for the year 15 95 117 10 237Written back on disposals (18) (1) — (9) (28)Balance at 31 December 2002 21 452 234 29 736--- - - - - - - - - - - - - - - - - - - - - - - - - - - - - - - - - - - - - - - - - - - - - - - - - - - - - - - - - - - - - - - - - - - - - - - - - - - - - - - - - - - - - - - - - - - - - - - - - - - - - - - - - - - - - - - - - - - - - - - - - - - - - - - - - - - - - - - - - - - - - - - - - - - - - - - - - - - - - - - - - - - - - - - - - - - - - - - - - - - - - - - - - - - - - - - - - - - - - - - - - - - - - - - - - - - - - - - - - - - - - - - - - - - - - - - - - - - - - - - - - - - - - - - - - - - - - - - - - - - - - - - - - - - - - -
Net book value:At 31 December 2002 150 555 2,929 25 3,659At 31 December 2001 132 560 3,046 15 3,753
Except for exploration and production right, the above intangible assets were acquired from third parties. The Company acquired Sinopec NationalStar together with the exploration and production right from Sinopec Group Company. The exploration and production right was valued withreference to the proved reserves of the associated oil fields. The amortisation period and remaining amortisation period of exploration andproduction right was 27 years and 25 years respectively. The amortisation periods of other intangible assets range from 4 to 10 years.

10
1Fi
nanc
ial
Acc
ount
ing
Rep
ort
15 DEFERRED TAX ASSETS AND LIABILITIES
The Group
Assets Liabilities Net balance2002 2001 2002 2001 2002 2001
RMB millions RMB millions RMB millions RMB millions RMB millions RMB millionsCurrentProvision primarily for receivables and inventories 264 423 — — 264 423Non-currentProperty, plant and equipment 47 35 (460) (671) (413) (636)Tax value of losses carried forward,
net of valuation allowance 30 173 — — 30 173Others 16 129 (14) (8) 2 121Deferred tax assets/(liabilities) 357 760 (474) (679) (117) 81
The Company
Assets Liabilities Net balance2002 2001 2002 2001 2002 2001
RMB millions RMB millions RMB millions RMB millions RMB millions RMB millionsCurrentProvision primarily for receivables and inventories 57 281 — — 57 281Non-currentProperty, plant and equipment 36 3 (54) (33) (18) (30)Others 15 53 (3) — 12 53Deferred tax assets/(liabilities) 108 337 (57) (33) 51 304
16 SHORT-TERM LOANSThe Group’s and the Company’s short-term loans represent:
The Group The Company2002 2001 2002 2001
RMB millions RMB millions RMB millions RMB millionsShort-term bank loans 22,839 34,424 12,514 23,460Short-term other loans 19 43 15 24Loans from Sinopec Group Company and fellow subsidiaries 4,121 3,448 2,299 2,622
26,979 37,915 14,828 26,106
The Group’s and the Company’s weighted average interest rate on short-term loans was 4.3% (2001: 5.1%) and 4.2% (2001: 5.1%) respectively at31 December 2002. The majority of the above loans are unsecured.
The Group and the Company had no overdue short-term loan at 31 December 2002 (2001: nil).
17 BILLS PAYABLEBills payable primarily represented the bank accepted bills for the purchase of material, goods and products. The repayment term is normally fromthree to six months.
18 TRADE ACCOUNTS PAYABLEThe ageing analysis of trade accounts payable are as follows:
The Group
2002 2001RMB millions % RMB millions %
Within 3 months 11,058 57.6 12,494 74.4Between 3 and 6 months 5,688 29.6 1,866 11.1Over 6 months 2,466 12.8 2,433 14.5
19,212 100.0 16,793 100.0
The Company
2002 2001RMB millions % RMB millions %
Within 3 months 13,975 76.3 9,735 76.5Between 3 and 6 months 2,588 14.2 1,313 10.3Over 6 months 1,747 9.5 1,679 13.2
18,310 100.0 12,727 100.0
Except for the balances disclosed in Note 39, there is no amount due to shareholders who hold 5% or more voting right of the Company included inthe balance of trade accounts payable.
At 31 December 2002, the Group and the Company had no individually significant trade accounts payable aged over three years.
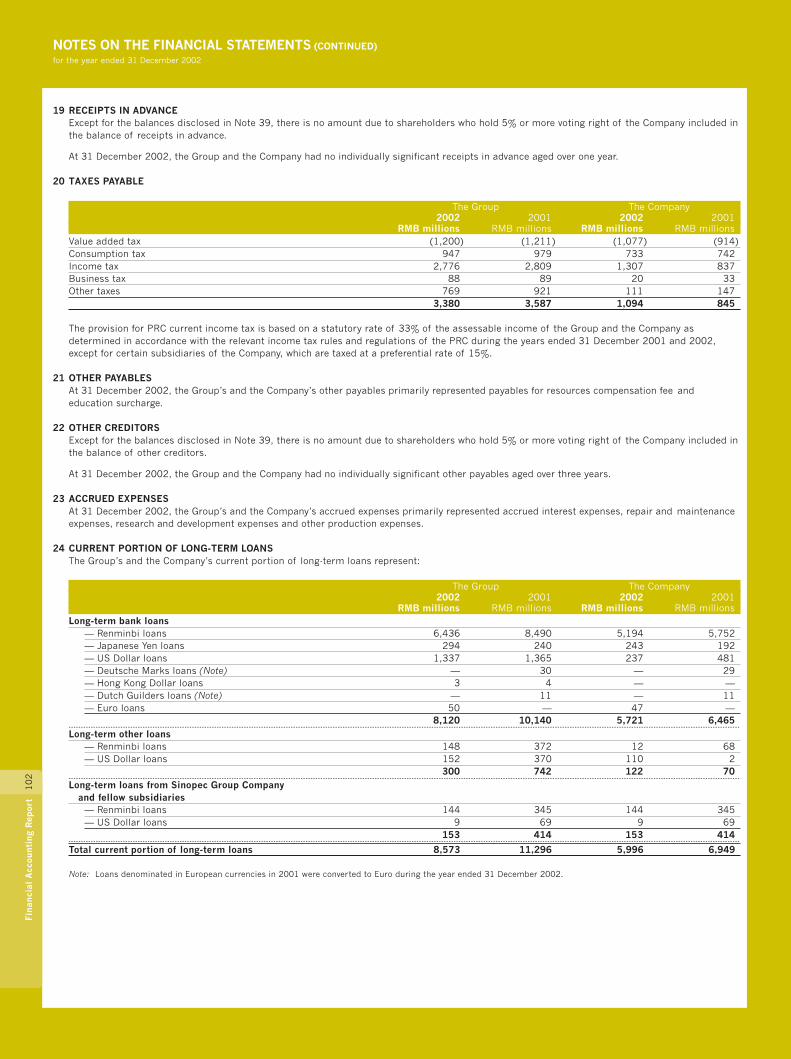
NOTES ON THE FINANCIAL STATEMENTS (CONTINUED)for the year ended 31 December 2002
10
2Fi
nanc
ial
Acc
ount
ing
Rep
ort
19 RECEIPTS IN ADVANCEExcept for the balances disclosed in Note 39, there is no amount due to shareholders who hold 5% or more voting right of the Company included inthe balance of receipts in advance.
At 31 December 2002, the Group and the Company had no individually significant receipts in advance aged over one year.
20 TAXES PAYABLE
The Group The Company2002 2001 2002 2001
RMB millions RMB millions RMB millions RMB millionsValue added tax (1,200) (1,211) (1,077) (914)Consumption tax 947 979 733 742Income tax 2,776 2,809 1,307 837Business tax 88 89 20 33Other taxes 769 921 111 147
3,380 3,587 1,094 845
The provision for PRC current income tax is based on a statutory rate of 33% of the assessable income of the Group and the Company asdetermined in accordance with the relevant income tax rules and regulations of the PRC during the years ended 31 December 2001 and 2002,except for certain subsidiaries of the Company, which are taxed at a preferential rate of 15%.
21 OTHER PAYABLESAt 31 December 2002, the Group’s and the Company’s other payables primarily represented payables for resources compensation fee andeducation surcharge.
22 OTHER CREDITORSExcept for the balances disclosed in Note 39, there is no amount due to shareholders who hold 5% or more voting right of the Company included inthe balance of other creditors.
At 31 December 2002, the Group and the Company had no individually significant other payables aged over three years.
23 ACCRUED EXPENSESAt 31 December 2002, the Group’s and the Company’s accrued expenses primarily represented accrued interest expenses, repair and maintenanceexpenses, research and development expenses and other production expenses.
24 CURRENT PORTION OF LONG-TERM LOANSThe Group’s and the Company’s current portion of long-term loans represent:
The Group The Company2002 2001 2002 2001
RMB millions RMB millions RMB millions RMB millionsLong-term bank loans
— Renminbi loans 6,436 8,490 5,194 5,752— Japanese Yen loans 294 240 243 192— US Dollar loans 1,337 1,365 237 481— Deutsche Marks loans (Note) — 30 — 29— Hong Kong Dollar loans 3 4 — —— Dutch Guilders loans (Note) — 11 — 11— Euro loans 50 — 47 —
8,120 10,140 5,721 6,465--- - - - - - - - - - - - - - - - - - - - - - - - - - - - - - - - - - - - - - - - - - - - - - - - - - - - - - - - - - - - - - - - - - - - - - - - - - - - - - - - - - - - - - - - - - - - - - - - - - - - - - - - - - - - - - - - - - - - - - - - - - - - - - - - - - - - - - - - - - - - - - - - - - - - - - - - - - - - - - - - - - - - - - - - - - - - - - - - - - - - - - - - - - - - - - - - - - - - - - - - - - - - - - - - - - - - - - - - - - - - - - - - - - - - - - - - - - - - - - - - - - - - - - - - - - - - - - - - - - - - - - - - - - - - - -
Long-term other loans— Renminbi loans 148 372 12 68— US Dollar loans 152 370 110 2
300 742 122 70--- - - - - - - - - - - - - - - - - - - - - - - - - - - - - - - - - - - - - - - - - - - - - - - - - - - - - - - - - - - - - - - - - - - - - - - - - - - - - - - - - - - - - - - - - - - - - - - - - - - - - - - - - - - - - - - - - - - - - - - - - - - - - - - - - - - - - - - - - - - - - - - - - - - - - - - - - - - - - - - - - - - - - - - - - - - - - - - - - - - - - - - - - - - - - - - - - - - - - - - - - - - - - - - - - - - - - - - - - - - - - - - - - - - - - - - - - - - - - - - - - - - - - - - - - - - - - - - - - - - - - - - - - - - - - -
Long-term loans from Sinopec Group Companyand fellow subsidiaries
— Renminbi loans 144 345 144 345— US Dollar loans 9 69 9 69
153 414 153 414--- - - - - - - - - - - - - - - - - - - - - - - - - - - - - - - - - - - - - - - - - - - - - - - - - - - - - - - - - - - - - - - - - - - - - - - - - - - - - - - - - - - - - - - - - - - - - - - - - - - - - - - - - - - - - - - - - - - - - - - - - - - - - - - - - - - - - - - - - - - - - - - - - - - - - - - - - - - - - - - - - - - - - - - - - - - - - - - - - - - - - - - - - - - - - - - - - - - - - - - - - - - - - - - - - - - - - - - - - - - - - - - - - - - - - - - - - - - - - - - - - - - - - - - - - - - - - - - - - - - - - - - - - - - - - -
Total current portion of long-term loans 8,573 11,296 5,996 6,949
Note: Loans denominated in European currencies in 2001 were converted to Euro during the year ended 31 December 2002.

10
3Fi
nanc
ial
Acc
ount
ing
Rep
ort
25 LONG-TERM LOANSThe Group’s and the Company’s long-term loans represent:
The Group The CompanyInterest rate and final maturity 2002 2001 2002 2001
RMB millions RMB millions RMB millions RMB millionsThird parties debtsLong-term bank loansRenminbi loans Interest rates ranging from
interest free to 11.2% per annumat 31 December 2002with maturities through 2013 36,855 32,231 25,884 21,473
Japanese Yen loans Interest rates ranging from0.2% to 7.3% per annumat 31 December 2002with maturities through 2024 2,373 2,401 2,280 2,272
US Dollar loans Interest rates ranging frominterest free to 7.9% per annumat 31 December 2002with maturities through 2031 4,294 4,300 1,323 1,884
Deutsche Marks loans Fixed rates ranging from6.6% to 6.8% per annumat 31 December 2001which was converted toEuro denominated during 2002 — 151 — 144
Dutch Guilders loans Fixed rate at 7.9% per annumat 31 December 2001which was converted toEuro denominated during 2002 — 28 — 28
Hong Kong Dollar loans Floating rate at Hong Kong Prime Rateper annum plus 0.25%with maturities through 2006 10 14 — —
Euro loans Fixed rates ranging from6.0% to 7.9% per annumat 31 December 2002with maturities through 2006 162 — 155 —
Less: Current portion 8,120 10,140 5,721 6,465Long-term bank loans 35,574 28,985 23,921 19,336Other long-term loansRenminbi loans Interest rates ranging from
interest free to 7.5% per annumat 31 December 2002with maturities through 2015 277 596 61 123
US Dollar loans Interest rates ranging frominterest free to 3.4% per annumat 31 December 2002with maturities through 2015 438 522 398 34
French Francs loans Interest rates ranging from1.8% to 8.1% per annumat 31 December 2001which was converted toEuro denominated during 2002 — 15 — 15
Euro loans Interest rates ranging from1.8% to 8.1% per annumat 31 December 2002with maturities through 2025 16 — 16 —
Less: Current portion 300 742 122 70Other long-term loans 431 391 353 102Long-term loans from Sinopec Group Company and fellow subsidiariesRenminbi loans Interest free with maturity in 2020 35,561 35,561 35,561 35,561Renminbi loans Interest rates ranging from
5.0% to 6.0% per annumat 31 December 2002with maturities through 2007 2,272 796 2,187 790
US Dollar loans Interest rates ranging from2.4% to 2.8% per annumat 31 December 2002with maturities through 2006 23 182 21 180
Less: Current portion 153 414 153 414Long-term loans from Sinopec Group Company and fellow subsidiaries 37,703 36,125 37,616 36,117
73,708 65,501 61,890 55,555

NOTES ON THE FINANCIAL STATEMENTS (CONTINUED)for the year ended 31 December 2002
10
4Fi
nanc
ial
Acc
ount
ing
Rep
ort
25 LONG-TERM LOANS (Continued)The maturity analysis of the Group’s and the Company’s long-term loans are as follows:
The Group The Company2002 2001 2002 2001
RMB millions RMB millions RMB millions RMB millionsBetween one to two years 7,177 10,383 3,876 6,043Between two to five years 25,564 13,108 17,458 7,931After five years 40,967 42,010 40,556 41,581Total long-term loans 73,708 65,501 61,890 55,555
At 31 December 2002, the Group and the Company had secured loans from third parties amounting to RMB 85 million (2001: RMB 171 million)and RMB 23 million (2001: RMB 76 million) respectively.
Except for the balances disclosed in Note 39, there is no amount due to shareholders who held 5% or more voting right of the Company included inthe balance of long term loans.
26 DEBENTURES PAYABLE
The GroupInterest rate and final maturity 2002 2001
RMB millions RMB millionsConvertible bonds Fixed rate at 2.2% per annum at 31 December 2002
and redeemable in July 2004 1,500 1,500
Convertible bonds amounting to RMB 1,500 million were issued by a subsidiary of the Group on 28 July 1999. The bonds are convertible upon aninitial public offering (“IPO”) into ordinary shares of the subsidiary from the date of IPO to 27 July 2004.
27 OTHER LONG-TERM PAYABLESOther long-term payables primarily represent provision for future dismantlement of oil and gas properties, the costs arising from environmentalrestoration and specific research and development projects.
28 SHARE CAPITAL
The Group and the Company2002 2001
RMB millions RMB millionsRegistered, issued and fully paid:67,121,951,000 domestic state-owned A shares of RMB 1.00 each 67,122 67,12216,780,488,000 H shares of RMB 1.00 each 16,780 16,7802,800,000,000 A shares of RMB 1.00 each 2,800 2,800
86,702 86,702
The Company was established on 25 February 2000 with a registered capital of 68.8 billion state-owned domestic shares with a par value of RMB1.00 each, which were all held by Sinopec Group Company (see Note 1).
Pursuant to the resolutions passed in an extraordinary general meeting of the Company held on 25 July 2000 and the approval from relevantauthorities, the Company issued 15,102,439,000 H shares with a par value of RMB 1.00 each in its initial global offering in October 2000. Theshares include 12,521,864,000 H shares and 25,805,750 American depositary shares (“ADSs”, each representing 100 H shares) at prices of HK$1.59 and US$ 20.645 respectively. As part of the offering, 1,678,049,000 shares were offered in placing to Hong Kong and overseas investors.
According to Sinopec Group Company’s debt-to-equity arrangement, some of the Company’s shares held by Sinopec Group Company weretransferred to the following state-owned bank and asset management companies. Pursuant to the notice Cai Qi [2000] No. 261 issued by MOF, theCompany, having made its global offer of H shares, adjusted the price of shares to be transferred to the following entities, based on the issue priceof the H shares, in connection with the debt-to-equity arrangement and the proportion of its state-owned shares. As a result, shares of theCompany held by the State Development Bank of China, China Cinda Asset Management Corporation, China Orient Asset Management Corporation,China Huarong Asset Management Corporation are 8,775,570,000 shares, 8,720,650,000 shares, 1,296,410,000 shares and 586,760,000 sharesrespectively. Shares of the Company held by Sinopec Group Company was adjusted to 47,742,600,000 shares accordingly. Such arrangement wasapproved by MOF in Cai Qi [2000] No. 754 “Comments on the issues relating to the management of the state-owned equity in China Petroleum andChemical Corporation”.
In July 2001, the Company issued 2,800,000,000 domestic listed A shares with a par value of RMB 1.00 each at RMB 4.22.
All the domestic state-owned ordinary shares and H shares rank pari passu in all material respects.
KPMG Huazhen had verified the above paid-in capital. The capital verification reports, KPMG-C (2000) CV No. 0007, KPMG-C (2001) CV No. 0002and KPMG-C (2001) CV No.0006 were issued on 22 February 2000, 27 February 2001 and 23 July 2001 respectively.

10
5Fi
nanc
ial
Acc
ount
ing
Rep
ort
29 CAPITAL RESERVEThe movements in capital reserve are as follows:
The Group and the Company2002 2001
RMB millions RMB millionsBalance at 1 January 36,297 27,449Share premium from issuance of share — 9,016Less: Underwriting and issuing expenses — 168Government grants 291 —Balance at 31 December 36,588 36,297
During the year ended 31 December 2002, the Group received subsidy on investments amounted to RMB 291 million, pursuant to Guo Jing MaoTou Zi [2002] No. 847 “Notice on the State’s Key Technology Reform on Project Fund Plan regarding the Third Batch of State Debt’s Special Fundin 2002" issued by MOF. This fund is used for technology improvement projects.
30 SURPLUS RESERVESMovements in statutory surplus reserve and statutory public welfare fund are as follows:
The Group and the CompanyStatutory Statutory Discretionary
surplus public surplusreserve welfare fund reserve Total
RMB millions RMB millions RMB millions RMB millionsBalance at 1 January 2001 1,615 1,615 — 3,230Appropriation of net profit 1,402 1,402 — 2,804Balance at 31 December 2001 3,017 3,017 — 6,034Balance at 1 January 2002 3,017 3,017 — 6,034Appropriation of net profit 1,412 1,412 7,000 9,824Balance at 31 December 2002 4,429 4,429 7,000 15,858
The Articles of Association of the Company and the following profit appropriation plans had been approved at the Extraordinary General Meetingheld on 25 July 2000:
(a) 10% of the net profit is transferred to the statutory surplus reserve;
(b) 5% to 10% of the net profit is transferred to the statutory public welfare fund;
(c) after the transfer to the statutory surplus reserve, a transfer to discretionary surplus reserve can be made upon the passing of a resolution atthe Annual General Meeting.
31 INCOME FROM PRINCIPAL OPERATIONSThe income from principal operations represents revenue from sales of crude oil, natural gas, petroleum and chemical products net of value addedtax. The Group’s segmental information is set out in note 43.
For the year ended 31 December 2002, revenue from sales to top five customers are RMB 51,896 million (2001: RMB 51,372 million) whichaccounts for 16% (2001: 17%) of income from principal operations of the Group.
32 SALES TAX AND SURCHARGES
The Group The Company2002 2001 2002 2001
RMB millions RMB millions RMB millions RMB millionsConsumption tax 8,823 9,025 5,909 6,088City construction tax 1,636 1,615 896 820Education surcharge 782 707 420 396Resources tax 499 406 96 106Business tax 112 110 60 78
11,852 11,863 7,381 7,488
33 FINANCIAL EXPENSES
The Group The Company2002 2001 2002 2001
RMB millions RMB millions RMB millions RMB millionsInterest expenses incurred 4,951 5,692 3,060 3,372Less: Capitalised interest expenses 551 542 271 378Financial expenses-interest expenses 4,400 5,150 2,789 2,994Interest income (338) (1,183) (200) (824)Foreign exchange losses 312 222 235 45Foreign exchange gains (47) (593) (31) (356)
4,327 3,596 2,793 1,859

NOTES ON THE FINANCIAL STATEMENTS (CONTINUED)for the year ended 31 December 2002
10
6Fi
nanc
ial
Acc
ount
ing
Rep
ort
34 EXPLORATION EXPENSESExploration expenses include geological and geophysical expenses and write off of dry hole costs.
35 INVESTMENT INCOME
The Group The Company2002 2001 2002 2001
RMB millions RMB millions RMB millions RMB millionsInvestment income accounted for under the cost method 190 199 16 37Investment income accounted for under the equity method 315 347 15,564 19,292
505 546 15,580 19,329
36 NON-OPERATING EXPENSES
The Group The Company2002 2001 2002 2001
RMB millions RMB millions RMB millions RMB millionsLoss on disposal of fixed assets 748 323 469 165Fines, penalties and compensation 74 87 71 83Donation 66 62 38 23Employee reduction expenses (i) 244 2,546 244 1,767Others 511 490 320 315
1,643 3,508 1,142 2,353
(i) During the year ended 31 December 2002, in connection with the assets swap agreement between the Company and Sinopec Group Company(Note 39), the Company made payment of RMB 244 million related to approximately 11,000 employees that were transferred to Sinopec GroupCompany.
In accordance with the Group’s voluntary employee reduction plan, the Group recorded employee reduction expenses of RMB 2,546 millionduring the year ended 31 December 2001 in respect of the voluntary termination and the transfer to Sinopec Group Company totallingapproximately 68,000 employees. The RMB 2,546 million expense included approximately RMB 1,245 million paid to employees that acceptedoffers to transfer to Sinopec Group Company. As at 31 December 2001, all payments to these employees have been made by the Group. Foremployees that were transferred to Sinopec Group Company, the employees were entitled to receive termination benefits from Sinopec GroupCompany to the extent that their employment was subsequently terminated.
37 INCOME TAX
The Group The Company2002 2001 2002 2001
RMB millions RMB millions RMB millions RMB millionsProvision for PRC income tax 6,611 6,445 6,250 6,455Deferred taxation 198 647 253 430
6,809 7,092 6,503 6,885
38 DIVIDENDSPursuant to the shareholder’s approval at the Annual General Meeting on 13 June 2002, the Board of Directors was authorised to declare theinterim dividends for the year ended 2002. According to the resolution passed at the Director’s meeting on 16 August 2002, an interim dividend ofRMB 0.02 (2001: nil) per share totalling RMB 1,734 million (2001: nil) was declared.
Pursuant to a resolution passed at the Director’s meeting on 28 March 2003, a final dividend of RMB 0.06 per share (2001: RMB 0.08 per share)totalling RMB 5,202 million (2001: RMB 6,936 million) was proposed for shareholders’ approval at the Annual General Meeting.
Final dividend for the year ended 31 December 2002 has provided for in the financial statements.
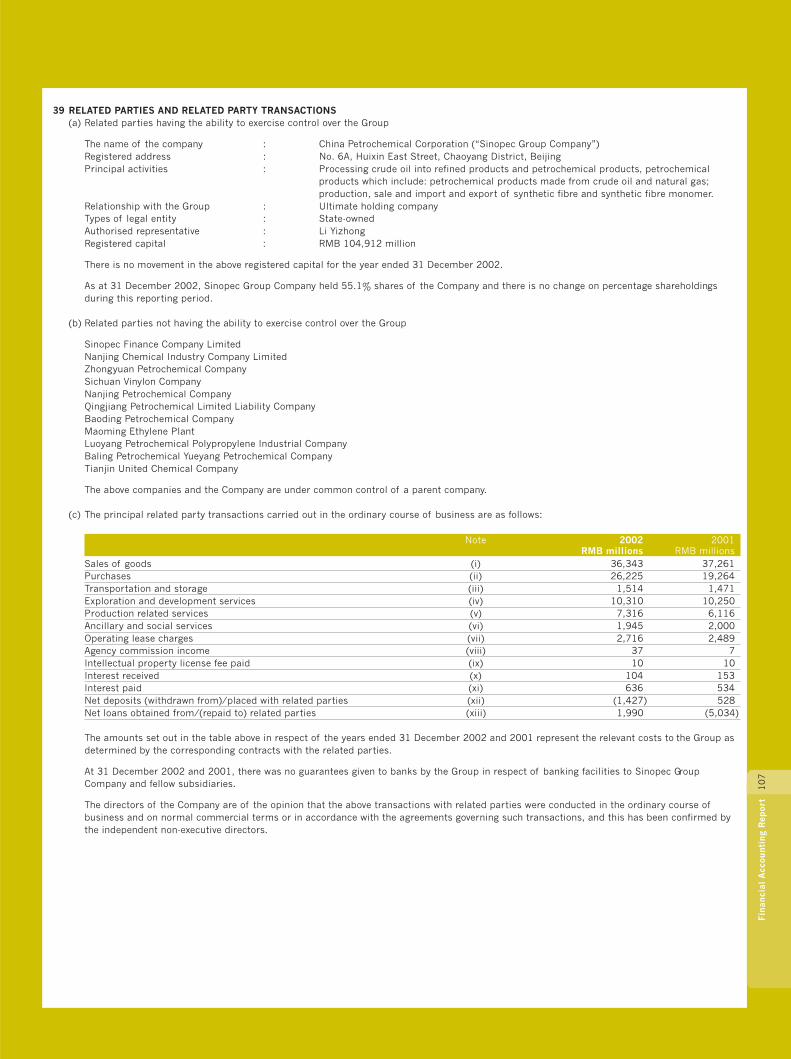
10
7Fi
nanc
ial
Acc
ount
ing
Rep
ort
39 RELATED PARTIES AND RELATED PARTY TRANSACTIONS(a) Related parties having the ability to exercise control over the Group
The name of the company : China Petrochemical Corporation (“Sinopec Group Company”)Registered address : No. 6A, Huixin East Street, Chaoyang District, BeijingPrincipal activities : Processing crude oil into refined products and petrochemical products, petrochemical
products which include: petrochemical products made from crude oil and natural gas;production, sale and import and export of synthetic fibre and synthetic fibre monomer.
Relationship with the Group : Ultimate holding companyTypes of legal entity : State-ownedAuthorised representative : Li YizhongRegistered capital : RMB 104,912 million
There is no movement in the above registered capital for the year ended 31 December 2002.
As at 31 December 2002, Sinopec Group Company held 55.1% shares of the Company and there is no change on percentage shareholdingsduring this reporting period.
(b) Related parties not having the ability to exercise control over the Group
Sinopec Finance Company LimitedNanjing Chemical Industry Company LimitedZhongyuan Petrochemical CompanySichuan Vinylon CompanyNanjing Petrochemical CompanyQingjiang Petrochemical Limited Liability CompanyBaoding Petrochemical CompanyMaoming Ethylene PlantLuoyang Petrochemical Polypropylene Industrial CompanyBaling Petrochemical Yueyang Petrochemical CompanyTianjin United Chemical Company
The above companies and the Company are under common control of a parent company.
(c) The principal related party transactions carried out in the ordinary course of business are as follows:
Note 2002 2001RMB millions RMB millions
Sales of goods (i) 36,343 37,261Purchases (ii) 26,225 19,264Transportation and storage (iii) 1,514 1,471Exploration and development services (iv) 10,310 10,250Production related services (v) 7,316 6,116Ancillary and social services (vi) 1,945 2,000Operating lease charges (vii) 2,716 2,489Agency commission income (viii) 37 7Intellectual property license fee paid (ix) 10 10Interest received (x) 104 153Interest paid (xi) 636 534Net deposits (withdrawn from)/placed with related parties (xii) (1,427) 528Net loans obtained from/(repaid to) related parties (xiii) 1,990 (5,034)
The amounts set out in the table above in respect of the years ended 31 December 2002 and 2001 represent the relevant costs to the Group asdetermined by the corresponding contracts with the related parties.
At 31 December 2002 and 2001, there was no guarantees given to banks by the Group in respect of banking facilities to Sinopec GroupCompany and fellow subsidiaries.
The directors of the Company are of the opinion that the above transactions with related parties were conducted in the ordinary course ofbusiness and on normal commercial terms or in accordance with the agreements governing such transactions, and this has been confirmed bythe independent non-executive directors.
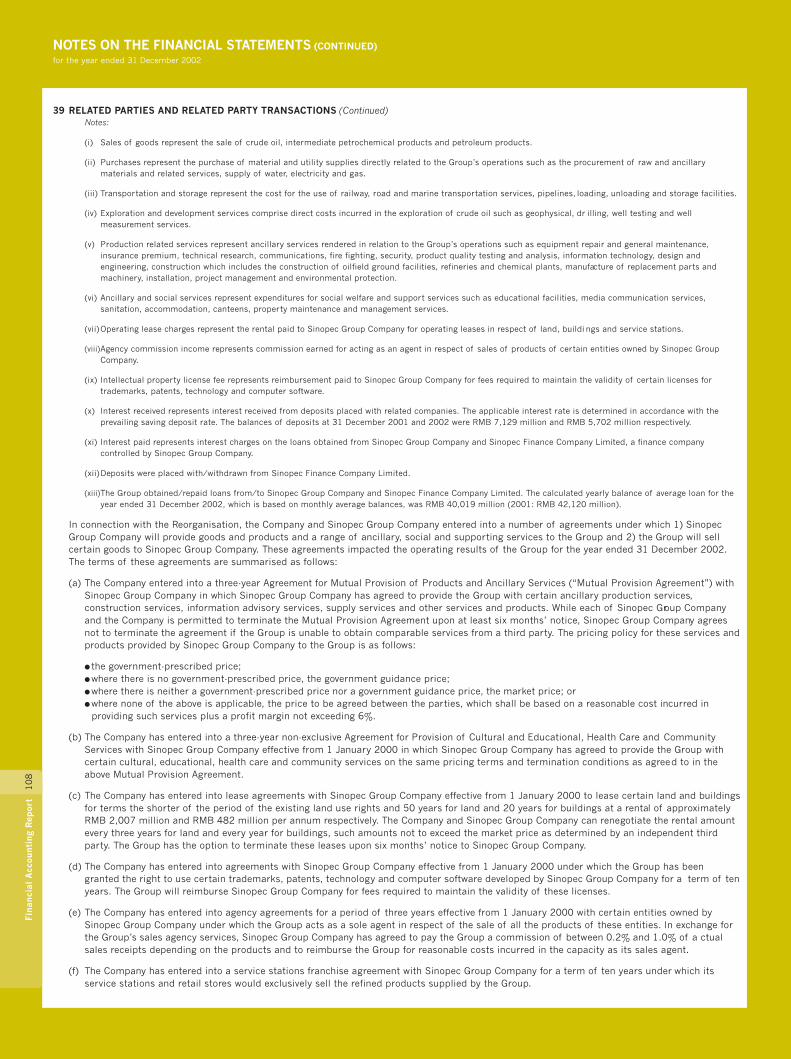
NOTES ON THE FINANCIAL STATEMENTS (CONTINUED)for the year ended 31 December 2002
10
8Fi
nanc
ial
Acc
ount
ing
Rep
ort
39 RELATED PARTIES AND RELATED PARTY TRANSACTIONS (Continued)Notes:
(i) Sales of goods represent the sale of crude oil, intermediate petrochemical products and petroleum products.
(ii) Purchases represent the purchase of material and utility supplies directly related to the Group’s operations such as the procurement of raw and ancillarymaterials and related services, supply of water, electricity and gas.
(iii) Transportation and storage represent the cost for the use of railway, road and marine transportation services, pipelines, loading, unloading and storage facilities.
(iv) Exploration and development services comprise direct costs incurred in the exploration of crude oil such as geophysical, drilling, well testing and wellmeasurement services.
(v) Production related services represent ancillary services rendered in relation to the Group’s operations such as equipment repair and general maintenance,insurance premium, technical research, communications, fire fighting, security, product quality testing and analysis, information technology, design andengineering, construction which includes the construction of oilfield ground facilities, refineries and chemical plants, manufacture of replacement parts andmachinery, installation, project management and environmental protection.
(vi) Ancillary and social services represent expenditures for social welfare and support services such as educational facilities, media communication services,sanitation, accommodation, canteens, property maintenance and management services.
(vii)Operating lease charges represent the rental paid to Sinopec Group Company for operating leases in respect of land, buildings and service stations.
(viii)Agency commission income represents commission earned for acting as an agent in respect of sales of products of certain entities owned by Sinopec GroupCompany.
(ix) Intellectual property license fee represents reimbursement paid to Sinopec Group Company for fees required to maintain the validity of certain licenses fortrademarks, patents, technology and computer software.
(x) Interest received represents interest received from deposits placed with related companies. The applicable interest rate is determined in accordance with theprevailing saving deposit rate. The balances of deposits at 31 December 2001 and 2002 were RMB 7,129 million and RMB 5,702 million respectively.
(xi) Interest paid represents interest charges on the loans obtained from Sinopec Group Company and Sinopec Finance Company Limited, a finance companycontrolled by Sinopec Group Company.
(xii)Deposits were placed with/withdrawn from Sinopec Finance Company Limited.
(xiii)The Group obtained/repaid loans from/to Sinopec Group Company and Sinopec Finance Company Limited. The calculated yearly balance of average loan for theyear ended 31 December 2002, which is based on monthly average balances, was RMB 40,019 million (2001: RMB 42,120 million).
In connection with the Reorganisation, the Company and Sinopec Group Company entered into a number of agreements under which 1) SinopecGroup Company will provide goods and products and a range of ancillary, social and supporting services to the Group and 2) the Group will sellcertain goods to Sinopec Group Company. These agreements impacted the operating results of the Group for the year ended 31 December 2002.The terms of these agreements are summarised as follows:
(a) The Company entered into a three-year Agreement for Mutual Provision of Products and Ancillary Services (“Mutual Provision Agreement”) withSinopec Group Company in which Sinopec Group Company has agreed to provide the Group with certain ancillary production services,construction services, information advisory services, supply services and other services and products. While each of Sinopec Group Companyand the Company is permitted to terminate the Mutual Provision Agreement upon at least six months’ notice, Sinopec Group Company agreesnot to terminate the agreement if the Group is unable to obtain comparable services from a third party. The pricing policy for these services andproducts provided by Sinopec Group Company to the Group is as follows:
� the government-prescribed price;� where there is no government-prescribed price, the government guidance price;� where there is neither a government-prescribed price nor a government guidance price, the market price; or� where none of the above is applicable, the price to be agreed between the parties, which shall be based on a reasonable cost incurred in
providing such services plus a profit margin not exceeding 6%.
(b) The Company has entered into a three-year non-exclusive Agreement for Provision of Cultural and Educational, Health Care and CommunityServices with Sinopec Group Company effective from 1 January 2000 in which Sinopec Group Company has agreed to provide the Group withcertain cultural, educational, health care and community services on the same pricing terms and termination conditions as agreed to in theabove Mutual Provision Agreement.
(c) The Company has entered into lease agreements with Sinopec Group Company effective from 1 January 2000 to lease certain land and buildingsfor terms the shorter of the period of the existing land use rights and 50 years for land and 20 years for buildings at a rental of approximatelyRMB 2,007 million and RMB 482 million per annum respectively. The Company and Sinopec Group Company can renegotiate the rental amountevery three years for land and every year for buildings, such amounts not to exceed the market price as determined by an independent thirdparty. The Group has the option to terminate these leases upon six months’ notice to Sinopec Group Company.
(d) The Company has entered into agreements with Sinopec Group Company effective from 1 January 2000 under which the Group has beengranted the right to use certain trademarks, patents, technology and computer software developed by Sinopec Group Company for a term of tenyears. The Group will reimburse Sinopec Group Company for fees required to maintain the validity of these licenses.
(e) The Company has entered into agency agreements for a period of three years effective from 1 January 2000 with certain entities owned bySinopec Group Company under which the Group acts as a sole agent in respect of the sale of all the products of these entities. In exchange forthe Group’s sales agency services, Sinopec Group Company has agreed to pay the Group a commission of between 0.2% and 1.0% of actualsales receipts depending on the products and to reimburse the Group for reasonable costs incurred in the capacity as its sales agent.
(f) The Company has entered into a service stations franchise agreement with Sinopec Group Company for a term of ten years under which itsservice stations and retail stores would exclusively sell the refined products supplied by the Group.
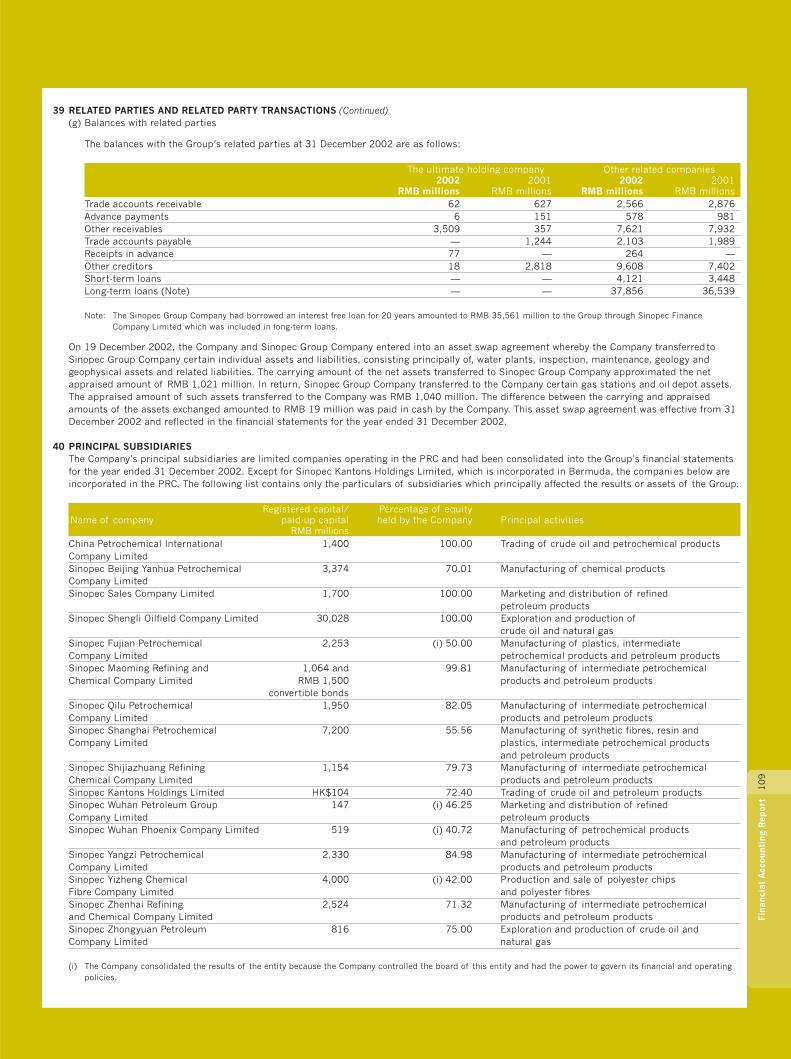
10
9Fi
nanc
ial
Acc
ount
ing
Rep
ort
39 RELATED PARTIES AND RELATED PARTY TRANSACTIONS (Continued)(g) Balances with related parties
The balances with the Group’s related parties at 31 December 2002 are as follows:
The ultimate holding company Other related companies2002 2001 2002 2001
RMB millions RMB millions RMB millions RMB millionsTrade accounts receivable 62 627 2,566 2,876Advance payments 6 151 578 981Other receivables 3,509 357 7,621 7,932Trade accounts payable — 1,244 2,103 1,989Receipts in advance 77 — 264 —Other creditors 18 2,818 9,608 7,402Short-term loans — — 4,121 3,448Long-term loans (Note) — — 37,856 36,539
Note: The Sinopec Group Company had borrowed an interest free loan for 20 years amounted to RMB 35,561 million to the Group through Sinopec FinanceCompany Limited which was included in long-term loans.
On 19 December 2002, the Company and Sinopec Group Company entered into an asset swap agreement whereby the Company transferred toSinopec Group Company certain individual assets and liabilities, consisting principally of, water plants, inspection, maintenance, geology andgeophysical assets and related liabilities. The carrying amount of the net assets transferred to Sinopec Group Company approximated the netappraised amount of RMB 1,021 million. In return, Sinopec Group Company transferred to the Company certain gas stations and oil depot assets.The appraised amount of such assets transferred to the Company was RMB 1,040 million. The difference between the carrying and appraisedamounts of the assets exchanged amounted to RMB 19 million was paid in cash by the Company. This asset swap agreement was effective from 31December 2002 and reflected in the financial statements for the year ended 31 December 2002.
40 PRINCIPAL SUBSIDIARIESThe Company’s principal subsidiaries are limited companies operating in the PRC and had been consolidated into the Group’s financial statementsfor the year ended 31 December 2002. Except for Sinopec Kantons Holdings Limited, which is incorporated in Bermuda, the companies below areincorporated in the PRC. The following list contains only the particulars of subsidiaries which principally affected the results or assets of the Group.
Registered capital/ Percentage of equityName of company paid-up capital held by the Company Principal activities
RMB millionsChina Petrochemical International 1,400 100.00 Trading of crude oil and petrochemical productsCompany LimitedSinopec Beijing Yanhua Petrochemical 3,374 70.01 Manufacturing of chemical productsCompany LimitedSinopec Sales Company Limited 1,700 100.00 Marketing and distribution of refined
petroleum productsSinopec Shengli Oilfield Company Limited 30,028 100.00 Exploration and production of
crude oil and natural gasSinopec Fujian Petrochemical 2,253 (i) 50.00 Manufacturing of plastics, intermediateCompany Limited petrochemical products and petroleum productsSinopec Maoming Refining and 1,064 and 99.81 Manufacturing of intermediate petrochemicalChemical Company Limited RMB 1,500 products and petroleum products
convertible bondsSinopec Qilu Petrochemical 1,950 82.05 Manufacturing of intermediate petrochemicalCompany Limited products and petroleum productsSinopec Shanghai Petrochemical 7,200 55.56 Manufacturing of synthetic fibres, resin andCompany Limited plastics, intermediate petrochemical products
and petroleum productsSinopec Shijiazhuang Refining 1,154 79.73 Manufacturing of intermediate petrochemicalChemical Company Limited products and petroleum productsSinopec Kantons Holdings Limited HK$104 72.40 Trading of crude oil and petroleum productsSinopec Wuhan Petroleum Group 147 (i) 46.25 Marketing and distribution of refinedCompany Limited petroleum productsSinopec Wuhan Phoenix Company Limited 519 (i) 40.72 Manufacturing of petrochemical products
and petroleum productsSinopec Yangzi Petrochemical 2,330 84.98 Manufacturing of intermediate petrochemicalCompany Limited products and petroleum productsSinopec Yizheng Chemical 4,000 (i) 42.00 Production and sale of polyester chipsFibre Company Limited and polyester fibresSinopec Zhenhai Refining 2,524 71.32 Manufacturing of intermediate petrochemicaland Chemical Company Limited products and petroleum productsSinopec Zhongyuan Petroleum 816 75.00 Exploration and production of crude oil andCompany Limited natural gas
(i) The Company consolidated the results of the entity because the Company controlled the board of this entity and had the power to govern its financial and operatingpolicies.
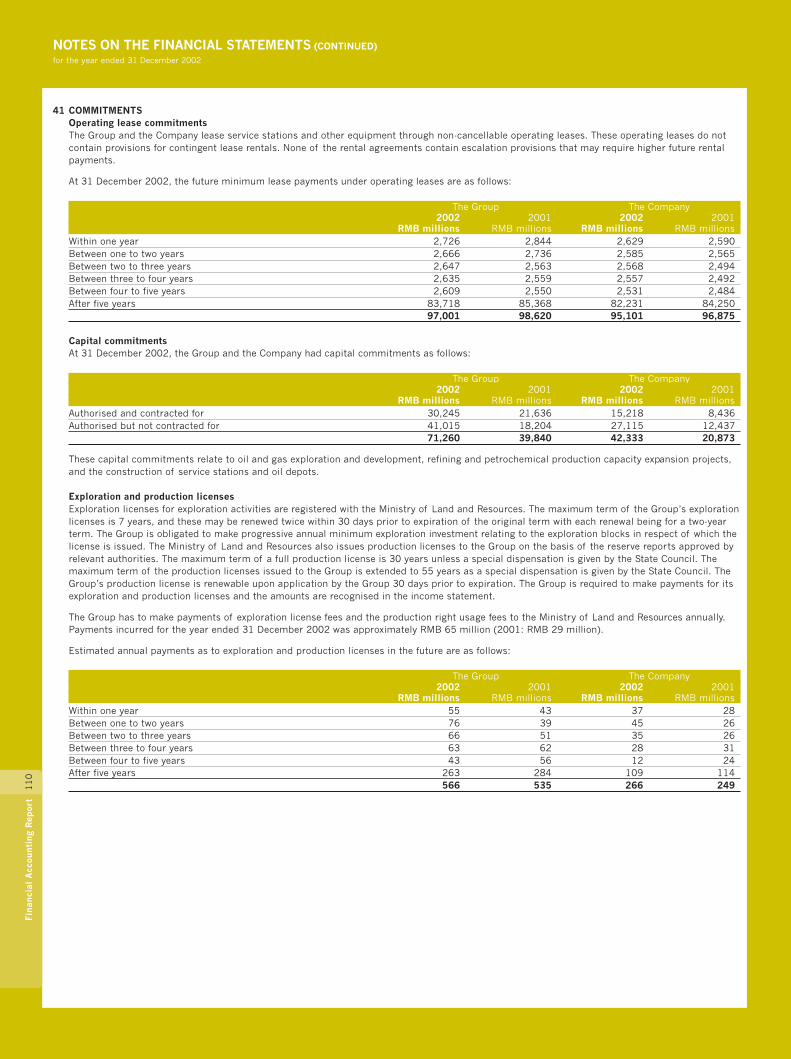
NOTES ON THE FINANCIAL STATEMENTS (CONTINUED)for the year ended 31 December 2002
11
0Fi
nanc
ial
Acc
ount
ing
Rep
ort
41 COMMITMENTSOperating lease commitmentsThe Group and the Company lease service stations and other equipment through non-cancellable operating leases. These operating leases do notcontain provisions for contingent lease rentals. None of the rental agreements contain escalation provisions that may require higher future rentalpayments.
At 31 December 2002, the future minimum lease payments under operating leases are as follows:
The Group The Company2002 2001 2002 2001
RMB millions RMB millions RMB millions RMB millionsWithin one year 2,726 2,844 2,629 2,590Between one to two years 2,666 2,736 2,585 2,565Between two to three years 2,647 2,563 2,568 2,494Between three to four years 2,635 2,559 2,557 2,492Between four to five years 2,609 2,550 2,531 2,484After five years 83,718 85,368 82,231 84,250
97,001 98,620 95,101 96,875
Capital commitmentsAt 31 December 2002, the Group and the Company had capital commitments as follows:
The Group The Company2002 2001 2002 2001
RMB millions RMB millions RMB millions RMB millionsAuthorised and contracted for 30,245 21,636 15,218 8,436Authorised but not contracted for 41,015 18,204 27,115 12,437
71,260 39,840 42,333 20,873
These capital commitments relate to oil and gas exploration and development, refining and petrochemical production capacity expansion projects,and the construction of service stations and oil depots.
Exploration and production licensesExploration licenses for exploration activities are registered with the Ministry of Land and Resources. The maximum term of the Group’s explorationlicenses is 7 years, and these may be renewed twice within 30 days prior to expiration of the original term with each renewal being for a two-yearterm. The Group is obligated to make progressive annual minimum exploration investment relating to the exploration blocks in respect of which thelicense is issued. The Ministry of Land and Resources also issues production licenses to the Group on the basis of the reserve reports approved byrelevant authorities. The maximum term of a full production license is 30 years unless a special dispensation is given by the State Council. Themaximum term of the production licenses issued to the Group is extended to 55 years as a special dispensation is given by the State Council. TheGroup’s production license is renewable upon application by the Group 30 days prior to expiration. The Group is required to make payments for itsexploration and production licenses and the amounts are recognised in the income statement.
The Group has to make payments of exploration license fees and the production right usage fees to the Ministry of Land and Resources annually.Payments incurred for the year ended 31 December 2002 was approximately RMB 65 million (2001: RMB 29 million).
Estimated annual payments as to exploration and production licenses in the future are as follows:
The Group The Company2002 2001 2002 2001
RMB millions RMB millions RMB millions RMB millionsWithin one year 55 43 37 28Between one to two years 76 39 45 26Between two to three years 66 51 35 26Between three to four years 63 62 28 31Between four to five years 43 56 12 24After five years 263 284 109 114
566 535 266 249
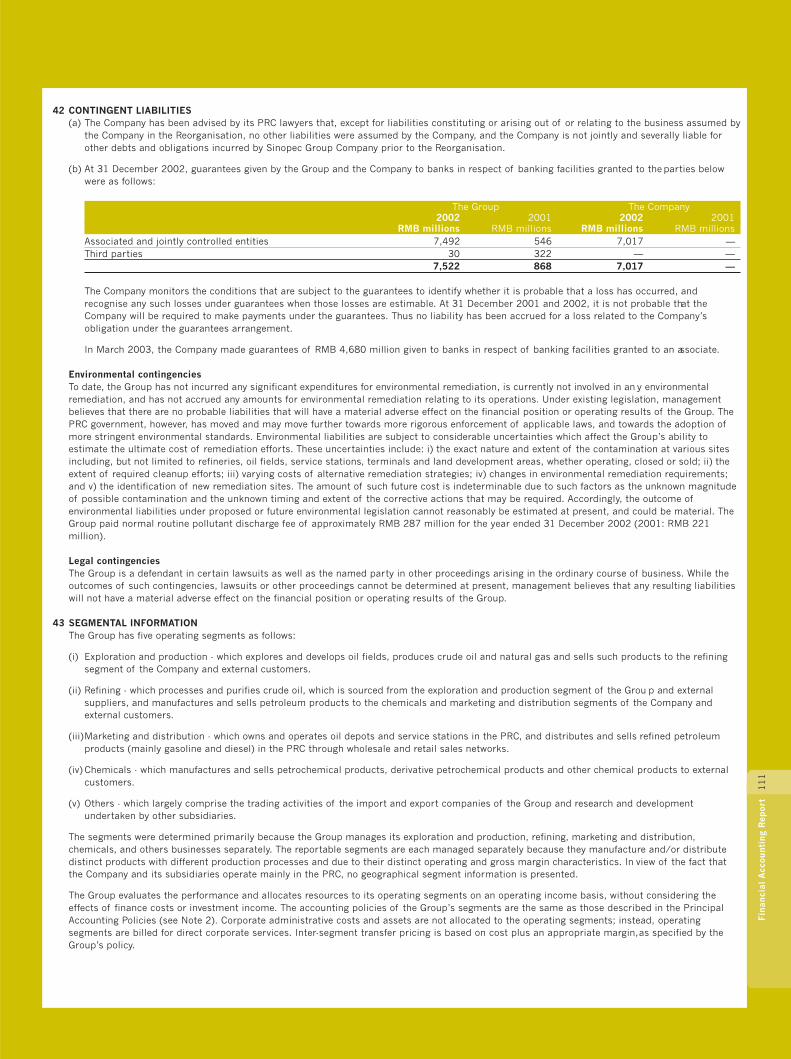
11
1Fi
nanc
ial
Acc
ount
ing
Rep
ort
42 CONTINGENT LIABILITIES(a) The Company has been advised by its PRC lawyers that, except for liabilities constituting or arising out of or relating to the business assumed by
the Company in the Reorganisation, no other liabilities were assumed by the Company, and the Company is not jointly and severally liable forother debts and obligations incurred by Sinopec Group Company prior to the Reorganisation.
(b) At 31 December 2002, guarantees given by the Group and the Company to banks in respect of banking facilities granted to the parties belowwere as follows:
The Group The Company2002 2001 2002 2001
RMB millions RMB millions RMB millions RMB millionsAssociated and jointly controlled entities 7,492 546 7,017 —Third parties 30 322 — —
7,522 868 7,017 —
The Company monitors the conditions that are subject to the guarantees to identify whether it is probable that a loss has occurred, andrecognise any such losses under guarantees when those losses are estimable. At 31 December 2001 and 2002, it is not probable that theCompany will be required to make payments under the guarantees. Thus no liability has been accrued for a loss related to the Company’sobligation under the guarantees arrangement.
In March 2003, the Company made guarantees of RMB 4,680 million given to banks in respect of banking facilities granted to an associate.
Environmental contingenciesTo date, the Group has not incurred any significant expenditures for environmental remediation, is currently not involved in any environmentalremediation, and has not accrued any amounts for environmental remediation relating to its operations. Under existing legislation, managementbelieves that there are no probable liabilities that will have a material adverse effect on the financial position or operating results of the Group. ThePRC government, however, has moved and may move further towards more rigorous enforcement of applicable laws, and towards the adoption ofmore stringent environmental standards. Environmental liabilities are subject to considerable uncertainties which affect the Group’s ability toestimate the ultimate cost of remediation efforts. These uncertainties include: i) the exact nature and extent of the contamination at various sitesincluding, but not limited to refineries, oil fields, service stations, terminals and land development areas, whether operating, closed or sold; ii) theextent of required cleanup efforts; iii) varying costs of alternative remediation strategies; iv) changes in environmental remediation requirements;and v) the identification of new remediation sites. The amount of such future cost is indeterminable due to such factors as the unknown magnitudeof possible contamination and the unknown timing and extent of the corrective actions that may be required. Accordingly, the outcome ofenvironmental liabilities under proposed or future environmental legislation cannot reasonably be estimated at present, and could be material. TheGroup paid normal routine pollutant discharge fee of approximately RMB 287 million for the year ended 31 December 2002 (2001: RMB 221million).
Legal contingenciesThe Group is a defendant in certain lawsuits as well as the named party in other proceedings arising in the ordinary course of business. While theoutcomes of such contingencies, lawsuits or other proceedings cannot be determined at present, management believes that any resulting liabilitieswill not have a material adverse effect on the financial position or operating results of the Group.
43 SEGMENTAL INFORMATIONThe Group has five operating segments as follows:
(i) Exploration and production - which explores and develops oil fields, produces crude oil and natural gas and sells such products to the refiningsegment of the Company and external customers.
(ii) Refining - which processes and purifies crude oil, which is sourced from the exploration and production segment of the Group and externalsuppliers, and manufactures and sells petroleum products to the chemicals and marketing and distribution segments of the Company andexternal customers.
(iii)Marketing and distribution - which owns and operates oil depots and service stations in the PRC, and distributes and sells refined petroleumproducts (mainly gasoline and diesel) in the PRC through wholesale and retail sales networks.
(iv) Chemicals - which manufactures and sells petrochemical products, derivative petrochemical products and other chemical products to externalcustomers.
(v) Others - which largely comprise the trading activities of the import and export companies of the Group and research and developmentundertaken by other subsidiaries.
The segments were determined primarily because the Group manages its exploration and production, refining, marketing and distribution,chemicals, and others businesses separately. The reportable segments are each managed separately because they manufacture and/or distributedistinct products with different production processes and due to their distinct operating and gross margin characteristics. In view of the fact thatthe Company and its subsidiaries operate mainly in the PRC, no geographical segment information is presented.
The Group evaluates the performance and allocates resources to its operating segments on an operating income basis, without considering theeffects of finance costs or investment income. The accounting policies of the Group’s segments are the same as those described in the PrincipalAccounting Policies (see Note 2). Corporate administrative costs and assets are not allocated to the operating segments; instead, operatingsegments are billed for direct corporate services. Inter-segment transfer pricing is based on cost plus an appropriate margin, as specified by theGroup’s policy.
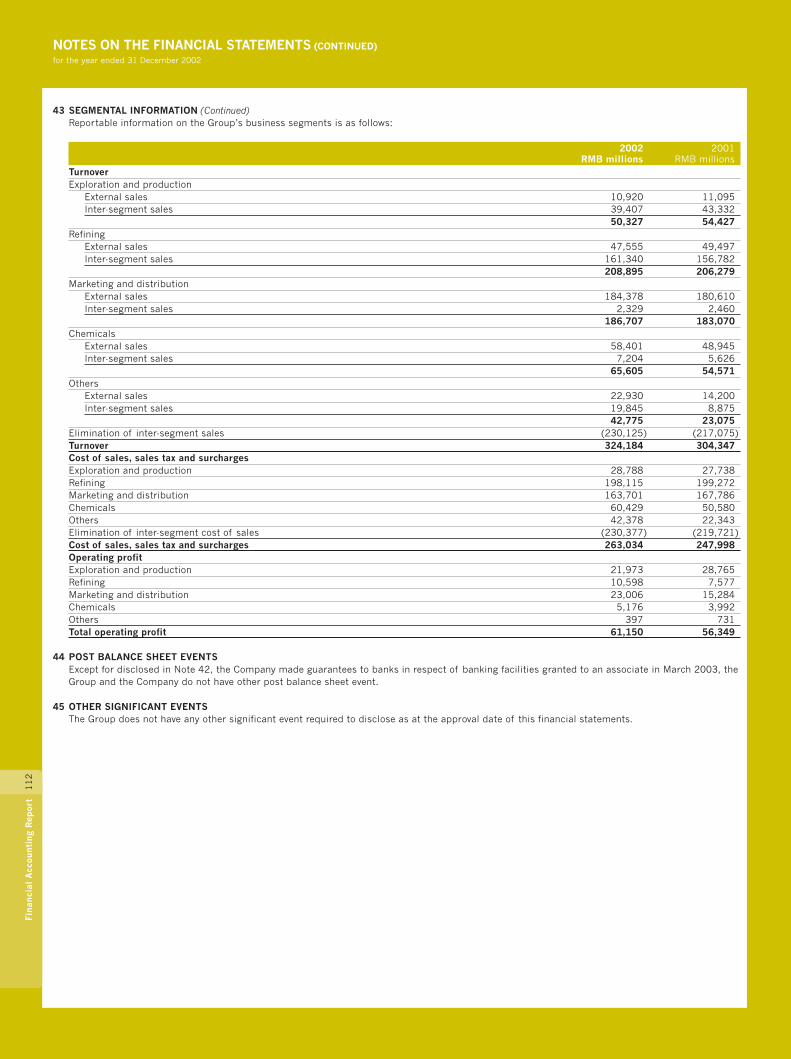
NOTES ON THE FINANCIAL STATEMENTS (CONTINUED)for the year ended 31 December 2002
11
2Fi
nanc
ial
Acc
ount
ing
Rep
ort
43 SEGMENTAL INFORMATION (Continued)Reportable information on the Group’s business segments is as follows:
2002 2001RMB millions RMB millions
TurnoverExploration and production
External sales 10,920 11,095Inter-segment sales 39,407 43,332
50,327 54,427Refining
External sales 47,555 49,497Inter-segment sales 161,340 156,782
208,895 206,279Marketing and distribution
External sales 184,378 180,610Inter-segment sales 2,329 2,460
186,707 183,070Chemicals
External sales 58,401 48,945Inter-segment sales 7,204 5,626
65,605 54,571Others
External sales 22,930 14,200Inter-segment sales 19,845 8,875
42,775 23,075Elimination of inter-segment sales (230,125) (217,075)Turnover 324,184 304,347Cost of sales, sales tax and surchargesExploration and production 28,788 27,738Refining 198,115 199,272Marketing and distribution 163,701 167,786Chemicals 60,429 50,580Others 42,378 22,343Elimination of inter-segment cost of sales (230,377) (219,721)Cost of sales, sales tax and surcharges 263,034 247,998Operating profitExploration and production 21,973 28,765Refining 10,598 7,577Marketing and distribution 23,006 15,284Chemicals 5,176 3,992Others 397 731Total operating profit 61,150 56,349
44 POST BALANCE SHEET EVENTSExcept for disclosed in Note 42, the Company made guarantees to banks in respect of banking facilities granted to an associate in March 2003, theGroup and the Company do not have other post balance sheet event.
45 OTHER SIGNIFICANT EVENTSThe Group does not have any other significant event required to disclose as at the approval date of this financial statements.

11
3Fi
nanc
ial
Acc
ount
ing
Rep
ort
REPORT OF THE INTERNATIONAL AUDITORS
To the Shareholders ofChina Petroleum & Chemical Corporation(Established in The People’s Republic of China with limited liability)
We have audited the financial statements on pages 114 to 142 which have been prepared in accordance with International Financial ReportingStandards promulgated by the International Accounting Standards Board.
RESPECTIVE RESPONSIBILITIES OF DIRECTORS AND AUDITORSThe Company’s directors are responsible for the preparation of financial statements which give a true and fair view. In preparing financial statementswhich give a true and fair view it is fundamental that appropriate accounting policies are selected and applied consistently, that judgements andestimates are made which are prudent and reasonable and that the reasons for any significant departure from applicable accounting standards arestated.
It is our responsibility to form an independent opinion, based on our audit, on those financial statements and to report our opinion to you.
BASIS OF OPINIONWe conducted our audit in accordance with Statements of Auditing Standards issued by the Hong Kong Society of Accountants. An audit includesexamination, on a test basis, of evidence relevant to the amounts and disclosures in the financial statements. It also includes an assessment of thesignificant estimates and judgements made by the directors in the preparation of the financial statements, and of whether the accounting policies areappropriate to the Company’s and the Group’s circumstances, consistently applied and adequately disclosed.
We planned and performed our audit so as to obtain all the information and explanations which we considered necessary in order to provide us withsufficient evidence to give reasonable assurance as to whether the financial statements are free from material misstatement. In forming our opinion wealso evaluated the overall adequacy of the presentation of information in the financial statements. We believe that our audit provides a reasonablebasis for our opinion.
OPINIONIn our opinion, the financial statements give a true and fair view of the state of affairs of the Company and of the Group as at 31 December 2002 andof the Group’s profit and cash flows for the year then ended and have been properly prepared in accordance with International Financial ReportingStandards promulgated by the International Accounting Standards Board and the disclosure requirements of the Hong Kong Companies Ordinance.
KPMGCertified Public AccountantsHong Kong, China, 28 March 2003

11
4Fi
nanc
ial
Acc
ount
ing
Rep
ort
(B) FINANCIAL STATEMENTS PREPARED UNDER INTERNATIONAL FINANCIAL REPORTING STANDARDS (“IFRS”)CONSOLIDATED INCOME STATEMENTfor the year ended 31 December 2002(Amounts in millions except per share data)
Note 2002 2001RMB RMB
Turnover and other operating revenuesTurnover 3 324,184 304,347Other operating revenues 4 15,858 14,124
340,042 318,471--- - - - - - - - - - - - - - - - - - - - - - - - - - - - - - - - - - - - - - - - - - - - - - - - - - - - - - - - - - - - - - - - - - - - - - - - - - - - - - - - - - - - - - - - - - - - - - - - - - - - - - - - - - - - - - - - - - - - - - - - - - - - - - - - - - - - - - - - - - - - - - - - - - - - - - - - - - - - - - - - - - - - - - - - - - - - - - - - - - - - - - - - - - - - - - - - - - - - - - - - - - - - - - - - - - - - - - - - - - - - - - - - - - - - - - - - - - - - - - - - - - - - - - - - - - - - - - - - - - - - - - - - - - - - - -
Operating expensesPurchased crude oil, products and operating supplies and expenses (235,245) (220,313)Selling, general and administrative expenses 5 (21,088) (17,138)Depreciation, depletion and amortisation (24,282) (22,430)Exploration expenses, including dry holes (4,363) (3,775)Personnel expenses 6 (13,625) (12,889)Employee reduction expenses 7 (244) (2,546)Taxes other than income tax 8 (11,852) (11,887)Other operating expenses, net 9 (1,066) (193)
Total operating expenses (311,765) (291,171)---- - - - - - - - - - - - - - - - - - - - - - - - - - - - - - - - - - - - - - - - - - - - - - - - - - - - - - - - - - - - - - - - - - - - - - - - - - - - - - - - - - - - - - - - - - - - - - - - - - - - - - - - - - - - - - - - - - - - - - - - - - - - - - - - - - - - - - - - - - - - - - - - - - - - - - - - - - - - - - - - - - - - - - - - - - - - - - - - - - - - - - - - - - - - - - - - - - - - - - - - - - - - - - - - - - - - - - - - - - - - - - - - - - - - - - - - - - - - - - - - - - - - - - - - - - - - - - - - - - - - - - - - - - - - -
Operating profit 28,277 27,300Finance costs
Interest expense 10 (4,018) (4,706)Interest income 338 1,183Foreign exchange losses (312) (222)Foreign exchange gains 47 593
Net finance costs (3,945) (3,152)Investment income 190 199Share of profits less losses from associates and jointly controlled entities 310 320Profit from ordinary activities before taxation 24,832 24,667Taxation 11 (7,635) (8,029)Profit from ordinary activities after taxation 17,197 16,638Minority interests (1,117) (613)Profit attributable to shareholders 16,080 16,025Basic earnings per share 15 0.19 0.19Dividends attributable to the year: 16Interim dividend declared during the year 1,734 —Final dividend proposed after the balance sheet date 5,202 6,936
6,936 6,936
The notes on pages 120 to 142 form part of these financial statements.
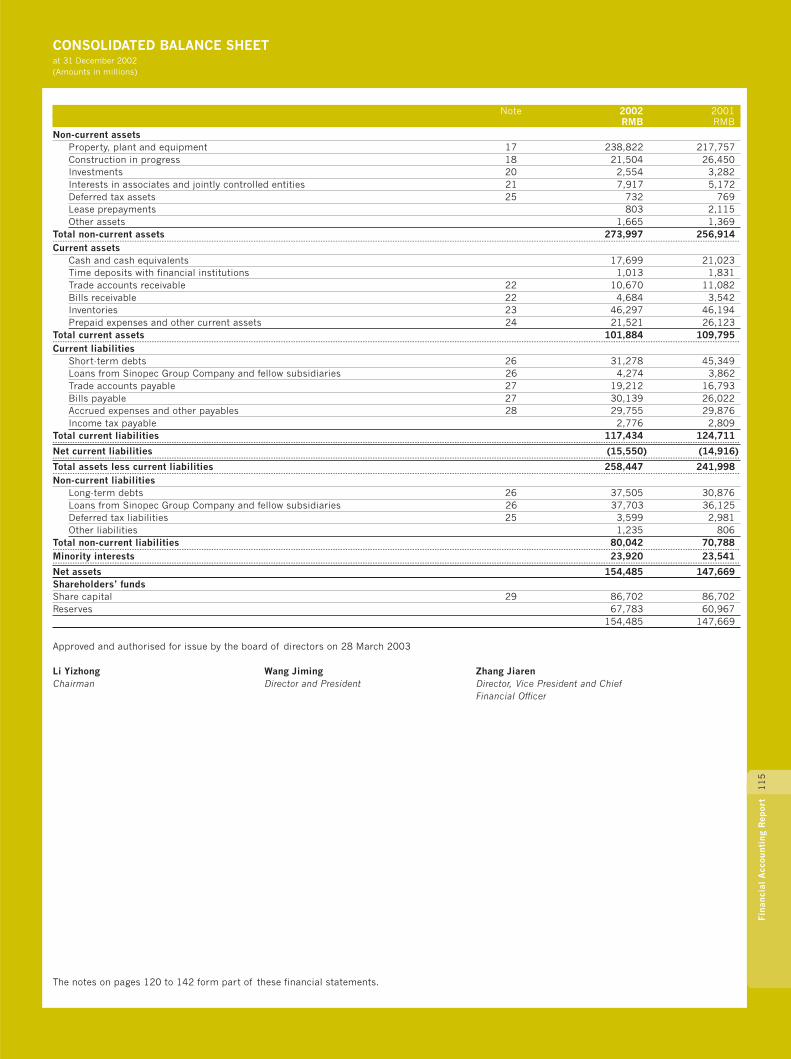
11
5Fi
nanc
ial
Acc
ount
ing
Rep
ort
CONSOLIDATED BALANCE SHEETat 31 December 2002(Amounts in millions)
Note 2002 2001RMB RMB
Non-current assetsProperty, plant and equipment 17 238,822 217,757Construction in progress 18 21,504 26,450Investments 20 2,554 3,282Interests in associates and jointly controlled entities 21 7,917 5,172Deferred tax assets 25 732 769Lease prepayments 803 2,115Other assets 1,665 1,369
Total non-current assets 273,997 256,914--- - - - - - - - - - - - - - - - - - - - - - - - - - - - - - - - - - - - - - - - - - - - - - - - - - - - - - - - - - - - - - - - - - - - - - - - - - - - - - - - - - - - - - - - - - - - - - - - - - - - - - - - - - - - - - - - - - - - - - - - - - - - - - - - - - - - - - - - - - - - - - - - - - - - - - - - - - - - - - - - - - - - - - - - - - - - - - - - - - - - - - - - - - - - - - - - - - - - - - - - - - - - - - - - - - - - - - - - - - - - - - - - - - - - - - - - - - - - - - - - - - - - - - - - - - - - - - - - - - - - - - - - - - - - - - - - - - -
Current assetsCash and cash equivalents 17,699 21,023Time deposits with financial institutions 1,013 1,831Trade accounts receivable 22 10,670 11,082Bills receivable 22 4,684 3,542Inventories 23 46,297 46,194Prepaid expenses and other current assets 24 21,521 26,123
Total current assets 101,884 109,795--- - - - - - - - - - - - - - - - - - - - - - - - - - - - - - - - - - - - - - - - - - - - - - - - - - - - - - - - - - - - - - - - - - - - - - - - - - - - - - - - - - - - - - - - - - - - - - - - - - - - - - - - - - - - - - - - - - - - - - - - - - - - - - - - - - - - - - - - - - - - - - - - - - - - - - - - - - - - - - - - - - - - - - - - - - - - - - - - - - - - - - - - - - - - - - - - - - - - - - - - - - - - - - - - - - - - - - - - - - - - - - - - - - - - - - - - - - - - - - - - - - - - - - - - - - - - - - - - - - - - - - - - - - - - - - - - - - -
Current liabilitiesShort-term debts 26 31,278 45,349Loans from Sinopec Group Company and fellow subsidiaries 26 4,274 3,862Trade accounts payable 27 19,212 16,793Bills payable 27 30,139 26,022Accrued expenses and other payables 28 29,755 29,876Income tax payable 2,776 2,809
Total current liabilities 117,434 124,711--- - - - - - - - - - - - - - - - - - - - - - - - - - - - - - - - - - - - - - - - - - - - - - - - - - - - - - - - - - - - - - - - - - - - - - - - - - - - - - - - - - - - - - - - - - - - - - - - - - - - - - - - - - - - - - - - - - - - - - - - - - - - - - - - - - - - - - - - - - - - - - - - - - - - - - - - - - - - - - - - - - - - - - - - - - - - - - - - - - - - - - - - - - - - - - - - - - - - - - - - - - - - - - - - - - - - - - - - - - - - - - - - - - - - - - - - - - - - - - - - - - - - - - - - - - - - - - - - - - - - - - - - - - - - - - - - - - -
Net current liabilities (15,550) (14,916)-- - - - - - - - - - - - - - - - - - - - - - - - - - - - - - - - - - - - - - - - - - - - - - - - - - - - - - - - - - - - - - - - - - - - - - - - - - - - - - - - - - - - - - - - - - - - - - - - - - - - - - - - - - - - - - - - - - - - - - - - - - - - - - - - - - - - - - - - - - - - - - - - - - - - - - - - - - - - - - - - - - - - - - - - - - - - - - - - - - - - - - - - - - - - - - - - - - - - - - - - - - - - - - - - - - - - - - - - - - - - - - - - - - - - - - - - - - - - - - - - - - - - - - - - - - - - - - - - - - - - - - - - - - - - - - - - - - - -
Total assets less current liabilities 258,447 241,998--- - - - - - - - - - - - - - - - - - - - - - - - - - - - - - - - - - - - - - - - - - - - - - - - - - - - - - - - - - - - - - - - - - - - - - - - - - - - - - - - - - - - - - - - - - - - - - - - - - - - - - - - - - - - - - - - - - - - - - - - - - - - - - - - - - - - - - - - - - - - - - - - - - - - - - - - - - - - - - - - - - - - - - - - - - - - - - - - - - - - - - - - - - - - - - - - - - - - - - - - - - - - - - - - - - - - - - - - - - - - - - - - - - - - - - - - - - - - - - - - - - - - - - - - - - - - - - - - - - - - - - - - - - - - - - - - - - -
Non-current liabilitiesLong-term debts 26 37,505 30,876Loans from Sinopec Group Company and fellow subsidiaries 26 37,703 36,125Deferred tax liabilities 25 3,599 2,981Other liabilities 1,235 806
Total non-current liabilities 80,042 70,788--- - - - - - - - - - - - - - - - - - - - - - - - - - - - - - - - - - - - - - - - - - - - - - - - - - - - - - - - - - - - - - - - - - - - - - - - - - - - - - - - - - - - - - - - - - - - - - - - - - - - - - - - - - - - - - - - - - - - - - - - - - - - - - - - - - - - - - - - - - - - - - - - - - - - - - - - - - - - - - - - - - - - - - - - - - - - - - - - - - - - - - - - - - - - - - - - - - - - - - - - - - - - - - - - - - - - - - - - - - - - - - - - - - - - - - - - - - - - - - - - - - - - - - - - - - - - - - - - - - - - - - - - - - - - - - - - - - -
Minority interests 23,920 23,541--- - - - - - - - - - - - - - - - - - - - - - - - - - - - - - - - - - - - - - - - - - - - - - - - - - - - - - - - - - - - - - - - - - - - - - - - - - - - - - - - - - - - - - - - - - - - - - - - - - - - - - - - - - - - - - - - - - - - - - - - - - - - - - - - - - - - - - - - - - - - - - - - - - - - - - - - - - - - - - - - - - - - - - - - - - - - - - - - - - - - - - - - - - - - - - - - - - - - - - - - - - - - - - - - - - - - - - - - - - - - - - - - - - - - - - - - - - - - - - - - - - - - - - - - - - - - - - - - - - - - - - - - - - - - - - - - - - -
Net assets 154,485 147,669Shareholders’ fundsShare capital 29 86,702 86,702Reserves 67,783 60,967
154,485 147,669
Approved and authorised for issue by the board of directors on 28 March 2003
Li Yizhong Wang Jiming Zhang JiarenChairman Director and President Director, Vice President and Chief
Financial Officer
The notes on pages 120 to 142 form part of these financial statements.

11
6Fi
nanc
ial
Acc
ount
ing
Rep
ort
BALANCE SHEETat 31 December 2002(Amounts in millions)
Note 2002 2001RMB RMB
Non-current assetsProperty, plant and equipment 17 118,562 107,040Construction in progress 18 15,695 16,753Interests in subsidiaries 19 89,332 89,608Investments 20 486 462Interests in associates and jointly controlled entities 21 5,679 4,155Deferred tax assets 25 108 337Other assets 1,267 1,092
Total non-current assets 231,129 219,447--- - - - - - - - - - - - - - - - - - - - - - - - - - - - - - - - - - - - - - - - - - - - - - - - - - - - - - - - - - - - - - - - - - - - - - - - - - - - - - - - - - - - - - - - - - - - - - - - - - - - - - - - - - - - - - - - - - - - - - - - - - - - - - - - - - - - - - - - - - - - - - - - - - - - - - - - - - - - - - - - - - - - - - - - - - - - - - - - - - - - - - - - - - - - - - - - - - - - - - - - - - - - - - - - - - - - - - - - - - - - - - - - - - - - - - - - - - - - - - - - - - - - - - - - - - - - - - - - - - - - - - - - - - - - - - - - - - -
Current assetsCash and cash equivalents 8,207 11,595Time deposits with financial institutions 221 230Trade accounts receivable 22 9,885 9,461Bills receivable 22 1,478 1,464Inventories 23 25,190 27,327Prepaid expenses and other current assets 24 26,599 28,453
Total current assets 71,580 78,530--- - - - - - - - - - - - - - - - - - - - - - - - - - - - - - - - - - - - - - - - - - - - - - - - - - - - - - - - - - - - - - - - - - - - - - - - - - - - - - - - - - - - - - - - - - - - - - - - - - - - - - - - - - - - - - - - - - - - - - - - - - - - - - - - - - - - - - - - - - - - - - - - - - - - - - - - - - - - - - - - - - - - - - - - - - - - - - - - - - - - - - - - - - - - - - - - - - - - - - - - - - - - - - - - - - - - - - - - - - - - - - - - - - - - - - - - - - - - - - - - - - - - - - - - - - - - - - - - - - - - - - - - - - - - - - - - - - -
Current liabilitiesShort-term debts 26 18,372 30,019Loans from Sinopec Group Company and fellow subsidiaries 26 2,452 3,036Trade accounts payable 27 18,310 12,727Bills payable 27 23,055 19,291Accrued expenses and other payables 28 21,094 27,552Income tax payable 1,307 837
Total current liabilities 84,590 93,462--- - - - - - - - - - - - - - - - - - - - - - - - - - - - - - - - - - - - - - - - - - - - - - - - - - - - - - - - - - - - - - - - - - - - - - - - - - - - - - - - - - - - - - - - - - - - - - - - - - - - - - - - - - - - - - - - - - - - - - - - - - - - - - - - - - - - - - - - - - - - - - - - - - - - - - - - - - - - - - - - - - - - - - - - - - - - - - - - - - - - - - - - - - - - - - - - - - - - - - - - - - - - - - - - - - - - - - - - - - - - - - - - - - - - - - - - - - - - - - - - - - - - - - - - - - - - - - - - - - - - - - - - - - - - - - - - - - -
Net current liabilities (13,010) (14,932)-- - - - - - - - - - - - - - - - - - - - - - - - - - - - - - - - - - - - - - - - - - - - - - - - - - - - - - - - - - - - - - - - - - - - - - - - - - - - - - - - - - - - - - - - - - - - - - - - - - - - - - - - - - - - - - - - - - - - - - - - - - - - - - - - - - - - - - - - - - - - - - - - - - - - - - - - - - - - - - - - - - - - - - - - - - - - - - - - - - - - - - - - - - - - - - - - - - - - - - - - - - - - - - - - - - - - - - - - - - - - - - - - - - - - - - - - - - - - - - - - - - - - - - - - - - - - - - - - - - - - - - - - - - - - - - - - - - - -
Total assets less current liabilities 218,119 204,515--- - - - - - - - - - - - - - - - - - - - - - - - - - - - - - - - - - - - - - - - - - - - - - - - - - - - - - - - - - - - - - - - - - - - - - - - - - - - - - - - - - - - - - - - - - - - - - - - - - - - - - - - - - - - - - - - - - - - - - - - - - - - - - - - - - - - - - - - - - - - - - - - - - - - - - - - - - - - - - - - - - - - - - - - - - - - - - - - - - - - - - - - - - - - - - - - - - - - - - - - - - - - - - - - - - - - - - - - - - - - - - - - - - - - - - - - - - - - - - - - - - - - - - - - - - - - - - - - - - - - - - - - - - - - - - - - - - -
Non-current liabilitiesLong-term debts 26 24,274 19,438Loans from Sinopec Group Company and fellow subsidiaries 26 37,616 36,117Deferred tax liabilities 25 1,042 673Other liabilities 702 618
Total non-current liabilities 63,634 56,846--- - - - - - - - - - - - - - - - - - - - - - - - - - - - - - - - - - - - - - - - - - - - - - - - - - - - - - - - - - - - - - - - - - - - - - - - - - - - - - - - - - - - - - - - - - - - - - - - - - - - - - - - - - - - - - - - - - - - - - - - - - - - - - - - - - - - - - - - - - - - - - - - - - - - - - - - - - - - - - - - - - - - - - - - - - - - - - - - - - - - - - - - - - - - - - - - - - - - - - - - - - - - - - - - - - - - - - - - - - - - - - - - - - - - - - - - - - - - - - - - - - - - - - - - - - - - - - - - - - - - - - - - - - - - - - - - - - -
Net assets 154,485 147,669Shareholders’ fundsShare capital 29 86,702 86,702Reserves 67,783 60,967
154,485 147,669
Approved and authorised for issue by the board of directors on 28 March 2003
Li Yizhong Wang Jiming Zhang JiarenChairman Director and President Director, Vice President and Chief
Financial Officer
The notes on pages 120 to 142 form part of these financial statements

11
7Fi
nanc
ial
Acc
ount
ing
Rep
ort
CONSOLIDATED CASH FLOW STATEMENTfor the year ended 31 December 2002(Amounts in millions)
Note 2002 2001RMB RMB
Cash flows from operating activities (a) 53,890 55,279--- - - - - - - - - - - - - - - - - - - - - - - - - - - - - - - - - - - - - - - - - - - - - - - - - - - - - - - - - - - - - - - - - - - - - - - - - - - - - - - - - - - - - - - - - - - - - - - - - - - - - - - - - - - - - - - - - - - - - - - - - - - - - - - - - - - - - - - - - - - - - - - - - - - - - - - - - - - - - - - - - - - - - - - - - - - - - - - - - - - - - - - - - - - - - - - - - - - - - - - - - - - - - - - - - - - - - - - - - - - - - - - - - - - - - - - - - - - - - - - - - - - - - - - - - - - - - - - - - - - - - - - - - - - - - - - - - - -
Cash flow from investing activitiesCapital expenditure (41,941) (55,935)Purchase of investments and investments in associates and jointly controlled entities (2,064) (3,375)Proceeds from disposal of investments and investments in associates
and jointly controlled entities 97 307Proceeds from disposal of property, plant and equipment 432 374Repayments from associates and jointly controlled entities — 117Increase in time deposits with financial institutions (1,342) (18,698)Maturity of time deposits with financial institutions 2,160 38,727
Net cash used in investing activities (42,658) (38,483)-- - - - - - - - - - - - - - - - - - - - - - - - - - - - - - - - - - - - - - - - - - - - - - - - - - - - - - - - - - - - - - - - - - - - - - - - - - - - - - - - - - - - - - - - - - - - - - - - - - - - - - - - - - - - - - - - - - - - - - - - - - - - - - - - - - - - - - - - - - - - - - - - - - - - - - - - - - - - - - - - - - - - - - - - - - - - - - - - - - - - - - - - - - - - - - - - - - - - - - - - - - - - - - - - - - - - - - - - - - - - - - - - - - - - - - - - - - - - - - - - - - - - - - - - - - - - - - - - - - - - - - - - - - - - - - - - - - - -
Cash flow from financing activitiesProceeds from public offering, net of issuing expenses — 11,648Proceeds from bank and other loans 252,675 258,928Repayments of bank and other loans (258,343) (272,410)Distributions to minority interests (455) (682)Contributions from minority interests 230 287Dividend paid (8,670) (6,712)Cash and cash equivalents distributed to Sinopec Group Company — (6,446)
Net cash used in financing activities (14,563) (15,387)-- - - - - - - - - - - - - - - - - - - - - - - - - - - - - - - - - - - - - - - - - - - - - - - - - - - - - - - - - - - - - - - - - - - - - - - - - - - - - - - - - - - - - - - - - - - - - - - - - - - - - - - - - - - - - - - - - - - - - - - - - - - - - - - - - - - - - - - - - - - - - - - - - - - - - - - - - - - - - - - - - - - - - - - - - - - - - - - - - - - - - - - - - - - - - - - - - - - - - - - - - - - - - - - - - - - - - - - - - - - - - - - - - - - - - - - - - - - - - - - - - - - - - - - - - - - - - - - - - - - - - - - - - - - - - - - - - - - -
Net (decrease)/increase in cash and cash equivalents (3,331) 1,409Effect of foreign exchange rate 7 (7)Cash and cash equivalents at beginning of year 21,023 19,621Cash and cash equivalents at end of year 17,699 21,023
The notes on pages 120 to 142 form part of these financial statements.
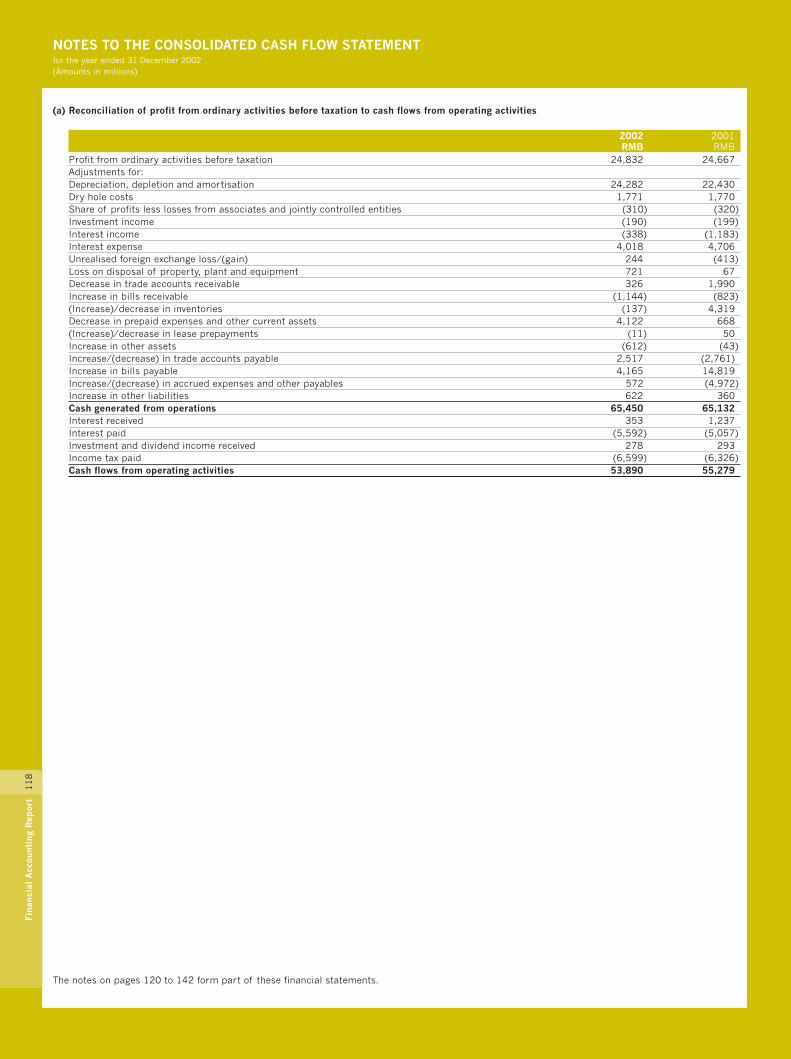
11
8Fi
nanc
ial
Acc
ount
ing
Rep
ort
NOTES TO THE CONSOLIDATED CASH FLOW STATEMENTfor the year ended 31 December 2002(Amounts in millions)
(a) Reconciliation of profit from ordinary activities before taxation to cash flows from operating activities
2002 2001RMB RMB
Profit from ordinary activities before taxation 24,832 24,667Adjustments for:Depreciation, depletion and amortisation 24,282 22,430Dry hole costs 1,771 1,770Share of profits less losses from associates and jointly controlled entities (310) (320)Investment income (190) (199)Interest income (338) (1,183)Interest expense 4,018 4,706Unrealised foreign exchange loss/(gain) 244 (413)Loss on disposal of property, plant and equipment 721 67Decrease in trade accounts receivable 326 1,990Increase in bills receivable (1,144) (823)(Increase)/decrease in inventories (137) 4,319Decrease in prepaid expenses and other current assets 4,122 668(Increase)/decrease in lease prepayments (11) 50Increase in other assets (612) (43)Increase/(decrease) in trade accounts payable 2,517 (2,761)Increase in bills payable 4,165 14,819Increase/(decrease) in accrued expenses and other payables 572 (4,972)Increase in other liabilities 622 360Cash generated from operations 65,450 65,132Interest received 353 1,237Interest paid (5,592) (5,057)Investment and dividend income received 278 293Income tax paid (6,599) (6,326)Cash flows from operating activities 53,890 55,279
The notes on pages 120 to 142 form part of these financial statements.

11
9Fi
nanc
ial
Acc
ount
ing
Rep
ort
STATEMENTS OF CHANGES IN SHAREHOLDERS’ FUNDSfor the year ended 31 December 2002(Amounts in millions except per share data)
THE GROUP AND THE COMPANY
StatutoryStatutory public Discretionary
Share Capital Share Revaluation surplus welfare surplus Other Retainedcapital reserve premium reserve reserve fund reserve reserves earnings Total
RMB RMB RMB RMB RMB RMB RMB RMB RMB RMBShareholders’ fund at 1 January 2001 83,902 (14,579) 9,224 33,257 1,615 1,615 — 2,147 15,973 133,154Final dividend for 2000 (Note 16) — — — — — — — — (6,712) (6,712)Issue of shares, net of issuing expenses
of RMB 168 million 2,800 — 8,848 — — — — — — 11,648Profit attributable to shareholders — — — — — — — — 16,025 16,025Appropriation (Note (a) and (b)) — — — — 1,402 1,402 — — (2,804) —Consideration for Acquisition of
Sinopec National Star (Note 1) — — — — — — — (6,446) — (6,446)Transfer from other reserves to capital reserve — (4,299) — — — — — 4,299 — —Revaluation surplus realised — — — (232) — — — — 232 —Shareholders’ fund at 31 December 2001 86,702 (18,878) 18,072 33,025 3,017 3,017 — — 22,714 147,669Final dividend for 2001 (Note 16) — — — — — — — — (6,936) (6,936)Interim dividend for 2002 (Note 16) — — — — — — — — (1,734) (1,734)Profit attributable to shareholders — — — — — — — — 16,080 16,080Appropriation (Note (a), (b) and (c)) — — — — 1,412 1,412 7,000 — (9,824) —Revaluation surplus realised — — — (544) — — — — 544 —Elimination of surplus on land use rights (Note (e)) — — — (840) — — — 246 — (594)Deferred tax on land use rights (Note (e)) — — — — — — — (5) 5 —Shareholders’ fund at 31 December 2002 86,702 (18,878) 18,072 31,641 4,429 4,429 7,000 241 20,849 154,485
Notes:
(a) According to the Company’s Articles of Association, the Company is required to transfer 10% of its net profit, as determined in accordance with the PRC AccountingRules and Regulations, to statutory surplus reserve until the reserve balance reaches 50% of the registered capital. The transfer to this reserve must be made beforedistribution of a dividend to shareholders.
Statutory surplus reserve can be used to make good previous years’ losses, if any, and may be converted into share capital by the issue of new shares to shareholders inproportion to their existing shareholdings or by increasing the par value of the shares currently held by them, provided that the balance after such issue is not less than25% of the registered capital. During the year ended 31 December 2002, the Company transferred RMB 1,412 million (2001: RMB 1,402 million), being 10% of thecurrent year’s net profit determined in accordance with the PRC Accounting Rules and Regulations to this reserve.
(b) According to the Company’s Articles of Association, the Company is required to transfer 5% to 10% of its net profit, as determined in accordance with the PRCAccounting Rules and Regulations, to the statutory public welfare fund. This fund can only be utilised on capital items for the collective benefits of the Company’semployees such as the construction of dormitories, canteen and other staff welfare facilities. This fund is non-distributable other than on liquidation. The transfer to thisfund must be made before distribution of a dividend to shareholders.
Pursuant to the shareholders’ approval at the Annual General Meeting on 13 June 2002, the Board of Directors was authorised to determine the amount of the transfer.The directors authorised the transfer of RMB 450 million (2001: RMB nil), being 10% of the net profit for the six-month period ended 30 June 2002 as determined inaccordance with the PRC Accounting Rules and Regulations, to this fund.
The directors authorised the transfer of RMB 962 million, subject to the shareholders’ approval, being 10% of the net profit for the six-month period ended 31 December2002 determined in accordance with the PRC Accounting Rules and Regulations, to this fund. The transfer to this fund for the year ended 31 December 2001 was RMB1,402 million.
(c) The directors authorised the transfer of RMB 7,000 million (2001: Rmb nil), subject to the shareholders’ approval at the Annual General Meeting to the discretionarysurplus reserve. Its usage is similar to that of statutory surplus reserve.
(d) According to the Company’s Articles of Association, the amount of retained profits available for distribution to shareholders of the Company is the lower of the amountdetermined in accordance with the PRC Accounting Rules and Regulations and the amount determined in accordance with IFRS. At 31 December 2002, the amount ofretained profits available for distribution was RMB 12,569 million (2001: RMB 16,942 million), being the amount determined in accordance with the PRC AccountingRules and Regulations. Final dividend of RMB 5,202 million (2001: RMB 6,936 million) proposed after the balance sheet date has not been recognised as a liability atthe balance sheet date.
(e) Effective 1 January 2002, land use rights which are included in lease prepayments are carried at historical cost. Accordingly, the surplus on the revaluation of land userights credited to revaluation reserve previously, net of minority interests, was eliminated during the year. The effect of this change did not have a material impact on theGroup’s financial condition and results of operations in the years prior to the change. As a result of the tax deductibility of the revaluation surplus, a deferred tax asset,net of minority interests, is created with a corresponding increase in other reserves.
(f) The capital reserve represents (i) the difference between the total amount of the par value of shares issued and the amount of the net assets transferred from SinopecGroup Company in connection with the Reorganisation and (ii) the difference between the consideration paid over the amount of the net assets acquired from SinopecNational Star.
(g) The application of the share premium account is governed by Sections 178 and 179 of the PRC Company Law.
The notes on pages 120 to 142 form part of these financial statements
12
0Fi
nanc
ial
Acc
ount
ing
Rep
ort
NOTES ON THE FINANCIAL STATEMENTSfor the year ended 31 December 2002
1 PRINCIPAL ACTIVITIES, ORGANISATION AND BASIS OF PRESENTATION
Principal activitiesChina Petroleum & Chemical Corporation (“the Company”) is an oil and energy company that, through its subsidiaries (hereinafter collectivelyreferred to as “the Group”), engages in fully integrated oil and gas and chemical operations in the People’s Republic of China (“the PRC”). Oil andgas operations consist of exploring for, developing and producing crude oil and natural gas; transporting crude oil, natural gas and products bypipelines; refining crude oil into finished petroleum products; and marketing crude oil, natural gas and refined petroleum products. Chemicaloperations include the manufacture and marketing of a wide range of chemicals for industrial uses.
OrganisationThe Company was established in the PRC on 25 February 2000 as a joint stock limited company as part of the reorganisation (“the Reorganisation”)of China Petrochemical Corporation (“Sinopec Group Company”), the ultimate holding company of the Group and a ministry-level enterprise underthe direct supervision of the State Council of the PRC. Prior to the incorporation of the Company, the oil and gas and chemical operations of theGroup were carried on by oil administration bureaux, petrochemical and refining production enterprises and sales and marketing companies ofSinopec Group Company.
As part of the Reorganisation, certain of Sinopec Group Company’s core oil and gas and chemical operations and businesses together with therelated assets and liabilities that were to be transferred to the Company were segregated such that the operations and businesses were separatelymanaged beginning 31 December 1999. On 25 February 2000, in consideration for Sinopec Group Company transferring such oil and gas andchemical operations and businesses and the related assets and liabilities to the Company, the Company issued 68.8 billion domestic state-ownedordinary shares with a par value of RMB 1.00 each to Sinopec Group Company. The shares issued to Sinopec Group Company on 25 February 2000represented the entire registered and issued share capital of the Company at that date. The oil and gas and chemical operations and businessestransferred to the Company related to (i) the exploration, development and production of crude oil and natural gas, (ii) the refining, transportation,storage and marketing of crude oil and petroleum products, and (iii) the production and sale of chemicals (collectively the “PredecessorOperations”).
Basis of presentationPursuant to the resolution passed at the Extraordinary General Meeting held on 24 August 2001, the Company acquired the entire equity interest ofSinopec National Star Petroleum Company (“Sinopec National Star”) from Sinopec Group Company for a consideration of RMB 6.45 billion(hereinafter referred to as the “Acquisition”).
As the Group and Sinopec National Star are under the common control of Sinopec Group Company, the Acquisition is considered a “combination ofentities under common control” which is accounted in a manner similar to a pooling-of-interests (“as-if pooling-of-interests accounting”).Accordingly, the assets and liabilities of Sinopec National Star acquired have been accounted for at historical cost and the financial statements ofthe Group for periods prior to the combination have been restated to include the results of operations of Sinopec National Star on a combinedbasis. The consideration paid by the Group was treated as an equity transaction.
The accompanying financial statements have been prepared in accordance with IFRS promulgated by the International Accounting Standards Board.IFRS includes International Accounting Standards (“IAS”) and related interpretations. These financial statements also comply with the disclosurerequirements of the Hong Kong Companies Ordinance and the applicable disclosure provisions of the Rules Governing the Listing of Securities onThe Stock Exchange of Hong Kong Limited.
The accompanying financial statements are prepared on the historical cost basis as modified by the revaluation of certain property, plant andequipment (Note 17). The accounting policies described in Note 2 have been consistently applied by the Group. As described in note (e) to thestatements of changes in shareholders’ funds, land use rights are carried at cost effective 1 January 2002. The effect of this change resulted in adecrease in the revaluation reserve and an increase in other reserves relating to the recognition of the deferred tax asset as at 1 January 2002. Theeffect of this change did not have a material impact on the Group’s financial condition and results of operations in prior years.
The preparation of financial statements in accordance with IFRS requires management to make estimates and assumptions that affect the reportedamounts of assets and liabilities and disclosure of contingent assets and liabilities at the date of the financial statements and the reportedamounts of revenues and expenses during the year. Actual results could differ from those estimates.
2 PRINCIPAL ACCOUNTING POLICIES
(a) Basis of consolidationThe consolidated financial statements include the financial statements of the Company and its subsidiaries. Subsidiaries are those entitiescontrolled by the Company. Control exists when the Company has the power, directly or indirectly, to govern the financial and operating policiesof an entity so as to obtain benefits from its activities.
The results of subsidiaries are included in the consolidated income statement from the date that control effectively commences until the datethat control effectively ceases, and the share attributable to minority interests is deducted from or added to profit from ordinary activities aftertaxation. All significant inter-company balances and transactions and any unrealised gains arising from intercompany transactions areeliminated on consolidation.
The particulars of the Group’s principal subsidiaries are set out in Note 34.
(b) Translation of foreign currenciesThe functional and reporting currency of the Group is Renminbi. Foreign currency transactions during the year are translated into Renminbi atthe applicable rates of exchange quoted by the People’s Bank of China (“PBOC rates”) prevailing on the transaction dates. Foreign currencymonetary assets and liabilities are translated into Renminbi at the applicable PBOC rates at the balance sheet date.
Exchange differences, other than those capitalised as construction in progress, are recognised as income or expense in the income statement.

12
1Fi
nanc
ial
Acc
ount
ing
Rep
ort
2 PRINCIPAL ACCOUNTING POLICIES (Continued)
(c) Cash and cash equivalentsCash equivalents consist of time deposits with financial institutions with an initial term of less than three months when purchased. Cashequivalents are stated at cost, which approximates fair value.
(d) Trade accounts receivableTrade accounts receivable are stated at cost less allowance for doubtful accounts. An allowance for doubtful accounts is provided based uponthe evaluation of the recoverability of these accounts at the balance sheet date.
(e) InventoriesInventories, other than spare parts and consumables, are stated at the lower of cost and net realisable value. Cost includes the cost of purchasecomputed using the weighted average method and, in the case of work in progress and finished goods, direct labour and an appropriateproportion of production overheads. Net realisable value is the estimated selling price in the ordinary course of business less the estimatedcosts of completion and the estimated costs necessary to make the sale.
Spare parts and consumables are stated at cost less any provision for obsolescence.
(f) Property, plant and equipmentProperty, plant and equipment are initially recorded at cost less accumulated depreciation and impairment losses. The cost of an assetcomprises its purchase price and any directly attributable costs of bringing the asset to working condition and location for its intended use.Subsequent to the revaluation (Note 17), which was based on depreciated replacement costs, property, plant and equipment are carried atrevalued amount, being the fair value at the date of the revaluation less any subsequent accumulated depreciation and impairment losses.Revaluations are performed periodically to ensure that the carrying amount does not differ materially from that which would be determinedusing fair value at the balance sheet date. Expenditure incurred after the asset has been put into operation is capitalised only when it increasesthe future economic benefits embodied in the item of property, plant and equipment. All other expenditure is charged to the income statementin the period in which it is incurred.
Gains or losses arising from the retirement or disposal of property, plant and equipment, other than oil and gas properties, are determined asthe difference between the net disposal proceeds and the carrying amount of the asset and are recognised as income or expense in the incomestatement on the date of retirement or disposal. On disposal of a revalued asset, the related revaluation surplus is transferred from therevaluation reserve to retained earnings.
Depreciation is provided to write off the cost/revalued amount of each asset, other than oil and gas properties, over its estimated useful life ona straight-line basis, after taking into account its estimated residual value, as follows:
Buildings 15 to 45 yearsPlant, machinery, equipment and others 4 to 18 yearsOil depots, storage tanks and service station equipment 8 to 14 years
(g) Oil and gas propertiesThe Group uses the successful efforts method of accounting for its oil and gas producing activities. Under this method, costs of developmentwells and the related support equipment are capitalised. The cost of exploratory wells is initially capitalised as construction in progress pendingdetermination of whether the well has found proved reserves. The impairment of exploratory well costs occurs upon the determination that thewell has not found proved reserves. Exploratory wells that find oil and gas reserves in any area requiring major capital expenditure are expensedunless the well has found a sufficient quantity of reserves to justify its completion as a producing well if the required capital expenditure ismade, and drilling of the additional exploratory wells is under way or firmly planned for the near future. However, in the absence of adetermination of the discovery of proved reserves, exploratory well costs are not carried as an asset for more than one year followingcompletion of drilling. If, after one year has passed, a determination of the discovery of proved reserves cannot be made, the exploratory wellcosts are impaired and charged to expense. All other exploration costs, including geological and geophysical costs, other dry hole costs andannual lease rentals, are expensed as incurred. Capitalised costs relating to proved properties are amortised at the field level on a unit-of-production method. The amortisation rates are determined based on oil and gas reserves estimated to be recoverable from existing facilitiesover the shorter of the economic lives of crude oil and natural gas reservoirs and the terms of the relevant production licenses.
Gains and losses on the disposal of proved oil and gas properties are not recognised unless the disposal encompasses an entire property. Theproceeds on such disposals are credited to the carrying amounts of oil and gas properties.
(h) Lease prepaymentsLease prepayments represent land use rights paid to the PRC’s land bureau. Land use rights are carried at cost and amortised on a straight-linebasis over the respective periods of the rights. At 31 December 2002, lease prepayments which comprise of land use rights have beenpresented in a separate balance sheet caption. Accordingly, the comparative amount at 31 December 2001 which was previously included inproperty, plant and equipment was reclassified to conform with the current year’s presentation.
(i) Construction in progressConstruction in progress represents buildings, oil and gas properties, various plant and equipment under construction and pending installation,and is stated at cost less impairment losses. Cost comprises direct costs of construction as well as interest charges, and foreign exchangedifferences on related borrowed funds to the extent that they are regarded as an adjustment to interest charges, during the periods ofconstruction.
Construction in progress is transferred to property, plant and equipment when the asset is substantially ready for its intended use.
No depreciation is provided in respect of construction in progress.
12
2Fi
nanc
ial
Acc
ount
ing
Rep
ort
NOTES ON THE FINANCIAL STATEMENTS (CONTINUED)for the year ended 31 December 2002
2 PRINCIPAL ACCOUNTING POLICIES (Continued)
(j) Interests in subsidiariesIn the Company’s stand-alone balance sheet, interests in subsidiaries are accounted for using the equity method.
(k) InvestmentsInvestments in unlisted equity securities are stated at cost less provision for impairment losses. A provision is made where, in the opinion ofmanagement, the carrying amount of the investments exceeds its recoverable amount.
(l) Interests in associates and jointly controlled entitiesAn associate is a company, not being a subsidiary, in which the Group exercises significant influence over its management. A jointly controlledentity is an entity over which the Group can exercise joint control with other venturers. Significant influence is the power to participate in thefinancial and operating policy decisions of the investee but is not control over those policies. Joint control is the contractually agreed sharing ofcontrol over an economic activity.
Investments in associates and jointly controlled entities are accounted for using the equity method in the Company’s and the Group’s financialstatements, from the date that significant influence or joint control commences until the date that significant influence or joint control ceases.
(m)ProvisionsA provision is recognised in the balance sheet when the Group has a legal or constructive obligation as a result of a past event, and it isprobable that an outflow of economic benefits will be required to settle the obligation.
(n) Revenue recognitionRevenues associated with the sale of crude oil, natural gas, petroleum and chemical products and all other items are recorded when thecustomer accepts the goods and the significant risks and rewards of ownership and title have been transferred to the buyer. Revenue from therendering of services is recognised in the income statement upon performance of the services. No revenue is recognised if there are significantuncertainties regarding recovery of the consideration due, the possible return of goods, or when the amount of revenue and the costs incurredor to be incurred in respect of the transaction cannot be measured reliably.
Interest income is recognised on a time apportioned basis that takes into account the effective yield on the asset.
(o) Borrowing costsBorrowing costs are expensed in the income statement in the period in which they are incurred, except to the extent that they are capitalised asbeing attributable to the construction of an asset which necessarily takes a period of time to get ready for its intended use.
(p) Repairs and maintenance expenditureRepairs and maintenance expenditure, including cost of major overhaul, is expensed as incurred.
(q) Environmental expendituresEnvironmental expenditures that relate to current ongoing operations or to conditions caused by past operations are expensed as incurred.
Liabilities related to future remediation costs are recorded when environmental assessments and/or cleanups are probable and the costs can bereasonably estimated. As facts concerning environmental contingencies become known to the Group, the Group reassesses its position both withrespect to accrued liabilities and other potential exposures.
(r) Research and development costsResearch and development costs are recognised as expenses in the period in which they are incurred.
(s) Operating leasesOperating lease payments are charged to the income statement on a straight-line basis over the period of the respective leases.
(t) Retirement benefitsThe contributions payable under the Group’s retirement plans are charged to the income statement according to the contribution determined bythe plans. Further information is set out in Note 32.
(u) Impairment lossThe carrying amounts of long-lived assets are reviewed periodically in order to assess whether the recoverable amounts have declined below thecarrying amounts. These assets are tested for impairment whenever events or changes in circumstances indicate that their recorded carryingamounts may not be recoverable. When such a decline has occurred, the carrying amount is reduced to the recoverable amount. The recoverableamount is the greater of the net selling price and the value in use. In determining the value in use, expected future cash flows generated by theasset are discounted to their present value. The amount of the reduction is recognised as an expense in the income statement unless the assetis carried at revalued amount for which an impairment loss is recognised directly against any related revaluation reserve to the extent that theimpairment loss does not exceed the amount held in the revaluation reserve for that same asset.
The Group assesses at each balance sheet date whether there is any indication that an impairment loss recognised for an asset in prior yearsmay no longer exist. An impairment loss is reversed if there has been a favourable change in the estimates used to determine the recoverableamount. A subsequent increase in the recoverable amount of an asset, when the circumstances and events that led to the write-down or write-offcease to exist, is recognised as income unless the asset is carried at revalued amount. Reversal of an impairment loss on a revalued asset iscredited to the revaluation reserve except for impairment loss which was previously recognised as an expense in the income statement; areversal of such impairment loss is recognised as income. The reversal is reduced by the amount that would have been recognised asdepreciation had the write-down or write-off not occurred.
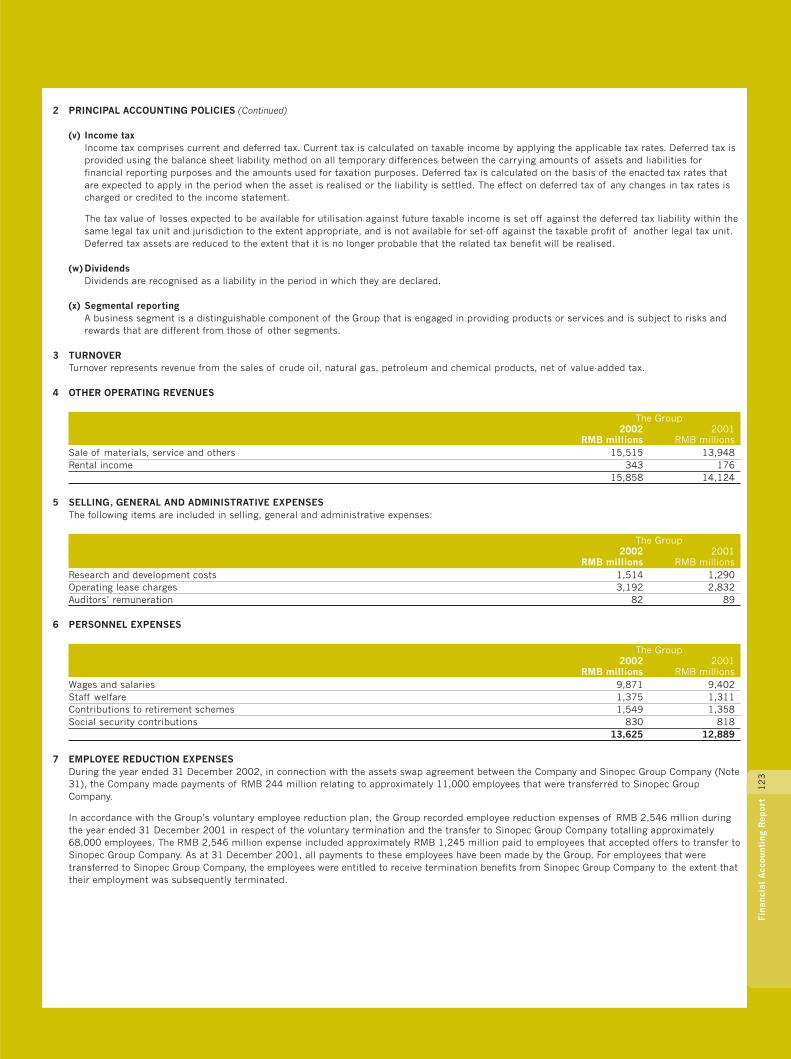
12
3Fi
nanc
ial
Acc
ount
ing
Rep
ort
2 PRINCIPAL ACCOUNTING POLICIES (Continued)
(v) Income taxIncome tax comprises current and deferred tax. Current tax is calculated on taxable income by applying the applicable tax rates. Deferred tax isprovided using the balance sheet liability method on all temporary differences between the carrying amounts of assets and liabilities forfinancial reporting purposes and the amounts used for taxation purposes. Deferred tax is calculated on the basis of the enacted tax rates thatare expected to apply in the period when the asset is realised or the liability is settled. The effect on deferred tax of any changes in tax rates ischarged or credited to the income statement.
The tax value of losses expected to be available for utilisation against future taxable income is set off against the deferred tax liability within thesame legal tax unit and jurisdiction to the extent appropriate, and is not available for set-off against the taxable profit of another legal tax unit.Deferred tax assets are reduced to the extent that it is no longer probable that the related tax benefit will be realised.
(w) DividendsDividends are recognised as a liability in the period in which they are declared.
(x) Segmental reportingA business segment is a distinguishable component of the Group that is engaged in providing products or services and is subject to risks andrewards that are different from those of other segments.
3 TURNOVERTurnover represents revenue from the sales of crude oil, natural gas, petroleum and chemical products, net of value-added tax.
4 OTHER OPERATING REVENUES
The Group2002 2001
RMB millions RMB millionsSale of materials, service and others 15,515 13,948Rental income 343 176
15,858 14,124
5 SELLING, GENERAL AND ADMINISTRATIVE EXPENSESThe following items are included in selling, general and administrative expenses:
The Group2002 2001
RMB millions RMB millionsResearch and development costs 1,514 1,290Operating lease charges 3,192 2,832Auditors’ remuneration 82 89
6 PERSONNEL EXPENSES
The Group2002 2001
RMB millions RMB millionsWages and salaries 9,871 9,402Staff welfare 1,375 1,311Contributions to retirement schemes 1,549 1,358Social security contributions 830 818
13,625 12,889
7 EMPLOYEE REDUCTION EXPENSESDuring the year ended 31 December 2002, in connection with the assets swap agreement between the Company and Sinopec Group Company (Note31), the Company made payments of RMB 244 million relating to approximately 11,000 employees that were transferred to Sinopec GroupCompany.
In accordance with the Group’s voluntary employee reduction plan, the Group recorded employee reduction expenses of RMB 2,546 million duringthe year ended 31 December 2001 in respect of the voluntary termination and the transfer to Sinopec Group Company totalling approximately68,000 employees. The RMB 2,546 million expense included approximately RMB 1,245 million paid to employees that accepted offers to transfer toSinopec Group Company. As at 31 December 2001, all payments to these employees have been made by the Group. For employees that weretransferred to Sinopec Group Company, the employees were entitled to receive termination benefits from Sinopec Group Company to the extent thattheir employment was subsequently terminated.
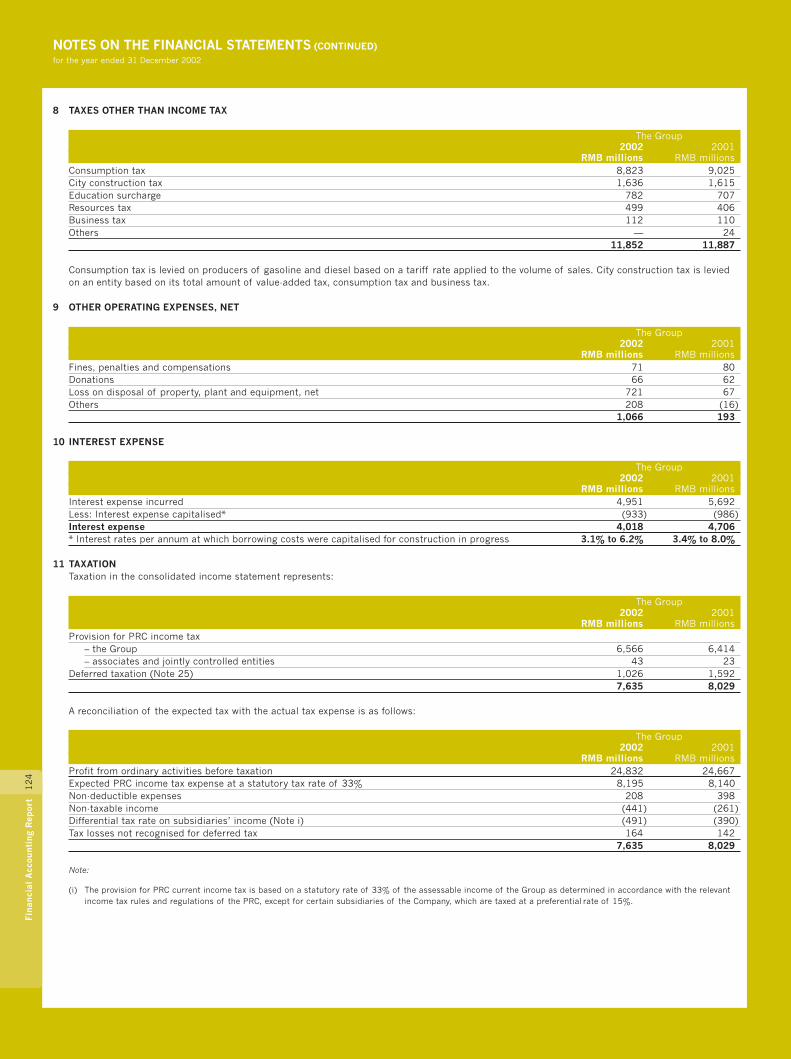
12
4Fi
nanc
ial
Acc
ount
ing
Rep
ort
NOTES ON THE FINANCIAL STATEMENTS (CONTINUED)for the year ended 31 December 2002
8 TAXES OTHER THAN INCOME TAX
The Group2002 2001
RMB millions RMB millionsConsumption tax 8,823 9,025City construction tax 1,636 1,615Education surcharge 782 707Resources tax 499 406Business tax 112 110Others — 24
11,852 11,887
Consumption tax is levied on producers of gasoline and diesel based on a tariff rate applied to the volume of sales. City construction tax is leviedon an entity based on its total amount of value-added tax, consumption tax and business tax.
9 OTHER OPERATING EXPENSES, NET
The Group2002 2001
RMB millions RMB millionsFines, penalties and compensations 71 80Donations 66 62Loss on disposal of property, plant and equipment, net 721 67Others 208 (16)
1,066 193
10 INTEREST EXPENSE
The Group2002 2001
RMB millions RMB millionsInterest expense incurred 4,951 5,692Less: Interest expense capitalised* (933) (986)Interest expense 4,018 4,706* Interest rates per annum at which borrowing costs were capitalised for construction in progress 3.1% to 6.2% 3.4% to 8.0%
11 TAXATIONTaxation in the consolidated income statement represents:
The Group2002 2001
RMB millions RMB millionsProvision for PRC income tax
– the Group 6,566 6,414– associates and jointly controlled entities 43 23
Deferred taxation (Note 25) 1,026 1,5927,635 8,029
A reconciliation of the expected tax with the actual tax expense is as follows:
The Group2002 2001
RMB millions RMB millionsProfit from ordinary activities before taxation 24,832 24,667Expected PRC income tax expense at a statutory tax rate of 33% 8,195 8,140Non-deductible expenses 208 398Non-taxable income (441) (261)Differential tax rate on subsidiaries’ income (Note i) (491) (390)Tax losses not recognised for deferred tax 164 142
7,635 8,029
Note:
(i) The provision for PRC current income tax is based on a statutory rate of 33% of the assessable income of the Group as determined in accordance with the relevantincome tax rules and regulations of the PRC, except for certain subsidiaries of the Company, which are taxed at a preferential rate of 15%.
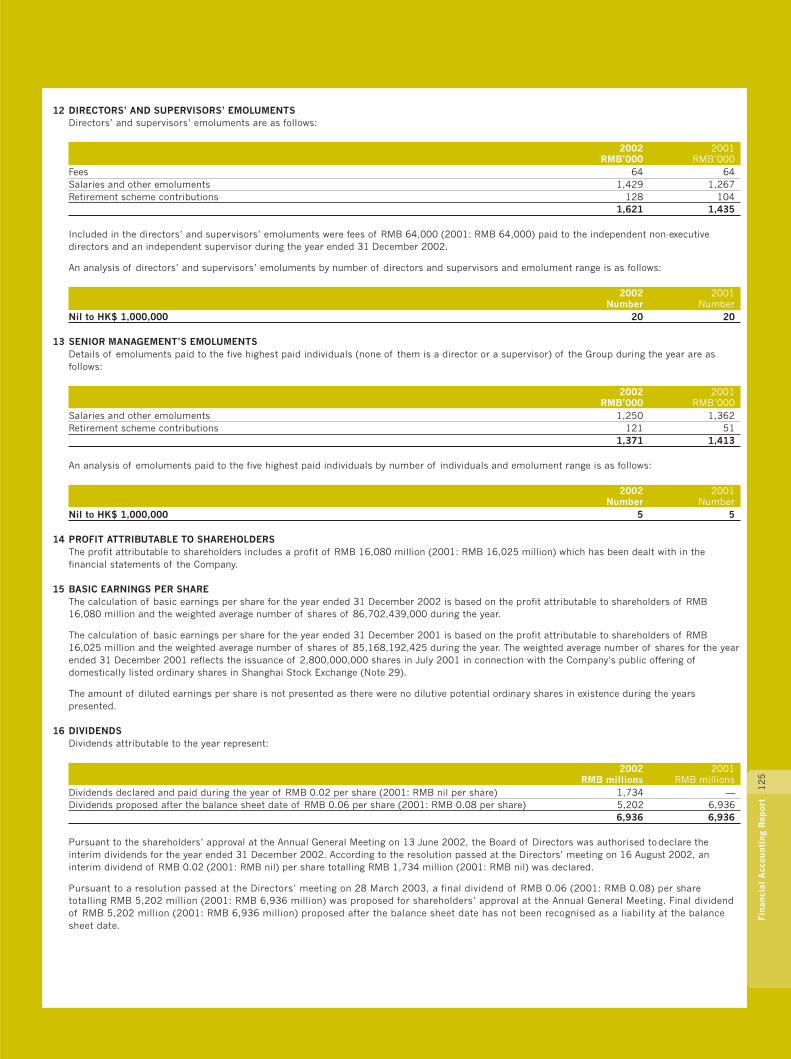
12
5Fi
nanc
ial
Acc
ount
ing
Rep
ort
12 DIRECTORS’ AND SUPERVISORS’ EMOLUMENTSDirectors’ and supervisors’ emoluments are as follows:
2002 2001RMB’000 RMB’000
Fees 64 64Salaries and other emoluments 1,429 1,267Retirement scheme contributions 128 104
1,621 1,435
Included in the directors’ and supervisors’ emoluments were fees of RMB 64,000 (2001: RMB 64,000) paid to the independent non-executivedirectors and an independent supervisor during the year ended 31 December 2002.
An analysis of directors’ and supervisors’ emoluments by number of directors and supervisors and emolument range is as follows:
2002 2001Number Number
Nil to HK$ 1,000,000 20 20
13 SENIOR MANAGEMENT’S EMOLUMENTSDetails of emoluments paid to the five highest paid individuals (none of them is a director or a supervisor) of the Group during the year are asfollows:
2002 2001RMB’000 RMB’000
Salaries and other emoluments 1,250 1,362Retirement scheme contributions 121 51
1,371 1,413
An analysis of emoluments paid to the five highest paid individuals by number of individuals and emolument range is as follows:
2002 2001Number Number
Nil to HK$ 1,000,000 5 5
14 PROFIT ATTRIBUTABLE TO SHAREHOLDERSThe profit attributable to shareholders includes a profit of RMB 16,080 million (2001: RMB 16,025 million) which has been dealt with in thefinancial statements of the Company.
15 BASIC EARNINGS PER SHAREThe calculation of basic earnings per share for the year ended 31 December 2002 is based on the profit attributable to shareholders of RMB16,080 million and the weighted average number of shares of 86,702,439,000 during the year.
The calculation of basic earnings per share for the year ended 31 December 2001 is based on the profit attributable to shareholders of RMB16,025 million and the weighted average number of shares of 85,168,192,425 during the year. The weighted average number of shares for the yearended 31 December 2001 reflects the issuance of 2,800,000,000 shares in July 2001 in connection with the Company’s public offering ofdomestically listed ordinary shares in Shanghai Stock Exchange (Note 29).
The amount of diluted earnings per share is not presented as there were no dilutive potential ordinary shares in existence during the yearspresented.
16 DIVIDENDSDividends attributable to the year represent:
2002 2001RMB millions RMB millions
Dividends declared and paid during the year of RMB 0.02 per share (2001: RMB nil per share) 1,734 —Dividends proposed after the balance sheet date of RMB 0.06 per share (2001: RMB 0.08 per share) 5,202 6,936
6,936 6,936
Pursuant to the shareholders’ approval at the Annual General Meeting on 13 June 2002, the Board of Directors was authorised to declare theinterim dividends for the year ended 31 December 2002. According to the resolution passed at the Directors’ meeting on 16 August 2002, aninterim dividend of RMB 0.02 (2001: RMB nil) per share totalling RMB 1,734 million (2001: RMB nil) was declared.
Pursuant to a resolution passed at the Directors’ meeting on 28 March 2003, a final dividend of RMB 0.06 (2001: RMB 0.08) per sharetotalling RMB 5,202 million (2001: RMB 6,936 million) was proposed for shareholders’ approval at the Annual General Meeting. Final dividendof RMB 5,202 million (2001: RMB 6,936 million) proposed after the balance sheet date has not been recognised as a liability at the balancesheet date.
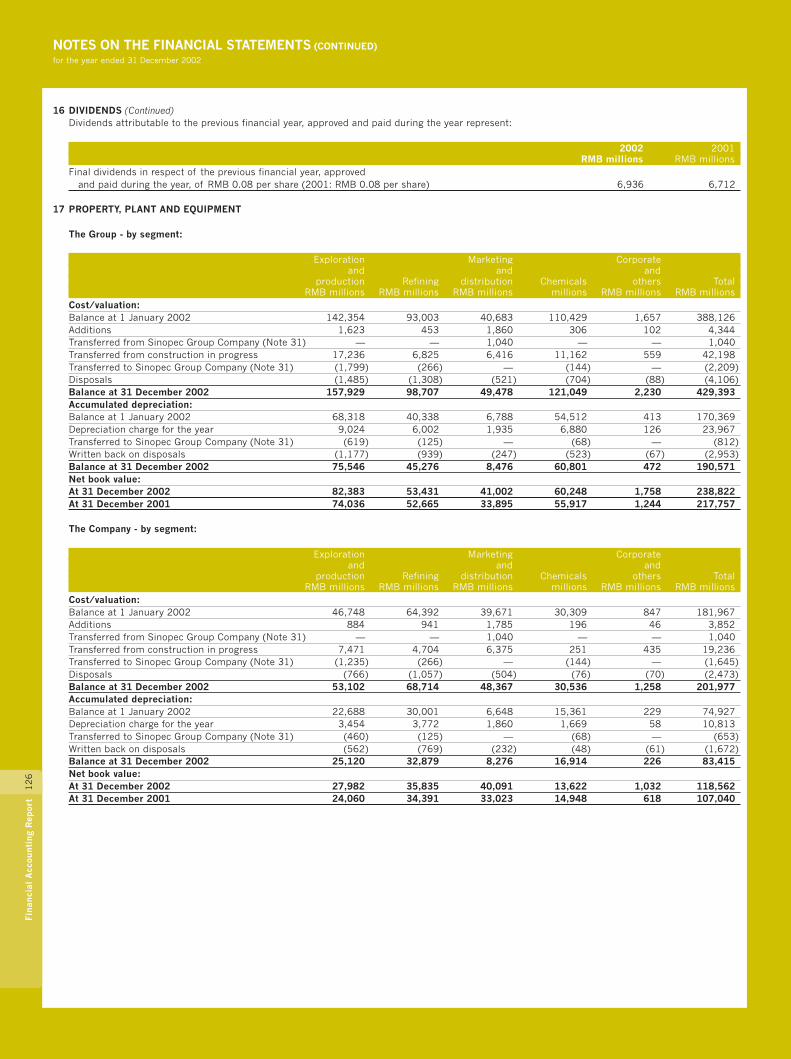
12
6Fi
nanc
ial
Acc
ount
ing
Rep
ort
NOTES ON THE FINANCIAL STATEMENTS (CONTINUED)for the year ended 31 December 2002
16 DIVIDENDS (Continued)Dividends attributable to the previous financial year, approved and paid during the year represent:
2002 2001RMB millions RMB millions
Final dividends in respect of the previous financial year, approvedand paid during the year, of RMB 0.08 per share (2001: RMB 0.08 per share) 6,936 6,712
17 PROPERTY, PLANT AND EQUIPMENT
The Group - by segment:
Exploration Marketing Corporateand and and
production Refining distribution Chemicals others TotalRMB millions RMB millions RMB millions millions RMB millions RMB millions
Cost/valuation:Balance at 1 January 2002 142,354 93,003 40,683 110,429 1,657 388,126Additions 1,623 453 1,860 306 102 4,344Transferred from Sinopec Group Company (Note 31) — — 1,040 — — 1,040Transferred from construction in progress 17,236 6,825 6,416 11,162 559 42,198Transferred to Sinopec Group Company (Note 31) (1,799) (266) — (144) — (2,209)Disposals (1,485) (1,308) (521) (704) (88) (4,106)Balance at 31 December 2002 157,929 98,707 49,478 121,049 2,230 429,393Accumulated depreciation:Balance at 1 January 2002 68,318 40,338 6,788 54,512 413 170,369Depreciation charge for the year 9,024 6,002 1,935 6,880 126 23,967Transferred to Sinopec Group Company (Note 31) (619) (125) — (68) — (812)Written back on disposals (1,177) (939) (247) (523) (67) (2,953)Balance at 31 December 2002 75,546 45,276 8,476 60,801 472 190,571Net book value:At 31 December 2002 82,383 53,431 41,002 60,248 1,758 238,822At 31 December 2001 74,036 52,665 33,895 55,917 1,244 217,757
The Company - by segment:
Exploration Marketing Corporateand and and
production Refining distribution Chemicals others TotalRMB millions RMB millions RMB millions millions RMB millions RMB millions
Cost/valuation:Balance at 1 January 2002 46,748 64,392 39,671 30,309 847 181,967Additions 884 941 1,785 196 46 3,852Transferred from Sinopec Group Company (Note 31) — — 1,040 — — 1,040Transferred from construction in progress 7,471 4,704 6,375 251 435 19,236Transferred to Sinopec Group Company (Note 31) (1,235) (266) — (144) — (1,645)Disposals (766) (1,057) (504) (76) (70) (2,473)Balance at 31 December 2002 53,102 68,714 48,367 30,536 1,258 201,977Accumulated depreciation:Balance at 1 January 2002 22,688 30,001 6,648 15,361 229 74,927Depreciation charge for the year 3,454 3,772 1,860 1,669 58 10,813Transferred to Sinopec Group Company (Note 31) (460) (125) — (68) — (653)Written back on disposals (562) (769) (232) (48) (61) (1,672)Balance at 31 December 2002 25,120 32,879 8,276 16,914 226 83,415Net book value:At 31 December 2002 27,982 35,835 40,091 13,622 1,032 118,562At 31 December 2001 24,060 34,391 33,023 14,948 618 107,040

12
7Fi
nanc
ial
Acc
ount
ing
Rep
ort
17 PROPERTY, PLANT AND EQUIPMENT (Continued)
The Group - by asset class:
Oil depots, Plant,storage tanks machinery,
Oil and gas and service equipmentBuildings properties stations and others Total
RMB millions RMB millions RMB millions RMB millions RMB millionsCost/valuation:Balance at 1 January 2002 33,397 125,119 33,321 196,289 388,126Additions 365 52 1,160 2,767 4,344Transferred from Sinopec Group Company (Note 31) — — 1,040 — 1,040Transferred from construction in progress 1,407 16,431 6,019 18,341 42,198Reclassification 1,077 295 (4,361) 2,989 —Transferred to Sinopec Group Company (Note 31) (185) (196) — (1,828) (2,209)Disposals (317) (769) (252) (2,768) (4,106)Balance at 31 December 2002 35,744 140,932 36,927 215,790 429,393Accumulated depreciation:Balance at 1 January 2002 12,934 62,676 5,902 88,857 170,369Depreciation charge for the year 1,539 7,557 1,391 13,480 23,967Reclassification 384 118 (748) 246 —Transferred to Sinopec Group Company (Note 31) (56) (51) — (705) (812)Written back on disposals (116) (667) (163) (2,007) (2,953)Balance at 31 December 2002 14,685 69,633 6,382 99,871 190,571Net book value:At 31 December 2002 21,059 71,299 30,545 115,919 238,822At 31 December 2001 20,463 62,443 27,419 107,432 217,757
The Company - by asset class:
Oil depots, Plant,storage tanks machinery,
Oil and gas and service equipmentBuildings properties stations and others Total
RMB millions RMB millions RMB millions RMB millions RMB millionsCost/valuation:Balance at 1 January 2002 17,221 39,869 32,397 92,480 181,967Additions 316 52 1,132 2,352 3,852Transferred from Sinopec Group Company (Note 31) — — 1,040 — 1,040Transferred from construction in progress 1,024 6,899 5,839 5,474 19,236Reclassification 175 (380) (4,361) 4,566 —Transferred to Sinopec Group Company (Note 31) (91) (196) — (1,358) (1,645)Disposals (206) (272) (251) (1,744) (2,473)Balance at 31 December 2002 18,439 45,972 35,796 101,770 201,977Accumulated depreciation:Balance at 1 January 2002 5,651 20,919 5,828 42,529 74,927Depreciation charge for the year 836 2,955 1,319 5,703 10,813Reclassification 67 (165) (748) 846 —Transferred to Sinopec Group Company (Note 31) (36) (51) — (566) (653)Written back on disposals (89) (217) (163) (1,203) (1,672)Balance at 31 December 2002 6,429 23,441 6,236 47,309 83,415Net book value:At 31 December 2002 12,010 22,531 29,560 54,461 118,562At 31 December 2001 11,570 18,950 26,569 49,951 107,040
As required by the relevant PRC regulations with respect to the Reorganisation, the property, plant and equipment of the Group at 30 September1999 were valued for each asset class by China United Assets Appraisal Corporation, Beijing Zhong Zheng Appraisal Company, CIECC AssetsAppraisal Corporation and Zhong Fa International Properties Valuation Corporation, independent valuers registered in the PRC, on a depreciatedreplacement cost basis. The value of property, plant and equipment was determined at RMB 159,788 million. The surplus on revaluation of RMB32,320 million, net of amounts allocated to minority interests, was incorporated in the financial statements of the Group at 31 December 1999. Inconnection with the Acquisition, the property, plant and equipment of Sinopec National Star were revalued at 31 December 2000, by a firm ofindependent valuers and approved by the Ministry of Finance. The value of property, plant and equipment of Sinopec National Star pursuant to thevaluation, based on a depreciated replacement cost basis, was determined at RMB 4,373 million, resulting in a surplus on revaluation of RMB1,136 million, net of amounts allocated to minority interests.

12
8Fi
nanc
ial
Acc
ount
ing
Rep
ort
NOTES ON THE FINANCIAL STATEMENTS (CONTINUED)for the year ended 31 December 2002
18 CONSTRUCTION IN PROGRESS
The Group:
Exploration Marketing Corporateand and and
production Refining distribution Chemicals others TotalRMB millions RMB millions RMB millions millions RMB millions RMB millions
Balance at 1 January 2002 3,163 6,636 8,722 7,420 509 26,450Additions 20,376 6,080 5,122 7,018 443 39,039Dry hole costs written off (1,771) — — — — (1,771)Amount transferred to Sinopec
Group Company (Note 31) (6) (10) — — — (16)Transferred to fixed assets (17,236) (6,825) (6,416) (11,162) (559) (42,198)Balance at 31 December 2002 4,526 5,881 7,428 3,276 393 21,504
The Company:
Exploration Marketing Corporateand and and
production Refining distribution Chemicals others TotalRMB millions RMB millions RMB millions millions RMB millions RMB millions
Balance at 1 January 2002 1,893 5,179 8,476 737 468 16,753Additions 9,653 3,772 4,946 431 343 19,145Dry hole costs written off (951) — — — — (951)Amount transferred to Sinopec
Group Company (Note 31) (6) (10) — — — (16)Transferred to fixed assets (7,471) (4,704) (6,375) (251) (435) (19,236)Balance at 31 December 2002 3,118 4,237 7,047 917 376 15,695
19 INTERESTS IN SUBSIDIARIES
The Company2002 2001
RMB millions RMB millionsShare of net assets 89,332 89,608
Details of the Company’s principal subsidiaries at 31 December 2002 are set out in Note 34.
20 INVESTMENTS
The Group The Company2002 2001 2002 2001
RMB millions RMB millions RMB millions RMB millionsUnlisted investments, at cost 2,738 3,463 635 611Less: Provision for impairment losses (184) (181) (149) (149)
2,554 3,282 486 462
Unlisted investments represent the Group’s interests in PRC domiciled enterprises which are mainly engaged in non-oil and gas activities andoperations. The Group has no investments in marketable securities.
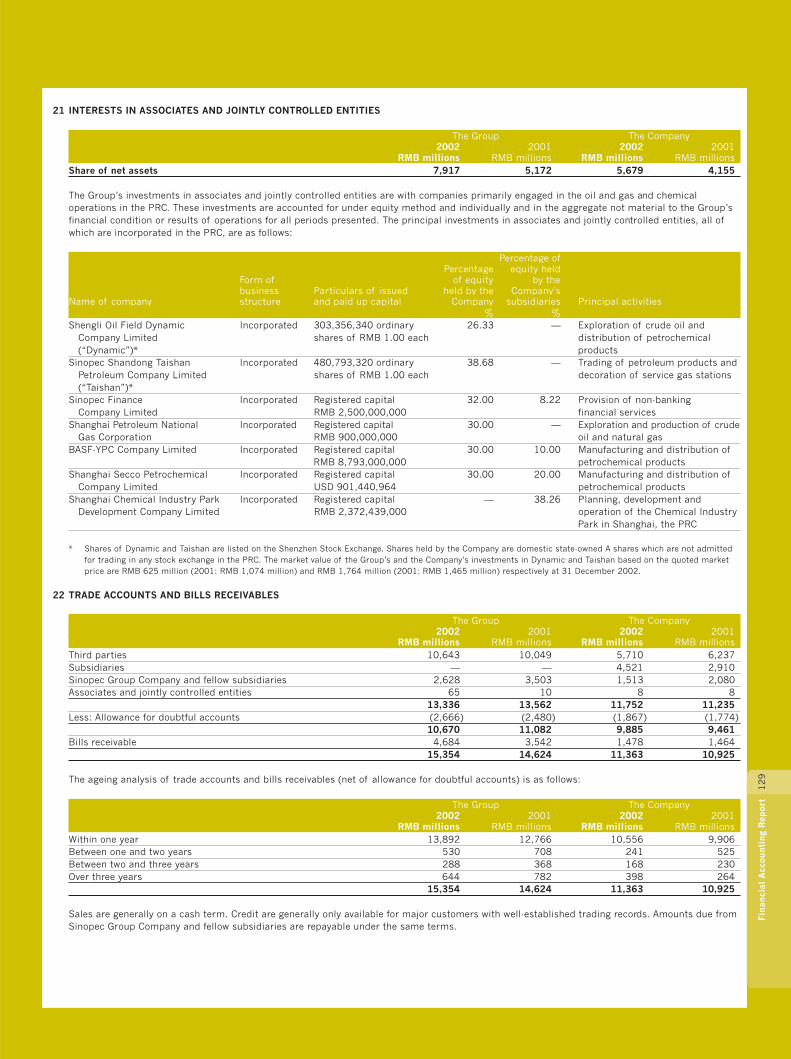
12
9Fi
nanc
ial
Acc
ount
ing
Rep
ort
21 INTERESTS IN ASSOCIATES AND JOINTLY CONTROLLED ENTITIES
The Group The Company2002 2001 2002 2001
RMB millions RMB millions RMB millions RMB millionsShare of net assets 7,917 5,172 5,679 4,155
The Group’s investments in associates and jointly controlled entities are with companies primarily engaged in the oil and gas and chemicaloperations in the PRC. These investments are accounted for under equity method and individually and in the aggregate not material to the Group’sfinancial condition or results of operations for all periods presented. The principal investments in associates and jointly controlled entities, all ofwhich are incorporated in the PRC, are as follows:
Percentage ofPercentage equity held
Form of of equity by thebusiness Particulars of issued held by the Company’s
Name of company structure and paid up capital Company subsidiaries Principal activities% %
Shengli Oil Field Dynamic Incorporated 303,356,340 ordinary 26.33 — Exploration of crude oil andCompany Limited shares of RMB 1.00 each distribution of petrochemical(“Dynamic”)* products
Sinopec Shandong Taishan Incorporated 480,793,320 ordinary 38.68 — Trading of petroleum products andPetroleum Company Limited shares of RMB 1.00 each decoration of service gas stations(“Taishan”)*
Sinopec Finance Incorporated Registered capital 32.00 8.22 Provision of non-bankingCompany Limited RMB 2,500,000,000 financial services
Shanghai Petroleum National Incorporated Registered capital 30.00 — Exploration and production of crudeGas Corporation RMB 900,000,000 oil and natural gas
BASF-YPC Company Limited Incorporated Registered capital 30.00 10.00 Manufacturing and distribution ofRMB 8,793,000,000 petrochemical products
Shanghai Secco Petrochemical Incorporated Registered capital 30.00 20.00 Manufacturing and distribution ofCompany Limited USD 901,440,964 petrochemical products
Shanghai Chemical Industry Park Incorporated Registered capital — 38.26 Planning, development andDevelopment Company Limited RMB 2,372,439,000 operation of the Chemical Industry
Park in Shanghai, the PRC
* Shares of Dynamic and Taishan are listed on the Shenzhen Stock Exchange. Shares held by the Company are domestic state-owned A shares which are not admittedfor trading in any stock exchange in the PRC. The market value of the Group’s and the Company’s investments in Dynamic and Taishan based on the quoted marketprice are RMB 625 million (2001: RMB 1,074 million) and RMB 1,764 million (2001: RMB 1,465 million) respectively at 31 December 2002.
22 TRADE ACCOUNTS AND BILLS RECEIVABLES
The Group The Company2002 2001 2002 2001
RMB millions RMB millions RMB millions RMB millionsThird parties 10,643 10,049 5,710 6,237Subsidiaries — — 4,521 2,910Sinopec Group Company and fellow subsidiaries 2,628 3,503 1,513 2,080Associates and jointly controlled entities 65 10 8 8
13,336 13,562 11,752 11,235Less: Allowance for doubtful accounts (2,666) (2,480) (1,867) (1,774)
10,670 11,082 9,885 9,461Bills receivable 4,684 3,542 1,478 1,464
15,354 14,624 11,363 10,925
The ageing analysis of trade accounts and bills receivables (net of allowance for doubtful accounts) is as follows:
The Group The Company2002 2001 2002 2001
RMB millions RMB millions RMB millions RMB millionsWithin one year 13,892 12,766 10,556 9,906Between one and two years 530 708 241 525Between two and three years 288 368 168 230Over three years 644 782 398 264
15,354 14,624 11,363 10,925
Sales are generally on a cash term. Credit are generally only available for major customers with well-established trading records. Amounts due fromSinopec Group Company and fellow subsidiaries are repayable under the same terms.

13
0Fi
nanc
ial
Acc
ount
ing
Rep
ort
NOTES ON THE FINANCIAL STATEMENTS (CONTINUED)for the year ended 31 December 2002
23 INVENTORIES
The Group The Company2002 2001 2002 2001
RMB millions RMB millions RMB millions RMB millionsCrude oil and other raw materials 21,295 17,749 10,426 9,954Work in progress 6,192 5,050 3,387 3,556Finished goods 15,086 20,442 10,248 12,925Spare parts and consumables 4,210 3,555 1,353 1,184
46,783 46,796 25,414 27,619Less: Allowance for diminution in value of inventories (486) (602) (224) (292)
46,297 46,194 25,190 27,327
At 31 December 2002, the carrying amount of the Group’s and the Company’s inventories carried at net realisable value amounted to RMB 1,624million (2001: RMB 1,924 million) and RMB 966 million (2001: RMB 1,120 million), respectively.
The cost of inventories recognised as an expense in the consolidated income statement amounted to RMB 258,594 million for the year ended 31December 2002 (2001: RMB 249,700 million).
24 PREPAID EXPENSES AND OTHER CURRENT ASSETS
The Group The Company2002 2001 2002 2001
RMB millions RMB millions RMB millions RMB millionsAdvances to third parties 3,500 6,618 1,868 5,328Amounts due from Sinopec Group Company and fellow subsidiaries 11,714 9,421 10,085 7,400Amounts due from subsidiaries — — 10,419 8,802Other receivables 1,645 3,406 875 2,309Purchase deposits 1,610 2,426 1,216 1,495Prepayments in connection with construction work
and equipment purchases 1,196 1,543 1,077 1,072Prepaid value-added tax and customs duty 1,511 2,284 749 1,651Amounts due from associates and jointly controlled entities 345 373 310 373Prepaid rental — 52 — 23
21,521 26,123 26,599 28,453
25 DEFERRED TAX ASSETS AND LIABILITIESDeferred tax assets and deferred tax liabilities are attributable to the items detailed in the table below:
The Group
Assets Liabilities Net balance2002 2001 2002 2001 2002 2001
RMB millions RMB millions RMB millions RMB millions RMB millions RMB millionsCurrentProvisions, primarily for receivables and inventories 275 432 — — 275 432Non-currentProperty, plant and equipment 47 35 (627) (788) (580) (753)Accelerated depreciation — — (2,958) (2,185) (2,958) (2,185)Tax value of losses carried forward, net of
valuation allowance 30 173 — — 30 173Land use rights (Note) 364 — — — 364 —Others 16 129 (14) (8) 2 121Deferred tax assets/(liabilities) 732 769 (3,599) (2,981) (2,867) (2,212)
The Company
Assets Liabilities Net balance2002 2001 2002 2001 2002 2001
RMB millions RMB millions RMB millions RMB millions RMB millions RMB millionsCurrentProvisions, primarily for receivables and inventories 57 281 — — 57 281Non-currentProperty, plant and equipment 36 3 (240) (119) (204) (116)Accelerated depreciation — — (799) (554) (799) (554)Others 15 53 (3) — 12 53Deferred tax assets/(liabilities) 108 337 (1,042) (673) (934) (336)
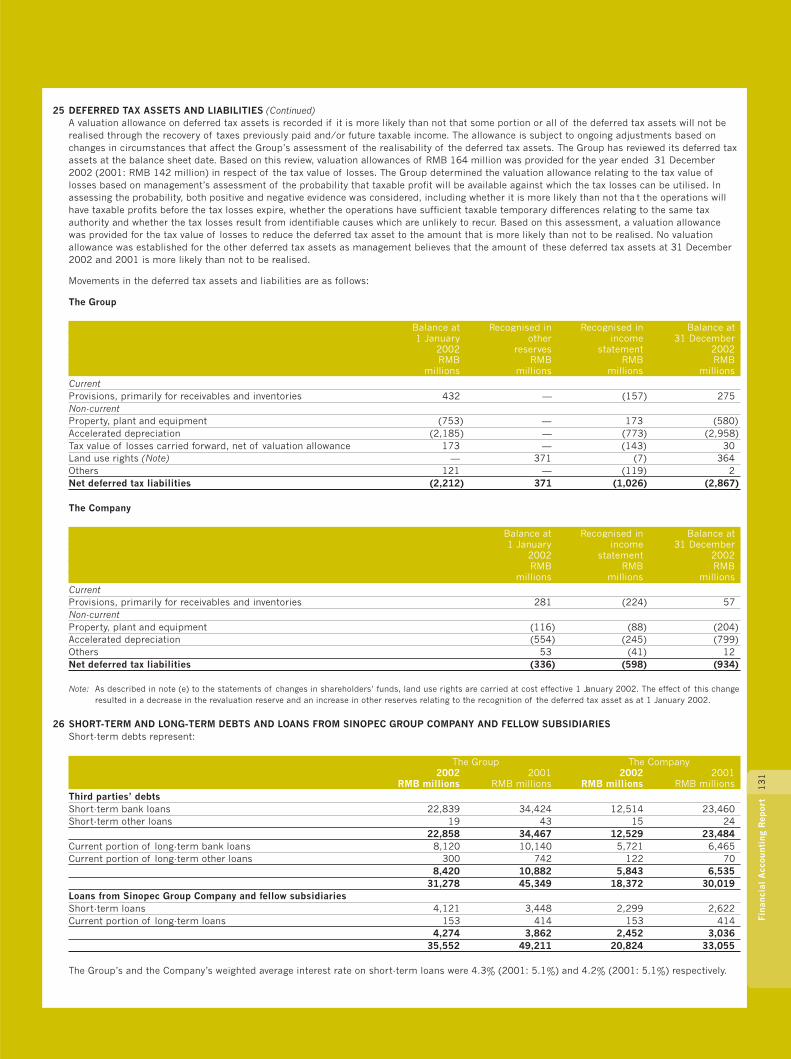
13
1Fi
nanc
ial
Acc
ount
ing
Rep
ort
25 DEFERRED TAX ASSETS AND LIABILITIES (Continued)A valuation allowance on deferred tax assets is recorded if it is more likely than not that some portion or all of the deferred tax assets will not berealised through the recovery of taxes previously paid and/or future taxable income. The allowance is subject to ongoing adjustments based onchanges in circumstances that affect the Group’s assessment of the realisability of the deferred tax assets. The Group has reviewed its deferred taxassets at the balance sheet date. Based on this review, valuation allowances of RMB 164 million was provided for the year ended 31 December2002 (2001: RMB 142 million) in respect of the tax value of losses. The Group determined the valuation allowance relating to the tax value oflosses based on management’s assessment of the probability that taxable profit will be available against which the tax losses can be utilised. Inassessing the probability, both positive and negative evidence was considered, including whether it is more likely than not that the operations willhave taxable profits before the tax losses expire, whether the operations have sufficient taxable temporary differences relating to the same taxauthority and whether the tax losses result from identifiable causes which are unlikely to recur. Based on this assessment, a valuation allowancewas provided for the tax value of losses to reduce the deferred tax asset to the amount that is more likely than not to be realised. No valuationallowance was established for the other deferred tax assets as management believes that the amount of these deferred tax assets at 31 December2002 and 2001 is more likely than not to be realised.
Movements in the deferred tax assets and liabilities are as follows:
The Group
Balance at Recognised in Recognised in Balance at1 January other income 31 December
2002 reserves statement 2002RMB RMB RMB RMB
millions millions millions millionsCurrentProvisions, primarily for receivables and inventories 432 — (157) 275Non-currentProperty, plant and equipment (753) — 173 (580)Accelerated depreciation (2,185) — (773) (2,958)Tax value of losses carried forward, net of valuation allowance 173 — (143) 30Land use rights (Note) — 371 (7) 364Others 121 — (119) 2Net deferred tax liabilities (2,212) 371 (1,026) (2,867)
The Company
Balance at Recognised in Balance at1 January income 31 December
2002 statement 2002RMB RMB RMB
millions millions millionsCurrentProvisions, primarily for receivables and inventories 281 (224) 57Non-currentProperty, plant and equipment (116) (88) (204)Accelerated depreciation (554) (245) (799)Others 53 (41) 12Net deferred tax liabilities (336) (598) (934)
Note: As described in note (e) to the statements of changes in shareholders’ funds, land use rights are carried at cost effective 1 January 2002. The effect of this changeresulted in a decrease in the revaluation reserve and an increase in other reserves relating to the recognition of the deferred tax asset as at 1 January 2002.
26 SHORT-TERM AND LONG-TERM DEBTS AND LOANS FROM SINOPEC GROUP COMPANY AND FELLOW SUBSIDIARIESShort-term debts represent:
The Group The Company2002 2001 2002 2001
RMB millions RMB millions RMB millions RMB millionsThird parties’ debtsShort-term bank loans 22,839 34,424 12,514 23,460Short-term other loans 19 43 15 24
22,858 34,467 12,529 23,484Current portion of long-term bank loans 8,120 10,140 5,721 6,465Current portion of long-term other loans 300 742 122 70
8,420 10,882 5,843 6,53531,278 45,349 18,372 30,019
Loans from Sinopec Group Company and fellow subsidiariesShort-term loans 4,121 3,448 2,299 2,622Current portion of long-term loans 153 414 153 414
4,274 3,862 2,452 3,03635,552 49,211 20,824 33,055
The Group’s and the Company’s weighted average interest rate on short-term loans were 4.3% (2001: 5.1%) and 4.2% (2001: 5.1%) respectively.
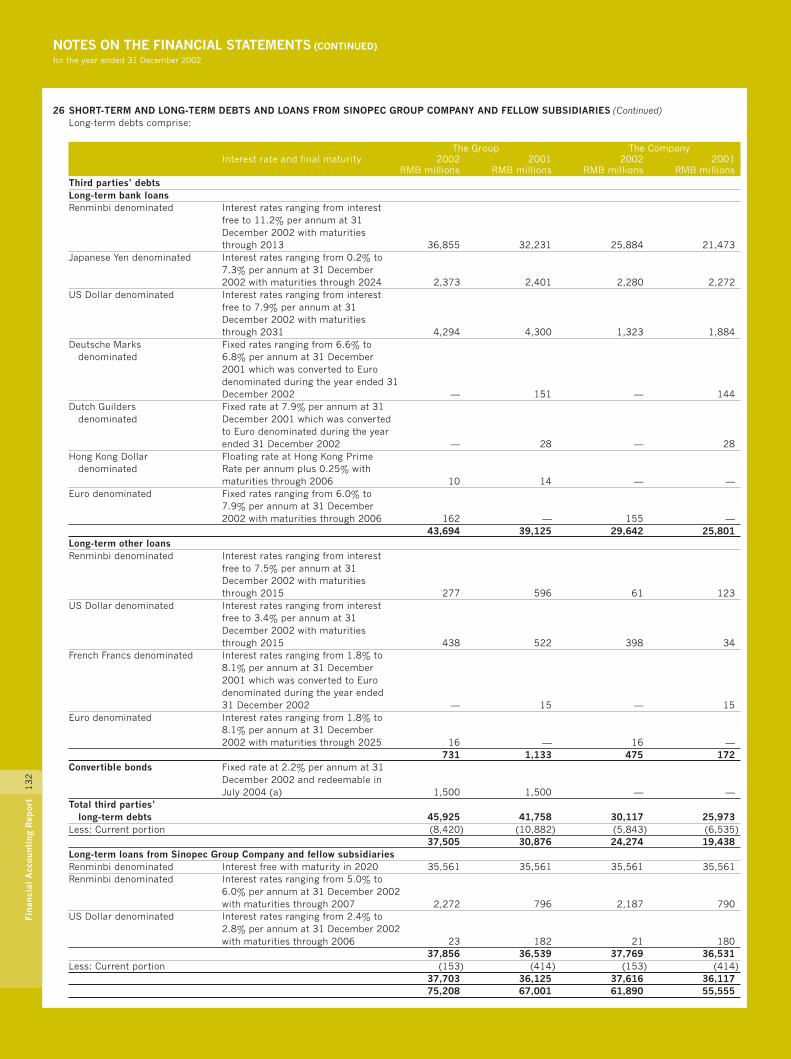
13
2Fi
nanc
ial
Acc
ount
ing
Rep
ort
NOTES ON THE FINANCIAL STATEMENTS (CONTINUED)for the year ended 31 December 2002
26 SHORT-TERM AND LONG-TERM DEBTS AND LOANS FROM SINOPEC GROUP COMPANY AND FELLOW SUBSIDIARIES (Continued)Long-term debts comprise:
The Group The CompanyInterest rate and final maturity 2002 2001 2002 2001
RMB millions RMB millions RMB millions RMB millionsThird parties’ debtsLong-term bank loansRenminbi denominated Interest rates ranging from interest
free to 11.2% per annum at 31December 2002 with maturitiesthrough 2013 36,855 32,231 25,884 21,473
Japanese Yen denominated Interest rates ranging from 0.2% to7.3% per annum at 31 December2002 with maturities through 2024 2,373 2,401 2,280 2,272
US Dollar denominated Interest rates ranging from interestfree to 7.9% per annum at 31December 2002 with maturitiesthrough 2031 4,294 4,300 1,323 1,884
Deutsche Marks Fixed rates ranging from 6.6% todenominated 6.8% per annum at 31 December
2001 which was converted to Eurodenominated during the year ended 31December 2002 — 151 — 144
Dutch Guilders Fixed rate at 7.9% per annum at 31denominated December 2001 which was converted
to Euro denominated during the yearended 31 December 2002 — 28 — 28
Hong Kong Dollar Floating rate at Hong Kong Primedenominated Rate per annum plus 0.25% with
maturities through 2006 10 14 — —Euro denominated Fixed rates ranging from 6.0% to
7.9% per annum at 31 December2002 with maturities through 2006 162 — 155 —
43,694 39,125 29,642 25,801Long-term other loansRenminbi denominated Interest rates ranging from interest
free to 7.5% per annum at 31December 2002 with maturitiesthrough 2015 277 596 61 123
US Dollar denominated Interest rates ranging from interestfree to 3.4% per annum at 31December 2002 with maturitiesthrough 2015 438 522 398 34
French Francs denominated Interest rates ranging from 1.8% to8.1% per annum at 31 December2001 which was converted to Eurodenominated during the year ended31 December 2002 — 15 — 15
Euro denominated Interest rates ranging from 1.8% to8.1% per annum at 31 December2002 with maturities through 2025 16 — 16 —
731 1,133 475 172Convertible bonds Fixed rate at 2.2% per annum at 31
December 2002 and redeemable inJuly 2004 (a) 1,500 1,500 — —
Total third parties’long-term debts 45,925 41,758 30,117 25,973
Less: Current portion (8,420) (10,882) (5,843) (6,535)37,505 30,876 24,274 19,438
Long-term loans from Sinopec Group Company and fellow subsidiariesRenminbi denominated Interest free with maturity in 2020 35,561 35,561 35,561 35,561Renminbi denominated Interest rates ranging from 5.0% to
6.0% per annum at 31 December 2002with maturities through 2007 2,272 796 2,187 790
US Dollar denominated Interest rates ranging from 2.4% to2.8% per annum at 31 December 2002with maturities through 2006 23 182 21 180
37,856 36,539 37,769 36,531Less: Current portion (153) (414) (153) (414)
37,703 36,125 37,616 36,11775,208 67,001 61,890 55,555
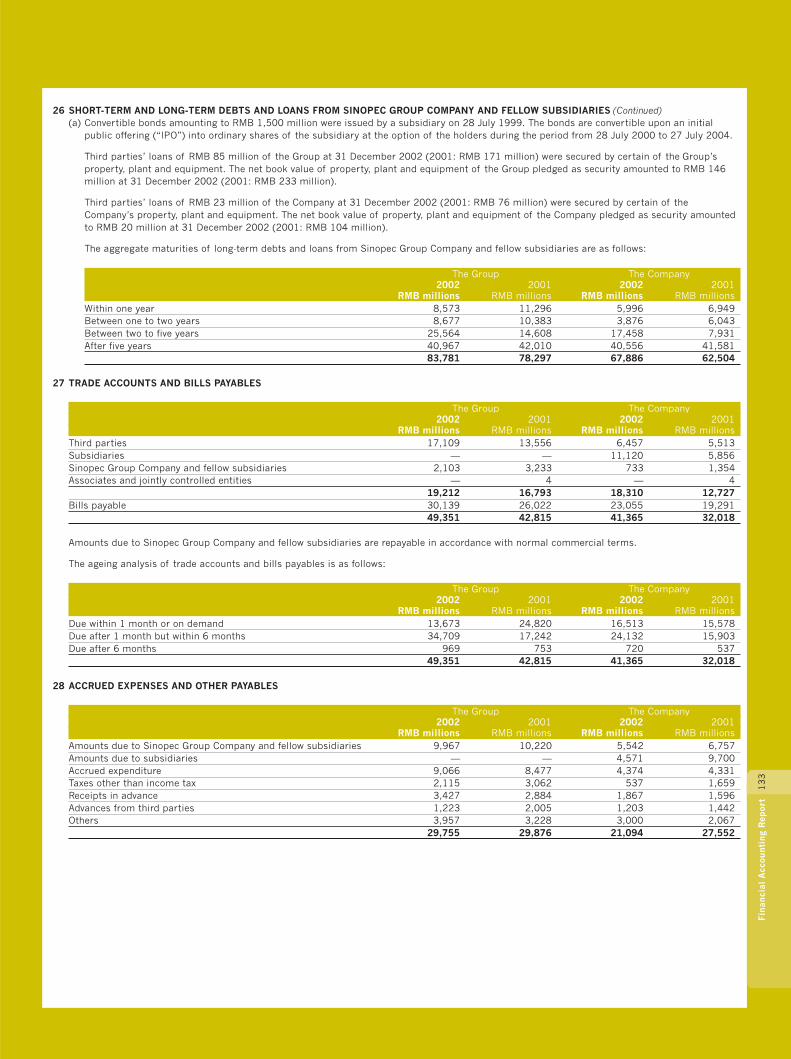
13
3Fi
nanc
ial
Acc
ount
ing
Rep
ort
26 SHORT-TERM AND LONG-TERM DEBTS AND LOANS FROM SINOPEC GROUP COMPANY AND FELLOW SUBSIDIARIES (Continued)(a) Convertible bonds amounting to RMB 1,500 million were issued by a subsidiary on 28 July 1999. The bonds are convertible upon an initial
public offering (“IPO”) into ordinary shares of the subsidiary at the option of the holders during the period from 28 July 2000 to 27 July 2004.
Third parties’ loans of RMB 85 million of the Group at 31 December 2002 (2001: RMB 171 million) were secured by certain of the Group’sproperty, plant and equipment. The net book value of property, plant and equipment of the Group pledged as security amounted to RMB 146million at 31 December 2002 (2001: RMB 233 million).
Third parties’ loans of RMB 23 million of the Company at 31 December 2002 (2001: RMB 76 million) were secured by certain of theCompany’s property, plant and equipment. The net book value of property, plant and equipment of the Company pledged as security amountedto RMB 20 million at 31 December 2002 (2001: RMB 104 million).
The aggregate maturities of long-term debts and loans from Sinopec Group Company and fellow subsidiaries are as follows:
The Group The Company2002 2001 2002 2001
RMB millions RMB millions RMB millions RMB millionsWithin one year 8,573 11,296 5,996 6,949Between one to two years 8,677 10,383 3,876 6,043Between two to five years 25,564 14,608 17,458 7,931After five years 40,967 42,010 40,556 41,581
83,781 78,297 67,886 62,504
27 TRADE ACCOUNTS AND BILLS PAYABLES
The Group The Company2002 2001 2002 2001
RMB millions RMB millions RMB millions RMB millionsThird parties 17,109 13,556 6,457 5,513Subsidiaries — — 11,120 5,856Sinopec Group Company and fellow subsidiaries 2,103 3,233 733 1,354Associates and jointly controlled entities — 4 — 4
19,212 16,793 18,310 12,727Bills payable 30,139 26,022 23,055 19,291
49,351 42,815 41,365 32,018
Amounts due to Sinopec Group Company and fellow subsidiaries are repayable in accordance with normal commercial terms.
The ageing analysis of trade accounts and bills payables is as follows:
The Group The Company2002 2001 2002 2001
RMB millions RMB millions RMB millions RMB millionsDue within 1 month or on demand 13,673 24,820 16,513 15,578Due after 1 month but within 6 months 34,709 17,242 24,132 15,903Due after 6 months 969 753 720 537
49,351 42,815 41,365 32,018
28 ACCRUED EXPENSES AND OTHER PAYABLES
The Group The Company2002 2001 2002 2001
RMB millions RMB millions RMB millions RMB millionsAmounts due to Sinopec Group Company and fellow subsidiaries 9,967 10,220 5,542 6,757Amounts due to subsidiaries — — 4,571 9,700Accrued expenditure 9,066 8,477 4,374 4,331Taxes other than income tax 2,115 3,062 537 1,659Receipts in advance 3,427 2,884 1,867 1,596Advances from third parties 1,223 2,005 1,203 1,442Others 3,957 3,228 3,000 2,067
29,755 29,876 21,094 27,552
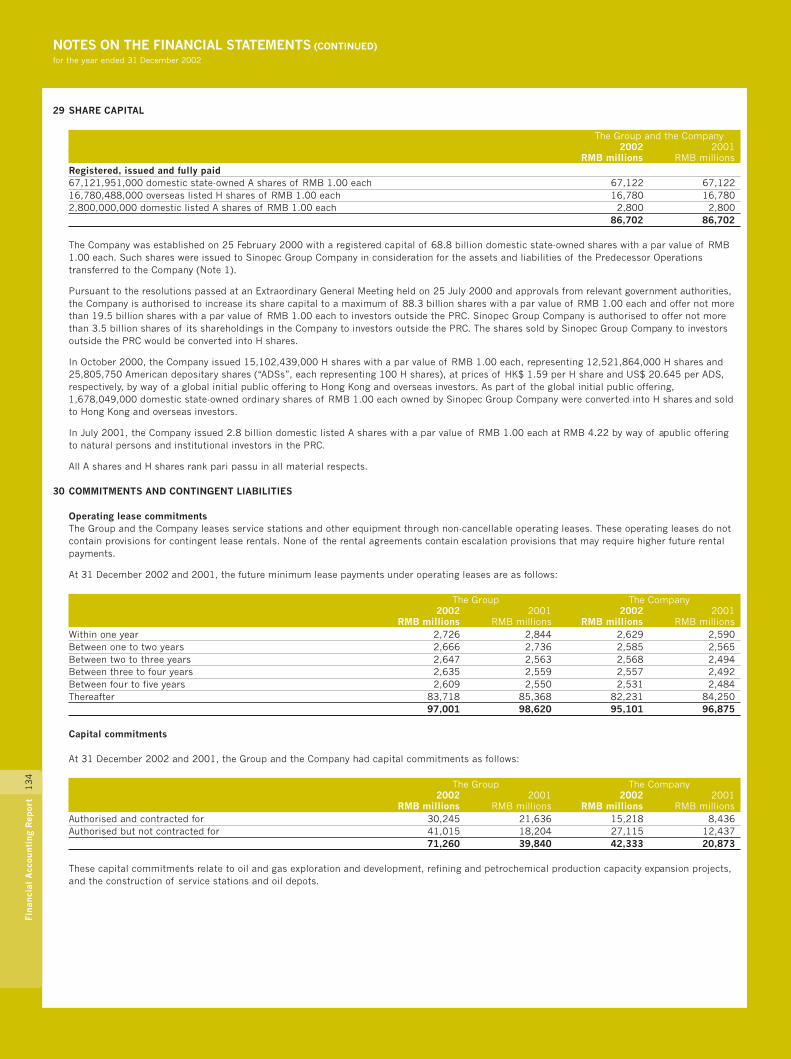
13
4Fi
nanc
ial
Acc
ount
ing
Rep
ort
NOTES ON THE FINANCIAL STATEMENTS (CONTINUED)for the year ended 31 December 2002
29 SHARE CAPITAL
The Group and the Company2002 2001
RMB millions RMB millionsRegistered, issued and fully paid67,121,951,000 domestic state-owned A shares of RMB 1.00 each 67,122 67,12216,780,488,000 overseas listed H shares of RMB 1.00 each 16,780 16,7802,800,000,000 domestic listed A shares of RMB 1.00 each 2,800 2,800
86,702 86,702
The Company was established on 25 February 2000 with a registered capital of 68.8 billion domestic state-owned shares with a par value of RMB1.00 each. Such shares were issued to Sinopec Group Company in consideration for the assets and liabilities of the Predecessor Operationstransferred to the Company (Note 1).
Pursuant to the resolutions passed at an Extraordinary General Meeting held on 25 July 2000 and approvals from relevant government authorities,the Company is authorised to increase its share capital to a maximum of 88.3 billion shares with a par value of RMB 1.00 each and offer not morethan 19.5 billion shares with a par value of RMB 1.00 each to investors outside the PRC. Sinopec Group Company is authorised to offer not morethan 3.5 billion shares of its shareholdings in the Company to investors outside the PRC. The shares sold by Sinopec Group Company to investorsoutside the PRC would be converted into H shares.
In October 2000, the Company issued 15,102,439,000 H shares with a par value of RMB 1.00 each, representing 12,521,864,000 H shares and25,805,750 American depositary shares (“ADSs”, each representing 100 H shares), at prices of HK$ 1.59 per H share and US$ 20.645 per ADS,respectively, by way of a global initial public offering to Hong Kong and overseas investors. As part of the global initial public offering,1,678,049,000 domestic state-owned ordinary shares of RMB 1.00 each owned by Sinopec Group Company were converted into H shares and soldto Hong Kong and overseas investors.
In July 2001, the Company issued 2.8 billion domestic listed A shares with a par value of RMB 1.00 each at RMB 4.22 by way of a public offeringto natural persons and institutional investors in the PRC.
All A shares and H shares rank pari passu in all material respects.
30 COMMITMENTS AND CONTINGENT LIABILITIES
Operating lease commitmentsThe Group and the Company leases service stations and other equipment through non-cancellable operating leases. These operating leases do notcontain provisions for contingent lease rentals. None of the rental agreements contain escalation provisions that may require higher future rentalpayments.
At 31 December 2002 and 2001, the future minimum lease payments under operating leases are as follows:
The Group The Company2002 2001 2002 2001
RMB millions RMB millions RMB millions RMB millionsWithin one year 2,726 2,844 2,629 2,590Between one to two years 2,666 2,736 2,585 2,565Between two to three years 2,647 2,563 2,568 2,494Between three to four years 2,635 2,559 2,557 2,492Between four to five years 2,609 2,550 2,531 2,484Thereafter 83,718 85,368 82,231 84,250
97,001 98,620 95,101 96,875
Capital commitments
At 31 December 2002 and 2001, the Group and the Company had capital commitments as follows:
The Group The Company2002 2001 2002 2001
RMB millions RMB millions RMB millions RMB millionsAuthorised and contracted for 30,245 21,636 15,218 8,436Authorised but not contracted for 41,015 18,204 27,115 12,437
71,260 39,840 42,333 20,873
These capital commitments relate to oil and gas exploration and development, refining and petrochemical production capacity expansion projects,and the construction of service stations and oil depots.

13
5Fi
nanc
ial
Acc
ount
ing
Rep
ort
30 COMMITMENTS AND CONTINGENT LIABILITIES (Continued)
Exploration and production licensesExploration licenses for exploration activities are registered with the Ministry of Land and Resources. The maximum term of the Group’s explorationlicenses is 7 years, and may be renewed twice within 30 days prior to expiration of the original term with each renewal being for a two-year term.The Group is obligated to make progressive annual minimum exploration investment relating to the exploration blocks in respect of which thelicense is issued. The Ministry of Land and Resources also issues production licenses to the Group on the basis of the reserve reports approved byrelevant authorities. The maximum term of a full production license is 30 years unless a special dispensation is given by the State Council. Themaximum term of production licenses issued to the Group is 55 years as a special dispensation was given to the Company by the State Council.The Group’s production license is renewable upon application by the Group 30 days prior to expiration.
The Group is required to make payments of exploration license fees and production right usage fees to the Ministry of Land and Resources annuallywhich are expensed as incurred. Payments incurred were approximately RMB 65 million for the year ended 31 December 2002 (2001: RMB 29million).
Estimated future annual payments are as follows:
The Group The Company2002 2001 2002 2001
RMB millions RMB millions RMB millions RMB millionsWithin one year 55 43 37 28Between one to two years 76 39 45 26Between two to three years 66 51 35 26Between three to four years 63 62 28 31Between four to five years 43 56 12 24Thereafter 263 284 109 114Total payments 566 535 266 249
Contingent liabilities(a) The Company has been advised by its PRC lawyers that, except for liabilities constituting or arising out of or relating to the business assumed by
the Company in the Reorganisation, no other liabilities were assumed by the Company, and the Company is not jointly and severally liable forother debts and obligations incurred by Sinopec Group Company prior to the Reorganisation.
(b) At 31 December 2002 and 2001, guarantees given to banks in respect of banking facilities granted to the parties below were as follows:
The Group The Company2002 2001 2002 2001
RMB millions RMB millions RMB millions RMB millionsAssociates and jointly controlled entities 7,492 546 7,017 —Third parties 30 322 — —
7,522 868 7,017 —
The Company monitors the conditions that are subject to the guarantees to identify whether it is probable that a loss has occurred, and recogniseany such losses under guarantees when those losses are estimable. At 31 December 2001 and 2002, it is not probable that the Company will berequired to make payments under the guarantees. Thus no liability has been accrued for a loss related to the Company’s obligation under theguarantees arrangement.
In March 2003, the Company made guarantees of RMB 4,680 million given to banks in respect of banking facilities granted to an associate.
Environmental contingenciesTo date, the Group has not incurred any significant expenditures for environmental remediation, is currently not involved in any environmentalremediation, and has not accrued any amounts for environmental remediation relating to its operations. Under existing legislation, managementbelieves that there are no probable liabilities that will have a material adverse effect on the financial position or operating results of the Group. ThePRC government, however, has moved, and may move further towards more rigorous enforcement of applicable laws, and towards the adoption ofmore stringent environmental standards. Environmental liabilities are subject to considerable uncertainties which affect the Group’s ability toestimate the ultimate cost of remediation efforts. These uncertainties include i) the exact nature and extent of the contamination at various sitesincluding, but not limited to refineries, oil fields, service stations, terminals and land development areas, whether operating, closed or sold, ii) theextent of required cleanup efforts, iii) varying costs of alternative remediation strategies, iv) changes in environmental remediation requirements,and v) the identification of new remediation sites. The amount of such future cost is indeterminable due to such factors as the unknown magnitudeof possible contamination and the unknown timing and extent of the corrective actions that may be required. Accordingly, the outcome ofenvironmental liabilities under proposed or future environmental legislation cannot reasonably be estimated at present, and could be material. TheGroup paid normal routine pollutant discharge fees of approximately RMB 287 million for the year ended 31 December 2002 (2001: RMB 221million).

13
6Fi
nanc
ial
Acc
ount
ing
Rep
ort
NOTES ON THE FINANCIAL STATEMENTS (CONTINUED)for the year ended 31 December 2002
30 COMMITMENTS AND CONTINGENT LIABILITIES (Continued)
Legal contingenciesThe Group is a defendant in certain lawsuits as well as the named party in other proceedings arising in the ordinary course of business. While theoutcomes of such contingencies, lawsuits or other proceedings cannot be determined at present, management believes that any resulting liabilitieswill not have a material adverse effect on the financial position or operating results of the Group.
31 RELATED PARTY TRANSACTIONSCompanies are considered to be related if one company has the ability, directly or indirectly, to control the other company or exercise significantinfluence over the other company in making financial and operating decisions. Companies are also considered to be related if they are subject tocommon control or common significant influence.
The Group is part of a larger group of companies under Sinopec Group Company and has significant transactions and relationships with theSinopec Group Company and fellow subsidiaries. Because of these relationships, it is possible that the terms of these transactions are not thesame as those that would result from transactions among wholly unrelated parties. Sinopec Group Company itself is owned by the PRC government.There are also many other enterprises directly or indirectly owned or controlled by the PRC government (“state-owned enterprises”). Under IFRS,state-owned enterprises, other than Sinopec Group Company and fellow subsidiaries, are not considered related parties. Related parties refer toenterprises over which Sinopec Group Company is able to exercise significant influence.
The Group conducts business with state-owned enterprises. Furthermore, the PRC government itself represents a significant customer of the Groupboth directly through its numerous authorities and indirectly through its numerous affiliates and other organisations. Sales of certain products toPRC government authorities and affiliates and other state-owned enterprises may be at regulated prices, which differ from market prices. The Groupconsiders that these sales are activities in the ordinary course of business in the PRC and has not disclosed such sales as related partytransactions.
The principal related party transactions with Sinopec Group Company, which were carried out in the ordinary course of business, are as follows:
Note 2002 2001RMB millions RMB millions
Sales of goods (i) 36,343 37,261Purchases (ii) 26,225 19,264Transportation and storage (iii) 1,514 1,471Exploration and development services (iv) 10,310 10,250Production related services (v) 7,316 6,116Ancillary and social services (vi) 1,945 2,000Operating lease charges (vii) 2,716 2,489Agency commission income (viii) 37 7Intellectual property licence fee paid (ix) 10 10Interest received (x) 104 153Interest paid (xi) 636 534Net deposits (withdrawn from)/placed with related parties (xii) (1,427) 528Net loans obtained from/(repaid to) related parties (xiii) 1,990 (5,034)
The amounts set out in the table above in respect of the years ended 31 December 2002 and 2001 represent the relevant costs to the Group asdetermined by the corresponding contracts with the related parties.
At 31 December 2002 and 2001, there were no guarantees given to banks by the Group in respect of banking facilities to Sinopec Group Companyand fellow subsidiaries.
The directors of the Company are of the opinion that the above transactions with related parties were conducted in the ordinary course of businessand on normal commercial terms or in accordance with the agreements governing such transactions, and this has been confirmed by theindependent non-executive directors.
Notes:
(i) Sales of goods represent the sale of crude oil, intermediate petrochemical products and petroleum products.
(ii) Purchases represent the purchase of material and utility supplies directly related to the Group’s operations such as the procurement of raw and ancillary materialsand related services, supply of water, electricity and gas.
(iii) Transportation and storage represent the cost for the use of railway, road and marine transportation services, pipelines, loading, unloading and storage facilities.
(iv) Exploration and development services comprise direct costs incurred in the exploration of crude oil such as geophysical, drilling, well testing and well measurementservices.
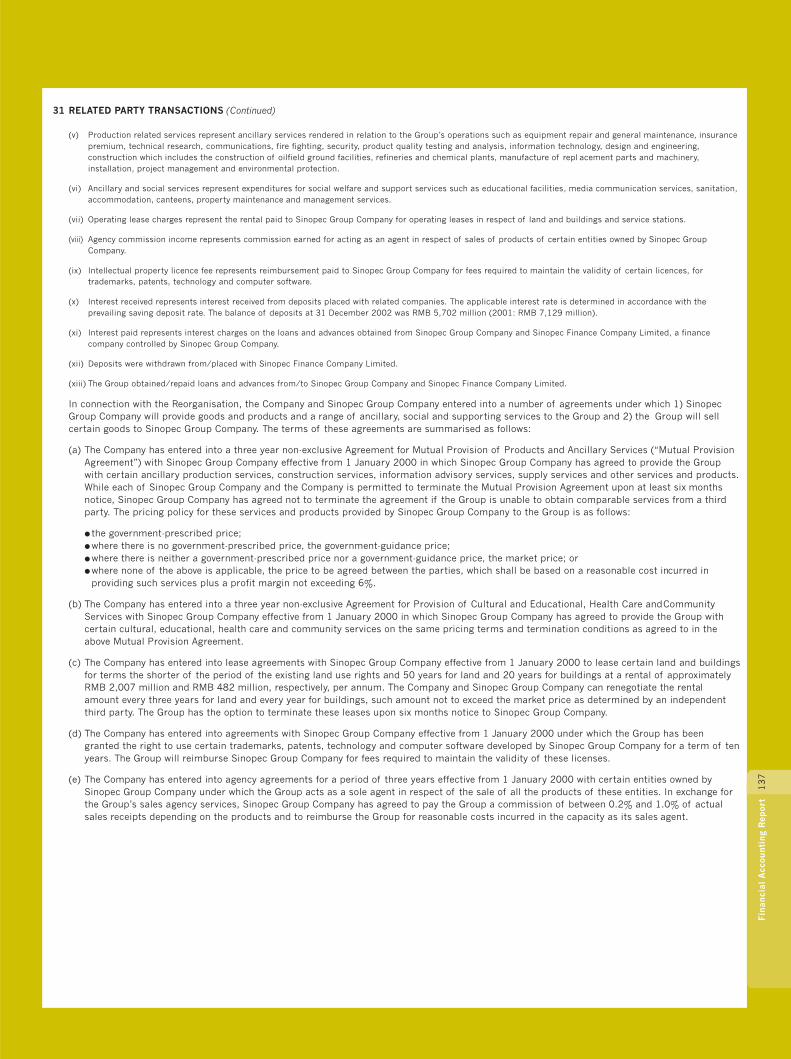
13
7Fi
nanc
ial
Acc
ount
ing
Rep
ort
31 RELATED PARTY TRANSACTIONS (Continued)
(v) Production related services represent ancillary services rendered in relation to the Group’s operations such as equipment repair and general maintenance, insurancepremium, technical research, communications, fire fighting, security, product quality testing and analysis, information technology, design and engineering,construction which includes the construction of oilfield ground facilities, refineries and chemical plants, manufacture of replacement parts and machinery,installation, project management and environmental protection.
(vi) Ancillary and social services represent expenditures for social welfare and support services such as educational facilities, media communication services, sanitation,accommodation, canteens, property maintenance and management services.
(vii) Operating lease charges represent the rental paid to Sinopec Group Company for operating leases in respect of land and buildings and service stations.
(viii) Agency commission income represents commission earned for acting as an agent in respect of sales of products of certain entities owned by Sinopec GroupCompany.
(ix) Intellectual property licence fee represents reimbursement paid to Sinopec Group Company for fees required to maintain the validity of certain licences, fortrademarks, patents, technology and computer software.
(x) Interest received represents interest received from deposits placed with related companies. The applicable interest rate is determined in accordance with theprevailing saving deposit rate. The balance of deposits at 31 December 2002 was RMB 5,702 million (2001: RMB 7,129 million).
(xi) Interest paid represents interest charges on the loans and advances obtained from Sinopec Group Company and Sinopec Finance Company Limited, a financecompany controlled by Sinopec Group Company.
(xii) Deposits were withdrawn from/placed with Sinopec Finance Company Limited.
(xiii) The Group obtained/repaid loans and advances from/to Sinopec Group Company and Sinopec Finance Company Limited.
In connection with the Reorganisation, the Company and Sinopec Group Company entered into a number of agreements under which 1) SinopecGroup Company will provide goods and products and a range of ancillary, social and supporting services to the Group and 2) the Group will sellcertain goods to Sinopec Group Company. The terms of these agreements are summarised as follows:
(a) The Company has entered into a three year non-exclusive Agreement for Mutual Provision of Products and Ancillary Services (“Mutual ProvisionAgreement”) with Sinopec Group Company effective from 1 January 2000 in which Sinopec Group Company has agreed to provide the Groupwith certain ancillary production services, construction services, information advisory services, supply services and other services and products.While each of Sinopec Group Company and the Company is permitted to terminate the Mutual Provision Agreement upon at least six monthsnotice, Sinopec Group Company has agreed not to terminate the agreement if the Group is unable to obtain comparable services from a thirdparty. The pricing policy for these services and products provided by Sinopec Group Company to the Group is as follows:
� the government-prescribed price;� where there is no government-prescribed price, the government-guidance price;� where there is neither a government-prescribed price nor a government-guidance price, the market price; or� where none of the above is applicable, the price to be agreed between the parties, which shall be based on a reasonable cost incurred in
providing such services plus a profit margin not exceeding 6%.
(b) The Company has entered into a three year non-exclusive Agreement for Provision of Cultural and Educational, Health Care and CommunityServices with Sinopec Group Company effective from 1 January 2000 in which Sinopec Group Company has agreed to provide the Group withcertain cultural, educational, health care and community services on the same pricing terms and termination conditions as agreed to in theabove Mutual Provision Agreement.
(c) The Company has entered into lease agreements with Sinopec Group Company effective from 1 January 2000 to lease certain land and buildingsfor terms the shorter of the period of the existing land use rights and 50 years for land and 20 years for buildings at a rental of approximatelyRMB 2,007 million and RMB 482 million, respectively, per annum. The Company and Sinopec Group Company can renegotiate the rentalamount every three years for land and every year for buildings, such amount not to exceed the market price as determined by an independentthird party. The Group has the option to terminate these leases upon six months notice to Sinopec Group Company.
(d) The Company has entered into agreements with Sinopec Group Company effective from 1 January 2000 under which the Group has beengranted the right to use certain trademarks, patents, technology and computer software developed by Sinopec Group Company for a term of tenyears. The Group will reimburse Sinopec Group Company for fees required to maintain the validity of these licenses.
(e) The Company has entered into agency agreements for a period of three years effective from 1 January 2000 with certain entities owned bySinopec Group Company under which the Group acts as a sole agent in respect of the sale of all the products of these entities. In exchange forthe Group’s sales agency services, Sinopec Group Company has agreed to pay the Group a commission of between 0.2% and 1.0% of actualsales receipts depending on the products and to reimburse the Group for reasonable costs incurred in the capacity as its sales agent.
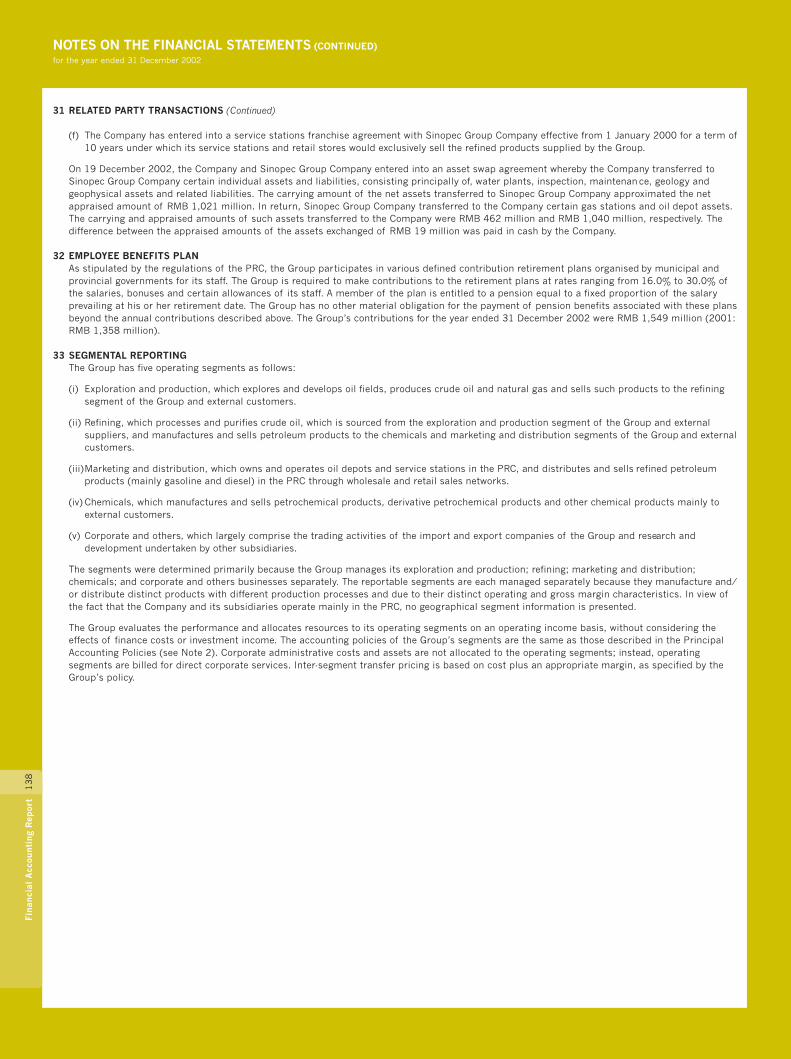
13
8Fi
nanc
ial
Acc
ount
ing
Rep
ort
NOTES ON THE FINANCIAL STATEMENTS (CONTINUED)for the year ended 31 December 2002
31 RELATED PARTY TRANSACTIONS (Continued)
(f) The Company has entered into a service stations franchise agreement with Sinopec Group Company effective from 1 January 2000 for a term of10 years under which its service stations and retail stores would exclusively sell the refined products supplied by the Group.
On 19 December 2002, the Company and Sinopec Group Company entered into an asset swap agreement whereby the Company transferred toSinopec Group Company certain individual assets and liabilities, consisting principally of, water plants, inspection, maintenance, geology andgeophysical assets and related liabilities. The carrying amount of the net assets transferred to Sinopec Group Company approximated the netappraised amount of RMB 1,021 million. In return, Sinopec Group Company transferred to the Company certain gas stations and oil depot assets.The carrying and appraised amounts of such assets transferred to the Company were RMB 462 million and RMB 1,040 million, respectively. Thedifference between the appraised amounts of the assets exchanged of RMB 19 million was paid in cash by the Company.
32 EMPLOYEE BENEFITS PLANAs stipulated by the regulations of the PRC, the Group participates in various defined contribution retirement plans organised by municipal andprovincial governments for its staff. The Group is required to make contributions to the retirement plans at rates ranging from 16.0% to 30.0% ofthe salaries, bonuses and certain allowances of its staff. A member of the plan is entitled to a pension equal to a fixed proportion of the salaryprevailing at his or her retirement date. The Group has no other material obligation for the payment of pension benefits associated with these plansbeyond the annual contributions described above. The Group’s contributions for the year ended 31 December 2002 were RMB 1,549 million (2001:RMB 1,358 million).
33 SEGMENTAL REPORTINGThe Group has five operating segments as follows:
(i) Exploration and production, which explores and develops oil fields, produces crude oil and natural gas and sells such products to the refiningsegment of the Group and external customers.
(ii) Refining, which processes and purifies crude oil, which is sourced from the exploration and production segment of the Group and externalsuppliers, and manufactures and sells petroleum products to the chemicals and marketing and distribution segments of the Group and externalcustomers.
(iii)Marketing and distribution, which owns and operates oil depots and service stations in the PRC, and distributes and sells refined petroleumproducts (mainly gasoline and diesel) in the PRC through wholesale and retail sales networks.
(iv) Chemicals, which manufactures and sells petrochemical products, derivative petrochemical products and other chemical products mainly toexternal customers.
(v) Corporate and others, which largely comprise the trading activities of the import and export companies of the Group and research anddevelopment undertaken by other subsidiaries.
The segments were determined primarily because the Group manages its exploration and production; refining; marketing and distribution;chemicals; and corporate and others businesses separately. The reportable segments are each managed separately because they manufacture and/or distribute distinct products with different production processes and due to their distinct operating and gross margin characteristics. In view ofthe fact that the Company and its subsidiaries operate mainly in the PRC, no geographical segment information is presented.
The Group evaluates the performance and allocates resources to its operating segments on an operating income basis, without considering theeffects of finance costs or investment income. The accounting policies of the Group’s segments are the same as those described in the PrincipalAccounting Policies (see Note 2). Corporate administrative costs and assets are not allocated to the operating segments; instead, operatingsegments are billed for direct corporate services. Inter-segment transfer pricing is based on cost plus an appropriate margin, as specified by theGroup’s policy.
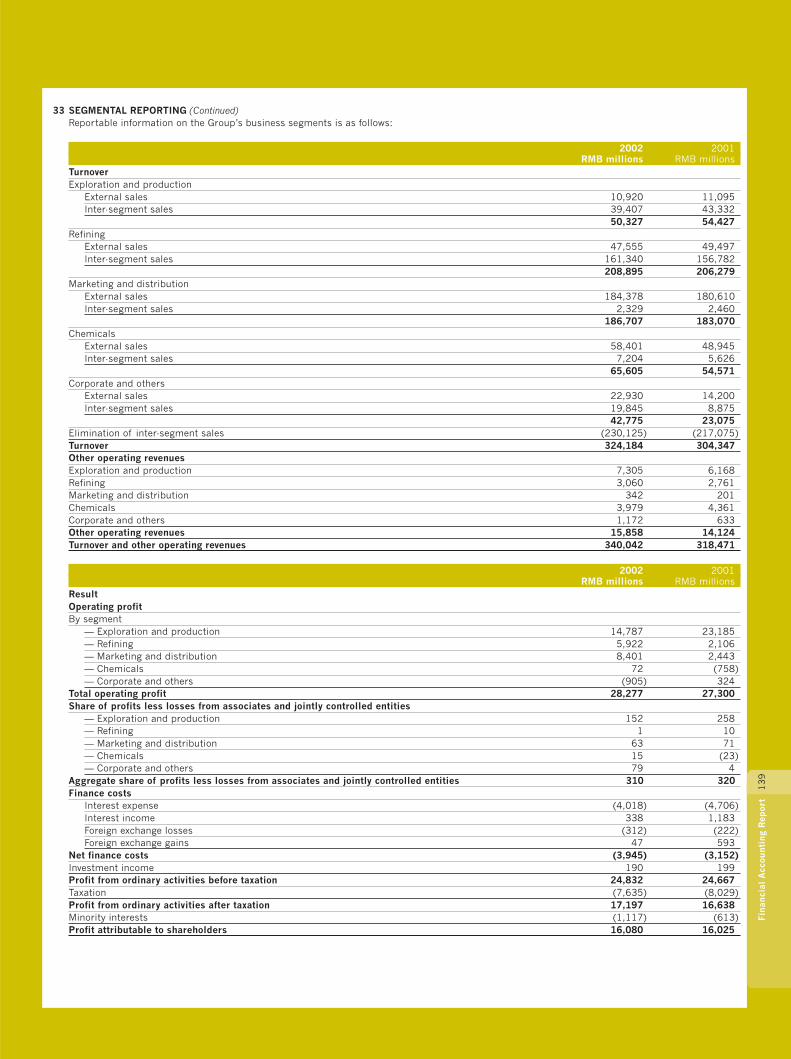
13
9Fi
nanc
ial
Acc
ount
ing
Rep
ort
33 SEGMENTAL REPORTING (Continued)Reportable information on the Group’s business segments is as follows:
2002 2001RMB millions RMB millions
TurnoverExploration and production
External sales 10,920 11,095Inter-segment sales 39,407 43,332
50,327 54,427Refining
External sales 47,555 49,497Inter-segment sales 161,340 156,782
208,895 206,279Marketing and distribution
External sales 184,378 180,610Inter-segment sales 2,329 2,460
186,707 183,070Chemicals
External sales 58,401 48,945Inter-segment sales 7,204 5,626
65,605 54,571Corporate and others
External sales 22,930 14,200Inter-segment sales 19,845 8,875
42,775 23,075Elimination of inter-segment sales (230,125) (217,075)Turnover 324,184 304,347Other operating revenuesExploration and production 7,305 6,168Refining 3,060 2,761Marketing and distribution 342 201Chemicals 3,979 4,361Corporate and others 1,172 633Other operating revenues 15,858 14,124Turnover and other operating revenues 340,042 318,471
2002 2001RMB millions RMB millions
ResultOperating profitBy segment
— Exploration and production 14,787 23,185— Refining 5,922 2,106— Marketing and distribution 8,401 2,443— Chemicals 72 (758)— Corporate and others (905) 324
Total operating profit 28,277 27,300Share of profits less losses from associates and jointly controlled entities
— Exploration and production 152 258— Refining 1 10— Marketing and distribution 63 71— Chemicals 15 (23)— Corporate and others 79 4
Aggregate share of profits less losses from associates and jointly controlled entities 310 320Finance costs
Interest expense (4,018) (4,706)Interest income 338 1,183Foreign exchange losses (312) (222)Foreign exchange gains 47 593
Net finance costs (3,945) (3,152)Investment income 190 199Profit from ordinary activities before taxation 24,832 24,667Taxation (7,635) (8,029)Profit from ordinary activities after taxation 17,197 16,638Minority interests (1,117) (613)Profit attributable to shareholders 16,080 16,025
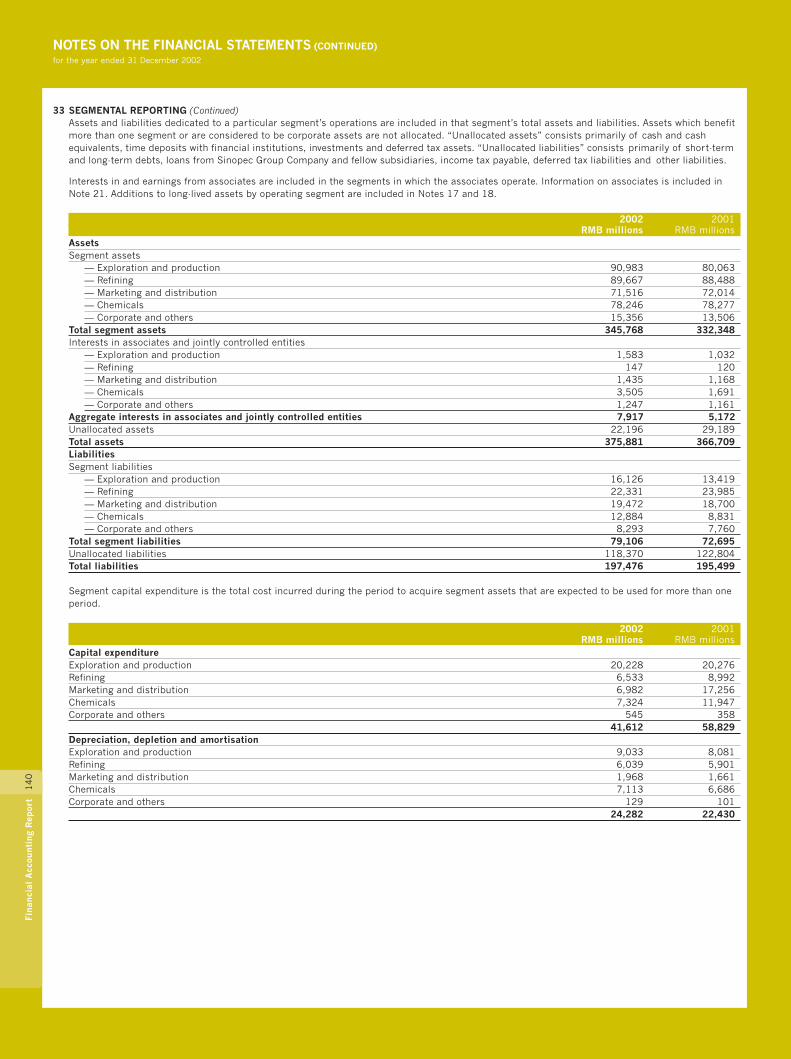
14
0Fi
nanc
ial
Acc
ount
ing
Rep
ort
NOTES ON THE FINANCIAL STATEMENTS (CONTINUED)for the year ended 31 December 2002
33 SEGMENTAL REPORTING (Continued)Assets and liabilities dedicated to a particular segment’s operations are included in that segment’s total assets and liabilities. Assets which benefitmore than one segment or are considered to be corporate assets are not allocated. “Unallocated assets” consists primarily of cash and cashequivalents, time deposits with financial institutions, investments and deferred tax assets. “Unallocated liabilities” consists primarily of short-termand long-term debts, loans from Sinopec Group Company and fellow subsidiaries, income tax payable, deferred tax liabilities and other liabilities.
Interests in and earnings from associates are included in the segments in which the associates operate. Information on associates is included inNote 21. Additions to long-lived assets by operating segment are included in Notes 17 and 18.
2002 2001RMB millions RMB millions
AssetsSegment assets
— Exploration and production 90,983 80,063— Refining 89,667 88,488— Marketing and distribution 71,516 72,014— Chemicals 78,246 78,277— Corporate and others 15,356 13,506
Total segment assets 345,768 332,348Interests in associates and jointly controlled entities
— Exploration and production 1,583 1,032— Refining 147 120— Marketing and distribution 1,435 1,168— Chemicals 3,505 1,691— Corporate and others 1,247 1,161
Aggregate interests in associates and jointly controlled entities 7,917 5,172Unallocated assets 22,196 29,189Total assets 375,881 366,709LiabilitiesSegment liabilities
— Exploration and production 16,126 13,419— Refining 22,331 23,985— Marketing and distribution 19,472 18,700— Chemicals 12,884 8,831— Corporate and others 8,293 7,760
Total segment liabilities 79,106 72,695Unallocated liabilities 118,370 122,804Total liabilities 197,476 195,499
Segment capital expenditure is the total cost incurred during the period to acquire segment assets that are expected to be used for more than oneperiod.
2002 2001RMB millions RMB millions
Capital expenditureExploration and production 20,228 20,276Refining 6,533 8,992Marketing and distribution 6,982 17,256Chemicals 7,324 11,947Corporate and others 545 358
41,612 58,829Depreciation, depletion and amortisationExploration and production 9,033 8,081Refining 6,039 5,901Marketing and distribution 1,968 1,661Chemicals 7,113 6,686Corporate and others 129 101
24,282 22,430

14
1Fi
nanc
ial
Acc
ount
ing
Rep
ort
34 PRINCIPAL SUBSIDIARIESAt 31 December 2002, the following list contains the particulars of subsidiaries which principally affected the results or assets of the Group.
Particularsof issued
capital and Percentage of equitydebt Type of held by the held by
Name of company securities legal entity Company Subsidiary Principal activities(millions) % %
China Petrochemical International RMB1,400 Limited 100.00 — Trading of crude oil andCompany Limited company petrochemical productsSinopec Beijing Yanhua Petrochemical RMB 3,374 Limited 70.01 — Manufacturing of chemical productsCompany Limited companySinopec Sales Company Limited RMB 1,700 Limited 100.00 — Marketing and distribution of refined
company petroleum productsSinopec Shengli Oilfield Company RMB 30,028 Limited 100.00 — Exploration and production ofLimited company crude oil and natural gasSinopec Fujian Petrochemical Company RMB 2,253 Limited 50.00 — Manufacturing of plastics, intermediateLimited (i) company petrochemical products and
petroleum productsSinopec Maoming Refining and RMB 1,064 Limited 99.81 — Manufacturing of intermediateChemical Company Limited and RMB 1,500 company petrochemical products and
convertible petroleum productsbonds
Sinopec Qilu Petrochemical Company RMB 1,950 Limited 82.05 — Manufacturing of intermediateLimited company petrochemical products and
petroleum productsSinopec Shanghai Petrochemical RMB 7,200 Limited 55.56 — Manufacturing of synthetic fibres,Company Limited company resin and plastics, intermediate
petrochemical products andpetroleum products
Sinopec Shijiazhuang Refining- RMB 1,154 Limited 79.73 — Manufacturing of intermediateChemical Company Limited company petrochemical products and
petroleum productsSinopec Kantons Holdings Limited HK$ 104 Limited — 72.40 Trading of crude oil and petroleum
company productsSinopec Wuhan Petroleum Group RMB 147 Limited 46.25 — Marketing and distribution of refinedCompany Limited (i) company petroleum productsSinopec Wuhan Phoenix Company RMB 519 Limited 40.72 — Manufacturing of petrochemicalLimited (i) company products and petroleum productsSinopec Yangzi Petrochemical Company RMB 2,330 Limited 84.98 — Manufacturing of intermediateLimited company petrochemical products and
petroleum productsSinopec Yizheng Chemical Fibre RMB 4,000 Limited 42.00 — Production and sale of polyester chipsCompany Limited (i) company and polyester fibresSinopec Zhenhai Refining and Chemical RMB 2,524 Limited 71.32 — Manufacturing of intermediateCompany Limited company petrochemical products and
petroleum productsSinopec Zhongyuan Petroleum RMB 816 Limited 75.00 — Exploration and production of crudeCompany Limited company oil and natural gas
Except for Sinopec Kantons Holdings Limited, which is incorporated in Bermuda, all of the above principal subsidiaries are incorporated in the PRC.
(i) The Company consolidated the results of the entity because the Company controlled the board of this entity and had the power to govern its financial and operatingpolicies.

14
2Fi
nanc
ial
Acc
ount
ing
Rep
ort
NOTES ON THE FINANCIAL STATEMENTS (CONTINUED)for the year ended 31 December 2002
35 FINANCIAL INSTRUMENTSFinancial assets of the Group include cash and cash equivalents, time deposits with financial institutions, investments, trade accounts receivable,bills receivable, amounts due from Sinopec Group Company and fellow subsidiaries, loans to third parties, due from associates and jointlycontrolled entities, and other receivables. Financial liabilities of the Group include bank and other loans, loans from Sinopec Group Company andfellow subsidiaries, trade accounts payable, bills payable, amounts due to Sinopec Group Company and fellow subsidiaries, receipts in advance, andadvances from third parties. The Group has no derivative instruments that are designated and qualified as hedging instruments at 31 December2002 and 2001.
Credit riskThe carrying amounts of cash and cash equivalents, time deposits with financial institutions, trade accounts and bills receivables, and other currentassets, except for prepayments and deposits, represent the Group’s maximum exposure to credit risk in relation to financial assets.
The majority of the Group’s trade accounts receivable relate to sales of petroleum and chemical products to related parties and third partiesoperating in the petroleum and chemical industries. The Group performs ongoing credit evaluations of its customers’ financial condition andgenerally does not require collateral on trade accounts receivable. The Group maintains an allowance for doubtful accounts and actual losses havebeen within management’s expectations. No single customer accounted for greater than 10% of total revenues.
No other financial assets carry a significant exposure to credit risk.
Currency riskSubstantially all of the revenue-generating operations of the Group are transacted in Renminbi, which is not fully convertible into foreign currencies.On 1 January 1994, the PRC government abolished the dual rate system and introduced a single rate of exchange as quoted by the People’s Bankof China. However, the unification of the exchange rate does not imply convertibility of Renminbi into United States dollars or other foreigncurrencies. All foreign exchange transactions continue to take place either through the People’s Bank of China or other banks authorized to buy andsell foreign currencies at the exchange rates quoted by the People’s Bank of China. Approval of foreign currency payments by the People’s Bank ofChina or other institutions requires submitting a payment application form together with suppliers’ invoices, shipping documents and signedcontracts.
Interest rate riskThe interest rates and terms of repayment of short-term and long-term debts of the Group are disclosed in Note 26.
The following disclosure of the estimated fair value of financial instruments is made in accordance with the requirements of IAS 32 and IAS 39. Fairvalue estimates, methods and assumptions, set forth below for the Group’s financial instruments, are made to comply with the requirements of IAS32 and IAS 39 and should be read in conjunction with the Group’s consolidated financial statements and related notes. The estimated fair valueamounts have been determined by the Group using market information and valuation methodologies considered appropriate. However, considerablejudgment is required to interpret market data to develop the estimates of fair value. Accordingly, the estimates presented herein are not necessarilyindicative of the amounts the Group could realise in a current market exchange. The use of different market assumptions and/or estimationmethodologies may have a material effect on the estimated fair value amounts.
The Group has not developed an internal valuation model necessary to make the estimate of the fair value of loans from Sinopec Group Companyand fellow subsidiaries as it is not considered practicable to estimate their fair value because the cost of obtaining discount and borrowing rates forcomparable borrowings would be excessive based on the Reorganisation of the Group, its existing capital structure, and the terms of theborrowings.
The following table presents the carrying amount and fair value of the Group’s long-term indebtedness other than loans from Sinopec GroupCompany and fellow subsidiaries at 31 December 2002 and 2001:
2002 2001RMB millions RMB millions
Carrying amount 45,925 41,758Fair value 46,370 41,996
The fair value of long-term indebtedness is estimated by discounting future cash flows thereon using current market interest rates offered to theGroup for debts with substantially the same characteristics and maturities.
Investments in unlisted equity securities have no quoted market prices in the PRC. Accordingly, a reasonable estimate of fair value could not bemade without incurring excessive costs.
The fair values of all other financial instruments approximate their carrying amounts due to the nature or short-term maturity of these instruments.
36 ULTIMATE HOLDING COMPANYThe directors consider the ultimate holding company of the Group at 31 December 2002 to be Sinopec Group Company, a state-owned enterpriseestablished in the PRC.
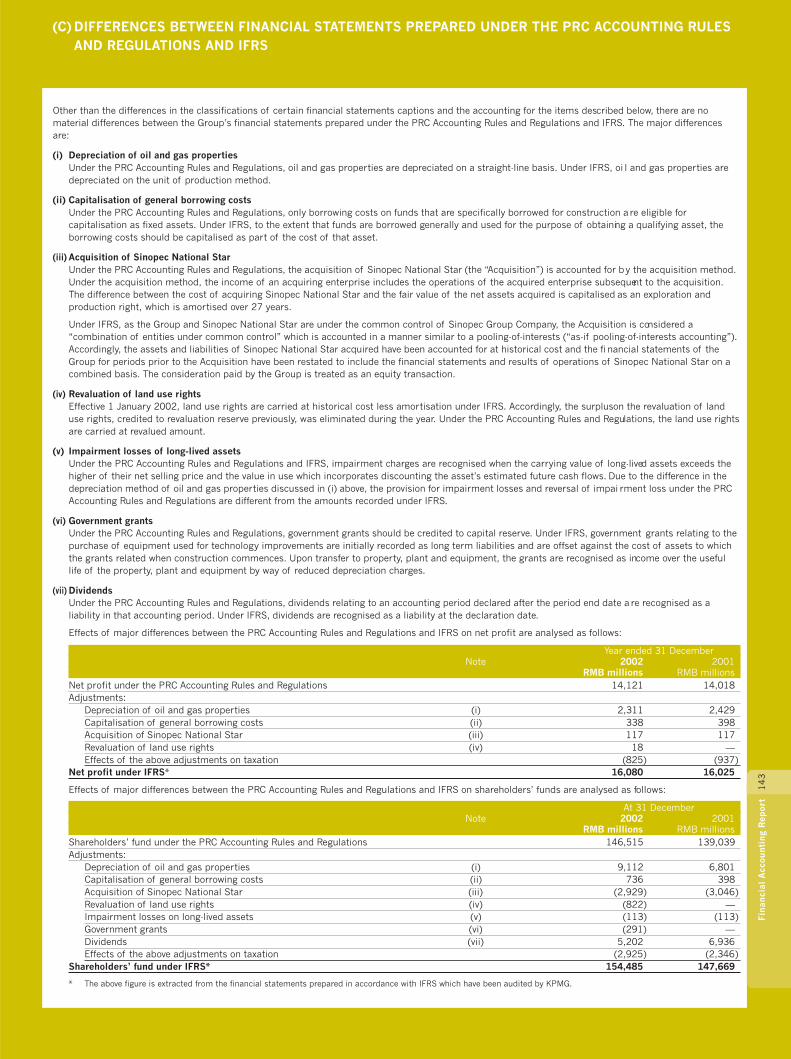
(C) DIFFERENCES BETWEEN FINANCIAL STATEMENTS PREPARED UNDER THE PRC ACCOUNTING RULESAND REGULATIONS AND IFRS
14
3Fi
nanc
ial
Acc
ount
ing
Rep
ort
Other than the differences in the classifications of certain financial statements captions and the accounting for the items described below, there are nomaterial differences between the Group’s financial statements prepared under the PRC Accounting Rules and Regulations and IFRS. The major differencesare:
(i) Depreciation of oil and gas propertiesUnder the PRC Accounting Rules and Regulations, oil and gas properties are depreciated on a straight-line basis. Under IFRS, oil and gas properties aredepreciated on the unit of production method.
(ii) Capitalisation of general borrowing costsUnder the PRC Accounting Rules and Regulations, only borrowing costs on funds that are specifically borrowed for construction are eligible forcapitalisation as fixed assets. Under IFRS, to the extent that funds are borrowed generally and used for the purpose of obtaining a qualifying asset, theborrowing costs should be capitalised as part of the cost of that asset.
(iii) Acquisition of Sinopec National StarUnder the PRC Accounting Rules and Regulations, the acquisition of Sinopec National Star (the “Acquisition”) is accounted for by the acquisition method.Under the acquisition method, the income of an acquiring enterprise includes the operations of the acquired enterprise subsequent to the acquisition.The difference between the cost of acquiring Sinopec National Star and the fair value of the net assets acquired is capitalised as an exploration andproduction right, which is amortised over 27 years.
Under IFRS, as the Group and Sinopec National Star are under the common control of Sinopec Group Company, the Acquisition is considered a“combination of entities under common control” which is accounted in a manner similar to a pooling-of-interests (“as-if pooling-of-interests accounting”).Accordingly, the assets and liabilities of Sinopec National Star acquired have been accounted for at historical cost and the financial statements of theGroup for periods prior to the Acquisition have been restated to include the financial statements and results of operations of Sinopec National Star on acombined basis. The consideration paid by the Group is treated as an equity transaction.
(iv) Revaluation of land use rightsEffective 1 January 2002, land use rights are carried at historical cost less amortisation under IFRS. Accordingly, the surplus on the revaluation of landuse rights, credited to revaluation reserve previously, was eliminated during the year. Under the PRC Accounting Rules and Regulations, the land use rightsare carried at revalued amount.
(v) Impairment losses of long-lived assetsUnder the PRC Accounting Rules and Regulations and IFRS, impairment charges are recognised when the carrying value of long-lived assets exceeds thehigher of their net selling price and the value in use which incorporates discounting the asset’s estimated future cash flows. Due to the difference in thedepreciation method of oil and gas properties discussed in (i) above, the provision for impairment losses and reversal of impairment loss under the PRCAccounting Rules and Regulations are different from the amounts recorded under IFRS.
(vi) Government grantsUnder the PRC Accounting Rules and Regulations, government grants should be credited to capital reserve. Under IFRS, government grants relating to thepurchase of equipment used for technology improvements are initially recorded as long term liabilities and are offset against the cost of assets to whichthe grants related when construction commences. Upon transfer to property, plant and equipment, the grants are recognised as income over the usefullife of the property, plant and equipment by way of reduced depreciation charges.
(vii) DividendsUnder the PRC Accounting Rules and Regulations, dividends relating to an accounting period declared after the period end date are recognised as aliability in that accounting period. Under IFRS, dividends are recognised as a liability at the declaration date.
Effects of major differences between the PRC Accounting Rules and Regulations and IFRS on net profit are analysed as follows:
Year ended 31 DecemberNote 2002 2001
RMB millions RMB millionsNet profit under the PRC Accounting Rules and Regulations 14,121 14,018Adjustments:
Depreciation of oil and gas properties (i) 2,311 2,429Capitalisation of general borrowing costs (ii) 338 398Acquisition of Sinopec National Star (iii) 117 117Revaluation of land use rights (iv) 18 —Effects of the above adjustments on taxation (825) (937)
Net profit under IFRS* 16,080 16,025
Effects of major differences between the PRC Accounting Rules and Regulations and IFRS on shareholders’ funds are analysed as follows:
At 31 DecemberNote 2002 2001
RMB millions RMB millionsShareholders’ fund under the PRC Accounting Rules and Regulations 146,515 139,039Adjustments:
Depreciation of oil and gas properties (i) 9,112 6,801Capitalisation of general borrowing costs (ii) 736 398Acquisition of Sinopec National Star (iii) (2,929) (3,046)Revaluation of land use rights (iv) (822) —Impairment losses on long-lived assets (v) (113) (113)Government grants (vi) (291) —Dividends (vii) 5,202 6,936Effects of the above adjustments on taxation (2,925) (2,346)
Shareholders’ fund under IFRS* 154,485 147,669
* The above figure is extracted from the financial statements prepared in accordance with IFRS which have been audited by KPMG.
(D)SUPPLEMENTAL INFORMATION FOR NORTH AMERICAN SHAREHOLDERS1
44
Fina
ncia
l A
ccou
ntin
g R
epor
t
The Group’s accounting policies conform with IFRS which differ in certain significant respects from accounting principles generally accepted in the UnitedStates of America (“US GAAP”). Differences which have a significant effect on profit attributable to shareholders and shareholders’ funds are set out below.
(a) Foreign exchange gains and lossesIn accordance with IFRS, foreign exchange differences on funds borrowed for construction are capitalised as property, plant and equipment to the extentthat they are regarded as an adjustment to interest costs during the construction period. Under US GAAP, all foreign exchange gains and losses on foreigncurrency debts are included in current earnings.
(b) Capitalisation of property, plant and equipmentIn years prior to those presented herein, certain adjustments arose between IFRS and US GAAP with regard to the capitalisation of interest and pre-production results under IFRS, that were reversed and expensed under US GAAP. For the years presented herein, there were no adjustments related to thecapitalisation of interest and pre-production results. Accordingly, the US GAAP adjustments represent the amortisation effect of such originatingadjustments described above.
(c) Revaluation of property, plant and equipmentAs required by the relevant PRC regulations with respect to the Reorganisation, the property, plant and equipment of the Group were revalued at 30September 1999. In addition, the property, plant and equipment of Sinopec National Star were revalued at 31 December 2000 in connection with theAcquisition. Under IFRS, such revaluations result in an increase in shareholders’ funds with respect to the increase in carrying amount of certain property,plant and equipment above their historical bases.
Under US GAAP, property, plant and equipment, including land use rights, are stated at their historical cost less accumulated depreciation. However, as aresult of the tax deductibility of the revaluation surplus, a deferred tax asset related to the reversal of the revaluation surplus is created under US GAAPwith a corresponding increase in shareholders’ funds.
Under IFRS, effective 1 January 2002, land use rights, which were previously carried at revalued amount, are carried at cost under IFRS. The effect of thischange resulted in a decrease to revaluation reserve net of minority interests of RMB 840 million as of 1 January 2002. This revaluation reserve waspreviously included as part of the revaluation reserve of property, plant and equipment. This change under IFRS eliminated the US GAAP differencerelating to the revaluation of land use rights. However, as a result of the tax deductibility of the revalued land use rights, the reversal of the revaluationreserve resulted in a deferred tax asset.
In addition, under IFRS, on disposal of a revalued asset, the related revaluation surplus is transferred from the revaluation reserve to retained earnings.Under US GAAP, the gain and loss on disposal of an asset is determined with reference to the asset’s historical carrying amount and included in currentearnings.
(d) Exchange of assetsAs described in Note 31 to the financial statements prepared under IFRS, the Company and Sinopec Group Company entered into an asset swaptransaction on 19 December 2002. Under IFRS, the cost of property, plant and equipment acquired in an exchange for a dissimilar item of property,plant and equipment is measured at fair value. Under US GAAP, as the exchange of assets was between entities under common control, the assetsreceived from Sinopec Group Company are measured at historical cost. The difference between the historical cost of the net assets transferred and thenet assets received is accounted for as an equity transaction.
(e) Impairment of long-lived assetsUnder IFRS, impairment charges are recognised when a long-lived asset’s carrying amount exceeds the higher of an asset’s net selling price and value inuse, which incorporates discounting the asset’s estimated future cash flows.
Under US GAAP, determination of the recoverability of a long-lived asset is based on an estimate of undiscounted future cash flows resulting from the useof the asset and its eventual disposition. If the sum of the expected future cash flows is less than the carrying amount of the asset, an impairment loss isrecognised. Measurement of an impairment loss for a long-lived asset is based on the fair value of the asset.
In addition, under IFRS, a subsequent increase in the recoverable amount of an asset is reversed to the consolidated income statement to the extent thatan impairment loss on the same asset was previously recognised as an expense when the circumstances and events that led to the write-down or write-offcease to exist. The reversal is reduced by the amount that would have been recognised as depreciation had the write-off not occurred. Under US GAAP, animpairment loss establishes a new cost basis for the impaired asset and the new cost basis should not be adjusted subsequently other than for furtherimpairment losses.
The US GAAP adjustment represents the effect of reversing the recovery of previous impairment charges recorded under IFRS.
(f) Employee reduction expensesAs described in Note 7 to the financial statements prepared under IFRS, certain employees of the Group were transferred to Sinopec Group Company.During the year ended 31 December 2001, Sinopec Group Company paid RMB 2,885 million to employees that were transferred to Sinopec GroupCompany and were subsequently terminated. Under IFRS, the payment made to these employees by Sinopec Group Company is not recorded in currentearnings. Under US GAAP, with reference to Interpretation No. 1 to Accounting Principles Board Opinion (“APB”) No. 25, such payment made by SinopecGroup Company is charged to current earnings with a corresponding increase in shareholders’ funds.
(g) Capitalised interest on investment in associatesUnder IFRS, investment accounted for by the equity method is not considered a qualifying asset for which interest is capitalised. Under US GAAP, aninvestment accounted for by the equity method while the investee has activities in progress necessary to commence its planned principal operations,provided that the investee’s activities include the use of funds to acquire qualifying assets for its operations, is a qualifying asset for which interest iscapitalised.

14
5Fi
nanc
ial
Acc
ount
ing
Rep
ort
(h) Goodwill amortisationUnder IFRS, goodwill and negative goodwill are amortised on a systematic basis over their useful lives.
Under US GAAP, with reference to Statement of Financial Accounting Standards No. 142, “Goodwill and Other Intangible Assets” (“SFAS No. 142”),goodwill is no longer amortised beginning 1 January 2002, the date that SFAS No. 142 was adopted. Instead, goodwill is reviewed for impairment uponadoption of SFAS No. 142 and annually thereafter. In connection with SFAS No. 142’s transitional goodwill impairment evaluation, the Group determinedthat no goodwill impairment existed as of the date of adoption. In addition, under US GAAP, negative goodwill of RMB 11 million, net of minorityinterests, that existed at the date of adoption of SFAS No. 142 was written off as a cumulative effect of a change in accounting principle.
(i) Companies included in consolidationUnder IFRS, the Group consolidates less than majority owned entities in which the Group has the power, directly or indirectly, to govern the financial andoperating policies of an entity so as to obtain benefits from its activities. However, US GAAP requires that any entity of which the Group owns 20% to 50%of total outstanding voting stock not be consolidated, but rather be accounted for under the equity method. Accordingly, Sinopec Fujian PetrochemicalCompany Limited, Sinopec Wuhan Petroleum Group Company Limited, Sinopec Wuhan Phoenix Company Limited and Sinopec Yizheng Chemical FibreCompany Limited of which the Group owns 50%, 46.25%, 40.72%, and 42%, respectively of the outstanding voting stock, are excluded fromconsolidation under US GAAP and accounted for under the equity method. This exclusion does not affect the profit attributable to shareholders orshareholders’ funds reconciliations between IFRS and US GAAP. Presented below is summarised financial information of Sinopec Fujian PetrochemicalCompany Limited, Sinopec Wuhan Petroleum Group Company Limited, Sinopec Wuhan Phoenix Company Limited and Sinopec Yizheng Chemical FibreCompany Limited.
Year ended 31 December2002 2001
RMB millions RMB millionsRevenues 16,719 15,809Profit before taxation 666 531Net profit 468 329
At 31 December2002 2001
RMB millions RMB millionsCurrent assets 5,169 4,556Total assets 17,463 15,564Current liabilities 4,612 3,267Total liabilities 4,992 3,823Total equity 12,471 11,741
(j) Related party transactionsUnder IFRS, transactions of state-controlled enterprises with other state-controlled enterprises are not required to be disclosed as related partytransactions. Furthermore, government departments and agencies are deemed not to be related parties to the extent that such dealings are in the normalcourse of business. Therefore, related party transactions as disclosed in Note 31 in financial statements prepared under IFRS only refers to transactionswith enterprises over which Sinopec Group Company is able to exercise significant influence.
Under US GAAP, there are no similar exemptions. Although the majority of the Group’s activities are with PRC government authorities and affiliates andother PRC state-owned enterprises, the Group believes that it has provided meaningful disclosure of related party transactions in Note 31 to the financialstatements prepared under IFRS.
(k) Recently issued accounting standardsSFAS No. 143In June 2001, the FASB issued SFAS No. 143, “Accounting for Asset Retirement Obligations”. SFAS No. 143 requires the Group to record the fair value ofan asset retirement obligation as a liability in the period in which it incurs a legal obligation associated with the retirement of tangible long-lived assetsthat result from the acquisition, construction, development and/or normal use of the assets. The Group is also required to record a corresponding assetwhich is depreciated over the life of the asset. Subsequent to the initial measurement of the asset retirement obligation, the obligation will be adjusted atthe end of each period to reflect the passage of time and changes in the estimated future cash flows underlying the obligation. The Group is required toadopt SFAS No. 143 on 1 January 2003. The Group does not expect the adoption of SFAS No.143 will have a material impact on its consolidated financialstatements.
SFAS No. 145In April 2002, the FASB issued SFAS No. 145, which rescinds SFAS No. 4, “Reporting Gains and Losses from Extinguishment of Debt”, and anamendment of that Statement, SFAS No. 64, “Extinguishments of Debt Made to Satisfy Sinking-Fund Requirements”. SFAS No. 145 also rescinds SFASNo. 44, “Accounting for Intangible Assets of Motor Carriers”. SFAS No. 145 amends SFAS No. 13, “Accounting for Leases”, to eliminate an inconsistencybetween the required accounting for sale-leaseback transactions and the required accounting for certain lease modifications that have economic effectsthat are similar to sale-leaseback transactions. SFAS No. 145 also amends other existing authoritative pronouncements to make various technicalcorrections, clarify meanings, or describe their applicability under changed conditions.
The provisions of SFAS No. 145 related to the rescission of SFAS No. 4 shall be applied in fiscal years beginning after 15 May 2002. The provisions inparagraphs 8 and 9(c) of SFAS No. 145 related to Statement 13 shall be effective for transactions occurring after 15 May 2002. All other provisions ofSFAS No. 145 shall be effective for financial statements issued on or after 15 May 2002. The Group does not expect the adoption of SFAS No. 145 willhave a material impact on its consolidated financial statements.
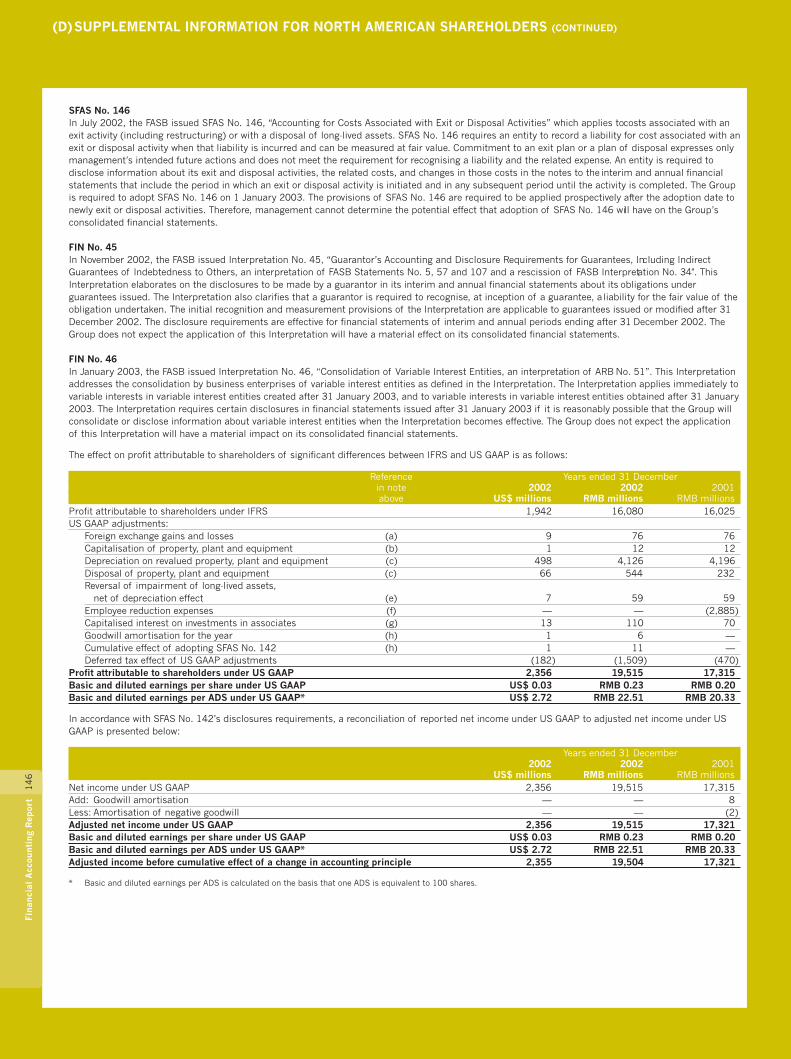
(D)SUPPLEMENTAL INFORMATION FOR NORTH AMERICAN SHAREHOLDERS (CONTINUED)1
46
Fina
ncia
l A
ccou
ntin
g R
epor
t
SFAS No. 146In July 2002, the FASB issued SFAS No. 146, “Accounting for Costs Associated with Exit or Disposal Activities” which applies to costs associated with anexit activity (including restructuring) or with a disposal of long-lived assets. SFAS No. 146 requires an entity to record a liability for cost associated with anexit or disposal activity when that liability is incurred and can be measured at fair value. Commitment to an exit plan or a plan of disposal expresses onlymanagement’s intended future actions and does not meet the requirement for recognising a liability and the related expense. An entity is required todisclose information about its exit and disposal activities, the related costs, and changes in those costs in the notes to the interim and annual financialstatements that include the period in which an exit or disposal activity is initiated and in any subsequent period until the activity is completed. The Groupis required to adopt SFAS No. 146 on 1 January 2003. The provisions of SFAS No. 146 are required to be applied prospectively after the adoption date tonewly exit or disposal activities. Therefore, management cannot determine the potential effect that adoption of SFAS No. 146 will have on the Group’sconsolidated financial statements.
FIN No. 45In November 2002, the FASB issued Interpretation No. 45, “Guarantor’s Accounting and Disclosure Requirements for Guarantees, Including IndirectGuarantees of Indebtedness to Others, an interpretation of FASB Statements No. 5, 57 and 107 and a rescission of FASB Interpretation No. 34". ThisInterpretation elaborates on the disclosures to be made by a guarantor in its interim and annual financial statements about its obligations underguarantees issued. The Interpretation also clarifies that a guarantor is required to recognise, at inception of a guarantee, a liability for the fair value of theobligation undertaken. The initial recognition and measurement provisions of the Interpretation are applicable to guarantees issued or modified after 31December 2002. The disclosure requirements are effective for financial statements of interim and annual periods ending after 31 December 2002. TheGroup does not expect the application of this Interpretation will have a material effect on its consolidated financial statements.
FIN No. 46In January 2003, the FASB issued Interpretation No. 46, “Consolidation of Variable Interest Entities, an interpretation of ARB No. 51”. This Interpretationaddresses the consolidation by business enterprises of variable interest entities as defined in the Interpretation. The Interpretation applies immediately tovariable interests in variable interest entities created after 31 January 2003, and to variable interests in variable interest entities obtained after 31 January2003. The Interpretation requires certain disclosures in financial statements issued after 31 January 2003 if it is reasonably possible that the Group willconsolidate or disclose information about variable interest entities when the Interpretation becomes effective. The Group does not expect the applicationof this Interpretation will have a material impact on its consolidated financial statements.
The effect on profit attributable to shareholders of significant differences between IFRS and US GAAP is as follows:
Reference Years ended 31 Decemberin note 2002 2002 2001above US$ millions RMB millions RMB millions
Profit attributable to shareholders under IFRS 1,942 16,080 16,025US GAAP adjustments:
Foreign exchange gains and losses (a) 9 76 76Capitalisation of property, plant and equipment (b) 1 12 12Depreciation on revalued property, plant and equipment (c) 498 4,126 4,196Disposal of property, plant and equipment (c) 66 544 232Reversal of impairment of long-lived assets,
net of depreciation effect (e) 7 59 59Employee reduction expenses (f) — — (2,885)Capitalised interest on investments in associates (g) 13 110 70Goodwill amortisation for the year (h) 1 6 —Cumulative effect of adopting SFAS No. 142 (h) 1 11 —Deferred tax effect of US GAAP adjustments (182) (1,509) (470)
Profit attributable to shareholders under US GAAP 2,356 19,515 17,315Basic and diluted earnings per share under US GAAP US$ 0.03 RMB 0.23 RMB 0.20Basic and diluted earnings per ADS under US GAAP* US$ 2.72 RMB 22.51 RMB 20.33
In accordance with SFAS No. 142’s disclosures requirements, a reconciliation of reported net income under US GAAP to adjusted net income under USGAAP is presented below:
Years ended 31 December2002 2002 2001
US$ millions RMB millions RMB millionsNet income under US GAAP 2,356 19,515 17,315Add: Goodwill amortisation — — 8Less: Amortisation of negative goodwill — — (2)Adjusted net income under US GAAP 2,356 19,515 17,321Basic and diluted earnings per share under US GAAP US$ 0.03 RMB 0.23 RMB 0.20Basic and diluted earnings per ADS under US GAAP* US$ 2.72 RMB 22.51 RMB 20.33Adjusted income before cumulative effect of a change in accounting principle 2,355 19,504 17,321
* Basic and diluted earnings per ADS is calculated on the basis that one ADS is equivalent to 100 shares.
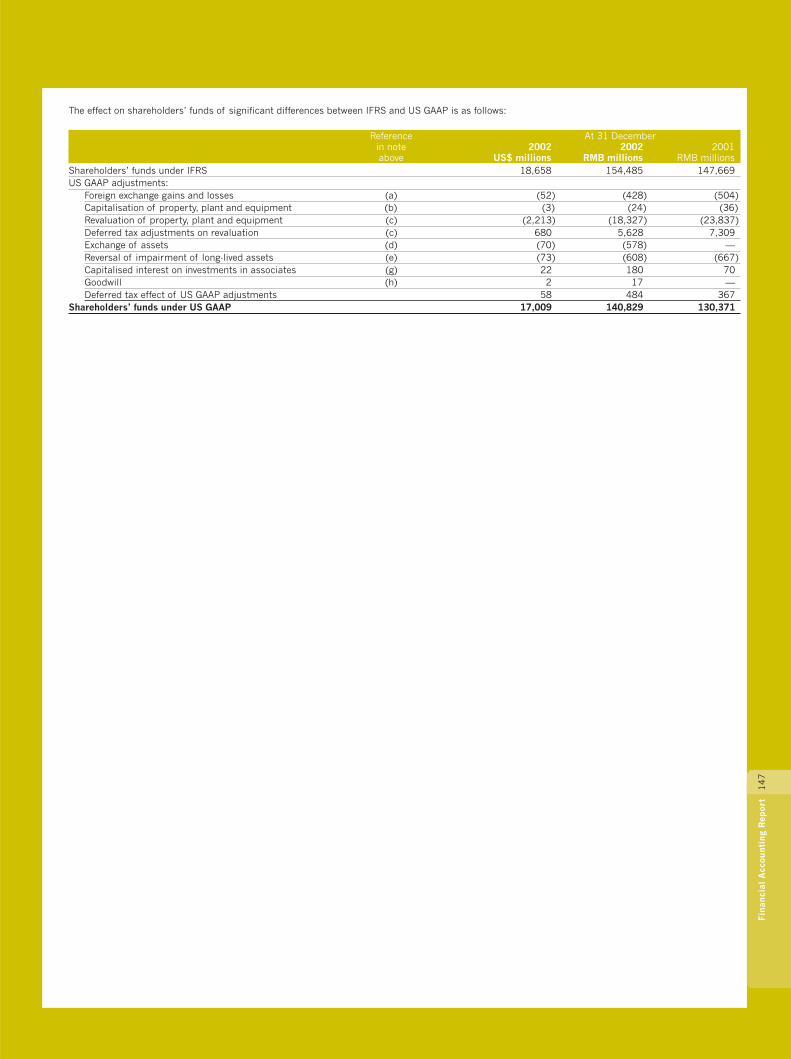
14
7Fi
nanc
ial
Acc
ount
ing
Rep
ort
The effect on shareholders’ funds of significant differences between IFRS and US GAAP is as follows:
Reference At 31 Decemberin note 2002 2002 2001above US$ millions RMB millions RMB millions
Shareholders’ funds under IFRS 18,658 154,485 147,669US GAAP adjustments:
Foreign exchange gains and losses (a) (52) (428) (504)Capitalisation of property, plant and equipment (b) (3) (24) (36)Revaluation of property, plant and equipment (c) (2,213) (18,327) (23,837)Deferred tax adjustments on revaluation (c) 680 5,628 7,309Exchange of assets (d) (70) (578) —Reversal of impairment of long-lived assets (e) (73) (608) (667)Capitalised interest on investments in associates (g) 22 180 70Goodwill (h) 2 17 —Deferred tax effect of US GAAP adjustments 58 484 367
Shareholders’ funds under US GAAP 17,009 140,829 130,371
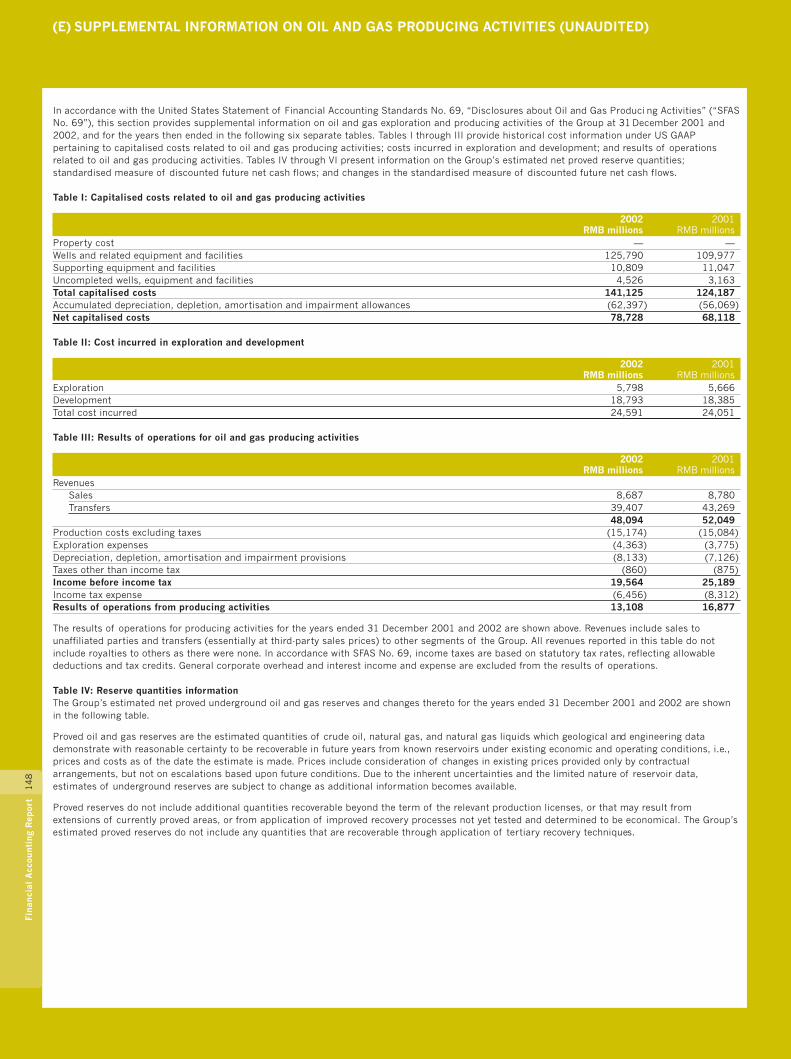
(E) SUPPLEMENTAL INFORMATION ON OIL AND GAS PRODUCING ACTIVITIES (UNAUDITED)1
48
Fina
ncia
l A
ccou
ntin
g R
epor
t
In accordance with the United States Statement of Financial Accounting Standards No. 69, “Disclosures about Oil and Gas Producing Activities” (“SFASNo. 69”), this section provides supplemental information on oil and gas exploration and producing activities of the Group at 31 December 2001 and2002, and for the years then ended in the following six separate tables. Tables I through III provide historical cost information under US GAAPpertaining to capitalised costs related to oil and gas producing activities; costs incurred in exploration and development; and results of operationsrelated to oil and gas producing activities. Tables IV through VI present information on the Group’s estimated net proved reserve quantities;standardised measure of discounted future net cash flows; and changes in the standardised measure of discounted future net cash flows.
Table I: Capitalised costs related to oil and gas producing activities
2002 2001RMB millions RMB millions
Property cost — —Wells and related equipment and facilities 125,790 109,977Supporting equipment and facilities 10,809 11,047Uncompleted wells, equipment and facilities 4,526 3,163Total capitalised costs 141,125 124,187Accumulated depreciation, depletion, amortisation and impairment allowances (62,397) (56,069)Net capitalised costs 78,728 68,118
Table II: Cost incurred in exploration and development
2002 2001RMB millions RMB millions
Exploration 5,798 5,666Development 18,793 18,385Total cost incurred 24,591 24,051
Table III: Results of operations for oil and gas producing activities
2002 2001RMB millions RMB millions
RevenuesSales 8,687 8,780Transfers 39,407 43,269
48,094 52,049Production costs excluding taxes (15,174) (15,084)Exploration expenses (4,363) (3,775)Depreciation, depletion, amortisation and impairment provisions (8,133) (7,126)Taxes other than income tax (860) (875)Income before income tax 19,564 25,189Income tax expense (6,456) (8,312)Results of operations from producing activities 13,108 16,877
The results of operations for producing activities for the years ended 31 December 2001 and 2002 are shown above. Revenues include sales tounaffiliated parties and transfers (essentially at third-party sales prices) to other segments of the Group. All revenues reported in this table do notinclude royalties to others as there were none. In accordance with SFAS No. 69, income taxes are based on statutory tax rates, reflecting allowabledeductions and tax credits. General corporate overhead and interest income and expense are excluded from the results of operations.
Table IV: Reserve quantities informationThe Group’s estimated net proved underground oil and gas reserves and changes thereto for the years ended 31 December 2001 and 2002 are shownin the following table.
Proved oil and gas reserves are the estimated quantities of crude oil, natural gas, and natural gas liquids which geological and engineering datademonstrate with reasonable certainty to be recoverable in future years from known reservoirs under existing economic and operating conditions, i.e.,prices and costs as of the date the estimate is made. Prices include consideration of changes in existing prices provided only by contractualarrangements, but not on escalations based upon future conditions. Due to the inherent uncertainties and the limited nature of reservoir data,estimates of underground reserves are subject to change as additional information becomes available.
Proved reserves do not include additional quantities recoverable beyond the term of the relevant production licenses, or that may result fromextensions of currently proved areas, or from application of improved recovery processes not yet tested and determined to be economical. The Group’sestimated proved reserves do not include any quantities that are recoverable through application of tertiary recovery techniques.
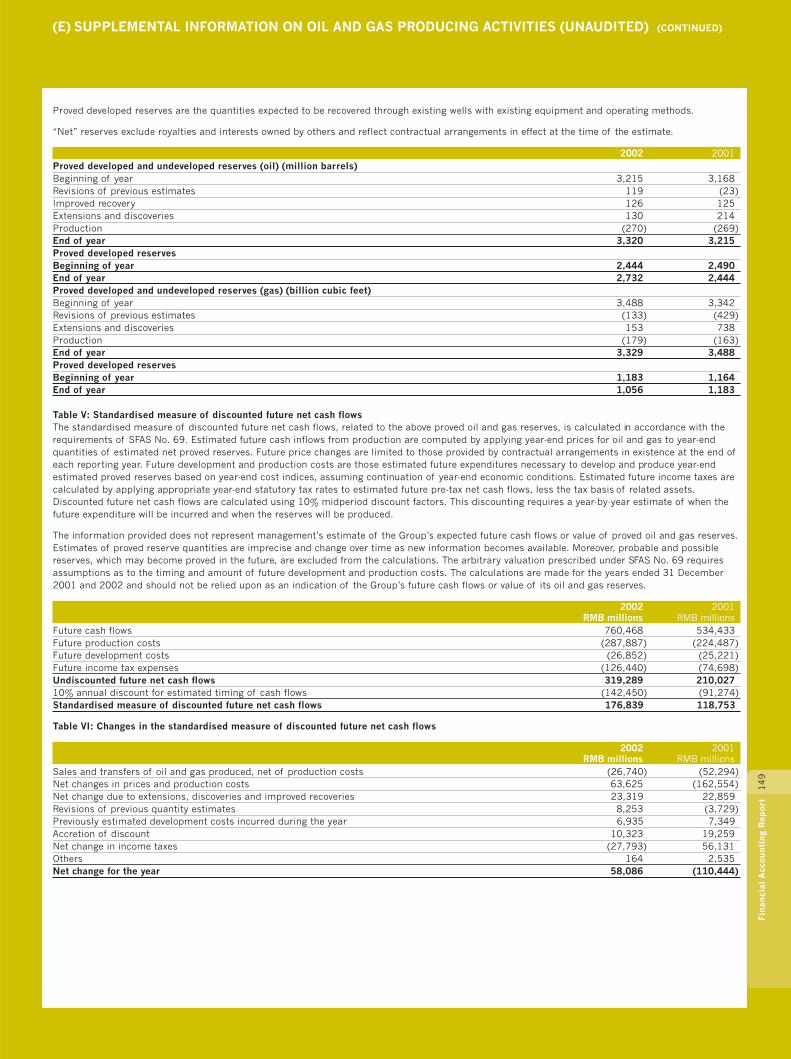
(E) SUPPLEMENTAL INFORMATION ON OIL AND GAS PRODUCING ACTIVITIES (UNAUDITED) (CONTINUED)
14
9Fi
nanc
ial
Acc
ount
ing
Rep
ort
Proved developed reserves are the quantities expected to be recovered through existing wells with existing equipment and operating methods.
“Net” reserves exclude royalties and interests owned by others and reflect contractual arrangements in effect at the time of the estimate.
2002 2001Proved developed and undeveloped reserves (oil) (million barrels)Beginning of year 3,215 3,168Revisions of previous estimates 119 (23)Improved recovery 126 125Extensions and discoveries 130 214Production (270) (269)End of year 3,320 3,215Proved developed reservesBeginning of year 2,444 2,490End of year 2,732 2,444Proved developed and undeveloped reserves (gas) (billion cubic feet)Beginning of year 3,488 3,342Revisions of previous estimates (133) (429)Extensions and discoveries 153 738Production (179) (163)End of year 3,329 3,488Proved developed reservesBeginning of year 1,183 1,164End of year 1,056 1,183
Table V: Standardised measure of discounted future net cash flowsThe standardised measure of discounted future net cash flows, related to the above proved oil and gas reserves, is calculated in accordance with therequirements of SFAS No. 69. Estimated future cash inflows from production are computed by applying year-end prices for oil and gas to year-endquantities of estimated net proved reserves. Future price changes are limited to those provided by contractual arrangements in existence at the end ofeach reporting year. Future development and production costs are those estimated future expenditures necessary to develop and produce year-endestimated proved reserves based on year-end cost indices, assuming continuation of year-end economic conditions. Estimated future income taxes arecalculated by applying appropriate year-end statutory tax rates to estimated future pre-tax net cash flows, less the tax basis of related assets.Discounted future net cash flows are calculated using 10% midperiod discount factors. This discounting requires a year-by-year estimate of when thefuture expenditure will be incurred and when the reserves will be produced.
The information provided does not represent management’s estimate of the Group’s expected future cash flows or value of proved oil and gas reserves.Estimates of proved reserve quantities are imprecise and change over time as new information becomes available. Moreover, probable and possiblereserves, which may become proved in the future, are excluded from the calculations. The arbitrary valuation prescribed under SFAS No. 69 requiresassumptions as to the timing and amount of future development and production costs. The calculations are made for the years ended 31 December2001 and 2002 and should not be relied upon as an indication of the Group’s future cash flows or value of its oil and gas reserves.
2002 2001RMB millions RMB millions
Future cash flows 760,468 534,433Future production costs (287,887) (224,487)Future development costs (26,852) (25,221)Future income tax expenses (126,440) (74,698)Undiscounted future net cash flows 319,289 210,02710% annual discount for estimated timing of cash flows (142,450) (91,274)Standardised measure of discounted future net cash flows 176,839 118,753
Table VI: Changes in the standardised measure of discounted future net cash flows
2002 2001RMB millions RMB millions
Sales and transfers of oil and gas produced, net of production costs (26,740) (52,294)Net changes in prices and production costs 63,625 (162,554)Net change due to extensions, discoveries and improved recoveries 23,319 22,859Revisions of previous quantity estimates 8,253 (3,729)Previously estimated development costs incurred during the year 6,935 7,349Accretion of discount 10,323 19,259Net change in income taxes (27,793) 56,131Others 164 2,535Net change for the year 58,086 (110,444)
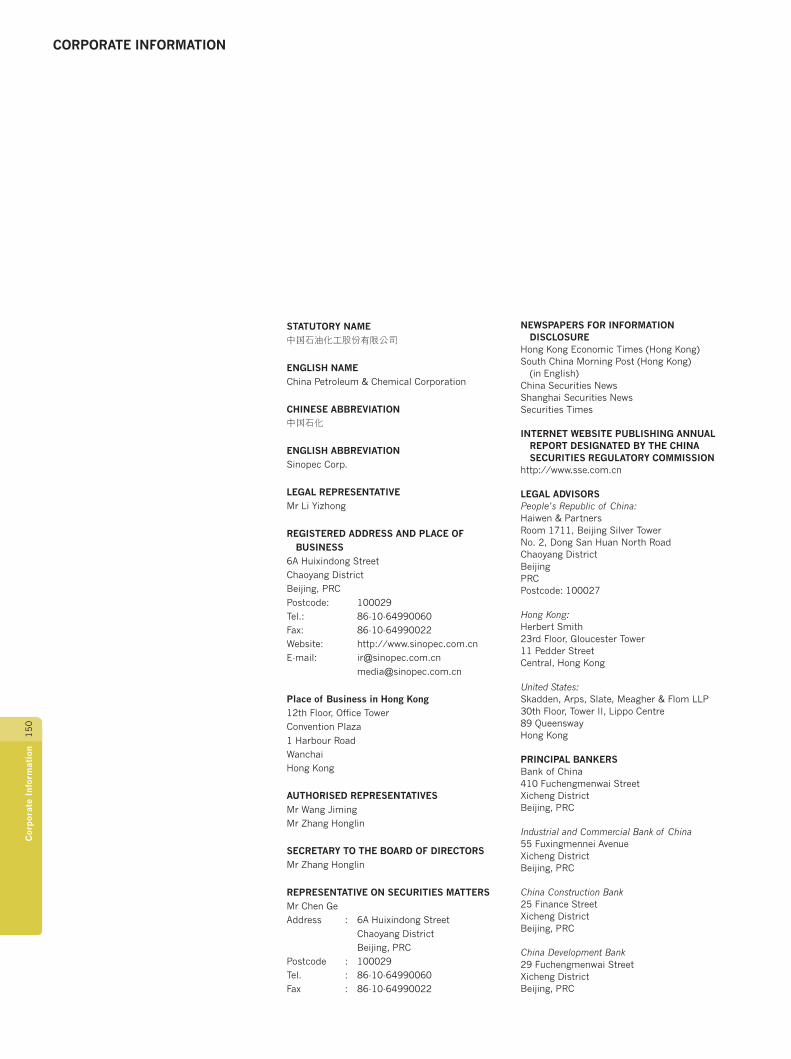
CORPORATE INFORMATION
15
0C
orp
orat
e In
form
atio
n
NEWSPAPERS FOR INFORMATIONDISCLOSURE
Hong Kong Economic Times (Hong Kong)South China Morning Post (Hong Kong)
(in English)China Securities NewsShanghai Securities NewsSecurities Times
INTERNET WEBSITE PUBLISHING ANNUALREPORT DESIGNATED BY THE CHINASECURITIES REGULATORY COMMISSION
http://www.sse.com.cn
LEGAL ADVISORSPeople’s Republic of China:Haiwen & PartnersRoom 1711, Beijing Silver TowerNo. 2, Dong San Huan North RoadChaoyang DistrictBeijingPRCPostcode: 100027
Hong Kong:Herbert Smith23rd Floor, Gloucester Tower11 Pedder StreetCentral, Hong Kong
United States:Skadden, Arps, Slate, Meagher & Flom LLP30th Floor, Tower II, Lippo Centre89 QueenswayHong Kong
PRINCIPAL BANKERSBank of China410 Fuchengmenwai StreetXicheng DistrictBeijing, PRC
Industrial and Commercial Bank of China55 Fuxingmennei AvenueXicheng DistrictBeijing, PRC
China Construction Bank25 Finance StreetXicheng DistrictBeijing, PRC
China Development Bank29 Fuchengmenwai StreetXicheng DistrictBeijing, PRC
STATUTORY NAME中國石油化工股份有限公司
ENGLISH NAMEChina Petroleum & Chemical Corporation
CHINESE ABBREVIATION中國石化
ENGLISH ABBREVIATIONSinopec Corp.
LEGAL REPRESENTATIVEMr Li Yizhong
REGISTERED ADDRESS AND PLACE OFBUSINESS
6A Huixindong StreetChaoyang DistrictBeijing, PRC
Postcode: 100029Tel.: 86-10-64990060Fax: 86-10-64990022Website: http://www.sinopec.com.cnE-mail: [email protected]
Place of Business in Hong Kong12th Floor, Office TowerConvention Plaza
1 Harbour RoadWanchaiHong Kong
AUTHORISED REPRESENTATIVESMr Wang JimingMr Zhang Honglin
SECRETARY TO THE BOARD OF DIRECTORSMr Zhang Honglin
REPRESENTATIVE ON SECURITIES MATTERSMr Chen GeAddress : 6A Huixindong Street
Chaoyang DistrictBeijing, PRC
Postcode : 100029Tel. : 86-10-64990060Fax : 86-10-64990022
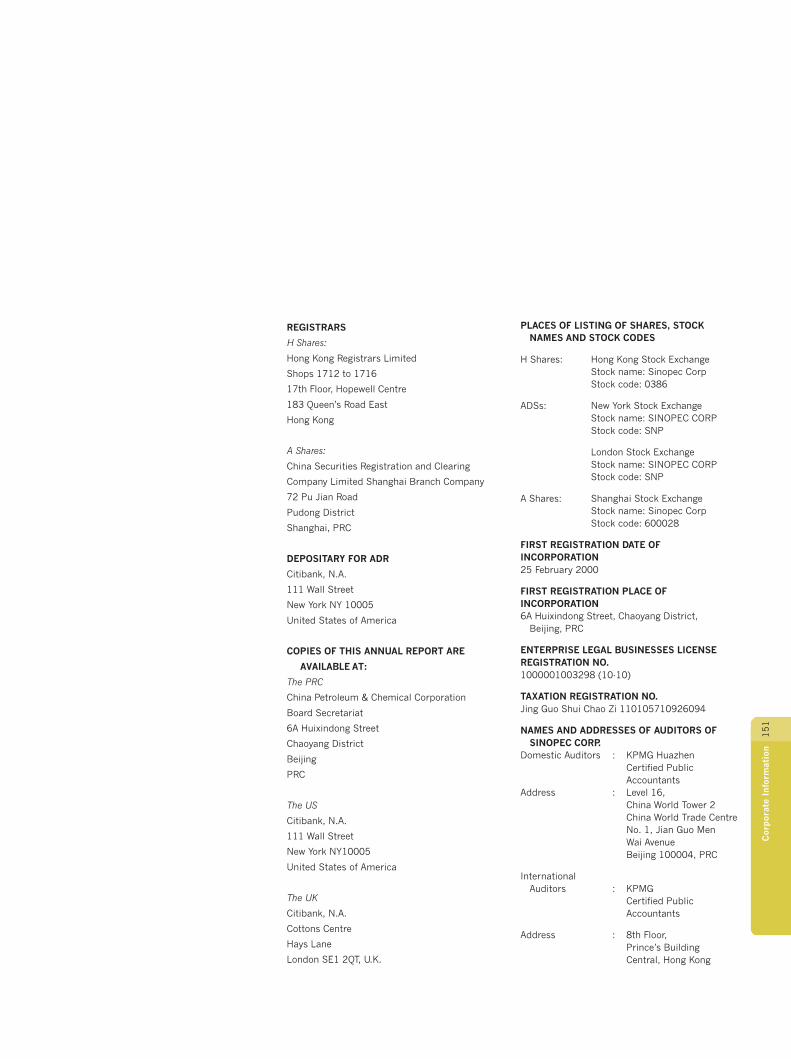
15
1C
orp
orat
e In
form
atio
n
REGISTRARS
H Shares:
Hong Kong Registrars Limited
Shops 1712 to 1716
17th Floor, Hopewell Centre
183 Queen’s Road East
Hong Kong
A Shares:
China Securities Registration and Clearing
Company Limited Shanghai Branch Company
72 Pu Jian Road
Pudong District
Shanghai, PRC
DEPOSITARY FOR ADR
Citibank, N.A.
111 Wall Street
New York NY 10005
United States of America
COPIES OF THIS ANNUAL REPORT ARE
AVAILABLE AT:
The PRC
China Petroleum & Chemical Corporation
Board Secretariat
6A Huixindong Street
Chaoyang District
Beijing
PRC
The US
Citibank, N.A.
111 Wall Street
New York NY10005
United States of America
The UK
Citibank, N.A.
Cottons Centre
Hays Lane
London SE1 2QT, U.K.
PLACES OF LISTING OF SHARES, STOCKNAMES AND STOCK CODES
H Shares: Hong Kong Stock ExchangeStock name: Sinopec CorpStock code: 0386
ADSs: New York Stock ExchangeStock name: SINOPEC CORPStock code: SNP
London Stock ExchangeStock name: SINOPEC CORPStock code: SNP
A Shares: Shanghai Stock ExchangeStock name: Sinopec CorpStock code: 600028
FIRST REGISTRATION DATE OFINCORPORATION25 February 2000
FIRST REGISTRATION PLACE OFINCORPORATION6A Huixindong Street, Chaoyang District,
Beijing, PRC
ENTERPRISE LEGAL BUSINESSES LICENSEREGISTRATION NO.1000001003298 (10-10)
TAXATION REGISTRATION NO.Jing Guo Shui Chao Zi 110105710926094
NAMES AND ADDRESSES OF AUDITORS OFSINOPEC CORP.
Domestic Auditors : KPMG HuazhenCertified PublicAccountants
Address : Level 16,China World Tower 2China World Trade CentreNo. 1, Jian Guo MenWai AvenueBeijing 100004, PRC
InternationalAuditors : KPMG
Certified PublicAccountants
Address : 8th Floor,Prince’s BuildingCentral, Hong Kong

DOCUMENTS FOR INSPECTION
15
2D
ocum
ents
for
Ins
pec
tion
The following documents will be available forinspection during normal business hours after 28March 2003 (Friday) at the statutory address ofSinopec Corp. upon requests by the relevantregulatory authorities and shareholders inaccordance with the Articles of Association ofSinopec Corp. and the Company Law of the PRC:
a) The original annual report signed by theChairman of the Board of Directors and thePresident;
b) The original audited accounts and auditedconsolidated accounts of Sinopec Corp.prepared in accordance with IFRS and the PRCAccounting Rules and Regulations for the yearended 31 December 2002 signed by theChairman of the Board of Directors, thePresident and the Chief Financial Officer;
c) The original auditors’ report in respect of theabove financial reports signed by the auditors;
d) The latest Articles of Association of SinopecCorp. which were amended at the AnnualGeneral Meeting held on 5 June 2001; and
e) All the original copies of the documents andannouncements which Sinopec Corp.published in the newspapers stipulated by theCSRC during the reporting period.
By Order of the BoardLi YizhongChairman
Beijing, PRC, 28 March 2003
This annual report is published in both Englishand Chinese languages. The Chinese versionshall prevail.
