company presentation april 2017 - soitec - soitec · under number d.15-0587-a01 and update n°2...
TRANSCRIPT

Company presentation
April 2017
Disclaimer
This document was prepared by Soitec (the “Company”) and is provided for information purposes only. It is confidential and
must be treated as such by all persons who receive it. It may not be reproduced, distributed or published, directly or indirectly, in
whole or in part, nor distributed to any persons unless in accordance with applicable laws and regulations.
The Company’s business operations and financial position is described in the Company’s Document de Référence registered by
the Autorité des marchés financiers (the “AMF”) on June 10, 2015 under number D.15-0587, together with update n°1 registered
under number D.15-0587-A01 and update n°2 registered under number D.15-0587-A02 (together, the “Document de
Référence”). Copies of the French language Document de Référence are available through the Company. It may also be
consulted on the AMF’s website (www.amf-france.org) and on the Company’s website (www.soitec.com). Your attention is drawn
to the risk factors described in Chapter 4 of the Document de Référence. This presentation contains summary information and
should be read in conjunction with the Document de Référence. In the event of a discrepancy between this document and the
Document de Référence, the Document de Référence shall prevail.
This document contains certain forward-looking statements. These forward-looking statements relate to the Company’s future
prospects, developments and strategy and are based on analyses of earnings forecasts and estimates of amounts not yet
determinable. By their nature, forward-looking statements are subject to a variety of risks and uncertainties as they relate to
future events and are dependent on circumstances that may or may not materialize in the future. Forward-looking statements
are not a guarantee of the Company’s future performance. The Company’s actual financial position, results and cash flows, as
well as the trends in the sector in which the Company operates may differ materially from those contained in this presentation.
Furthermore, even if the Company’s financial position, results, cash-flows and the developments in the sector in which the
Company operates were to conform to the forward-looking statements contained in this presentation, such elements cannot be
construed as a reliable indication of the Company’s future results or developments. The Company does not undertake any
obligation to update or make any correction to any forward-looking statement in order to reflect an event or circumstance that
may occur after the date of this presentation. In addition, the occurrence of any of the risks described in Chapter 4 of the
Document de Référence may have an impact on these forward-looking statements.
Soitec - Company presentation - April 2017 2
Agenda
Soitec - Company presentation - April 2017 3
1 H1’17 highlights
2 H1’17 financials & FY’17 revenues
3 Business review: promising prospects in Electronics
4 Outlook
5 Appendix
Agenda
Soitec - Company presentation - April 2017 4
1 H1’17 highlights
2 H1’17 financials & FY’17 revenues
3 Business review: promising prospects in Electronics
4 Outlook
5 Appendix
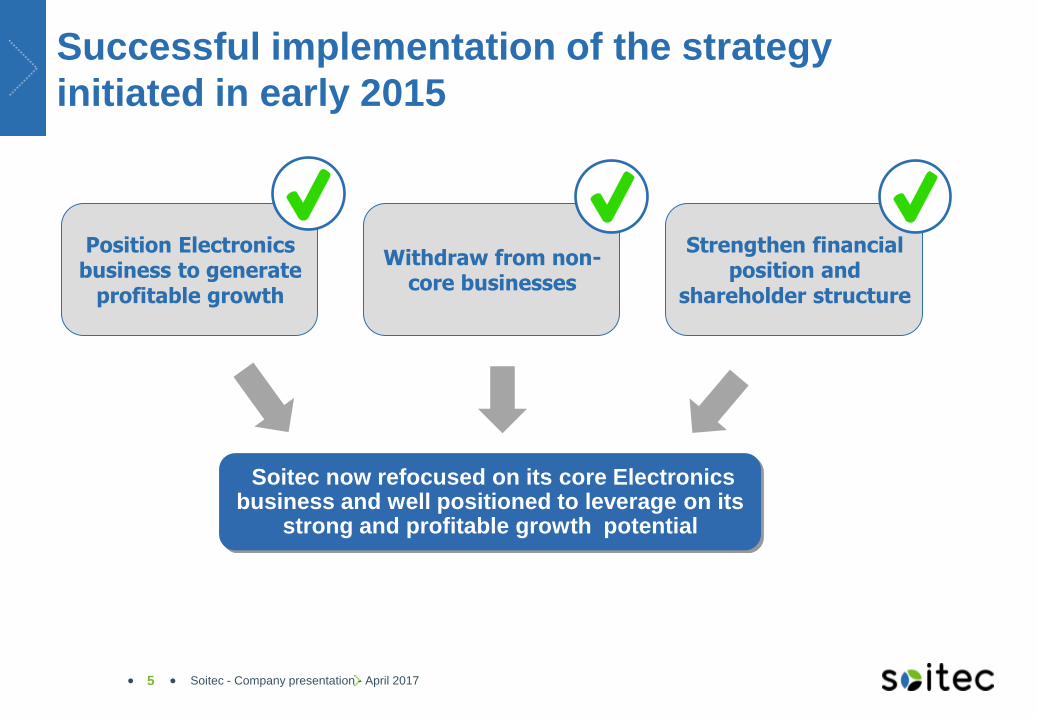
Successful implementation of the strategy
initiated in early 2015
5
Position Electronics business to generate
profitable growth
Soitec now refocused on its core Electronics business and well positioned to leverage on its
strong and profitable growth potential
Withdraw from non-core businesses
Strengthen financial position and
shareholder structure
Soitec - Company presentation - April 2017
27.1 32.0
H1'16 H1'17
7.9 9.4
H1'16 H1'17
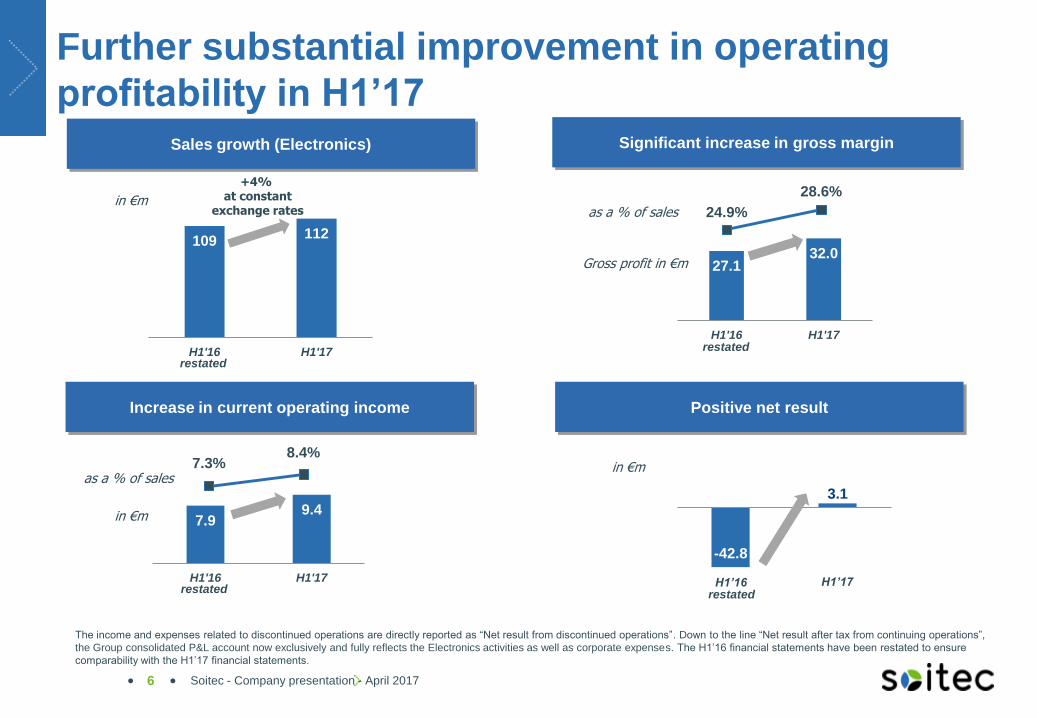
Further substantial improvement in operating
profitability in H1’17
109 112
H1'16 H1'17
Significant increase in gross margin
in €m
Gross profit in €m
as a % of sales
Increase in current operating income
in €m
Positive net result
-42.8
3.1
in €m
+4% at constant
exchange rates
The income and expenses related to discontinued operations are directly reported as “Net result from discontinued operations”. Down to the line “Net result after tax from continuing operations”,
the Group consolidated P&L account now exclusively and fully reflects the Electronics activities as well as corporate expenses. The H1’16 financial statements have been restated to ensure
comparability with the H1’17 financial statements.
restated
restated
restated restated
Sales growth (Electronics)
Soitec - Company presentation - April 2017 6
24.9%
28.6%
7.3% 8.4%
H1’16 H1’17
as a % of sales

Soitec’s largest shareholder since 2011
Chinese industrial investment group
dedicated to the semiconductor industry
Wholly-owned by CEA, Soitec’s R&D and
technological partner since 1992
Key transaction completed in Q1’17 to strengthen
balance sheet and support future growth
Growth
financing
Balance sheet
strengthening
Use of funds A total equity
injection of €151.9m
€50m used to
repay financing
maturing in May
2016
~ €60m for the
repurchase of
2018 OCEANE
(out of the
€103.2m )
€40m to be
dedicated to
Bernin II CAPEX
Soitec - Company presentation - April 2017
3 strategic partners holding 14.5% of Soitec’s capital each
NSIG
7
Rights Issue
€75.4m
Reserved Capital
Increases
€76.5m

Agenda
Soitec - Company presentation - April 2017 8
1 H1’17 highlights
2 H1’17 financials & FY’17 revenues
3 Business review: promising prospects in Electronics
4 Outlook
5 Appendix
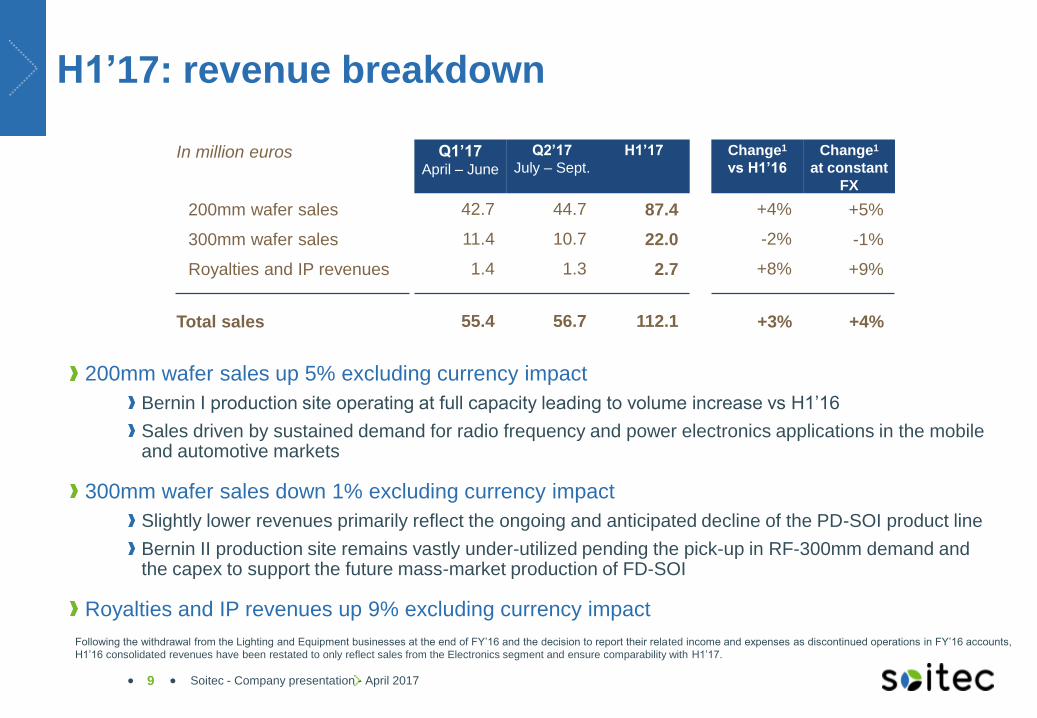
H1’17: revenue breakdown
Soitec - Company presentation - April 2017 9
In million euros Q1’17 April – June
Q2’17
July – Sept.
H1’17 Change1
vs H1’16
Change1
at constant
FX
200mm wafer sales 42.7 44.7 87.4 +4% +5%
300mm wafer sales 11.4 10.7 22.0 -2% -1%
Royalties and IP revenues 1.4 1.3 2.7 +8% +9%
Total sales 55.4 56.7 112.1 +3% +4%
Following the withdrawal from the Lighting and Equipment businesses at the end of FY’16 and the decision to report their related income and expenses as discontinued operations in FY’16 accounts,
H1’16 consolidated revenues have been restated to only reflect sales from the Electronics segment and ensure comparability with H1’17.
200mm wafer sales up 5% excluding currency impact
Bernin I production site operating at full capacity leading to volume increase vs H1’16
Sales driven by sustained demand for radio frequency and power electronics applications in the mobile and automotive markets
300mm wafer sales down 1% excluding currency impact
Slightly lower revenues primarily reflect the ongoing and anticipated decline of the PD-SOI product line
Bernin II production site remains vastly under-utilized pending the pick-up in RF-300mm demand and the capex to support the future mass-market production of FD-SOI
Royalties and IP revenues up 9% excluding currency impact
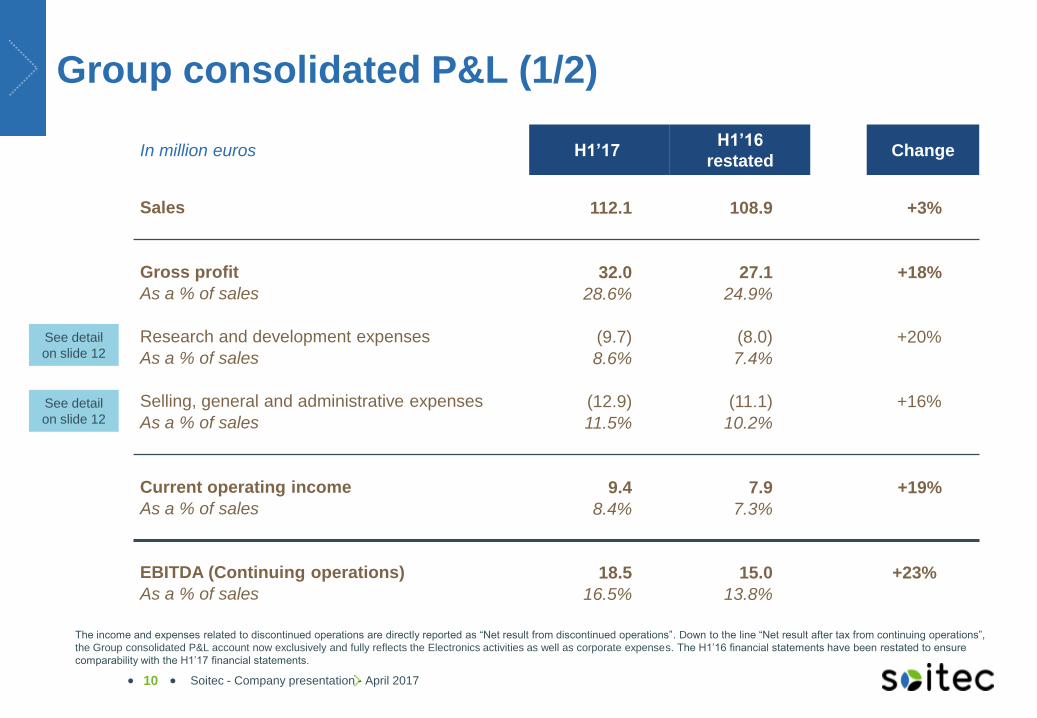
Group consolidated P&L (1/2)
In million euros H1’17 H1’16
restated Change
Sales 112.1 108.9 +3%
Gross profit 32.0 27.1 +18%
As a % of sales 28.6% 24.9%
Research and development expenses (9.7) (8.0) +20%
As a % of sales 8.6% 7.4%
Selling, general and administrative expenses (12.9) (11.1) +16%
As a % of sales 11.5% 10.2%
Current operating income 9.4 7.9 +19%
As a % of sales 8.4% 7.3%
EBITDA (Continuing operations) 18.5 15.0 +23%
As a % of sales 16.5% 13.8%
Soitec - Company presentation - April 2017 10
See detail
on slide 12
See detail
on slide 12
The income and expenses related to discontinued operations are directly reported as “Net result from discontinued operations”. Down to the line “Net result after tax from continuing operations”,
the Group consolidated P&L account now exclusively and fully reflects the Electronics activities as well as corporate expenses. The H1’16 financial statements have been restated to ensure
comparability with the H1’17 financial statements.
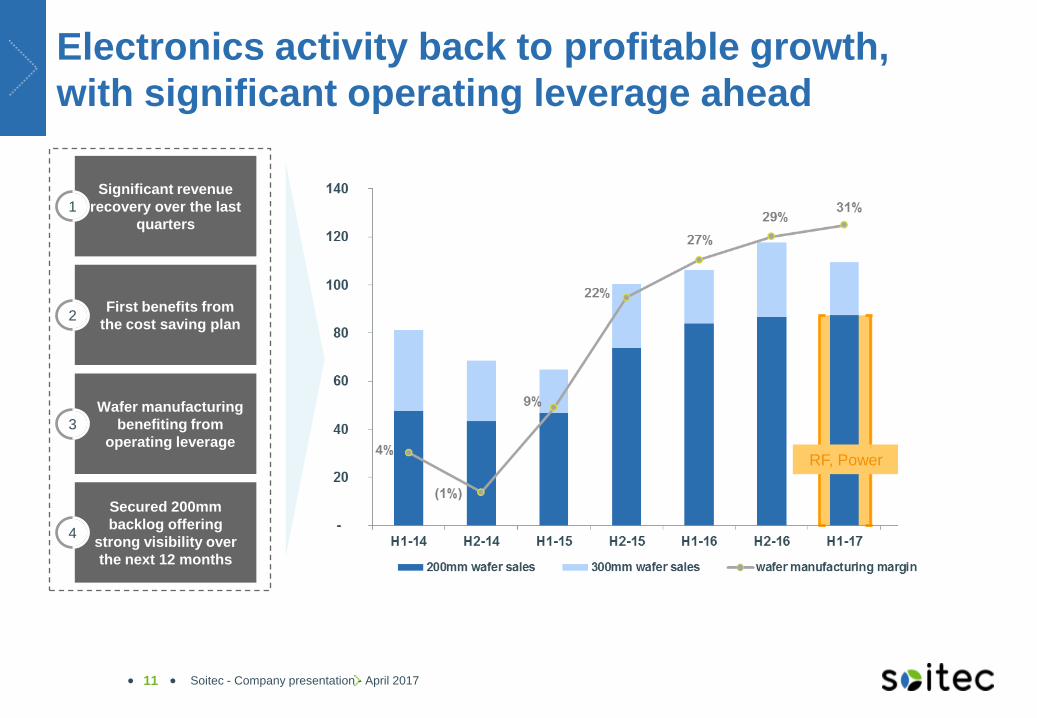
Electronics activity back to profitable growth,
with significant operating leverage ahead
Significant revenue
recovery over the last
quarters
Wafer manufacturing
benefiting from
operating leverage
Secured 200mm
backlog offering
strong visibility over
the next 12 months
1
3
4
First benefits from
the cost saving plan 2
RF, Power
11 Soitec - Company presentation - April 2017
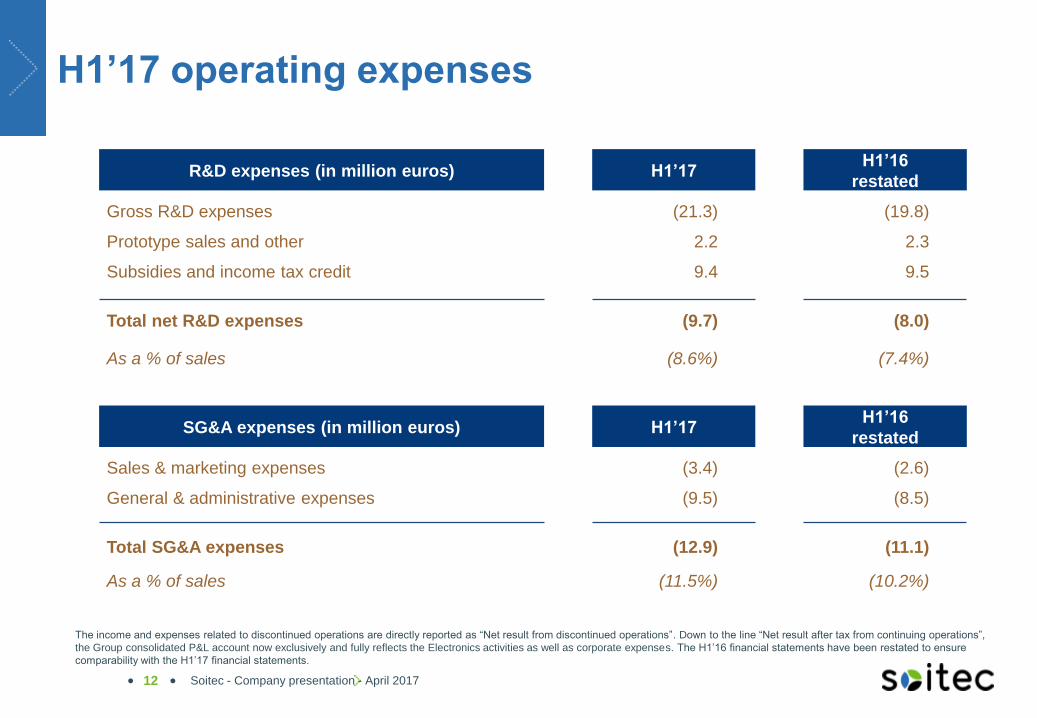
H1’17 operating expenses
Soitec - Company presentation - April 2017 12
R&D expenses (in million euros) H1’17 H1’16
restated
Gross R&D expenses (21.3) (19.8)
Prototype sales and other 2.2 2.3
Subsidies and income tax credit 9.4 9.5
Total net R&D expenses (9.7) (8.0)
As a % of sales (8.6%) (7.4%)
SG&A expenses (in million euros) H1’17 H1’16
restated
Sales & marketing expenses (3.4) (2.6)
General & administrative expenses (9.5) (8.5)
Total SG&A expenses (12.9) (11.1)
As a % of sales (11.5%) (10.2%)
The income and expenses related to discontinued operations are directly reported as “Net result from discontinued operations”. Down to the line “Net result after tax from continuing operations”,
the Group consolidated P&L account now exclusively and fully reflects the Electronics activities as well as corporate expenses. The H1’16 financial statements have been restated to ensure
comparability with the H1’17 financial statements.
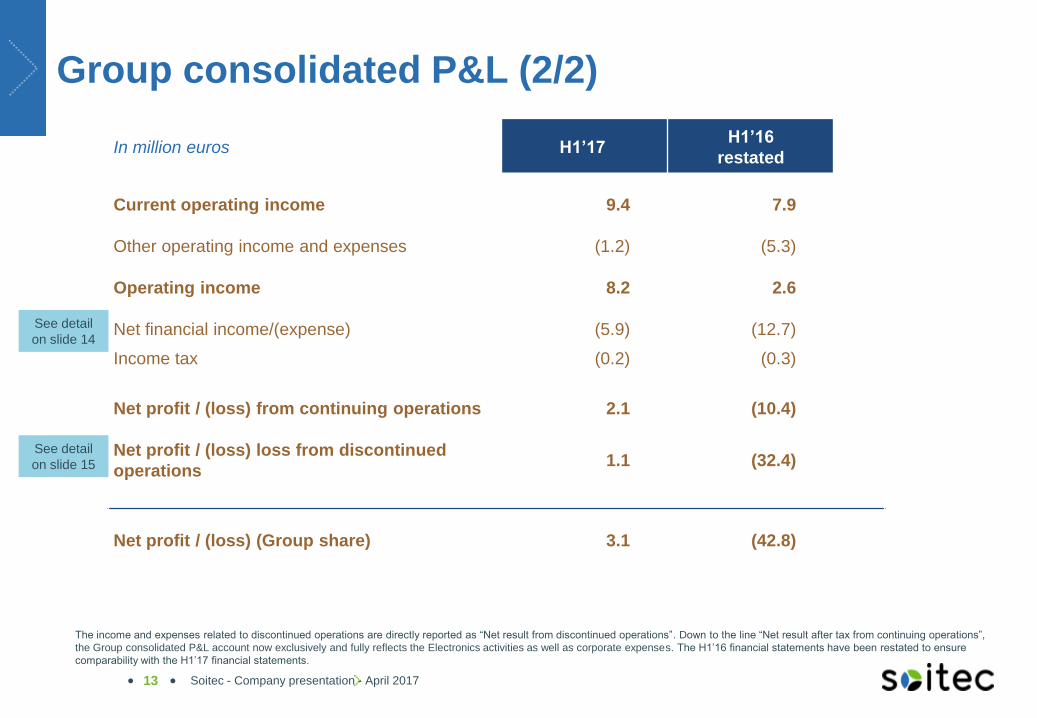
Group consolidated P&L (2/2)
In million euros H1’17 H1’16
restated
Current operating income 9.4 7.9
Other operating income and expenses (1.2) (5.3)
Operating income 8.2 2.6
Net financial income/(expense) (5.9) (12.7)
Income tax (0.2) (0.3)
Net profit / (loss) from continuing operations 2.1 (10.4)
Net profit / (loss) loss from discontinued
operations 1.1 (32.4)
Net profit / (loss) (Group share) 3.1 (42.8)
13 Soitec - Company presentation - April 2017
See detail
on slide 14
See detail
on slide 15
The income and expenses related to discontinued operations are directly reported as “Net result from discontinued operations”. Down to the line “Net result after tax from continuing operations”,
the Group consolidated P&L account now exclusively and fully reflects the Electronics activities as well as corporate expenses. The H1’16 financial statements have been restated to ensure
comparability with the H1’17 financial statements.
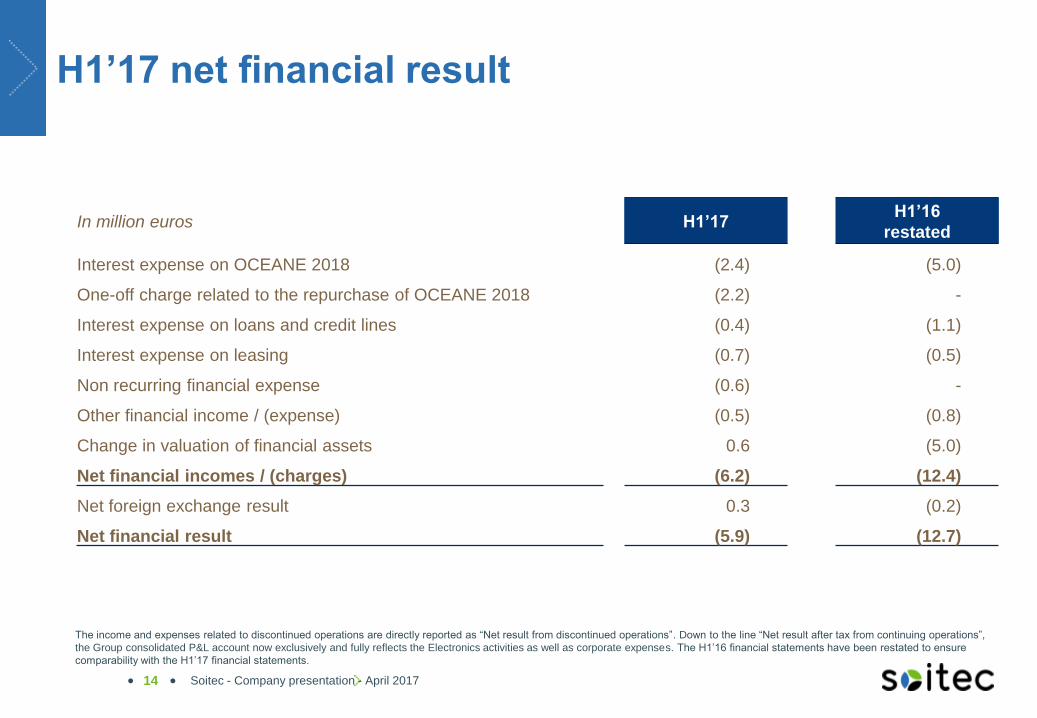
H1’17 net financial result
In million euros H1’17 H1’16
restated
Interest expense on OCEANE 2018 (2.4) (5.0)
One-off charge related to the repurchase of OCEANE 2018 (2.2) -
Interest expense on loans and credit lines (0.4) (1.1)
Interest expense on leasing (0.7) (0.5)
Non recurring financial expense (0.6) -
Other financial income / (expense) (0.5) (0.8)
Change in valuation of financial assets 0.6 (5.0)
Net financial incomes / (charges) (6.2) (12.4)
Net foreign exchange result 0.3 (0.2)
Net financial result (5.9) (12.7)
Soitec - Company presentation - April 2017 14
The income and expenses related to discontinued operations are directly reported as “Net result from discontinued operations”. Down to the line “Net result after tax from continuing operations”,
the Group consolidated P&L account now exclusively and fully reflects the Electronics activities as well as corporate expenses. The H1’16 financial statements have been restated to ensure
comparability with the H1’17 financial statements.
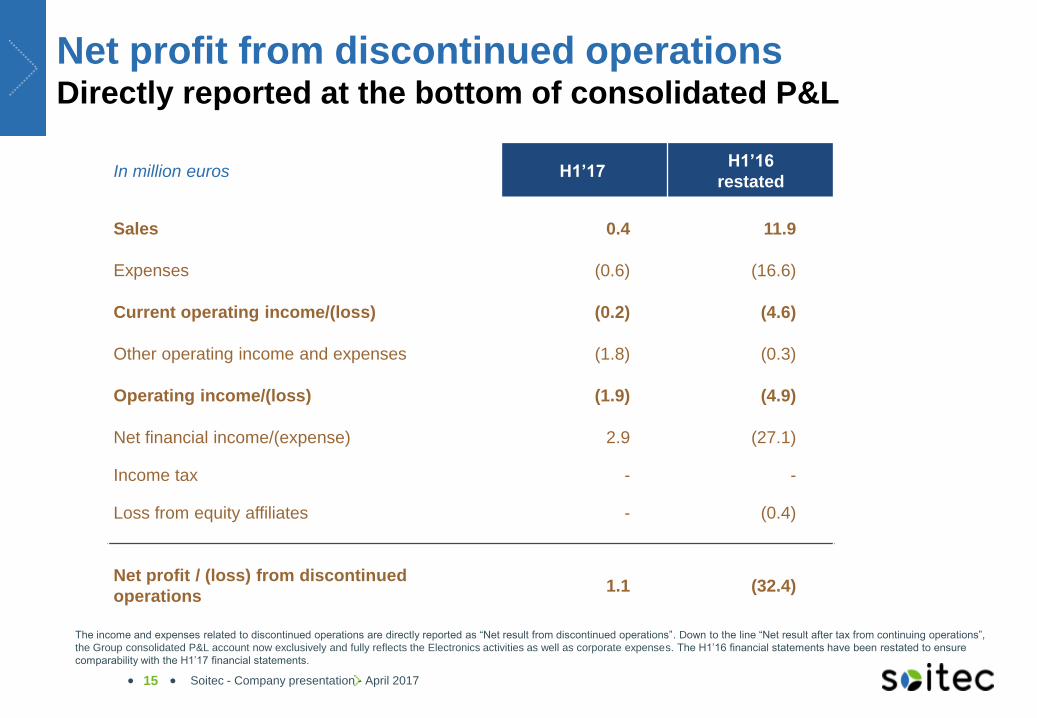
Net profit from discontinued operations Directly reported at the bottom of consolidated P&L
In million euros H1’17 H1’16
restated
Sales 0.4 11.9
Expenses (0.6) (16.6)
Current operating income/(loss) (0.2) (4.6)
Other operating income and expenses (1.8) (0.3)
Operating income/(loss) (1.9) (4.9)
Net financial income/(expense) 2.9 (27.1)
Income tax - -
Loss from equity affiliates - (0.4)
Net profit / (loss) from discontinued
operations 1.1 (32.4)
15 Soitec - Company presentation - April 2017
The income and expenses related to discontinued operations are directly reported as “Net result from discontinued operations”. Down to the line “Net result after tax from continuing operations”,
the Group consolidated P&L account now exclusively and fully reflects the Electronics activities as well as corporate expenses. The H1’16 financial statements have been restated to ensure
comparability with the H1’17 financial statements.
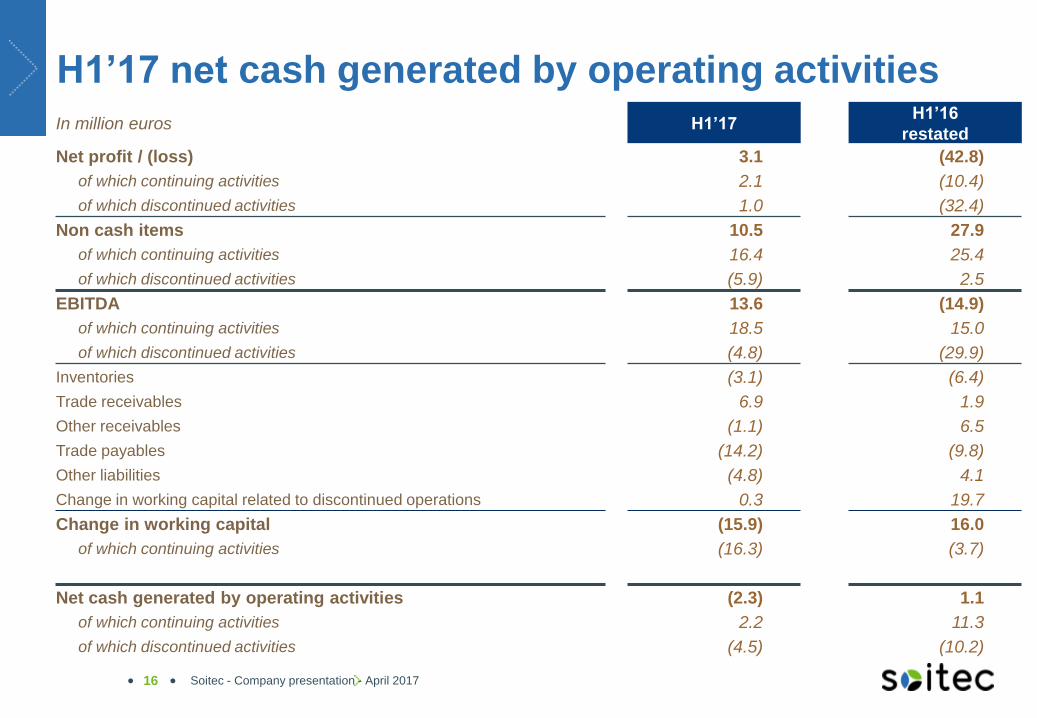
H1’17 net cash generated by operating activities
In million euros H1’17 H1’16
restated
Net profit / (loss) 3.1 (42.8)
of which continuing activities 2.1 (10.4)
of which discontinued activities 1.0 (32.4)
Non cash items 10.5 27.9
of which continuing activities 16.4 25.4
of which discontinued activities (5.9) 2.5
EBITDA 13.6 (14.9)
of which continuing activities 18.5 15.0
of which discontinued activities (4.8) (29.9)
Inventories (3.1) (6.4)
Trade receivables 6.9 1.9
Other receivables (1.1) 6.5
Trade payables (14.2) (9.8)
Other liabilities (4.8) 4.1
Change in working capital related to discontinued operations 0.3 19.7
Change in working capital (15.9) 16.0
of which continuing activities (16.3) (3.7)
Net cash generated by operating activities (2.3) 1.1
of which continuing activities 2.2 11.3
of which discontinued activities (4.5) (10.2)
Soitec - Company presentation - April 2017 16
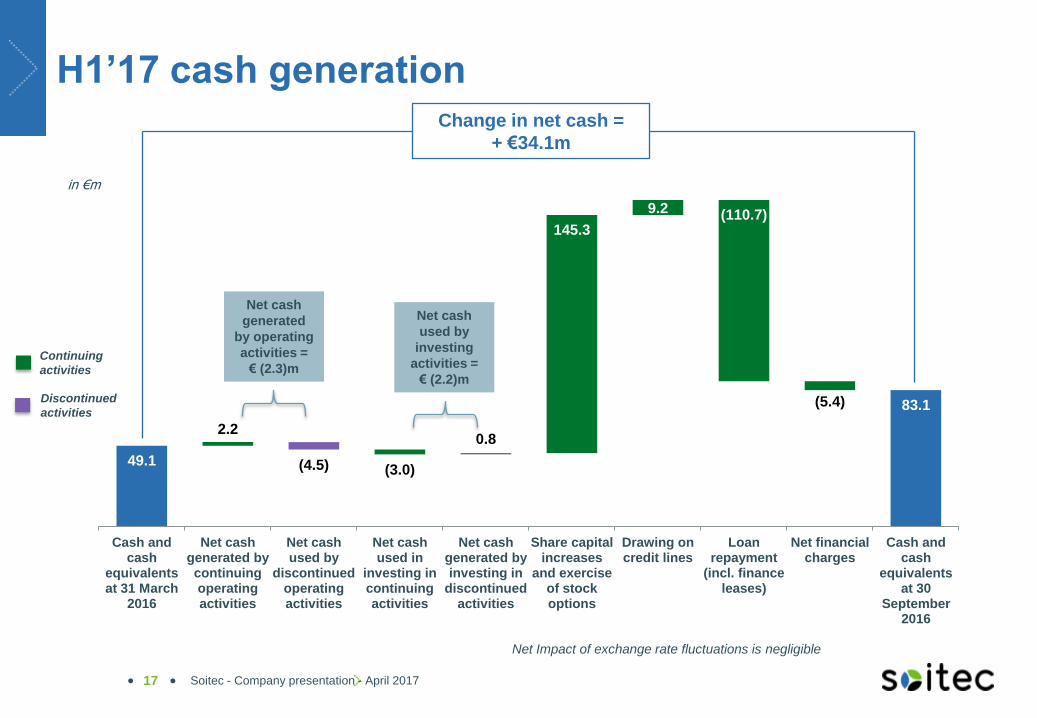
H1’17 cash generation
Soitec - Company presentation - April 2017 17
49.1 8.2 8.2 2.1
83.1
2.2
(4.5) (3.0)
0.8
145.3
9.2 (110.7)
(5.4)
Cash and cash
equivalents at 31 March
2016
Net cash generated by continuing operating activities
Net cash used by
discontinued operating activities
Net cash used in
investing in continuing activities
Net cash generated by investing in
discontinued activities
Share capital increases
and exercise of stock options
Drawing on credit lines
Loan repayment
(incl. finance leases)
Net financial charges
Cash and cash
equivalents at 30
September 2016
Change in net cash =
+ €34.1m
in €m
Discontinued
activities
Continuing
activities
Net cash
generated
by operating
activities =
€ (2.3)m
Net cash
used by
investing
activities =
€ (2.2)m
Net Impact of exchange rate fluctuations is negligible

Major strengthening of the balance sheet
during H1’17
-8
140
31 March 16 30 September 16
Gross debt
in €m
Cash and cash equivalents Net debt
in €m
Shareholders’ equity
49 83
31 March 16 30 September 16
in €m
219
119
31 March 16 30 September 16
in €m
170
35
31 March 16 30 September 16
Soitec - Company presentation - April 2017 18
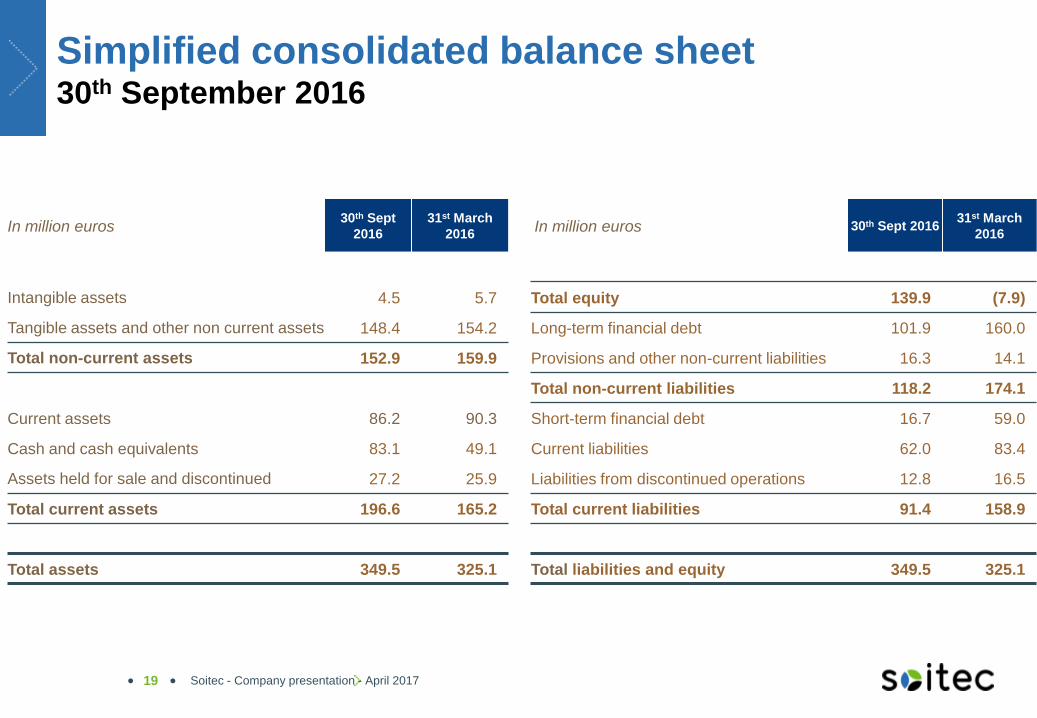
Simplified consolidated balance sheet 30th September 2016
In million euros 30th Sept
2016
31st March
2016 In million euros 30th Sept 2016
31st March
2016
Intangible assets 4.5 5.7 Total equity 139.9 (7.9)
Tangible assets and other non current assets 148.4 154.2 Long-term financial debt 101.9 160.0
Total non-current assets 152.9 159.9 Provisions and other non-current liabilities 16.3 14.1
Total non-current liabilities 118.2 174.1
Current assets 86.2 90.3 Short-term financial debt 16.7 59.0
Cash and cash equivalents 83.1 49.1 Current liabilities 62.0 83.4
Assets held for sale and discontinued 27.2 25.9 Liabilities from discontinued operations 12.8 16.5
Total current assets 196.6 165.2 Total current liabilities 91.4 158.9
Total assets 349.5 325.1 Total liabilities and equity 349.5 325.1
Soitec - Company presentation - April 2017 19

FY’17 consolidated sales (unaudited)
FY’17 revenues reached €245.7m, up 4% at constant exchange rates
Q4’17 revenues reached €70.5m, up 4% at constant exchange rates compared with Q4’16
Sustained growth in Communication & Power 200-mm wafer sales compared with Q4’16
Double-digit growth in 300-mm wafer sales versus Q4’16 – further strong pick up from Q3’17 after low point reached in Q2’17
Total 200-mm and 300-mm wafer sales up 9% in Q4’17 vs Q4’16 Excluding royalties and IP revenues which were significantly lower in Q4’17 than in Q4’16 due to a high basis of comparison in Q4’16
Soitec - Company presentation - April 2017 20
12m’16 12m’17 12m’17/12m’16
(Euros thousands) % % at cst FX
200-mm 170,510 182,495 +7% +6%
300-mm 53,596 56,663 +6% +5%
Royalties and IP 9,087 6,551 -28% -29%
Total revenues 233,194 245,709 +5% +4%
Agenda
Soitec - Company presentation - April 2017 21
1 H1’17 highlights
2 H1’17 financials & FY’17 revenues
3 Business review: promising prospects in Electronics
4 Outlook
5 Appendix

Manufacturing
Who we are and what we do
Engineered substrates at the heart of Electronics
22
Direct
customers
Core Technologies
3,600 active patents
Smart StackingTM
layer-transfer technology
Wafer Manufacturing
Technology
Epitaxy expertise
Smart Cut TM
Current
production sites
Additional & flexible
production capacity
Top Customers
Key market
players
Bernin I Bernin II
Simgui (China)
200mm
capacity:
~800k wafers
per year
300mm
capacity:
~650k wafers
per year
Extra flexible
capacity: 150k
wafers per
year (200mm)
Extra flexible
capacity:
~1m wafers per
year (300mm)
Singapore
Soitec - Company presentation - April 2017
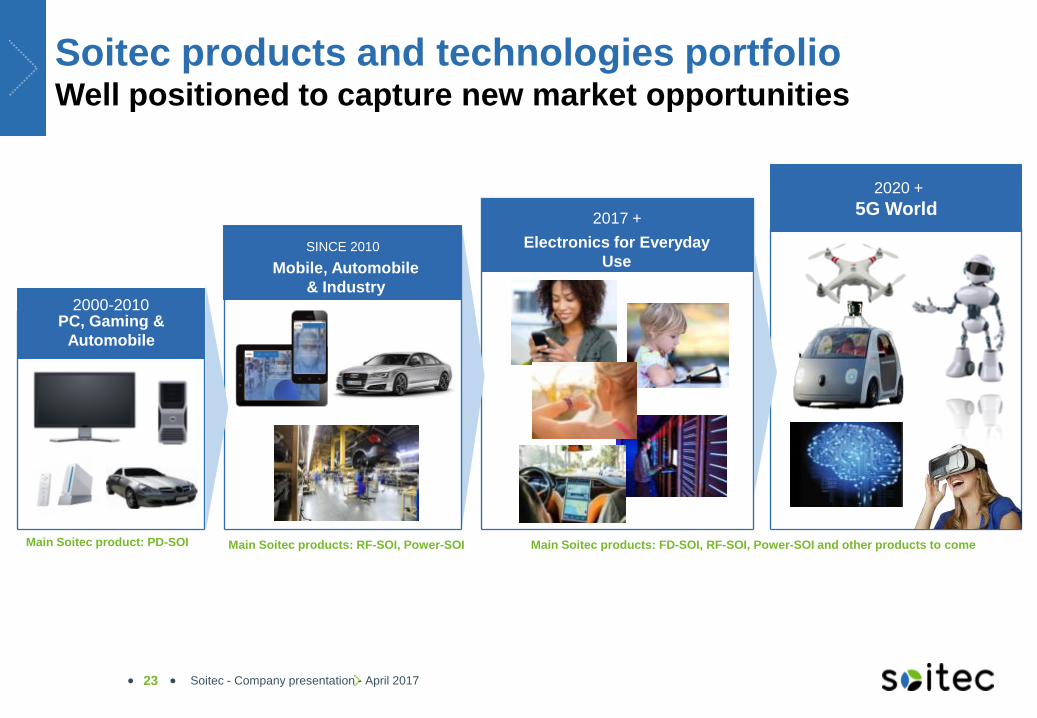
Soitec products and technologies portfolio Well positioned to capture new market opportunities
Soitec - Company presentation - April 2017 23
2017 +
Electronics for Everyday
Use
2020 +
5G World
2000-2010
PC, Gaming &
Automobile
Main Soitec product: PD-SOI
SINCE 2010
Mobile, Automobile
& Industry
Main Soitec products: RF-SOI, Power-SOI Main Soitec products: FD-SOI, RF-SOI, Power-SOI and other products to come
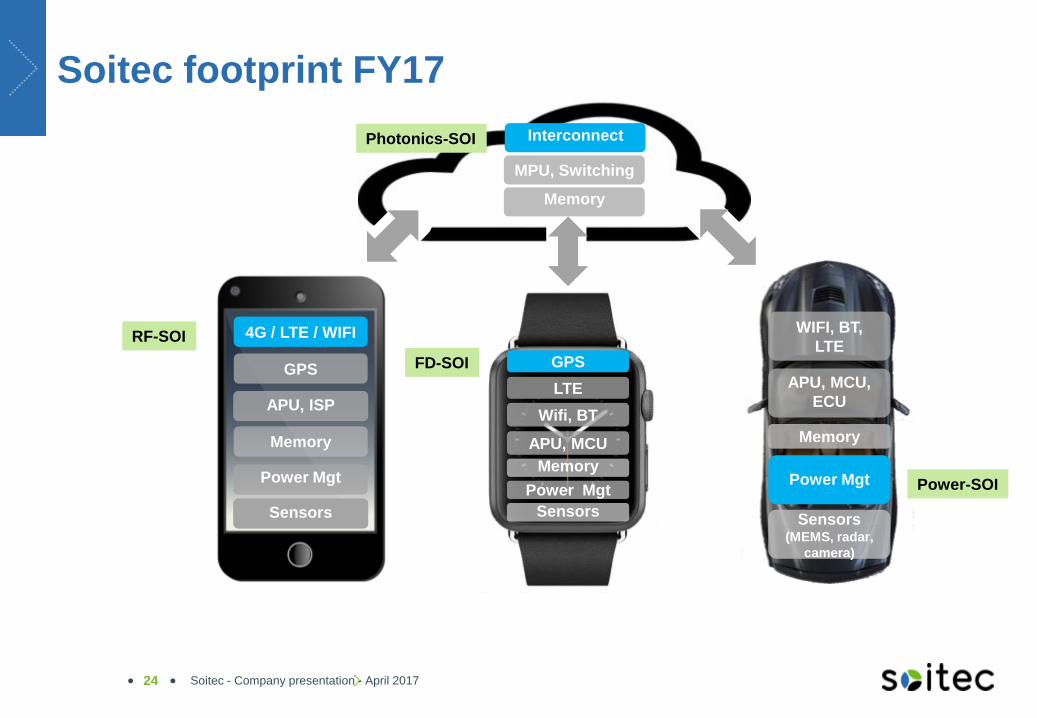
Soitec footprint FY17
4G / LTE / WIFI
APU, ISP
Memory
Power Mgt
WIFI, BT,
LTE
APU, MCU,
ECU
Memory
Memory
Power Mgt
Sensors Sensors
(MEMS, radar,
camera)
Memory
Interconnect
MPU, Switching
Sensors
LTE
APU, MCU
Wifi, BT
GPS
Power Mgt
GPS FD-SOI
RF-SOI
Power-SOI
Photonics-SOI
24 Soitec - Company presentation - April 2017
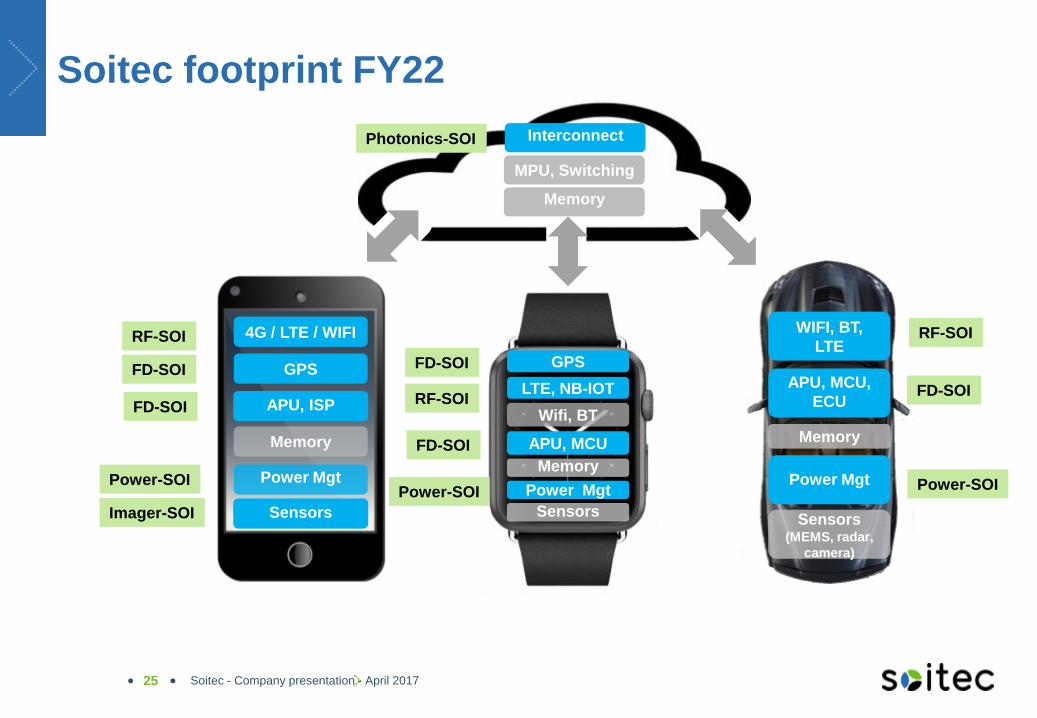
Soitec footprint FY22
4G / LTE / WIFI
APU, ISP
Memory
Power Mgt
WIFI, BT,
LTE
APU, MCU,
ECU
Memory
Sensors (MEMS, radar,
camera)
Memory
Interconnect
MPU, Switching
Sensors
GPS
Power Mgt Memory
Power Mgt
Sensors
LTE, NB-IOT
APU, MCU
Wifi, BT
GPS FD-SOI
RF-SOI
Power-SOI
Photonics-SOI
FD-SOI
FD-SOI
Power-SOI
Imager-SOI
RF-SOI
FD-SOI
Power-SOI
RF-SOI
FD-SOI
25 Soitec - Company presentation - April 2017
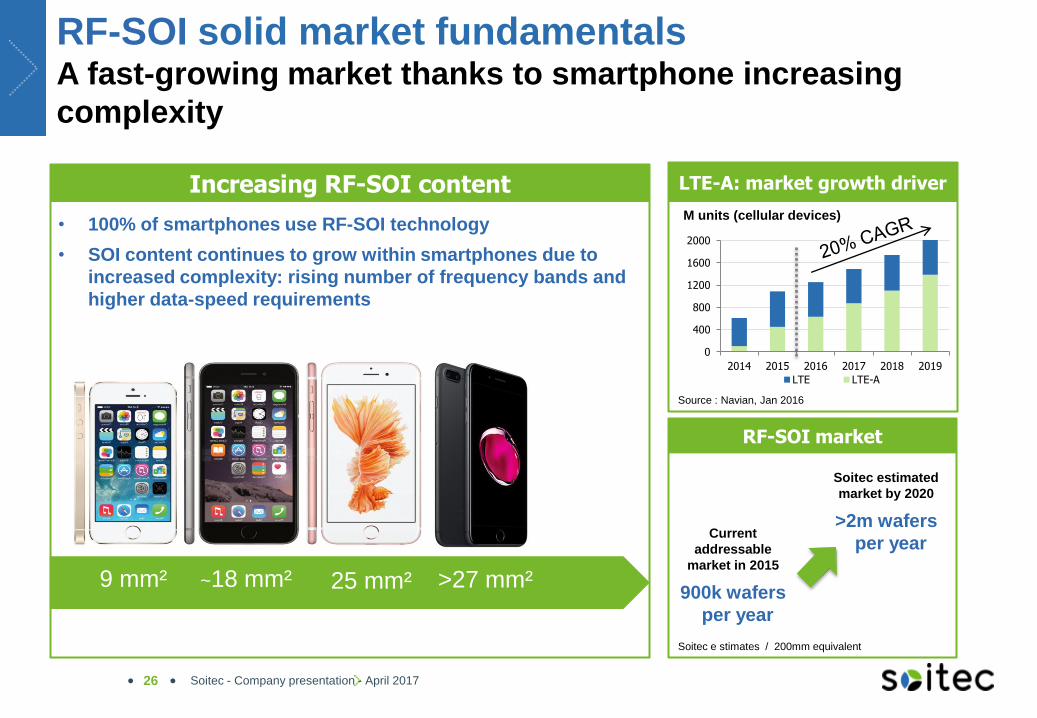
RF-SOI solid market fundamentals A fast-growing market thanks to smartphone increasing
complexity
Soitec - Company presentation - April 2017 26
~18 mm² 9 mm² >27 mm²
RF-SOI market
LTE-A: market growth driver Increasing RF-SOI content
• 100% of smartphones use RF-SOI technology
• SOI content continues to grow within smartphones due to
increased complexity: rising number of frequency bands and
higher data-speed requirements
0
400
800
1200
1600
2000
2014 2015 2016 2017 2018 2019
LTE LTE-A
M units (cellular devices)
Source : Navian, Jan 2016
Soitec e stimates / 200mm equivalent
25 mm²
Soitec estimated
market by 2020
>2m wafers
per year Current
addressable
market in 2015
900k wafers
per year
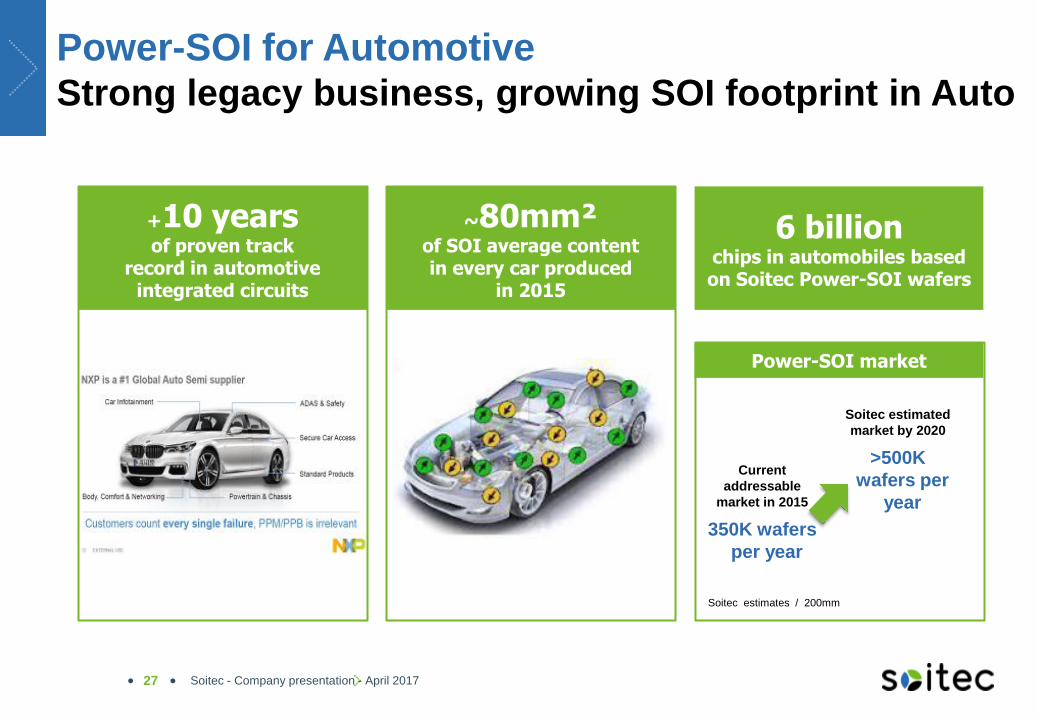
Power-SOI for Automotive Strong legacy business, growing SOI footprint in Auto
6 billion chips in automobiles based on Soitec Power-SOI wafers
~80mm² of SOI average content in every car produced
in 2015
+10 years of proven track
record in automotive integrated circuits
Soitec - Company presentation - April 2017 27
Power-SOI market
Soitec estimates / 200mm
Soitec estimated
market by 2020
>500K
wafers per
year
Current
addressable
market in 2015
350K wafers
per year
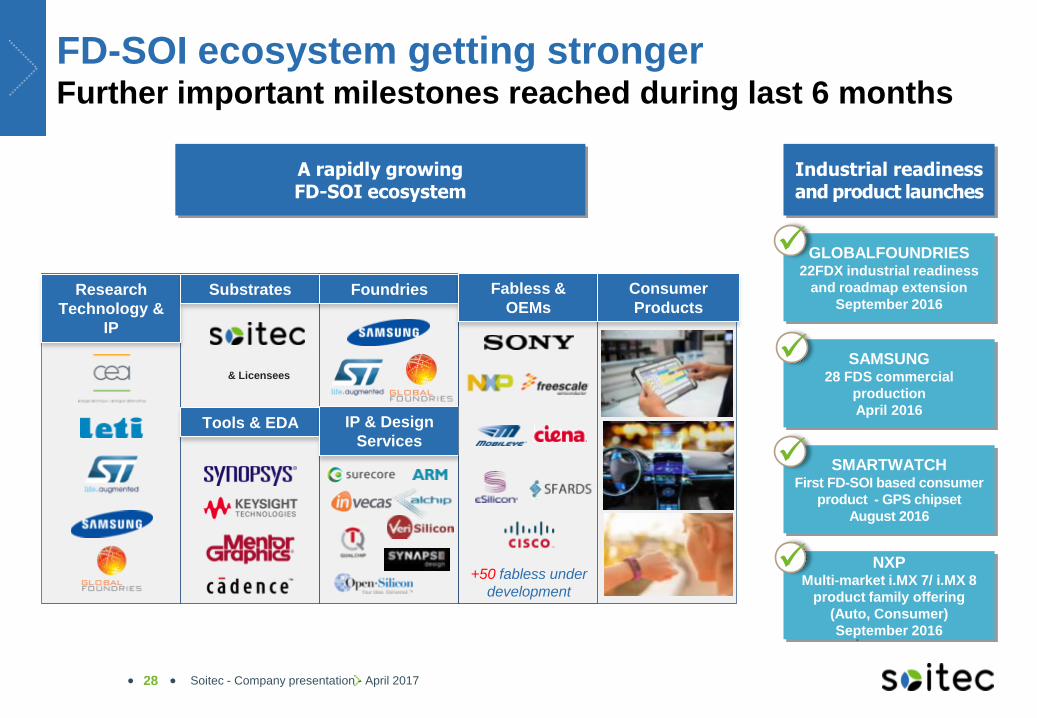
NXP Multi-market i.MX 7/ i.MX 8
product family offering
(Auto, Consumer)
September 2016
SMARTWATCH First FD-SOI based consumer
product - GPS chipset
August 2016
FD-SOI ecosystem getting stronger Further important milestones reached during last 6 months
GLOBALFOUNDRIES 22FDX industrial readiness
and roadmap extension
September 2016
SAMSUNG 28 FDS commercial
production
April 2016
Soitec - Company presentation - April 2017 28
A rapidly growing FD-SOI ecosystem
Mettre a jour
Et s’assurer qu’il le logo de ARM
Research
Technology &
IP
Substrates
Tools & EDA
Foundries
IP & Design
Services
Fabless &
OEMs
Consumer
Products
& Licensees
+50 fabless under
development
Industrial readiness and product launches
0
1000
2000
2017 2018 2019 2020 2021
GF
FD-S
OI
cap
acit
y (k
w/y
)
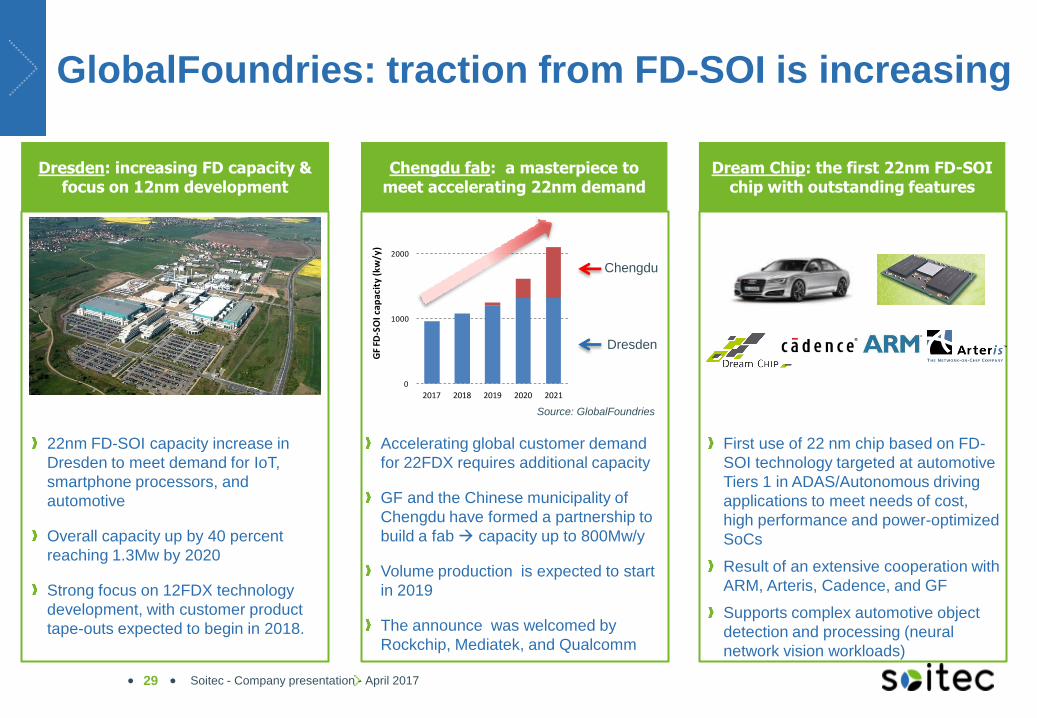
GlobalFoundries: traction from FD-SOI is increasing
Accelerating global customer demand
for 22FDX requires additional capacity
GF and the Chinese municipality of
Chengdu have formed a partnership to
build a fab capacity up to 800Mw/y
Volume production is expected to start
in 2019
The announce was welcomed by
Rockchip, Mediatek, and Qualcomm
29
Dresden: increasing FD capacity & focus on 12nm development
Chengdu fab: a masterpiece to meet accelerating 22nm demand
Dream Chip: the first 22nm FD-SOI chip with outstanding features
Chengdu
Dresden
First use of 22 nm chip based on FD-
SOI technology targeted at automotive
Tiers 1 in ADAS/Autonomous driving
applications to meet needs of cost,
high performance and power-optimized
SoCs
Result of an extensive cooperation with
ARM, Arteris, Cadence, and GF
Supports complex automotive object
detection and processing (neural
network vision workloads)
22nm FD-SOI capacity increase in
Dresden to meet demand for IoT,
smartphone processors, and
automotive
Overall capacity up by 40 percent
reaching 1.3Mw by 2020
Strong focus on 12FDX technology
development, with customer product
tape-outs expected to begin in 2018.
Source: GlobalFoundries
Soitec - Company presentation - April 2017
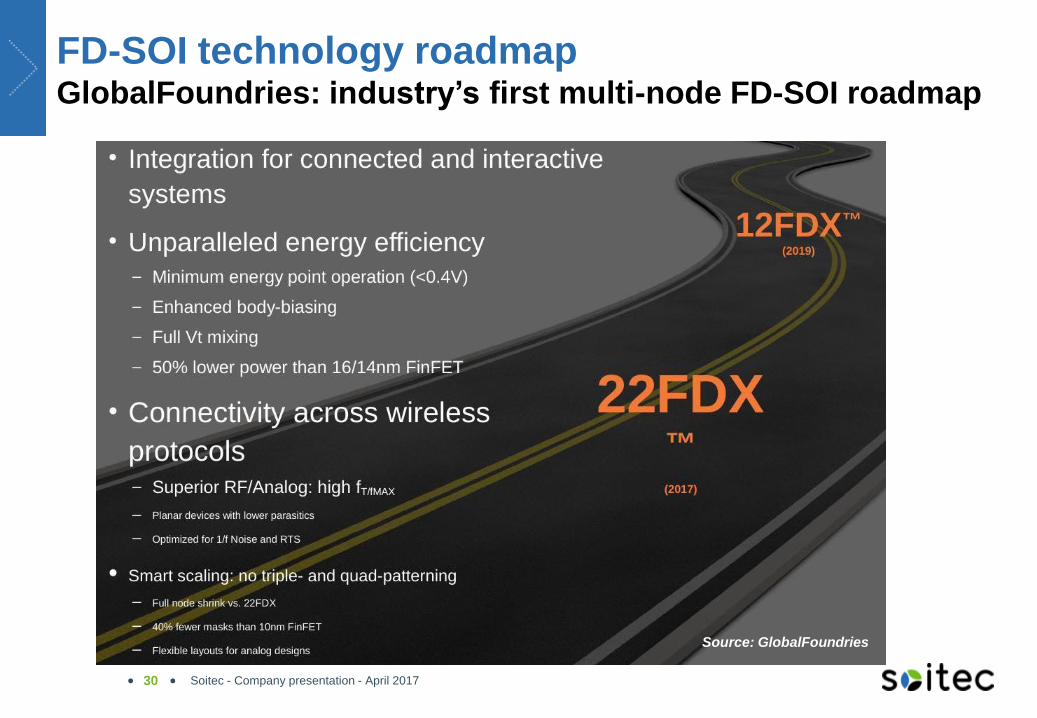
FD-SOI technology roadmap GlobalFoundries: industry’s first multi-node FD-SOI roadmap
Soitec - Company presentation - April 2017 30
Source: GlobalFoundries
31 Source: company reports
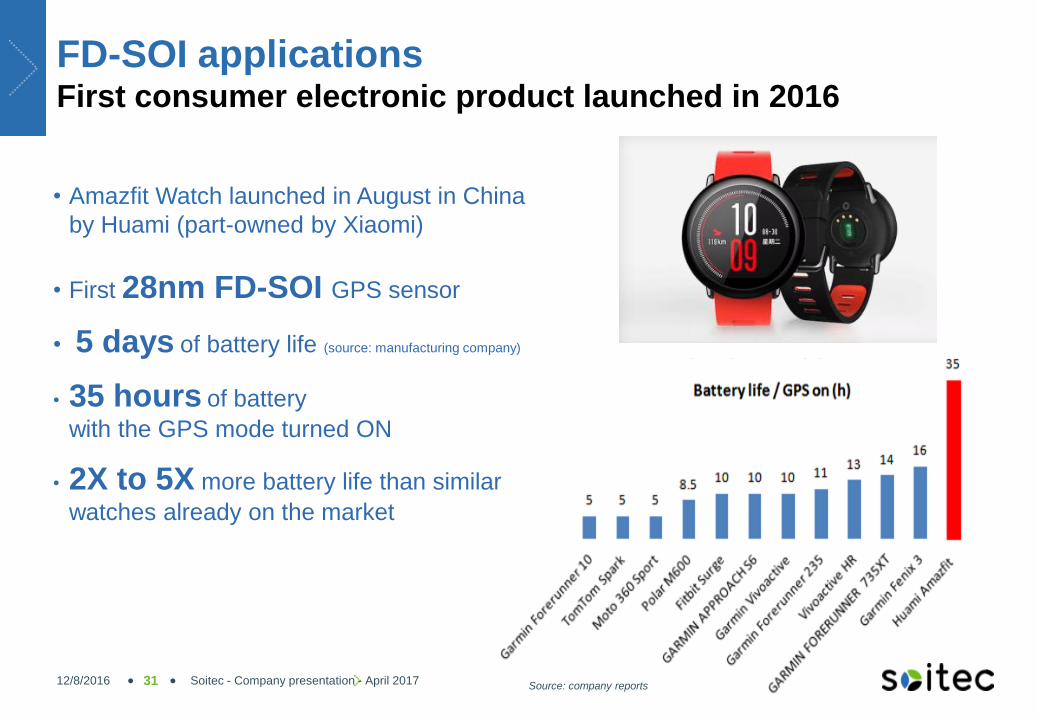
FD-SOI applications First consumer electronic product launched in 2016
• Amazfit Watch launched in August in China
by Huami (part-owned by Xiaomi)
• First 28nm FD-SOI GPS sensor
• 5 days of battery life (source: manufacturing company)
• 35 hours of battery
with the GPS mode turned ON
• 2X to 5X more battery life than similar
watches already on the market
12/8/2016 Soitec - Company presentation - April 2017
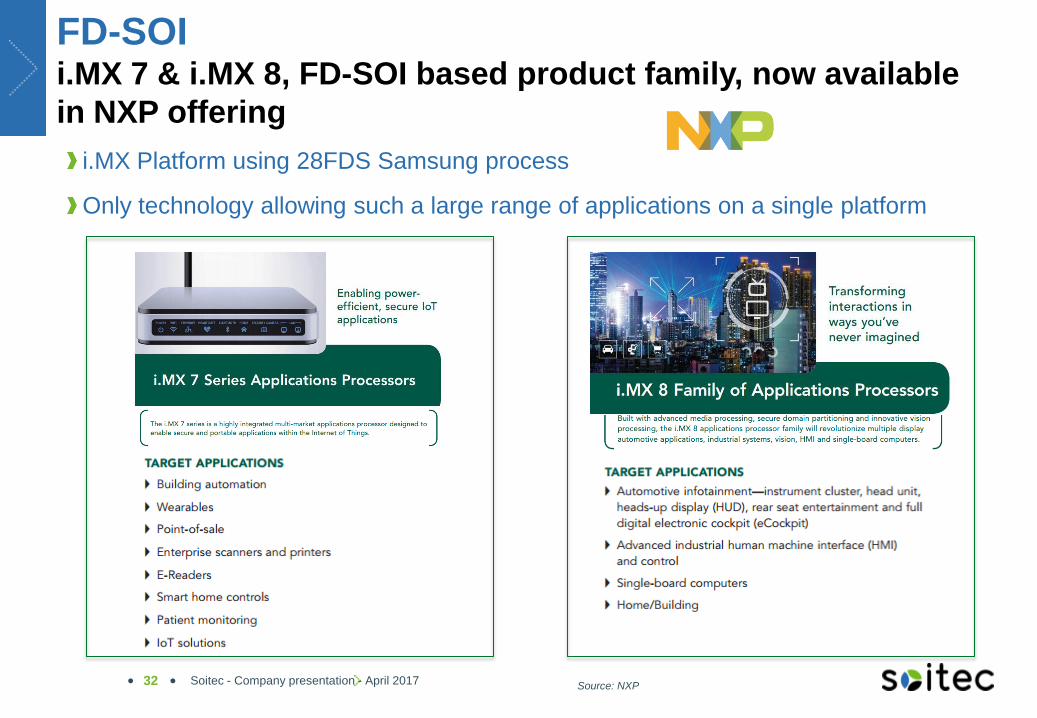
FD-SOI i.MX 7 & i.MX 8, FD-SOI based product family, now available
in NXP offering
i.MX Platform using 28FDS Samsung process
Only technology allowing such a large range of applications on a single platform
Soitec - Company presentation - April 2017 32 Source: NXP
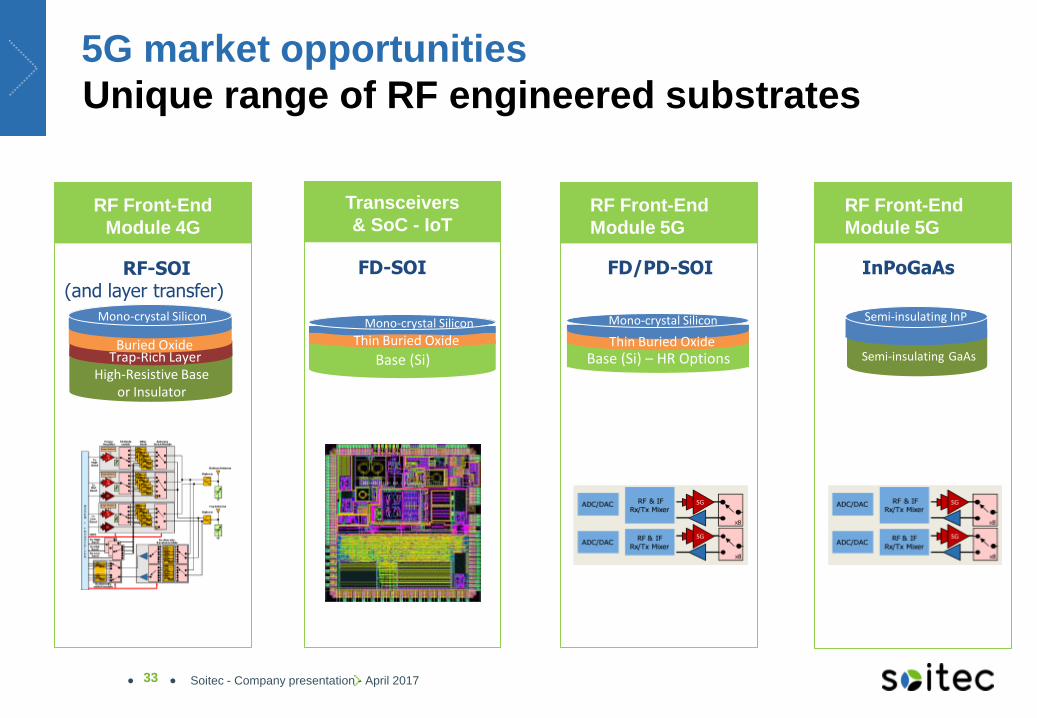
5G market opportunities
Unique range of RF engineered substrates
Mono-crystal Silicon
High-Resistive Base or Insulator
Trap-Rich Layer Buried Oxide
Mono-crystal Silicon
RF Front-End
Module 5G
RF Front-End
Module 4G
Transceivers
& SoC - IoT
FD-SOI RF-SOI (and layer transfer)
FD/PD-SOI
Mono-crystal Silicon
Base (Si) – HR Options Thin Buried Oxide Thin Buried Oxide
Base (Si)
RF Front-End
Module 5G
InPoGaAs Semi-insulating InP
Semi-insulating GaAs
33 Soitec - Company presentation - April 2017
Agenda
Soitec - Company presentation - April 2017 34
1 H1’17 highlights
2 H1’17 financials & FY’17 revenues
3 Business review: promising prospects in Electronics
4 Outlook
5 Appendix

Outlook for FY’17 and fiscal Q1’18
FY’17 Electronics EBITDA margin(1) expected to reach a minimum of 16.5%
FY’17 Guidance
Beyond FY’17: gradual sales and EBITDA increase expected
Soitec - Company presentation - April 2017 35 (1) = EBITDA of continuing operations / sales
Q1’18 revenues growth expected to be at least 20% at constant exchange rates
compared to the first quarter of FY’17
Opportunity to benefit from continuous growth in RF-SOI
Simgui partnership: additional capacity of 150,000 wafers by 2018 (200mm)
Internal capacity to support expected growth in 300mm RF-SOI
Significant production capability to support the early stages of FD-SOI adoption
Contemplated investment (€40m) in Bernin II to progressively boost FD-SOI production capacity from 100,000 to 400,000 wafers per year (300mm FD-SOI)
Agenda
Soitec - Company presentation - April 2017 36
1 H1’17 highlights
2 H1’17 financials & FY’17 revenues
3 Business review: promising prospects in Electronics
4 Outlook
5 Appendix

H1’17 – from Electronics EBITDA to net profit
Soitec - Company presentation - April 2017 37
18.5
8.2
8.2 2.1
3.1
(10.2)
(5.9)
(0.2)
1.1
EBITDA continuing operations
Depreciation and other non cash
items continuing operations
Operating income
Net financial expense
Income tax Net profit continuing operations
Net profit discontinued operations
Net profit Group share
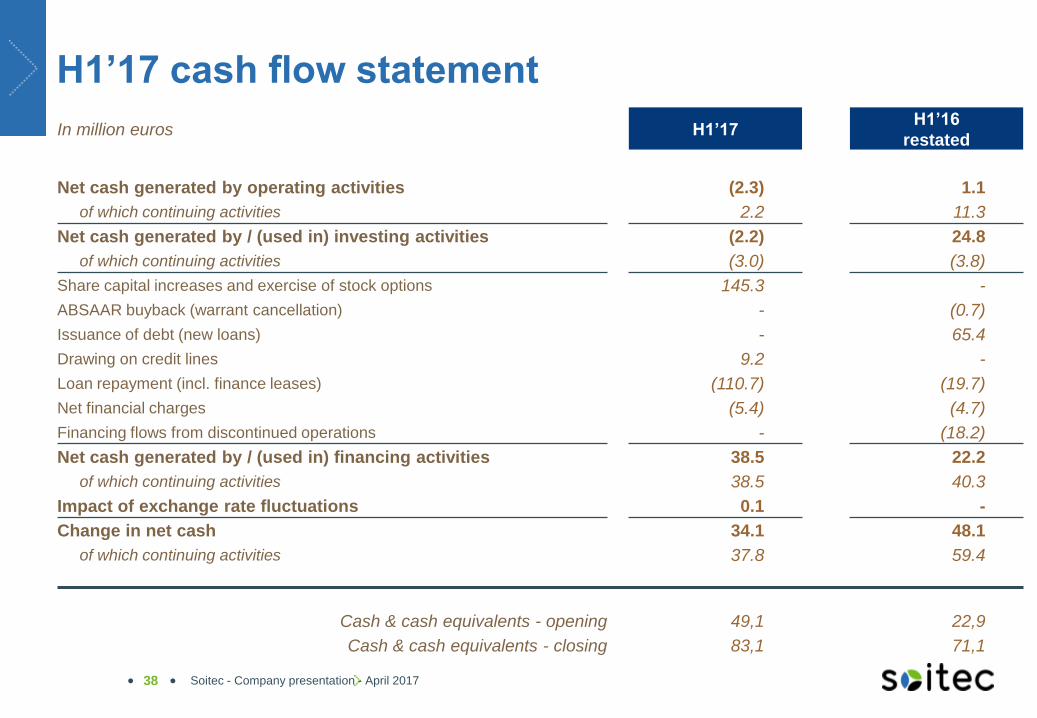
H1’17 cash flow statement
In million euros H1’17 H1’16
restated
Net cash generated by operating activities (2.3) 1.1
of which continuing activities 2.2 11.3
Net cash generated by / (used in) investing activities (2.2) 24.8
of which continuing activities (3.0) (3.8)
Share capital increases and exercise of stock options 145.3 -
ABSAAR buyback (warrant cancellation) - (0.7)
Issuance of debt (new loans) - 65.4
Drawing on credit lines 9.2 -
Loan repayment (incl. finance leases) (110.7) (19.7)
Net financial charges (5.4) (4.7)
Financing flows from discontinued operations - (18.2)
Net cash generated by / (used in) financing activities 38.5 22.2
of which continuing activities 38.5 40.3
Impact of exchange rate fluctuations 0.1 -
Change in net cash 34.1 48.1
of which continuing activities 37.8 59.4
Cash & cash equivalents - opening 49,1 22,9
Cash & cash equivalents - closing 83,1 71,1
Soitec - Company presentation - April 2017 38

In million euros 30th Sept
2016
31st March
2016 In million euros
30th Sept
2016
31st March
2016
Goodwill and intangible assets 2.8 3.8 Share capital 60.6 23.1
Capitalized development projects 1.7 1.9 Share premium 888.1 780.4
Property, plant and equipment 116.5 120.6 Reserves (808.8) (811.4)
Non-current financial assets 9.9 8.9 Total equity 139.9 (7.9)
Other non-current assets 22.1 24.7
Total non-current assets 152.9 159.9 Long-term financial debt 101.9 160.0
Provisions and other non-current liabilities 16.3 14.1
Inventories 32.1 30.9 Total non-current liabilities 118.2 174.1
Trade receivables 33.6 40.4
Other current assets 20.3 17.5 Short-term financial debt 16.7 59.0
Current financial assets 0.2 1.4 Trade payables 27.4 42.6
Cash and cash equivalents 83.1 49.1 Provisions and other current liabilities 34.6 40.9
Assets held for sale and discontinued 27.2 25.9 Liabilities from discontinued operations 12.8 16.5
Total current assets 196.6 165.2 Total current liabilities 91.4 158.9
Total assets 349.5 325.1 Total liabilities and equity 349.5 325.1
Consolidated balance sheet 30th September 2016
Soitec - Company presentation - April 2017 39
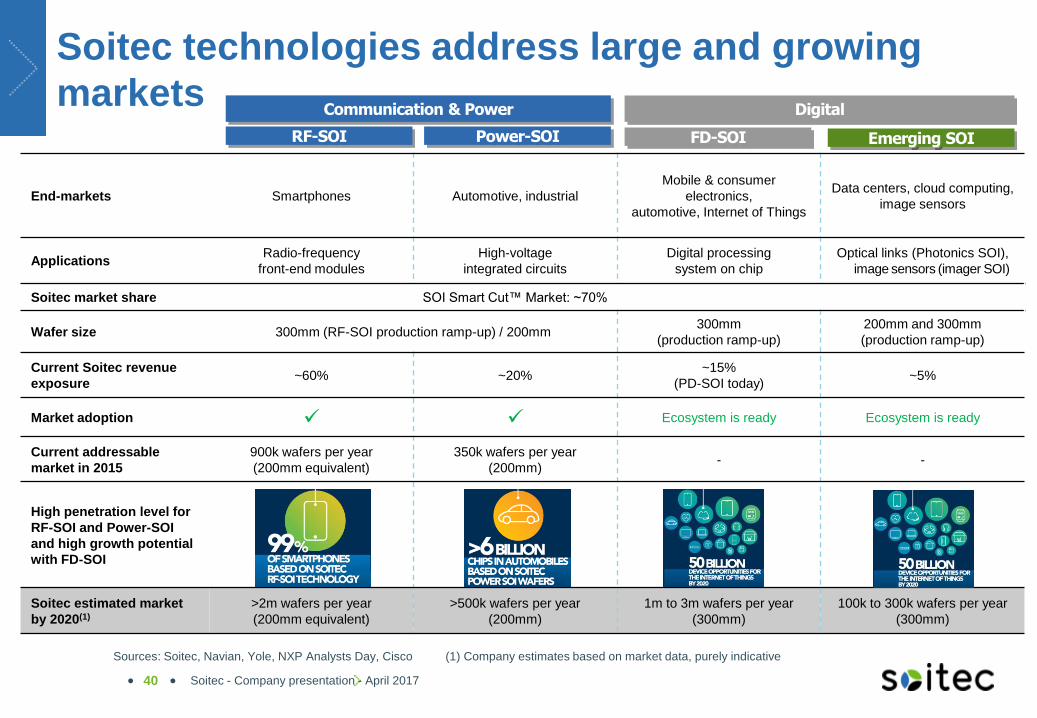
End-markets Smartphones Automotive, industrial
Mobile & consumer
electronics,
automotive, Internet of Things
Data centers, cloud computing,
image sensors
Applications Radio-frequency
front-end modules
High-voltage
integrated circuits
Digital processing
system on chip
Optical links (Photonics SOI),
image sensors (imager SOI)
Soitec market share SOI Smart Cut™ Market: ~70%
Wafer size 300mm (RF-SOI production ramp-up) / 200mm 300mm
(production ramp-up)
200mm and 300mm
(production ramp-up)
Current Soitec revenue
exposure ~60% ~20%
~15%
(PD-SOI today) ~5%
Market adoption Ecosystem is ready Ecosystem is ready
Current addressable
market in 2015
900k wafers per year
(200mm equivalent)
350k wafers per year
(200mm) - -
High penetration level for
RF-SOI and Power-SOI
and high growth potential
with FD-SOI
Soitec estimated market
by 2020(1)
>2m wafers per year
(200mm equivalent)
>500k wafers per year
(200mm)
1m to 3m wafers per year
(300mm)
100k to 300k wafers per year
(300mm)
Communication & Power
Soitec technologies address large and growing
markets Power-SOI RF-SOI
Sources: Soitec, Navian, Yole, NXP Analysts Day, Cisco (1) Company estimates based on market data, purely indicative
Digital
FD-SOI Emerging SOI
Soitec - Company presentation - April 2017 40