company overviews2.q4cdn.com/115332500/files/doc_presentations/2018/ir-standard... · complex...
TRANSCRIPT

Company Overview
February 2018
Safe Harbor Statement
2
THIS PRESENTATION CONTAINS FORWARD-LOOKING STATEMENTS
Forward-looking statements are made based upon management's good faith expectations and beliefs concerning future developments and their potential effect upon the Company.
These forward-looking statements are subject to risks and uncertainties that may cause actual results to differ materially from those expressed in the forward-looking statements, including the risks and uncertainties set forth under our full disclosure located at the end of this presentation and included in our SEC filings.
Any forward-looking statements speak only as of the date on which it is made, and the Company assumes no obligation to update our forward-looking statements.
References to adjusted financial results are non-GAAP measures. You will find GAAP reconciliation tables at the end of this presentation.
"EPS" refers to diluted earnings per share.
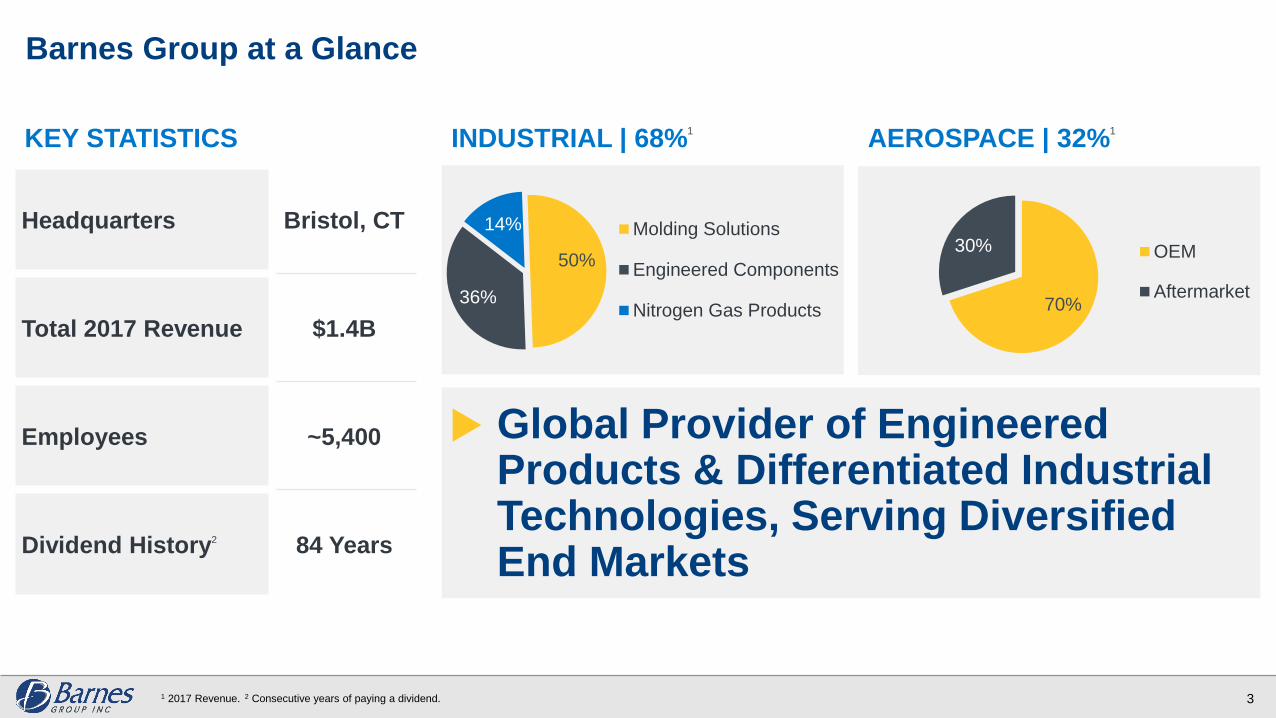
Barnes Group at a Glance
3
INDUSTRIAL | 68%1
AEROSPACE | 32%1
50%
36%
14% Molding Solutions
Engineered Components
Nitrogen Gas Products 70%
30% OEM
Aftermarket
Headquarters Bristol, CT
Total 2017 Revenue $1.4B
Employees ~5,400
Dividend History2 84 Years
KEY STATISTICS
1 2017 Revenue. 2 Consecutive years of paying a dividend.
Global Provider of Engineered Products & Differentiated Industrial Technologies, Serving Diversified End Markets
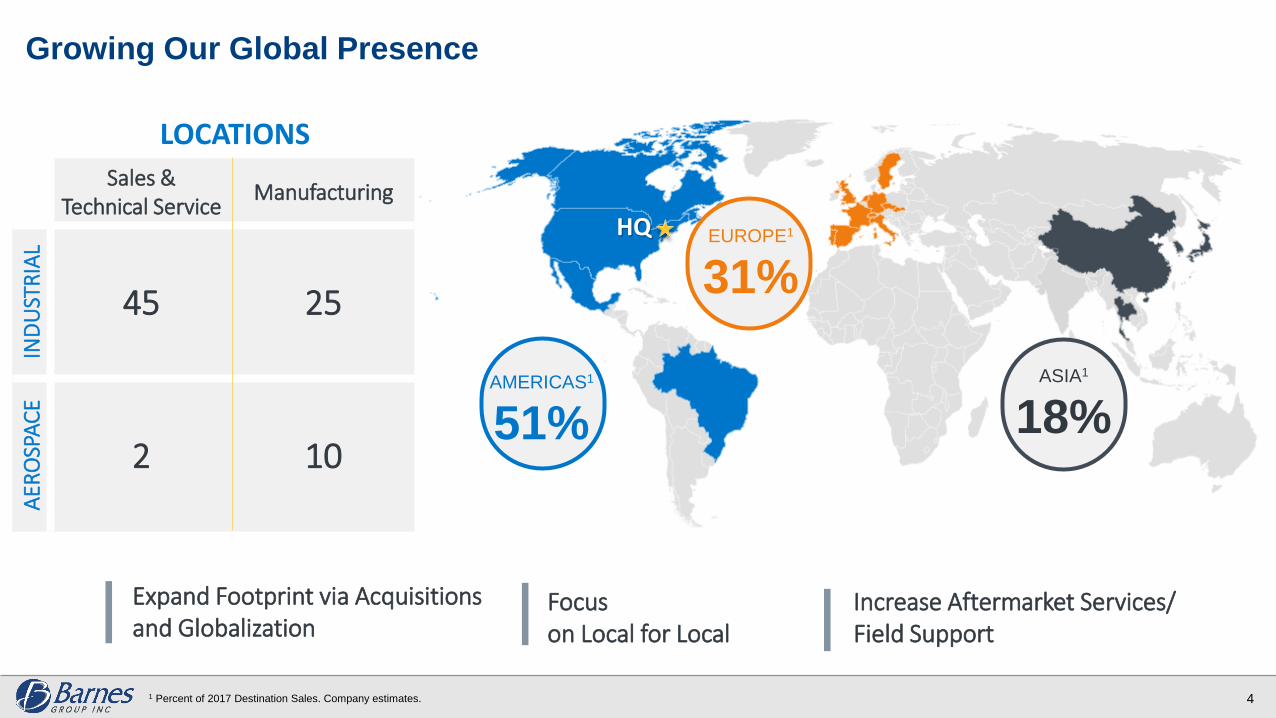
ASIA1
18%
EUROPE1
31%
AMERICAS1
51%
HQ
Growing Our Global Presence
41 Percent of 2017 Destination Sales. Company estimates.
Sales & Technical Service
Manufacturing
IND
UST
RIA
L
45 25
AER
OSP
AC
E
2 10
LOCATIONS
Expand Footprint via Acquisitions and Globalization
Focuson Local for Local
Increase Aftermarket Services/ Field Support
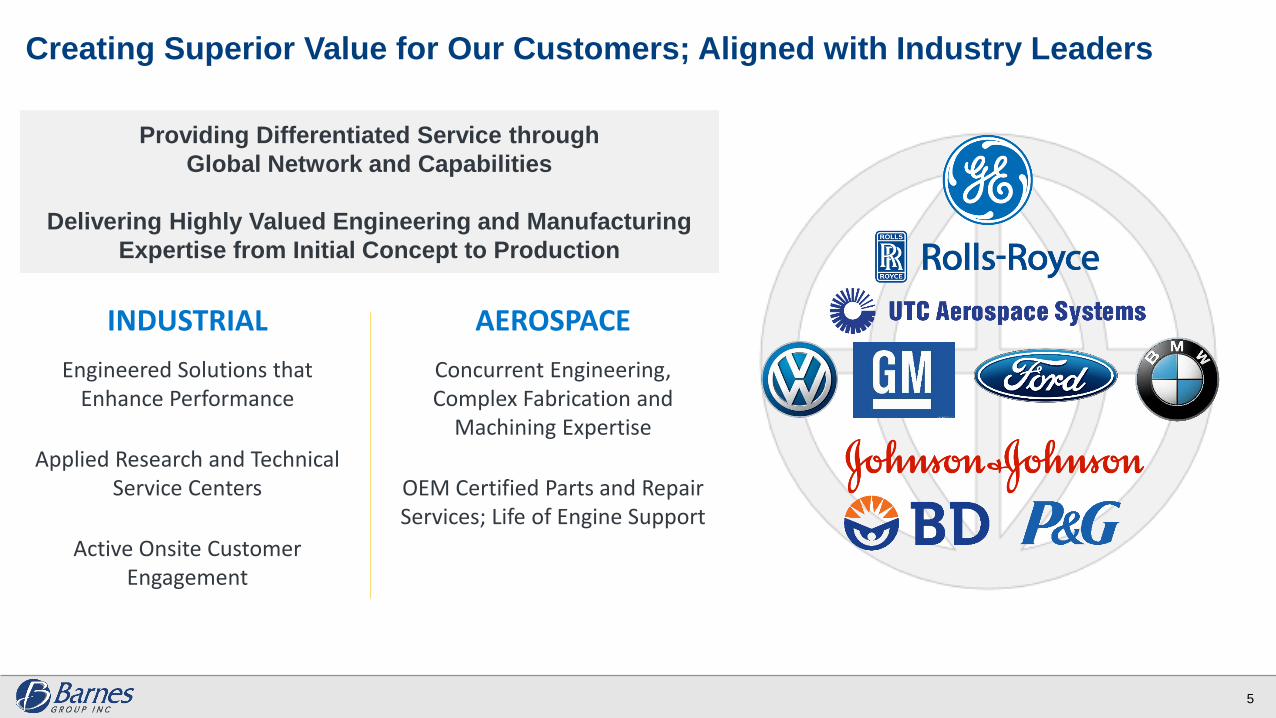
Providing Differentiated Service through
Global Network and Capabilities
Delivering Highly Valued Engineering and Manufacturing
Expertise from Initial Concept to Production
Creating Superior Value for Our Customers; Aligned with Industry Leaders
5
INDUSTRIAL
Engineered Solutions that Enhance Performance
Applied Research and Technical Service Centers
Active Onsite Customer Engagement
AEROSPACE
Concurrent Engineering, Complex Fabrication and
Machining Expertise
OEM Certified Parts and Repair Services; Life of Engine Support
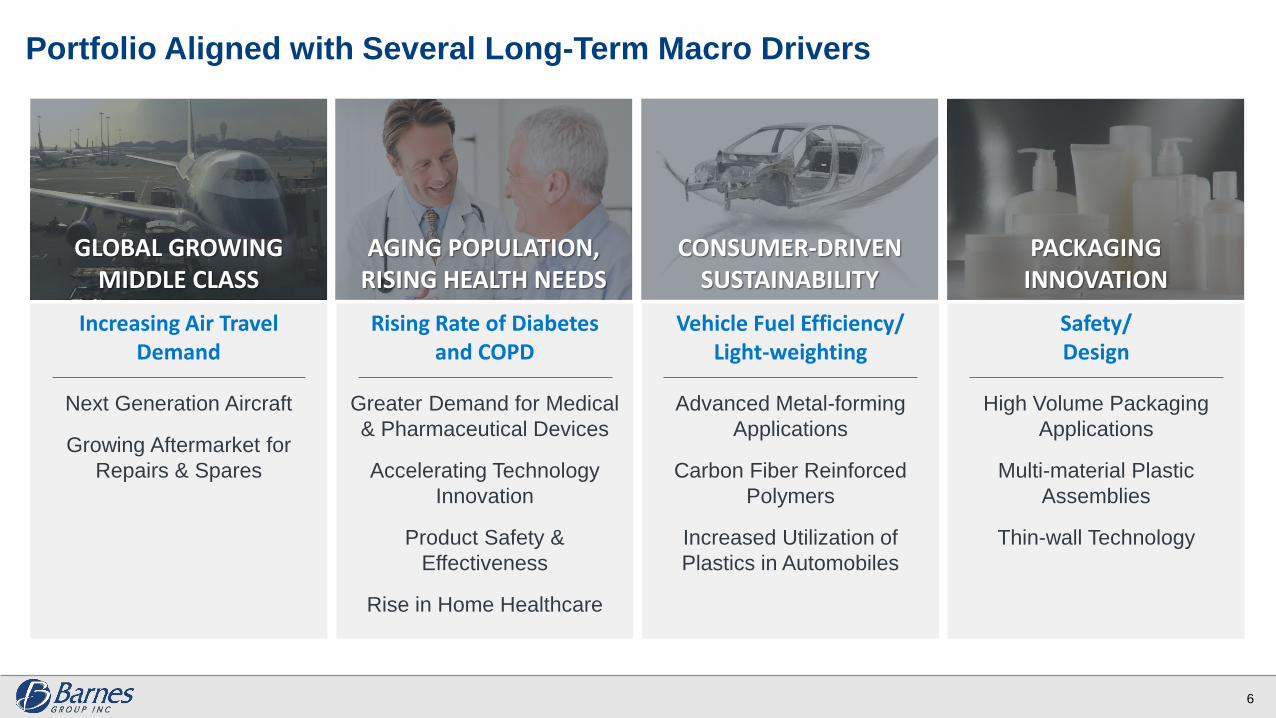
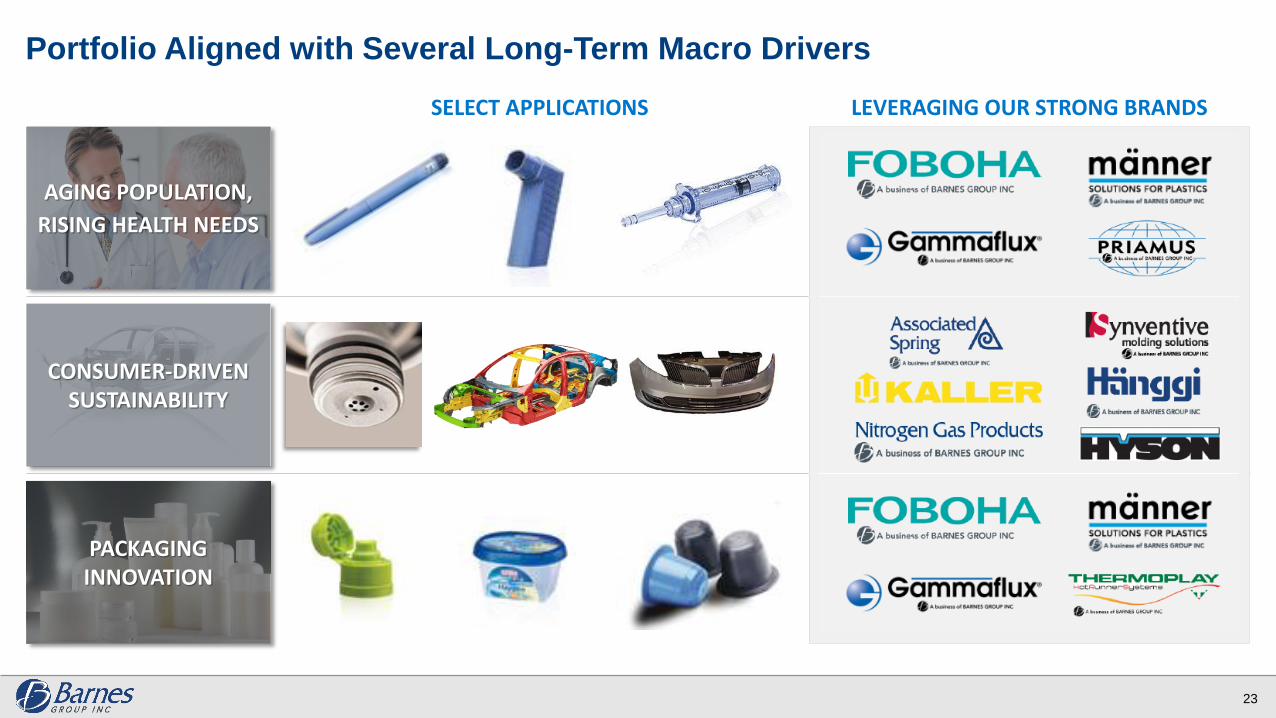
PACKAGING INNOVATION
CONSUMER-DRIVEN SUSTAINABILITY
AGING POPULATION,RISING HEALTH NEEDS
Vehicle Fuel Efficiency/ Light-weighting
Advanced Metal-forming
Applications
Carbon Fiber Reinforced
Polymers
Increased Utilization of
Plastics in Automobiles
Safety/ Design
High Volume Packaging
Applications
Multi-material Plastic
Assemblies
Thin-wall Technology
Rising Rate of Diabetes and COPD
Greater Demand for Medical
& Pharmaceutical Devices
Accelerating Technology
Innovation
Product Safety &
Effectiveness
Rise in Home Healthcare
Portfolio Aligned with Several Long-Term Macro Drivers
GLOBAL GROWING MIDDLE CLASS
Increasing Air Travel Demand
Next Generation Aircraft
Growing Aftermarket for
Repairs & Spares
6
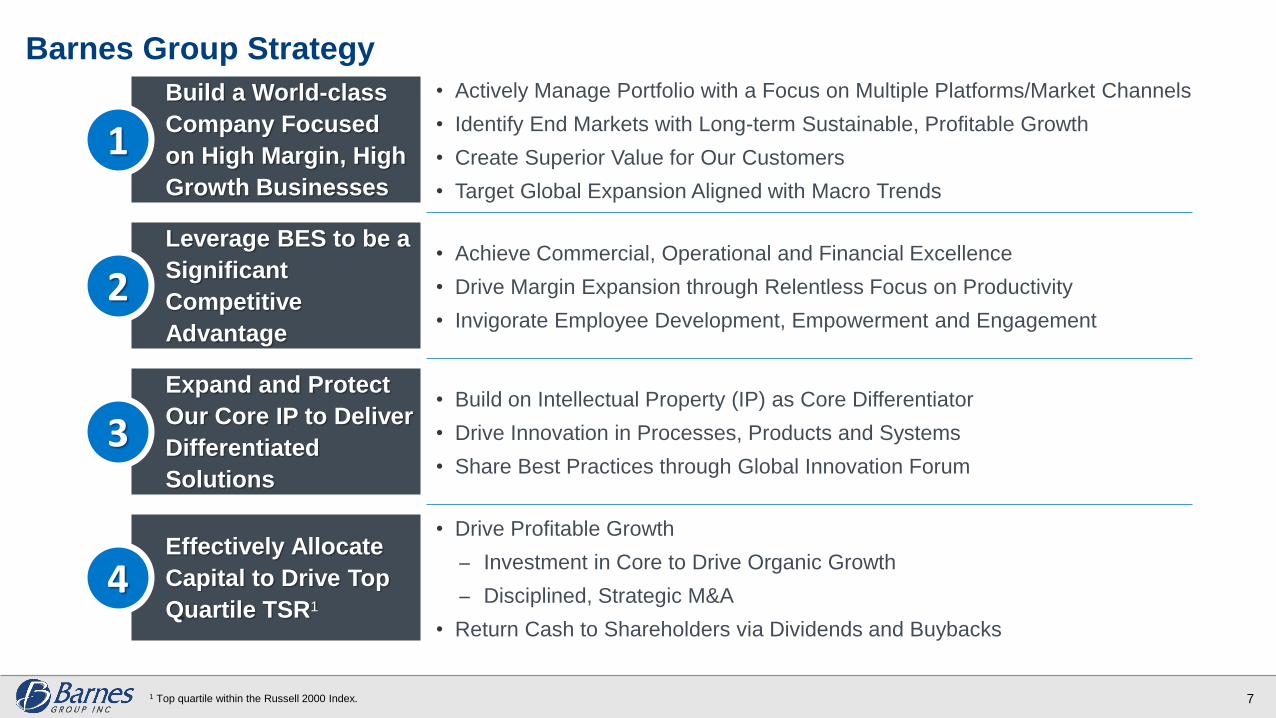
Barnes Group Strategy
71 Top quartile within the Russell 2000 Index.
Build a World-class
Company Focused
on High Margin, High
Growth Businesses
Effectively Allocate
Capital to Drive Top
Quartile TSR1
• Actively Manage Portfolio with a Focus on Multiple Platforms/Market Channels
• Identify End Markets with Long-term Sustainable, Profitable Growth
• Create Superior Value for Our Customers
• Target Global Expansion Aligned with Macro Trends
• Achieve Commercial, Operational and Financial Excellence
• Drive Margin Expansion through Relentless Focus on Productivity
• Invigorate Employee Development, Empowerment and Engagement
• Build on Intellectual Property (IP) as Core Differentiator
• Drive Innovation in Processes, Products and Systems
• Share Best Practices through Global Innovation Forum
• Drive Profitable Growth
Investment in Core to Drive Organic Growth
Disciplined, Strategic M&A
• Return Cash to Shareholders via Dividends and Buybacks
Expand and Protect
Our Core IP to Deliver
Differentiated
Solutions
Leverage BES to be a
Significant
Competitive
Advantage
1
2
3
4
Major Portfolio Shifts Over Last Several Years
Transformed Portfolio with Technological Orientation
8
WHERE WE WERE WHERE WE ARE
PORTFOLIO COMPOSITION 3 Segments 2 Segments
PORTFOLIO PROFILE Cyclical More Secular
GEOGRAPHIC EXPOSURE Overweight U.S. Globally Balanced
PATENTS ~300 ~1,200
CORE COMPETENCY ManufacturingDesign, Applications, Manufacturing
& Service
IP OWNERSHIP Primarily Process Process, Products & Systems
NEW MARKETS -Auto Model Changes, Medical,
Personal Care & Packaging
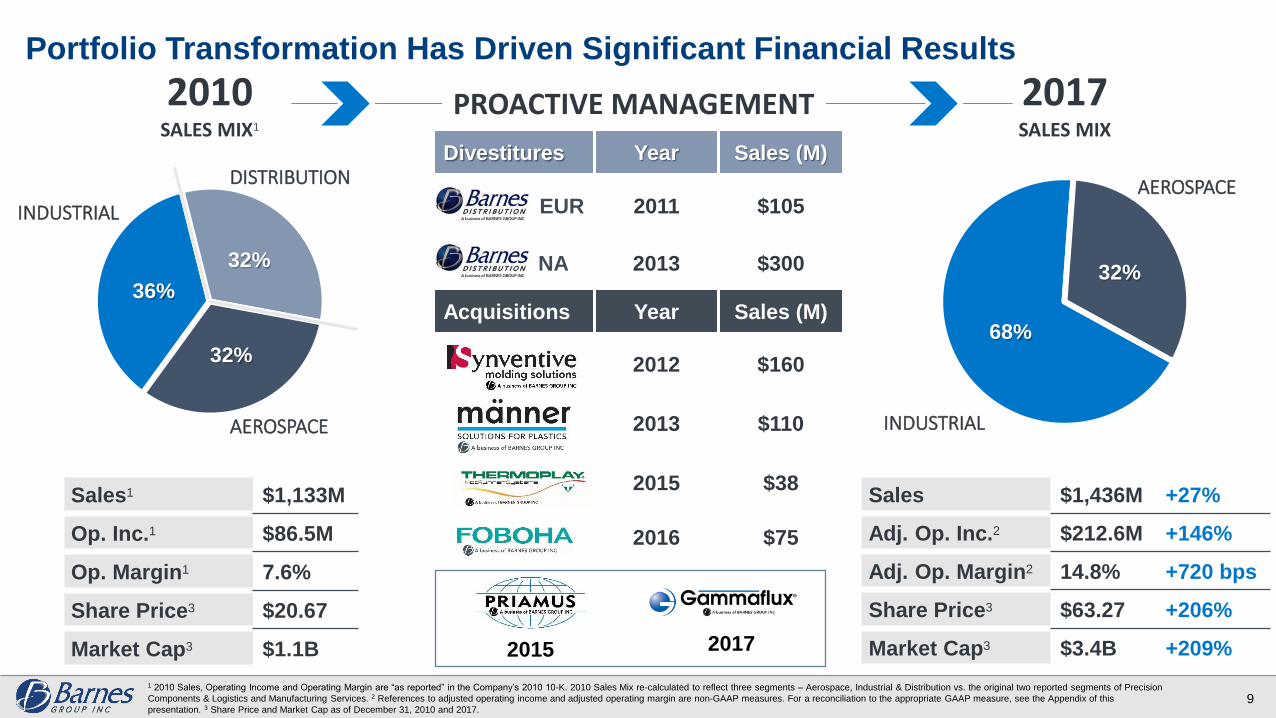
Portfolio Transformation Has Driven Significant Financial Results
9
36%
32%
32%
INDUSTRIAL
AEROSPACE
DISTRIBUTION
Sales1 $1,133M
Op. Inc.1 $86.5M
Op. Margin1 7.6%
Share Price3 $20.67
Market Cap3 $1.1B
Divestitures Year Sales (M)
EUR 2011 $105
NA 2013 $300
Acquisitions Year Sales (M)
2012 $160
2013 $110
2015 $38
2016 $75
Sales $1,436M +27%
Adj. Op. Inc.2 $212.6M +146%
Adj. Op. Margin2 14.8% +720 bps
Share Price3 $63.27 +206%
Market Cap3 $3.4B +209%
68%
32%
2017 SALES MIX
2010 SALES MIX1
INDUSTRIAL
AEROSPACE
PROACTIVE MANAGEMENT
1 2010 Sales, Operating Income and Operating Margin are “as reported” in the Company’s 2010 10-K. 2010 Sales Mix re-calculated to reflect three segments – Aerospace, Industrial & Distribution vs. the original two reported segments of Precision
Components & Logistics and Manufacturing Services. 2 References to adjusted operating income and adjusted operating margin are non-GAAP measures. For a reconciliation to the appropriate GAAP measure, see the Appendix of this
presentation. 3 Share Price and Market Cap as of December 31, 2010 and 2017.
2015 2017
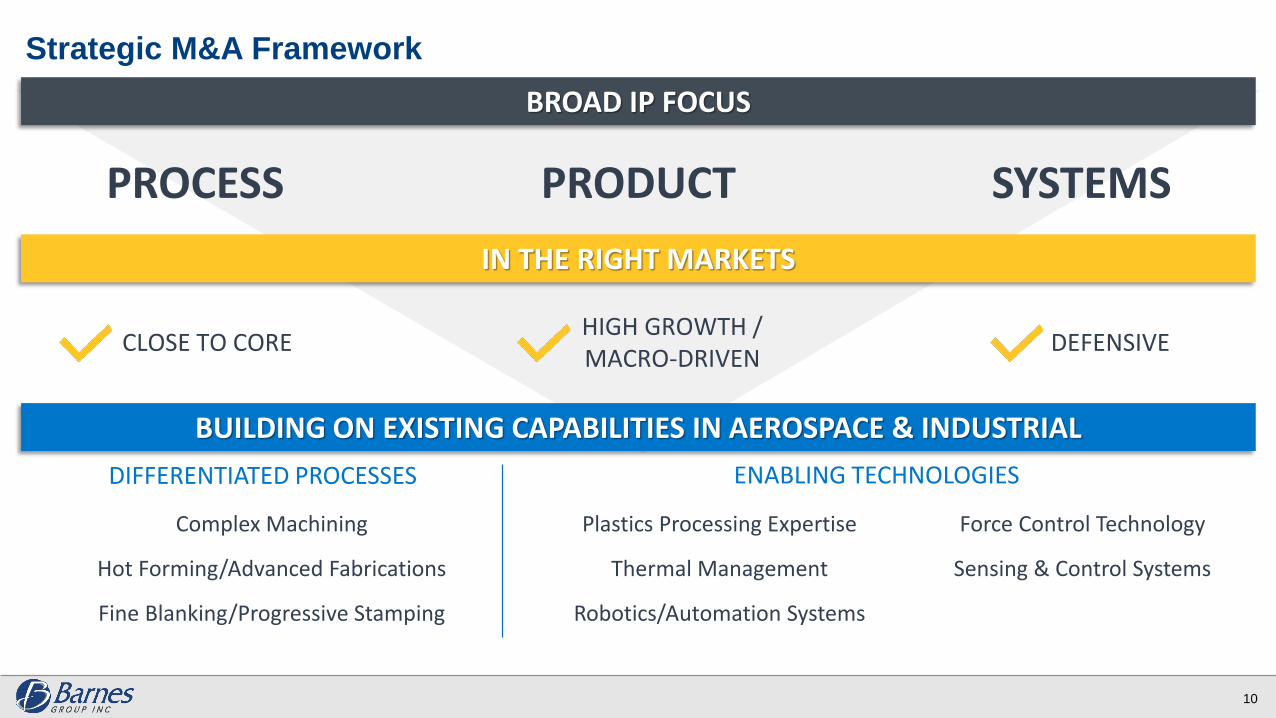
Strategic M&A Framework
10
PROCESS PRODUCT SYSTEMS
BROAD IP FOCUS
BUILDING ON EXISTING CAPABILITIES IN AEROSPACE & INDUSTRIAL
IN THE RIGHT MARKETS
Plastics Processing Expertise
Thermal Management
Robotics/Automation Systems
Force Control Technology
Sensing & Control Systems
ENABLING TECHNOLOGIESDIFFERENTIATED PROCESSES
Complex Machining
Hot Forming/Advanced Fabrications
Fine Blanking/Progressive Stamping
DEFENSIVECLOSE TO COREHIGH GROWTH / MACRO-DRIVEN
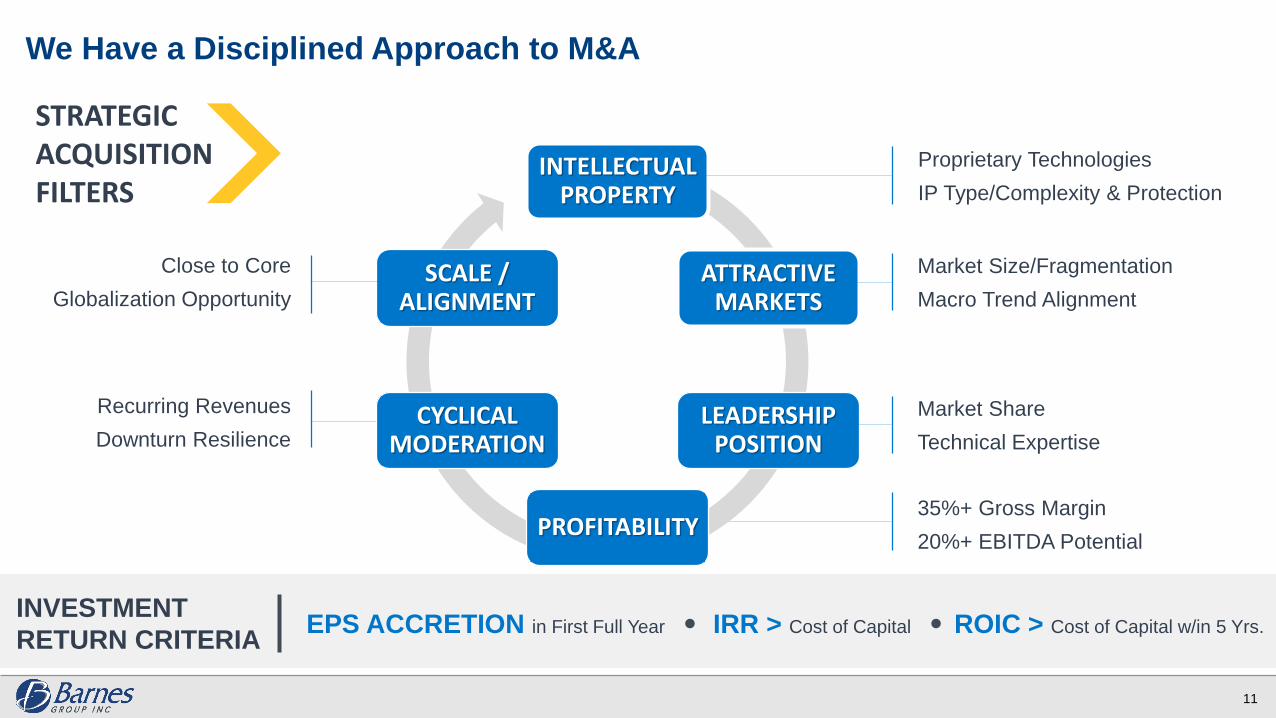
We Have a Disciplined Approach to M&A
11
INVESTMENT
RETURN CRITERIAEPS ACCRETION in First Full Year IRR > Cost of Capital ROIC > Cost of Capital w/in 5 Yrs.
STRATEGIC ACQUISITION FILTERS
INTELLECTUALPROPERTY
PROFITABILITY
LEADERSHIPPOSITION
CYCLICAL MODERATION
ATTRACTIVE MARKETS
SCALE / ALIGNMENT
Proprietary Technologies
IP Type/Complexity & Protection
Market Share
Technical Expertise
Close to Core
Globalization Opportunity
Recurring Revenues
Downturn Resilience
Market Size/Fragmentation
Macro Trend Alignment
35%+ Gross Margin
20%+ EBITDA Potential
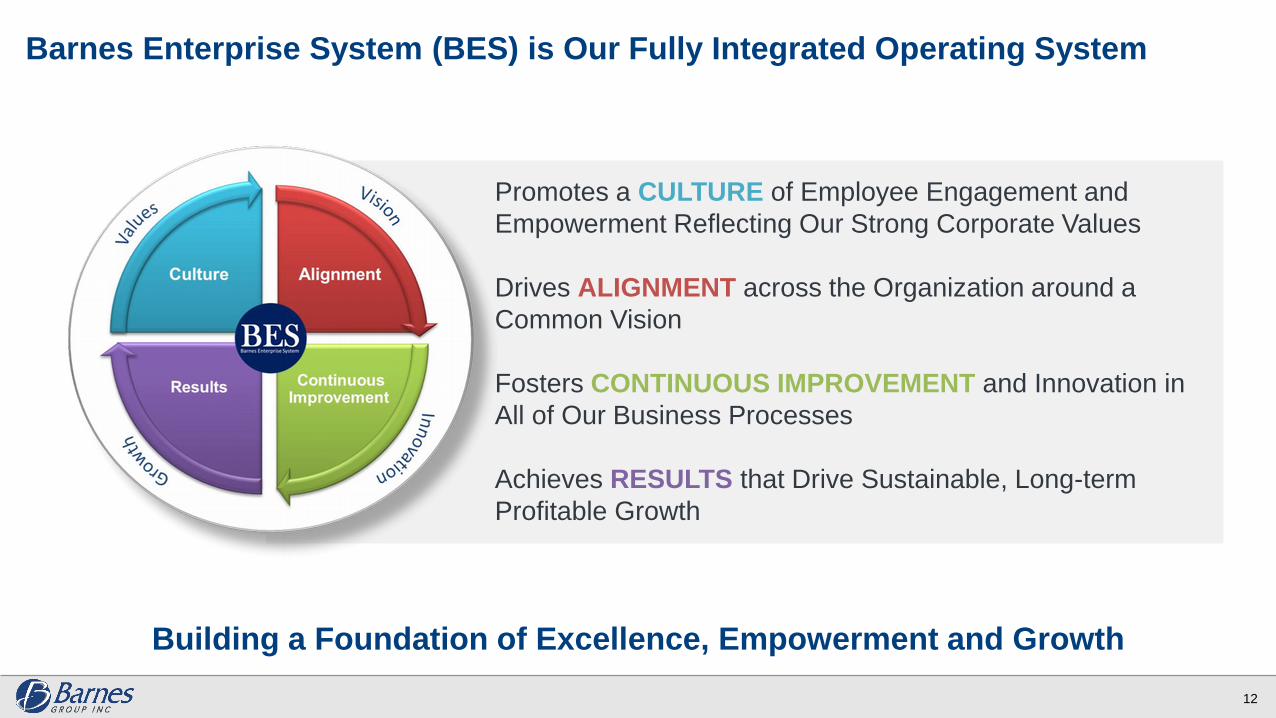
Barnes Enterprise System (BES) is Our Fully Integrated Operating System
Building a Foundation of Excellence, Empowerment and Growth
12
Promotes a CULTURE of Employee Engagement and
Empowerment Reflecting Our Strong Corporate Values
Drives ALIGNMENT across the Organization around a
Common Vision
Fosters CONTINUOUS IMPROVEMENT and Innovation in
All of Our Business Processes
Achieves RESULTS that Drive Sustainable, Long-term
Profitable Growth
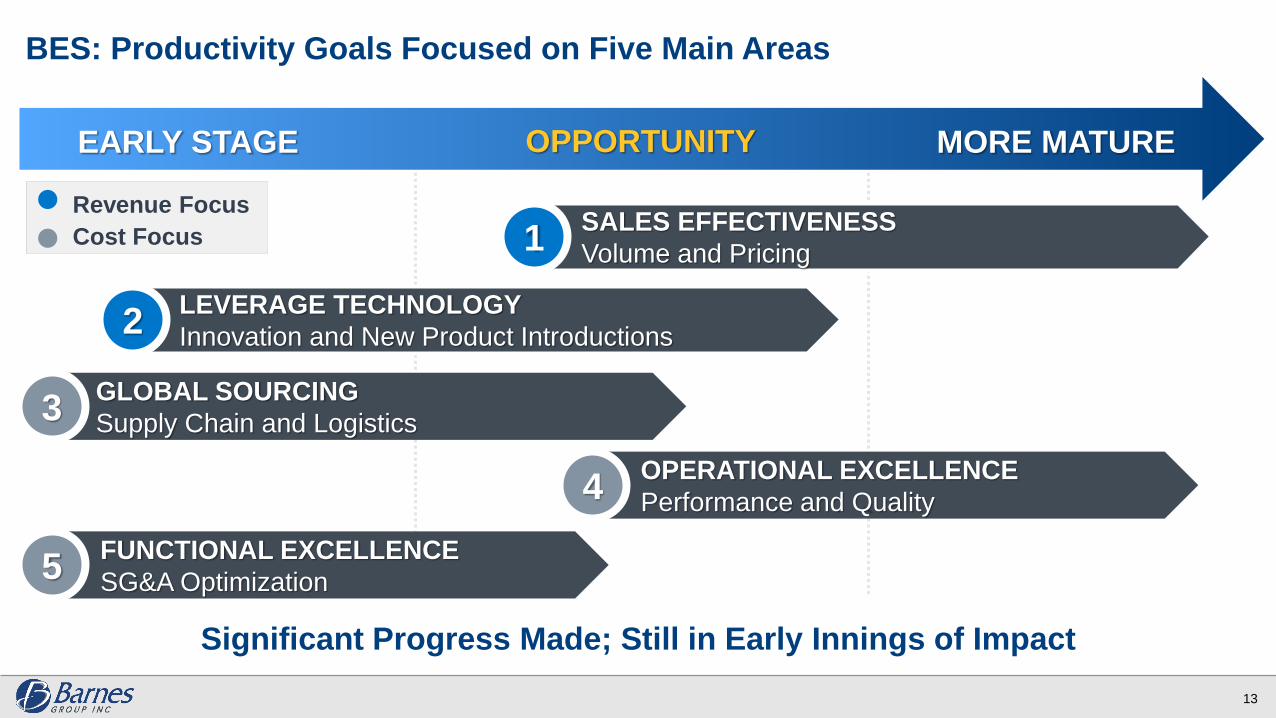
Significant Progress Made; Still in Early Innings of Impact
13
EARLY STAGE MORE MATURE
SALES EFFECTIVENESS
Volume and Pricing
GLOBAL SOURCING
Supply Chain and Logistics
LEVERAGE TECHNOLOGY
Innovation and New Product Introductions
OPERATIONAL EXCELLENCE
Performance and Quality
FUNCTIONAL EXCELLENCE
SG&A Optimization
1
2
3
4
5
Revenue Focus
Cost Focus
BES: Productivity Goals Focused on Five Main Areas
OPPORTUNITY

Financial Performance
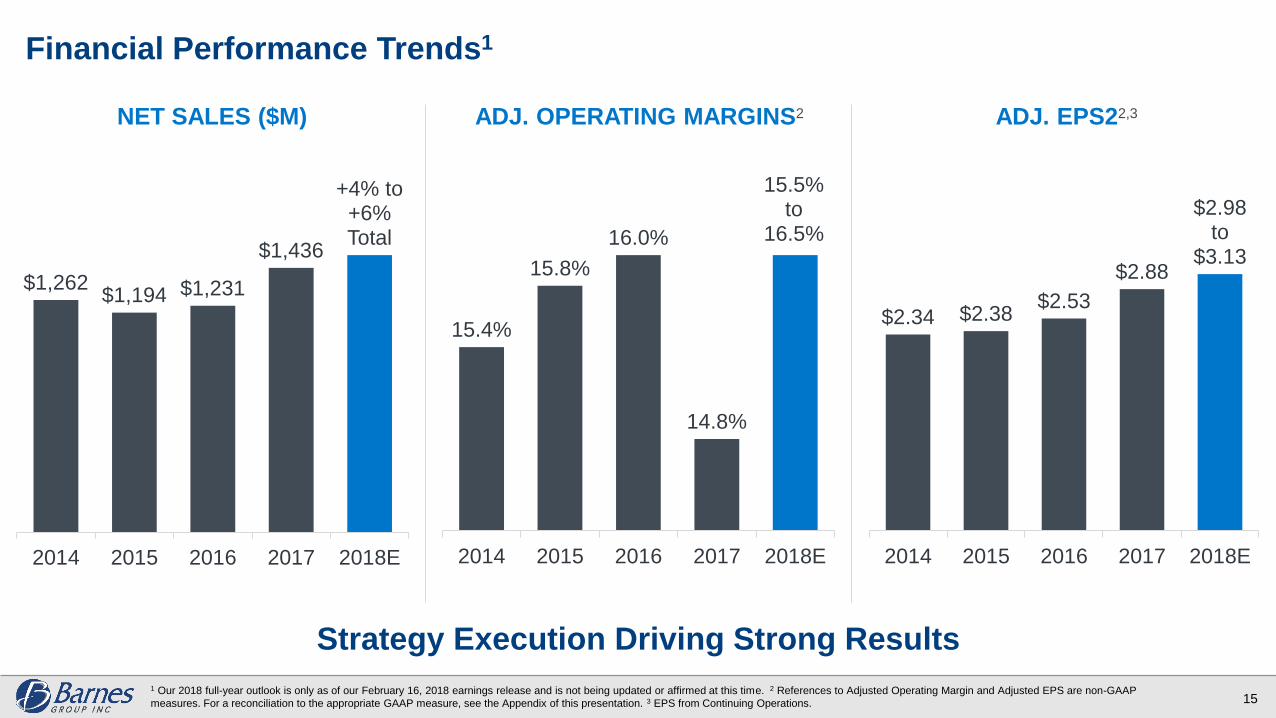
Financial Performance Trends1
Strategy Execution Driving Strong Results
15
NET SALES ($M) ADJ. EPS22,3ADJ. OPERATING MARGINS2
$1,262 $1,194 $1,231
$1,436
+4% to +6% Total
2014 2015 2016 2017 2018E
15.4%
15.8%
16.0%
14.8%
15.5% to
16.5%
2014 2015 2016 2017 2018E
$2.34 $2.38 $2.53
$2.88
$2.98 to
$3.13
2014 2015 2016 2017 2018E
1 Our 2018 full-year outlook is only as of our February 16, 2018 earnings release and is not being updated or affirmed at this time. 2 References to Adjusted Operating Margin and Adjusted EPS are non-GAAP
measures. For a reconciliation to the appropriate GAAP measure, see the Appendix of this presentation. 3 EPS from Continuing Operations.
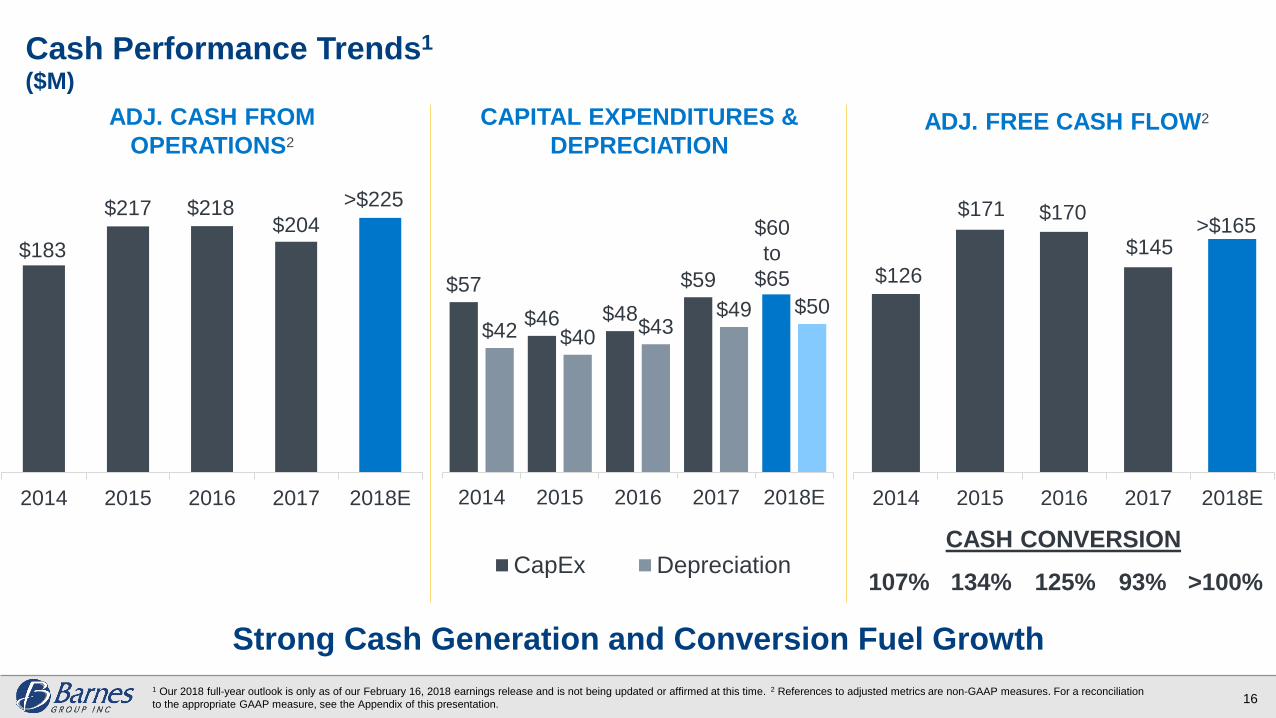
Strong Cash Generation and Conversion Fuel Growth
16
Cash Performance Trends1
$183
$217 $218$204
2014 2015 2016 2017 2018E
~$195
~$140
ADJ. CASH FROM
OPERATIONS2
ADJ. FREE CASH FLOW2CAPITAL EXPENDITURES &
DEPRECIATION
$57
$46 $48
$59
$42 $40$43
$49 $50
2014 2015 2016 2017 2018E
$126
$171 $170
$145
2014 2015 2016 2017 2018E
107% 134% 125% 93% >100%
CASH CONVERSION
>$165
CapEx Depreciation
($M)
$60
to
$65
>$225
1 Our 2018 full-year outlook is only as of our February 16, 2018 earnings release and is not being updated or affirmed at this time. 2 References to adjusted metrics are non-GAAP measures. For a reconciliation
to the appropriate GAAP measure, see the Appendix of this presentation.
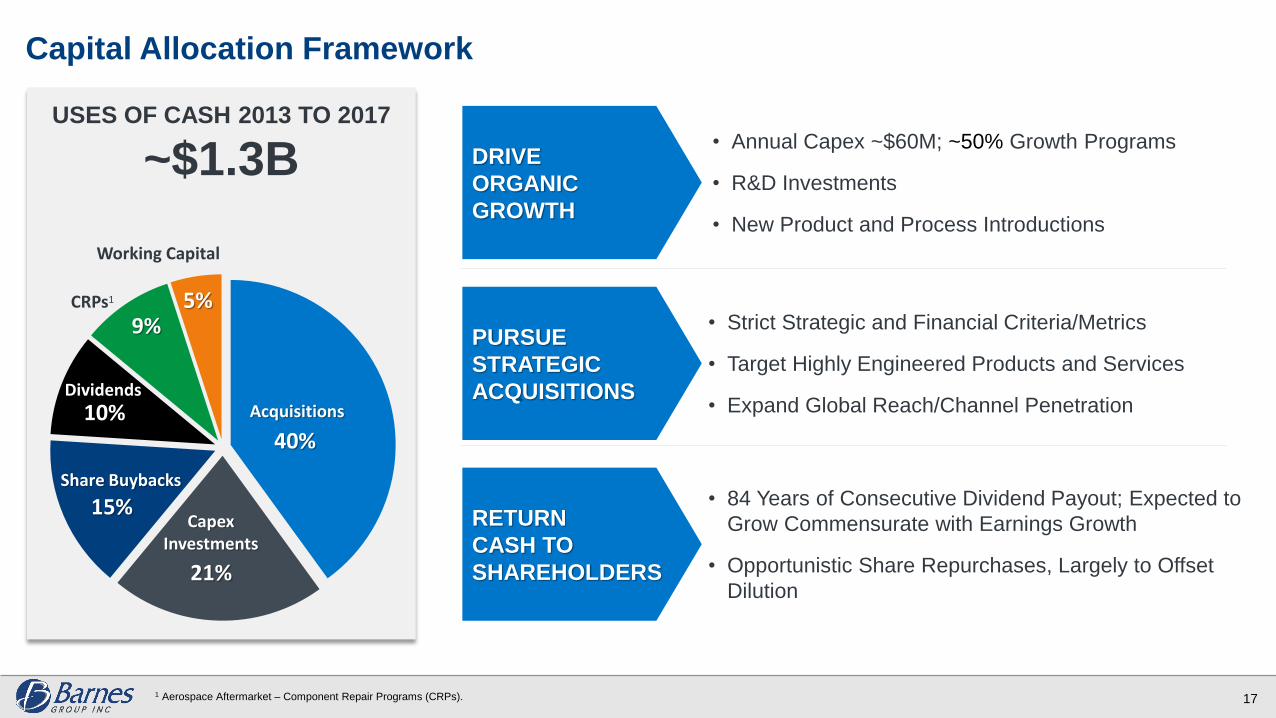
Capital Allocation Framework
17
USES OF CASH 2013 TO 2017
~$1.3B
40%
21%
15%
10%
9%5%CRPs1
Dividends
Share Buybacks
CapexInvestments
Acquisitions
Working Capital
1 Aerospace Aftermarket – Component Repair Programs (CRPs).
• Annual Capex ~$60M; ~50% Growth Programs
• R&D Investments
• New Product and Process Introductions
DRIVE
ORGANIC
GROWTH
• Strict Strategic and Financial Criteria/Metrics
• Target Highly Engineered Products and Services
• Expand Global Reach/Channel Penetration
• 84 Years of Consecutive Dividend Payout; Expected to
Grow Commensurate with Earnings Growth
• Opportunistic Share Repurchases, Largely to Offset
Dilution
RETURN
CASH TO
SHAREHOLDERS
PURSUE
STRATEGIC
ACQUISITIONS
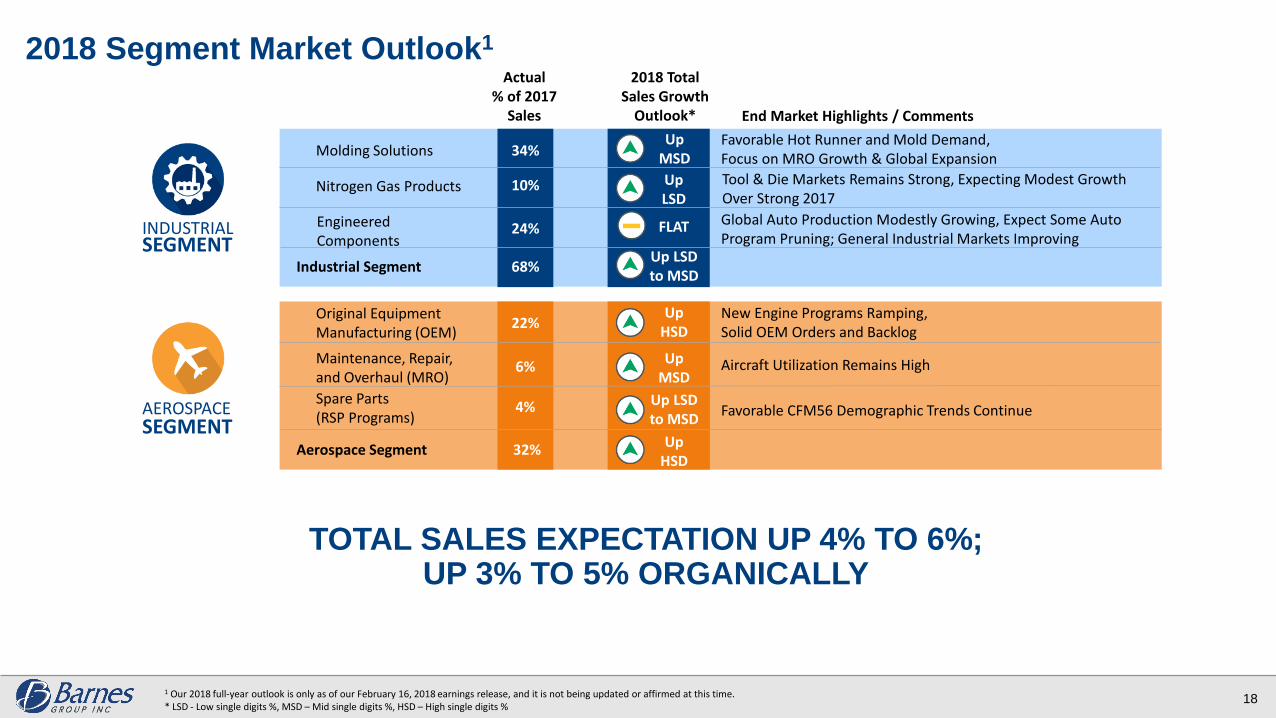
2018 Segment Market Outlook1
TOTAL SALES EXPECTATION UP 4% TO 6%; UP 3% TO 5% ORGANICALLY
1 Our 2018 full-year outlook is only as of our February 16, 2018 earnings release, and it is not being updated or affirmed at this time.* LSD - Low single digits %, MSD – Mid single digits %, HSD – High single digits %
INDUSTRIALSEGMENT
AEROSPACESEGMENT
End Market Highlights / Comments
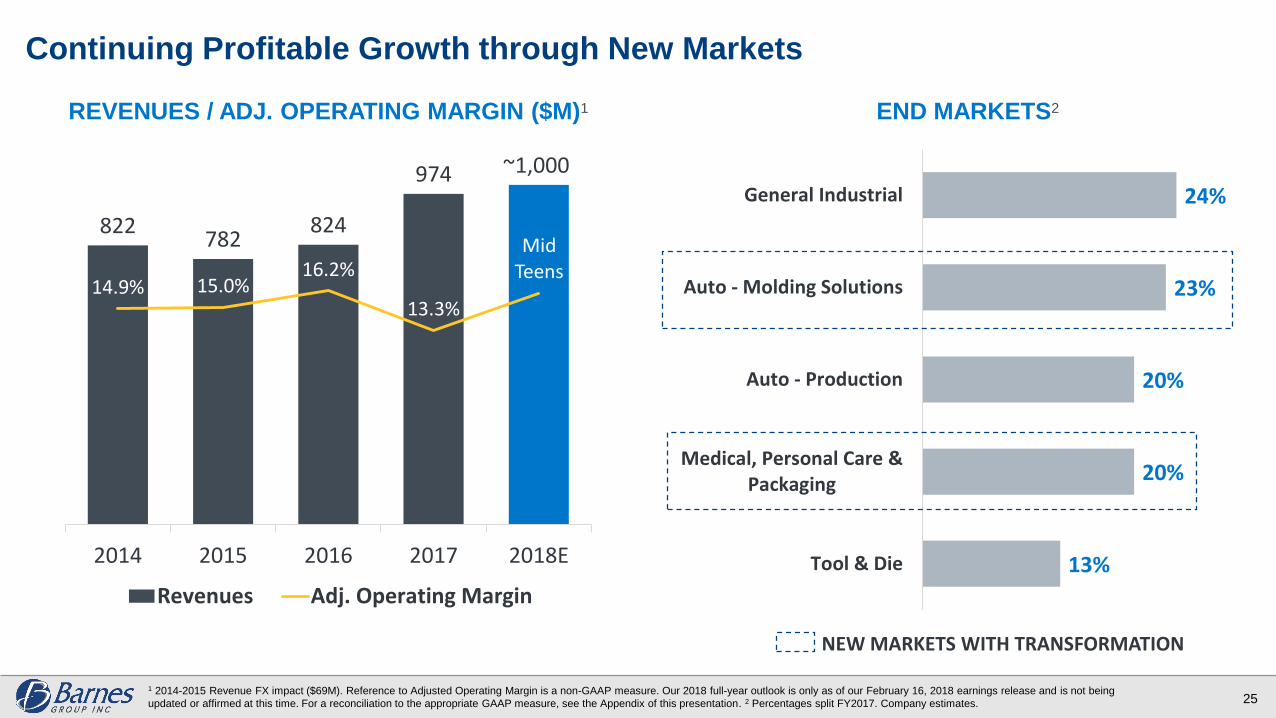
Molding Solutions 34%
10%Nitrogen Gas Products
Original Equipment Manufacturing (OEM)
Maintenance, Repair,and Overhaul (MRO)
Spare Parts (RSP Programs)
22%
Up MSD
6%
4%
Favorable Hot Runner and Mold Demand, Focus on MRO Growth & Global Expansion
Tool & Die Markets Remains Strong, Expecting Modest Growth Over Strong 2017
New Engine Programs Ramping, Solid OEM Orders and Backlog
Aircraft Utilization Remains High
Favorable CFM56 Demographic Trends Continue
Up LSD
Industrial Segment 68%Up LSD to MSDTeens
Aerospace Segment 32%
24%Engineered Components
Global Auto Production Modestly Growing, Expect Some Auto Program Pruning; General Industrial Markets Improving
Up HSD
FLAT
Up MSD
Up LSDto MSD
UpHSD
Actual% of 2017
Sales
2018 Total Sales Growth
Outlook*
18
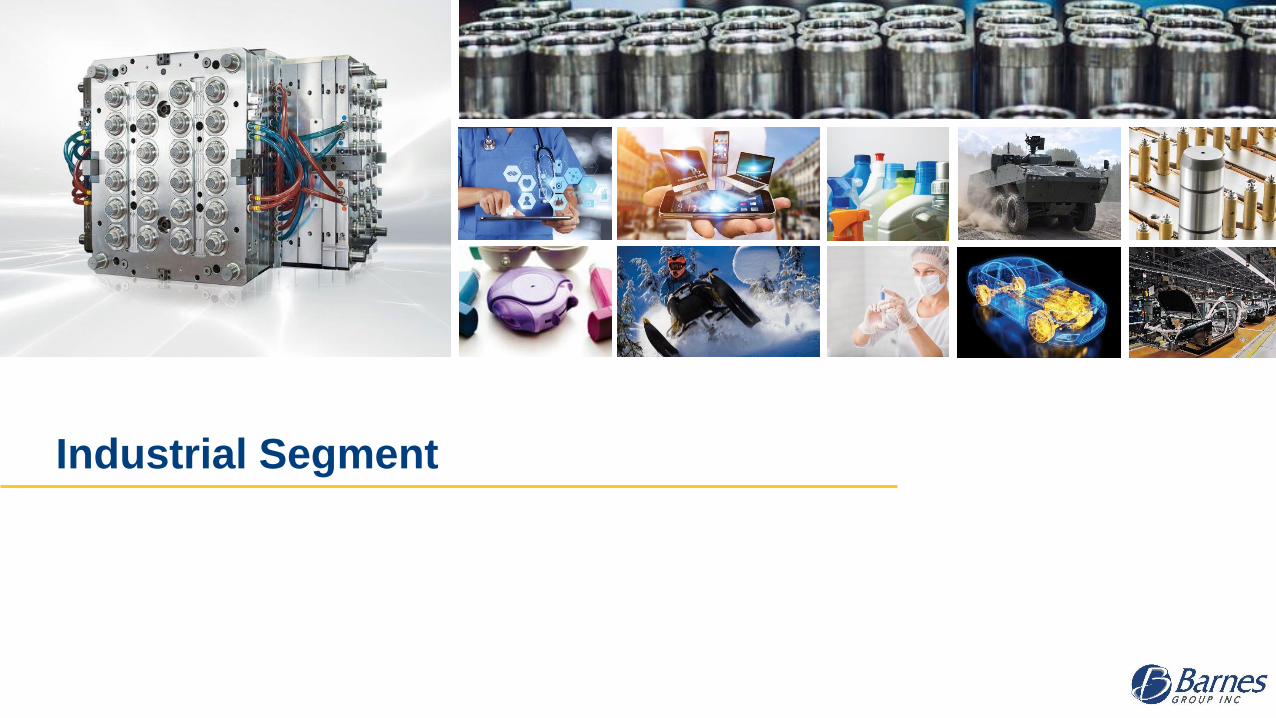
Industrial Segment
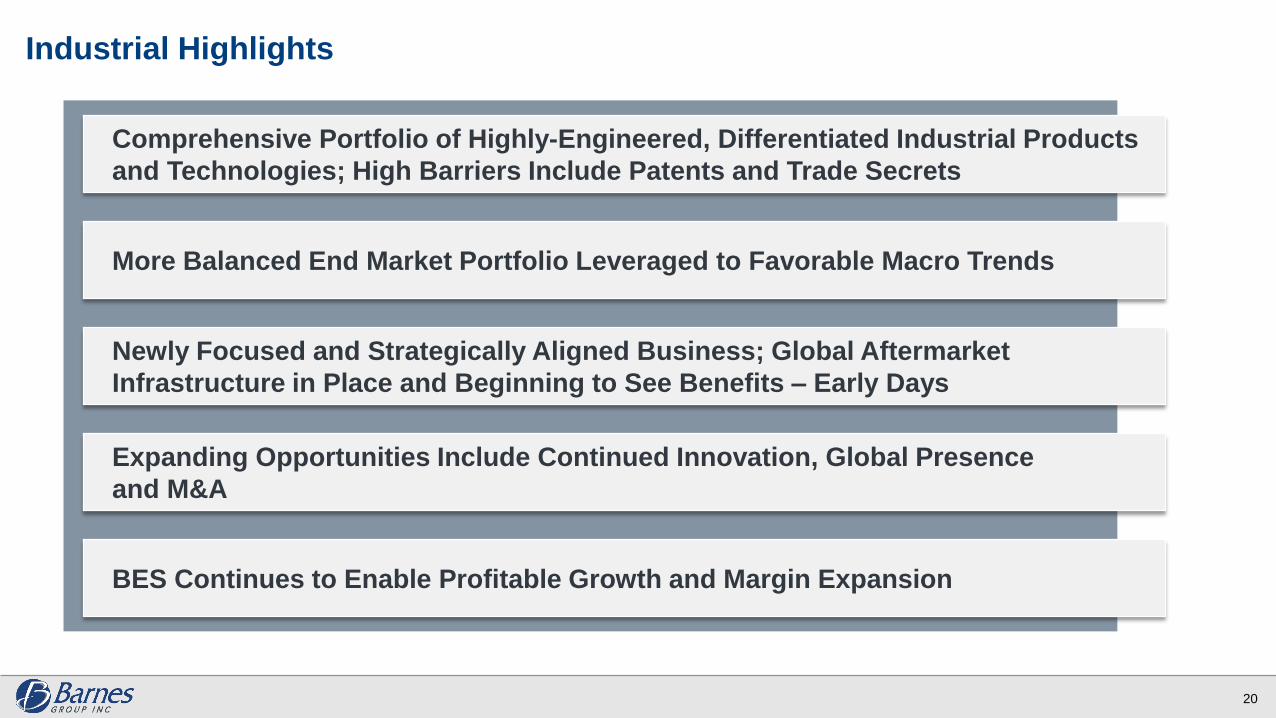
Industrial Highlights
20
Comprehensive Portfolio of Highly-Engineered, Differentiated Industrial Products
and Technologies; High Barriers Include Patents and Trade Secrets
More Balanced End Market Portfolio Leveraged to Favorable Macro Trends
Newly Focused and Strategically Aligned Business; Global Aftermarket
Infrastructure in Place and Beginning to See Benefits – Early Days
Expanding Opportunities Include Continued Innovation, Global Presence
and M&A
BES Continues to Enable Profitable Growth and Margin Expansion
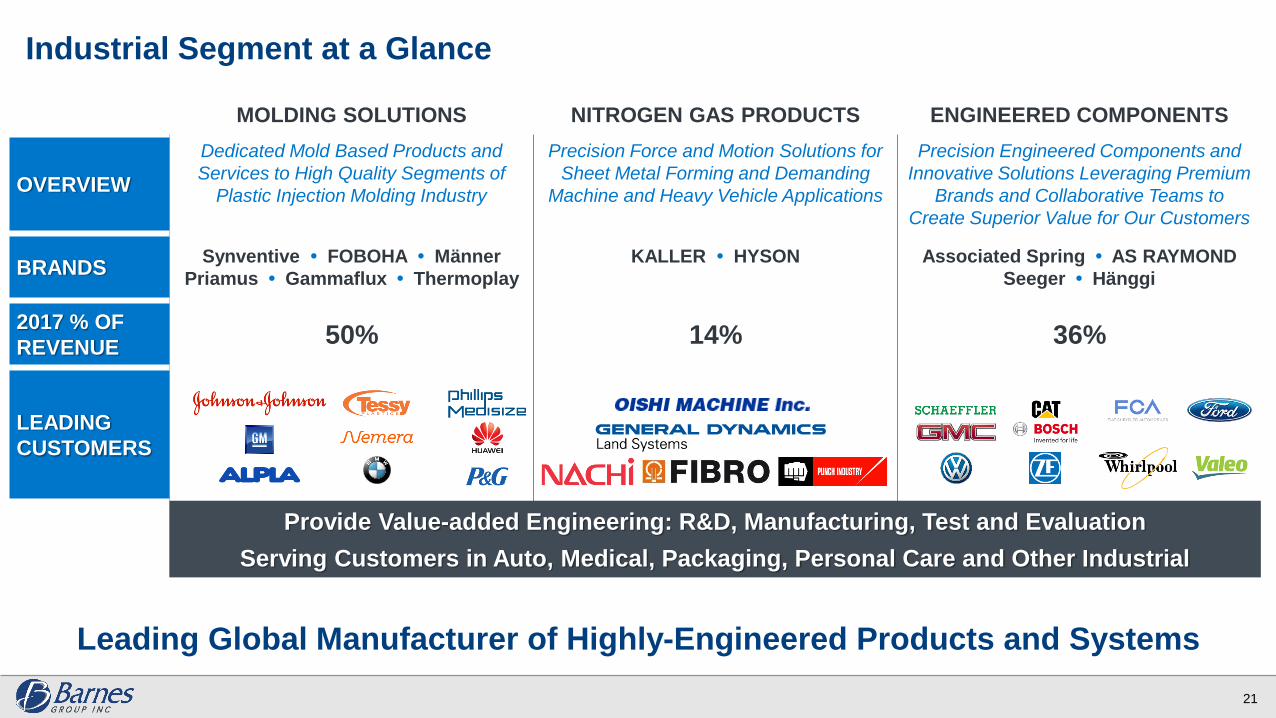
MOLDING SOLUTIONS NITROGEN GAS PRODUCTS ENGINEERED COMPONENTS
OVERVIEW
Dedicated Mold Based Products and
Services to High Quality Segments of
Plastic Injection Molding Industry
Precision Force and Motion Solutions for
Sheet Metal Forming and Demanding
Machine and Heavy Vehicle Applications
Precision Engineered Components and
Innovative Solutions Leveraging Premium
Brands and Collaborative Teams to
Create Superior Value for Our Customers
BRANDSSynventive • FOBOHA • Männer
Priamus • Gammaflux • Thermoplay
KALLER • HYSON Associated Spring • AS RAYMOND
Seeger • Hänggi
2017 % OF
REVENUE50% 14% 36%
LEADING
CUSTOMERS
Industrial Segment at a Glance
Leading Global Manufacturer of Highly-Engineered Products and Systems
21
Provide Value-added Engineering: R&D, Manufacturing, Test and Evaluation
Serving Customers in Auto, Medical, Packaging, Personal Care and Other Industrial
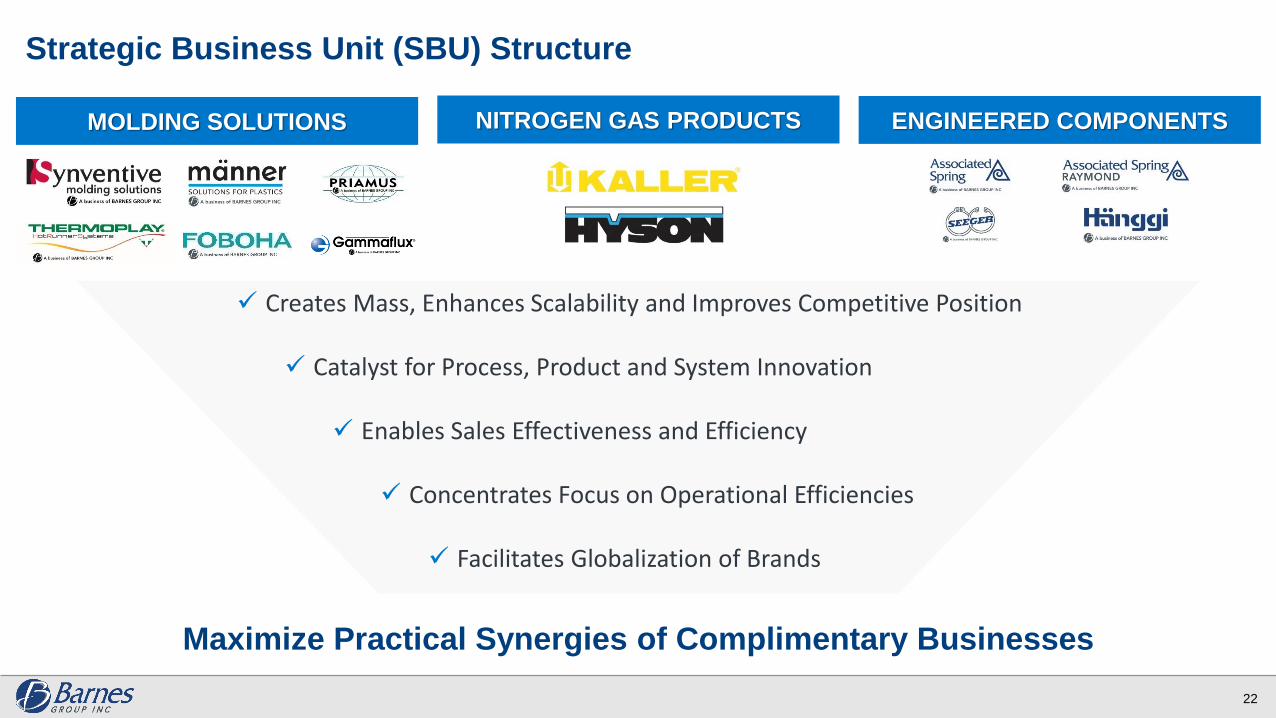
Strategic Business Unit (SBU) Structure
Maximize Practical Synergies of Complimentary Businesses
22
MOLDING SOLUTIONS NITROGEN GAS PRODUCTS ENGINEERED COMPONENTS
Creates Mass, Enhances Scalability and Improves Competitive Position
Catalyst for Process, Product and System Innovation
Enables Sales Effectiveness and Efficiency
Concentrates Focus on Operational Efficiencies
Facilitates Globalization of Brands
Portfolio Aligned with Several Long-Term Macro Drivers
23
AGING POPULATION,
RISING HEALTH NEEDS
CONSUMER-DRIVEN SUSTAINABILITY
PACKAGING INNOVATION
SELECT APPLICATIONS LEVERAGING OUR STRONG BRANDS
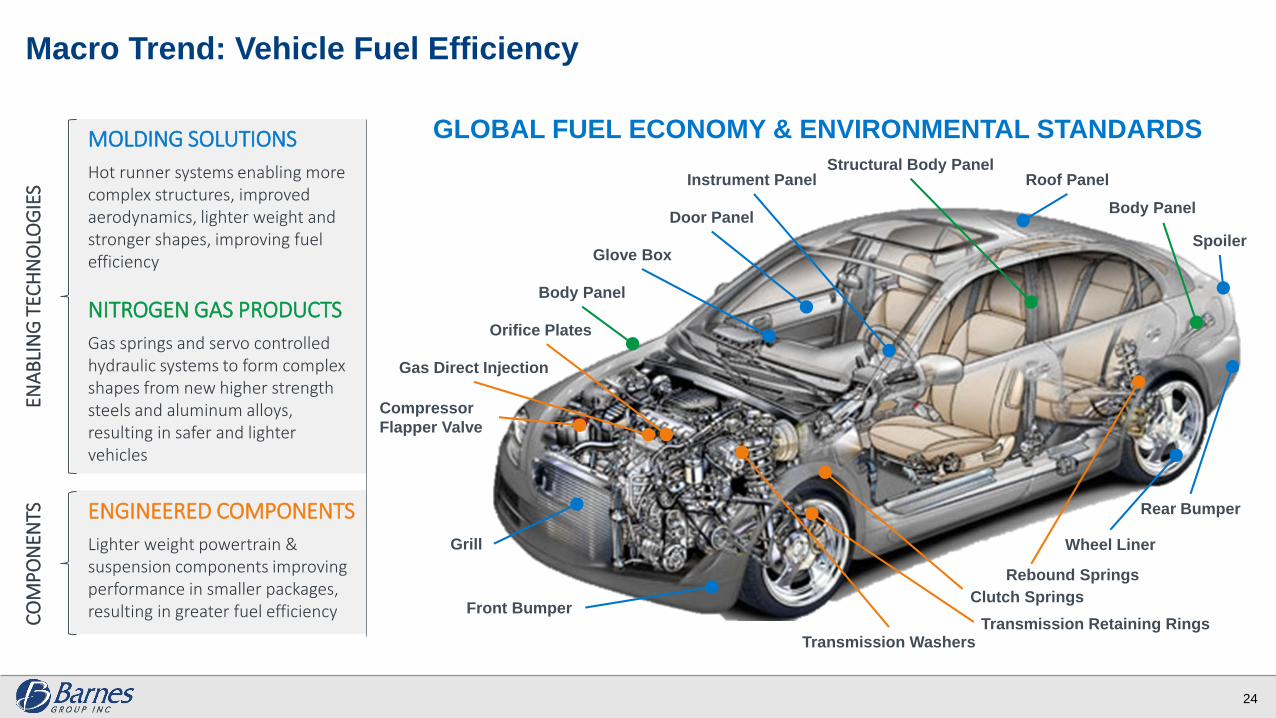
Macro Trend: Vehicle Fuel Efficiency
Grill
Front Bumper
Glove Box
Door Panel
Instrument Panel
Wheel Liner
Rear Bumper
Spoiler
Transmission WashersTransmission Retaining Rings
Gas Direct Injection
Orifice Plates
Roof PanelStructural Body Panel
Body Panel
Body Panel
Clutch Springs
Compressor
Flapper Valve
GLOBAL FUEL ECONOMY & ENVIRONMENTAL STANDARDS
24
MOLDING SOLUTIONS
Hot runner systems enabling more complex structures, improved aerodynamics, lighter weight and stronger shapes, improving fuel efficiency
NITROGEN GAS PRODUCTS
Gas springs and servo controlled hydraulic systems to form complex shapes from new higher strength steels and aluminum alloys, resulting in safer and lighter vehicles
ENGINEERED COMPONENTS
Lighter weight powertrain & suspension components improving performance in smaller packages, resulting in greater fuel efficiency
ENA
BLI
NG
TEC
HN
OLO
GIE
SC
OM
PO
NEN
TS
Rebound Springs
13%
20%
20%
23%
24%
Tool & Die
Medical, Personal Care &Packaging
Auto - Production
Auto - Molding Solutions
General Industrial
Continuing Profitable Growth through New Markets
25
REVENUES / ADJ. OPERATING MARGIN ($M)1 END MARKETS2
NEW MARKETS WITH TRANSFORMATION
822782
824
974 ~1,000
14.9% 15.0%16.2%
13.3%
MidTeens
-1.0%
4.0 %
9.0 %
14. 0%
19. 0%
24. 0%
0
100
200
300
400
500
600
700
800
900
100 0
2014 2015 2016 2017 2018E
Revenues Adj. Operating Margin
1 2014-2015 Revenue FX impact ($69M). Reference to Adjusted Operating Margin is a non-GAAP measure. Our 2018 full-year outlook is only as of our February 16, 2018 earnings release and is not being
updated or affirmed at this time. For a reconciliation to the appropriate GAAP measure, see the Appendix of this presentation. 2 Percentages split FY2017. Company estimates.
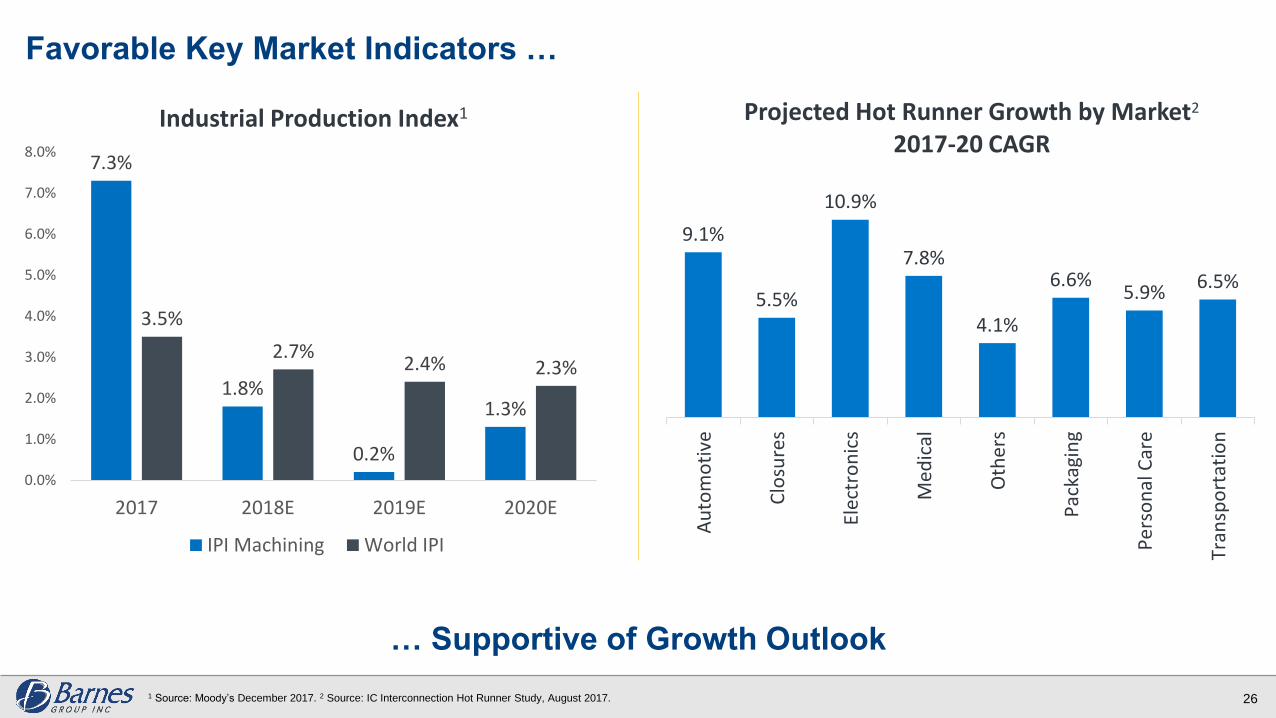
Favorable Key Market Indicators …
… Supportive of Growth Outlook
26
9.1%
5.5%
10.9%
7.8%
4.1%
6.6%5.9%
6.5%
Au
tom
oti
ve
Clo
sure
s
Elec
tro
nic
s
Med
ical
Oth
ers
Pac
kagi
ng
Per
son
al C
are
Tran
spo
rtat
ion
Projected Hot Runner Growth by Market2
2017-20 CAGR
1 Source: Moody’s December 2017. 2 Source: IC Interconnection Hot Runner Study, August 2017.
7.3%
1.8%
0.2%
1.3%
3.5%
2.7%2.4% 2.3%
0.0%
1.0%
2.0%
3.0%
4.0%
5.0%
6.0%
7.0%
8.0%
2017 2018E 2019E 2020E
Industrial Production Index1
IPI Machining World IPI
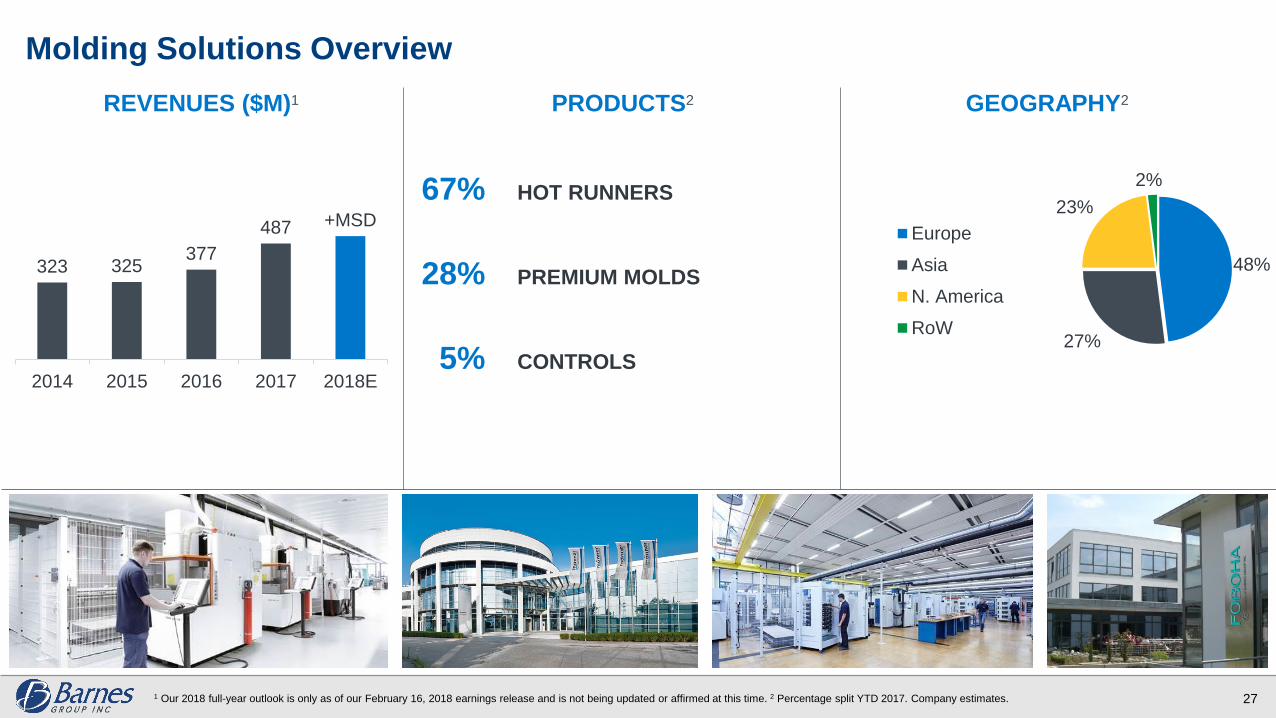
Molding Solutions Overview
27
323 325377
487 +MSD
2014 2015 2016 2017 2018E
REVENUES ($M)1 GEOGRAPHY2
48%
27%
23%
2%
Europe
Asia
N. America
RoW
67% HOT RUNNERS
28% PREMIUM MOLDS
5% CONTROLS
PRODUCTS2
1 Our 2018 full-year outlook is only as of our February 16, 2018 earnings release and is not being updated or affirmed at this time. 2 Percentage split YTD 2017. Company estimates.
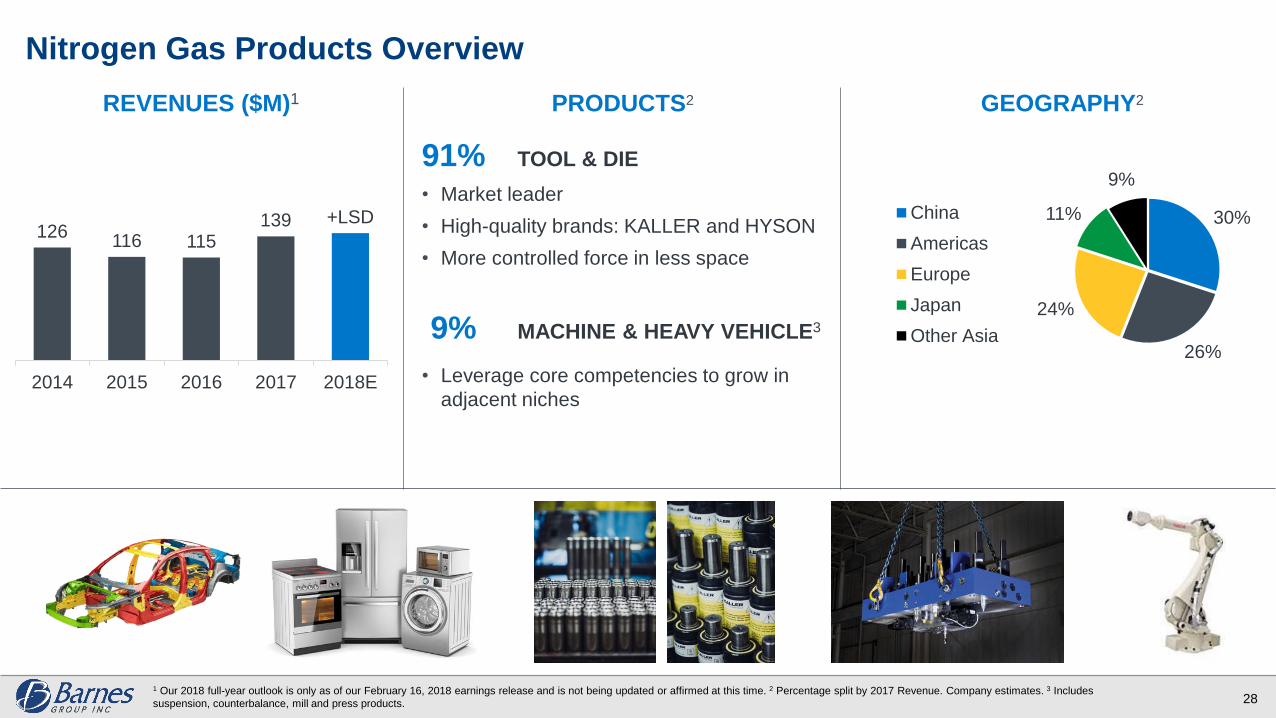
Nitrogen Gas Products Overview
28
126116 115
139 +LSD
2014 2015 2016 2017 2018E
REVENUES ($M)1 PRODUCTS2 GEOGRAPHY2
30%
26%
24%
11%
9%
China
Americas
Europe
Japan
Other Asia
91% TOOL & DIE
• Market leader
• High-quality brands: KALLER and HYSON
• More controlled force in less space
9% MACHINE & HEAVY VEHICLE3
• Leverage core competencies to grow in
adjacent niches
1 Our 2018 full-year outlook is only as of our February 16, 2018 earnings release and is not being updated or affirmed at this time. 2 Percentage split by 2017 Revenue. Company estimates. 3 Includes
suspension, counterbalance, mill and press products.
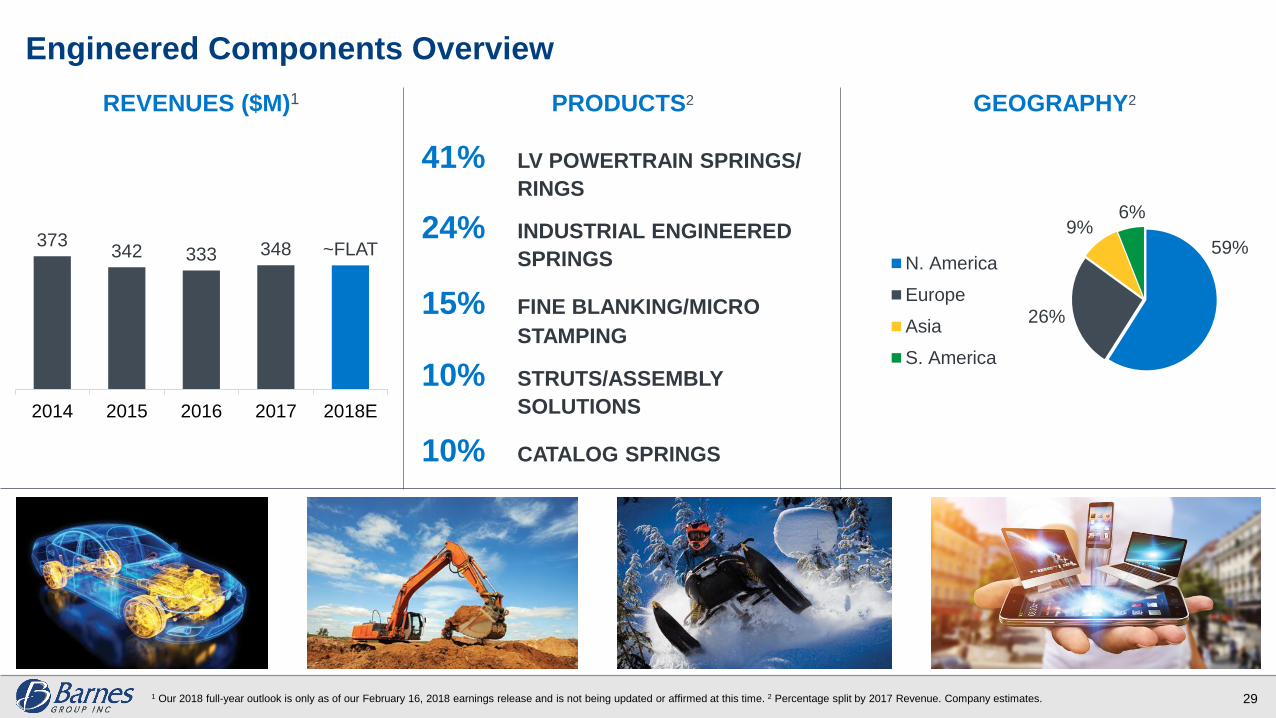
Engineered Components Overview
REVENUES ($M)1 GEOGRAPHY2
59%
26%
9%6%
N. America
Europe
Asia
S. America
41% LV POWERTRAIN SPRINGS/
RINGS
24% INDUSTRIAL ENGINEERED
SPRINGS
15% FINE BLANKING/MICRO
STAMPING
10% STRUTS/ASSEMBLY
SOLUTIONS
10% CATALOG SPRINGS
29
373342 333 348 ~FLAT
2014 2015 2016 2017 2018E
PRODUCTS2
1 Our 2018 full-year outlook is only as of our February 16, 2018 earnings release and is not being updated or affirmed at this time. 2 Percentage split by 2017 Revenue. Company estimates.
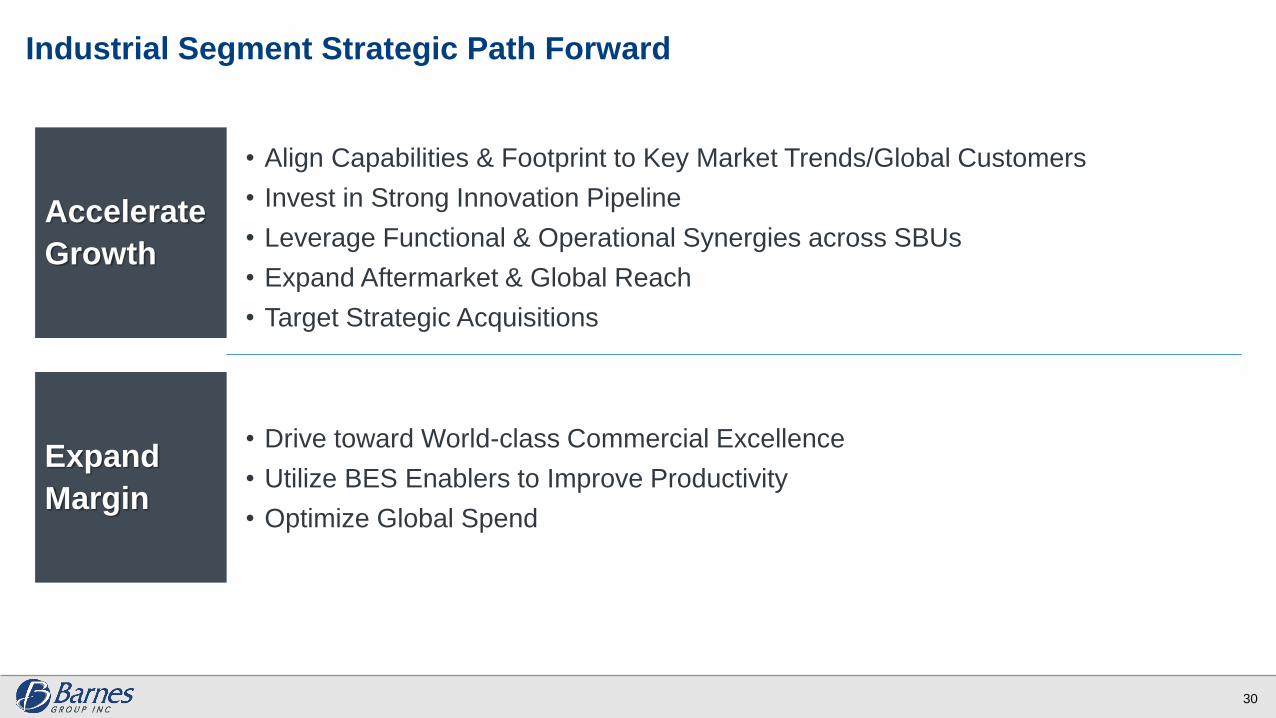
Industrial Segment Strategic Path Forward
• Align Capabilities & Footprint to Key Market Trends/Global Customers
• Invest in Strong Innovation Pipeline
• Leverage Functional & Operational Synergies across SBUs
• Expand Aftermarket & Global Reach
• Target Strategic Acquisitions
• Drive toward World-class Commercial Excellence
• Utilize BES Enablers to Improve Productivity
• Optimize Global Spend
Accelerate
Growth
Expand
Margin
30
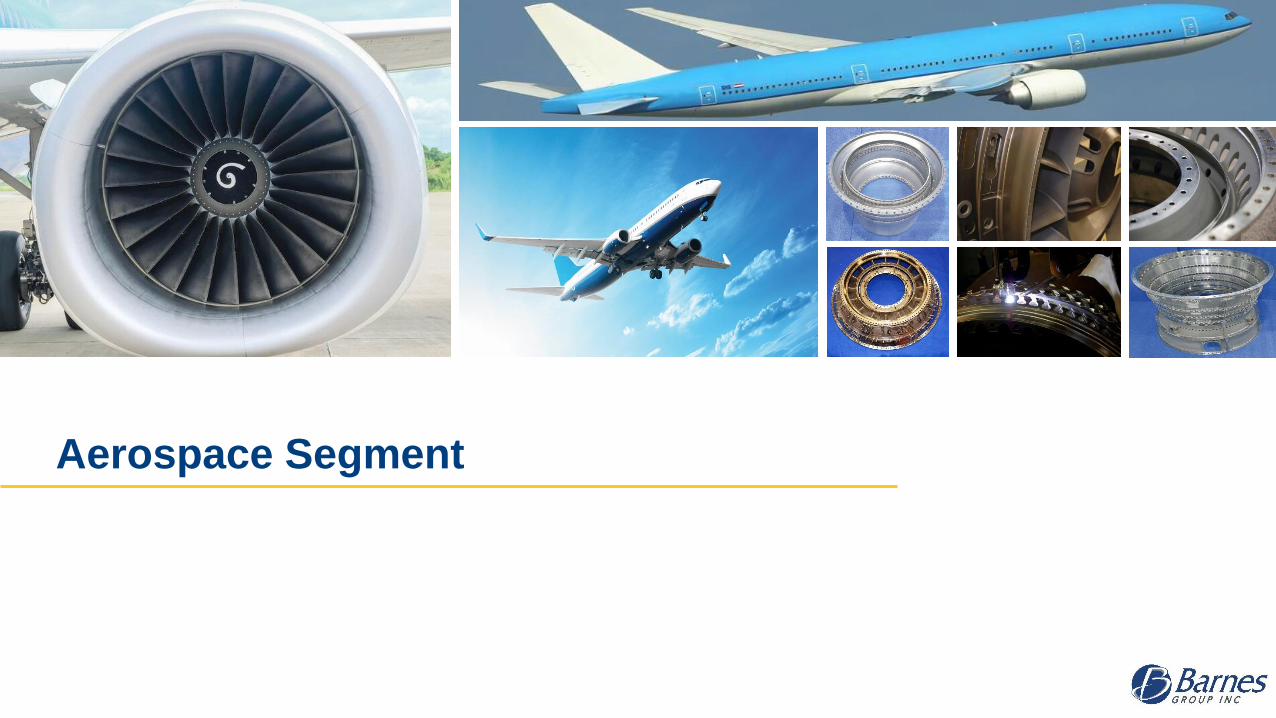
Aerospace Segment
Aerospace Highlights
32
Return to Growth with Transition from Legacy to New Engine Programs
Concurrent Engineering Expertise and Execution through BES Creating Strong
Customer Relationships
Flexible New Product Introduction Processes Creating Innovative Solutions to
Address Customer Challenges
Drive Aftermarket Presence through Investments and Partnerships
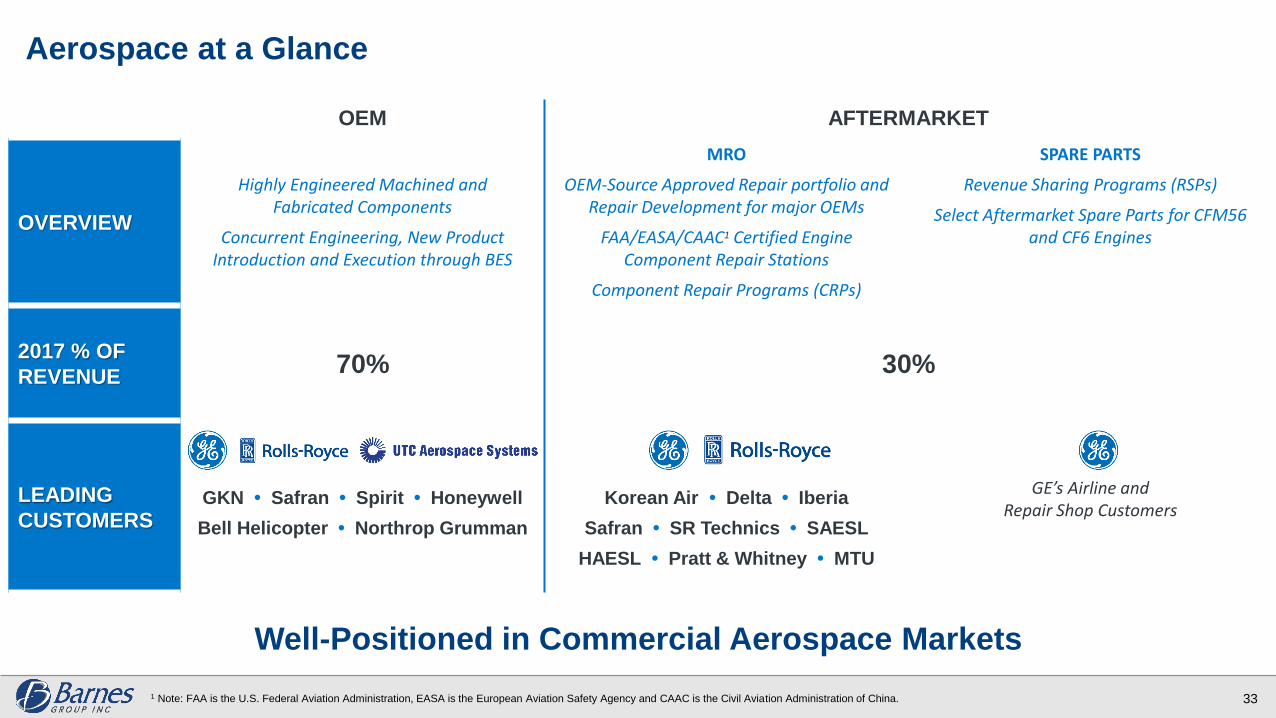
Aerospace at a Glance
Well-Positioned in Commercial Aerospace Markets
33
OEM AFTERMARKET
OVERVIEW
Highly Engineered Machined and Fabricated Components
Concurrent Engineering, New Product Introduction and Execution through BES
MRO
OEM-Source Approved Repair portfolio and Repair Development for major OEMs
FAA/EASA/CAAC1 Certified Engine Component Repair Stations
Component Repair Programs (CRPs)
SPARE PARTS
Revenue Sharing Programs (RSPs)
Select Aftermarket Spare Parts for CFM56 and CF6 Engines
2017 % OF
REVENUE70% 30%
LEADING
CUSTOMERSGKN • Safran • Spirit • Honeywell
Bell Helicopter • Northrop Grumman
Korean Air • Delta • Iberia
Safran • SR Technics • SAESL
HAESL • Pratt & Whitney • MTU
GE’s Airline andRepair Shop Customers
1 Note: FAA is the U.S. Federal Aviation Administration, EASA is the European Aviation Safety Agency and CAAC is the Civil Aviation Administration of China.
2014 2015 2016 2017 2018E
Aftermarket
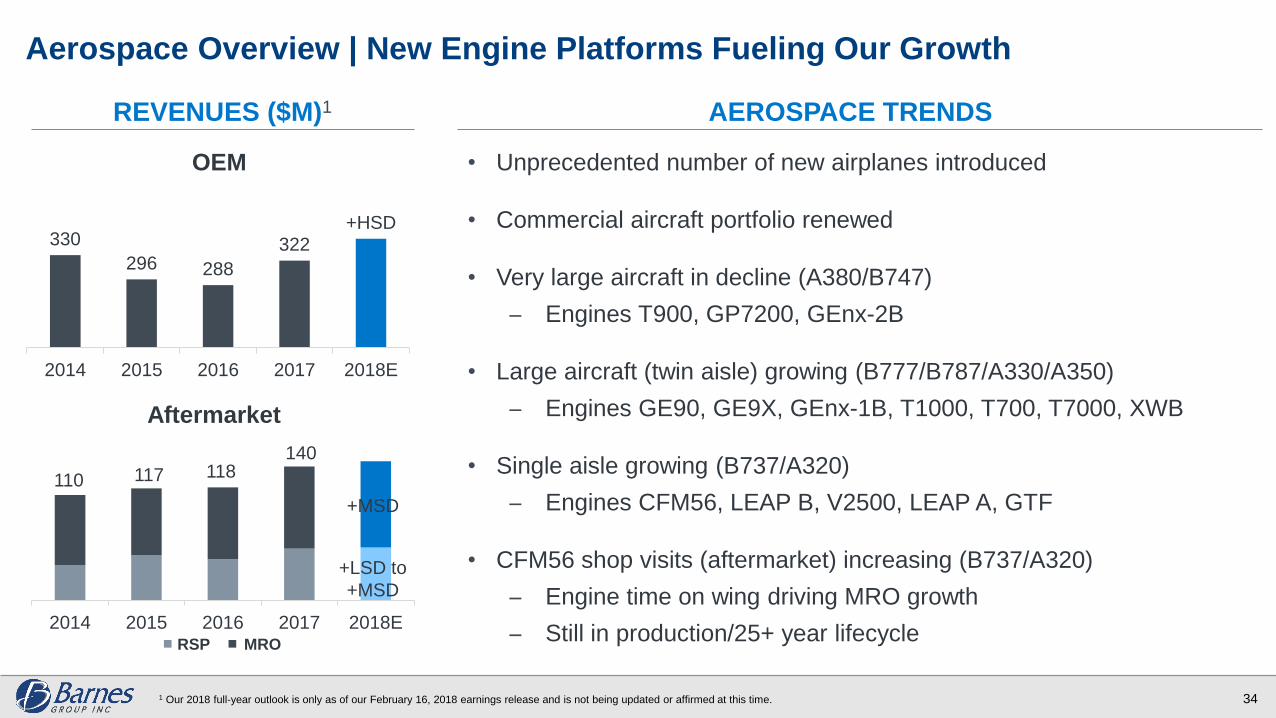
Aerospace Overview | New Engine Platforms Fueling Our Growth
• Unprecedented number of new airplanes introduced
• Commercial aircraft portfolio renewed
• Very large aircraft in decline (A380/B747)
Engines T900, GP7200, GEnx-2B
• Large aircraft (twin aisle) growing (B777/B787/A330/A350)
Engines GE90, GE9X, GEnx-1B, T1000, T700, T7000, XWB
• Single aisle growing (B737/A320)
Engines CFM56, LEAP B, V2500, LEAP A, GTF
• CFM56 shop visits (aftermarket) increasing (B737/A320)
Engine time on wing driving MRO growth
Still in production/25+ year lifecycle
AEROSPACE TRENDSREVENUES ($M)1
34
OEM
110 117 118140
+MSD
RSP MRO
330
296 288
322+HSD
2014 2015 2016 2017 2018E
1 Our 2018 full-year outlook is only as of our February 16, 2018 earnings release and is not being updated or affirmed at this time.
+LSD to
+MSD
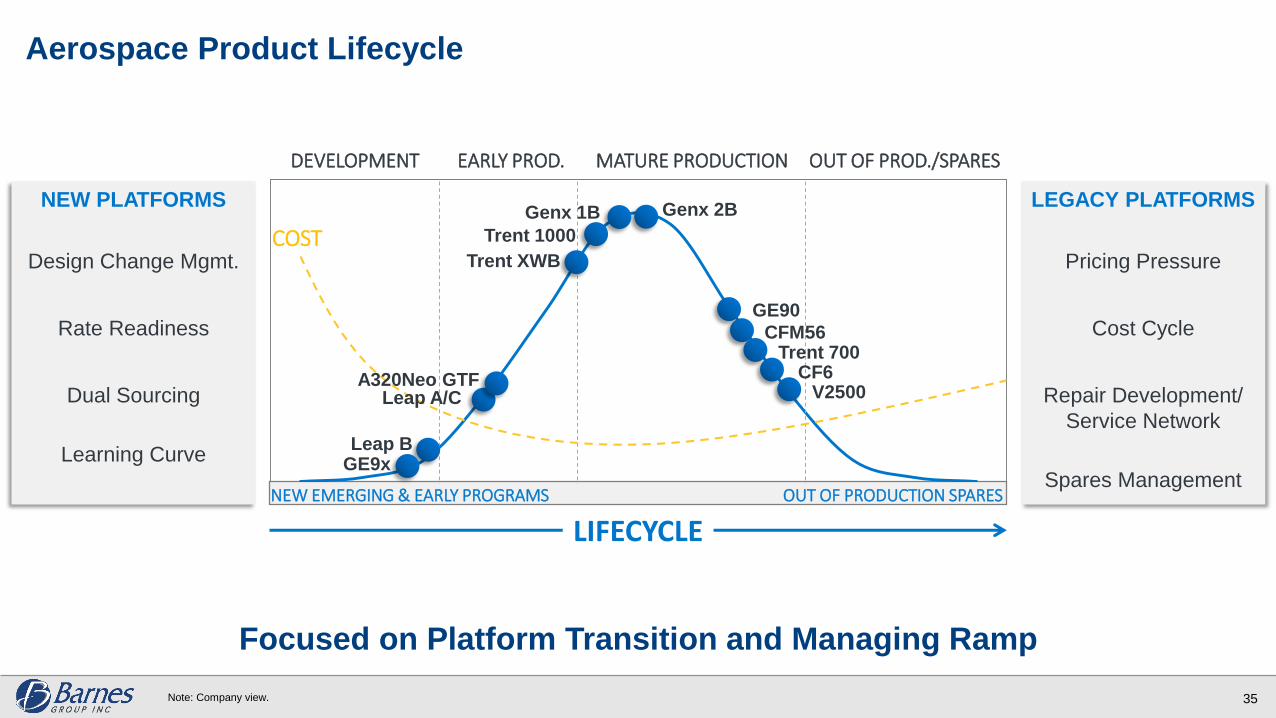
Aerospace Product Lifecycle
Focused on Platform Transition and Managing Ramp
35
COST
DEVELOPMENT EARLY PROD. MATURE PRODUCTION OUT OF PROD./SPARES
GE9xLeap B
Leap A/CA320Neo GTF
Trent XWB
Trent 1000
Genx 1B Genx 2B
GE90
CFM56Trent 700
CF6
NEW EMERGING & EARLY PROGRAMS OUT OF PRODUCTION SPARES
LIFECYCLE
NEW PLATFORMS
Design Change Mgmt.
Rate Readiness
Dual Sourcing
Learning Curve
LEGACY PLATFORMS
Pricing Pressure
Cost Cycle
Repair Development/
Service Network
Spares Management
V2500
Note: Company view.
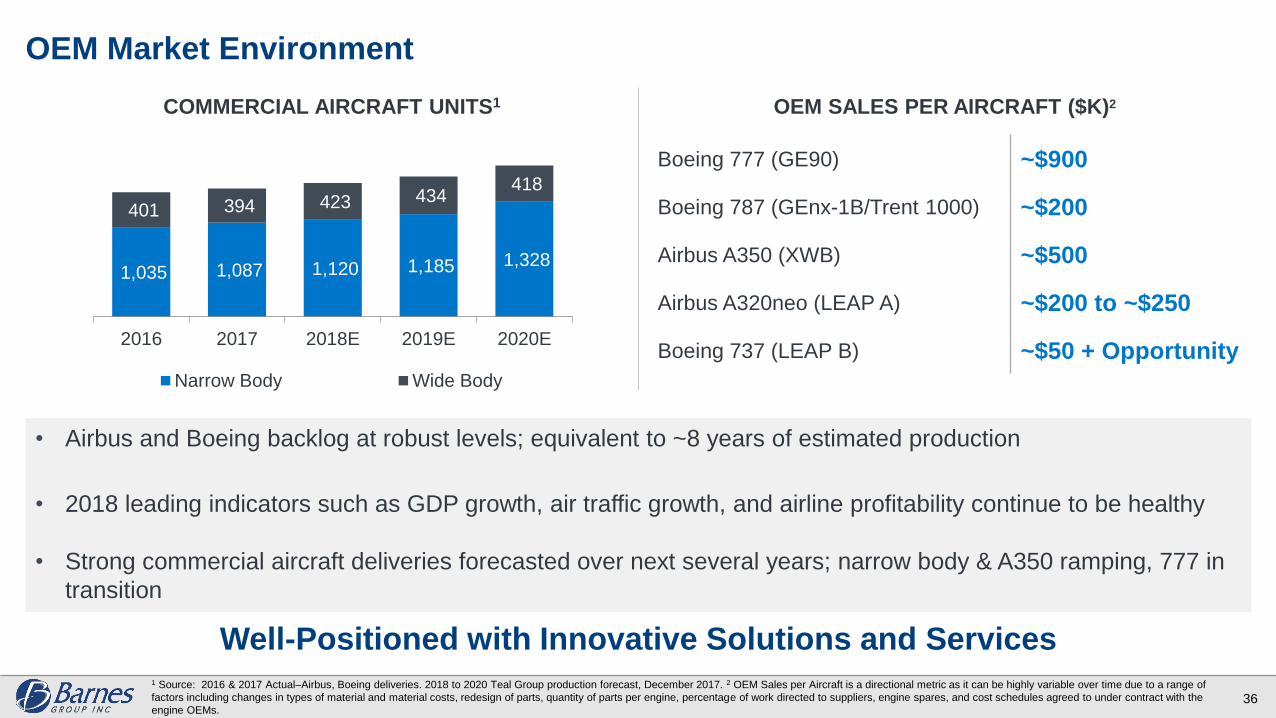
OEM Market Environment
Well-Positioned with Innovative Solutions and Services
36
1,035 1,087 1,120 1,185 1,328
401 394 423 434 418
2016 2017 2018E 2019E 2020E
Narrow Body Wide Body
COMMERCIAL AIRCRAFT UNITS1 OEM SALES PER AIRCRAFT ($K)2
• Airbus and Boeing backlog at robust levels; equivalent to ~8 years of estimated production
• 2018 leading indicators such as GDP growth, air traffic growth, and airline profitability continue to be healthy
• Strong commercial aircraft deliveries forecasted over next several years; narrow body & A350 ramping, 777 in
transition
Boeing 777 (GE90) ~$900
Boeing 787 (GEnx-1B/Trent 1000) ~$200
Airbus A350 (XWB) ~$500
Airbus A320neo (LEAP A) ~$200 to ~$250
Boeing 737 (LEAP B) ~$50 + Opportunity
1 Source: 2016 & 2017 Actual–Airbus, Boeing deliveries. 2018 to 2020 Teal Group production forecast, December 2017. 2 OEM Sales per Aircraft is a directional metric as it can be highly variable over time due to a range of
factors including changes in types of material and material costs, redesign of parts, quantity of parts per engine, percentage of work directed to suppliers, engine spares, and cost schedules agreed to under contract with the
engine OEMs.
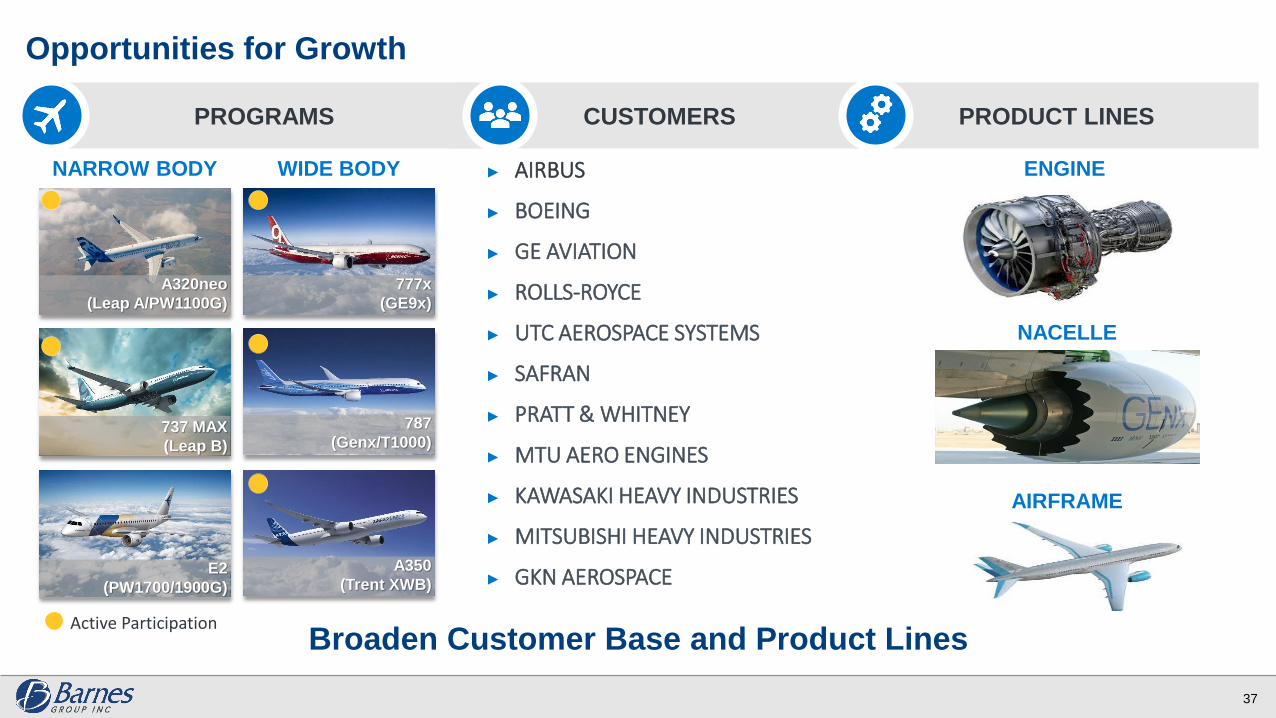
Opportunities for Growth
Broaden Customer Base and Product Lines
37
PROGRAMS CUSTOMERS PRODUCT LINES
NARROW BODY
A320neo
(Leap A/PW1100G)
737 MAX
(Leap B)
E2
(PW1700/1900G)
WIDE BODY
777x
(GE9x)
787
(Genx/T1000)
A350
(Trent XWB)
AIRFRAME
NACELLE
ENGINE► AIRBUS
► BOEING
► GE AVIATION
► ROLLS-ROYCE
► UTC AEROSPACE SYSTEMS
► SAFRAN
► PRATT & WHITNEY
► MTU AERO ENGINES
► KAWASAKI HEAVY INDUSTRIES
► MITSUBISHI HEAVY INDUSTRIES
► GKN AEROSPACE
Active Participation
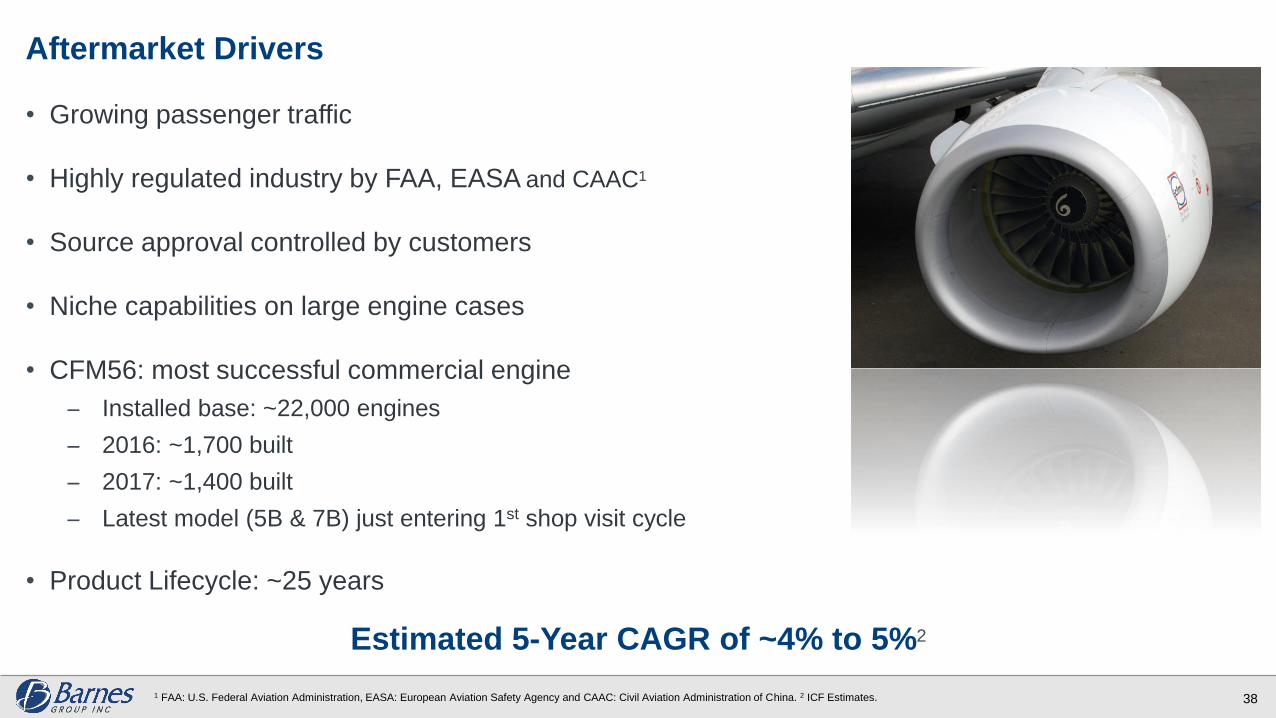
Aftermarket Drivers
• Growing passenger traffic
• Highly regulated industry by FAA, EASA and CAAC1
• Source approval controlled by customers
• Niche capabilities on large engine cases
• CFM56: most successful commercial engine
Installed base: ~22,000 engines
2016: ~1,700 built
2017: ~1,400 built
Latest model (5B & 7B) just entering 1st shop visit cycle
• Product Lifecycle: ~25 years
Estimated 5-Year CAGR of ~4% to 5%2
381 FAA: U.S. Federal Aviation Administration, EASA: European Aviation Safety Agency and CAAC: Civil Aviation Administration of China. 2 ICF Estimates.
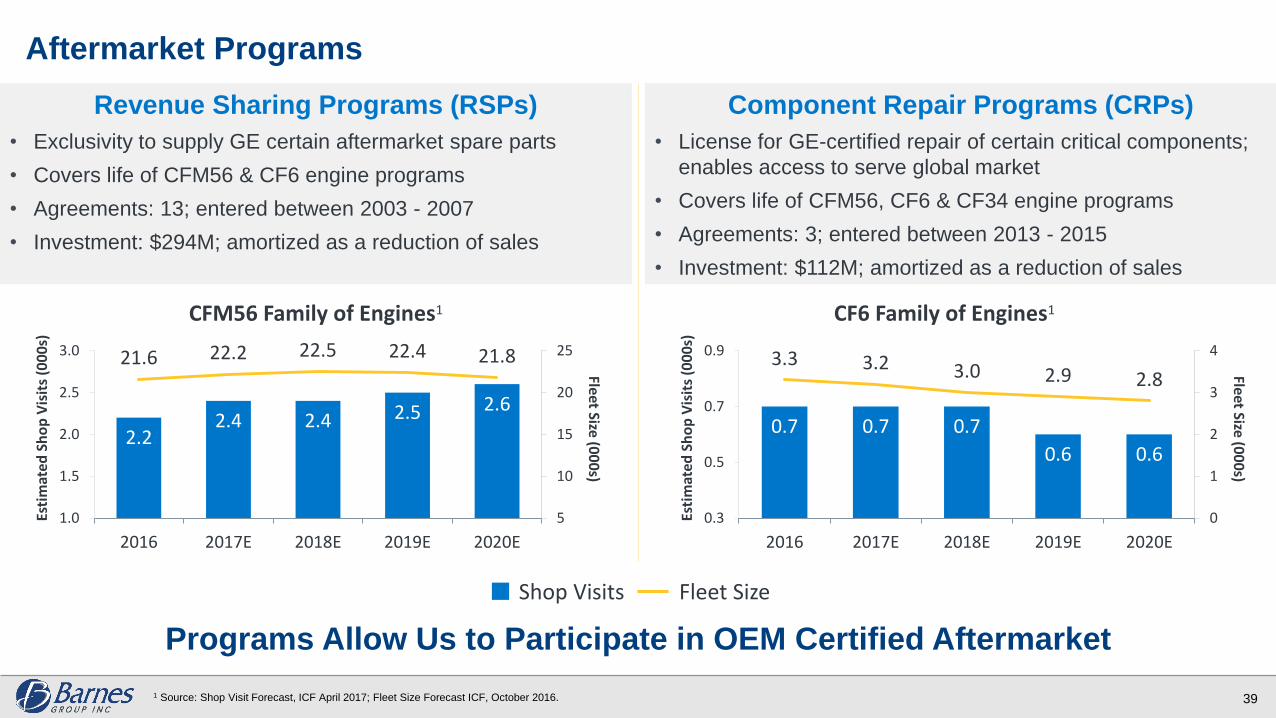
Aftermarket Programs
39
Revenue Sharing Programs (RSPs)
• Exclusivity to supply GE certain aftermarket spare parts
• Covers life of CFM56 & CF6 engine programs
• Agreements: 13; entered between 2003 - 2007
• Investment: $294M; amortized as a reduction of sales
Component Repair Programs (CRPs)
• License for GE-certified repair of certain critical components;
enables access to serve global market
• Covers life of CFM56, CF6 & CF34 engine programs
• Agreements: 3; entered between 2013 - 2015
• Investment: $112M; amortized as a reduction of sales
Programs Allow Us to Participate in OEM Certified Aftermarket
Shop Visits Fleet Size
1 Source: Shop Visit Forecast, ICF April 2017; Fleet Size Forecast ICF, October 2016.
2.22.4 2.4 2.5 2.6
21.6 22.2 22.5 22.4 21.8
5
10
15
20
25
1.0
1.5
2.0
2.5
3.0
2016 2017E 2018E 2019E 2020E
Fleet Size (00
0s)
Esti
mat
ed S
ho
p V
isit
s (0
00
s)
CFM56 Family of Engines1
0.7 0.7 0.7
0.6 0.6
3.3 3.2 3.0 2.9 2.8
0
1
2
3
4
0.3
0.5
0.7
0.9
2016 2017E 2018E 2019E 2020E
Fleet Size (00
0s)
Esti
mat
ed S
ho
p V
isit
s (0
00
s)
CF6 Family of Engines1
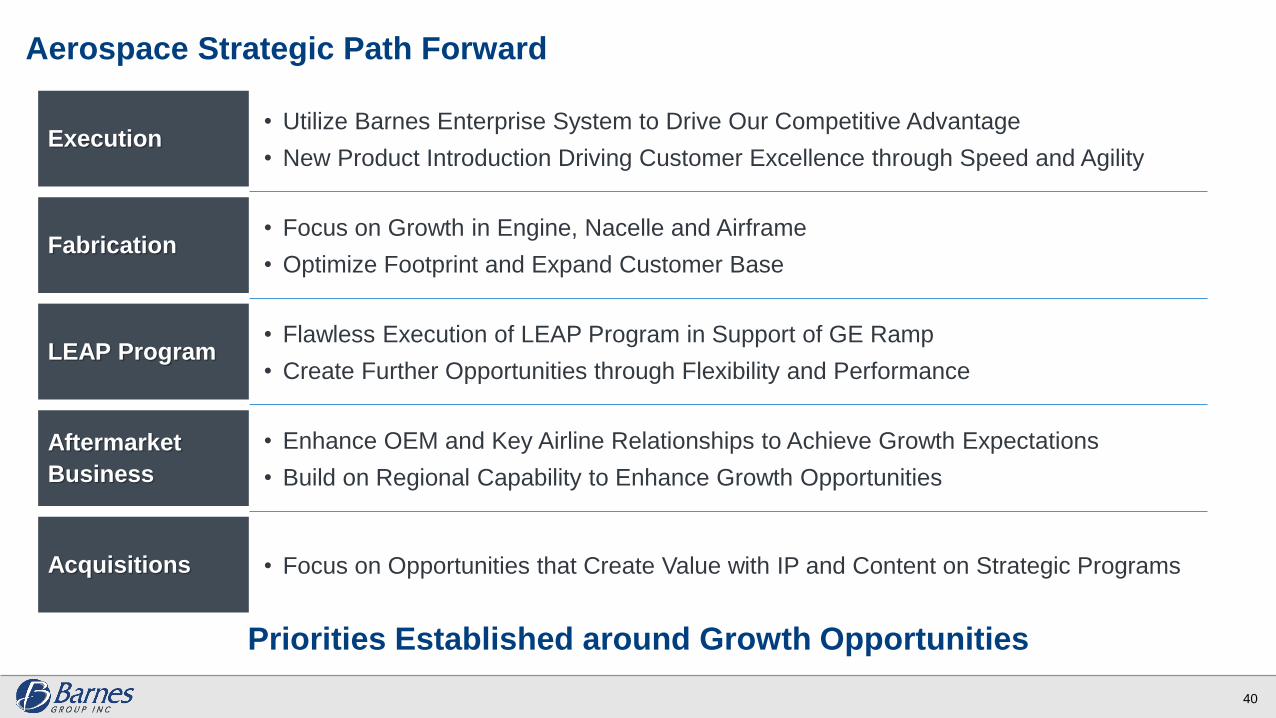
Aerospace Strategic Path Forward
Priorities Established around Growth Opportunities
40
Execution• Utilize Barnes Enterprise System to Drive Our Competitive Advantage
• New Product Introduction Driving Customer Excellence through Speed and Agility
• Focus on Growth in Engine, Nacelle and Airframe
• Optimize Footprint and Expand Customer BaseFabrication
• Flawless Execution of LEAP Program in Support of GE Ramp
• Create Further Opportunities through Flexibility and PerformanceLEAP Program
Aftermarket
Business
• Enhance OEM and Key Airline Relationships to Achieve Growth Expectations
• Build on Regional Capability to Enhance Growth Opportunities
• Focus on Opportunities that Create Value with IP and Content on Strategic ProgramsAcquisitions
Why Invest In Barnes Group?
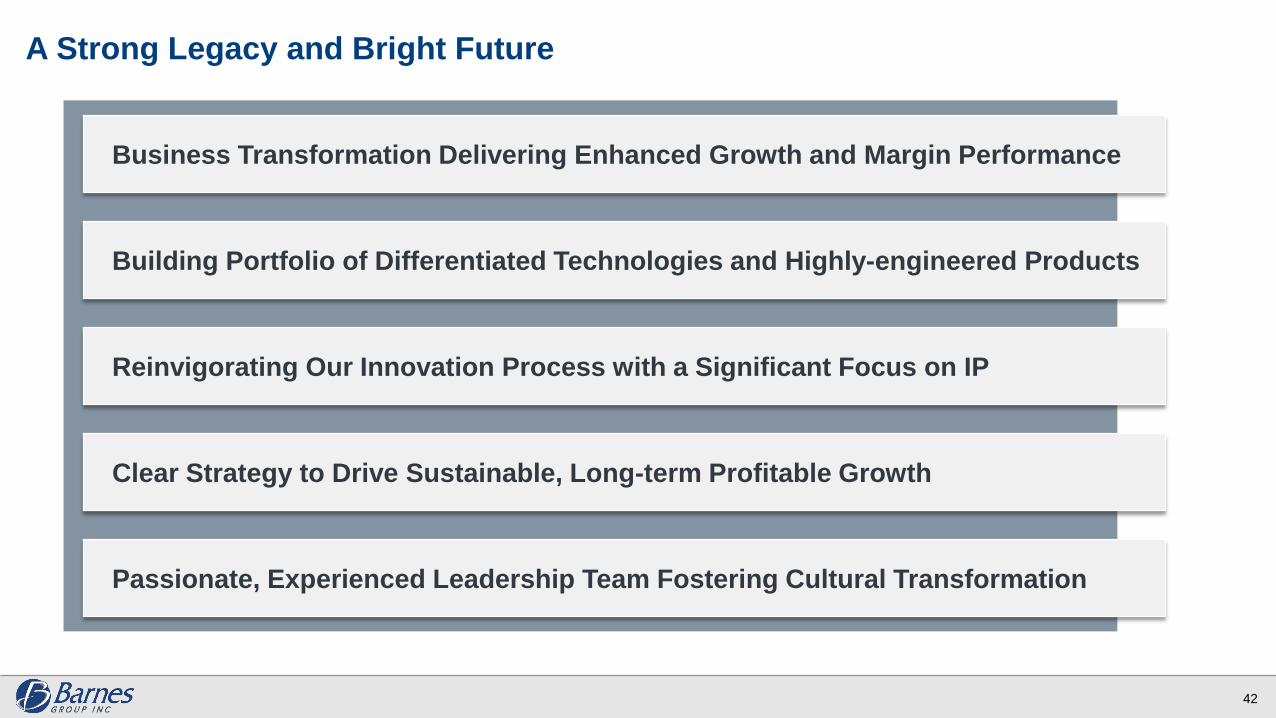
A Strong Legacy and Bright Future
42
Business Transformation Delivering Enhanced Growth and Margin Performance
Building Portfolio of Differentiated Technologies and Highly-engineered Products
Reinvigorating Our Innovation Process with a Significant Focus on IP
Clear Strategy to Drive Sustainable, Long-term Profitable Growth
Passionate, Experienced Leadership Team Fostering Cultural Transformation
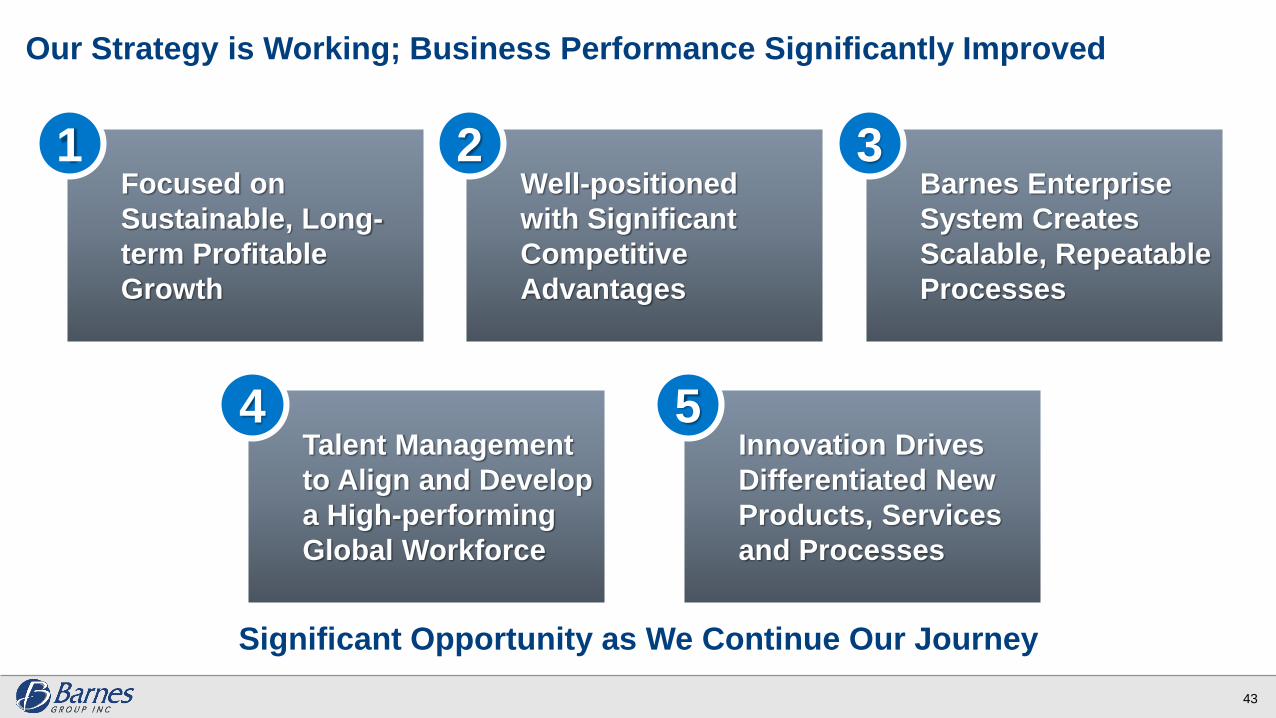
Our Strategy is Working; Business Performance Significantly Improved
Significant Opportunity as We Continue Our Journey
43
Focused on
Sustainable, Long-
term Profitable
Growth
1Well-positioned
with Significant
Competitive
Advantages
2Barnes Enterprise
System Creates
Scalable, Repeatable
Processes
3
Talent Management
to Align and Develop
a High-performing
Global Workforce
Innovation Drives
Differentiated New
Products, Services
and Processes
4 5

Appendix
Forward-Looking Statements
This presentation contains forward-looking statements as defined in the Private Securities Litigation Reform Act of 1995. Forward-looking statements
often address our expected future operating and financial performance and financial condition, and often contain words such as "anticipate,"
"believe," "expect," "plan," "estimate," "project," and similar terms. These forward-looking statements do not constitute guarantees of future
performance and are subject to a variety of risks and uncertainties that may cause actual results to differ materially from those expressed in the
forward-looking statements. These include, among others: difficulty maintaining relationships with employees, including unionized employees,
customers, distributors, suppliers, business partners or governmental entities; failure to successfully negotiate collective bargaining agreements or
potential strikes, work stoppages or other similar events; difficulties leveraging market opportunities; changes in market demand for our products and
services; rapid technological and market change; the ability to protect intellectual property rights; introduction or development of new products or
transfer of work; higher risks in global operations and markets; the impact of intense competition; acts of terrorism, cybersecurity attacks or intrusions
that could adversely impact our businesses; uncertainties relating to conditions in financial markets; currency fluctuations and foreign currency
exposure; future financial performance of the industries or customers that we serve; our dependence upon revenues and earnings from a small
number of significant customers; a major loss of customers; inability to realize expected sales or profits from existing backlog due to a range of
factors, including changes in customer sourcing decisions, material changes, production schedules and volumes of specific programs; the impact of
government budget and funding decisions; the impact of new or revised tax laws and regulations; changes in raw material or product prices and
availability; integration of acquired businesses; restructuring costs or savings; the continuing impact of prior acquisitions and divestitures; and any
other future strategic actions, including acquisitions, divestitures, restructurings, or strategic business realignments, and our ability to achieve the
financial and operational targets set in connection with any such actions; the outcome of pending and future legal, governmental, or regulatory
proceedings and contingencies and uninsured claims; product liabilities; future repurchases of common stock; future levels of indebtedness; and
numerous other matters of a global, regional or national scale, including those of a political, economic, business, competitive, environmental,
regulatory and public health nature; and other risks and uncertainties described in documents filed with or furnished to the Securities and Exchange
Commission ("SEC") by the Company, including, among others, those in the Management's Discussion and Analysis of Financial Condition and
Results of Operations and Risk Factors sections of the Company's filings. The Company assumes no obligation to update its forward-looking
statements.
45
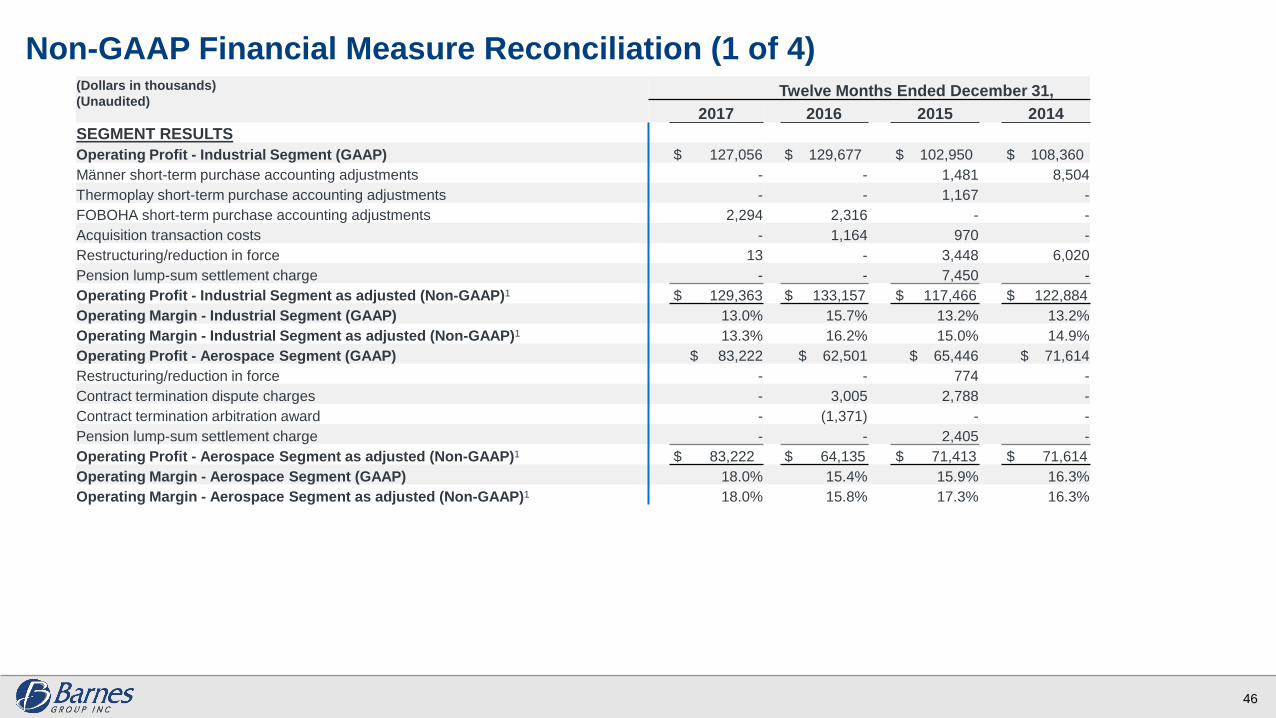
Non-GAAP Financial Measure Reconciliation (1 of 4)Unaudited)
46
(Dollars in thousands)
(Unaudited)Twelve Months Ended December 31,
2017 2016 2015 2014
SEGMENT RESULTS
Operating Profit - Industrial Segment (GAAP) $ 127,056 $ 129,677 $ 102,950 $ 108,360
Männer short-term purchase accounting adjustments - - 1,481 8,504
Thermoplay short-term purchase accounting adjustments - - 1,167 -
FOBOHA short-term purchase accounting adjustments 2,294 2,316 - -
Acquisition transaction costs - 1,164 970 -
Restructuring/reduction in force 13 - 3,448 6,020
Pension lump-sum settlement charge - - 7,450 -
Operating Profit - Industrial Segment as adjusted (Non-GAAP)1 $ 129,363 $ 133,157 $ 117,466 $ 122,884
Operating Margin - Industrial Segment (GAAP) 13.0% 15.7% 13.2% 13.2%
Operating Margin - Industrial Segment as adjusted (Non-GAAP)1 13.3% 16.2% 15.0% 14.9%
Operating Profit - Aerospace Segment (GAAP) $ 83,222 $ 62,501 $ 65,446 $ 71,614
Restructuring/reduction in force - - 774 -
Contract termination dispute charges - 3,005 2,788 -
Contract termination arbitration award - (1,371) - -
Pension lump-sum settlement charge - - 2,405 -
Operating Profit - Aerospace Segment as adjusted (Non-GAAP)1 $ 83,222 $ 64,135 $ 71,413 $ 71,614
Operating Margin - Aerospace Segment (GAAP) 18.0% 15.4% 15.9% 16.3%
Operating Margin - Aerospace Segment as adjusted (Non-GAAP)1 18.0% 15.8% 17.3% 16.3%
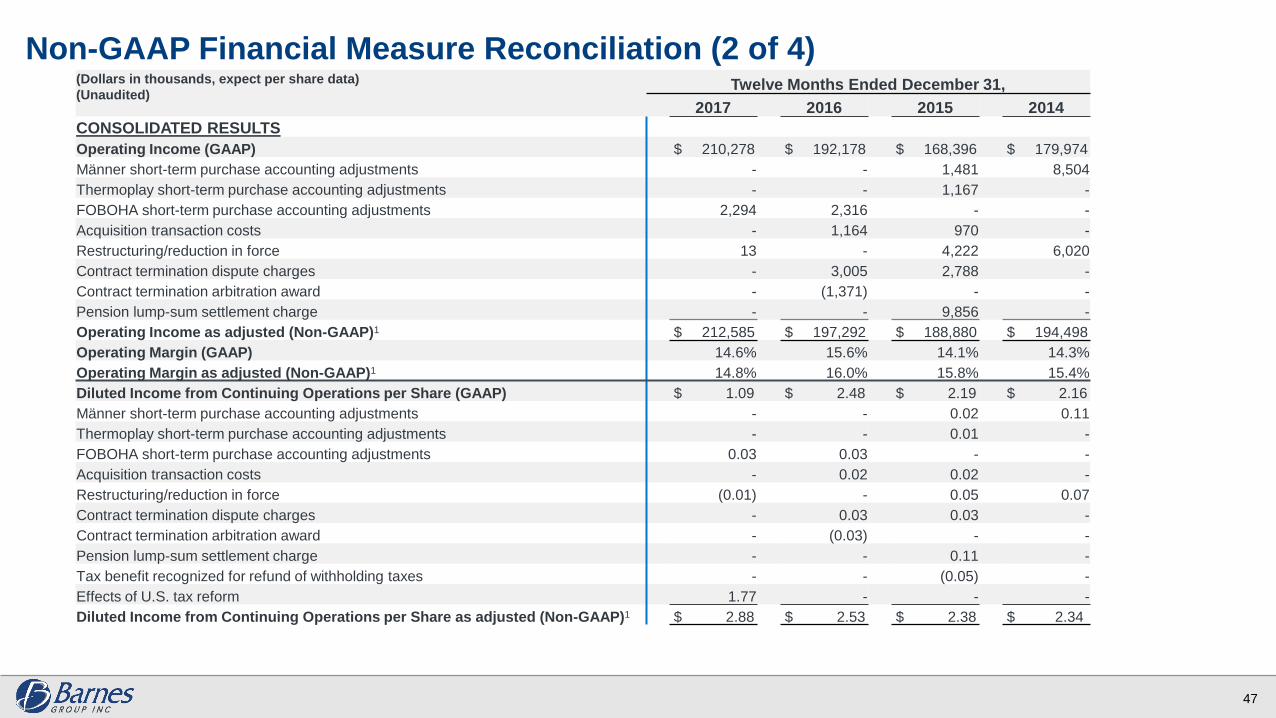
Non-GAAP Financial Measure Reconciliation (2 of 4))
47
(Dollars in thousands, expect per share data)
(Unaudited)Twelve Months Ended December 31,
2017 2016 2015 2014
CONSOLIDATED RESULTS
Operating Income (GAAP) $ 210,278 $ 192,178 $ 168,396 $ 179,974
Männer short-term purchase accounting adjustments - - 1,481 8,504
Thermoplay short-term purchase accounting adjustments - - 1,167 -
FOBOHA short-term purchase accounting adjustments 2,294 2,316 - -
Acquisition transaction costs - 1,164 970 -
Restructuring/reduction in force 13 - 4,222 6,020
Contract termination dispute charges - 3,005 2,788 -
Contract termination arbitration award - (1,371) - -
Pension lump-sum settlement charge - - 9,856 -
Operating Income as adjusted (Non-GAAP)1 $ 212,585 $ 197,292 $ 188,880 $ 194,498
Operating Margin (GAAP) 14.6% 15.6% 14.1% 14.3%
Operating Margin as adjusted (Non-GAAP)1 14.8% 16.0% 15.8% 15.4%
Diluted Income from Continuing Operations per Share (GAAP) $ 1.09 $ 2.48 $ 2.19 $ 2.16
Männer short-term purchase accounting adjustments - - 0.02 0.11
Thermoplay short-term purchase accounting adjustments - - 0.01 -
FOBOHA short-term purchase accounting adjustments 0.03 0.03 - -
Acquisition transaction costs - 0.02 0.02 -
Restructuring/reduction in force (0.01) - 0.05 0.07
Contract termination dispute charges - 0.03 0.03 -
Contract termination arbitration award - (0.03) - -
Pension lump-sum settlement charge - - 0.11 -
Tax benefit recognized for refund of withholding taxes - - (0.05) -
Effects of U.S. tax reform 1.77 - - -
Diluted Income from Continuing Operations per Share as adjusted (Non-GAAP)1 $ 2.88 $ 2.53 $ 2.38 $ 2.34
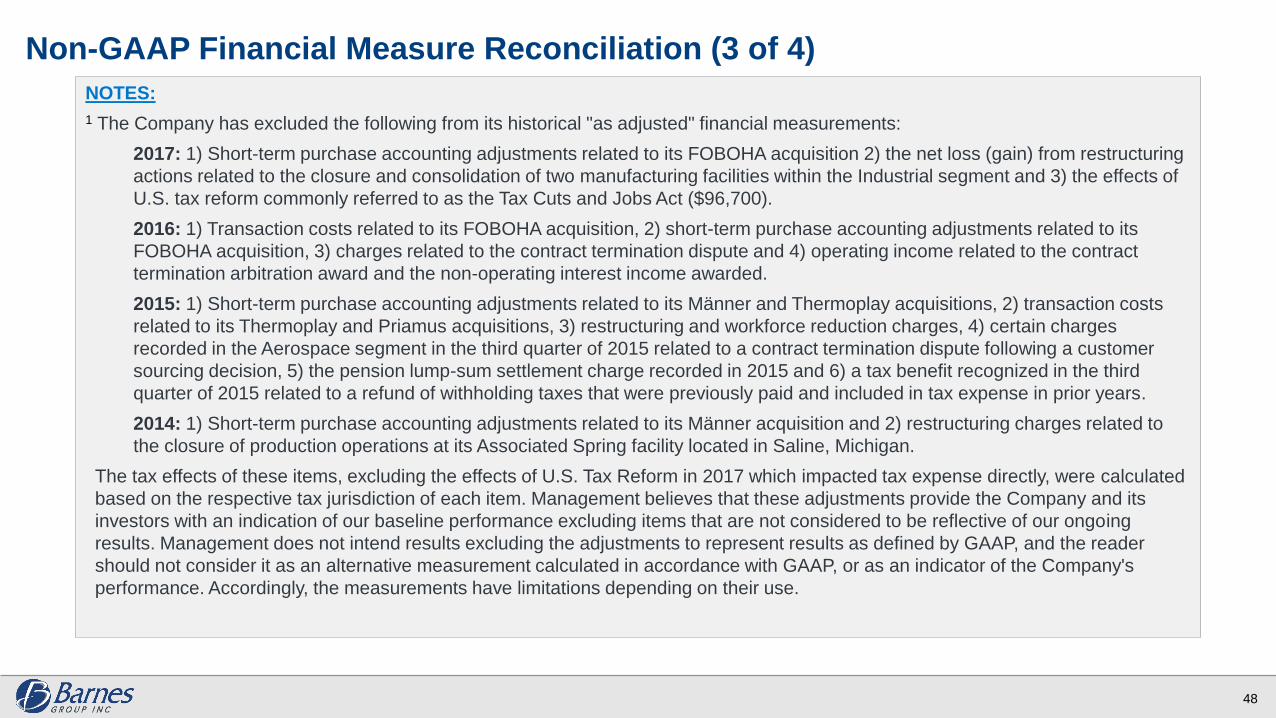
NOTES:
1 The Company has excluded the following from its historical "as adjusted" financial measurements:
2017: 1) Short-term purchase accounting adjustments related to its FOBOHA acquisition 2) the net loss (gain) from restructuring
actions related to the closure and consolidation of two manufacturing facilities within the Industrial segment and 3) the effects of
U.S. tax reform commonly referred to as the Tax Cuts and Jobs Act ($96,700).
2016: 1) Transaction costs related to its FOBOHA acquisition, 2) short-term purchase accounting adjustments related to its
FOBOHA acquisition, 3) charges related to the contract termination dispute and 4) operating income related to the contract
termination arbitration award and the non-operating interest income awarded.
2015: 1) Short-term purchase accounting adjustments related to its Männer and Thermoplay acquisitions, 2) transaction costs
related to its Thermoplay and Priamus acquisitions, 3) restructuring and workforce reduction charges, 4) certain charges
recorded in the Aerospace segment in the third quarter of 2015 related to a contract termination dispute following a customer
sourcing decision, 5) the pension lump-sum settlement charge recorded in 2015 and 6) a tax benefit recognized in the third
quarter of 2015 related to a refund of withholding taxes that were previously paid and included in tax expense in prior years.
2014: 1) Short-term purchase accounting adjustments related to its Männer acquisition and 2) restructuring charges related to
the closure of production operations at its Associated Spring facility located in Saline, Michigan.
The tax effects of these items, excluding the effects of U.S. Tax Reform in 2017 which impacted tax expense directly, were calculated
based on the respective tax jurisdiction of each item. Management believes that these adjustments provide the Company and its
investors with an indication of our baseline performance excluding items that are not considered to be reflective of our ongoing
results. Management does not intend results excluding the adjustments to represent results as defined by GAAP, and the reader
should not consider it as an alternative measurement calculated in accordance with GAAP, or as an indicator of the Company's
performance. Accordingly, the measurements have limitations depending on their use.
Non-GAAP Financial Measure Reconciliation (3 of 4)s
48
Non-GAAP Financial Measure Reconciliation (4 of 4)
49
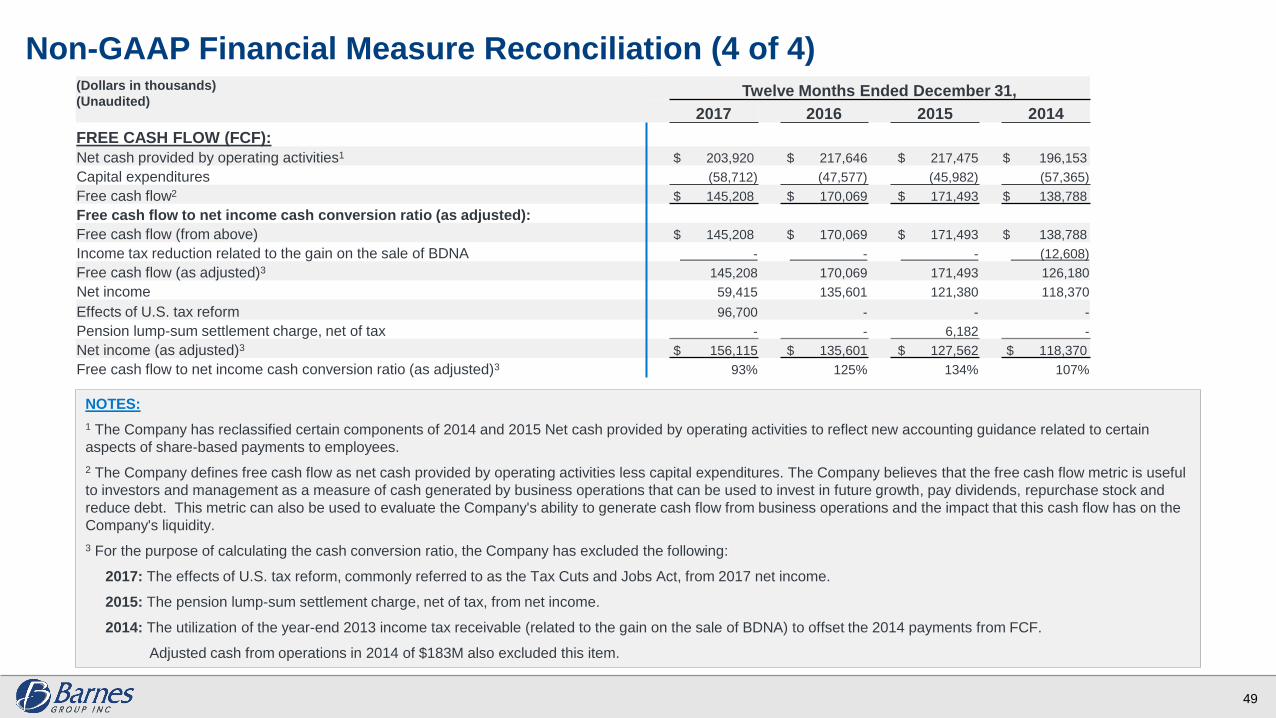
(Dollars in thousands)
(Unaudited)Twelve Months Ended December 31,
2017 2016 2015 2014
FREE CASH FLOW (FCF):
Net cash provided by operating activities1 $ 203,920 $ 217,646 $ 217,475 $ 196,153
Capital expenditures (58,712) (47,577) (45,982) (57,365)
Free cash flow2 $ 145,208 $ 170,069 $ 171,493 $ 138,788
Free cash flow to net income cash conversion ratio (as adjusted):
Free cash flow (from above) $ 145,208 $ 170,069 $ 171,493 $ 138,788
Income tax reduction related to the gain on the sale of BDNA - - - (12,608)
Free cash flow (as adjusted)3 145,208 170,069 171,493 126,180
Net income 59,415 135,601 121,380 118,370
Effects of U.S. tax reform 96,700 - - -
Pension lump-sum settlement charge, net of tax - - 6,182 -
Net income (as adjusted)3 $ 156,115 $ 135,601 $ 127,562 $ 118,370
Free cash flow to net income cash conversion ratio (as adjusted)3 93% 125% 134% 107%
NOTES:
1 The Company has reclassified certain components of 2014 and 2015 Net cash provided by operating activities to reflect new accounting guidance related to certain
aspects of share-based payments to employees.
2 The Company defines free cash flow as net cash provided by operating activities less capital expenditures. The Company believes that the free cash flow metric is useful
to investors and management as a measure of cash generated by business operations that can be used to invest in future growth, pay dividends, repurchase stock and
reduce debt. This metric can also be used to evaluate the Company's ability to generate cash flow from business operations and the impact that this cash flow has on the
Company's liquidity.
3 For the purpose of calculating the cash conversion ratio, the Company has excluded the following:
2017: The effects of U.S. tax reform, commonly referred to as the Tax Cuts and Jobs Act, from 2017 net income.
2015: The pension lump-sum settlement charge, net of tax, from net income.
2014: The utilization of the year-end 2013 income tax receivable (related to the gain on the sale of BDNA) to offset the 2014 payments from FCF.
Adjusted cash from operations in 2014 of $183M also excluded this item.