company insight havl in equity november 19, 2015...
TRANSCRIPT

Ambit Capital and / or its affiliates do and seek to do business including investment banking with companies covered in its research reports. As a result, investors should be aware that Ambit Capital may have a conflict of interest that could affect the objectivity of this report. Investors should not consider this report as the only factor in making their investment decision.
Premium brand at economy price!
Havells’ stock price fell by 15% in the past one year, underperforming the Sensex by 7% and peers by 18%; standalone business consequently trades at FY17E P/E of 25x; 3% discount to peers. This is despite it being a market leader with 59% ROIC in FY16-17 vs 25% for peers. Whilst the industry is unlikely to grow in FY16, Havells should gain market share led by: (a) streamlining of discounts; (b) marginalisation of new players; and (c) strengthening its product portfolio. With Sylvania no longer a guzzler (meagre debt of Euro27mn), we expect standalone RoE to improve from 21% in FY15 to 24% in FY18. Upgrade to BUY with a TP of `296/share (implied FY17E P/E of 28x and 10% premium to peers).
Competitive position: STRONG Changes to this position: POSITIVE Marginalisation of new players to benefit Havells Competitive intensity is likely to ease, with new players struggling to survive given sub-par products and poor after-sales service; corroborated from our recent trip to Ace Tech exhibition in Mumbai wherein the products of new players were lackluster. Further, they do not have sufficient product-serving staff and relevant technical know-how which amplifies their problems. Online platforms are not a threat as Havells has strengthened its presence herein; also entered into agreement with them for not selling below market operating price. Streamlining discounts and new products to aid market share Finally Havells is moving away from giving extra discounts to large distributors (20% of overall market) to a uniform discount policy. This should lead to market share gains, as streamlining of discounts leads to reduction in price wars, thereby developing trust amidst the distributor community. Alongside, Havells has improved its product portfolio by launching new SKUs to consolidate its position in a weak market. Sylvania no longer a guzzler; RoE set to improve Havells may not pump more fund into Sylvania, as the latter’s net debt has reduced to Euro27mn (from 172mn in FY08) in Sept’15. Consequently, Sylvania is likely to report positive FCFE from FY17; note it has been FCF positive since FY12. Havells should spend extra cash on increasing dividend/strengthening its portfolio; thus standalone ROE should improve from 21% in FY15 to 24% in FY18
Valuations: Market leader trading at 3% discount to peers Havells’ standalone franchise is trading at 3% discount to peers on FY17 P/E (vs 20% premium a year ago) despite it being a market leader with average RoIC of 59% in FY16-17 vs 25% for peers and EPS CAGR of 16% vs peers’ 23%. Our fair value of `285/share for standalone implies FY17E P/E of 28x; paint companies trade at 38x FY17 P/E despite lower FY16-17 ROIC of 30% v/s Havells’ standalone 59%.
COMPANY INSIGHT HAVL IN EQUITY November 19, 2015
Havells IndiaBUY
Capital Goods
Recommendation Mcap (bn): `160/US$2.4 6M ADV (mn): `236/US$3.6 CMP: `263 TP (12 mths): `296 Upside (%): 13
Flags Accounting: AMBER Predictability: GREEN Earnings Momentum: GREEN
Catalysts
Gross margin improvement by 150bps over FY15-18E
Marginalisation of new players over FY15-17E
Performance (%)
Source: Bloomberg, Ambit Capital Research
75
85
95
105
115
Nov
-14
Jan-
15
Mar
-15
May
-15
Jul-
15
Sep-
15
Nov
-15
Sensex Havells
Analyst Details
Bhargav Buddhadev
+91 22 3043 3252 [email protected]
Deepesh Agarwal
+91 22 3043 3275
Key financials – Consolidated unless specified YE March (̀ mn) FY14 FY15 FY16E FY17E FY18E
Operating income 81,858 85,694 85,339 92,679 101,848
EBITDA (%) 9.1 8.4 10.2 11.5 12.2
EPS (`) 7.2 6.2 8.1 10.7 12.9
RoE (%) 28.7 22.1 25.8 29.1 30.4
Standalone RoIC (%) 54.0 52.1 53.6 65.2 75.0
P/E (x) 36.8 42.6 32.5 24.7 20.3
Standalone P/E (x) 32.8 33.4 31.3 24.9 20.4
Source: Company, Ambit Capital research

Havells India
November 19, 2015 Ambit Capital Pvt. Ltd. Page 2
TTM has been tough period for Havells Havells standalone’s TTM revenue/EBITDA growth has decelerated from 15%/16% in 2QFY15 to 2%/5% in 2QFY16, extremely weak when compared with 14%/18% revenue/EBITDA CAGR over FY10-15. However, this trend is also visible for its peers Bajaj Electricals, Crompton Greaves, Finolex, V-Guard and Orient which reported deceleration in revenue and EBITDA growth in TTM as seen below.
Exhibit 1: Light electrical companies have reported deceleration in revenue/EBITDA since 2QFY15
TTM growth YoY (%) FY14 FY15 FY16
1Q 2Q 3Q 4Q 1Q 2Q 3Q 4Q 1Q 2Q
Revenue
Havells (standalone) 11% 13% 12% 12% 17% 15% 14% 11% 6% 2%
Bajaj# 15% 16% 12% 7% 8% 4% 2% 2% -1% 0%
Crompton# 22% 21% 18% 12% 8% 7% 7% 12% 13% 12%
Finolex 9% 5% 4% 4% 3% 5% 4% 4% 4% 1%
V-Guard 28% 21% 14% 11% 10% 13% 16% 11% 11% 6%
Orient# 18% 17% 22% 25% 29% 29% 18% 5% 2% 2%
Median (excl. Havells) 18% 17% 14% 11% 8% 7% 7% 5% 4% 2%
EBITDA
Havells (standalone) 14% 16% 18% 23% 22% 16% 12% 10% 6% 5%
Bajaj* 32% 34% 29% 10% -38% -25% -28% -30% 81% 22%
Crompton* 14% 16% 18% 23% 22% 16% 12% 10% 6% -22%
Finolex 5% 13% 15% 21% 23% 19% 17% 21% 24% 15%
V-Guard 23% 9% 8% 11% 12% 11% 17% 7% 11% 7%
Orient* 2% -13% -13% 12% 24% 35% 24% 8% 3% -3%
Median (excl. Havells) 14% 11% 12% 17% 22% 17% 17% 9% 9% 2%
Source: Company, Ambit Capital research, Note -#we take relevant segmental revenue growth * we take relevant segmental EBIT growth instead of EBITDA growth, TTM – trailing twelve months
Several reasons for Havells’ sluggish performance were:
Volatile copper prices: Copper prices have declined by 20% YoY in the last 12 months, leading to companies taking price cuts in cables and wires (where copper is the main raw material) in the range of 12-13%. This impacts revenue growth, as cables and wires is the largest revenue contributor for light electrical companies; even for Havells, cables and wires contribute to 42% of standalone revenue. Moreover, declining copper prices also leads to inventory destocking in the channel which impacts volume growth.
Exhibit 2: Copper prices have slid by 20% in the last twelve months
Source: Bloomberg, Ambit Capital research
Exhibit 3: This impacts revenue growth as cables and wires is the largest selling category for light electrical companies `bn unless specified FY15 Share in total (%)
Domestic switchgears 25 4%
Industrial switchgears 38 6%
Switches 25 4%
Electric cables and wires 219 33%
Lighting 86 13%
Luminaries 78 12%
Consumer durables 139 21%
Fans 60 9%
Light Electrical industry 671 100%
Source: Industry, Ambit Capital research
310
330
350
370
390
410
430
May
-15
May
-15
May
-15
Jun-
15
Jun-
15
Jul-
15
Jul-
15
Aug
-15
Aug
-15
Sep-
15
Sep-
15
Oct
-15
Oct
-15
Oct
-15
MCX copper spot (Rs/kg)
Copper prices have declined by 20% YoY in the last twelve months, leading to companies taking price cuts in cables and wires in the range of 12%-13%. Copper prices have declined by 20% YoY in the last 12 months, leading to companies taking price cuts in cables and wires in the range of 12-13%.

Havells India
November 19, 2015 Ambit Capital Pvt. Ltd. Page 3
Weak real estate demand especially in north India led by NCR: Real estate demand (largest demand driver for the light electrical companies) has seen a sharp dip over FY11-15 due to: (a) NDA government’s attack on Black money with its draconian Black Money Bill which went live on 1st July 2015 (Refer our Real Estate thematic dated 14 July 2015 (Click here); (b) disparity between gross rental yields and bank base rate deterring the interest of real estate property investors; and (c) overall deceleration in the economy impacting the demand for residential as well as office/manufacturing units.
Slump in real estate demand has impacted Havells more than its peers like Crompton, Finolex, Bajaj, V-Guard as the pace of deceleration is more acute in North India (North accounts for at least one-third of Havells’ standalone revenue) led by a sharp fall in the NCR. According to Knight Frank, it will take at least 14 quarters more to clear the pilled-up real estate inventory in the NCR region. Moreover as per our economy team, prices in NCR have crashed by ~18% over April 2014 to April 2015.
Exhibit 4: Real estate demand deceleration is more acute in NCR region as evident from the highest Quarter-to-SELL inventory…
Source: Knight Frank (as shown in the January 28 issue of the Mint: http://goo.gl/o7WMjz)
Exhibit 5: …and largest percentage fall in real estate prices in NCR region
Source: PropTiger, magic bricks and 99 acres, Ambit Capital research. Note: The YoY fall in prices is from April 2014- to April 2015.
18% 17% 17% 16%
12% 12%10% 9% 9%
7%5% 4% 3%
0%
8%
16%
24%
Gre
ater
Noi
da
Che
nnai
EC
R
Gir
gaon
, Mum
bai
Mam
bala
m,
Che
nnai
Mah
alax
mi,
Mum
bai
Noi
daG
reat
erN
oida
Dw
arka
, D
elhi
Jaya
naga
r,Be
ngal
uru
Mul
shi,
Pune
Bach
upal
ly,
Hyd
erab
ad
Nip
ania
, Ind
ore
Haz
ratg
anj,
Lukh
now
Nav
rang
pura
,A
hmed
abad
Fall
in r
ea
l est
ate
pri
ces
(Yo
Y ch
an
ge
, in
%)
Slump in real estate in North India has impacted Havells more than its peers as North India accounts for at least one-third of Havells’ standalone revenues

Havells India
November 19, 2015 Ambit Capital Pvt. Ltd. Page 4
Lost market share in lighting due to shift towards LEDs from CFL: Havells has lost market share in the lighting segment over FY12-15 as corroborated by Havells lower revenue CAGR in lighting at 10% over FY12-15 vs industry’s 17%. Even other listed organised players such as Crompton and Surya have registered a higher CAGR of 14% over FY12-15. Note, Bajaj is not comparable as it is losing market share due to roll out of Theory of constraint (TOC).
Market share loss for Havells may have been led by the fast pace transition of demand from CFL and traditional lighting to LED (as per ELCOMA, LED market has witnessed 68% CAGR over CY12-14 to `38bn vs 7% CAGR for CFL/traditional bulbs to `52bn in CY14). Whilst Havells has reasonable LED portfolio (due to experience of LED procurement for Sylvania), it has lost market share due to: (a) increase in share of Chinese and unorganised players as the quality control norms for LED in India are weak and no player is manufacturing LED in India entirely; and (b) Havells not participating in the government LED orders. Whilst this is a good strategy given the wafer thin margin in the government orders, this impacts the opportunity in the retail market as more than 80% of LEDs procured by government is sold in the retail market. Note, government orders are likely to account for 51% of the LEDs sold in CY15.
Exhibit 6: Havells has lost market share in lighting segment given its revenue CAGR of 10% over CY12-15 vs industry average of 17%...
`bn FY12 FY13 FY14 FY15 CAGR over FY12-15
Havells 5.5 6.7 7.2 7.4 10%
Organised listed Peers
- Crompton 6.7 7.7 9.1 9.8 14%
- Surya 7.7 9.1 10.8 11.5 14%
- Bajaj# 7.6 8.6 9.5 9.0 6%
Industry (as per Elcoma)* 101 117 135 160 17%
Source: Company, Elcoma, Ambit Capital research, Note – # Bajaj is not comparable as it is losing market share due to rollout of ToC, * we take CY11 as FY12 and so on
Havells has lost market share in lighting corroborated by revenue CAGR of 10% over FY12-15 vs industry CAGR of 17%
Market share loss is on account of (a) increase in share of Chinese and unorganised players and (b) Havells not participating in Government tenders

Havells India
November 19, 2015 Ambit Capital Pvt. Ltd. Page 5
However, the market leader is now taking corrective actions Streamlining discounts across various classes of distributors
Our interaction with large distributors suggest that Havells has started streamlining discounts across all classes of distributors vis-à-vis giving extra discount (in the range of 100bps to 300bps to top distributors (accounts for ~20% of Havells’ total revenues). This should lead to a rise in demand for Havells’ products from smaller distributors as they start pushing Havells’ products vis-à-vis other brands. Our interaction with a few small distributors suggests rising market share for Havells’ products in their sales. Whilst it is still not reflecting in Havells’ overall revenue, we believe it will happen gradually as these small multi-brand distributors start pushing Havells’ products which is easy for them given Havells’ strong brand-recall relative to peers.
Presently, the decline in sales to large distributors is because of no extra incentive offered over the small distributors now. Currently this is not being able to offset the growth from small distributors because these large distributors deal with only two to three brands unlike small who deal with multiple brands. With these large distributors now not pushing Havells; the impact on volume decline for Havells is higher currently which with time should get offset by the growth coming from small distributors.
Streamlining of discounts across distributors should also lead to reduction in price wars amidst the distributor community which augurs well for companies as it develops trust amidst the distributor community. The reason why Havells has chosen to streamline discount now and not earlier may be because Anil Gupta wants to institutionalize the business. Earlier under the leadership of Qimat Rai Gupta (QRG) this may not have been possible as he believed in extending favour to a class of large distributors with whom he enjoyed a special relationship.
The advantages of streamlining of discount are: (a) rise in profitability, (b) reduced dependence on people (risk of attrition is low) as business gets institutionalized and (c) improvement in working capital management as channel stuffing gets reduced.
Exhibit 7: QRG vs Anil Rai Gupta Era at Havells
Sr.No. QRG Era Anil Rai Gupta Era
1 Focus on push based model Focus on pull based model
2 Additional discount to large distributors on bulk orders
Streamlining discount across distributors irrespective of order size
3 Relationship driven nature of business Institutionalising the business
4 Focus on volumes Focus on profitability and working capital
Source: Industry, Ambit Capital research
Gross margin to improve as share of large distributors declines
Large distributors in Bhagirath palace and Lohar Chawl have started pushing other brands like Polycab, Bajaj (non-TOC area) and Crompton (especially under the new management) over Havells given no added incentive relative to that being offered by these other brands.
It is to be noted that Light Electrical products do not enjoy the same brand loyalty as paints which allows distributors to push products of companies which have given them a fair deal. This is corroborated from the top 5 paint companies enjoying a market share of 65% vs the top 5 players in light electrical enjoying market share of 30%. Moreover, these top-five players in the paints industry viz Asian Paints, Berger, Kansai Nerolac, Akzo Nobel and Shalimar Paints have remained the top five for ~15 years, with Asian Paints being the leader over this period. This is unlike Light Electricals, where after every 5-6 years a new player emerges and an incumbent who loses focus (Khaitan, Polar, Universal Cables, Cable Corporation of India, Osram etc) or develops friction with channel partners goes virtually out of business.
Our interaction with large distributors suggest that Havells has started streamlining discounts across all classes of distributor vis-à-vis giving extra discount to top distributors
Presently, the decline in sales to large distributors is not being able to offset the growth from small distributors given these large distributors deal with only two to three brands which is unlike the small who deal with multiple brands
The reason why Anil Gupta has chosen to do this is because he wants to institutionalize the business which was not possible under the QRG era
Large distributors in Bhagirath palace and Lohar Chawl are pushing other brands over Havells given no extra incentive relative to that being offered by peers
It is to be noted that Light Electrical products do not enjoy the same brand loyalty as paints which allows distributors to push products of companies which given them a fair deal

Havells India
November 19, 2015 Ambit Capital Pvt. Ltd. Page 6
Exhibit 8: Whilst top-five players dominate 65% of the market in Paints…
in % unless specified FY15
Industry size (̀ bn) 350
Asian Paints 35.0%
Berger 10.9%
Kansai Nerolac 10.1%
Akzo Nobel 7.2%
Shalimar Paints 1.2%
Market share of top five players 65%
Source: Industry, Company, Ambit Capital research
Exhibit 9: …the top-five players dominate only 30% of the market in light electricals
in % unless specified FY15
Industry size (̀ bn) 671
Havells 7.8%
Philips 6.4%
Polycab* 6.1%
Crompton 4.8%
Bajaj 4.4%
Market share of top five players 30%
Source: Source: Industry, Company, Ambit Capital research, Note – * we take FY14 revenue for Polycab as its FY15 financials are not available
Exhibit 10: Whilst the top-four players in paints have remained the same over the past 15 years, light electricals has seen significant churn in the top four players
Top players 15 years ago Top players currently
Paints Asian Paints, Berger, Kansai Nerolac, Akzo Nobel, Shalimar Paints
Asian Paints, Berger, Kansai Nerolac, Akzo Nobel
Light Electrical
Lighting Philips, Laxman Sylvania, Osram, Crompton, Fixo Light, Glow Light Philips, Bajaj, Havells, Crompton
Fans Polar, Khaitan, Crompton, Orient Crompton, Orient, Bajaj, Usha, Havells
Consumer appliances Sumit, Philips Bajaj, Philips, Crompton, Havells
Cables and Wires Cable Corporation of India, RPG cables, Universal cables, Netco, Gloster Cables
Polycab, Finolex Cables, Havells, Sterlite
Source: Industry, Ambit Capital research
Streamlining of discounts should aid in gross margin expansion given Havells is doing away with the additional discounts. The reason why despite lowering of discounts we model lower YoY gross margin in FY17 is on account of benefits from lower commodity prices accrued in FY16 fading off in FY17. In FY18 and FY19 we have modelled 20bps/10bps YoY improvement in gross margin.
Exhibit 11: We model higher gross margins for Havells over FY16-19….
Source: Company, Industry, Ambit Capital research
Havells has significantly improved its product portfolio in this market weakness thereby allowing it to at least ensure no loss in market share
Havells is using the current market slowdown to strengthen its product portfolio across various categories. This coupled with weak product offerings of new players (see next section for details) should lead to Havells at least maintaining market leadership. Havells has launched several new versions across SKUs in the last 12 months like (a) N frame series in switchgears; (b) Oro series in switches; (c) Magnum (steam iron), Attamatic (mixer) and Convenio (food processor) in domestic appliances;
34.3%
36.6% 37.2%38.5%
39.3%
41.1% 40.6% 40.8% 40.9%
30.0%
32.0%
34.0%
36.0%
38.0%
40.0%
42.0%
FY11
FY12
FY13
FY14
FY15
FY16
E
FY17
E
FY18
E
FY19
E
Gross margin (%)
Streamlining of discount should lead to gross margin expansion. We model 20bps/10bps YoY improvement in gross margin in FY18 and FY19
Havells is using the current market slowdown to strengthen its product portfolio by launching several new SKUs

Havells India
November 19, 2015 Ambit Capital Pvt. Ltd. Page 7
(d) Puro Plus and Monza EC in water heaters; and (e) Diva, E-lite and Lumeno in Lighting and luminaries. Whilst it is very difficult to decipher the appropriate timing on when will the industry recover; clearly Havells’ strategy of strengthening its product portfolio and luring distributors by streamlining discounts should augur well for its franchise especially in a weak market.
Exhibit 12: Havells’ N Frame Switchgear and Oro switches launched in 1QFY16
Source: Company, Industry, Ambit Capital research
Exhibit 13: Havells’ launched Convenio food processor in 2QFY15
Source: Company, Industry, Ambit Capital research
Exhibit 14: Havells’ launched Puro Plus Water heater in 2QFY16
Source: Company, Industry, Ambit Capital research
Exhibit 15: Havells’ launched Lumeno LED light in 1QFY16
Source: Company, Industry, Ambit Capital research
Exhibit 16: Havells has the large number of SKUs across price range Product Number of series (~) Total SKUs (~) Price Range
Switchgears 60 200 `185-16,500
Modular & Reo switches 30 300 `20-1200
Fans 100 600 `1,590-36,500
Consumer appliances 103 NA `800-15,000
Water heater 12 NA `2000-24000
Home decorative lighting 45 NA `350-3600
Luminaries 220 500 `100-3400
LED bulbs 2 40 `75-350
CFL bulbs and conventional light 6 40 `80-1400
Source: Company, Industry, Ambit Capital research, we take the number of SKU from the company’s price list

Havells India
November 19, 2015 Ambit Capital Pvt. Ltd. Page 8
Marginalisation of new players to benefit Havells Competitive intensity to decline as new players are offering weak product offerings: One of our SELL thesis (we were SELLers till 10 November 2015) on Havells has been market share loss to new players like Polycab, Luminous, Surya, Roshni, RR Kabel and Orient who have recently ventured into new product categories such as consumer appliances, fans, switches, switchgear, etc.
Exhibit 17: Several players in the last two years have introduced new product categories…
Company Flagship product New products added
RR Kabel Electrical Wires Fans
Polycab Electrical Wires Fans, lighting, switches, switchgears
Orient Fans Small appliances
Luminous Invertors Fans, switches, CFLs, switchgears
Anchor Switches Electrical cables, lighting, switchgears
Surya Roshni Lighting Fans, small appliances, water heaters
Source: Industry, Ambit Capital research
However, our recent channel checks suggest that these players are facing difficulties in promoting their products, given their inferior product quality (relative to Havells) and weak after-sales service. According to the channel partners, these companies neither have in-house manufacturing (except for Polycab in fans) nor credible sourcing partners. This is also corroborated from our recent visit to Ace-Tech exhibition in Mumbai wherein Polycab and RR Kabel’s new products were less impressive. Alongside the poor product quality, they do not have sufficient product serving staff and relevant technical know-how which amplifies their problems. Attrition is especially severe in companies like Polycab and RR Kabel where a large proportion of employees in the new product divisions are looking out for new jobs (as highlighted by distributors).
Exhibit 18: Most of the NEW players don’t have in-house manufacturing Company Product Manufacturing/outsourcing
Polycab Fans In-house
Polycab Switches, switchgear, Light Outsourced
RR Kabel Fans Outsourced
Orient Appliances Outsourced
Anchor Switchgear, cables In-house
Anchor Light Outsourced
Surya Fans, small appliances, water heater Outsourced
Source: Industry, Ambit Capital research
Our recent channel checks suggests that new players are facing difficulties in promoting their product portfolio given inferior product quality and weak after sales service

Havells India
November 19, 2015 Ambit Capital Pvt. Ltd. Page 9
Exhibit 19: RR Kabel’s fans portfolio is not impressive
Source: Industry, Ambit Capital research
Exhibit 20: …same is the case with Polycab’s switches
Source: Industry, Ambit Capital research
Bait of annual discount leading to channel partners pushing products of incumbents: Havells is likely to benefit if the sluggish demand prevails in 2HFY16 given the distributors may opt to push sales of incumbents to avail of the lucrative annual discounts (based on annual turnover). It is industry norm to give an additional annual discount of 1-2% (either in cash or kind such as foreign tour) of sales to distributors if they achieve their annual target turnover.
Our interactions with many large multi-brand distributors suggests that they have started pushing limited brands (which are also very popular with customers; Havells fits this) in the lure to avail annual discounts given the market weakness is not allowing them to meet their revenue budgets; hence focus is on improving profit margins by maximizing discounts. Consequently, Havells (with the leadership in market share; FY15 market share of 7.8%) becomes the natural beneficiary of distributors’ behaviour of maximising their annual commissions. Havells incidentally is also one of the dealer friendly companies as evident from the various incentive schemes offered by it.
Exhibit 21: Various incentive schemes offered by Havells
Scheme Description
Shahenshah scheme Dealers/distributors who have achieved their annual targets are credited with points which can be redeemed against foreign/domestic holidays
Prepaid shopping cards Prepaid shopping cards/gift card are given to dealers under this scheme
Channel Financing Bank funding is provided to dealers/distributors through introductions. Note Havells gives a recourse of 5-10% of the total exposure
Power plus loyalty Royalty points to channel partners, electricians and electrical contractors on purchase of Havells products
Travel incentives Free domestic/international tours are given to dealers under this scheme Mutual fund and insurance scheme
Mutual funds and insurance policies are awarded to dealers on achievement of the targets
In-kind incentives In-kind benefits such as gold coins, consumer appliances, etc. are given on achievement of the target
Source: Company, Industry, Ambit Capital research
Havells should benefit from sluggish demand given the distributors may opt to push sales of incumbents to avail of the lucrative annual discounts (based on annual turnover)

Havells India
November 19, 2015 Ambit Capital Pvt. Ltd. Page 10
Sylvania no longer a guzzler; RoE set to improve Havells’ investments in Sylvania lead to standalone ROE declining to 21% in FY15 vs 47% in FY07 Havells’ investment in Sylvania increased five-fold to `10bn in FY15 (48% of standalone capital employed) since FY07. This is despite average loss of `1.2bn over FY08-15, translating into a dismal ROI of -14% in FY15 and -17% over FY08-15. Whilst Sylvania turned into black with APAT of `417mn in FY11 and `617mn in FY12, it again slipped into the red, with adjusted loss after tax of `289mn in FY14 and `1.4bn in FY15. Exhibit 22: Consistent increase in Havells’ investment in Sylvania led to Havells’ standalone RoE declining from 47% in FY07 to 21% in FY15 as…
Source: Company, Ambit Capital research
Exhibit 23: …Sylvania continued to incur losses
Source: Company, Ambit Capital research, Note we calculate Sylvania’s financials as consolidated minus (-) standalone; we have adjusted PAT for one-time cost in FY09
Management commits to no more investment in Sylvania; debt reduced to Euro26.6mn Management in the 2QFY16 conference call committed that Sylvania would not need any further cash support from Havells standalone (baring challenging year of FY16) given that the Sylvania’s net debt has already declined to Euro26.6mn (from Euro171.6mn in FY08). With no plans to incur any green-field capex in Sylvania and our expectation of Sylvania reporting total FCFE of `8mn in FY17 and `213mn in FY18 implies no further support from Havells. Note Sylvania has already become FCF positive from FY12 onwards and is likely to remain so given minimal capex requirements and given that it has been CFO positive since the time it has been acquired except for in FY08 and FY11.
0%
10%
20%
30%
40%
50%
60%
-
2
4
6
8
10
12
FY04
FY05
FY06
FY07
FY08
FY09
FY10
FY11
FY12
FY13
FY14
FY15
Investment in Sylvania (Rsbn)Standalone RoE (%) on RHS
-5.0
-4.0
-3.0
-2.0
-1.0
0.0
1.0
2.0
3.0
FY08
FY09
FY10
FY11
FY12
FY13
FY14
FY15
EBITDA (Rsbn) APAT (Rsbn) on RHS
Havells’ investment in Sylvania increased five-fold to `10bn in FY15 translating into ROI of -14% in FY15
Havells may not need to infuse any further funds in Sylvania given negligible net debt of Euro26.6mn and it being FCF positive since FY12

Havells India
November 19, 2015 Ambit Capital Pvt. Ltd. Page 11
Exhibit 24: Sylvania’s debt has declined significantly to a paltry Euro26.6mn at the end of FY15
Source: Company, Ambit Capital research
Exhibit 25: We expect Sylvania to be FCFE positive from FY18 implying no support from Havells
`mn CFO
(before WC investment)
CFO Capex Debt payment
Interest payment
FCFE
FY10 (2,120) 1,095 221 (2,449) (807) (1,940)
FY11 1,455 (886) (93) 306 (744) (1,418)
FY12 1,743 947 (152) (852) (770) (828)
FY13 3,275 2,563 (276) (257) (908) 1,121
FY14 1,512 2,156 (832) (1,502) (441) (619)
FY15 (131) 3,621 (49) (4,416) (436) (1,279)
FY16E 581 480 (150) (196) (293) (160)
FY17E 1,128 910 (150) (500) (252) 8
FY18E 1,105 1,105 (200) (500) (192) 213
Source: Company, Ambit Capital research
Consequently, we model standalone ROE to improve to 24% in FY18 vs 21% in FY15 Assuming no more capital infusion in Sylvania and only maintenance capex we assume an increase in dividend payout to 55% over FY17-19 vs 40% over FY14-16. Consequently, Havells standalone’ RoE is likely to improve to 24% in FY18 vs 21% in FY15 (and 21% over FY12-16E). Also on a consolidated basis, Havells’ ROE is expected to improve to 30% in FY18 vs 22% in FY15.
Exhibit 26: We model increase in dividend payout and consequent improvement in standalone ROE
Source: Company, Ambit Capital research
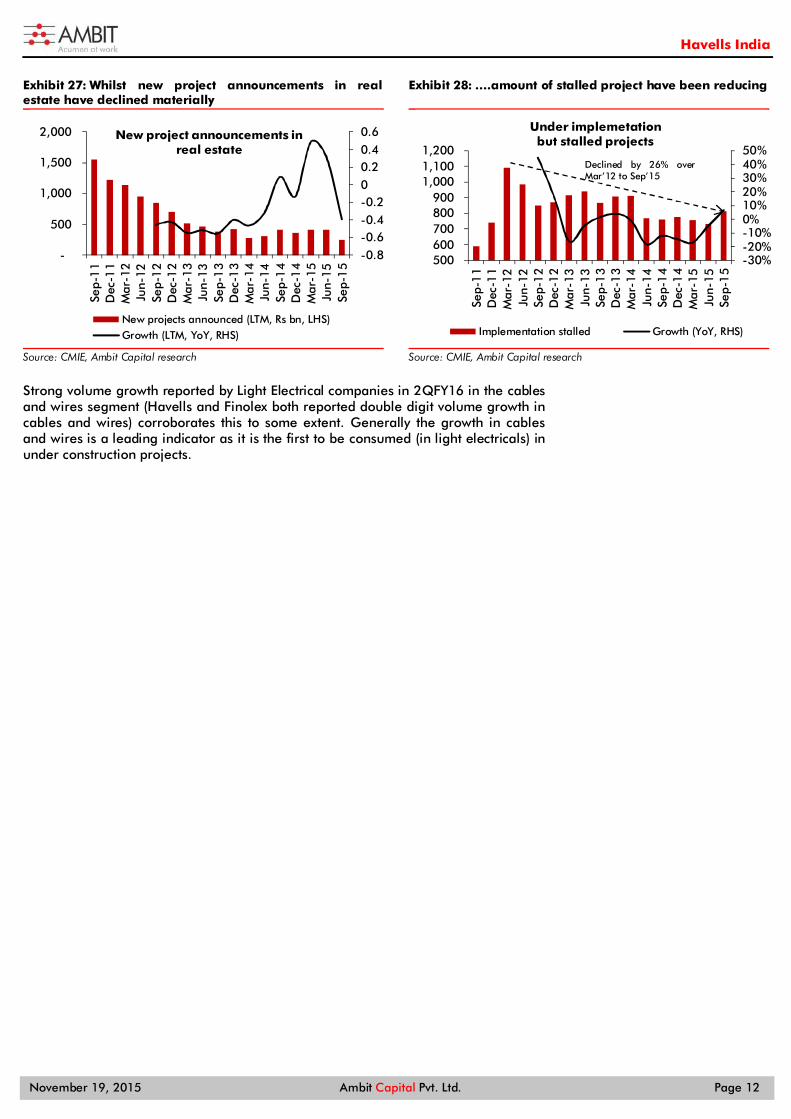
Pick-up in execution of under-construction real estate projects to benefit Light Electrical companies Our interactions with a few of the leading real estate developers suggest a pick-up in execution of under construction real estate projects. As per CMIE, number of stalled projects in real estate has seen a 17% decline in FY15. Given the clamp down on the black economy which has led to significant decline in land purchases and hence new launches (see exhibit below); real estate developers have no other option but to fast track execution of under construction projects which allows them to earn milestone linked payments.
0
306090
120
150180
Mar
-08
Sep-
08
Mar
-09
Sep-
09
Mar
-10
Sep-
10
Mar
-11
Sep-
11
Mar
-12
Sep-
12
Mar
-13
Sep-
13
Mar
-14
Sep-
14
Mar
-15
Sep-
15
Sylvania's net debt (Euromn)
17%
19%
21%
23%
25%
27%
29%
0%10%20%30%40%50%60%70%80%
FY12
FY13
FY14
FY15
FY16
E
FY17
E
FY18
E
FY19
E
FY20
E
FY21
E
FY22
E
Dividend Payout ratio (%) RoE (%) (RHS)
Our interactions with a few of the leading real estate developers suggest a pick-up in execution of under construction real estate projects. As per CMIE, number of stalled projects in real estate has seen a 17% decline in FY15
Havells India
November 19, 2015 Ambit Capital Pvt. Ltd. Page 12
Exhibit 27: Whilst new project announcements in real estate have declined materially
Source: CMIE, Ambit Capital research
Exhibit 28: ….amount of stalled project have been reducing
Source: CMIE, Ambit Capital research
Strong volume growth reported by Light Electrical companies in 2QFY16 in the cables and wires segment (Havells and Finolex both reported double digit volume growth in cables and wires) corroborates this to some extent. Generally the growth in cables and wires is a leading indicator as it is the first to be consumed (in light electricals) in under construction projects.
-0.8-0.6-0.4-0.200.20.40.6
-
500
1,000
1,500
2,000
Sep-
11
Dec
-11
Mar
-12
Jun-
12Se
p-1
2D
ec-1
2M
ar-1
3Ju
n-13
Sep-
13
Dec
-13
Mar
-14
Jun-
14Se
p-1
4D
ec-1
4M
ar-1
5Ju
n-15
Sep-
15
New project announcements in real estate
New projects announced (LTM, Rs bn, LHS)Growth (LTM, YoY, RHS)
-30%-20%-10%0%10%20%30%40%50%
500 600 700 800 900
1,000 1,100 1,200
Sep-
11
Dec
-11
Mar
-12
Jun-
12Se
p-1
2D
ec-1
2M
ar-1
3Ju
n-13
Sep-
13
Dec
-13
Mar
-14
Jun-
14Se
p-1
4D
ec-1
4M
ar-1
5Ju
n-15
Sep-
15
Under implemetation but stalled projects
Implementation stalled Growth (YoY, RHS)
Declined by 26% over Mar’12 to Sep’15

Havells India
November 19, 2015 Ambit Capital Pvt. Ltd. Page 13
Assumptions Exhibit 29: Key assumptions – Standalone
`mn unless specified FY14 FY15 FY16E FY17E FY18E Comments
Key assumptions
Switchgears
Revenue 12,192 12,790 13,430 15,224 17,337 Expect revenue growth to pick-up from FY17 onwards led by rise in market share and pick-up in execution of stalled real estate projects. We model 270bps improvement in EBIT margin in FY16 as Havells has already reported 220bps improvement in EBIT margin in 1HFY16 despite 2% decline in revenue.
YoY growth (%) 13.1% 4.9% 5.0% 13.4% 13.9%
EBIT margin 33.1% 34.3% 37.0% 37.0% 37.0%
Cables
Revenue 19,264 21,904 22,723 25,677 29,357 We model mid-single digit revenue growth in FY16 despite double digit volume growth in 1HFY16 given the ~12% YoY decline in realisation. For FY17 and FY18 we model double digit volume growth led by market share gains and pick-up in execution of under-construction projects
YoY growth (%) 13.8% 13.7% 3.7% 13.0% 14.3%
EBIT margin 11.0% 12.1% 13.0% 12.0% 11.5%
Lightings and Fixtures
Revenue 7,207 7,410 7,697 8,562 9,706 We expect revenue CAGR of 9.4% over FY15-18 vs 14.6% over FY10-15 given the shift in market towards LED. YoY growth (%) 8.3% 2.8% 3.9% 11.2% 13.4%
EBIT margin 24.8% 26.6% 23.0% 23.5% 24.0%
Consumer Durables
Revenue 8,534 10,283 11,517 13,544 15,776 We expect revenue growth to return to double digit in FY17 led by market share gains given introduction of many SKUs alongside Bajaj Electricals’ significant decline in market share due to roll out of TOC on a pan India basis
YoY growth (%) 8.1% 20.5% 12.0% 17.6% 16.5%
EBIT margin 27.0% 25.1% 27.0% 27.0% 27.0%
Unallocable expenses as a % of revenue 9.4% 10.5% 10.9% 9.6% 8.8%
We model a decline in unallocable expenses in FY17 and FY18 due to discontinuance of royalty payment to promoter from FY17 (impact ~70bps) and operating leverage due to higher growth.
Key estimates
Revenue 47,197 52,387 55,367 63,007 72,176 Based on above assumptions, we expect revenue CAGR of 11% over FY15-17 Sales (YoY growth) (%) 12% 11% 6% 14% 15%
Gross Profit 18,180 20,603 22,756 25,581 29,448 We model significant improvement in gross margin in FY16 led by weak commodity prices. We model 50bps decline in gross margin in FY17 as the benefits of lower raw material prices fade-away. For FY18, we expect 20bps improvement led by the benefits of streamlining discounts across distributors
Gross margin (%) 38.5% 39.3% 41.1% 40.6% 40.8%
Employee expenses 2,475 3,127 3,599 3,922 4,475
We expect pace of growth in employee expenses to decelerate from 24% over FY14-15 to 13% over FY15-18 as Havells recruited several territory sales managers during FY14-15 period which to a great extent is done now.
Other expenses 9,289 10,484 11,420 12,349 13,858
We expect other expenses as % revenue to decline from 20.6% in FY16E (similar to 1HFY16) to 19.6% in FY17 and 19.2% in FY18 given the discontinuance of royalty (impact ~70bps) and impact of favourable operating leverage
EBITDA 6,416 6,991 7,737 9,309 11,115 Consequently, we expect improvement in EBITDA margin in FY17
EBITDA margin (%) 13.6% 13.3% 14.0% 14.8% 15.4%
PBT 5,951 6,521 7,069 8,867 10,844 Consequently 18% CAGR in PBT
Tax rate (%) 19.6% 27.8% 29.0% 29.0% 29.0% Higher tax rate based on the management guidance
PAT 4,787 4,708 5,019 6,296 7,699 We expect PAT CAGR of 17% over FY15-17
PAT (YoY growth) (%) 28.9% -1.7% 6.6% 25.4% 22.3%
CFO 6,525 6,004 6,909 7,450 9,077 Consequently 15% CAGR in CFO
Capex 893 1,642 1,500 1,329 1,771 For FY17 we model maintenance capex as all the facilities except cables and wires are operating at less than 70%. From FY18, we model expansion capex
FCF 5,632 4,363 5,409 6,121 7,306 Consequently 18% CAGR in FCF
Cash conversion cycle
- Inventory days 53 48 48 48 48
We expect cash conversion cycle to remain flat at 28 days over FY15-18;
- Receivable days 11 9 9 9 9
- Payable days 36 29 29 29 29
Cash conversion cycle 28 28 28 28 28
Source: Ambit Capital research

Havells India
November 19, 2015 Ambit Capital Pvt. Ltd. Page 14
Exhibit 30: Key assumptions – Sylvania
`mn unless specified FY14 FY15 FY16E FY17E FY18E Comments
Sales 34,614 33,302 29,972 29,672 29,672 We model 10% YoY decline in Sylvania's revenue in FY16 given 7.5% YoY decline in 1HFY16 due to shift in market towards LED and impact of INR appreciation against Euro. For FY17 and FY18 we model flat growth
Sales (YoY growth) (%) 14.5% -3.8% -10.0% -1.0% 0.0%
Gross margin (%) 49.8% 50.4% 50.0% 50.0% 50.0% We model flat gross margin of 50% over FY16-17
Employee Cost as % of revenue 24.2% 26.3% 24.5% 24.0% 24.0% Led by the cost reduction measures undertaken Other operating expenditure as %
of revenue 22.3% 23.2% 22.4% 21.5% 21.5%
EBITDA 1,137 327 944 1,335 1,335 Consequent improvement in EBITDA margin
EBITDA margin (%) 3.3% 1.0% 3.1% 4.5% 4.5%
Interest expense 472 464 293 252 192 We model decline in interest expenses as Sylvania’s net debt has reduced from Euro57mn in Sept'14 to Euro27mn in Sep'15
PBT - 64
- 849 7 685 738 Consequent recovery in PBT in FY17 and FY18
Tax rate (%) NA -64% 70% 40% 40% We model higher tax rate in FY16 as Sylvania reported tax rate in excess of 100% in 1HFY16. For FY17 and FY18 we model normal tax rate
PAT - 290
- 1,392
- 174 411 443
Consequent improvement in PAT PAT (YoY growth) (%) NA NA -87% -336% 8%
Source: Ambit Capital research
Exhibit 31: Ambit vs consensus – consolidated
Ambit Consensus Divergence (%) Comments
Revenue (̀ mn) - FY16 85,339 87,865 -3%
Consequent to divergence on standalone and Sylvania’s estimates
- FY17 92,679 97,281 -5%
- FY18 101,848 107,623 -5%
EBITDA (`mn) - FY16 8,681 9,085 -4%
- FY17 10,644 10,925 -3%
- FY18 12,450 12,313 1%
EPS (̀ ) - FY16 8.1 8.5 -5%
- FY17 10.7 10.7 0%
- FY18 12.9 13.5 -4%
Source: Bloomberg, Ambit Capital research
Exhibit 32: Ambit vs consensus – standalone
Ambit Consensus Divergence (%) Comments
Revenue (̀ mn) - FY16 55,367 56,160 -1% Lower revenue growth in FY17 and FY18 could be led by our
expectation of industry growth decelerating to lower teens over the next decade vs 15% over FY05-15
- FY17 63,007 65,201 -3%
- FY18 72,176 75,642 -5%
EBITDA margin (%) - FY16 14.0% 13.7% 30bps Higher EBITDA margin vs consensus could be led by our
expectation of gross margin improvement of 150bps over FY15-18, led by streamlining of discount across distributors
- FY17 14.8% 14.4% 40bps
- FY18 15.4% 14.2% 120bps
EBITDA (̀ mn) - FY16 7,737 7,705 0%
Consequent to divergence on standalone revenue and EBITDA margin - FY17 9,309 9,394 -1%
- FY18 11,115 10,731 4%
EPS (̀ ) - FY16 8.0 8.8 -9%
We model a higher tax of 30% over FY16-19 vs consensus assumption of 27% - FY17 10.1 11.1 -9%
- FY18 12.3 13.1 -6%
Source: Bloomberg, Ambit Capital research

Havells India
November 19, 2015 Ambit Capital Pvt. Ltd. Page 15
Exhibit 33: Ambit vs consensus – Sylvania
Ambit Consensus Divergence (%) Comments
Revenue (̀ mn) - FY16 29,972 31,705 -5% Given the sluggish demand environment, we model 10%
decline in revenue in FY16 (already declined by 7.5% in 1HFY16) and flat revenue over FY17-18 which may not be the case with consensus
- FY17 29,672 32,080 -8%
- FY18 29,672 31,981 -7%
EBITDA margin (%) - FY16 3.1% 4.4% -130bps
Lower-than-consensus EBITDA margin could be led by unfavourable operating leverage - FY17 4.5% 4.8% -30bps
- FY18 4.5% 4.9% -40bps
EBITDA (̀ mn) - FY16 944 1,380 -32%
Consequent to divergence on Sylvania revenue and EBITDA margin - FY17 1,335 1,531 -13%
- FY18 1,335 1,582 -16%
Source: Bloomberg, Ambit Capital research

Havells India
November 19, 2015 Ambit Capital Pvt. Ltd. Page 16
Havells is trading at 3% discount to peers Underperformance has led to shrinkage of premium Havell’s stock price has declined by 15% in the past one year, underperforming the Sensex by 7%. Consequently, the stock has de-rated to 25x FY17 P/E (standalone), a 9% discount to the cross cycle average valuation (two-year) of the stock. The underperformance is on the back of weak results as discussed earlier.
Exhibit 34: Havells has underperformed the Sensex by 7% in the last one year….
Source: Bloomberg, Ambit Capital research
Exhibit 35: …and Havells standalone trades at 26.7x one-year forward P/E, a 9% discount to its two-year average valuation…
Source: Bloomberg, Ambit Capital research
Exhibit 36: …given Havells standalone EBITDA and PAT growth decelerated over FY15-16
Source: Company, Ambit Capital research
Also when compared to its peers (Bajaj, Finolex, V-Guard and TTK), Havells’ valuation premium has eroded from a premium of 15% in November’14 to a discount of 3% on FY17 EPS.
80
85
90
95
100
105
110
Nov
-14
Dec
-14
Jan-
15
Feb-
15
Mar
-15
Apr
-15
May
-15
Jun-
15
Jul-
15
Aug
-15
Sep-
15
Oct
-15
Nov
-15
Sensex Havells
12
17
22
27
32
37
Nov
-10
Mar
-11
Jul-
11
Nov
-11
Mar
-12
Jul-
12
Nov
-12
Mar
-13
Jul-
13
Nov
-13
Mar
-14
Jul-
14
Nov
-14
Mar
-15
Jul-
15
One-year forward P/E (x) Two-year average (x)
Five-year average (x)
-60%
-40%
-20%
0%
20%
40%
60%
80%
100%
120%
FY10
FY11
FY12
FY13
FY14
FY15
FY16E
Revenue EBITDA PAT

Havells India
November 19, 2015 Ambit Capital Pvt. Ltd. Page 17
Exhibit 37: Also, when compared to similar peers, the valuation premium has eroded
Source: Bloomberg, Ambit Capital research, Note – we take V-Guard, Bajaj (non-E&P), TTK Prestige and Finolex Cables as peers for industry average
Such a discount is unjustified given Havells’ better performance than peers on revenue growth, EBITDA margin and ROIC In a weak demand environment, Havells has managed to do a stellar job with standalone revenue growth of 11.7% in FY14 and 11.0% in FY15 vs peers’ 5.6% and 2.4%. Whilst Havells’ revenue growth of -0.9% in 1HFY16 was lower than peer median of 2.2%, we believe it is due to low base impact for TTK Prestige and Bajaj (also supplied LED lights under ESL order in 1HFY16). On margin and ROIC, Havells continued to score far better than peers with average EBITDA margin of 13.4% over FY14-15 vs peers 9.2% and RoIC of 53% over FY14-15 vs peers’ 21%.
Exhibit 38: Havells has seen better performance than peers on revenue growth, margin and RoIC
Company RoIC (%) Revenue growth (%) EBITDA margin (%)
FY14 FY15 FY14 FY15 1HFY16 FY14 FY15 1HFY16
Havells (standalone) 54.0% 52.1% 11.7% 11.0% -0.9% 13.6% 13.3% 13.3%
Finolex 24.3% 20.3% 3.9% 3.8% -1.3% 10.5% 11.1% 12.1%
V-Guard 20.1% 19.3% 11.6% 15.0% 2.6% 8.1% 7.6% 8.6%
Bajaj* 42.8% 49.8% 7.3% 0.9% 1.8% 6.8% 5.7% 4.8%
TTK Prestige 19.4% 15.1% -4.8% -8.0% 7.0% 12.4% 10.8% 11.8%
Peer median 22.2% 19.8% 5.6% 2.4% 2.2% 9.3% 9.2% 10.2%
Source: Company, Ambit Capital research, Note -* for Bajaj we take post-tax RoCE as a proxy for RoIC and EBIT growth as a proxy for EBITDA growth
Why we think Havells’ franchise is superior to peers and hence should trade at premium valuation
Innovation:
Havells made the transition from a B2B manufacturer of switches, fuses and cables to a consumer brand through multiple innovations. For example, in FY04 when Havells made an entry in the consumer fans business, the industry was competitive as well as unorganised (the top-six players held a 20% stake). To differentiate itself from the competition (Crompton, Orient, Usha, Bajaj, Polar and Khaitan), Havells launched fans at a premium price point, choosing energy saving, safety and lifestyle as unique selling points. This helped Havells break into a market with established players. Havells has followed this strategy across other lighting electrical products. For example, its water geysers come with in-built circuit breakers in case of electricity leakage.
With regards to distribution, Havells stands out from competitors (except Bajaj Electricals) by offering door step pickup of faulty products (as compared to other brands where the consumer has to approach the seller/go to the servicing centre of the brand). Havells was also the first consumer electricals company to start exclusive brand showrooms called Havells Galaxy.
-40%
-25%
-10%
5%
20%
35%
8
13
18
23
28
33
Nov
-10
Feb-
11
May
-11
Aug
-11
Nov
-11
Feb-
12
May
-12
Aug
-12
Nov
-12
Feb-
13
May
-13
Aug
-13
Nov
-13
Feb-
14
May
-14
Aug
-14
Nov
-14
Feb-
15
May
-15
Aug
-15
Havells Premium / (Discount) to peer average (RHS)
Havells has managed to do a good job with standalone revenue growth of 11.7%/11% in FY14/FY15 vs peers’ 5.6%/2.4%.
Havells reported average EBITDA margin of 13.4% over FY14-15 vs peers 9.2% and RoIC of 53% over FY14-15 vs peers’ 21%.
Havells India
November 19, 2015 Ambit Capital Pvt. Ltd. Page 18
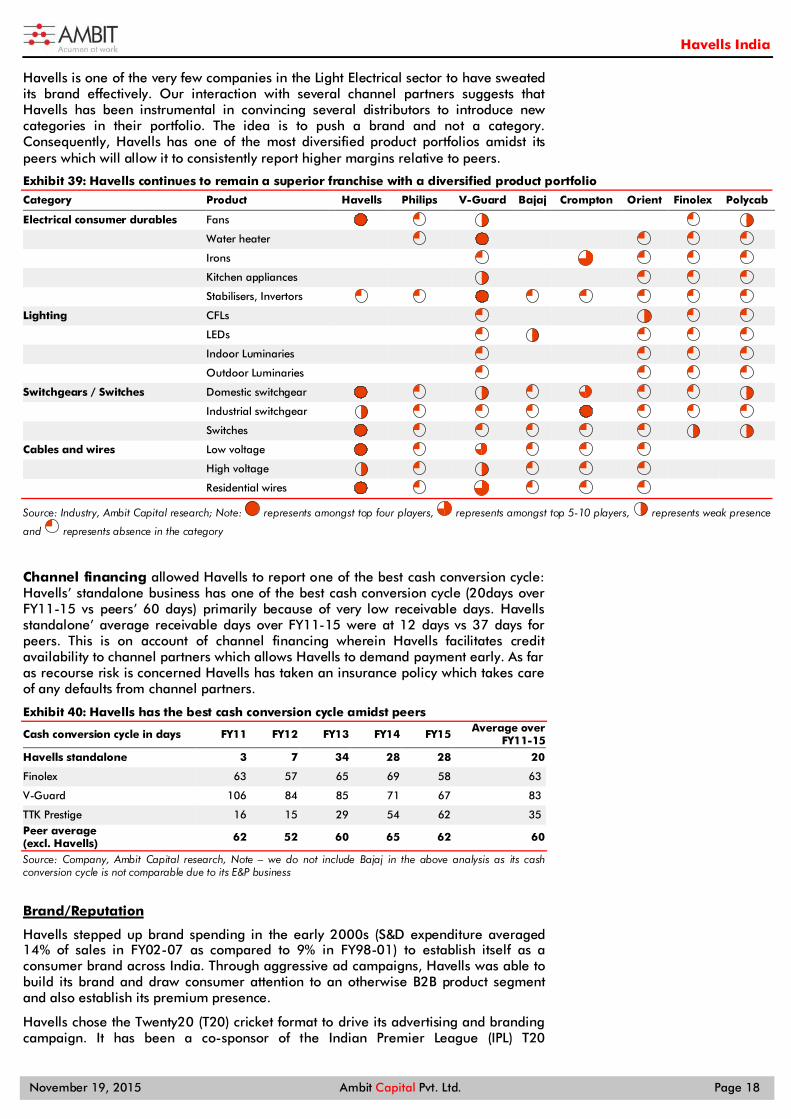
Havells is one of the very few companies in the Light Electrical sector to have sweated its brand effectively. Our interaction with several channel partners suggests that Havells has been instrumental in convincing several distributors to introduce new categories in their portfolio. The idea is to push a brand and not a category. Consequently, Havells has one of the most diversified product portfolios amidst its peers which will allow it to consistently report higher margins relative to peers.
Exhibit 39: Havells continues to remain a superior franchise with a diversified product portfolio
Category Product Havells Philips V-Guard Bajaj Crompton Orient Finolex Polycab
Electrical consumer durables Fans
Water heater
Irons
Kitchen appliances
Stabilisers, Invertors
Lighting CFLs
LEDs
Indoor Luminaries
Outdoor Luminaries
Switchgears / Switches Domestic switchgear
Industrial switchgear
Switches
Cables and wires Low voltage
High voltage
Residential wires
Source: Industry, Ambit Capital research; Note: represents amongst top four players, represents amongst top 5-10 players, represents weak presence
and represents absence in the category
Channel financing allowed Havells to report one of the best cash conversion cycle: Havells’ standalone business has one of the best cash conversion cycle (20days over FY11-15 vs peers’ 60 days) primarily because of very low receivable days. Havells standalone’ average receivable days over FY11-15 were at 12 days vs 37 days for peers. This is on account of channel financing wherein Havells facilitates credit availability to channel partners which allows Havells to demand payment early. As far as recourse risk is concerned Havells has taken an insurance policy which takes care of any defaults from channel partners.
Exhibit 40: Havells has the best cash conversion cycle amidst peers
Cash conversion cycle in days FY11 FY12 FY13 FY14 FY15 Average over FY11-15
Havells standalone 3 7 34 28 28 20
Finolex 63 57 65 69 58 63
V-Guard 106 84 85 71 67 83
TTK Prestige 16 15 29 54 62 35 Peer average (excl. Havells) 62 52 60 65 62 60
Source: Company, Ambit Capital research, Note – we do not include Bajaj in the above analysis as its cash conversion cycle is not comparable due to its E&P business
Brand/Reputation
Havells stepped up brand spending in the early 2000s (S&D expenditure averaged 14% of sales in FY02-07 as compared to 9% in FY98-01) to establish itself as a consumer brand across India. Through aggressive ad campaigns, Havells was able to build its brand and draw consumer attention to an otherwise B2B product segment and also establish its premium presence.
Havells chose the Twenty20 (T20) cricket format to drive its advertising and branding campaign. It has been a co-sponsor of the Indian Premier League (IPL) T20

Havells India
November 19, 2015 Ambit Capital Pvt. Ltd. Page 19
tournament since the beginning (this year is the eighth edition) as well as the International Cricket Council’s (ICC) T20 World Cup in 2007 where India won the world cup. As luck would have it, India won the first ICC World T20 in 2007, and this was instrumental in entrenching Havells’ brand in the consumer electrical space. In our discussions with dealers, Havells’ aggressive brand spend comes across a key factor that draws dealers to its products. Brand promotion and a wide range of products were the two most repeated factors that dealers recalled.
Havells’ strong brand re-call can be corroborated by its highest margins and ROIC relative to peers. This has been possible on account of consistently high ad spends, premium product offering and consistent new product launches.
Exhibit 41: Havells standalone’s EBITDA margins and ROICs are the highest amidst peers
Company FY09 FY10 FY11 FY12 FY13 FY14 FY15 Average over FY09-15
EBITDA margin (%) Havells 9% 13% 19% 12% 13% 14% 13% 13%
Finolex 6% 11% 8% 8% 10% 11% 11% 9%
V-Guard 10% 11% 10% 12% 8% 8% 8% 10%
Bajaj (consumer) 9% 11% 10% 9% 9% 7% 6% 9%
TTK Prestige 10% 15% 16% 16% 15% 13% 11% 14%
CRG (consumer) 9% 12% 13% 11% 8% 10% 11% 11%
Average (excl. Havells) 9% 12% 11% 11% 10% 10% 9% 10%
RoIC (%) Havells 39% 42% 71% 43% 46% 54% 52% 50%
Finolex 17% 17% 16% 19% 25% 24% 20% 20%
V-Guard 19% 18% 19% 30% 21% 20% 19% 21%
Bajaj (consumer) 38% 47% 49% 40% 38% 43% 50% 43%
TTK Prestige 36% 79% 119% 55% 41% 19% 15% 52%
CRG (consumer) 32% 69% 38% 29% 22% 25% NA 36%
Average (excl. Havells) 28% 46% 48% 35% 29% 26% 26% 34%
Source: Company, Ambit Capital research
Exhibit 42: Havells has consistently been the highest ad spender
Ad spend as a % revenue FY05 FY06 FY07 FY08 FY09 FY10 FY11 FY12 FY13 FY14 FY15
Average over
FY05-09 FY10-15 FY05-15
Havells (standalone) 2.8% 3.1% 2.0% 2.6% 2.3% 3.5% 2.5% 3.1% 3.1% 2.4% 3.0% 2.6% 2.9% 2.8%
Finolex 0.4% 0.3% 0.4% 0.5% 0.3% 0.4% 0.4% 0.5% 0.5% 0.4% 0.7% 0.4% 0.5% 0.4%
V-Guard 5.3% 4.7% 5.4% 5.7% 5.1% 5.1% 3.8% 4.2% 4.3% 3.9% 4.0% 5.2% 4.2% 4.7%
Philips 3.2% 3.3% 2.9% 3.1% 2.8% 3.7% 3.3% 2.9% 2.7% 2.8% 3.5% 3.1% 3.2% 3.1%
Khaitan 2.8% 3.2% 2.2% 2.4% 2.1% 1.7% 2.3% 2.0% 1.2% 1.7% 1.1% 2.6% 1.7% 2.1%
Surya Roshni 1.2% 1.0% 1.1% 0.6% 2.3% 2.0% 1.3% 0.6% 0.5% 0.4% 0.8% 1.2% 0.9% 1.1%
Bajaj (non-E&P) 2.5% 2.6% 2.3% 2.1% 1.9% 2.2% 1.9% 1.8% 1.6% 2.2% 1.9% 2.3% 1.9% 2.1%
CRG (consumer) 1.9% 1.8% 3.2% 3.6% 4.0% 5.2% 1.7% 2.2% 2.7% 2.7% 2.5% 2.9% 2.8% 2.9%
Average (excl. Havells) 2.5% 2.4% 2.5% 2.6% 2.6% 2.9% 2.1% 2.1% 1.9% 2.0% 2.1% 2.5% 2.2% 2.3%
Source: Company, Ace Equity, Ambit Capital research
Exhibit 43: Havells has consistently launched new product offerings Product Launched in
Fans 2003
CFL 2003
Lighting 2003
Electric water heater 2010
Domestic Appliances 2011
Pumps 2013
Source: Company, Ambit Capital research
Exhibit 44: Havells product portfolio is premium focused Proportion of SKUs in fans at Flipkart price range-wise
Price range in ̀ 000s
1-2 2-5 5-10 10 and above
Havells 21% 72% 2% 5%
Bajaj 40% 60% 0% 0%
Crompton 39% 53% 6% 2%
Usha 50% 49% 1% 0%
Orient 45% 49% 4% 2%
Source: Flipkart, Ambit Capital research

Havells India
November 19, 2015 Ambit Capital Pvt. Ltd. Page 20
Whilst the recent onset of e-commerce players is a risk to Havells given it eliminates the biggest entry barrier of having a strong distribution network; apart from domestic appliances and to some extent fans (both part of Havells’ consumer durables business); other product categories like lighting and fixtures, cables and wires and switchgears are not very popular on e-commerce platform. Moreover, Havells has also strengthened its presence on the e-commerce platform by entering into agreements with several players for not selling below the market operating price so as to maintain pricing discipline.
Exhibit 45: Havells has a reasonable presence on the e-commerce platform
Number of SKU for sale on Flipkart Fans Water Heater Mixer Iron
Havells 130 38 20 10
Bajaj + Morphy Richards 41 37 105 29
Crompton 87 25 24 7
Usha 177 29 41 16
Orient 141 5 8 NA
Philips NA NA 46 29
Racold NA 40 NA NA
Source: Flipkart, Ambit Capital research
Architecture
Havells stands apart in its dealer relationships. QRG’s origin as a trader has helped him to understand the needs of dealers and this has helped Havells build unique, long-term relationships with its dealer community. For instance, post the demise of Lehman Brothers, the prices of cables and wires crashed, led by a sharp correction in copper prices, which crashed by 67% in a space of six months. Consequently, dealers came under severe stress, as they had piled up inventory in September to cash in on the festive season. To share the losses of the dealers, the company announced a special trade discount of 1%. This went down very well with the dealers as not many of the other competitors matched this gesture.
Whilst all consumer companies pamper dealers with perks like foreign tours on dealers, Havells has gone far ahead with schemes that provide medical insurance, mutual funds, and gift debit cards for dealers. This route helps dealers directly as compared to cash commissions which typically get passed on by the dealer to the consumer through discounts.
Here are some key quotes from our discussions with channel partners:
“My wife had a bad fall at home and had to be hospitalised. The bill came to `169,000 and I was able to settle it for a few hundred rupees within an hour, thanks to Havells medical insurance scheme. I personally suffer from various disorders of the heart, brain and diabetes. No insurer would offer medical insurance to me but Havells helped me to get medical insurance.”
“My son got married and his overseas honeymoon was entirely sponsored by Havells (via points), including travel and 5-star stay”.
“In a visit organised by the company for its top-performing distributors to Europe, the company gave prepaid SIM cards to the visitors, which had the contact numbers of key personnel – instead of the dealer having to search for the numbers.”
“They always think of how dealers can make profits. As dealers grow, Havells grows.”
“Credit notes get cleared in six days at Havells. The same process takes months at other companies.”
“When I go to Havells to negotiate a price discount for a large project, they finalise the matter on the first visit. Other companies take much longer.”

Havells India
November 19, 2015 Ambit Capital Pvt. Ltd. Page 21
Strategic assets
Havells’ dealer network is its biggest strategic asset. Relationships have been built over decades and span generations. These will be difficult to replace by any competitor. Havells has also built significant scale in its domestic operations.
“Havells is very timely on product availability across the country. This is because all their manufacturing facilities (Neemrana, Faridabad, Haridwar, Ghaziabad, Baddi and Alwar) are very close to Delhi which is a feeder market”
- An electricals dealer in Bhagirath Palace, Delhi
Exhibit 46: Havells has one of the strongest distribution network
Havells Bajaj V-Guard Finolex Polycab RR Kabel Crompton TTK Prestige
Gandhimati Butterfly
Orient Electric
Exclusive stores 210 Havells Galaxy stores
103 Bajaj World Stores
30 C& F agents NA NA 3 stores
Distributors NA 1,000 470 150 650 4,000 NA 300 Dealers 2,500 4,000 3,000 4,500 5,000 NA NA 3,500
Retailers 100,000 400,000 15,000 45,000 7,000 NA 45,000 100,000
Source: Company, Ambit Capital research
Havells India
November 19, 2015 Ambit Capital Pvt. Ltd. Page 22
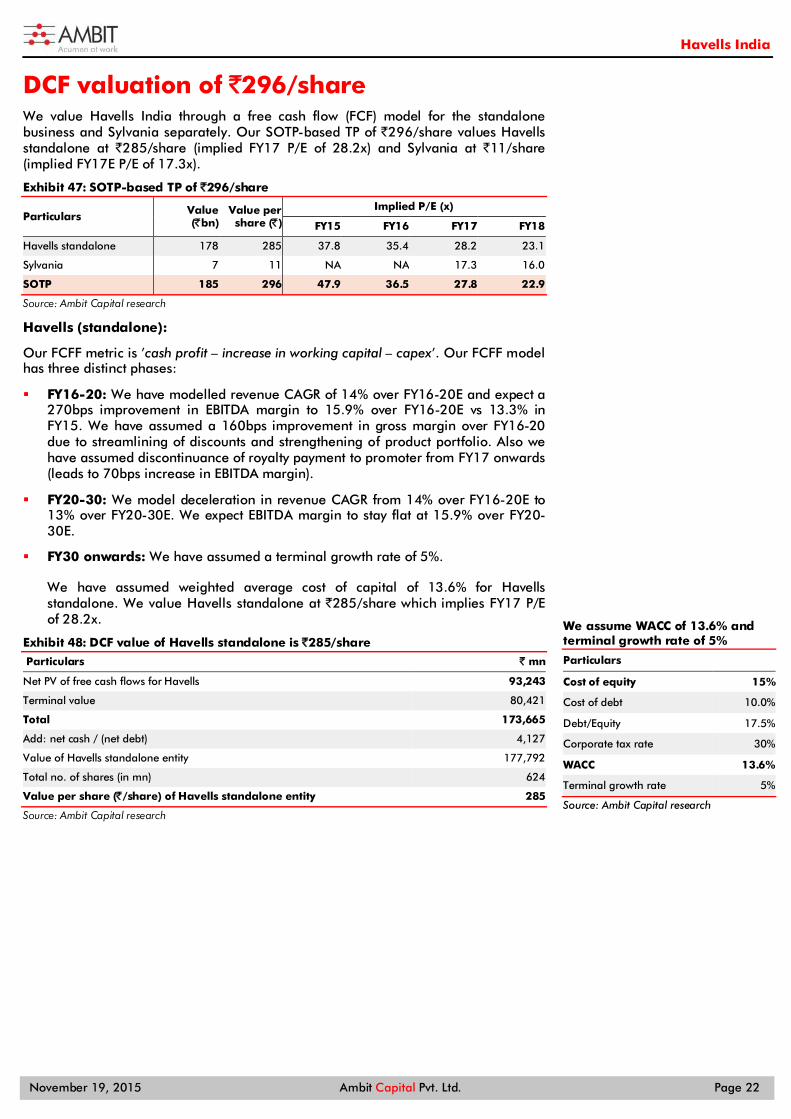
DCF valuation of `296/share We value Havells India through a free cash flow (FCF) model for the standalone business and Sylvania separately. Our SOTP-based TP of `296/share values Havells standalone at `285/share (implied FY17 P/E of 28.2x) and Sylvania at `11/share (implied FY17E P/E of 17.3x).
Exhibit 47: SOTP-based TP of ̀ 296/share
Particulars Value (̀ bn)
Value per share (̀ )
Implied P/E (x)
FY15 FY16 FY17 FY18
Havells standalone 178 285 37.8 35.4 28.2 23.1
Sylvania 7 11 NA NA 17.3 16.0
SOTP 185 296 47.9 36.5 27.8 22.9
Source: Ambit Capital research
Havells (standalone):
Our FCFF metric is ’cash profit – increase in working capital – capex’. Our FCFF model has three distinct phases:
FY16-20: We have modelled revenue CAGR of 14% over FY16-20E and expect a 270bps improvement in EBITDA margin to 15.9% over FY16-20E vs 13.3% in FY15. We have assumed a 160bps improvement in gross margin over FY16-20 due to streamlining of discounts and strengthening of product portfolio. Also we have assumed discontinuance of royalty payment to promoter from FY17 onwards (leads to 70bps increase in EBITDA margin).
FY20-30: We model deceleration in revenue CAGR from 14% over FY16-20E to 13% over FY20-30E. We expect EBITDA margin to stay flat at 15.9% over FY20-30E.
FY30 onwards: We have assumed a terminal growth rate of 5%.
We have assumed weighted average cost of capital of 13.6% for Havells standalone. We value Havells standalone at `285/share which implies FY17 P/E of 28.2x.
Exhibit 48: DCF value of Havells standalone is `285/share
Particulars ` mn
Net PV of free cash flows for Havells 93,243
Terminal value 80,421
Total 173,665
Add: net cash / (net debt) 4,127
Value of Havells standalone entity 177,792
Total no. of shares (in mn) 624
Value per share (̀ /share) of Havells standalone entity 285
Source: Ambit Capital research
We assume WACC of 13.6% and terminal growth rate of 5%
Particulars
Cost of equity 15%
Cost of debt 10.0%
Debt/Equity 17.5%
Corporate tax rate 30%
WACC 13.6%
Terminal growth rate 5%
Source: Ambit Capital research

Havells India
November 19, 2015 Ambit Capital Pvt. Ltd. Page 23
Exhibit 49: FCF profile of Havells standalone
Source: Ambit Capital research
Exhibit 50: Revenue and margin evolution of Havells standalone
Source: Ambit Capital research
Sylvania:
Our FCFF metric is ’cash profit – increase in working capital – capex’. Our FCFF model has three distinct phases:
FY16-20: We model flat revenue over FY16-20 led by fragile demand environment in Europe. We expect 390bps improvement in EBITDA margin to 4.9% by FY20E led by: (a) lower base effect as EBITDA margin declined by 400bps YoY over FY14-15; and (b) operating leverage.
FY20-30: We model constant revenue growth of 1% and EBITDA margin of 4.9% over FY20-30E.
FY30 onwards: We have assumed a terminal growth rate of 2%.
We have assumed weighted average cost of capital of 15% for Sylvania vs 13.6% for Havells standalone given the challenging business environment in Europe. We value Sylvania at `11/share, which implies FY17 P/E of 17.3x.
Exhibit 51: DCF value of Sylvania is `11/share Particulars ` mn
Net PV of free cash flows for Havells 5,783
Terminal value 1,312
Total 7,095
Less: Net debt/ (cash)* -9
Value of Sylvania 7,104
Total no. of shares (in mn) 624
Value per share (̀ /share) for Sylvania 11
Source: Ambit Capital research, Note - * consolidated minus (-) standalone
Exhibit 52: FCF profile of Sylvania
Source: Ambit Capital research
Exhibit 53: Revenue and margin evolution of Sylvania
Source: Ambit Capital research
0%5%10%15%20%25%30%35%40%
5,000
5,500
6,000
6,500
7,000
7,500
FY17
E
FY18
E
FY19
E
FY20
E
FY21
E
FY22
E
FY23
E
FY24
E
FY25
E
FY26
E
FY27
E
FY28
E
FY29
E
FY30
E
FCFF (Rsmn) on LHS WACC (%) ROCE (%)
12.0%
13.0%
14.0%
15.0%
16.0%
17.0%
050
100150200250300
FY16
EFY
17E
FY18
EFY
19E
FY20
EFY
21E
FY22
EFY
23E
FY24
EFY
25E
FY26
EFY
27E
FY28
EFY
29E
Revenue (Rsbn) EBIT margin (%) on RHS
5.0%
10.0%
15.0%
20.0%
0
200
400
600
800
FY17
EFY
18E
FY19
EFY
20E
FY21
E
FY22
EFY
23E
FY24
EFY
25E
FY26
EFY
27E
FY28
EFY
29E
FY30
E
FCFF (Rsmn) on LHS WACC (%) ROCE (%)
0.0%
1.0%
2.0%
3.0%
4.0%
2728293031323334
FY16
EFY
17E
FY18
EFY
19E
FY20
EFY
21E
FY22
EFY
23E
FY24
EFY
25E
FY26
EFY
27E
FY28
EFY
29E
FY30
E
Revenue (Rsbn) EBIT margin (%) on RHS

Havells India
November 19, 2015 Ambit Capital Pvt. Ltd. Page 24
Market leadership justifies valuation of 28x FY17 EPS; 10% premium to peers Industry growth to be still in low teens over the next decade vs 15% over the last decade
Our interaction with channel partners suggest that the industry growth despite decelerating will still be low teens over the next decade compared to 15% over the last 10 years. The deceleration in the growth relative to the last decade is on account of (a) 65% market share for the organised players as on FY15 vs 30% in FY06; (b) per sq feet opportunity to decline with incremental growth coming from tier-III and tier-IV cities and (c) higher premiumisation leading to lower growth in the replacement market.
Exhibit 54: Share of organised players increases to 65% in FY15 vs 30% in FY06
Share of organised players (%) FY06 FY10 FY15
Domestic switchgears 40% 43% 70%
Industrial switchgears 60% 72% 80%
Switches 25% 50% 70%
Cables and wires 20% 56% 62%
Lighting & Luminaries 25% 40% 55%
Fans 40% 55% 70%
Industry 30% 54% 65%
Source: Industry, Ambit Capital research
Exhibit 55: Top 10 organised players have grown at 15% CAGR over FY05-15
Revenue in ̀ mn FY05 FY06 FY07 FY08 FY09 FY10 FY11 FY12 FY13 FY14 FY15 CAGR (%)
Havells 5,820 10,035 15,472 20,556 21,984 23,712 28,817 36,156 42,250 47,197 52,387 25%
Polycab* 10,824 12,556 19,674 21,304 22,473 25,114 31,767 37,756 37,195 41,052 41,052 14%
Philips 25,780 29,600 28,001 20,492 24,820 25,612 NA 27,822 37,912 40,601 43,175 5%
Bajaj 5,585 5,992 7,721 10,105 12,417 14,904 19,082 22,653 26,981 28,956 29,219 18%
Crompton 6,712 8,166 9,927 11,667 13,218 16,119 20,207 21,324 25,915 28,457 32,318 17%
Finolex 5,708 7,478 10,330 13,838 13,415 16,187 20,358 20,640 22,707 23,590 24,491 16%
V-Guard 1,341 1,701 2,227 2,786 3,174 4,547 7,266 9,936 13,602 15,176 17,459 29%
Orient Electric 1,648 1,919 2,425 2,851 3,414 4,808 6,423 7,557 9,118 11,033 11,639 22%
Surya Roshni 2,691 3,127 3,237 3,472 3,818 5,599 7,502 7,698 9,064 10,772 11851.8 16%
Khaitan Electric 1,122 1,904 2,843 3,200 2,847 3,569 4,659 4,413 5,118 5,137 4,300 14%
Top ten players 67,230 82,477 101,856 110,269 121,581 140,171 146,080 195,956 229,861 251,971 267,892 15%
Excl. Havells 61,411 72,442 86,384 89,713 99,597 116,460 117,264 159,800 187,611 204,774 215,505 13%
Source: Company, MCA, AceEquity, Capitaline, Ambit Capital research, Note – * for Polycab we assume FY15 revenue being same as FY14 as its FY15 financials are not available
16% PAT CAGR over FY15-17 and 59% ROIC in FY16-17 justifies our implied valuation of 28x FY17 EPS; 10% premium to peers
Our implied value for Havells standalone is `285/share; implied FY17 P/E of 28x. This is assuming 16% PAT CAGR over FY15-17and 59% ROIC in FY16-17. We believe this is justified when compared to peers such as Bajaj (non-E&P), TTK Prestige, Finolex Cables and V-Guard given lower ROIC of 25%. Peers however have a higher EPS CAGR of 23% albeit on a week base of FY15.

Havells India
November 19, 2015 Ambit Capital Pvt. Ltd. Page 25
Exhibit 56: Havells standalone is trading at 3% discount to peers on FY17 P/E
Company CMP Mcap P/E (x) P/B (x) EV/EBITDA (x) RoIC (%) CAGR (FY15-17)
INR US$mn FY16 FY17 FY16 FY17 FY16 FY17 FY15 FY16 FY17 Revenue EPS
Havells (consolidated) 263 2,524 32.5 24.7 7.8 6.7 18.8 15.4 37.6 46.3 54.0 4.0 31.9
Havells (standalone) 263 2,524 31.3 24.9 5.9 5.2 20.4 17.0 52.1 53.6 65.2 9.7 15.6
Bajaj (non-E&P) 229 361 39.2 31.4 NA NA NA NA NA NA NA 8.8 19.0
TTK Prestige 4100 714 39.7 28.4 6.6 6.0 25.1 18.8 15.1 20.6 28.2 15.8 35.0
Finolex Cables 258 607 21.5 21.1 25.7 27.9 1.4 1.2 22.4 25.7 27.9 7.4 8.6
V-Guard 878 405 27.5 21.7 5.8 4.9 16.9 13.8 19.3 22.5 25.3 13.6 30.6
Average (excl Havells )
32.0 25.7 12.7 12.9 14.4 11.3 18.9 23.0 27.1 11.4 23.3
Divergence with Havells standalone -2% -3% -54% -59% 41% 50% 3,320bps 4,060bps 4,810bps -170bps -770bps
Source: Bloomberg, Ambit Capital research; Note: Valuation as on 18 November 2015; we have calculated Havells standalone P/E, P/B and EV/EBITDA by deducting our fair value of Sylvania of `11/share from CMP, we have calculated Bajaj (non-E&P) P/E by deducting our fair value of E&P business of `32/share from CMP
When compared to paint companies (Asian Paints and Berger), Havells standalone business is currently trading at 34% discount on FY17 P/E despite average standalone ROIC of 59% in FY16-17 vs Paints’ 30%. EPS CAGR for Havells though is low at 16% over FY15-17 vs paints’ 22%.
Exhibit 57: Havells standalone is trading at 34% discount to paints on FY17 P/E
Company CMP Mcap P/E (x) P/B (x) EV/EBITDA (x) RoIC (%) CAGR (FY15-17)
INR US$mn FY16 FY17 FY16 FY17 FY16 FY17 FY15 FY16 FY17 Revenue EPS
Havells (standalone) 263 2,524 31.3 24.9 5.9 5.2 20.4 17.0 52.1 53.6 65.2 9.7 15.6
Paints Berger 219 2,290 45.4 36.9 10.4 8.9 24.5 20.7 19.0 21.5 24.2 15.1 24.7
Asian Paints 822 11,899 45.5 39.0 14.1 12.1 27.3 23.4 33.9 34.5 38.9 15.0 19.3
Average (Excl. Havells) 45.5 37.9 12.3 10.5 25.9 22.0 26.5 28.0 31.6 15.1 22.0
Divergence -31% -34% -52% -50% -21% -23% 2,570bps 2,560bps 3,360bps -540bps -640bps
Source: Bloomberg, Ambit Capital research; Note: Valuation as on 18 November 2015
Catalysts
Gross margin improvement by 150bps over FY15-18: We expect Havells’ standalone gross margin to improve by 150bps over FY15-18 led by the streamlining of the discount across distributors (across its entire product portfolio) and improved product portfolio. Earlier Havells was offering extra discount in the range of 100-300bps to large distributors (accounted for ~20% of Havells’ revenue) which has now been withdrawn.
Increase in market share through marginalization of new players over FY15-17: Competitive intensity has increased in the past two years with players such as Polycab, Luminous, Surya, Roshini, RR Kabel and Orient venturing into new product categories such as consumer appliances, fans, switches, switchgear, etc. However, our recent channel checks suggest that these players are facing difficulties in promoting their products given their inferior product quality (relative to Havells) and weak after-sales service. According to the channel partners, these companies neither have in-house manufacturing (except for Polycab in fans) nor credible sourcing partners. Consequently, we expect the competitive intensity to ease off with these players making an exit from the new product categories implying no threat of market share loss to Havells. Moreover, with strengthening of product portfolio by launching new SKUs, Havells would emerge as the biggest beneficiary of marginalization of new players

Havells India
November 19, 2015 Ambit Capital Pvt. Ltd. Page 26
Risks:
Entry of Chinese players: Entry of Chinese players is a risk to Indian players given the importance of brand in Light Electricals is low compared to in paints as discussed earlier. However, the competition we believe will be more on the e-commerce platform and not through the brick and mortar network which means it will be restricted towards fans and domestic appliances which accounts for 21% of the overall light Electrical market. Moreover these players will have to build a credible after-sales service network in order to make a consistent mark.
Havells losing market share: If our thesis of marginalization of new players does not happen then Havells may lose market share as it is already has a PAN India presence with limited scope for entry into new product categories. Moreover, the company is streamlining its discounts across distributors irrespective of their scale and geography. Whilst this is a right strategy with the benefits of improving gross margin for Havells and improving the penetration amongst small distributor, this strategy is not taken well by the large distributors as there are no incentives. We do not expect the new strategy to result in market share loss for Havells as the higher sales to small distributors would more than offset the loss of sales through large distributors. However, if this does not happen then Havells may lose market share.
Further investments into Sylvania: With no plans to incur any green-field capex and our expectation of Sylvania reporting FCF of ~`500mn over FY17-18, we expect Sylvania to be self-sufficient. Even the management in the 2QFY16 conference call committed that Sylvania would not need any further cash support from Havells standalone (baring challenging year of FY16) given that the Sylvania’s net debt has already declined to Euro26.6mn (from Euro171.6mn in FY08). However, if Sylvania continues to disappoint given the sluggish demand environment and continued depreciation of Euro, our assumption of Havells not pumping in further cash into Sylvania and thereby improving its standalone ROE from 21% in FY15 to 24% in FY18 would come under risk.
Exhibit 58: Explanation for our flags on the cover page
Segment Score Comments
Accounting AMBER In our accounting analysis of consumer durable companies, Havells scores AMBER. Whilst Havells scores high on cash generation and cash yields; it scores below average on high proportion of contingent liability (primarily due to channel financing) and high proportion of non-operating expenses
Predictability GREEN In the past two quarters, the results were broadly in-line with the consensus estimate. Moreover Havells is the only company in the light electrical sector which follows a practice of giving profit-warning during difficult times.
Earnings Momentum GREEN After a year of cautious commentary the management finally turned positive post 2QFY16 results as they are seeing the green shoots of infra-led pick-up in the demand. Moreover with the marginalisation of new players coupled with streamlining of discount the gross margins is likely to improve for Havells.
Source: Bloomberg, Ambit Capital research

Havells India
November 19, 2015 Ambit Capital Pvt. Ltd. Page 27
Consolidated financials unless specified
Balance sheet Year to March (̀ mn) FY14 FY15 FY16E FY17E FY18E
Cash 8,819 7,775 10,290 13,095 16,257
Debtors 10,005 6,232 6,974 7,082 7,308
Inventory 14,934 13,663 13,370 14,383 15,589
Loans & advances 2,920 2,304 2,193 2,541 2,691
Miscellaneous/Other Current Assets 198 1,977 2,124 2,589 2,966
Investments - - - - -
Fixed assets 16,447 15,789 15,996 16,006 16,403
Total assets 53,324 47,739 50,947 55,695 61,213
Current liabilities & provisions 27,957 26,735 26,630 28,320 30,430
Debt 8,240 2,960 3,184 2,684 2,184
Other liabilities - Deferred Tax Liability 468 (137) (137) (137) (137)
Total liabilities 36,664 29,558 29,677 30,866 32,477
Share Capital 624 624 624 624 624
Reserves & surpluses 16,036 17,557 20,646 24,205 28,112
Total networth 16,660 18,181 21,270 24,829 28,736
Net working capital (97) (4,536) (4,093) (4,315) (4,842)
Net debt (cash) (580) (4,814) (7,107) (10,411) (14,073)
Source: Company, Ambit Capital research
Income statement
Year to March (̀ mn) FY14 FY15 FY16E FY17E FY18E
Operating income 81,858 85,694 85,339 92,679 101,848
% growth 12.9 4.7 (0.4) 8.6 9.9
Operating expenditure 74,433 78,483 76,658 82,035 89,398
EBITDA 7,425 7,211 8,681 10,644 12,450
% growth 10.1 (2.9) 20.4 22.6 17.0
Depreciation 1,155 1,387 1,443 1,469 1,574
EBIT 6,270 5,825 7,238 9,175 10,876
Interest expenditure 741 640 522 429 315
Non-operational income / Exceptional items 413 505 611 805 1,021
PBT 5,941 5,690 7,328 9,552 11,582
Tax 1,478 1,836 2,231 2,845 3,440
Reported PAT 4,463 3,854 5,096 6,706 8,142
Adjustments - - - - -
Adjusted PAT 4,463 3,854 5,096 6,706 8,142
% growth 15.3 (13.6) 32.2 31.6 21.4
Source: Company, Ambit Capital research

Havells India
November 19, 2015 Ambit Capital Pvt. Ltd. Page 28
Cash flow statement
Year to March (̀ mn) FY14 FY15 FY16E FY17E FY18E
PBT 5,941 5,870 7,328 9,552 11,582
Depreciation 1,155 1,387 1,443 1,469 1,574
Interest 572 542 522 429 315
Tax (1,336) (1,915) (2,231) (2,845) (3,440)
(Incr) / decr in net working capital 1,719 4,152 (590) (244) 151
Others 629 (409) - - -
Cash flow from operating activities 8,681 9,626 6,471 8,360 10,182
(Incr) / decr in capital expenditure (1,725) (1,709) (1,650) (1,479) (1,971)
(Incr) / decr in investments (2,247) (3,478) - - -
Others 210 323 - - -
Cash flow from investing activities (3,762) (4,864) (1,650) (1,479) (1,971)
Issuance of equity 0 99 0 - -
Incr / (decr) in borrowings (748) (5,570) 223 (500) (500)
Others (1,826) (1,460) (2,529) (3,577) (4,549)
Cash flow from financing activities (2,574) (6,931) (2,305) (4,077) (5,049)
Net change in cash 2,346 (2,169) 2,516 2,804 3,162
Source: Company, Ambit Capital research
Ratio Analysis Year to March (%) FY14 FY15 FY16E FY17E FY18E
EBITDA margin 9.1 8.4 10.2 11.5 12.2
Net profit margin 5.5 4.5 6.0 7.2 8.0
Return on capital employed 19.8 17.1 22.1 24.8 26.2
Return on equity 28.7 22.1 25.8 29.1 30.4
Current ratio (x) 1.3 1.1 1.2 1.3 1.4
Source: Ambit Capital research
Valuation parameter Year to March FY14 FY15 FY16E FY17E FY18E
EPS (`) 7.2 6.2 8.1 10.7 12.9
Book value per share (`) 26.7 29.1 33.8 39.5 45.7
P/E (x) 36.8 42.6 32.5 24.7 20.3
P/BV (x) 9.8 9.0 7.8 6.7 5.8
EV/EBITDA (x) 22.0 22.7 18.8 15.4 13.1
EV/Sales (x) 2.0 1.9 1.9 1.8 1.6
EV/EBIT (x) 26.1 28.1 22.6 17.8 15.0
Source: Ambit Capital research
Havells India
November 19, 2015 Ambit Capital Pvt. Ltd. Page 29
Institutional Equities Team Saurabh Mukherjea, CFA CEO, Institutional Equities (022) 30433174 [email protected]
Research
Analysts Industry Sectors Desk-Phone E-mail
Nitin Bhasin - Head of Research E&C / Infra / Cement / Industrials (022) 30433241 [email protected]
Aadesh Mehta, CFA Banking / Financial Services (022) 30433239 [email protected]
Abhishek Ranganathan, CFA Retail / Mid-caps (022) 30433085 [email protected]
Achint Bhagat, CFA Cement / Roads / Home Building (022) 30433178 [email protected]
Ashvin Shetty, CFA Automobile (022) 30433285 [email protected]
Bhargav Buddhadev Power Utilities / Capital Goods (022) 30433252 [email protected]
Deepesh Agarwal Power Utilities / Capital Goods (022) 30433275 [email protected] Gaurav Mehta, CFA Strategy / Derivatives Research (022) 30433255 [email protected]
Girisha Saraf Mid-caps / Small-caps (022) 30433211 [email protected]
Karan Khanna Strategy (022) 30433251 [email protected]
Kushank Poddar Technology (022) 30433203 [email protected] Pankaj Agarwal, CFA Banking / Financial Services (022) 30433206 [email protected]
Paresh Dave, CFA Healthcare (022) 30433212 [email protected]
Parita Ashar, CFA Metals & Mining (022) 30433223 [email protected]
Prashant Mittal, CFA Derivatives (022) 30433218 [email protected]
Rakshit Ranjan, CFA Consumer (022) 30433201 [email protected]
Ravi Singh Banking / Financial Services (022) 30433181 [email protected]
Ritesh Gupta, CFA Oil & Gas / Chemicals / Agri Inputs (022) 30433242 [email protected]
Ritesh Vaidya, CFA Consumer (022) 30433246 [email protected] Ritika Mankar Mukherjee, CFA Economy / Strategy (022) 30433175 [email protected]
Ritu Modi Automobile (022) 30433292 [email protected]
Sagar Rastogi Technology (022) 30433291 [email protected]
Sumit Shekhar Economy / Strategy (022) 30433229 [email protected]
Utsav Mehta, CFA E&C / Industrials (022) 30433209 [email protected]
Vivekanand Subbaraman, CFA Media (022) 30433261 [email protected]
Sales
Name Regions Desk-Phone E-mail
Sarojini Ramachandran - Head of Sales UK +44 (0) 20 7614 8374 [email protected]
Dharmen Shah India / Asia (022) 30433289 [email protected]
Dipti Mehta India / USA (022) 30433053 [email protected]
Hitakshi Mehra India (022) 30433204 [email protected]
Krishnan V India / Asia (022) 30433295 [email protected]
Nityam Shah, CFA USA / Europe (022) 30433259 [email protected]
Parees Purohit, CFA UK / USA (022) 30433169 [email protected]
Praveena Pattabiraman India / Asia (022) 30433268 [email protected]
Shaleen Silori India (022) 30433256 [email protected]
Singapore
Pramod Gubbi, CFA – Director Singapore +65 8606 6476 [email protected]
Shashank Abhisheik Singapore +65 6536 1935 [email protected]
USA / Canada
Ravilochan Pola - CEO Americas +1(646) 361 3107 [email protected]
Production
Sajid Merchant Production (022) 30433247 [email protected]
Sharoz G Hussain Production (022) 30433183 [email protected]
Joel Pereira Editor (022) 30433284 [email protected]
Nikhil Pillai Database (022) 30433265 [email protected]
E&C = Engineering & Construction
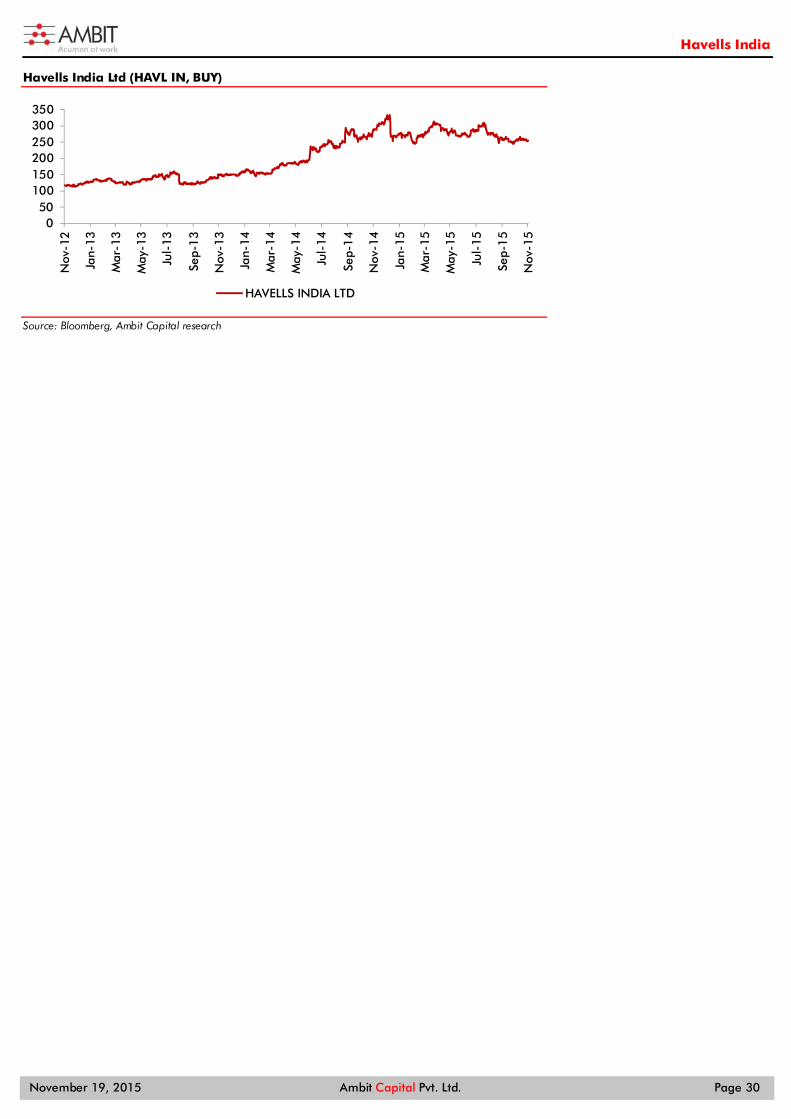
Havells India
November 19, 2015 Ambit Capital Pvt. Ltd. Page 30
Havells India Ltd (HAVL IN, BUY)
Source: Bloomberg, Ambit Capital research
050
100150200250300350
Nov
-12
Jan-
13
Mar
-13
May
-13
Jul-
13
Sep-
13
Nov
-13
Jan-
14
Mar
-14
May
-14
Jul-
14
Sep-
14
Nov
-14
Jan-
15
Mar
-15
May
-15
Jul-
15
Sep-
15
Nov
-15
HAVELLS INDIA LTD
Havells India
November 19, 2015 Ambit Capital Pvt. Ltd. Page 31
Explanation of Investment Rating
Investment Rating Expected return (over 12-month)
BUY >10%
SELL <10%
NO STANCE We have forward looking estimates for the stock but we refrain from assigning valuation and recommendation
UNDER REVIEW We will revisit our recommendation, valuation and estimates on the stock following recent events
NOT RATED We do not have any forward looking estimates, valuation or recommendation for the stock Disclaimer
This report or any portion hereof may not be reprinted, sold or redistributed without the written consent of Ambit Capital. AMBIT Capital Research is disseminated and available primarily electronically, and, in some cases, in printed form.
Additional information on recommended securities is available on request.
Disclaimer
1. AMBIT Capital Private Limited (“AMBIT Capital”) and its affiliates are a full service, integrated investment banking, investment advisory and brokerage group. AMBIT Capital is a Stock Broker, Portfolio Manager and Depository Participant registered with Securities and Exchange Board of India Limited (SEBI) and is regulated by SEBI
2. AMBIT Capital makes best endeavours to ensure that the research analyst(s) use current, reliable, comprehensive information and obtain such information from sources which the analyst(s) believes to be reliable. However, such information has not been independently verified by AMBIT Capital and/or the analyst(s) and no representation or warranty, express or implied, is made as to the accuracy or completeness of any information obtained from third parties. The information, opinions, views expressed in this Research Report are those of the research analyst as at the date of this Research Report which are subject to change and do not represent to be an authority on the subject. AMBIT Capital may or may not subscribe to any and/ or all the views expressed herein.
3. This Research Report should be read and relied upon at the sole discretion and risk of the recipient. If you are dissatisfied with the contents of this complimentary Research Report or with the terms of this Disclaimer, your sole and exclusive remedy is to stop using this Research Report and AMBIT Capital or its affiliates shall not be responsible and/ or liable for any direct/consequential loss howsoever directly or indirectly, from any use of this Research Report.
4. If this Research Report is received by any client of AMBIT Capital or its affiliate, the relationship of AMBIT Capital/its affiliate with such client will continue to be governed by the terms and conditions in place between AMBIT Capital/ such affiliate and the client.
5. This Research Report is issued for information only and the 'Buy', 'Sell', or ‘Other Recommendation’ made in this Research Report such should not be construed as an investment advice to any recipient to acquire, subscribe, purchase, sell, dispose of, retain any securities and should not be intended or treated as a substitute for necessary review or validation or any professional advice. Recipients should consider this Research Report as only a single factor in making any investment decisions. This Research Report is not an offer to sell or the solicitation of an offer to purchase or subscribe for any investment or as an official endorsement of any investment.
6. This Research Report is being supplied to you solely for your information and may not be reproduced, redistributed or passed on, directly or indirectly, to any other person or published, copied in whole or in part, for any purpose. Neither this Research Report nor any copy of it may be taken or transmitted or distributed, directly or indirectly within India or into any other country including United States (to US Persons), Canada or Japan or to any resident thereof. The distribution of this Research Report in other jurisdictions may be strictly restricted and/ or prohibited by law or contract, and persons into whose possession this Research Report comes should inform themselves about such restriction and/ or prohibition, and observe any such restrictions and/ or prohibition.
7. Ambit Capital Private Limited is registered as a Research Entity under the SEBI (Research Analysts) Regulations, 2014.
Conflict of Interests
8. In the normal course of AMBIT Capital’s business circumstances may arise that could result in the interests of AMBIT Capital conflicting with the interests of clients or one client’s interests conflicting with the interest of another client. AMBIT Capital makes best efforts to ensure that conflicts are identified and managed and that clients’ interests are protected. AMBIT Capital has policies and procedures in place to control the flow and use of non-public, price sensitive information and employees’ personal account trading. Where appropriate and reasonably achievable, AMBIT Capital segregates the activities of staff working in areas where conflicts of interest may arise. However, clients/potential clients of AMBIT Capital should be aware of these possible conflicts of interests and should make informed decisions in relation to AMBIT Capital’s services.
9. AMBIT Capital and/or its affiliates may from time to time have or solicit investment banking, investment advisory and other business relationships with companies covered in this Research Report and may receive compensation for the same.
Additional Disclaimer for U.S. Persons
10. The research report is solely a product of AMBIT Capital 11. AMBIT Capital is the employer of the research analyst(s) who has prepared the research report 12. Any subsequent transactions in securities discussed in the research reports should be effected through Enclave Capital LLC. (“Enclave”). 13. Enclave does not accept or receive any compensation of any kind for the dissemination of the AMBIT Capital research reports. 14. The research analyst(s) preparing the email / Research Report/ attachment is resident outside the United States and is/are not associated persons of any U.S. regulated broker-dealer and that
therefore the analyst(s) is/are not subject to supervision by a U.S. broker-dealer, and is/are not required to satisfy the regulatory licensing requirements of FINRA or required to otherwise comply with U.S. rules or regulations regarding, among other things, communications with a subject company, public appearances and trading securities held by a research analyst account.
15. This report is prepared, approved, published and distributed by the Ambit Capital located outside of the United States (a non-US Group Company”). This report is distributed in the U.S.by Enclave Capital LLC, a U.S. registered broker dealer, on behalf of Ambit Capital only to major U.S. institutional investors (as defined in Rule 15a-6 under the U.S. Securities Exchange Act of 1934 (the “Exchange Act”)) pursuant to the exemption in Rule 15a-6 and any transaction effected by a U.S. customer in the securities described in this report must be effected through Enclave Capital LLC (19 West 44th Street, suite 1700, New York, NY 10036).
16. As of the publication of this report Enclave Capital LLC, does not make a market in the subject securities. 17. This document does not constitute an offer of, or an invitation by or on behalf of Ambit Capital or its affiliates or any other company to any person, to buy or sell any security. The information
contained herein has been obtained from published information and other sources, which Ambit Capital or its Affiliates consider to be reliable. None of Ambit Capital accepts any liability or responsibility whatsoever for the accuracy or completeness of any such information. All estimates, expressions of opinion and other subjective judgments contained herein are made as of the date of this document. Emerging securities markets may be subject to risks significantly higher than more established markets. In particular, the political and economic environment, company practices and market prices and volumes may be subject to significant variations. The ability to assess such risks may also be limited due to significantly lower information quantity and quality. By accepting this document, you agree to be bound by all the foregoing provisions.
Additional Disclaimer for Canadian Persons
18. AMBIT Capital is not registered in the Province of Ontario and /or Province of Québec to trade in securities and/or to provide advice with respect to securities. 19. AMBIT Capital's head office or principal place of business is located in India. 20. All or substantially all of AMBIT Capital's assets may be situated outside of Canada. 21. It may be difficult for enforcing legal rights against AMBIT Capital because of the above. 22. Name and address of AMBIT Capital's agent for service of process in the Province of Ontario is: Torys LLP, 79 Wellington St. W., 30th Floor, Box 270, TD South Tower, Toronto, Ontario M5K 1N2
Canada. 23. Name and address of AMBIT Capital's agent for service of process in the Province of Montréal is Torys Law Firm LLP, 1 Place Ville Marie, Suite 1919 Montréal, Québec H3B 2C3 Canada.
Additional Disclaimer for Singapore Persons 24. This Report is prepared and distributed by Ambit Capital Private Limited and distributed as per the approved arrangement under Paragraph 9 of Third Schedule of Securities and Futures Act (CAP
289) and Paragraph 11 of the First Schedule to the Financial Advisors Act (CAP 110) provided to Ambit Singapore Pte. Limited by Monetary Authority of Singapore. 25. This Report is only available to persons in Singapore who are institutional investors (as defined in section 4A of the Securities and Futures Act (Cap. 289) of Singapore (the “SFA”).” Accordingly, if a
Singapore Person is not or ceases to be such an institutional investor, such Singapore Person must immediately discontinue any use of this Report and inform Ambit Singapore Pte. Limited.
Disclosure 26. Ambit and/or its associates have financial interest in Asian Paints.
Analyst Certification Each of the analysts identified in this report certifies, with respect to the companies or securities that the individual analyses, that (1) the views expressed in this report reflect his or her personal views about all of the subject companies and securities and (2) no part of his or her compensation was, is or will be directly or indirectly dependent on the specific recommendations or views expressed in this report. © Copyright 2015 AMBIT Capital Private Limited. All rights reserved.
Ambit Capital Pvt. Ltd. Ambit House, 3rd Floor. 449, Senapati Bapat Marg, Lower Parel, Mumbai 400 013, India. Phone: +91-22-3043 3000 | Fax: +91-22-3043 3100 CIN: U74140MH1997PTC107598 www.ambitcapital.com