company analysis and financial due diligence - nse · pdf filenational stock exchange of ......
TRANSCRIPT

Company Analysis and Financial Due Diligence
March 2015
© CRISIL Limited. All Rights Reserved.
This page is intentionally left blank

© CRISIL Limited. All Rights Reserved.
To,
Mr Jayesh Taori,
National Stock Exchange of India Ltd
Exchange Plaza,
Plot No. C/1, G Block,
Bandra - Kurla Complex
Bandra (E)
Mumbai - 400051
Date: March 23, 2015
Dear Sir,
We refer to your recent meeting with us when you requested us to provide to you a Company Analysis and
Financial Due Diligence Report (“FDD Report”) covering the limited scope as mentioned in the annexure
below and for the purpose of potential listing of Supreme India Impex Ltd (“the Company”) in the Small and
Medium Enterprise (SME) Exchange of the National Stock Exchange (NSE).
We now enclose our Company Analysis and FDD Report dated March 23, 2015. This Company Analysis and
FDD Report is based on the information provided by the company to us and also on the meetings with the
Management of the Company.
For the purpose of preparing the Company Analysis and FDD Report, we have not independently verified the
information provided by the Company or collected by us from other sources. CRISIL does not guarantee the
accuracy, adequacy or completeness of any information contained in such Reports. CRISIL especially states
that it has no financial liability whatsoever to you / the Company / users of the Reports. CRISIL’s Reports
submitted to the NSE do not constitute recommendations to list or not to list the Company on the SME
Exchange.
All the Company Analysis and FDD Reports submitted by CRISIL are confidential and are meant for internal
use only of the NSE and should not be used for purpose other than the potential listing of the Company on the
SME Exchange.
This letter shall form an integral part of the Company Analysis and FDD Reports.
We appreciate the opportunity to conduct financial due diligence on Supreme India Impex Ltd
Yours faithfully,
For CRISIL Ltd
Prasad Koparkar
Senior Director – CRISIL Research

© CRISIL Limited. All Rights Reserved.
Table of contents
Company Analysis ......................................................................................... 6
Financial Due Diligence ................................................................................ 8
Company Overview ............................................................................................. 8
Executive Summary ........................................................................................... 10
Analysis of Financial Statements .............................................................. 12
Income Statement Analysis ............................................................................... 12
Balance sheet analysis ...................................................................................... 22
Appendix ...................................................................................................... 31

© CRISIL Limited. All Rights Reserved. Page | 5
Glossary of terms
AS – Accounting standards
bps – Basis points
Capex – Capital expenditure
CAGR – Cumulative average growth rate
CC – Cash credit
COGS – Cost of goods sold
CWIP – Capital work in progress
DRHP – Draft Red Herring Prospectus
EBITDA – Earnings before interest tax depreciation and
amortisation
EPS – Earnings per share
FA – Fixed assets
FB – Fund based
FG – Finished goods
FIFO – First in first out
FS – Financial statements
FYXX – Financial year ended March 31, 20XX
GFA – Gross fixed assets
MAT – Minimum alternative tax
MIS – Management information system
NDA – Non disclosure agreement
PAT – Profit after tax
PBT – Profit before tax
RM – Raw materials
sq ft – Square feet
y-o-y – year-on-year
© CRISIL Limited. All Rights Reserved. Page | 6
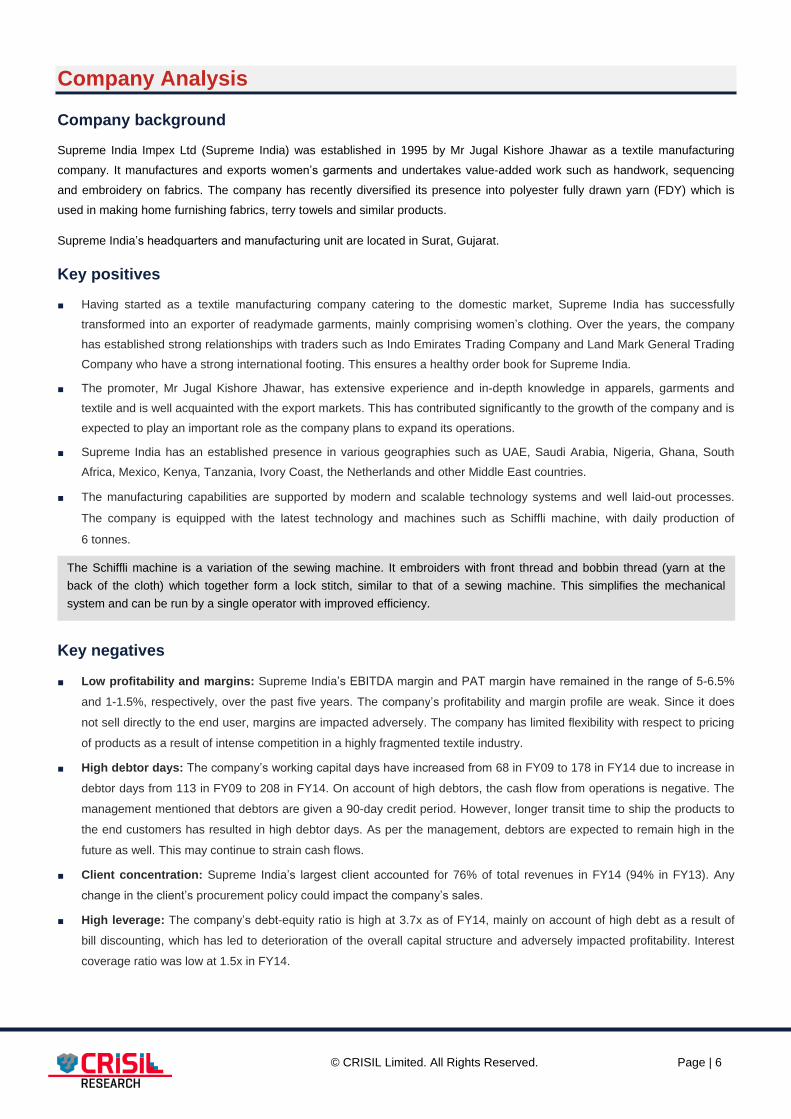
Company Analysis
Company background
Supreme India Impex Ltd (Supreme India) was established in 1995 by Mr Jugal Kishore Jhawar as a textile manufacturing
company. It manufactures and exports women’s garments and undertakes value-added work such as handwork, sequencing
and embroidery on fabrics. The company has recently diversified its presence into polyester fully drawn yarn (FDY) which is
used in making home furnishing fabrics, terry towels and similar products.
Supreme India’s headquarters and manufacturing unit are located in Surat, Gujarat.
Key positives
■ Having started as a textile manufacturing company catering to the domestic market, Supreme India has successfully
transformed into an exporter of readymade garments, mainly comprising women’s clothing. Over the years, the company
has established strong relationships with traders such as Indo Emirates Trading Company and Land Mark General Trading
Company who have a strong international footing. This ensures a healthy order book for Supreme India.
■ The promoter, Mr Jugal Kishore Jhawar, has extensive experience and in-depth knowledge in apparels, garments and
textile and is well acquainted with the export markets. This has contributed significantly to the growth of the company and is
expected to play an important role as the company plans to expand its operations.
■ Supreme India has an established presence in various geographies such as UAE, Saudi Arabia, Nigeria, Ghana, South
Africa, Mexico, Kenya, Tanzania, Ivory Coast, the Netherlands and other Middle East countries.
■ The manufacturing capabilities are supported by modern and scalable technology systems and well laid-out processes.
The company is equipped with the latest technology and machines such as Schiffli machine, with daily production of
6 tonnes.
Key negatives
■ Low profitability and margins: Supreme India’s EBITDA margin and PAT margin have remained in the range of 5-6.5%
and 1-1.5%, respectively, over the past five years. The company’s profitability and margin profile are weak. Since it does
not sell directly to the end user, margins are impacted adversely. The company has limited flexibility with respect to pricing
of products as a result of intense competition in a highly fragmented textile industry.
■ High debtor days: The company’s working capital days have increased from 68 in FY09 to 178 in FY14 due to increase in
debtor days from 113 in FY09 to 208 in FY14. On account of high debtors, the cash flow from operations is negative. The
management mentioned that debtors are given a 90-day credit period. However, longer transit time to ship the products to
the end customers has resulted in high debtor days. As per the management, debtors are expected to remain high in the
future as well. This may continue to strain cash flows.
■ Client concentration: Supreme India’s largest client accounted for 76% of total revenues in FY14 (94% in FY13). Any
change in the client’s procurement policy could impact the company’s sales.
■ High leverage: The company’s debt-equity ratio is high at 3.7x as of FY14, mainly on account of high debt as a result of
bill discounting, which has led to deterioration of the overall capital structure and adversely impacted profitability. Interest
coverage ratio was low at 1.5x in FY14.
The Schiffli machine is a variation of the sewing machine. It embroiders with front thread and bobbin thread (yarn at the
back of the cloth) which together form a lock stitch, similar to that of a sewing machine. This simplifies the mechanical
system and can be run by a single operator with improved efficiency.

© CRISIL Limited. All Rights Reserved. Page | 7
Key risks
■ Supreme India manufactures and exports women’s garments in specific styles and patterns. Demand for its products is
highly sensitive to changes in fashion and trends in the respective geographies. Hence, the company needs to constantly
keep itself abreast of the changing fashion trends. Any potential change in the consumer’s preference can impact Supreme
India’s business.
■ The company does not own any brand and sells its products under the label ‘Trendz’ and ‘Bestex’. Without the ownership
of a brand, it may not be able to command a premium and would have to depend on traders and other intermediaries for
business, which affects the margins and profitability adversely. Given Supreme India’s limited clientele, any change in the
client’s procurement strategy and policies will directly impact Supreme India’s business performance.
■ The remuneration paid to the key management personnel (KMP) and promoters is low. A raise in remuneration can
adversely impact PAT. The company has passed a resolution to increase the remuneration of promoter director to ₹1.2 mn
post H1FY15.
Management and corporate governance
■ The management is promoter-driven. Promoter Jugal Kishore Jhawar is the managing director. He is supported by his son
Abhishek Jhawar, who heads the marketing (domestic and exports) function. Based on our interactions with the
management, we believe that the decision making is centralised and rests mainly with Mr Jugal Kishore Jhawar.
■ As of August 2014, the board consists of three members including the chairman and managing director and two non-
executive directors. Ms Sarita Devi Jhawar, promoter’s wife, and Ms Bhanwaridevi Jhawar, promoter’s mother, are the non-
executive directors. Apart from general mentorship, they have no active role in business operations.
■ The company owes outstanding interest-free loans of ₹23 mn to the promoter group. As per our interaction with the
management, such covenants are required by the banks for disbursement of loans. Though unlikely, any change in the
covenants of such loans may affect the profitability.
Key financials
■ Supreme India’s revenues have grown at a strong CAGR of 25% over FY10-14 to ₹3.4 bn driven by growth in sales
volumes and addition of new capacity over the years. In FY13, the company diversified its presence into polyester FDY,
which contributes ~15% to total revenues.
■ EBITDA margin has remained between 6% and 6.5% over the past five years.
■ PAT has increased at a CAGR of 29% over FY10-14 to ₹53 mn. PAT margin has remained low in the range of 1%-1.5%
over the past five years due to low EBITDA margin and significantly high interest cost. Interest cost increased from ₹47 mn
in FY10 to ₹146 mn in FY14.
■ Supreme India’s RoE is low and has been in the range of 12-12.5% over the past five years.

© CRISIL Limited. All Rights Reserved. Page | 8
Executive Summary Analysis of Financial Statements Appendix
Company Overview
Financial Due Diligence
Company Overview
Business Overview
■ Supreme India manufactures and exports women’s garments and undertakes value-added work such as handwork, sequencing and embroidery on fabrics. It was established in 1995 by
Mr Jugal Kishore Jhawar. The company exports nearly all of its production (99% in FY14), through intermediaries (trading companies) in UAE, to Turkey, Nigeria, Ghana, South Africa,
Mexico, Kenya, Tanzania, Ivory Coast, the Netherlands and other Middle East Countries.
■ Supreme India has a manufacturing unit in GIDC, Surat, Gujarat.
Products
Brief Description
Sarees Supreme India manufactures a range of sarees catergorised as designer, ethnic, embroidered, printed, silk, embroidered and handloom sarees. The company
offers tailor-made products as per client’s specifications.
Salwaar suits The company specialises in undertaking value-added work such as decoration cuts, curves, patches, embroidery, floral work, thread work, sippy work, glass
work on salwars.
Fabrics The fabric line of the company features an extensive range of dyed, knitted, printed and cotton fabrics.
Embroidery Accessories The company specialises in embroidery on a range of casual and high fashion fabrics in cotton, silk, polyester, viscose, linen, tulle, net and organza.
Yarn Doubling The company started yarn doubling & twisting in FY14. The Company purchases, doubles and twists the yarn as per the customer specific requirements and
exports it to foreign countries.
Source: Company, CRISIL Research
© CRISIL Limited. All Rights Reserved. Page | 9
Executive Summary Analysis of Financial Statements Appendix
Company Overview
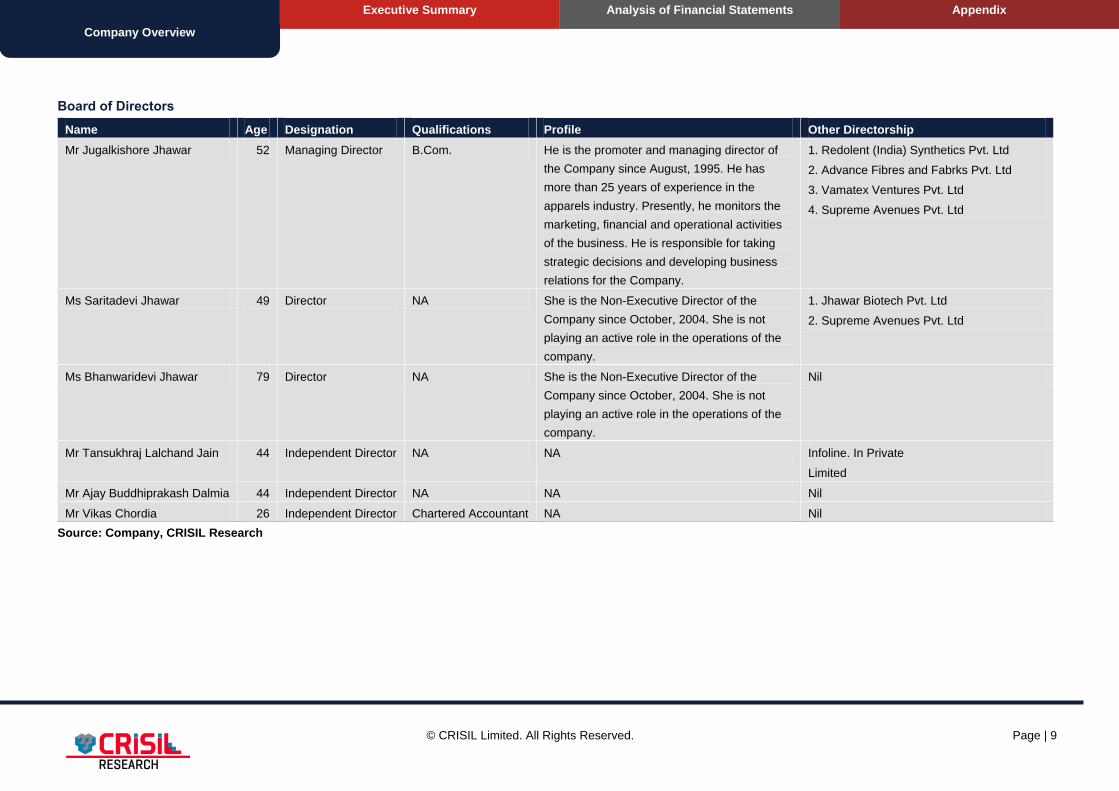
Board of Directors
Name Age Designation Qualifications Profile Other Directorship
Mr Jugalkishore Jhawar 52 Managing Director B.Com. He is the promoter and managing director of
the Company since August, 1995. He has
more than 25 years of experience in the
apparels industry. Presently, he monitors the
marketing, financial and operational activities
of the business. He is responsible for taking
strategic decisions and developing business
relations for the Company.
1. Redolent (India) Synthetics Pvt. Ltd
2. Advance Fibres and Fabrks Pvt. Ltd
3. Vamatex Ventures Pvt. Ltd
4. Supreme Avenues Pvt. Ltd
Ms Saritadevi Jhawar 49 Director NA She is the Non-Executive Director of the
Company since October, 2004. She is not
playing an active role in the operations of the
company.
1. Jhawar Biotech Pvt. Ltd
2. Supreme Avenues Pvt. Ltd
Ms Bhanwaridevi Jhawar 79 Director NA She is the Non-Executive Director of the
Company since October, 2004. She is not
playing an active role in the operations of the
company.
Nil
Mr Tansukhraj Lalchand Jain 44 Independent Director NA NA Infoline. In Private
Limited
Mr Ajay Buddhiprakash Dalmia 44 Independent Director NA NA Nil
Mr Vikas Chordia 26 Independent Director Chartered Accountant NA Nil
Source: Company, CRISIL Research

© CRISIL Limited. All Rights Reserved. Page | 10
Company Overview Analysis of Financial Statements Appendix
Executive Summary
Executive Summary
Key Findings
i) High debtor days leading to stretched working capital
Background Comments / implications Management comments
■ Supreme India’s debtor days have increased to
208 in FY14 from 120 in FY10. As a result,
working capital days have increased to 178
from 130 in FY10.
■ Debtors are expected to remain high as it is mainly on account
of the longer transit time taken to ship the products to the end
customer. Further, the company provides 90-day credit to its
clients. Hence, we expect the working capital days to remain
high and cash flows to remain stretched.
■ According to the management, the company provides
about 90-day credit to its clients. Further, the transit
time taken to ship the goods to the end customer is
high due to various trade clearances at different
countries. As a result, debtor days and, hence, the
working capital days are expected to remain high.
ii) High debt levels leading to weak capital structure
Background Comments / implications Management Comments
■ The company’s debt-equity ratio was as high as
3.7x in FY14. The interest coverage ratio was
low at 1.5x.
■ Debt is highly mainly on account of bill
discounting facility availed from banks to meet
the working capital requirements.
■ The financial risk is high given the high gearing.
■ The company has raised a large amount of debt to fund its
working capital requirements which has resulted in high interest
cost, thereby resulting in low PAT margins. Given the high
debt-equity ratio and low interest coverage ratio, any
incremental debt to fund the working capital requirements and
future expansion plans may impact the profitability adversely
and is a risk.
■ As per the management, significant amount of funds
are needed for the working capital requirements. IPO
proceeds will help reduce the debt-equity ratio slightly.
The management also indicated some expansion
plans which would be partially funded by debt.

© CRISIL Limited. All Rights Reserved. Page | 11
Company Overview Analysis of Financial Statements Appendix
Executive Summary
iii) Investment in a subsidiary which plans to start a project on cotton spinning
Background Comments / implications Management Comments
■ In FY14, the company purchased the business of Utility
Aquatech Pvt. Ltd for a sum of ₹105 mn. Utility Aquatech is
now a subsidiary of Supreme India.
■ At present, Utility Aquatech is a non-functioning company. It
has about 45 acres land in Kosamba near Surat.
■ As per the management, the company will
commence a project on cotton spinning and
garments on the land and resources of Utility
Aquatech.
iv) The remuneration of KMP and promoters is low
Background Comments / implications Management Comments
■ Promoter director, Mr Jugal Kishore Jhawar, received
salary of ₹0.4 mn in FY14.
■ The salary paid to KMP is low vis-à-vis their roles and
responsibilities.
■ The company has passed a resolution to increase the
remuneration of promoter director to ₹1.2 mn post H1FY15.
■ The current salary cost may not be representative of future
cost. Salaries may increase post fund raising, impacting future
profitability.
■ As per the management, there was a need to
plough back profits into the company and,
hence, they have not increased the salaries
significantly. Salaries are likely to increase
gradually in the future.
Details of annual salary of promoters and KMP (FY14)
Name Designation CTC (₹ mn per annum)
Mr Jugal Kishore Jhawar Chairman and MD 0.4
Ms Sarita Devi Jugal Kishore Jhawar Non-executive director -
Ms Bhanwaridevi Chhaganlal Jhawar Non-executive director -
Dheeraj Jaiswal Accounts Manager 0.6
Abhishek Jhawar Export Marketing Manager 0.4
Suresh Babu R Export Manager 0.4
P.B. Pandey Production Manager 0.6
Sarvesh Kumar Production Manager (Yarn) 0.4
Narayan Prasad Jhawar Research & Development Manager 0.2
Rajesh Jivnani Admin & Control Manager 1.2
Source: Company
© CRISIL Limited. All Rights Reserved. Page | 12
Company Overview Company Overview Appendix
Analysis of Financial Statements
Analysis of Financial Statements
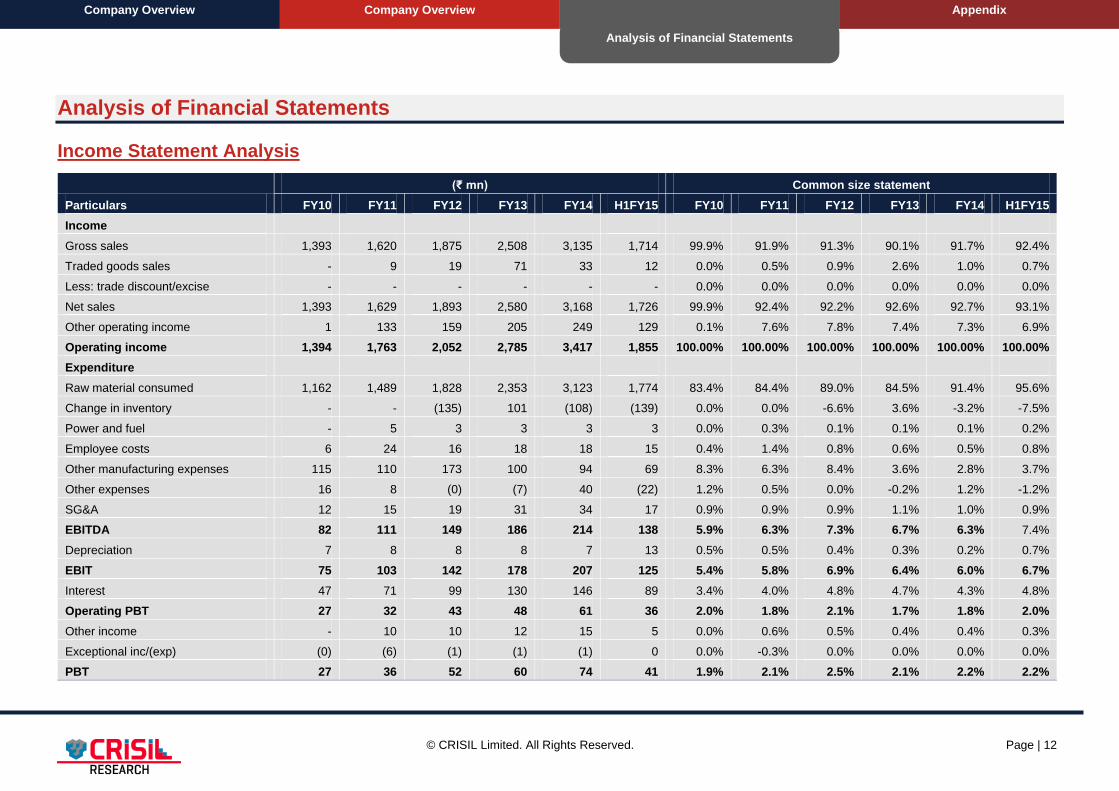
Income Statement Analysis
Particulars
(₹ mn) Common size statement
FY10 FY11 FY12 FY13 FY14 H1FY15 FY10 FY11 FY12 FY13 FY14 H1FY15
Income
Gross sales 1,393 1,620 1,875 2,508 3,135 1,714 99.9% 91.9% 91.3% 90.1% 91.7% 92.4%
Traded goods sales - 9 19 71 33 12 0.0% 0.5% 0.9% 2.6% 1.0% 0.7%
Less: trade discount/excise - - - - - - 0.0% 0.0% 0.0% 0.0% 0.0% 0.0%
Net sales 1,393 1,629 1,893 2,580 3,168 1,726 99.9% 92.4% 92.2% 92.6% 92.7% 93.1%
Other operating income 1 133 159 205 249 129 0.1% 7.6% 7.8% 7.4% 7.3% 6.9%
Operating income 1,394 1,763 2,052 2,785 3,417 1,855 100.00% 100.00% 100.00% 100.00% 100.00% 100.00%
Expenditure
Raw material consumed 1,162 1,489 1,828 2,353 3,123 1,774 83.4% 84.4% 89.0% 84.5% 91.4% 95.6%
Change in inventory - - (135) 101 (108) (139) 0.0% 0.0% -6.6% 3.6% -3.2% -7.5%
Power and fuel - 5 3 3 3 3 0.0% 0.3% 0.1% 0.1% 0.1% 0.2%
Employee costs 6 24 16 18 18 15 0.4% 1.4% 0.8% 0.6% 0.5% 0.8%
Other manufacturing expenses 115 110 173 100 94 69 8.3% 6.3% 8.4% 3.6% 2.8% 3.7%
Other expenses 16 8 (0) (7) 40 (22) 1.2% 0.5% 0.0% -0.2% 1.2% -1.2%
SG&A 12 15 19 31 34 17 0.9% 0.9% 0.9% 1.1% 1.0% 0.9%
EBITDA 82 111 149 186 214 138 5.9% 6.3% 7.3% 6.7% 6.3% 7.4%
Depreciation 7 8 8 8 7 13 0.5% 0.5% 0.4% 0.3% 0.2% 0.7%
EBIT 75 103 142 178 207 125 5.4% 5.8% 6.9% 6.4% 6.0% 6.7%
Interest 47 71 99 130 146 89 3.4% 4.0% 4.8% 4.7% 4.3% 4.8%
Operating PBT 27 32 43 48 61 36 2.0% 1.8% 2.1% 1.7% 1.8% 2.0%
Other income - 10 10 12 15 5 0.0% 0.6% 0.5% 0.4% 0.4% 0.3%
Exceptional inc/(exp) (0) (6) (1) (1) (1) 0 0.0% -0.3% 0.0% 0.0% 0.0% 0.0%
PBT 27 36 52 60 74 41 1.9% 2.1% 2.5% 2.1% 2.2% 2.2%
© CRISIL Limited. All Rights Reserved. Page | 13
Company Overview Company Overview Appendix
Analysis of Financial Statements
Particulars
(₹ mn) Common size statement
FY10 FY11 FY12 FY13 FY14 H1FY15 FY10 FY11 FY12 FY13 FY14 H1FY15
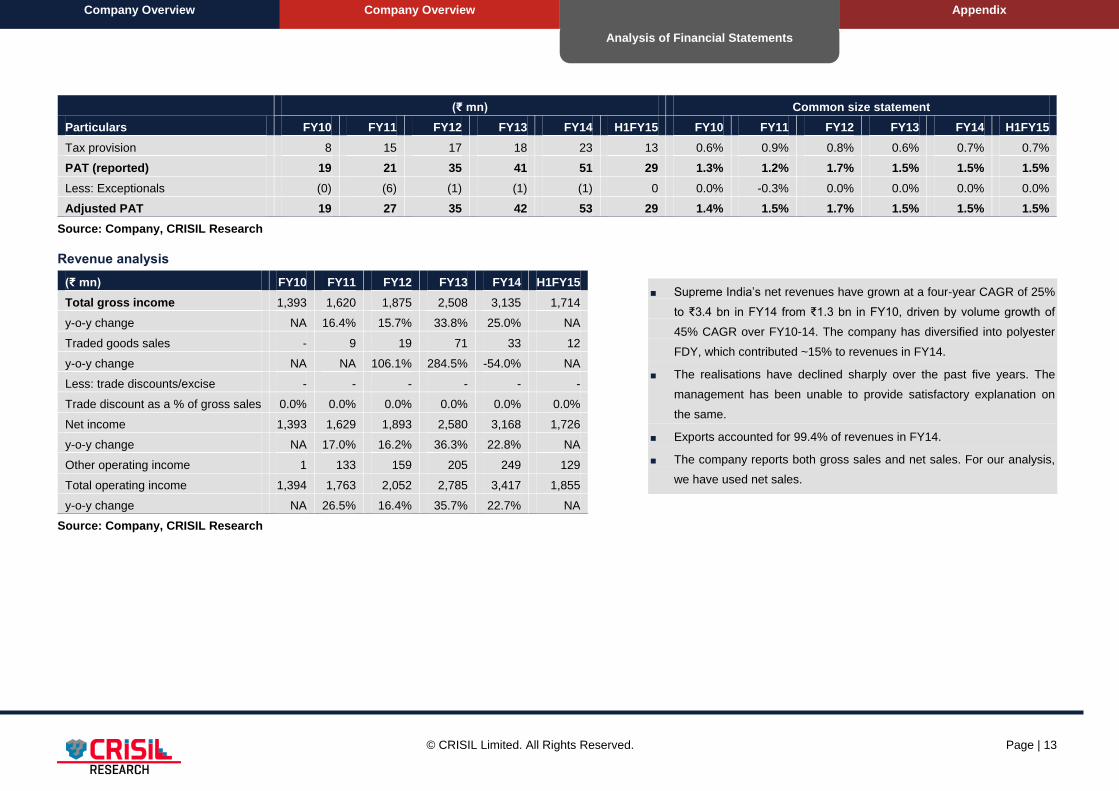
Tax provision 8 15 17 18 23 13 0.6% 0.9% 0.8% 0.6% 0.7% 0.7%
PAT (reported) 19 21 35 41 51 29 1.3% 1.2% 1.7% 1.5% 1.5% 1.5%
Less: Exceptionals (0) (6) (1) (1) (1) 0 0.0% -0.3% 0.0% 0.0% 0.0% 0.0%
Adjusted PAT 19 27 35 42 53 29 1.4% 1.5% 1.7% 1.5% 1.5% 1.5%
Source: Company, CRISIL Research
Revenue analysis
(₹ mn) FY10 FY11 FY12 FY13 FY14 H1FY15
Total gross income 1,393 1,620 1,875 2,508 3,135 1,714
y-o-y change NA 16.4% 15.7% 33.8% 25.0% NA
Traded goods sales - 9 19 71 33 12
y-o-y change NA NA 106.1% 284.5% -54.0% NA
Less: trade discounts/excise - - - - - -
Trade discount as a % of gross sales 0.0% 0.0% 0.0% 0.0% 0.0% 0.0%
Net income 1,393 1,629 1,893 2,580 3,168 1,726
y-o-y change NA 17.0% 16.2% 36.3% 22.8% NA
Other operating income 1 133 159 205 249 129
Total operating income 1,394 1,763 2,052 2,785 3,417 1,855
y-o-y change NA 26.5% 16.4% 35.7% 22.7% NA
Source: Company, CRISIL Research
■ Supreme India’s net revenues have grown at a four-year CAGR of 25%
to ₹3.4 bn in FY14 from ₹1.3 bn in FY10, driven by volume growth of
45% CAGR over FY10-14. The company has diversified into polyester
FDY, which contributed ~15% to revenues in FY14.
■ The realisations have declined sharply over the past five years. The
management has been unable to provide satisfactory explanation on
the same.
■ Exports accounted for 99.4% of revenues in FY14.
■ The company reports both gross sales and net sales. For our analysis,
we have used net sales.

© CRISIL Limited. All Rights Reserved. Page | 14
Company Overview Company Overview Appendix
Analysis of Financial Statements
Geographical break-down of revenues
(₹ mn) FY10 FY11 FY12 FY13 FY14 H1FY15
Revenues from manufactured goods
Exports 1,215 1,552 1,838 2,470 3,116 1,710
Domestic 0 2 5 1 3 0
Revenues from traded goods
Exports - 9 19 71 33 12
Domestic - - - - - -
Revenues from services rendered
Job work charges 58 67 32 38 16 3
Other operating revenues
Duty drawback and export incentives 120 134 160 206 250 128
Total revenues 1,393 1,764 2,054 2,786 3,418 1,855
Share of exports in revenues 96% 96% 98% 99% 99% 100%
Source: Company, CRISIL Research
Capacity and Production
■ Supreme India’s manufacturing facility is equipped with the latest technology including three Schiffli machines from Switzerland and 22 yarn doubling machines.
■ The Schiffli machines are capable of making 194,4000 stitches per day and have been running at ~80% utilisation over the past three years. Yarn doubling machines have a daily
capacity of manufacturing 6 tonnes.

© CRISIL Limited. All Rights Reserved. Page | 15
Company Overview Company Overview Appendix
Analysis of Financial Statements
Supreme India’s top customers
Top clients (FY14)
Amount
(₹ mn)
as % of
total
Indo Emirates Trading Co. LLC 2,418 76%
Land Mark General Trading Co. FZE 560 18%
Titanium Trading FZE 170 5%
Others 20 1%
Total *3,168 99%
*Excludes duty drawback
Top clients (FY13)
Amount
(₹ mn)
as % of
total
Indo Emirates Trading Co. LLC 2,417 94%
Land Mark General Trading Co. FZE 97 4%
Titanium Trading FZE 6 0%
Total *2,580 98%
*Excludes duty drawback
Top clients (FY12)
Amount
(₹ mn)
as % of
total
Indo Emirates Trading Co. LLC 1,599 84%
Land Mark General Trading Co. FZE 249 13%
Total 1,893 98%
Source: Company, CRISIL Research
■ Over the past three years, the company’s top client has been Indo Emirates Trading Co. LLC (Indo Emirates) with 76% contribution to overall revenues in FY14 and 94% in FY13. The
company has two other clients. We believe that high dependence on this group of three is a key risk for the company as any change in their procurement policy, especially of Indo
Emirates, could adversely impact Supreme India’s sales.

© CRISIL Limited. All Rights Reserved. Page | 16
Company Overview Company Overview Appendix
Analysis of Financial Statements
Seasonality of revenues
Quarterly income break-down
Source: Company, CRISIL Research
■ Supreme India’s revenues do not exhibit seasonality.
Raw material cost
(₹ mn) FY10 FY11 FY12 FY13 FY14 H1FY15
Raw material cost 1,162 1,489 1,693 2,454 3,015 1,634
Raw material cost as a % of sales 83.4% 84.4% 82.5% 88.1% 88.2% 88.1%
Source: Company, CRISIL Research
■ Supreme India’s main raw material is fabric in case of embroidery/printing, and polyester FDY in case of doubling and twisting. The company locally procures all raw materials.
■ Its raw material cost as a percentage of sales has increased from 83.4% in FY10 to 88.2% in FY14. The management has attributed this increase to rise in yarn prices and change in
product mix. We found the explanation of the increase in raw material cost unsatisfactory.
26.0%16.9% 17.0%
28.9%
26.7%
40.3%
15.3%27.2%
28.1%
29.8% 29.1%
14.6%
0%
10%
20%
30%
40%
50%
60%
70%
80%
90%
100%
FY12 FY13 FY14
Q1 Q2 Q3 Q4

© CRISIL Limited. All Rights Reserved. Page | 17
Company Overview Company Overview Appendix
Analysis of Financial Statements
Power and fuel cost
(₹ mn) FY10 FY11 FY12 FY13 FY14 H1FY15
Power and fuel cost - 5 3 3 3 3
Power and fuel cost as a % of sales 0.0% 0.3% 0.1% 0.1% 0.1% 0.2%
Source: Company, CRISIL Research
■ Power and fuel cost accounts for 0.1% of the company’s sales since garment manufacturing is not capital-intensive and requires more labour than machinery.
Manufacturing expenses
(₹ mn) FY10 FY11 FY12 FY13 FY14 H1FY15
Job work expenses and processing charges paid 78.0 103.9 164.6 92.1 86.5 57.5
Repairs to building, plant and machinery 0.7 0.8 0.6 1.0 2.0 1.3
Insurance 3.2 3.5 4.4 3.9 3.8 2.1
Factory expenses 0.6 0.5 0.8 0.8 0.6 0.2
Other expenses 16.3 1.6 2.1 1.8 1.4 7.8
As a % of sales 7.1% 6.3% 8.4% 3.6% 2.8% 3.7%
Source: Company, CRISIL Research
■ Manufacturing expenses as a percentage of sales decreased significantly from 7.1% in FY10 to 2.8% in FY14 due to increase in outsourcing of job work.
Employee cost
(₹ mn) FY10 FY11 FY12 FY13 FY14 H1FY15
Employee cost 15 24 16 18 18 15
Employee cost as a % of sales 1.1% 1.4% 0.8% 0.6% 0.5% 0.8%
Source: Company, CRISIL Research
Remuneration of promoters
₹ mn FY10 FY11 FY12 FY13 FY14 H1FY15
Mr Jugal Kishore Jhawar - - 0.4 0.4 0.4 0.3
As a percentage of net profit 0.0% 0.0% 1.0% 0.9% 0.7% 1.1%
Note: Remuneration excludes perquisites
Source: Company, CRISIL Research

© CRISIL Limited. All Rights Reserved. Page | 18
Company Overview Company Overview Appendix
Analysis of Financial Statements
■ Employee cost is 0.5-1% of operating income. The company currently has 47 employees excluding labour personnel. (Data is awaited from the company regarding number of employees
on rolls.)
■ The promoter, Mr Jugal Kishore Jhawar, drew ₹0.4 mn (0.7% of PAT) as total salary in FY14.
Salary of KMP
Name Designation CTC (₹ mn per annum)
Mr Abhishek Jhawar Export Marketing Manager 0.4
Ruchita Jhawar Designing Manager 0.2
Dheeraj Jaiswal Accounts Manager 0.6
Suresh Babu R Export Manager 0.4
P.B. Pandey Production Manager 0.6
Sarvesh Kumar Production Manager (Yarn) 0.4
Narayan Prasad Jhawar Research & Development Manager 0.2
Rajesh Jivnani Admin & Control Manager 1.2
Source: Company, CRISIL Research
■ In our opinion, salaries of some of the KMP are on the lower side and the company may have to raise the salary levels to retain the key employees.
Other expenses
(₹ mn) FY10 FY11 FY12 FY13 FY14 H1FY15
Rent rates and taxes 0.2 0.3 0.9 1.1 1.5 1.2
Directors fees, allowances, audit fees, legal expenses 1.9 2.9 1.8 3.0 7.0 1.2
Travelling and conveyance 2.3 1.9 2.4 2.6 2.9 2.0
Postage phone and telex 1.9 0.8 0.9 0.6 0.7 0.3
Printing and stationery 1.8 0.4 0.2 0.2 0.3 0.2
Donations 0.0 0.0 0.1 0.1 0.6 0.3
Vehicle expenses 1.9 0.5 0.5 0.5 0.5 0.3
Net loss on foreign currency transactions and translation - 1.2 - - 26.5 (27.5)
Miscellaneous expenses 0.1 0.1 0.3 0.3 0.2 0.1
As a % of sales 0.73% 0.46% 0.35% 0.30% 1.17% NM
Source: Company, CRISIL Research

© CRISIL Limited. All Rights Reserved. Page | 19
Company Overview Company Overview Appendix
Analysis of Financial Statements
■ Other expenses excluding foreign exchange gain/loss have been less than 1% of sales.
■ Exports account for nearly 100% sales. The company sold forward contracts in FY14 and incurred a net loss of ₹26 mn on the same due to rupee depreciation.
■ The company reported a gain of ₹27.5 mn on foreign currency transactions and translation in H1FY15.
Selling, general and administrative (SG&A) expenses
(₹ mn) FY10 FY11 FY12 FY13 FY14 H1FY15
Sampling and promotion 0.1 0.6 0.8 0.4 0.6 0.1
Commission and sales discount 2.5 3.3 2.3 2.0 2.6 0.0
Freight outward 10.9 11.3 15.7 28.8 30.5 17.3
Total 0.8 15.1 18.8 31.2 33.6 17.5
As a % of sales 0.06% 0.86% 0.92% 1.12% 0.98% 0.94%
Source: Company, CRISIL Research
■ SG&A expenses as a percentage of sales have been low at less than 1% as Supreme India only manufactures apparels and does not incur advertising and sales promotion expenses.
This is in line with the industry.
EBITDA margin
FY10 FY11 FY12 FY13 FY14 H1FY15
Raw material consumed 83.9% 84.4% 82.5% 88.1% 88.2% 88.1%
Power and fuel 0.3% 0.3% 0.1% 0.1% 0.1% 0.2%
Employee costs 1.1% 1.4% 0.8% 0.6% 0.5% 0.8%
Other manufacturing expenses 7.1% 6.3% 8.4% 3.6% 2.8% 3.7%
Other expenses 0.3% 0.5% 0.0% -0.2% 1.2% -1.2%
SG&A 1.0% 0.9% 0.9% 1.1% 1.0% 0.9%
EBITDA 6.4% 6.3% 7.3% 6.7% 6.3% 7.4%
Source: Company, CRISIL Research
■ Supreme India’s EBITDA margin has remained low and flat between 6% and 6.5% over the past five years. The key reasons are:
– Dependence on trading companies to sell the products to the end user.
– Intense competition in the garment manufacturing industry which limits the flexibility with respect to pricing of the products.

© CRISIL Limited. All Rights Reserved. Page | 20
Company Overview Company Overview Appendix
Analysis of Financial Statements
Finance charges
(₹ mn) FY10 FY11 FY12 FY13 FY14 H1FY15
Interest expense 49 67 92 123 138 84
Other borrowing cost 4 4 7 7 8 5
Total interest cost 53 71 99 130 146 89
Interest cost as a % of sales 3.8% 4.0% 4.8% 4.7% 4.3% 4.8%
Year end borrowings 605 757 1,032 1,383 1,681 1,774
Interest rate (on average borrowings) 10.07% 10.41% 11.08% 10.78% 9.54% 10.3%
Source: Company, CRISIL Research
■ Supreme India’s interest expense has increased significantly from ₹49 mn in FY10 to ₹138 mn in FY14. This was mainly on account of increase in debt to fund incremental working
capital requirement – working capital loans have increased from ₹546 mn to ₹1,648 mn over the same period.
Depreciation
(₹ mn) FY10 FY11 FY12 FY13 FY14 H1FY15
Depreciation 7 8 8 8 7 13
Depreciation as a % of sales 0.5% 0.5% 0.4% 0.3% 0.2% 0.7%
Gross block 137 152 152 153 170 180
Depreciation rate (% of average gross block) 5.85% 5.56% 4.99% 5.11% 4.39% 14.8%
Note: Details of gross block additions are provided under fixed assets
Source: Company, CRISIL Research

© CRISIL Limited. All Rights Reserved. Page | 21
Company Overview Company Overview Appendix
Analysis of Financial Statements
■ The depreciation expense is expected to increase going forward as the company started its yarn doubling and twisting operations in FY14 and installed machinery for the same.
Depreciation on all assets is provided on the written-down value method as per Schedule XIV of the Companies Act, 1956, except for plant and machinery where it is provided on the
straight-line method.
Tax rate and net income
(₹ mn) FY10 FY11 FY12 FY13 FY14 H1FY15
Profit before tax 34 42 53 60 75 41
PBT margin 2.5% 2.4% 2.6% 2.2% 2.2% 2.2%
Tax 8 15 17 18 23 13
Effective tax rate (%) 30.7% 41.5% 33.0% 30.4% 30.7% 30.7%
Net profit 19 21 35 41 51 29
Adjusted net profit 26 27 35 42 53 29
Adjusted net profit margin (%) 1.9% 1.5% 1.7% 1.5% 1.5% 1.5%
Source: Company, CRISIL Research
■ PBT margin declined from 2.5% in FY10 to 2.2% in FY14 mainly due to low EBITDA margin and significant increase in interest cost.
■ Adjusted net profit grew at a four-year CAGR of 19% to ₹53 mn in FY14 from ₹26 mn in FY10. Adjusted net profit margin declined from 1.9% in FY10 to 1.5% in FY13.

© CRISIL Limited. All Rights Reserved. Page | 22
Company Overview Company Overview Appendix
Analysis of Financial Statements
Balance sheet analysis
(₹ mn) FY10 FY11 FY12 FY13 FY14 H1FY15
Particulars FY10 FY11 FY12 FY13 FY14 H1FY15
Liabilities
Activity ratios
Equity share capital 25 30 31 32 36 36
Inventory days 45 46 52 34 29 52
Others 157 239 284 329 424 448
Creditor days 16 28 19 11 35 92
Reserves and surplus - - - - - -
Debtor days 120 148 174 177 208 233
Net worth 182 269 316 361 460 483
Working capital days 130 149 201 171 178 371
Convertible debt
Gross asset turnover (x) 11.4 12.2 2.1 18.3 21.2 21.2
Other debt 605 757 1,032 1,383 1,681 1,774
Net asset turnover (x) 12.3 13.8 7.0 23.1 28.0 29.4
Total debt 605 757 1,032 1,383 1,681 1,774
Sales/operating assets (x) 12.3 13.8 19.3 23.1 28.0 14.7
Deferred tax liability (net) 6 9 10 10 12 11
Total liabilities 793 1,035 1,357 1,754 2,152 2,269
Liquidity ratio
Assets
Current ratio (x) 11.7 7.4 11.6 17.6 6.8 3.3
Net fixed assets 124 131 125 117 127 125
Capital WIP - - - - - 0
Capital structure ratios
Total fixed assets 124 131 125 117 127 125
Debt-equity (x) 3.3 2.8 3.3 3.8 3.7 3.7
Investments 0 0 0 0 105 105
Net debt/equity (x) 2.9 2.6 3.0 3.4 3.5 3.5
Current assets
Interest coverage 1.5 1.5 1.4 1.4 1.4 1.4
Inventory 159 205 270 237 253 495
Sundry debtors 458 716 896 1,213 1,786 2,202
Profitability / return ratios
Loans and advances 42 62 83 130 133 118
EBITDA margin (%) 6.4 6.3 7.3 6.7 6.3 7.4
Cash & bank balance 71 62 99 155 78 105
Adj PAT Margin (%) 1.9 1.5 1.7 1.5 1.5 1.5
Marketable securities - - - - - -
RoE (%) 17.2 11.9 12.1 12.4 12.8 12.1
Total current assets 731 1,045 1,349 1,735 2,250 2,921
RoCE (%) 12.0 11.4 11.9 11.5 10.6 11.4
Current liabilities
Creditors 58 129 99 79 307 873
Provisions 4 13 18 19 24 10
Total current liabilities 62 142 117 99 330 883
Net current assets 669 903 1,232 1,637 1,919 2,038
Intangibles/misc. expenditure 0 0 0 0 0 0
Total assets 793 1,035 1,357 1,754 2,152 2,269
Source: Company, CRISIL Research

© CRISIL Limited. All Rights Reserved. Page | 23
Company Overview Company Overview Appendix
Analysis of Financial Statements
Equity share capital
■ As of FY14, Supreme India has one class of equity share (3,575,319 in number) with a face value of ₹10 each.
■ The company’s share capital has increased from ₹25 mn in FY10 to ₹36 mn in FY14. The shares were subscribed by the promoters at a premium.
Movement in Supreme India’s net worth
(₹ mn) FY10 FY11 FY12 FY13 FY14 H1FY15
Share capital 25 30 31 32 36 36
Share premium 100 162 174 180 224 224
Others - - - - 2 (0)
Reserves & surplus 57 77 110 150 199 224
Shareholders' funds 182 269 316 361 460 483
Source: Company, CRISIL Research
Build-up of equity share capital
Allotment details Allotment to Number of shares allotted Issue price Cumulative paid up capital (₹ mn)
30-May-95 Promoters and promoter group 7,000 10 0
15-Apr-97 Promoters and promoter group 112,000 10 1
25-Mar-98 Promoters and promoter group 172,000 10 2
31-Mar-02 Promoters and promoter group 452,000 10 5
31-Mar-06 Bonus Issue 1,356,000 - 14
31-Mar-07 Promoters and promoter group 1,431,000 80 14
25-Mar-08 Promoters and promoter group 1,474,880 75 15
31-Mar-08 Promoters and promoter group 1,694,880 80 17
31-Mar-09 Promoters and promoter group 1,923,380 100 19
19-Nov-09 Promoters and promoter group 2,123,380 100 21
31-Mar-10 Promoters and promoter group 2,455,380 125 25
31-Mar-11 Promoters and promoter group 2,992,670 125 30
31-Mar-12 Promoters and promoter group 3,101,670 100 31
31-Mar-12 Promoters and promoter group 3,128,670 100 31

© CRISIL Limited. All Rights Reserved. Page | 24
Company Overview Company Overview Appendix
Analysis of Financial Statements
Allotment details Allotment to Number of shares allotted Issue price Cumulative paid up capital (₹ mn)
31-Mar-13 Promoters and promoter group 3,175,270 125 32
31-Mar-14 Promoters and promoter group 3,575,319 120 36
Source: Company, CRISIL Research
Borrowings
■ As of FY14, the company has loans worth ₹1,681 mn – ₹32 mn long-term loan and ₹1,684 mn short-term loan (details in Appendix 2).
(₹ mn) FY10 FY11 FY12 FY13 FY14 H1FY15
Working capital loan (secured) 546 713 1,003 1,339 1,648 1,717
Loans from related party (unsecured) 4 1 - 26 23 46
Term loans (secured) 49 30 17 8 5 6
Term loans (unsecured) 6 3 1 - - -
Long-term debt due within one year NA 10 11 10 4 4
Total 605 757 1,032 1,383 1,681 1,774
Source: Company, CRISIL Research
■ Working capital loan
Working capital loans totalling ₹1,772 mn have been taken from Canara Bank, Dena Bank and Bank of India.
■ Term loan
Term loan consists of secured loans taken from Canara Bank.
■ Loans from related party
The company owes outstanding interest-free loans of ₹35 mn to promoter and related parties.

© CRISIL Limited. All Rights Reserved. Page | 25
Company Overview Company Overview Appendix
Analysis of Financial Statements
Fixed assets
Composition of net fixed assets
(₹ mn) FY10 FY11 FY12 FY13 FY14 H1FY15
Plot at Apparel Park 3 3 3 3 3 3
Land and buildings 57 55 56 53 46 45
Plant, machinery and equipment 56 65 57 54 72 71
Furniture and fixtures 3 6 6 5 5 4
Vehicles 1 3 2 1 1 1
Office equipment 1 0 1 1 1 0
Source: Company, CRISIL Research
■ Supreme India’s fixed assets primarily consist of factory building and plant and machinery (in Surat).
■ The company installed 22 yarn doubling machines in FY14.
Intangibles
(₹ mn) FY10 FY11 FY12 FY13 FY14 H1FY15
Brands/ trademarks 0.03 0.04 0.04 0.04 0.03 0.03
Computer Software - 0.07 0.05 0.12 0.07 0.06
■ Supreme India’s products are marketed under the labels Trendz and Besttex.
Investments
(₹ mn) FY10 FY11 FY12 FY13 FY14 H1FY15
Equity instruments of other entities (1200 shares of Canara bank) 0.04 0.04 0.04 0.04 - -
Gold coins - - - - 0.13 0.13
Equity instruments of subsidiary company Utility Aquatech Pvt. Ltd - - - - 105.11 105.11
Total investments 0.04 0.04 0.04 0.04 105.24 105.24
As a % of net worth 0.02% 0.02% 0.01% 0.01% 22.88% 20.28%
Source: Company, CRISIL Research
■ Supreme India’s investments include ₹105.1 mn in equity shares of Utility Aquatech.

© CRISIL Limited. All Rights Reserved. Page | 26
Company Overview Company Overview Appendix
Analysis of Financial Statements
■ The company purchased the business of Utility Aquatech in FY14, which was engaged in aquaculture activities. Utility Aquatech closed its operations in FY12. As per the management,
the company plans to implement a project on cotton spinning and garments on the land and resources of Utility Aquatech.
Inventories
(₹ mn) FY10 FY11 FY12 FY13 FY14 H1FY15
Raw material 51 182 110 179 87 189
Finished goods 108 23 158 56 165 304
Stock-in-trade - 1 2 2 1 1
Stores and spares 0 0 0 0 1 1
Total inventory 159 205 270 237 253 495
Inventory days (based on sales) 45 46 52 34 29 52
Source: Company, CRISIL Research
■ Supreme India’s inventory days decreased to 29 in FY14 from 45 in FY10. Inventory days stood at 52 as at H1FY15.
■ The management attributed the decrease in raw material inventory in FY14 to the increasing use of readymade purchases with small requirements of value-addition work.
Sundry debtors
(₹ mn) FY10 FY11 FY12 FY13 FY14 H1FY15
Gross sales 1,297 1,629 1,893 2,580 3,168 1,726
Debtors 458 716 896 1,213 1,786 2,202
Debtor days (based on sales) 120 148 174 177 208 233
Source: Company, CRISIL Research
■ As per the management, the clients are given ~90-day credit period. However, longer transit time taken to ship the product to the end customers has resulted in higher debtor days.
■ Debtor days increased to 120 in FY10 to 208 in FY14 and 233 in H1FY15.
Ageing analysis of debtors
■ In the past, 100% of the company’s debtors were outstanding for less than six months.
■ The company’s top debtor (Indo Emirates) comprised ~76% of total debtors in FY14.

© CRISIL Limited. All Rights Reserved. Page | 27
Company Overview Company Overview Appendix
Analysis of Financial Statements
Supreme India – top debtors
Top debtors as of FY14 Amount outstanding (₹ mn) As a percentage of total debtors
Indo Emirates Trading Co LLC 1,348 76%
Land Mark General Trading Co. FZE 368 21%
Titanium Trading FZE 67 4%
Others 2 0.1%
Total outstanding debtors 1,786 100%
Source: Company, CRISIL Research
Loans and advances
(₹ mn) FY10 FY11 FY12 FY13 FY14 H1FY15
Security deposits 0.2 0.5 0.5 5.0 1.3 2.4
Loans and advances to employees 0.2 0.0 0.0 0.2 0.2 0.1
Prepaid expenses 0.4 1.5 0.5 1.6 1.6 0.4
Balances with government authorities 41.6 51.0 67.5 106.8 105.0 98.4
Advances to others - 1.3 1.3 1.3 1.3 17.0
Total loans and advances 42.4 54.3 69.8 114.8 109.3 118.4
Source: Company, CRISIL Research
■ The company’s loans and advances mainly include balances with Central Excise and Customs, refundable excise duty and service tax, security deposits and advances given to staff.
Cash and bank balances
(₹ mn) FY10 FY11 FY12 FY13 FY14 H1FY15
Cash on hand 0.2 0.1 2.1 1.4 1.8 0.5
In current accounts (12.9) (5.1) 2.4 17.4 0.8 5.5
In deposit accounts 83.3 65.1 90.5 130.3 71.5 93.5
Others - recurring deposit account 0.4 0.7 0.1 0.4 0.8 1.0
Total 71.1 60.8 95.0 149.5 74.9 100.5
Source: Company, CRISIL Research

© CRISIL Limited. All Rights Reserved. Page | 28
Company Overview Company Overview Appendix
Analysis of Financial Statements
■ As of H1FY15, Supreme India has ₹0.5 mn in cash and ₹5.5 mn in the current account. It also has ₹93.5 mn worth of deposits with banks.
Marketable securities
■ The company has no marketable securities.
Creditors
(₹ mn) FY10 FY11 FY12 FY13 FY14 H1FY15
Sundry Creditors: Supplies 33 90 59 50 254 841
Sundry Creditors: Capital goods 1 - - 0 3 3
Others 24 39 39 29 50 29
Total creditors 58 129 98 79 307 873
Creditor days 16 28 19 11 35 92
Source: Company, CRISIL Research
■ Supreme India’s creditors include creditors of raw material supplies and capital goods, advances received from customers, outstanding salaries and statutory dues payable.
Supreme India - top 10 creditors
Top 10 creditors
Outstanding amount payable
as on March 31, 2014 % of total creditors
Epson Trading Pvt. Ltd 86 29%
Ealdor Retails Pvt. Ltd 49 17%
Modern Trading Business Pvt. Ltd 36 12%
Panama Overseas Pvt. Ltd 31 11%
Jhunjhunwala Cotspin Pvt. Ltd 14 5%
Priority Traders Pvt. Ltd 13 5%
Yug Exports 8 3%
Bluechip Fabrics Pvt. Ltd 7 2%
Best Processors Pvt. Ltd 6 2%
Genewa Corporation 3 1%
Total 292 86%
Source: Company, CRISIL Research

© CRISIL Limited. All Rights Reserved. Page | 29
Company Overview Company Overview Appendix
Analysis of Financial Statements
Provisions
(₹ mn) FY10 FY11 FY12 FY13 FY14 H1FY15
Provision for income tax 3.0 4.3 4.8 2.4 0.4 0.7
Provision for proposed dividend 1.1 1.2 1.5 1.6 1.8 -
Provision for tax on proposed dividend 0.2 0.2 0.2 0.3 0.3 -
Fringe benefit tax - - - - - 0.1
Total provisions 4.2 5.7 6.6 4.2 2.4 0.8
Source: Company, CRISIL Research
■ Total provisions amounted to ₹2.4 mn in FY14.
Other matters
Contingent liabilities
(₹ mn) FY10 FY11 FY12 FY13 FY14 H1FY15
Export obligation pending under EPCG license - - - - 17 43
Source: Company, CRISIL Research
■ As of H1FY15, the company has an export obligation pending under EPCG licence to the extent of ₹43 mn.
Other related party transactions
■ Details of the related party transactions are as follows:
(₹ mn) FY10 FY11 FY12 FY13 FY14 H1FY15
Unsecured borrowings received
Jugal Kishore Jhawar 1.0 - - 7.5 14.6 36.9
Sarita Devi Jhawar 2.3 - - 9.8 3.5 -
Bhanwari Devi Jhawar 0.1 - - 8.5 5.3 -
Kamla Devi Jhawar 0.1 - - - - -
Nand Kishore Jhawar 0.1 - - - - -
Remuneration
Jugal Kishore Jhawar - - 0.4 0.4 0.4 0.3

© CRISIL Limited. All Rights Reserved. Page | 30
Company Overview Company Overview Appendix
Analysis of Financial Statements
(₹ mn) FY10 FY11 FY12 FY13 FY14 H1FY15
Abhishek Jhawar 0.3 0.2 0.3 0.4 0.4 -
Ruchita Jhawar 0.1 0.1 0.2 0.2 0.2 -
Purchases
Supreme Fabstyle - - - - 2.7 -
Supreme India Overseas Corporation - 70.8 2.8 35.7 42.4 -
Jhawar Biotech Pvt. Ltd - 53.1 - -
-
Vama Tex India Ltd 5.2 - - -
-
Job work charges
Jhawar Biotech Pvt. Ltd - - - 3.4 - -
Vama Tex India Ltd - - - 4.8 - -
Supreme Fine Fab Pvt. Ltd 5.5 - - 2.8 - -
Source: Company, CRISIL Research
■ Remuneration is paid to Mr Abhishek Jhawar and Ms Ruchita Jhawar, who are not the directors of the company. We believe this to reduce tax liability of the promoter family. Since the
amount involved is insignificant (₹0.6 mn collectively in FY14), this is not a major issue.
Auditor and auditor’s remuneration
■ The company’s auditor has been Gujarat-based Soni Surana & Company since FY12.
(₹ mn) FY10 FY11 FY12 FY13 FY14 H1FY15
Auditor’s remuneration 0.1 0.1 0.1 0.1 0.1 -
Source: Company, CRISIL Research
© CRISIL Limited. All Rights Reserved. Page | 31
Company Overview Executive Summary Analysis of Financial Statements
Appendix
Appendix
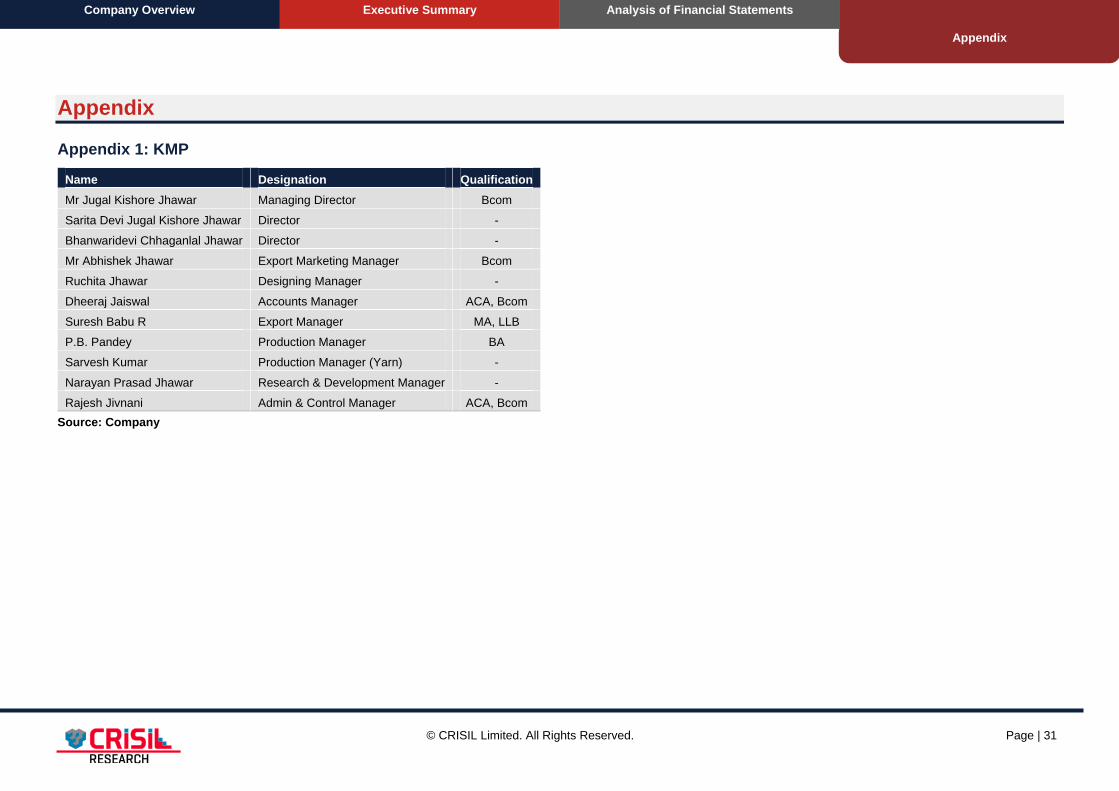
Appendix 1: KMP
Name Designation Qualification
Mr Jugal Kishore Jhawar Managing Director Bcom
Sarita Devi Jugal Kishore Jhawar Director -
Bhanwaridevi Chhaganlal Jhawar Director -
Mr Abhishek Jhawar Export Marketing Manager Bcom
Ruchita Jhawar Designing Manager -
Dheeraj Jaiswal Accounts Manager ACA, Bcom
Suresh Babu R Export Manager MA, LLB
P.B. Pandey Production Manager BA
Sarvesh Kumar Production Manager (Yarn) -
Narayan Prasad Jhawar Research & Development Manager -
Rajesh Jivnani Admin & Control Manager ACA, Bcom
Source: Company
© CRISIL Limited. All Rights Reserved. Page | 32
Company Overview Executive Summary Analysis of Financial Statements
Appendix
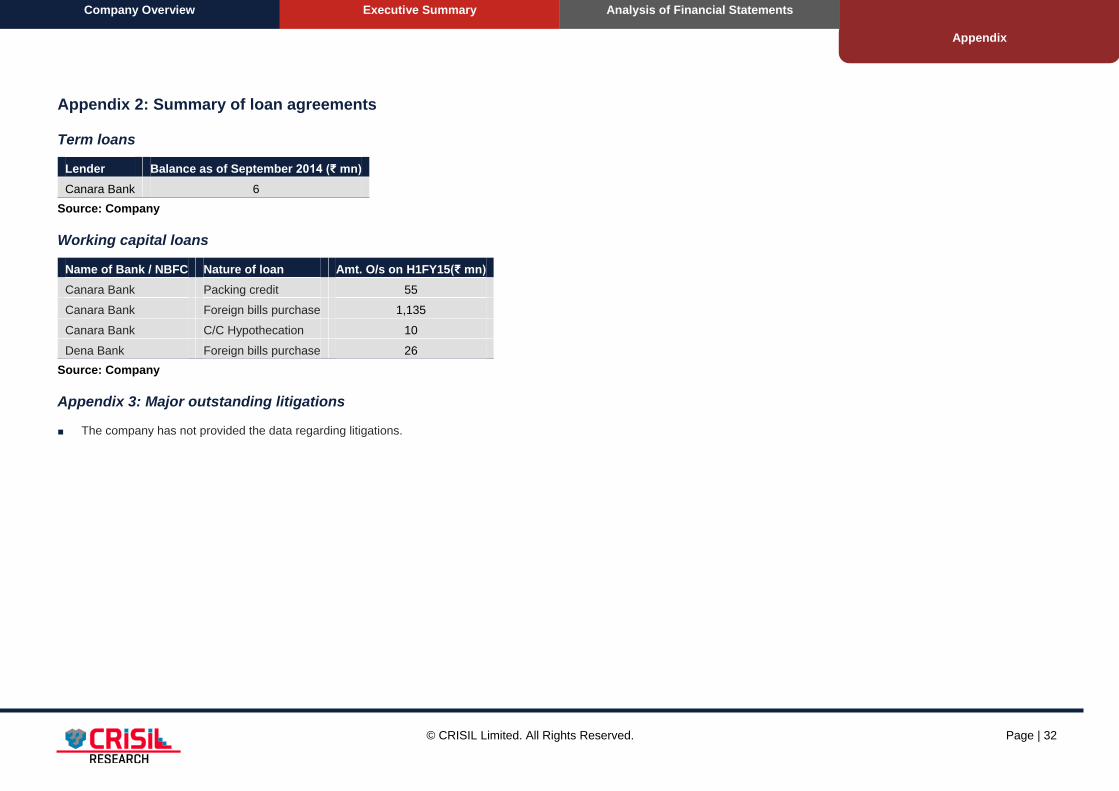
Appendix 2: Summary of loan agreements
Term loans
Lender Balance as of September 2014 (₹ mn)
Canara Bank 6
Source: Company
Working capital loans
Name of Bank / NBFC Nature of loan Amt. O/s on H1FY15(₹ mn)
Canara Bank Packing credit 55
Canara Bank Foreign bills purchase 1,135
Canara Bank C/C Hypothecation 10
Dena Bank Foreign bills purchase 26
Source: Company
Appendix 3: Major outstanding litigations
■ The company has not provided the data regarding litigations.
© CRISIL Limited. All Rights Reserved. Page | 33
Company Overview Executive Summary Analysis of Financial
Statements
Appendix
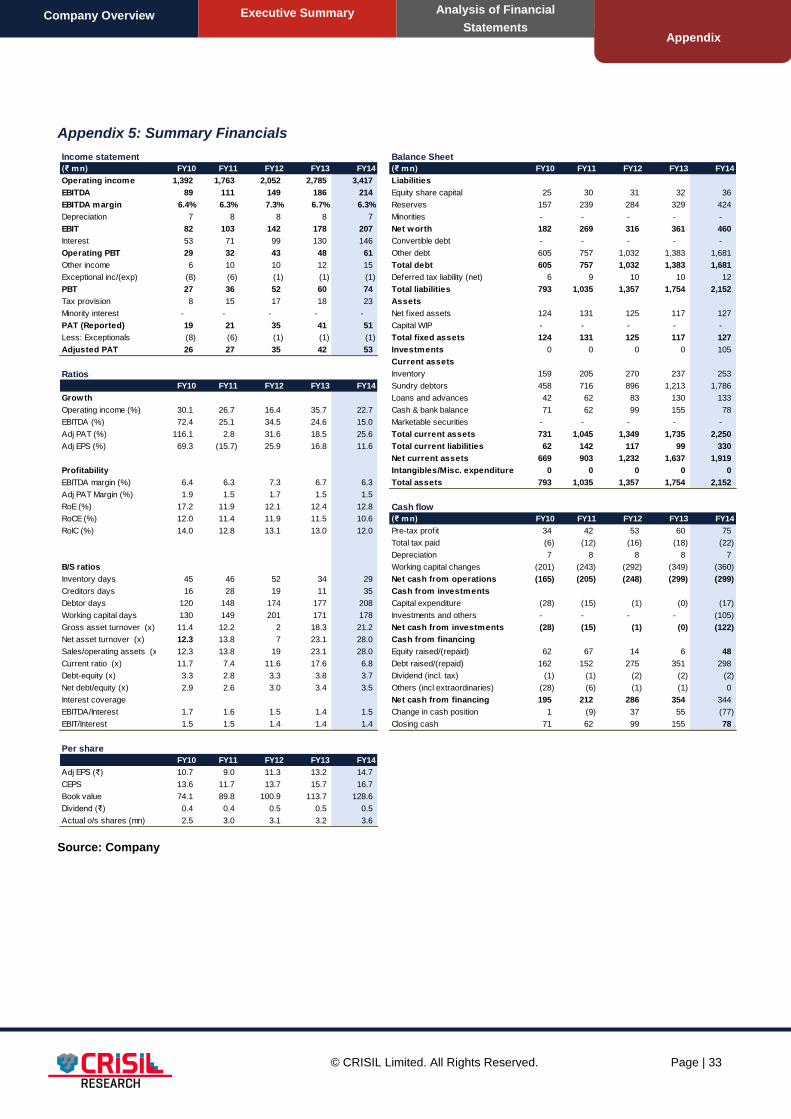
Appendix 5: Summary Financials
Source: Company
Income statement Balance Sheet
(₹ mn) FY10 FY11 FY12 FY13 FY14 (₹ mn) FY10 FY11 FY12 FY13 FY14
Operating income 1,392 1,763 2,052 2,785 3,417 Liabilities
EBITDA 89 111 149 186 214 Equity share capital 25 30 31 32 36
EBITDA margin 6.4% 6.3% 7.3% 6.7% 6.3% Reserves 157 239 284 329 424
Depreciation 7 8 8 8 7 Minorities - - - - -
EBIT 82 103 142 178 207 Net worth 182 269 316 361 460
Interest 53 71 99 130 146 Convertible debt - - - - -
Operating PBT 29 32 43 48 61 Other debt 605 757 1,032 1,383 1,681
Other income 6 10 10 12 15 Total debt 605 757 1,032 1,383 1,681
Exceptional inc/(exp) (8) (6) (1) (1) (1) Deferred tax liability (net) 6 9 10 10 12
PBT 27 36 52 60 74 Total liabilities 793 1,035 1,357 1,754 2,152
Tax provision 8 15 17 18 23 Assets
Minority interest - - - - - Net f ixed assets 124 131 125 117 127
PAT (Reported) 19 21 35 41 51 Capital WIP - - - - -
Less: Exceptionals (8) (6) (1) (1) (1) Total fixed assets 124 131 125 117 127
Adjusted PAT 26 27 35 42 53 Investments 0 0 0 0 105
Current assets
Ratios Inventory 159 205 270 237 253
FY10 FY11 FY12 FY13 FY14 Sundry debtors 458 716 896 1,213 1,786
Growth Loans and advances 42 62 83 130 133
Operating income (%) 30.1 26.7 16.4 35.7 22.7 Cash & bank balance 71 62 99 155 78
EBITDA (%) 72.4 25.1 34.5 24.6 15.0 Marketable securities - - - - -
Adj PAT (%) 116.1 2.8 31.6 18.5 25.6 Total current assets 731 1,045 1,349 1,735 2,250
Adj EPS (%) 69.3 (15.7) 25.9 16.8 11.6 Total current liabilities 62 142 117 99 330
Net current assets 669 903 1,232 1,637 1,919
Profitability Intangibles/Misc. expenditure 0 0 0 0 0
EBITDA margin (%) 6.4 6.3 7.3 6.7 6.3 Total assets 793 1,035 1,357 1,754 2,152
Adj PAT Margin (%) 1.9 1.5 1.7 1.5 1.5
RoE (%) 17.2 11.9 12.1 12.4 12.8 Cash flow
RoCE (%) 12.0 11.4 11.9 11.5 10.6 (₹ mn) FY10 FY11 FY12 FY13 FY14
RoIC (%) 14.0 12.8 13.1 13.0 12.0 Pre-tax profit 34 42 53 60 75
Total tax paid (6) (12) (16) (18) (22)
Depreciation 7 8 8 8 7
B/S ratios 1.9 1.7 Working capital changes (201) (243) (292) (349) (360)
Inventory days 45 46 52 34 29 Net cash from operations (165) (205) (248) (299) (299)
Creditors days 16 28 19 11 35 Cash from investments
Debtor days 120 148 174 177 208 Capital expenditure (28) (15) (1) (0) (17)
Working capital days 130 149 201 171 178 Investments and others - - - - (105)
Gross asset turnover (x) 11.4 12.2 2 18.3 21.2 Net cash from investments (28) (15) (1) (0) (122)
Net asset turnover (x) 12.3 13.8 7 23.1 28.0 Cash from financing
Sales/operating assets (x) 12.3 13.8 19 23.1 28.0 Equity raised/(repaid) 62 67 14 6 48
Current ratio (x) 11.7 7.4 11.6 17.6 6.8 Debt raised/(repaid) 162 152 275 351 298
Debt-equity (x) 3.3 2.8 3.3 3.8 3.7 Dividend (incl. tax) (1) (1) (2) (2) (2)
Net debt/equity (x) 2.9 2.6 3.0 3.4 3.5 Others (incl extraordinaries) (28) (6) (1) (1) 0
Interest coverage Net cash from financing 195 212 286 354 344
EBITDA/Interest 1.7 1.6 1.5 1.4 1.5 Change in cash position 1 (9) 37 55 (77)
EBIT/Interest 1.5 1.5 1.4 1.4 1.4 Closing cash 71 62 99 155 78
Per share
FY10 FY11 FY12 FY13 FY14
Adj EPS (₹) 10.7 9.0 11.3 13.2 14.7
CEPS 13.6 11.7 13.7 15.7 16.7
Book value 74.1 89.8 100.9 113.7 128.6
Dividend (₹) 0.4 0.4 0.5 0.5 0.5
Actual o/s shares (mn) 2.5 3.0 3.1 3.2 3.6

© CRISIL Limited. All Rights Reserved. Page | 34
Disclaimer / Important notice
This Company Analysis and FDD Report is based on the limited scope of financial due diligence of Supreme India
Impex Ltd (“the Company”). The Scope of Work covering the procedures to be performed for financial due diligence of
the Company is defined below. In this Report, we may choose to not include matters that we believe to be insignificant.
There may be matters, other than those noted in this Report, which might be relevant in the context of the issue and which
a wider scope might uncover. The financial due diligence is based on the audited/un-audited consolidated financial
statements for FY10, FY11, FY12, FY13, FY14 and H1FY15.
The Report has been issued on the understanding that the Company's management has drawn our attention to all
matters, financial or otherwise, of which they are aware which may have an impact on our Report up to the date of this
Report. Additionally, we have no responsibility to update this Report for events and circumstances occurring after this
date.
Our work does not constitute recommendations about the completion of the operation. This Report also does not
constitute an audit in accordance with the Audit Standards and we have not independently verified all the matters
discussed in this Report and have relied on the explanations and information as given by the management (verbal as well
as written) of the Company. We have assumed the genuineness of all signatures and the authenticity of all documents
submitted to us, whether original or copies. In this regard, management of the Company is responsible for the proper
recording of transactions in the books of account and maintaining an internal control structure sufficient to permit the
preparation of reliable financial information, including financial accounts. Consequently, we do not express an opinion on
the figures and other information included in this Report. CRISIL does take any responsibility towards the usage of the
Report in any form.
The information and conclusions of this Report should not be the basis for the listing or for any investor to place a value on
the business of the Company or to make a decision whether to acquire or invest in the Company. Our due diligence and
analysis should not be construed as investment advice; specifically, we do not express any opinion on the suitability or
otherwise of entering into any transaction in this regard. We accept no responsibility for matters not covered by the Report
or omitted due to the limited nature of our analysis. The future plans of the Company, if any, are as informed to us by its
Management. We do not have any view on the same.

© CRISIL Limited. All Rights Reserved. Page | 35
Scope of Work
The limited scope of coverage of the Company Analysis and Financial Due diligence Report would be:
i) Study of the financial statements of the Company for the financial periods ended March 31, 2010, March 31,
2011, March 31, 2012, March 31, 2013, March 31, 2014, and September 30,2014 (“Historical Period”).
ii) Review and comment on the reasonability and consistency of significant accounting policies adopted.
iii) Highlight significant matters in internal audit reports, audit committee reports and RBI audit reports.
iv) Analyse quality of earnings with particular focus on:
a) recurring versus non-recurring transactions (income and expenditure)
b) changes in accounting policies
c) impact of related party transactions, if any.
v) Analyse the key drivers of revenue and margin growth with particular reference to:
a) price and volume changes of key products
b) geographical distribution
vi) Comments on the branch distribution network. Highlight significant issues in the lease rent agreement.
vii) Analysis of selling costs and marketing overheads.
viii) Analysis of interest cost and depreciation expense.
ix) Analysis of variances in significant administrative overheads.
x) Analysis of movement in head count and employee costs during the reporting period.
xi) Highlight the movement of debtors over the past four years.
xii) Analysis of the cost sheet and comment on the movements in the costs over the Historical Period
xiii) Analysis of historical trends in capex. Based on discussion with management, comment if there has been
any deferred maintenance/replacement capex.
xiv) Analysis of the basis of capitalisation and components of costs such as borrowing costs, pre-operative
expenditure, exchange fluctuations, etc.
xv) Summarise details of investments held, highlighting investments in related entities, if any.
xvi) Analysis of the trends in working capital during the reporting period.
xvii) Analysis of and comment on the ageing profile of receivables and inventories. Inquire into provisioning policy
and comment on provisions for uncollectible amounts and write-offs.
xviii) Analysis of the basis of inventory valuation (physical verification of inventories will not be conducted).
xix) Comment on other current assets, loans and advances and major creditors. Comment on recoverability and
provisioning for uncollectible amounts.
xx) Comment on the current liabilities including accounts payable and provisions/accruals.
xxi) Obtaining bank reconciliations for key accounts and comment on reconciling items.
Commitments, contingencies and litigation
xxii) Highlight significant claims, pending or threatened litigations against the company at latest available period,
after discussions with the management of the Company their views on the likely outcome of the
cases/claims.
xxiii) Highlight significant guarantees, performance bonds, letters of comfort or similar documents of assurance
and any indemnities provided by / or for the benefit of the Company, including details of such guarantees,
etc. given by the company for the period under review.

© CRISIL Limited. All Rights Reserved. Page | 36
xxiv) Status of tax claims and disputes thereof, if any.
Related party transactions
xxv) Highlight major related party transactions and comment on recoverability / payment of balance due from / to
related parties at period end.
xxvi) Comment on key financial terms and conditions of such related party transactions after discussions with the
Management.
The following areas (indicative list) are excluded from the scope of the Report.
1) Valuation of the issuer’s business
2) Human resource review
3) Technical and commercial due diligence
4) Legal and tax due diligence
5) IT review and risk management
6) Physical verification and valuation of fixed assets, inventories and other current assets
7) Third-party confirmations, meetings with suppliers/customers
8) Environmental compliances
9) Overview of the supply chain management
10) Actuarial valuation of the company’s retirement benefit arrangements
11) Checking of accounting records

Stay Connected | CRISIL Website |
Twitter |
LinkedIn |
YouTube |
Contact us
Phone: +91 (22) 3342 3561/ 62
Fax: +91 (22) 3342 3501
E-mail: [email protected] | [email protected]
Our Office
Ahmedabad
706, Venus Atlantis
Nr. Reliance Petrol Pump
Prahladnagar,
Ahmedabad
Phone : 91-79-4024 4500
Fax : 91-79-2755 9863
Hyderabad
3rd Floor, Uma Chambers
Plot No. 9&10, Nagarjuna Hills,
(Near Punjagutta Cross Road)
Hyderabad - 500 482
Phone : 91-40-2335 8103 - 05
Fax : 91-40-2335 7507
New Delhi
The Mira, G-1,
1st Floor, Plot No. 1 & 2
Ishwar Nagar, Mathura Road,
New Delhi - 110 065
Phone : 91-11-4250 5100
Fax : 91-11-2684 2212
Bengaluru
W-101, Sunrise Chambers,
22, Ulsoor Road,
Bengaluru - 560 042
Phone : 91-80-2558 0899
Fax : 91-80-2559 4801
Kolkata
Horizon, Block 'B', 4th Floor
57 Chowringhee Road
Kolkata - 700 071
Phone : 91-33-2289 1949 - 50 |
Fax : 91-33-2283 0597
Pune
1187/17, Ghole Road,
Shivaji Nagar,
Pune - 411 005
Phone : 91-20-2553 9064 - 67
Fax : 91-20-4018 1930
Chennai
Thapar House,
43/44, Montieth Road, Egmore,
Chennai - 600 008
Phone : 91-44-2854 6205 - 06
Fax : 91-44-2854 7531
About CRISIL Ltd
CRISIL is a global analytical company providing ratings, research, and risk and policy advisory services. We are India’s leading
ratings agency. We are also the foremost provider of high-end research to the world’s largest banks and leading corporations.
About CRISIL Research
CRISIL Research is India's largest independent integrated research house. We provide insights, opinion and analysis on the
Indian economy, industry, capital markets and companies. We also conduct training programs to financial sector professionals
on a wide array of technical issues. We are India's most credible provider of economy and industry research. Our industry
research covers 86 sectors and is known for its rich insights and perspectives. Our analysis is supported by inputs from our
network of more than 5,000 primary sources, including industry experts, industry associations and trade channels. We play a
key role in India's fixed income markets. We are the largest provider of valuation of fixed income securities to the mutual fund,
insurance and banking industries in the country. We are also the sole provider of debt and hybrid indices to India's mutual fund
and life insurance industries. We pioneered independent equity research in India, and are today the country's largest
independent equity research house. Our defining trait is the ability to convert information and data into expert judgements and
forecasts with complete objectivity. We leverage our deep understanding of the macro-economy and our extensive sector
coverage to provide unique insights on micro-macro and cross-sectoral linkages. Our talent pool comprises economists, sector
experts, company analysts and information management specialists.
CRISIL Ltd
CRISIL House, Central Avenue, Hiranandani Business Park,
Powai, Mumbai – 400076. India
Phone: + 91 22 3342 3000 Fax: + 91 22 3342 3001
Email: [email protected]
www.crisil.com