community-level data on social determinants and … social determinants and health outcomes; and 2)...
TRANSCRIPT

Community-level Data on Social Determinants and Health Outcomes
The material that accompanies this working document was produced through a data inventory undertakenby Community Science, Inc., for the National Partnership for Action to End Health Disparities (NPA) led bythe Office of Minority Health in the Office of the Assistant Secretary for Health (OMH/OASH). The goals ofthe inventory were to: 1) assess and document the community-level data (i.e., data that can bedisaggregated by city, county, neighborhood, or zip code) available from state agencies and organizationson social determinants and health outcomes; and 2) share this information with NPA community partners(e.g., Regional Health Equity Councils [RHECs]) to make it easier for them to know what data are availableand how to access the data.
The inventory primarily focuses on state sources because:
Data for the current year from national sources (e.g., U.S. Census Bureau) are generally notavailable until several years later;
Data from state sources are likely to be available sooner and are frequently available for measuresthat are not usually included in national data sources;
An inventory of state sources is a more manageable task than an inventory of data from the largenumber of counties, cities, and other local jurisdiction that may also collect and store data.
The inventory started with the social determinants of health and health outcomes included in the NationalStakeholder Strategy for Health Equity and in the Centers for Disease Control and Prevention’s (CDC) HealthDisparities and Inequalities Report.1 Community Science and OMH/OASH discussed and prioritized the listof social determinants of health and health outcomes to be included in the inventory (see list at the end ofthis narrative). For each measure, information was sought about the smallest geographic unit and mostrecent year for which data were available and whether or not the data can be disaggregated by race,ethnicity, gender, age, disability status, primary language, and sexual orientation and gender identity.
Community Science attempted to locate the data through contacts with State government staff andthrough searching the World Wide Web. Community Science recognizes that the search may not besufficiently thorough to surface data that were not easily available, and welcomes information aboutadditional state sources that should be included in the accompanying materials. For questions or to shareinformation about additional state sources, please contact Abigail Baum, Community Science, 301-519-0722, ext. 121 or [email protected]. Community Science is also working with OMH/OASHto determine other critical social determinants of health and health outcome measures that should beexplored.
While the inventory focused on state sources, it would be helpful for NPA partners to also have informationabout certain key national sources; the accompanying material includes this information.
1 CDC Morbidity and Mortality Weekly Report, Supplement, Vol. 60, January 14, 2011

List of Measures Sought
Social Determinants of Health
EducationEducational Attainment
High school graduation ratesHigh school dropout ratesHighest level of education that an individual has completed# of diploma recipients, # of other high school completersHigh school equivalency recipientsAveraged freshman graduation rates% of persons aged 16-19 years not enrolled, not high school graduatesPost-secondary education enrollment/plans
JobsLabor Market Turnover
Unemployment ratesUnderemployment ratesLabor force participation rates
Access to Health CareScreening Rates
% of early periodic screenings (Early Periodic Screening, Diagnosis and Treatment (EPSDT) as defined inthe Medicaid program)
% of people reporting receiving colorectal cancer screeningsImmunizations Rates
% of people reporting influenza vaccination coverage% of children aged 19-35 months completely immunized
Distribution of Health Care ProvidersTotal number of nonfederal MD/DOs in primary careTotal number of nonfederal MD/DOs in family practiceTotal number of nonfederal MD/DOs in general practiceTotal number of nonfederal MD/DOs in internal medicineTotal number of nonfederal MD/DOs in OB/GYNTotal number of nonfederal MD/DOs in pediatric primary care practiceTotal # of oral health care providersTotal # of mental/ behavioral health care providersProvider-to-population ratios - mental/behavioral health care servicesMeasures of availability of services for older adults
Interpreter Training/Certification% of interpreters certified by training entities that comply with the codes of ethics and standards for
training and practiceRace/Ethnicity of Provider Staff-to-Population Ratios
Race/ethnicity staff-to-population ratios for primary careRace/ethnicity staff-to-population ratios for family practiceRace/ethnicity staff-to-population ratios for general practiceRace/ethnicity staff-to-population ratios for pediatric practiceRace/ethnicity staff-to-population ratios for internal medicineRace/ethnicity staff-to-population ratios for OB/GYNRace/ethnicity staff-to-population ratios for medical and surgical subspecialties

Health Outcomes
Mortality and DiseaseInfant/Maternal mortalityCardiovascular diseaseCancerHIV/AIDSDiabetesChronic lower-respiratory diseaseKidney diseaseArthritis
ViolenceFor violence and trauma look for homicide and suicide rates
Homicide ratesSuicide rates
Behavioral healthBinge drinkingCigarette smokingIllegal drug useSexual behavior (note that these categories were taken from the Youth Risk Behavior Surveillance SystemSurvey though we are interested in other data sources on these for different age groups if available)
Condom useAny contraceptive useForced sexual intercourse
Other measures available
Oral HealthAdults over age 18 who have visited a dentist or dental clinic in the past yearPercent of students with untreated tooth decayAdults over age 65 who have lost 6 or more teethObesity

REGION 5
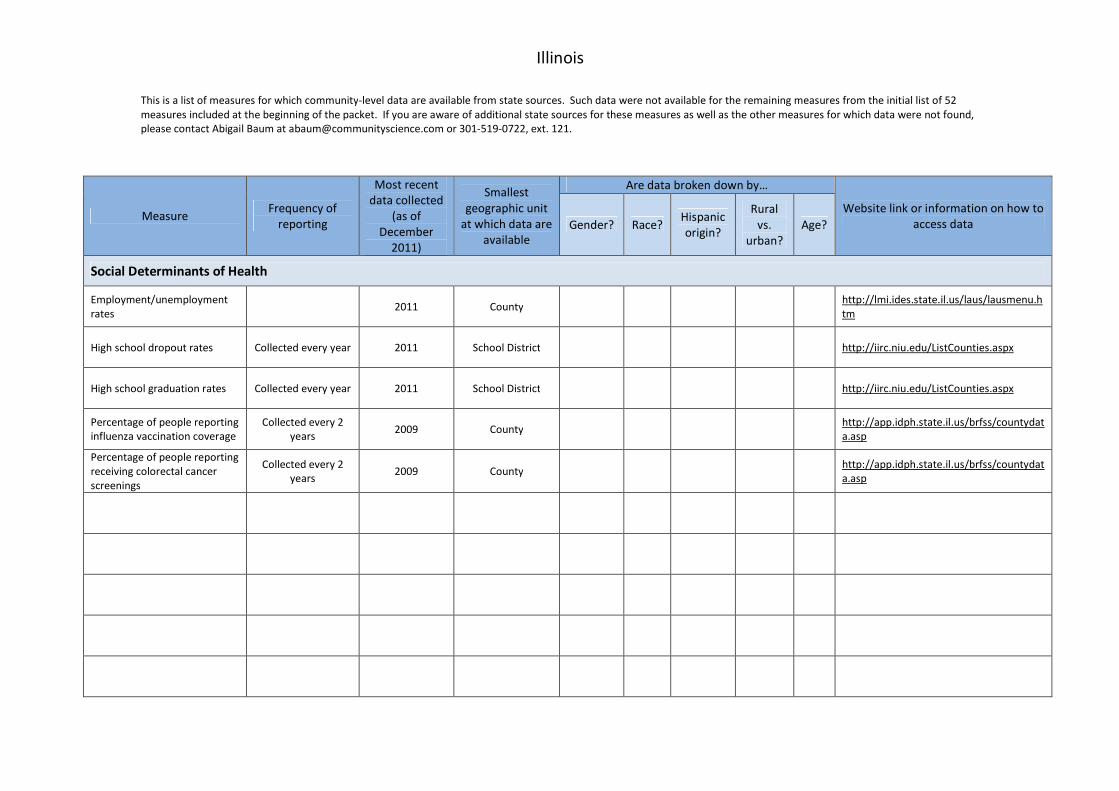
Illinois
This is a list of measures for which community-level data are available from state sources. Such data were not available for the remaining measures from the initial list of 52measures included at the beginning of the packet. If you are aware of additional state sources for these measures as well as the other measures for which data were not found,please contact Abigail Baum at [email protected] or 301-519-0722, ext. 121.
MeasureFrequency of
reporting
Most recentdata collected
(as ofDecember
2011)
Smallestgeographic unit
at which data areavailable
Are data broken down by…
Website link or information on how toaccess dataGender? Race?
Hispanicorigin?
Ruralvs.
urban?Age?
Social Determinants of Health
Employment/unemploymentrates
2011 Countyhttp://lmi.ides.state.il.us/laus/lausmenu.htm
High school dropout rates Collected every year 2011 School District http://iirc.niu.edu/ListCounties.aspx
High school graduation rates Collected every year 2011 School District http://iirc.niu.edu/ListCounties.aspx
Percentage of people reportinginfluenza vaccination coverage
Collected every 2years
2009 Countyhttp://app.idph.state.il.us/brfss/countydata.asp
Percentage of people reportingreceiving colorectal cancerscreenings
Collected every 2years
2009 Countyhttp://app.idph.state.il.us/brfss/countydata.asp

Illinois
MeasureFrequency of
reporting
Most recentdata collected
(as ofDecember
2011)
Smallestgeographic unit
at which data areavailable
Are data broken down by…
Website link or information on how toaccess dataGender? Race?
Hispanicorigin?
Ruralvs.
urban?Age?
Health Outcomes
HIV/AIDS-mortality Collected every year 2005 Countyhttp://www.idph.state.il.us/aids/aidscht5_00-09.htm
HIV/AIDS-prevalence Collected every year 2005 Countyhttp://www.idph.state.il.us/aids/aidscht5_00-09.htm
Cancer-incidence-age adjustedrate
Collected every 4years
2008 County X X X X
http://www.idph.state.il.us/cancer/11/county_rpt/ERS_11-03_FINAL_County_Cancer_Incidence_Report_Illinois_2004-2008.pdf
Infant/Maternal mortality Collected every year 2008 Countyhttp://www.idph.state.il.us/health/infant/infmort0608.htm
Adults over age 18 who havevisited a dentist or dental clinicin the past year
Collected every 2years
2009 County
http://app.idph.state.il.us/brfss/countydata.asp?selTopicCounty=oralhlth&areaCounty=Adams_1&show=freq&yrCounty=4&form=county&yr=&area=&selTopic=
Arthritis-prevalenceCollected every 2
years2009 County
http://app.idph.state.il.us/brfss/countydata.asp?selTopicCounty=arthritis&areaCounty=Adams_1&show=freq&yrCounty=4&form=county&yr=&area=&selTopic=
Binge drinkingCollected every 2
years2009 County
http://app.idph.state.il.us/brfss/countydata.asp?selTopicCounty=alcohol&areaCounty=Adams_1&show=freq&yrCounty=4&form=county&yr=&area=&selTopic=
Cardiovascular disease-prevalence
Collected every 2years
2009 County
http://app.idph.state.il.us/brfss/countydata.asp?selTopicCounty=cardiovascular&areaCounty=Adams_1&show=freq&yrCounty=4&form=county&yr=&area=&selTopic=

Illinois
MeasureFrequency of
reporting
Most recentdata collected
(as ofDecember
2011)
Smallestgeographic unit
at which data areavailable
Are data broken down by…
Website link or information on how toaccess dataGender? Race?
Hispanicorigin?
Ruralvs.
urban?Age?
Health Outcomes
Chronic lower respiratorydisease-prevalence-percent
Collected every 2years
2009 County
http://app.idph.state.il.us/brfss/countydata.asp?selTopicCounty=asthma&areaCounty=Adams_1&show=freq&yrCounty=4&form=county&yr=&area=&selTopic=
Cigarette smokingCollected every 2
years2009 County
http://app.idph.state.il.us/brfss/countydata.asp?selTopicCounty=alcohol&areaCounty=Adams_1&show=freq&yrCounty=4&form=county&yr=&area=&selTopic=
Diabetes-prevalenceCollected every 2
years2009 County
http://app.idph.state.il.us/brfss/countydata.asp?selTopicCounty=diab&areaCounty=Adams_1&show=freq&yrCounty=4&form=county&yr=&area=&selTopic=
Obesity-prevalenceCollected every 2
years2009 County
http://app.idph.state.il.us/brfss/countydata.asp?selTopicCounty=weight&areaCounty=Adams_1&show=freq&yrCounty=4&form=county&yr=&area=&selTopic=

Indiana
This is a list of measures for which community-level data are available from state sources. Such data were not available for the remaining measures from the initial list of 52measures included at the beginning of the packet. If you are aware of additional state sources for these measures as well as the other measures for which data were not found,please contact Abigail Baum at [email protected] or 301-519-0722, ext. 121.
MeasureFrequency of
reporting
Most recentdata collected
(as ofDecember
2011)
Smallestgeographic unit
at which data areavailable
Are data broken down by…
Website link or information on how toaccess dataGender? Race?
Hispanicorigin?
Ruralvs.
urban?Age?
Social Determinants of Health
Cohort graduation rate Collected every year 2010 Schoolhttp://www.doe.in.gov/improvement/accountability/graduation-cohort-rate
High school dropout rates Collected every year 2010 Schoolhttp://www.clrsearch.com/Indianapolis_Demographics/IN/Education-Level-and-Enrollment-Statistics
High school graduation rates Collected every year 2010 Schoolhttp://www.clrsearch.com/Indianapolis_Demographics/IN/Education-Level-and-Enrollment-Statistics
Highest level of education thatan individual has completed
Collected every year 2010 Countyhttp://www.clrsearch.com/Indianapolis_Demographics/IN/Education-Level-and-Enrollment-Statistics
Post-secondary educationenrollment plans
Collected every year 2010 Countyhttp://www.clrsearch.com/Indianapolis_Demographics/IN/Education-Level-and-Enrollment-Statistics
Employment/unemploymentrates
Collected monthly 2011 Cityhttp://www.hoosierdata.in.gov/dpage.asp?id=32&view_number=1&menu_level=&panel_number=2
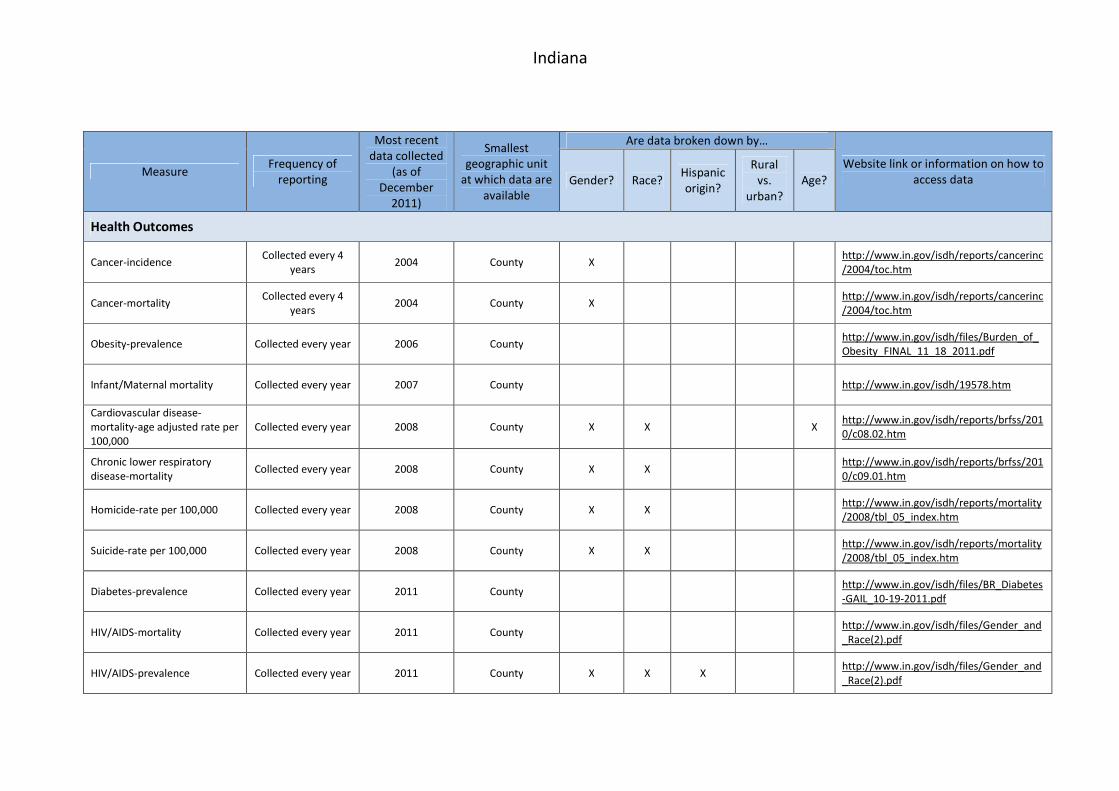
Indiana
MeasureFrequency of
reporting
Most recentdata collected
(as ofDecember
2011)
Smallestgeographic unit
at which data areavailable
Are data broken down by…
Website link or information on how toaccess dataGender? Race?
Hispanicorigin?
Ruralvs.
urban?Age?
Health Outcomes
Cancer-incidenceCollected every 4
years2004 County X
http://www.in.gov/isdh/reports/cancerinc/2004/toc.htm
Cancer-mortalityCollected every 4
years2004 County X
http://www.in.gov/isdh/reports/cancerinc/2004/toc.htm
Obesity-prevalence Collected every year 2006 Countyhttp://www.in.gov/isdh/files/Burden_of_Obesity_FINAL_11_18_2011.pdf
Infant/Maternal mortality Collected every year 2007 County http://www.in.gov/isdh/19578.htm
Cardiovascular disease-mortality-age adjusted rate per100,000
Collected every year 2008 County X X Xhttp://www.in.gov/isdh/reports/brfss/2010/c08.02.htm
Chronic lower respiratorydisease-mortality
Collected every year 2008 County X Xhttp://www.in.gov/isdh/reports/brfss/2010/c09.01.htm
Homicide-rate per 100,000 Collected every year 2008 County X Xhttp://www.in.gov/isdh/reports/mortality/2008/tbl_05_index.htm
Suicide-rate per 100,000 Collected every year 2008 County X Xhttp://www.in.gov/isdh/reports/mortality/2008/tbl_05_index.htm
Diabetes-prevalence Collected every year 2011 Countyhttp://www.in.gov/isdh/files/BR_Diabetes-GAIL_10-19-2011.pdf
HIV/AIDS-mortality Collected every year 2011 Countyhttp://www.in.gov/isdh/files/Gender_and_Race(2).pdf
HIV/AIDS-prevalence Collected every year 2011 County X X Xhttp://www.in.gov/isdh/files/Gender_and_Race(2).pdf

Michigan
This is a list of measures for which community-level data are available from state sources. Such data were not available for the remaining measures from the initial list of 52measures included at the beginning of the packet. If you are aware of additional state sources for these measures as well as the other measures for which data were not found,please contact Abigail Baum at [email protected] or 301-519-0722, ext. 121.
MeasureFrequency of
reporting
Most recentdata collected
(as ofDecember
2011)
Smallestgeographic unit
at which data areavailable
Are data broken down by…
Website link or information on how toaccess dataGender? Race?
Hispanicorigin?
Ruralvs.
urban?Age?
Social Determinants of Health
Cohort graduation rate Collected every year 2010 School Districthttp://www.michigan.gov/documents/cepi/2010-2009_MI_Grad-Drop_Rate_345879_7.pdf
Employment/unemploymentrates
Collected monthly 2011 Cityhttp://milmi.org/cgi/dataanalysis/AreaSelection.asp?tablename=Labforce
High school dropout rates Collected every year 2010 School Districthttp://www.michigan.gov/documents/cepi/2010-2009_MI_Grad-Drop_Rate_345879_7.pdf
High school graduation rates Collected every year 2010 School Districthttp://www.michigan.gov/documents/cepi/2010-2009_MI_Grad-Drop_Rate_345879_7.pdf
Labor force participation rates Collected monthly 2011 Countyhttp://milmi.org/cgi/dataanalysis/AreaSelection.asp?tablename=Labforce
Percentage of children aged19-35 months completelyimmunized
Collected monthly 2011 County
http://www.michigan.gov/documents/mdch/2008-2010_MiBRFS_Reg__LHD_Tables_FINAL_351398_7.pdf
Percentage of people reportinginfluenza vaccination coverage
Collected every 2years
2010 County
http://www.michigan.gov/documents/mdch/2008-2010_MiBRFS_Reg__LHD_Tables_FINAL_351398_7.pdf
Percentage of people reportingreceiving colorectal cancerscreenings
Collected every 2years
2010 County
http://www.michigan.gov/documents/mdch/2008-2010_MiBRFS_Reg__LHD_Tables_FINAL_351398_7.pdf
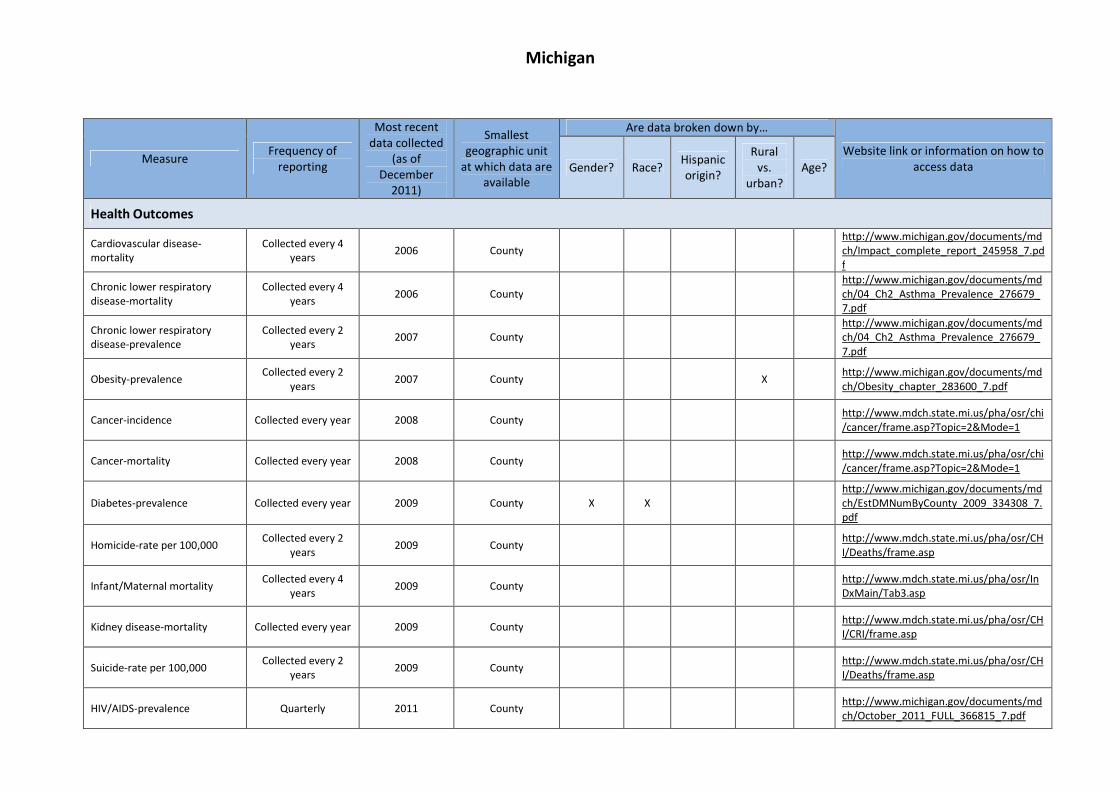
Michigan
MeasureFrequency of
reporting
Most recentdata collected
(as ofDecember
2011)
Smallestgeographic unit
at which data areavailable
Are data broken down by…
Website link or information on how toaccess dataGender? Race?
Hispanicorigin?
Ruralvs.
urban?Age?
Health Outcomes
Cardiovascular disease-mortality
Collected every 4years
2006 Countyhttp://www.michigan.gov/documents/mdch/Impact_complete_report_245958_7.pdf
Chronic lower respiratorydisease-mortality
Collected every 4years
2006 Countyhttp://www.michigan.gov/documents/mdch/04_Ch2_Asthma_Prevalence_276679_7.pdf
Chronic lower respiratorydisease-prevalence
Collected every 2years
2007 Countyhttp://www.michigan.gov/documents/mdch/04_Ch2_Asthma_Prevalence_276679_7.pdf
Obesity-prevalenceCollected every 2
years2007 County X
http://www.michigan.gov/documents/mdch/Obesity_chapter_283600_7.pdf
Cancer-incidence Collected every year 2008 Countyhttp://www.mdch.state.mi.us/pha/osr/chi/cancer/frame.asp?Topic=2&Mode=1
Cancer-mortality Collected every year 2008 Countyhttp://www.mdch.state.mi.us/pha/osr/chi/cancer/frame.asp?Topic=2&Mode=1
Diabetes-prevalence Collected every year 2009 County X Xhttp://www.michigan.gov/documents/mdch/EstDMNumByCounty_2009_334308_7.pdf
Homicide-rate per 100,000Collected every 2
years2009 County
http://www.mdch.state.mi.us/pha/osr/CHI/Deaths/frame.asp
Infant/Maternal mortalityCollected every 4
years2009 County
http://www.mdch.state.mi.us/pha/osr/InDxMain/Tab3.asp
Kidney disease-mortality Collected every year 2009 Countyhttp://www.mdch.state.mi.us/pha/osr/CHI/CRI/frame.asp
Suicide-rate per 100,000Collected every 2
years2009 County
http://www.mdch.state.mi.us/pha/osr/CHI/Deaths/frame.asp
HIV/AIDS-prevalence Quarterly 2011 Countyhttp://www.michigan.gov/documents/mdch/October_2011_FULL_366815_7.pdf
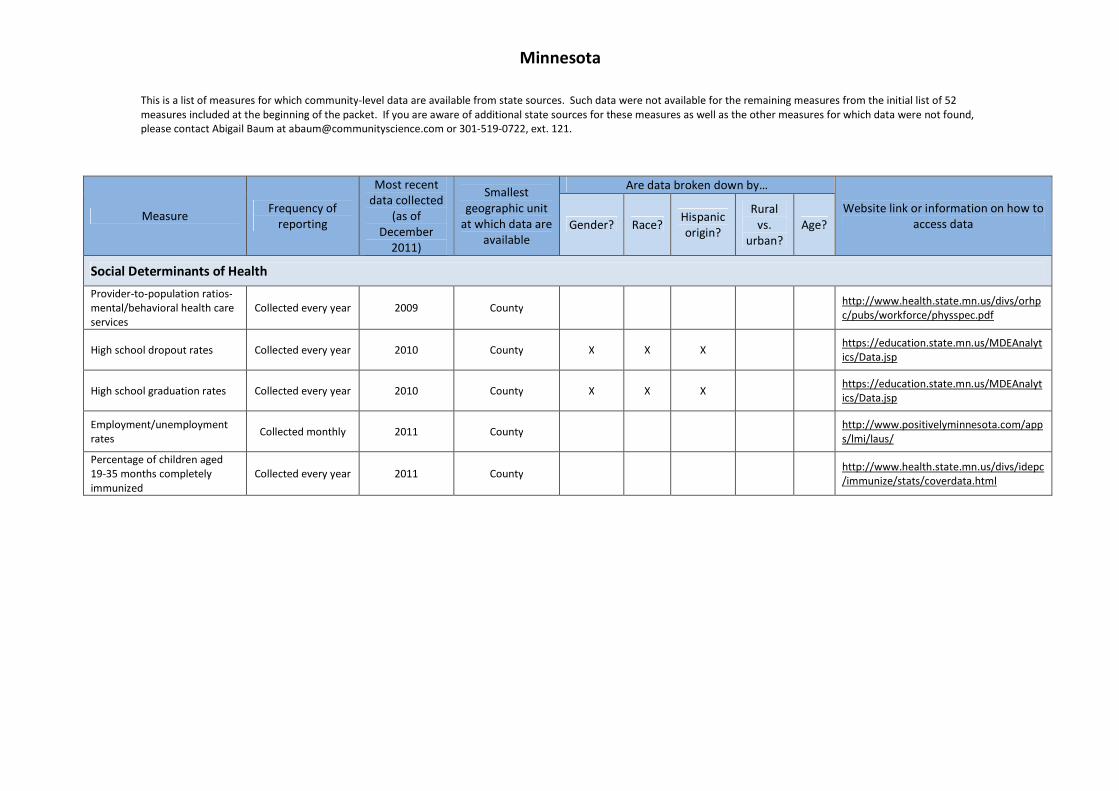
Minnesota
This is a list of measures for which community-level data are available from state sources. Such data were not available for the remaining measures from the initial list of 52measures included at the beginning of the packet. If you are aware of additional state sources for these measures as well as the other measures for which data were not found,please contact Abigail Baum at [email protected] or 301-519-0722, ext. 121.
MeasureFrequency of
reporting
Most recentdata collected
(as ofDecember
2011)
Smallestgeographic unit
at which data areavailable
Are data broken down by…
Website link or information on how toaccess dataGender? Race?
Hispanicorigin?
Ruralvs.
urban?Age?
Social Determinants of Health
Provider-to-population ratios-mental/behavioral health careservices
Collected every year 2009 Countyhttp://www.health.state.mn.us/divs/orhpc/pubs/workforce/physspec.pdf
High school dropout rates Collected every year 2010 County X X Xhttps://education.state.mn.us/MDEAnalytics/Data.jsp
High school graduation rates Collected every year 2010 County X X Xhttps://education.state.mn.us/MDEAnalytics/Data.jsp
Employment/unemploymentrates
Collected monthly 2011 Countyhttp://www.positivelyminnesota.com/apps/lmi/laus/
Percentage of children aged19-35 months completelyimmunized
Collected every year 2011 Countyhttp://www.health.state.mn.us/divs/idepc/immunize/stats/coverdata.html
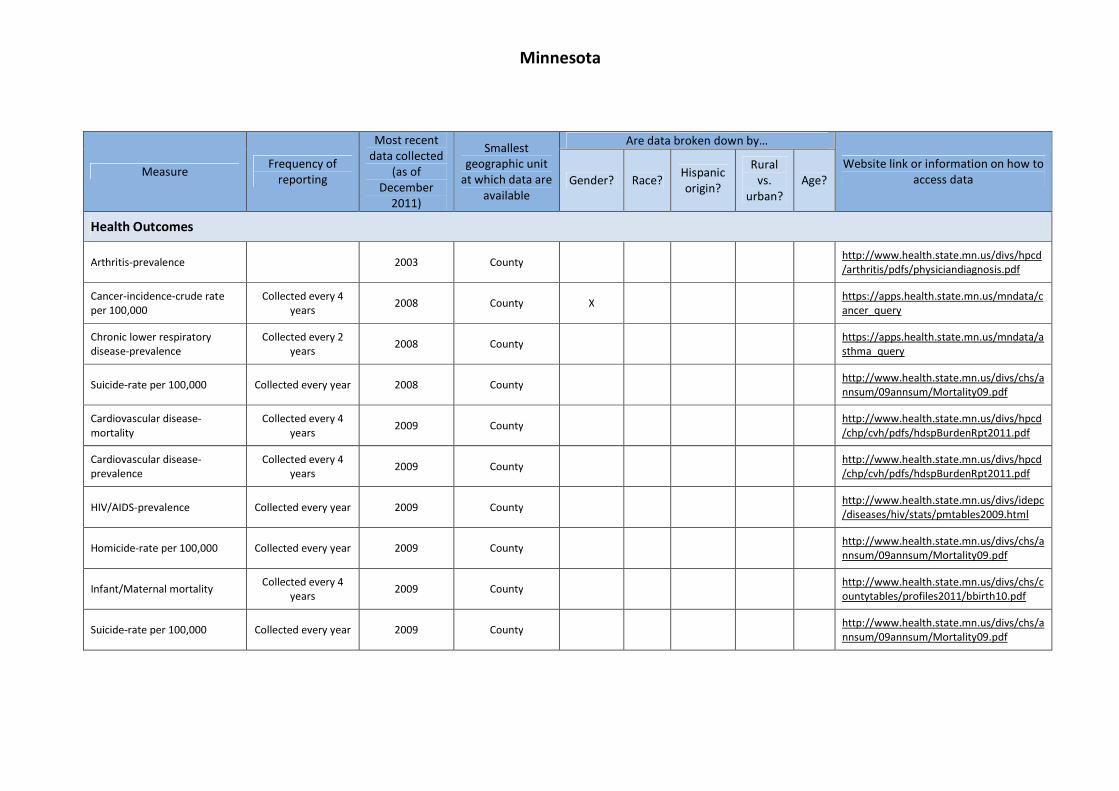
Minnesota
MeasureFrequency of
reporting
Most recentdata collected
(as ofDecember
2011)
Smallestgeographic unit
at which data areavailable
Are data broken down by…
Website link or information on how toaccess dataGender? Race?
Hispanicorigin?
Ruralvs.
urban?Age?
Health Outcomes
Arthritis-prevalence 2003 Countyhttp://www.health.state.mn.us/divs/hpcd/arthritis/pdfs/physiciandiagnosis.pdf
Cancer-incidence-crude rateper 100,000
Collected every 4years
2008 County Xhttps://apps.health.state.mn.us/mndata/cancer_query
Chronic lower respiratorydisease-prevalence
Collected every 2years
2008 Countyhttps://apps.health.state.mn.us/mndata/asthma_query
Suicide-rate per 100,000 Collected every year 2008 Countyhttp://www.health.state.mn.us/divs/chs/annsum/09annsum/Mortality09.pdf
Cardiovascular disease-mortality
Collected every 4years
2009 Countyhttp://www.health.state.mn.us/divs/hpcd/chp/cvh/pdfs/hdspBurdenRpt2011.pdf
Cardiovascular disease-prevalence
Collected every 4years
2009 Countyhttp://www.health.state.mn.us/divs/hpcd/chp/cvh/pdfs/hdspBurdenRpt2011.pdf
HIV/AIDS-prevalence Collected every year 2009 Countyhttp://www.health.state.mn.us/divs/idepc/diseases/hiv/stats/pmtables2009.html
Homicide-rate per 100,000 Collected every year 2009 Countyhttp://www.health.state.mn.us/divs/chs/annsum/09annsum/Mortality09.pdf
Infant/Maternal mortalityCollected every 4
years2009 County
http://www.health.state.mn.us/divs/chs/countytables/profiles2011/bbirth10.pdf
Suicide-rate per 100,000 Collected every year 2009 Countyhttp://www.health.state.mn.us/divs/chs/annsum/09annsum/Mortality09.pdf
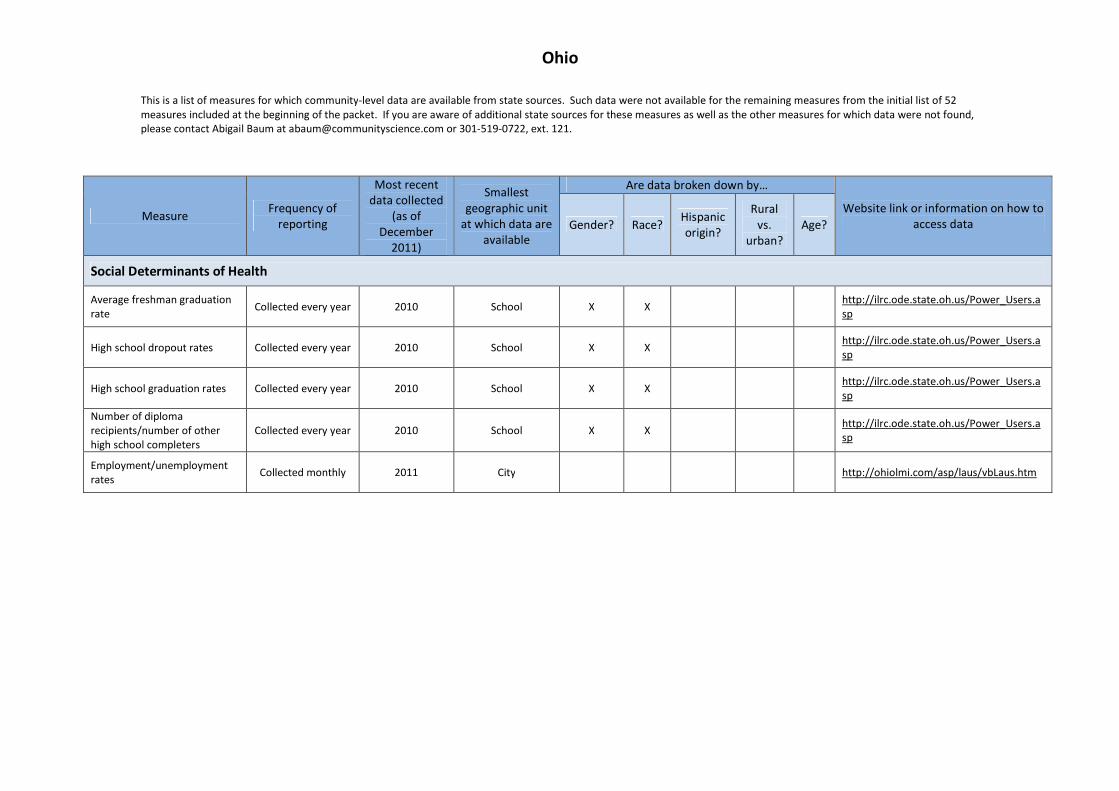
Ohio
This is a list of measures for which community-level data are available from state sources. Such data were not available for the remaining measures from the initial list of 52measures included at the beginning of the packet. If you are aware of additional state sources for these measures as well as the other measures for which data were not found,please contact Abigail Baum at [email protected] or 301-519-0722, ext. 121.
MeasureFrequency of
reporting
Most recentdata collected
(as ofDecember
2011)
Smallestgeographic unit
at which data areavailable
Are data broken down by…
Website link or information on how toaccess dataGender? Race?
Hispanicorigin?
Ruralvs.
urban?Age?
Social Determinants of Health
Average freshman graduationrate
Collected every year 2010 School X Xhttp://ilrc.ode.state.oh.us/Power_Users.asp
High school dropout rates Collected every year 2010 School X Xhttp://ilrc.ode.state.oh.us/Power_Users.asp
High school graduation rates Collected every year 2010 School X Xhttp://ilrc.ode.state.oh.us/Power_Users.asp
Number of diplomarecipients/number of otherhigh school completers
Collected every year 2010 School X Xhttp://ilrc.ode.state.oh.us/Power_Users.asp
Employment/unemploymentrates
Collected monthly 2011 City http://ohiolmi.com/asp/laus/vbLaus.htm

Ohio
MeasureFrequency of
reporting
Most recentdata collected
(as ofDecember
2011)
Smallestgeographic unit
at which data areavailable
Are data broken down by…
Website link or information on how toaccess dataGender? Race?
Hispanicorigin?
Ruralvs.
urban?Age?
Health Outcomes
Homicide-rate per 100,000 Collected every year 2006 County X Xhttp://healthyohioprogram.org/resources/profiles.aspx
Suicide-rate per 100,000 Collected every year 2006 County X Xhttp://healthyohioprogram.org/resources/profiles.aspx
Arthritis-prevalence Collected every year 2007 County X Xhttp://healthyohioprogram.org/resources/profiles.aspx
Binge drinking Collected every year 2007 County X Xhttp://healthyohioprogram.org/resources/profiles.aspx
Cigarette smoking Collected every year 2007 County Xhttp://healthyohioprogram.org/resources/profiles.aspx
Diabetes-mortality Collected every year 2007 County Xhttp://healthyohioprogram.org/resources/profiles.aspx
Kidney disease-mortality Collected every year 2007 County Xhttp://healthyohioprogram.org/resources/profiles.aspx
Obesity-prevalence Collected every year 2007 County Xhttp://healthyohioprogram.org/resources/profiles.aspx
Cancer-mortality Collected every year 2008 County Xhttp://healthyohioprogram.org/resources/profiles.aspx
Chronic lower respiratorydisease-mortality
Collected every year 2008 County Xhttp://healthyohioprogram.org/resources/profiles.aspx

Ohio
MeasureFrequency of
reporting
Most recentdata collected
(as ofDecember
2011)
Smallestgeographic unit
at which data areavailable
Are data broken down by…
Website link or information on how toaccess dataGender? Race?
Hispanicorigin?
Ruralvs.
urban?Age?
Health Outcomes
Infant/Maternal mortality Collected every year 2009 Countyhttp://www.odh.ohio.gov/healthstats/vitalstats/deathstat.aspx
Adults over age 18 who havevisited a dentist or dental clinicin the past year
Collected every year 2010 Countyhttp://publicapps.odh.ohio.gov/oralhealth/default.aspx

Wisconsin
This is a list of measures for which community-level data are available from state sources. Such data were not available for the remaining measures from the initial list of 52measures included at the beginning of the packet. If you are aware of additional state sources for these measures as well as the other measures for which data were not found,please contact Abigail Baum at [email protected] or 301-519-0722, ext. 121.
MeasureFrequency of
reporting
Most recentdata collected
(as ofDecember
2011)
Smallestgeographic unit
at which data areavailable
Are data broken down by…
Website link or information on how toaccess dataGender? Race?
Hispanicorigin?
Ruralvs.
urban?Age?
Social Determinants of Health
Percentage of children aged19-35 months completelyimmunized
Collected every year 2006 Countyhttp://www.dhs.wisconsin.gov/immunization/pdf/431331Cov2002to2006.pdf
Average freshman graduationrate
Collected every year 2010 School District X X X http://data.dpi.state.wi.us/data/
High school dropout rates Collected every year 2010 School District X X X http://data.dpi.state.wi.us/data/
High school equivalencyrecipients
Collected every year 2010 School District X X X http://data.dpi.state.wi.us/data/
High school graduation rates Collected every year 2010 School District X X X http://data.dpi.state.wi.us/data/
Highest level of education thatan individual has completed
Collected every year 2010 School District X X X http://data.dpi.state.wi.us/data/
Number of diplomarecipients/number of otherhigh school completers
Collected every year 2010 School District X X X http://data.dpi.state.wi.us/data/
Post-secondary educationenrollment plans
Collected every year 2010 School District X X X http://data.dpi.state.wi.us/data/

Wisconsin
MeasureFrequency of
reporting
Most recentdata collected
(as ofDecember
2011)
Smallestgeographic unit
at which data areavailable
Are data broken down by…
Website link or information on how toaccess dataGender? Race?
Hispanicorigin?
Ruralvs.
urban?Age?
Health Outcomes
Obesity-prevalenceMissing/unable to
determine2008 County
http://www.dhs.wisconsin.gov/health/physicalactivity/pdf_files/obesityreport.pdf
Cancer-mortality Collected every year 2010 County X X X Xhttp://www.dhs.wisconsin.gov/deaths/index.htm
Homicide-rate per 100,000 Collected every year 2010 County X X X Xhttp://www.dhs.wisconsin.gov/deaths/index.htm