community housing market report york region: vaughan · community housing market report. york...
TRANSCRIPT

Community Housing Market ReportYork Region: Vaughan
Third Quarter 2018

Third Quarter 2018
Toronto Real Estate Board
*The source for all slides is the Toronto Real Estate Board. Some statistics are not reported when the number of transactions is two (2) or less.Statistics are updated on a monthly basis. Quarterly community statistics in this report may not match quarterly sums calculated from past TREB publications. 1
ALL HOME TYPES, THIRD QUARTER 2018VAUGHAN COMMUNITY BREAKDOWN
Sales Dollar Volume Average Price Median Price New Listings Active Listings Avg. SP/LP Avg. DOM
Vaughan 708 $708,360,175 $1,000,509 $895,000 2,128 1,174 97% 30West Woodbridge Industria l A 0 - - - 1 1 - -Kleinburg 46 $72,011,299 $1,565,463 $1,237,500 147 91 94% 38Sonoma Heights 27 $24,699,900 $914,811 $900,000 60 32 98% 27Elder Mills 2 - - - 7 3 - -Islington Woods 17 $20,597,800 $1,211,635 $1,292,500 63 38 96% 24West Woodbridge 38 $27,407,179 $721,242 $673,750 93 47 99% 23Vaughan Grove 9 $4,942,000 $549,111 $526,000 31 26 98% 47Vellore Village 118 $115,276,500 $976,919 $856,000 326 167 98% 27East Woodbridge 47 $48,339,400 $1,028,498 $930,000 161 90 98% 30Pine Valley Business Park 0 - - - 0 0 - -Steeles West Industrial 0 - - - 0 0 - -Vaughan Corporate Centre 0 - - - 10 5 - -Rural Vaughan 10 $13,272,500 $1,327,250 $1,007,500 43 36 93% 31Maple 87 $75,027,174 $862,381 $841,000 211 103 97% 31Concord 20 $12,274,800 $613,740 $474,500 43 24 94% 45Glen Shields 5 $4,240,600 $848,120 $830,000 22 16 95% 30Patterson 149 $174,843,413 $1,173,446 $1,045,000 539 279 97% 27Beverley Glen 28 $19,125,800 $683,064 $526,500 75 32 97% 23Brownridge 33 $23,918,900 $724,815 $622,000 71 42 99% 32Lakeview Estates 9 $5,464,000 $607,111 $593,000 37 21 97% 27Uplands 14 $22,627,000 $1,616,214 $1,222,500 44 33 93% 48Crestwood-Springfarm-Yorkhi 49 $42,385,910 $865,019 $750,000 144 88 95% 35
SUMMARY OF EXISTING HOME TRANSACTIONS
Vaughan Community Breakdown

Third Quarter 2018
Toronto Real Estate Board
*The source for all slides is the Toronto Real Estate Board. Some statistics are not reported when the number of transactions is two (2) or less.Statistics are updated on a monthly basis. Quarterly community statistics in this report may not match quarterly sums calculated from past TREB publications. 2
0 0 0 0 0 0
Number of Transactions* Average/Median Selling Price (,000s)* Average Selling PriceMedian Selling Price
1
0 0 0 0 0
Number of New Listings*
0% 0% 0% 0% 0% 0%
Sales-to-New Listings Ratio*
Average Days on Market* Average Sale Price to List Price Ratio*
Vaughan: West Woodbridge Industrial Area
Third Quarter 2018
Toronto Real Estate Board
*The source for all slides is the Toronto Real Estate Board. Some statistics are not reported when the number of transactions is two (2) or less.Statistics are updated on a monthly basis. Quarterly community statistics in this report may not match quarterly sums calculated from past TREB publications. 3
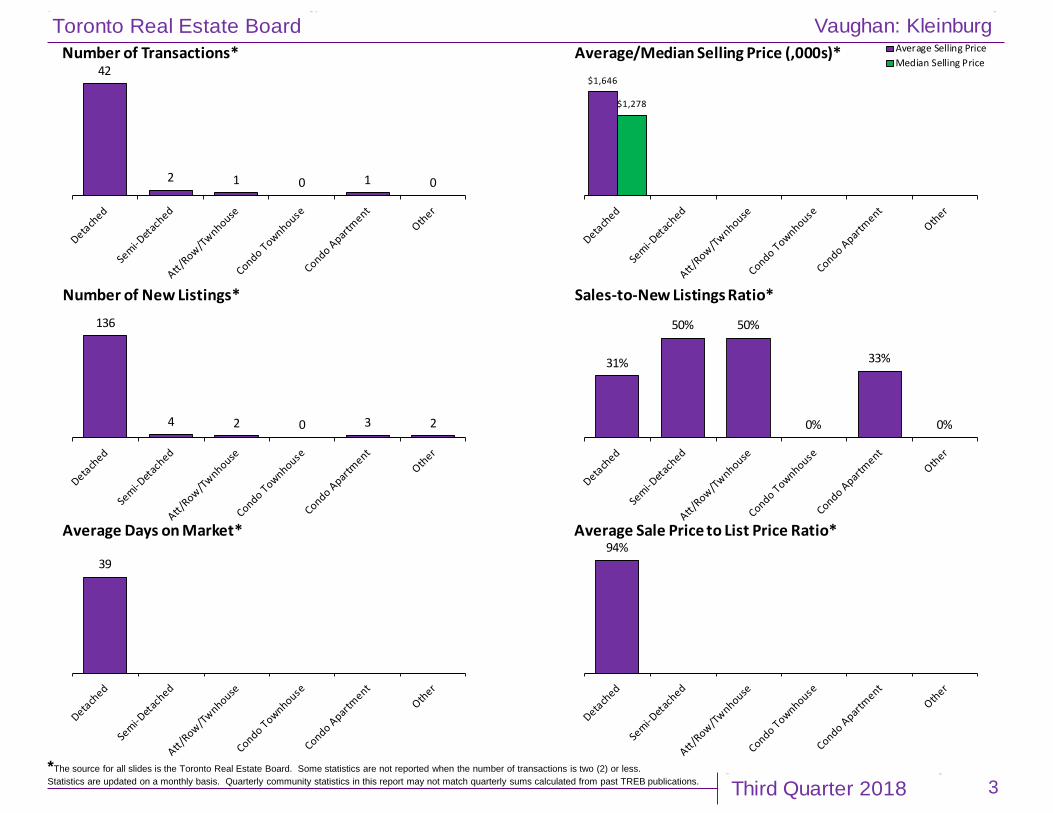
42
2 1 0 1 0
Number of Transactions*$1,646
$1,278
Average/Median Selling Price (,000s)* Average Selling PriceMedian Selling Price
136
4 2 0 3 2
Number of New Listings*
31%
50% 50%
0%
33%
0%
Sales-to-New Listings Ratio*
39
Average Days on Market*94%
Average Sale Price to List Price Ratio*
Vaughan: Kleinburg

Third Quarter 2018
Toronto Real Estate Board
*The source for all slides is the Toronto Real Estate Board. Some statistics are not reported when the number of transactions is two (2) or less.Statistics are updated on a monthly basis. Quarterly community statistics in this report may not match quarterly sums calculated from past TREB publications. 4
17
8
20 0 0
Number of Transactions*
$1,003
$774
$1,000
$770
Average/Median Selling Price (,000s)* Average Selling PriceMedian Selling Price
42
14
40 0 0
Number of New Listings*
40%
57%50%
0% 0% 0%
Sales-to-New Listings Ratio*
27 30
Average Days on Market*
97% 98%
Average Sale Price to List Price Ratio*
Vaughan: Sonoma Heights

Third Quarter 2018
Toronto Real Estate Board
*The source for all slides is the Toronto Real Estate Board. Some statistics are not reported when the number of transactions is two (2) or less.Statistics are updated on a monthly basis. Quarterly community statistics in this report may not match quarterly sums calculated from past TREB publications. 5
2
0 0 0 0 0
Number of Transactions* Average/Median Selling Price (,000s)* Average Selling PriceMedian Selling Price
5
2
0 0 0 0
Number of New Listings*40%
0% 0% 0% 0% 0%
Sales-to-New Listings Ratio*
Average Days on Market* Average Sale Price to List Price Ratio*
Vaughan: Elder Mills

Third Quarter 2018
Toronto Real Estate Board
*The source for all slides is the Toronto Real Estate Board. Some statistics are not reported when the number of transactions is two (2) or less.Statistics are updated on a monthly basis. Quarterly community statistics in this report may not match quarterly sums calculated from past TREB publications. 6
13
01
0
3
0
Number of Transactions*
$1,417
$440
$1,323
$418
Average/Median Selling Price (,000s)* Average Selling PriceMedian Selling Price
56
0 1 1 50
Number of New Listings*
23%
0%
100%
0%
60%
0%
Sales-to-New Listings Ratio*
22
30
Average Days on Market*
96% 97%
Average Sale Price to List Price Ratio*
Vaughan: Islington Woods

Third Quarter 2018
Toronto Real Estate Board
*The source for all slides is the Toronto Real Estate Board. Some statistics are not reported when the number of transactions is two (2) or less.Statistics are updated on a monthly basis. Quarterly community statistics in this report may not match quarterly sums calculated from past TREB publications. 7
12
6
9
3
8
0
Number of Transactions*$910
$747$670
$586$527
$928
$774$655 $609
$500
Average/Median Selling Price (,000s)* Average Selling PriceMedian Selling Price
30
8
20
9
26
0
Number of New Listings*
40%
75%
45%33% 31%
0%
Sales-to-New Listings Ratio*
26
19 2017
29
Average Days on Market*
100% 97% 99% 98% 99%
Average Sale Price to List Price Ratio*
Vaughan: West Woodbridge

Third Quarter 2018
Toronto Real Estate Board
*The source for all slides is the Toronto Real Estate Board. Some statistics are not reported when the number of transactions is two (2) or less.Statistics are updated on a monthly basis. Quarterly community statistics in this report may not match quarterly sums calculated from past TREB publications. 8
2
0 01
6
0
Number of Transactions*$474 $470
Average/Median Selling Price (,000s)* Average Selling PriceMedian Selling Price
20 0
1613
0
Number of New Listings*
100%
0% 0% 6%
46%
0%
Sales-to-New Listings Ratio*
24
Average Days on Market*
99%
Average Sale Price to List Price Ratio*
Vaughan: Vaughan Grove

Third Quarter 2018
Toronto Real Estate Board
*The source for all slides is the Toronto Real Estate Board. Some statistics are not reported when the number of transactions is two (2) or less.Statistics are updated on a monthly basis. Quarterly community statistics in this report may not match quarterly sums calculated from past TREB publications. 9
57
2733
0 0 1
Number of Transactions*
$1,174
$807 $780
$1,108
$789 $785
Average/Median Selling Price (,000s)* Average Selling PriceMedian Selling Price
186
5184
0 2 3
Number of New Listings*
31%
53%
39%
0% 0%
33%
Sales-to-New Listings Ratio*
3127
19
Average Days on Market*
98% 99% 99%
Average Sale Price to List Price Ratio*
Vaughan: Vellore Village

Third Quarter 2018
Toronto Real Estate Board
*The source for all slides is the Toronto Real Estate Board. Some statistics are not reported when the number of transactions is two (2) or less.Statistics are updated on a monthly basis. Quarterly community statistics in this report may not match quarterly sums calculated from past TREB publications. 10
31
5 5 4 2 0
Number of Transactions*
$1,208
$761 $739$600
$1,140
$761 $745$575
Average/Median Selling Price (,000s)* Average Selling PriceMedian Selling Price
102
15 19 12 121
Number of New Listings*30%
33%
26%
33%
17%
0%
Sales-to-New Listings Ratio*
31
2228
37
Average Days on Market*
99% 96% 99% 99%
Average Sale Price to List Price Ratio*
Vaughan: East Woodbridge

Third Quarter 2018
Toronto Real Estate Board
*The source for all slides is the Toronto Real Estate Board. Some statistics are not reported when the number of transactions is two (2) or less.Statistics are updated on a monthly basis. Quarterly community statistics in this report may not match quarterly sums calculated from past TREB publications. 11
0 0 0 0 0 0
Number of Transactions* Average/Median Selling Price (,000s)* Average Selling PriceMedian Selling Price
0 0 0 0 0 0
Number of New Listings*
0% 0% 0% 0% 0% 0%
Sales-to-New Listings Ratio*
Average Days on Market* Average Sale Price to List Price Ratio*
Vaughan: Pine Valley Business Park

Third Quarter 2018
Toronto Real Estate Board
*The source for all slides is the Toronto Real Estate Board. Some statistics are not reported when the number of transactions is two (2) or less.Statistics are updated on a monthly basis. Quarterly community statistics in this report may not match quarterly sums calculated from past TREB publications. 12
0 0 0 0 0 0
Number of Transactions* Average/Median Selling Price (,000s)* Average Selling PriceMedian Selling Price
0 0 0 0 0 0
Number of New Listings*
0% 0% 0% 0% 0% 0%
Sales-to-New Listings Ratio*
Average Days on Market* Average Sale Price to List Price Ratio*
Vaughan: Steeles West Industrial

Third Quarter 2018
Toronto Real Estate Board
*The source for all slides is the Toronto Real Estate Board. Some statistics are not reported when the number of transactions is two (2) or less.Statistics are updated on a monthly basis. Quarterly community statistics in this report may not match quarterly sums calculated from past TREB publications. 13
0 0 0 0 0 0
Number of Transactions* Average/Median Selling Price (,000s)* Average Selling PriceMedian Selling Price
0 0 0 0
10
0
Number of New Listings*
0% 0% 0% 0% 0% 0%
Sales-to-New Listings Ratio*
Average Days on Market* Average Sale Price to List Price Ratio*
Vaughan: Vaughan Corporate Centre

Third Quarter 2018
Toronto Real Estate Board
*The source for all slides is the Toronto Real Estate Board. Some statistics are not reported when the number of transactions is two (2) or less.Statistics are updated on a monthly basis. Quarterly community statistics in this report may not match quarterly sums calculated from past TREB publications. 14
9
01
0 0 0
Number of Transactions*
$1,392
$1,055
Average/Median Selling Price (,000s)* Average Selling PriceMedian Selling Price
39
04
0 0 0
Number of New Listings*
23%
0%
25%
0% 0% 0%
Sales-to-New Listings Ratio*
33
Average Days on Market*93%
Average Sale Price to List Price Ratio*
Vaughan: Rural Vaughan

Third Quarter 2018
Toronto Real Estate Board
*The source for all slides is the Toronto Real Estate Board. Some statistics are not reported when the number of transactions is two (2) or less.Statistics are updated on a monthly basis. Quarterly community statistics in this report may not match quarterly sums calculated from past TREB publications. 15
44
6
18
2
17
0
Number of Transactions*
$1,079
$772 $743
$492
$1,000
$759 $720
$475
Average/Median Selling Price (,000s)* Average Selling PriceMedian Selling Price
113
13
40
7
38
0
Number of New Listings*
39%46% 45%
29%
45%
0%
Sales-to-New Listings Ratio*
33 3227 29
Average Days on Market*
97% 98% 98% 97%
Average Sale Price to List Price Ratio*
Vaughan: Maple

Third Quarter 2018
Toronto Real Estate Board
*The source for all slides is the Toronto Real Estate Board. Some statistics are not reported when the number of transactions is two (2) or less.Statistics are updated on a monthly basis. Quarterly community statistics in this report may not match quarterly sums calculated from past TREB publications. 16
3
02
0
15
0
Number of Transactions*
$1,181
$485
$1,179
$464
Average/Median Selling Price (,000s)* Average Selling PriceMedian Selling Price
50 1 0
37
0
Number of New Listings*
60%
0%
200%
0%41%
0%
Sales-to-New Listings Ratio*
104
33
Average Days on Market*
91% 96%
Average Sale Price to List Price Ratio*
Vaughan: Concord

Third Quarter 2018
Toronto Real Estate Board
*The source for all slides is the Toronto Real Estate Board. Some statistics are not reported when the number of transactions is two (2) or less.Statistics are updated on a monthly basis. Quarterly community statistics in this report may not match quarterly sums calculated from past TREB publications. 17
4
0 0 0 0
1
Number of Transactions*
$865 $835
Average/Median Selling Price (,000s)* Average Selling PriceMedian Selling Price
16
0 0 0 0
6
Number of New Listings*
25%
0% 0% 0% 0%
17%
Sales-to-New Listings Ratio*
36
Average Days on Market*
95%
Average Sale Price to List Price Ratio*
Vaughan: Glen Shields

Third Quarter 2018
Toronto Real Estate Board
*The source for all slides is the Toronto Real Estate Board. Some statistics are not reported when the number of transactions is two (2) or less.Statistics are updated on a monthly basis. Quarterly community statistics in this report may not match quarterly sums calculated from past TREB publications. 18
77
15
55
0 0 2
Number of Transactions*
$1,413
$873 $927
$1,398
$865 $890
Average/Median Selling Price (,000s)* Average Selling PriceMedian Selling Price
327
37
169
0 0 6
Number of New Listings*
24%
41%
33%
0% 0%
33%
Sales-to-New Listings Ratio*
2924 24
Average Days on Market*
97% 98% 98%
Average Sale Price to List Price Ratio*
Vaughan: Patterson

Third Quarter 2018
Toronto Real Estate Board
*The source for all slides is the Toronto Real Estate Board. Some statistics are not reported when the number of transactions is two (2) or less.Statistics are updated on a monthly basis. Quarterly community statistics in this report may not match quarterly sums calculated from past TREB publications. 19
40
30
21
0
Number of Transactions*
$1,576
$924
$479
$1,381
$865
$459
Average/Median Selling Price (,000s)* Average Selling PriceMedian Selling Price
26
05 5
39
0
Number of New Listings*
15%
0%
60%
0%
54%
0%
Sales-to-New Listings Ratio*
2732
20
Average Days on Market*
96% 97% 98%
Average Sale Price to List Price Ratio*
Vaughan: Beverley Glen

Third Quarter 2018
Toronto Real Estate Board
*The source for all slides is the Toronto Real Estate Board. Some statistics are not reported when the number of transactions is two (2) or less.Statistics are updated on a monthly basis. Quarterly community statistics in this report may not match quarterly sums calculated from past TREB publications. 20
9
0 04
20
0
Number of Transactions*$1,099
$611 $579
$1,125
$609 $557
Average/Median Selling Price (,000s)* Average Selling PriceMedian Selling Price
38
0 04
29
0
Number of New Listings*
24%
0% 0%
100%
69%
0%
Sales-to-New Listings Ratio*
29
3732
Average Days on Market*
99% 99% 98%
Average Sale Price to List Price Ratio*
Vaughan: Brownridge
Third Quarter 2018
Toronto Real Estate Board
*The source for all slides is the Toronto Real Estate Board. Some statistics are not reported when the number of transactions is two (2) or less.Statistics are updated on a monthly basis. Quarterly community statistics in this report may not match quarterly sums calculated from past TREB publications. 21
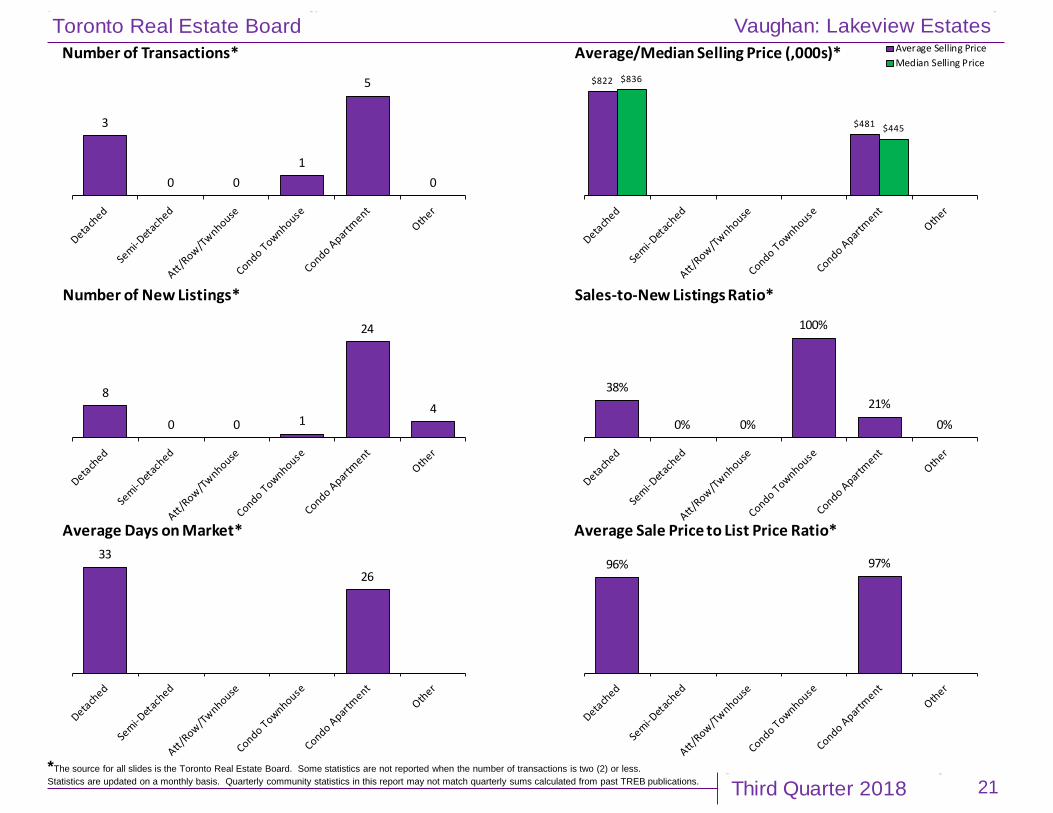
3
0 01
5
0
Number of Transactions*$822
$481
$836
$445
Average/Median Selling Price (,000s)* Average Selling PriceMedian Selling Price
8
0 0 1
24
4
Number of New Listings*
38%
0% 0%
100%
21%0%
Sales-to-New Listings Ratio*
33
26
Average Days on Market*
96% 97%
Average Sale Price to List Price Ratio*
Vaughan: Lakeview Estates

Third Quarter 2018
Toronto Real Estate Board
*The source for all slides is the Toronto Real Estate Board. Some statistics are not reported when the number of transactions is two (2) or less.Statistics are updated on a monthly basis. Quarterly community statistics in this report may not match quarterly sums calculated from past TREB publications. 22
10
0 0
4
0 0
Number of Transactions*
$1,944
$796
$1,346
$753
Average/Median Selling Price (,000s)* Average Selling PriceMedian Selling Price
38
0 06
0 0
Number of New Listings*
26%
0% 0%
67%
0% 0%
Sales-to-New Listings Ratio*
56
29
Average Days on Market*
92% 98%
Average Sale Price to List Price Ratio*
Vaughan: Uplands

Third Quarter 2018
Toronto Real Estate Board
*The source for all slides is the Toronto Real Estate Board. Some statistics are not reported when the number of transactions is two (2) or less.Statistics are updated on a monthly basis. Quarterly community statistics in this report may not match quarterly sums calculated from past TREB publications. 23
20
2 15
21
0
Number of Transactions*$1,289
$610$524
$1,078
$597$445
Average/Median Selling Price (,000s)* Average Selling PriceMedian Selling Price
43
1 7 12
81
0
Number of New Listings*
47%
200%
14%42% 26%
0%
Sales-to-New Listings Ratio*
35
46
35
Average Days on Market*
94% 97% 96%
Average Sale Price to List Price Ratio*
Vaughan: Crestwood-Springfarm-Yorkhill