community college research center | july 2013 trends …
TRANSCRIPT
COMMUNITY COLLEGE RESEARCH CENTER | JULY 2013
Trends in Enrollment Patterns Among Community College Students
Analysis reveals many distinct patterns of enrollment, very few of which comport with the idealized notion of traditional enrollment.
Community college programs are designed around regularity. Degrees and
certificates are often branded with an expected or “regular” completion time (e.g., two-year
associate degree, one-year certificate), and suggested course sequences often assume this
underlying time structure. In reality, however, relatively few students finish their course
sequences and programs of study so quickly. Instead, students generate a diverse array of
attendance patterns that may include periods of non-enrollment and shifts in part-time/full-
time status. Indeed, the notion of a regular enrollment pattern is quickly challenged through
analysis of data on how students actually attend community college.
FindingsUsing a large dataset, this report (based on a longer paper—see Crosta, 2013) reveals the di-
versity of enrollment patterns among community college students as they progress along their
education pathways. It also demonstrates a novel graphical technique for displaying large num-
bers of student enrollment patterns in terms of continuity (whether or not a student enrolls in a
given semester) and intensity (whether a student enrolls part-time or full-time).
The student-level data used in the study come from five community colleges located in a single
state. Each college uses a semester system, in which an academic year is defined by fall and
spring terms followed by a shorter summer term. The sample consists of 14,429 first-time-in-
college (FTIC) degree- or transfer-seeking students who began at one of the five institutions
in the 2005–06 or 2006–07 academic year. The students are tracked through the 2010–11
academic year (i.e., for 18 terms or six years for the 2005–06 entering cohort, and for 15 terms
or five years for the 2006–07 entering cohort).
Analysis reveals many distinct patterns of enrollment among community college students,
very few of which comport with the idealized notion of traditional enrollment. Because so
many students are found to switch their enrollment intensity multiple times, the results call
into question the conventional characterization of enrollees as either part-time or full-time
students. More broadly, the widespread variation in enrollment patterns underscores the chal-
lenge for colleges in facilitating students’ entry into and completion of programs of study.
By Peter M. Crosta
DEFINITIONS
CONTINUITY
Whether or not a student enrolls in a given semester.
INTENSITY
Whether an enrolled student attends part-time or full-time.

2
COMMUNITY COLLEGE RESEARCH CENTER / TEACHERS COLLEGE, COLUMBIA UNIVERSITY
Vector Patterns of Individual Students
Student enrollment patterns can be described in terms of continuity and intensity. Intensity distinguishes between full-time
and part-time enrollment, where full-time is defined as attempting 12 or more credit hours in the fall and spring terms or six or
more credit hours in the summer term. Continuity specifies whether or not a student enrolled at all in a given term. Each stu-
dent’s first term of enrollment is considered term one, regardless of whether it occurred in fall, spring, or summer. Each subse-
quent term is numbered incrementally from the student’s first term.
These definitions are employed to create a vector of length 18 for each student that consists of a series of zeroes, ones, and periods.
The ith location of the vector is a 1 if the student in term i enrolled full-time, a 0 if the student enrolled part-time, and a period
if the student did not enroll. (Because they were tracked for only 15 terms, students in the 2006–07 cohort necessarily had no
enrollment in terms 16, 17, and 18.) For example, a traditional student who begins in the fall and follows an idealized two-year
degree track may enroll full-time in the first two terms and skip the summer term, and then enroll full-time in the fourth and fifth
terms. Such a student’s vector would look like this:
11.11.............
A student who enrolls intermittently, sometimes part-time and sometimes full-time, may have a vector that looks like this:
01010..0..0..1....
Over the 18 observed terms, there are 4,594 distinct patterns of full-time, part-time, and non-enrollment. The 10 most com-
mon patterns, shown in the left panel of Table 1, account for 44 percent of the students in the sample; 10 of the least common
patterns, each of which represents just one student, are presented in the right panel of Table 1. The two most common patterns
represent students who enrolled for only one term, either part-time or full-time (28 percent of students). Most of these 4,000
students were the earliest dropouts from college. However, some of them earned short-term certificates (19 students) or trans-
ferred to a four-year institution (595 students) sometime after that first term.
TABLE 1: COMMON AND UNCOMMON ENROLLEMT VECTOR PATTERNS
PATTERN FREQUENCY % OF TOTAL PATTERN FREQUENCY % OF TOTAL 0................. 2,810 19.5 100......0..0..... 1 0.007
1.................* 1,190 8.2 00.00.11.11.1..... 1 0.007
00................ 744 5.2 11111.1100........ 1 0.007
11................ 561 3.8 00.01.00.00....... 1 0.007
10................ 291 2.0 10.1..11.11.1..... 1 0.007
11.11.............** 175 1.2 00..........0..0.. 1 0.007
01................ 145 1.0 10.00.10001.100... 1 0.007
0.0............... 140 1.0 00..0.0.00.....0.. 1 0.007
11.1.............. 125 0.8 10.11111111....... 1 0.007
00.0.............. 115 0.7 11.1..11011.1..... 1 0.007
Note. In these vector patterns, 1 indicates full-time enrollment, 0 indicates part-time enrollment, and a period indicates non-enrollment. The position of the number in the vector indicates the term number, from 1 to 18.
There are thousands of students who generate unique enrollment patterns; examples of such patterns are shown on the right
panel of Table 1. These patterns often include several matriculation periods; gaps in enrollment; long, persistent states of at-
tendance; and frequent switching between full-time, part-time, and non-enrollment states. In general, more common enroll-
ment patterns are short, and less common patterns are long; the longer a student stays in college (whether continuously or with
periods of non-enrollment), the more likely it is that the student’s pattern will be unique.

3
CCRC ANALYTICS / TRENDS IN ENROLLMENT PATTERNS AMONG COMMUNITY COLLEGE STUDENTS / JULY 2013
It is important to note that students usually stop enrolling after they graduate or transfer, but the vector patterns do not indicate
when graduation or transfer occurs. Among students captured in the left panel of Table 1, 65 (about 1 percent) earned a certifi-
cate or associate degree. Certificate awards are concentrated in the second pattern (*) on the left panel and associate awards in
the sixth pattern (**) on the left panel.
Displaying Multiple Vector Patterns
To understand the full range of enrollment patterns and how they relate to graduation and transfer, it is helpful to construct an
image from the vector patterns of all the students. In the images that follow, student vector patterns are represented with thin
bands of color instead of zeroes, ones, and periods. The student vector patterns are sorted and stacked to create a matrix of stu-
dent enrollment status by term where similar enrollment patterns are grouped together.
Figure 1 provides an example of how enrollment continuity and intensity would be represented visually for students following
three traditional enrollment patterns. Enrollments are concentrated in the left side of the figure. All students in this example
completed four terms of full-time enrollment (terms 1, 2, 4, and 5). Two thirds of these students enrolled part-time in the first
summer term (term 3), and half of those students enrolled part-time again for a second summer term (term 6). From the end of
the sixth term until the end of the tracking period, none of the students enrolled again.
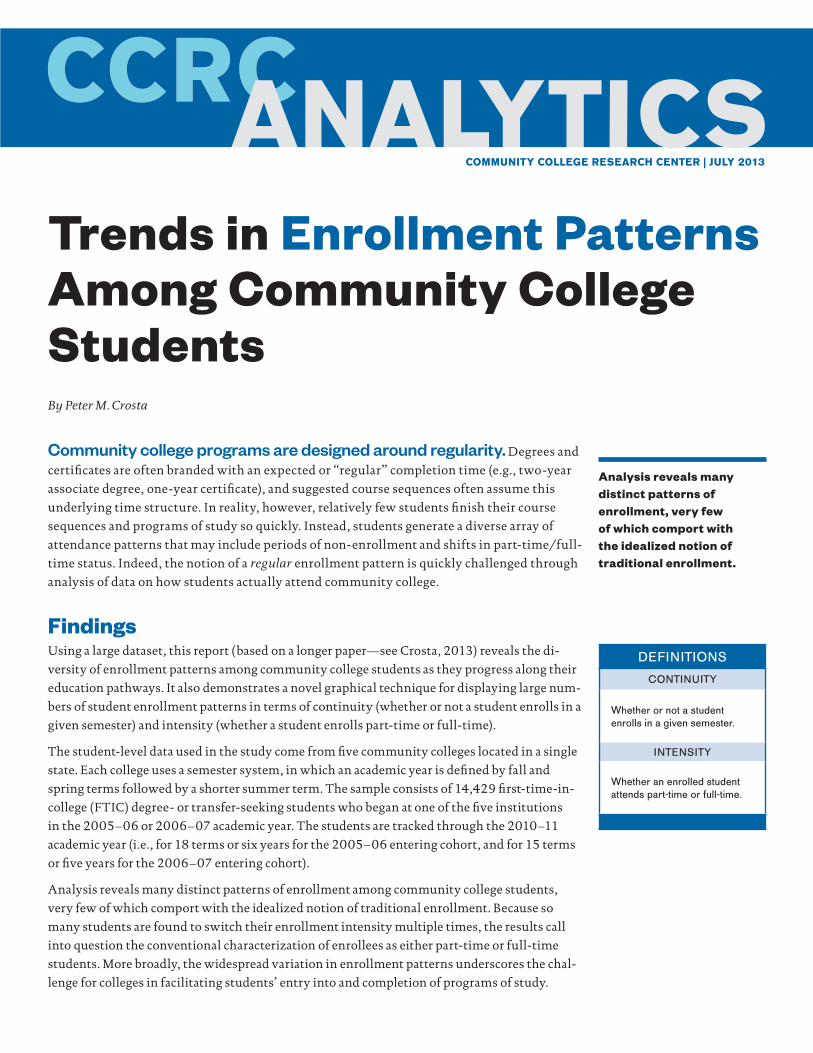
Although some individual students might have enrollment patterns like the three shown in Figure 1, the reality is that such ideal-
ized patterns are rare among community college students. The set of patterns from all 14,429 students in the sample is shown in
Figure 2 (see page 5). In term 1, all students are either enrolled full-time (represented by the blue block of color in the top portion
of the first column) or part-time (represented by the green block of color in the bottom portion of the first column). As the terms
progress and students switch their enrollment statuses, these blocks of color are subdivided to represent students’ divergent en-
rollment patterns. Scanning across the image allows for the visualization of the wide variation of enrollment intensity and conti-
nuity after the first few terms.
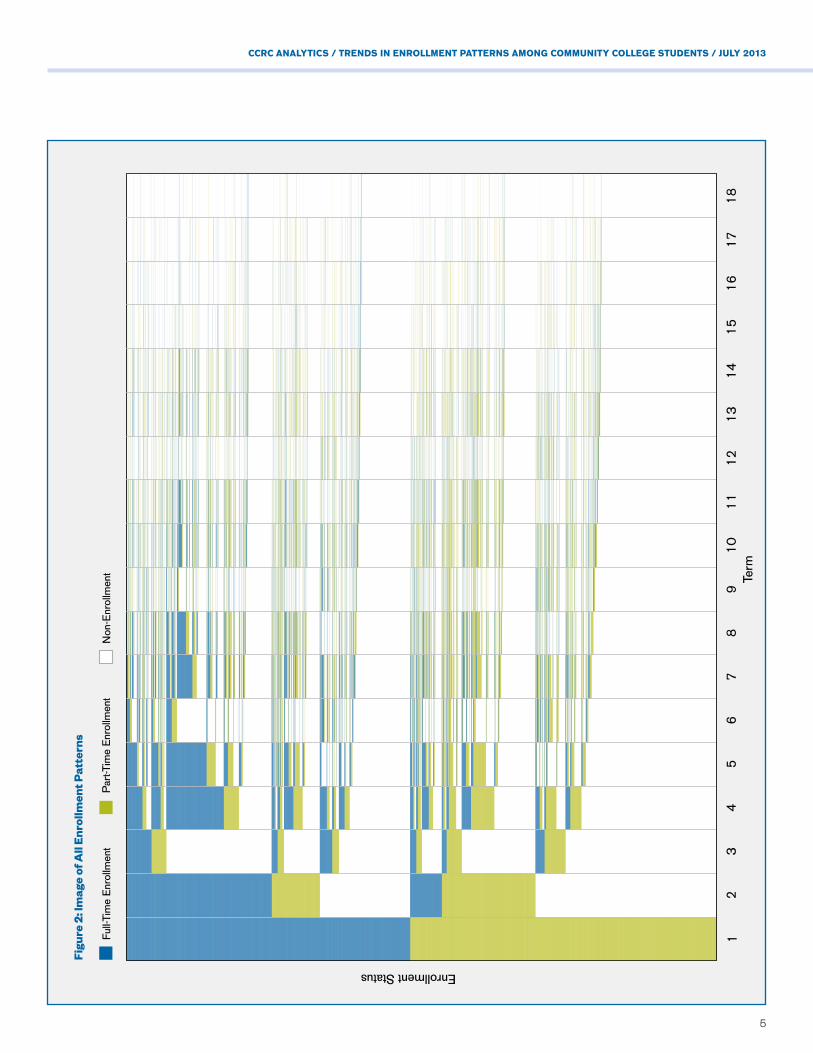
A concern when looking at patterns like this is that students who graduated or transferred appear as “not enrolled” in later terms,
potentially suggesting that they dropped out. To address this concern, Figures 3 and 4 (see pages 6 and 7) show the relationship be-
tween successful outcomes and the enrollment patterns with indicator marks overlaid where and when such events occur. Figure
3 includes indicator marks to show when students have earned a degree or certificate, and Figure 4 includes marks that represent
students’ first enrollment term in a four-year school.
Figure 3 shows that of the 14,429 students in the sample, 244 earned short-term certificates, 157 earned long-term certificates,
538 earned an Associate of Arts, 56 earned an Associate of Science, and 658 earned an Associate of Applied Science. Perhaps
not surprisingly, credentials are most heavily clustered along the top of Figure 3, among students with more consecutive terms of
full-time enrollment. However, there are several examples of persistent students who managed to earn a credential after 12 or even
Term
Enr
ollm
ent S
tatu
s
1 2 3 4 5 6 7 8 9 10 11 12 13 14 15 16 17 18
Full-Time Enrollment Part-Time Enrollment Non-Enrollment
Figure 1: Image of Traditional Enrollment Patterns

4
COMMUNITY COLLEGE RESEARCH CENTER / TEACHERS COLLEGE, COLUMBIA UNIVERSITY
15 terms of part-time or intermittent enrollment. (The figure also shows that some students have award dates in terms in which
they have no enrollment record, resulting from late filing of award paperwork or a delay in recognizing transfer credit, among
other reasons.)
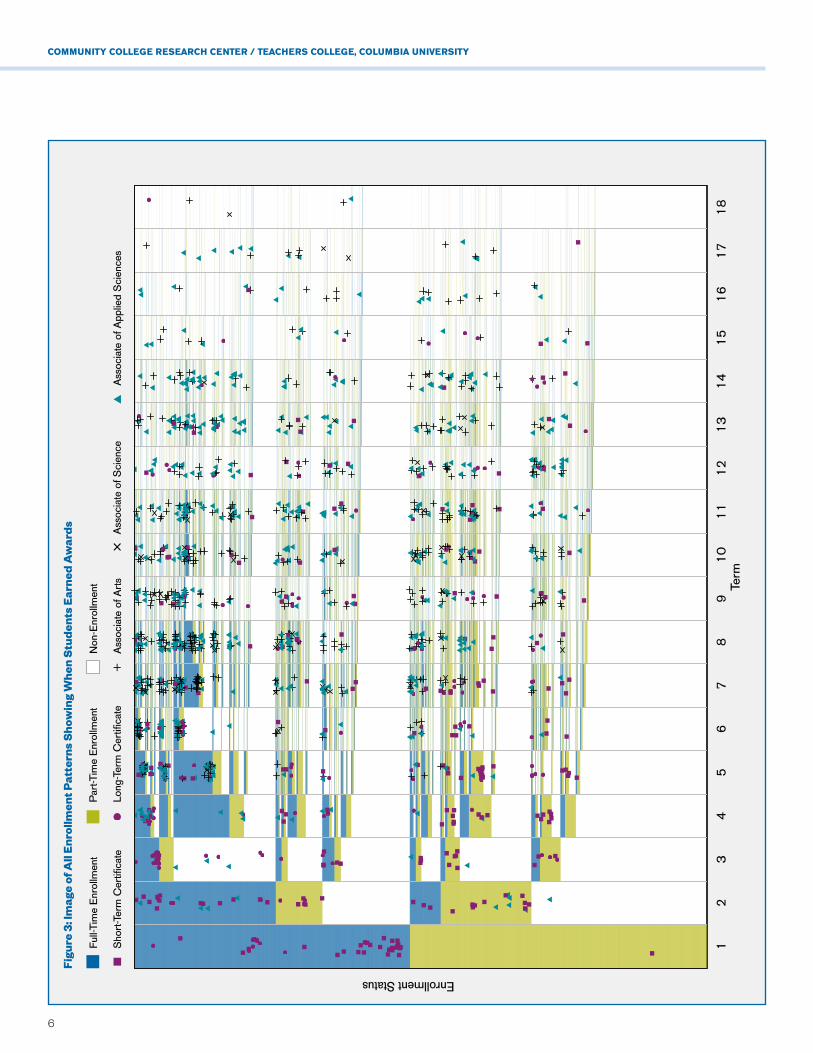
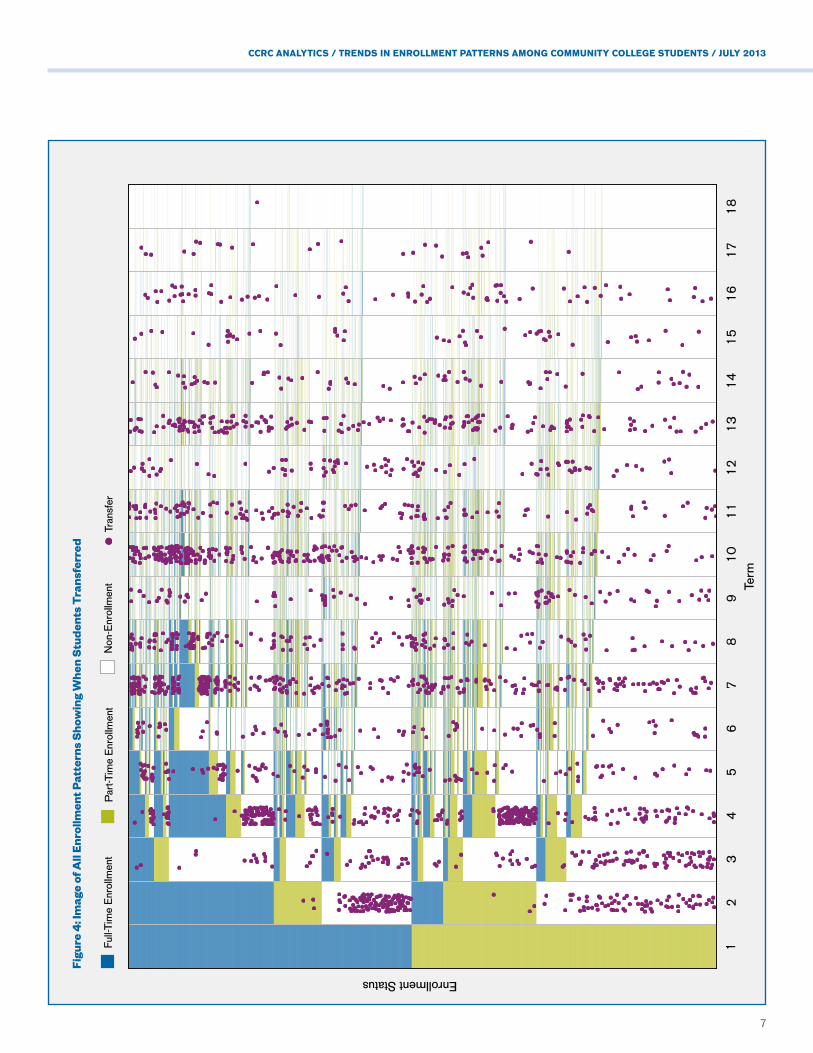
Figure 4 shows that of the 14,429 students in the sample, 2,656 transferred to a four-year institution. The indicator marks in
Figure 4 that represent transfer form a few clusters where one might expect to see them. For example, some students transfer
after one term of community college study, perhaps due to deferral from a four-year institution, spring admission to a four-year
institution, or even co-enrollment at a four-year institution. (Of the 148 students who attended community college in term 1
and who transferred in term 2, 54 percent began community college in the fall, 4 percent began in the spring, and 32 percent
began in the summer.) A cluster of students also transferred to a four-year college during term 4, which would likely be the first
fall term after a full year of community college study.
Terms 7 and 10 have clusters of transfers, a pattern expected of fall entrants who transferred to a four-year institution in a fall
term following two or three years at a community college. Although many transferees left in the term immediately following
a community college term, many others departed community college and then waited years before enrolling in a bachelor’s
degree–granting institution. Still others engaged in concurrent enrollment (as seen by transfer indicator marks inside of the
blue or green bars).
Discussion and ConclusionIt is clear from the images that students in the sample generate a wide variety of patterns due to intermittent enrollment and fre-
quent switching between full- and part-time status. There are about one third as many patterns of enrollment as there are students
(4,585 distinct patterns for 14,429 students), and significant numbers of students were still attached to community college during
the last year of the tracking period (9 percent of the 2005–06 cohort). Except for those who left the institution early in their post-
secondary careers, few students had identical enrollment patterns in college.
Several broad conclusions can be drawn from these findings. First, very few students follow traditional trajectories, and many
students drop out early on. Only about 1 percent of students in the sample followed the traditional fall–spring, fall–spring pattern
(with a break for summer) during the first six terms, followed by no additional enrollment in subsequent terms. Some 28 percent of
students had only one term of enrollment at a community college. Almost 40 percent of students enrolled in one or two consecu-
tive terms and never returned to either a two-year or four-year college within the tracking period.
Second, there is a lot of switching between full- and part-time status. In general, those who began full-time were more likely to
have subsequent full-time terms, suggesting that their rate of credit accumulation was greater than those who started part-time.
However, students frequently switched between full- and part-time enrollment (43 percent of students did so at least once, and
one quarter switched two or more times). Sixty-nine percent of full-time starters who returned at least once had at least one
part-time term. About half of part-time starters who returned at least once had at least one full-time term. This high degree of
switching challenges the notion that students can be identified broadly as either full- or part-time students based on their first-
term enrollment intensity alone.
Third, the patterns help explain why colleges have difficulty getting students into and through programs of study (Jenkins &
Cho, 2012). The images show wide variation in enrollment patterns characterized by enrollment gaps, variation in enrollment
intensity, and early exit from college. Few students earned an associate degree in two years (3.5 percent). Over a six-year tracking
period, many students left directly after their first term in college (28 percent). Only a handful of these students completed short-
term certificates or transferred to a four-year institution (15 percent of the 28 percent). The typical student in the sample attended
full-time in about 44 percent of the terms attended. Finishing a two-year degree quickly is bound to be uncommon when full-time
enrollment is this low.
Generating images of enrollment intensity and continuity for cohorts of students, as was done in this report, can help colleges and
state systems recognize the wide variety of enrollment patterns among their students, drawing attention to the need to help students
5
CCRC ANALYTICS / TRENDS IN ENROLLMENT PATTERNS AMONG COMMUNITY COLLEGE STUDENTS / JULY 2013
Term
Enrollment Status
12
34
56
78
91
01
11
21
31
41
51
61
71
8
Full-
Tim
e E
nrol
lmen
t P
art-T
ime
Enr
ollm
ent
Non
-Enr
ollm
ent
Figu
re 2
: Im
age
of A
ll En
rollm
ent P
atte
rns
6
COMMUNITY COLLEGE RESEARCH CENTER / TEACHERS COLLEGE, COLUMBIA UNIVERSITY
Term
Enrollment Status
12
34
56
78
91
01
11
21
31
41
51
61
71
8
Full-
Tim
e E
nrol
lmen
t P
art-T
ime
Enr
ollm
ent
Non
-Enr
ollm
ent
Sho
rt-T
erm
Cer
tific
ate
Ass
ocia
te o
f Art
sLo
ng-T
erm
Cer
tific
ate
Ass
ocia
te o
f App
lied
Sci
ence
sA
ssoc
iate
of S
cien
ce
Figu
re 3
: Im
age
of A
ll En
rollm
ent P
atte
rns
Sho
win
g W
hen
Stu
dent
s Ea
rned
Aw
ards
7
CCRC ANALYTICS / TRENDS IN ENROLLMENT PATTERNS AMONG COMMUNITY COLLEGE STUDENTS / JULY 2013
Enrollment Status
12
34
56
78
91
01
11
21
31
41
51
61
71
8
Full-
Tim
e E
nrol
lmen
t P
art-T
ime
Enr
ollm
ent
Non
-Enr
ollm
ent
Tran
sfer
Term
Figu
re 4
: Im
age
of A
ll En
rollm
ent P
atte
rns
Sho
win
g W
hen
Stu
dent
s T
rans
ferr
ed
Community College Research Center
Teachers College, Columbia University
525 West 120th Street, Box 174
New York, New York 10027
Tel: 212.678.3091 Fax: 212.678.3699
http://ccrc.tc.columbia.edu
Community College Research Center
Teachers College, Columbia University
525 West 120th Street, Box 174
New York, New York 10027
Tel: 212.678.3091 Fax: 212.678.3699
http://ccrc.tc.columbia.edu
Funding for this research was provided by the Bill & Melinda Gates Foundation.
find, pursue, and complete suitable college pathways and credentials. Although students tend to change their enrollment statuses in
response to work, family, financial, and academic circumstances, it is not clear that the diversity of enrollment patterns found at com-
munity colleges is truly optimal for students. The highly flexible structure of community college programs, in which students can
drop in and out at will, allows for, but may also encourage, long enrollment patterns, which can delay or thwart success.
ReferencesCrosta, P. M. (2013). Intensity and attachment: How the chaotic enrollment patterns of community college students affect education-al outcomes (CCRC Working Paper No. 60). New York, NY: Columbia University, Teachers College, Community College Research
Center.
Jenkins, D., & Cho, S. W. (2012). Get with the program: Accelerating community college students’ entry into and completion of programs of study (CCRC Working Paper No. 32). New York, NY: Columbia University, Teachers College, Community College
Research Center.
Radford, A. W., Berkner, L., Wheeless, S. C., & Shepherd, B. (2010). Persistence and attainment of 2003–04 beginning postsecond-ary students: After 6 years (NCES 2011-151). Washington, DC: U.S. Department of Education, Institute of Education Sciences,
National Center for Education Statistics.