community assessment - dca.ga.gov · finance, insurance & real estate 193 215 236 261 283 300...
TRANSCRIPT

COMPREHENSIVE PLAN
FOR THE
UNIFIED GOVERNMENT OF
CUSSETA-CHATTAHOOCHEE
COUNTY
COMMUNITY ASSESSMENT
2008-2030
Prepared by
THE LOWER CHATTAHOOCHEE
REGIONAL DEVELOPMENT CENTER

2
Cusseta-Chattahoochee County Comprehensive Plan 2007-2030
Community Assessment
Table of Contents
Introduction............................................................................................................................................... 3
Population ............................................................................................................................................. 3 Issues................................................................................................................................................. 4 Opportunities .................................................................................................................................... 4
Economic Development........................................................................................................................ 4 Issues................................................................................................................................................. 5 Opportunities .................................................................................................................................... 5
Housing................................................................................................................................................. 6 Issues................................................................................................................................................. 7 Opportunities .................................................................................................................................... 7
Natural and Cultural Resources ............................................................................................................ 7 Issues................................................................................................................................................. 7 Opportunities .................................................................................................................................... 7
Community Facilities............................................................................................................................ 8 Issues................................................................................................................................................. 8 Opportunities .................................................................................................................................... 9
Intergovernmental................................................................................................................................. 9 Issues................................................................................................................................................. 9 Opportunities .................................................................................................................................. 10
Transportation..................................................................................................................................... 10 Issues............................................................................................................................................... 10 Opportunities .................................................................................................................................. 10
Land Use............................................................................................................................................. 10 Issues............................................................................................................................................... 10 Opportunities .................................................................................................................................. 11
Analysis of Existing Development Patterns ........................................................................................... 12 Existing Land Use Table ................................................................................................................ 12 Existing Land Use Definitions Table ............................................................................................. 14
Areas Requiring Special Attention ..................................................................................................... 14 Areas Where Development is Likely to Occur................................................................................... 15 Significant Natural Resources ............................................................................................................ 15 Significant Cultural Resources ........................................................................................................... 15

3
Areas with Significant In-fill Development Opportunities ................................................................ 15 Brownfields......................................................................................................................................... 16 Areas of Disinvestment, Needing Redevelopment, or Improvements to Aesthetics or Attractiveness............................................................................................................................................................ 16 Recommended Character Areas ......................................................................................................... 16
Character Area Table...................................................................................................................... 17
Introduction As the first part of the Cusseta-Chattahoochee County Comprehensive Plan the community assessment includes a list of potential issues and opportunities the community may want to take action on, an analysis of existing development patterns, including map of recommended character areas to be considered in the development of the community’s vision statement, an evaluation of current policies, activities, and development patterns for consistency with the Quality Community Objectives. Finally the community assessment includes an analysis of data and information and the potential issues and opportunities prevalent to the community.
Population Population in Cusseta-Chattahoochee County (excluding that of the Fort Benning military installation) is projected to increase by 13,571 persons over the next twenty-four (24) years. The county’s population growth is expected to be greatest over the next seven (7) years, growing by a minimum of 5,000 individuals. Projected increases are a result of the relocation of 25,000 to 30,000 military and civilian dependents to the Columbus, GA area. The School aged population is expected to increase significantly by year 2030. The school system is currently adding over 100 new students a year. The Male to Female population ratio (including Fort Benning) will remain relatively the same with two Males to every one Female.
Chattahoochee County Total Populations 1980-200
1980 1990 2000 % Change
1980-1990 % Change 1990-2000
Chattahoochee County
21,732
16,934
14,882 -28.33 -13.79 Rural Chattahoochee County 1,029 1,404 1,533 26.71 8.41 City of Cusseta 1,218 1,107 1,196 -10.03 7.44
Fort Benning Division
19,485
14,423
12,153 -35.10 -18.68
State of Georgia
5,486,900
6,478,149
8,186,453 15.30 20.87 Source: U.S. Bureau of the Census, 1980, 1990, 2000. Lower Chattahoochee RDC Staff, 2006
Cusseta-Chattahoochee County Total Population Projection 2005-2030 2005 2010 2015 2020 2025 2030
Chattahoochee County
19,628
32,202
39,523
41,025
42,584
44,802

4
Cussetta-Chattahoochee County
2,808
10,293
14,458
15,072
15,712
16,379
Fort Benning Division
16,820
21,909
25,365
25,953
26,872
28,423 Source: Lower Chattahoochee RDC Staff, 2006
Issues • Providing Infrastructure for a growing population (water, sewer, schools, transportation, etc.). • Providing additional classrooms and school facilities for a growing population. • Paying for Growth. • Integrating New Comers with Old Timers. • Increasing Property Values and potentially increasing Taxes.
Opportunities • Diversifying the population. • Expanding Tax base from new residential, commercial and industrial growth. • Expanding local Job Opportunities. • Expanding Community Investment. • Increase in civilian and military populations.
Economic Development Economic Growth in Chattahoochee County over the last twenty (20) years has been slow. With Fort Benning’s expansion and general growth of the Columbus Metropolitan area; Cusseta-Chattahoochee County is expected to experience significant economic growth. Based on conversations with local officials and organizations such as the Chattahoochee Chamber of Commerce and the Greater Columbus Chamber of Commerce growth is expected to occur in the following sectors, service, retail, defense contracting and construction. The National Security Association (NSA) is scheduled to build a security training facility in Chattahoochee County. In addition, building plans are on the table for three (3) new subdivisions and a new retail center.
Chattahoochee County Total Employed Civilian Population 1980-2000
1980 1990 2000 % Change
1980-1990 % Change 1990-2000
Chattahoochee County 1,435 2,047 2,280 29.90 10.22State of Georgia N/A 3,090,276 3,839,756 N/A 19.52United States N/A 115,681,202 129,721,512 N/A 11.00
Source: U.S. Bureau of the Census Note: The above tables reflect civilian employment population, and do not take into account expected growth from Fort Benning expansion.

5
Cusseta-Chattahoochee County Employment by Industry Projections 2005-2030
2005 2010 2015 2020 2025 2030 Total Employed Civilian Population 2,491 2,703 2,914 3,125 3,336
3,566
Agriculture, Forestry, Fishing, Hunting & Mining 44 56 59 66 76 81 Construction 201 225 243 263 279 298 Manufacturing 259 266 274 281 292 302 Wholesale Trade 71 77 93 104 115 129 Retail Trade 311 293 275 259 246 241 Transportation, Warehousing & Utilities 102 110 127 138 153 168
Finance, Insurance & Real Estate 193 215 236 261 283 300 Professional, Scientific, Management, Administrative, & Waste Management Services 112 129 143 152 164 185 Educational, Health & Social Services 615 678 739 804 856 925 Arts, Entertainment, Recreation, Accommodation, & Food Services 180 206 229 254 281 303 Other Services 177 209 244 278 313 343 Public Administration 226 239 252 265 278 291
Source: U.S. Bureau of the Census
Issues • Means of tracking growth or reduction in businesses and proposed changes in businesses. • Uneven levels of development need of redevelopment (Downtown/ Town Center). • Lack of local incentives to attract industry. • Growth limited due to infrastructure (water, sewer, natural gas). • Transportation for job opportunities.
Opportunities • Business Recruitment and Retention Program. • Seek assistance from the Georgia Department of Economic Development (GDEcD) in
developing surveys to assess the current situation in the county with existing businesses • Community Economic Development Programs use tools such as downtown revitalization and
low interest rate loans to attract new businesses and rehabilitate existing buildings in the downtown area.
• Implementing adequate public facilities (water, sewer, natural gas) is necessary for commercial, industrial and residential growth.
• Increase of local job opportunities which will require less transportation. • Implementation of a public transit system.

6
• Job training and adult education programs. • Continued development of local education system. • Industrial and commercial development. • NSA Training Facility.
Housing Housing stock in Cusseta-Chattahoochee County consists of a mixture of traditional single family stick-built homes, multi-family units and manufactured and mobile home units. The 2000 housing inventory consisted of 3,316 housing units. The total housing stock consisted of 58% single family units, 22% multi-family units and manufactured or mobile home units make up 20% of total housing units. A high majority of the County’s housing units (64%) are rental units. In comparison only 30% of total units in Georgia were used as rental units in 2000. The high renter percentage reflects the high poverty rate and lower incomes in Chattahoochee County as well as the transient nature of military personnel. Housing cost in Chattahoochee County have been relatively low when compared to the region and the state, with a median housing value of $63,800 in 2000 as compared to the state’s median 2000 value of $111,200. From a cost burden standpoint only 20% of Cusseta-Chattahoochee County home owners are cost burdened. Renters appear to pay more of their incomes on housing with only 21% paying less than 30% of their income on rent. In the region 52.9% of renters pay less than 30% of their income of housing cost while 56% of renters in the State of Georgia pay less than 30% of their income on rent. With anticipated area growth both the value of property and monthly rent cost are expected to increase. Also growth in Chattahoochee County is expected to add approximately 1,600 new households over the next 25 years. Plans are already on the table to add roughly 1,000 housing units.
Chattahoochee County Number of Household Units by Type 1980-2000
1980 1990 2000
Total Housing Units
3,192
3,108
3,316
Single Family Units
1,388
1,717
1,920
Multi-Family Units
1,518
901
738
Mobile Home/Trailer
286
450
658 All Other Units - 40 -
Source: U.S. Bureau of the Census, 1980, 1990, 2000. Chattahoochee County Occupancy Status 1980-2000
1980 1990 2000 Total Housing Units 3,192 3,108 3,316 Housing Units Vacant 180 224 384 Owner Occupied N/A 594 819 Renter Occupied N/A 2,290 2,113
Source: U.S. Bureau of the Census, 1980, 1990, 2000. Cusseta-Chattahoochee County Projected Number of Households and Household Size 2005-2030
2005 2010 2015 2020 2025 2030 Number of Households
2,932
4,256
4,389
4,481
4,503
4,563

7
Average Household Size 3.41 2.42 3.29 3.36 3.49 3.59
Source: Lower Chattahoochee RDC Staff, 2006
Issues • Availability of affordable and adequate housing. • Low percentage of owner occupied housing. • Increase of mobile home units in the last twenty (20) years. • Presence of dilapidated and abandoned structures; aesthetically challenged real estate. • Balancing housing cost with housing quality.
Opportunities • Construction of additional affordable and adequate housing. • Diversify housing mix from predominantly single family site built and manufacture housing
units to quality multi-family and single family attached (town house, condominiums). • Create housing communities in comparisons to housing developments, retrofit existing housing
areas. • Increase home ownership opportunities.
Natural and Cultural Resources As a result of the expected population growth, development pressures will increase over the next seven (7) years. The Cusseta-Chattahoochee County should expand appropriate infrastructures to meet development needs and minimize the affects on sensitive areas. The County should develop educational programs to promote conservation and protection of important resources for all segments of society. The County should strengthen and improve existing regulations regarding development in sensitive areas.
Issues Management planning for significant community resources is needed. There is no on-going and active education about resource conservation and protection for the
public, local elected officials, developers, economic developers, etc. Make development entities aware of community resources. Make sure the public has adequate access to community resources. Historic resource conditions are endangered and/or declining. Development is diminishing environmental quality and historic integrity of cultural
significance resources. New development is occurring in inappropriate areas: environmentally sensitive areas and
historic neighborhoods. The community has abandoned and potentially contaminated properties. There are pollution problems (light, noise, water, air, etc.). There are erosion, sedimentation, storm water runoff problems.
Opportunities Chattahoochee County should develop more means of protecting significant resources. Actively educate the public, local elected officials, developers, economic developers, about
resource conservation and protection.
8
Improve, enhance, and promote Chattahoochee County’s natural and cultural resources. Develop abandoned rail line as connector between residential areas and public uses. Guide new development away from important resources to conserve resources and minimize
waste. Strengthen and enforce resource protection regulations. Set aside environmentally sensitive areas of the community, such as stream banks, floodplains,
or steep hillsides from development. Encourage or require best management practices as part of the development process. Adopt appropriate site design guidelines for developing on sensitive areas (e.g. steep slopes,
wetlands). Link local trail systems with state designated bike routes and existing trails in neighboring
communities. Develop programs that encourage infill development or brownfield/greyfield redevelopment.
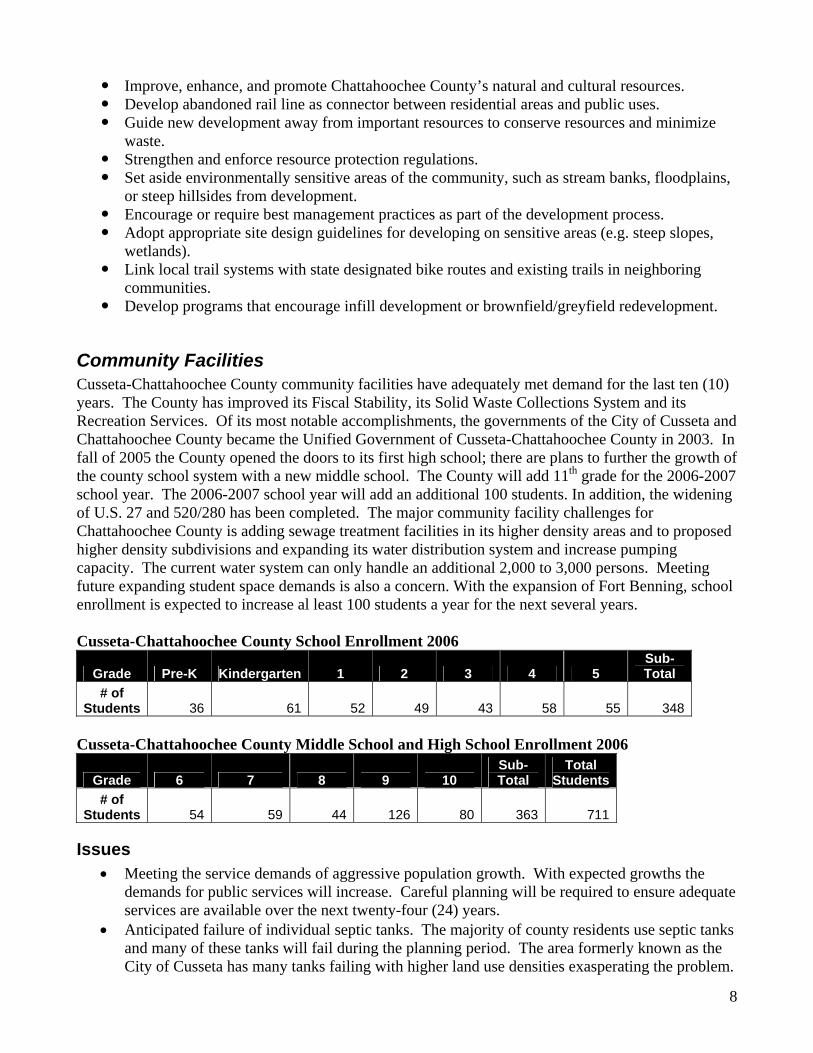
Community Facilities Cusseta-Chattahoochee County community facilities have adequately met demand for the last ten (10) years. The County has improved its Fiscal Stability, its Solid Waste Collections System and its Recreation Services. Of its most notable accomplishments, the governments of the City of Cusseta and Chattahoochee County became the Unified Government of Cusseta-Chattahoochee County in 2003. In fall of 2005 the County opened the doors to its first high school; there are plans to further the growth of the county school system with a new middle school. The County will add 11th grade for the 2006-2007 school year. The 2006-2007 school year will add an additional 100 students. In addition, the widening of U.S. 27 and 520/280 has been completed. The major community facility challenges for Chattahoochee County is adding sewage treatment facilities in its higher density areas and to proposed higher density subdivisions and expanding its water distribution system and increase pumping capacity. The current water system can only handle an additional 2,000 to 3,000 persons. Meeting future expanding student space demands is also a concern. With the expansion of Fort Benning, school enrollment is expected to increase al least 100 students a year for the next several years.
Cusseta-Chattahoochee County School Enrollment 2006
Grade Pre-K Kindergarten 1 2 3 4 5 Sub-Total
# of Students 36 61 52 49 43 58 55 348
Cusseta-Chattahoochee County Middle School and High School Enrollment 2006
Grade 6 7 8 9 10 Sub- Total
Total Students
# of Students 54 59 44 126 80 363 711
Issues • Meeting the service demands of aggressive population growth. With expected growths the
demands for public services will increase. Careful planning will be required to ensure adequate services are available over the next twenty-four (24) years.
• Anticipated failure of individual septic tanks. The majority of county residents use septic tanks and many of these tanks will fail during the planning period. The area formerly known as the City of Cusseta has many tanks failing with higher land use densities exasperating the problem.

9
• Stormwater Management • The Cusseta-Chattahoochee County water system is only adequate to meet current demands
with a growth in population of 2,000 to 3,000 people. Any growth beyond 3,000 people will need more wells or a surface treatment system.
• Septic and land application systems are consumptive uses of water. Future growth. With future growth there is the possibility of diminishing the supply of regional water. As a result, the development of sewer systems with surface water discharges, instead of, continued use of septic systems or land application systems maybe required.
• County buildings are operating at capacity and are in need of expansion. • Need for cemetery space. • Lack of local public facilities and services including Medical and Ambulance Services, after
school programs and activities for older children, and critical utility infrastructure. • Lack of knowledge of community programs, cooperation between local leaders, and small
number of local volunteers.
Opportunities • The county has plans to build a sewer system • The county should adopt a stormwater management ordinance. • Water lines are currently in place in 95% of the county. Growth means adding customers to the
existing system which should increase water revenues. • Growth provides an opportunity to look at various fees, (Impact fees, Subdivision Review fees
or Service Tax Districts) to compensate for new growth. • Assess available public space and determine what needs expansion, renovation or closure. • Adequate highway system. • Develop abandoned rail line as connector between residential areas and public uses. • Existing community facilities, both public and private including Recreation Center, Recycling
Center, Golf Course, Animal Shelter, and Library; the development of public and private facilities such as a proposed Health Center and dance studios.
Intergovernmental Chattahoochee County and Cusseta consolidated in 2003 thus eliminating any intergovernmental issues or opportunities within the county. However, issues and opportunities do exist between neighboring jurisdictions such as Muscogee, Marion, Talbot and Stewart Counties. In order to reduce issues and make the most of the potential opportunities the County should maintain open communication and dialogue with its neighboring jurisdictions throughout the planning process. Furthermore, Cusseta-Chattahoochee County should strongly consider the implementation and impact and of Regional Transportation Planning. The County should ensure that proper coordination and execution of much needed transportation improvements. County officials must be actively involved in transportation planning activities with the Columbus MPO and the Georgia Department of Transportation. Lastly the Service Delivery Strategy should be updated regularly. The SDS update will be done in conjunction with the update of the Comprehensive Plan.
Issues • Working relationship with the city of Columbus is strained. • Important to keep line of communication open with Fort Benning.

10
• Coordinate closely with neighboring counties and cities in meeting the state and federal stormwater management requirements.
• Actively participate in regional transportation planning efforts.
Opportunities • With projected growth for area counties and cities an opportunity exists for communities to
develop stronger working relationships and to share resources when necessary. • The Service Delivery Strategy will need to be updated as party of the Comprehensive Plan
process.
Transportation Cusseta-Chattahoochee County can easily be considered the gateway to Southwest Georgia as U.S. 27 and SR 520/280 offers travelers accessibility to Americus, Plains and Albany Georgia. Of its most notable accomplishments the County has completed its expansion of U.S. 27 and 520/280 and has adopted Road Standards. Challenges a head include widening SR 26, paving existing dirt roads, considering Metra Services to Chattahoochee County and considering the development of a By-Pass Route from U.S. 27 to SR 26.
Issues • Increasing development off of dirt roads. Who pays for paving costs? • Maintaining existing paved county roads and dirt roads • Controlling development off US 27, SR 520/280, and State Route 26 • Widening SR 26 • Potential By-Pass Route
Opportunities
• Metra Service to Cusseta-Chattahoochee County • Interstate 14
Land Use Land area is limited in Cusseta-Chattahoochee County due to the fact that Fort Benning owns over half of the County. Because of this fact Chattahoochee County official need to become good land managers. Maximizing land development opportunities while protecting natural resources. Key challenges to Chattahoochee County officials include protecting natural resources while encouraging development and establishing commercial and industrial uses as a large percentage of the land use mix. Agricultural use, mostly associated with timber production dominates the county’s existing land use. Second to agricultural use is the residential use of land in the county. While single-family detached housing is the predominant residential use, manufactured housing is the second most frequently used residential type. Commercial uses which are predominantly located in the Town Center and along State Routes along with industrial uses which are scattered in and around Cusseta make up less than one percent of total land use.
Issues • Excessive number of dilapidated structures both site built and mobile homes

11
• Determine if any brownfields exists; connect developers to the federal and state incentives for cleaning up brownfields sites.
• Aid to struggling areas while creating opportunities for reinvestment and redevelopment in deteriorating areas.
• Encroachment of non-compatible land use on Fort Benning • Land use mix is heavily favored towards agricultural use and residential use need to diversify
land use base. • Availability of Taxable land
Opportunities • Reserve land for industrial and commercial growth. Include adequate space for the growth of
employment-related uses, within the Future Land Use Plan/ Development Maps. • Work with developer to preserve open space around the county • Encourage traditional neighborhood development. Traditional neighborhoods should be
required when developing adjacent to or within a historic district • Protect natural resources within developments. Promote the use of the conservation
subdivision ordinance. Adopt a stream buffer ordinance and create an incentive to create greenway connections.
• Blank Canvas, can create a very desirable development pattern. • Develop abandoned rail line as connector between residential areas and public uses.
12
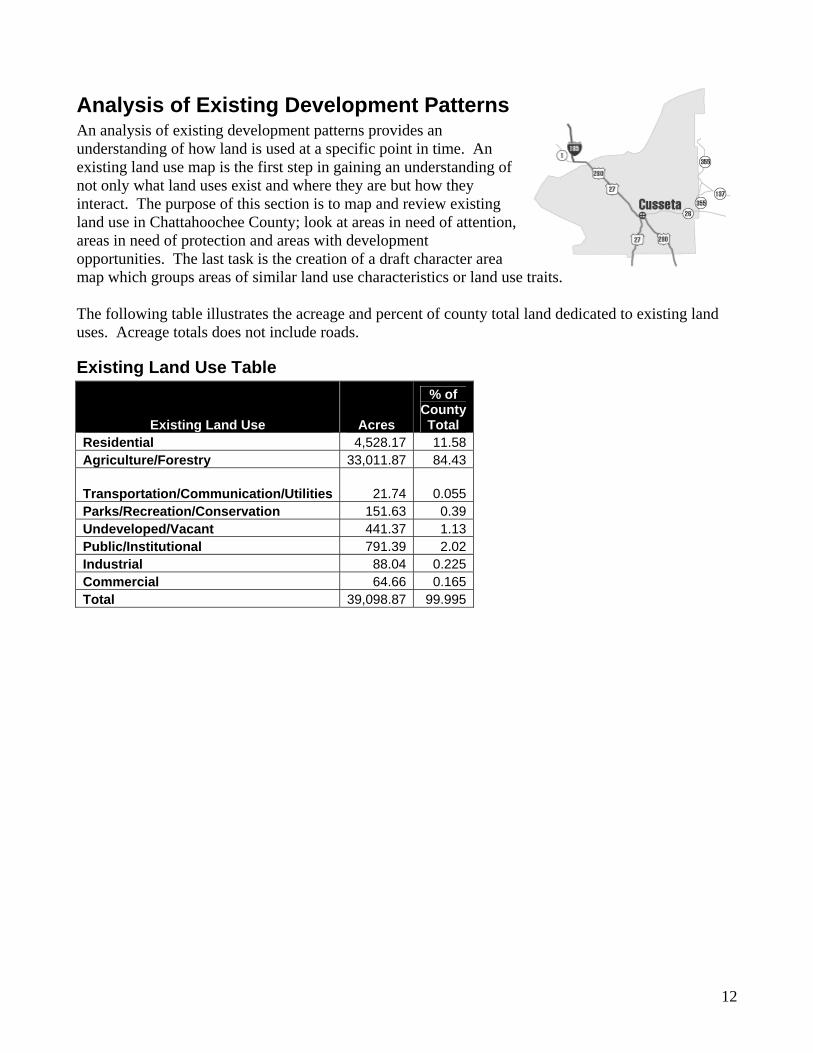
Analysis of Existing Development Patterns An analysis of existing development patterns provides an understanding of how land is used at a specific point in time. An existing land use map is the first step in gaining an understanding of not only what land uses exist and where they are but how they interact. The purpose of this section is to map and review existing land use in Chattahoochee County; look at areas in need of attention, areas in need of protection and areas with development opportunities. The last task is the creation of a draft character area map which groups areas of similar land use characteristics or land use traits. The following table illustrates the acreage and percent of county total land dedicated to existing land uses. Acreage totals does not include roads.
Existing Land Use Table
Existing Land Use Acres
% of County Total
Residential 4,528.17 11.58Agriculture/Forestry 33,011.87 84.43
Transportation/Communication/Utilities 21.74 0.055Parks/Recreation/Conservation 151.63 0.39Undeveloped/Vacant 441.37 1.13Public/Institutional 791.39 2.02Industrial 88.04 0.225Commercial 64.66 0.165Total 39,098.87 99.995

13
The following table presents the definitions of each of the land use categories.

14
Existing Land Use Definitions Table Existing Land Use Definition
Residential
Single-family residential uses, multi-family residential uses (apartments and duplexes), and manufactured and mobile home units (all normally located on no less than a one-quarter of an acre lots)
Agriculture/Forestry
Land used for agricultural purposes such as farming and/or livestock production and timber production
Commercial
Commercial uses including office use; retail, restaurants, convenience store, car dealerships, etc.
Industrial
Land dedicated to industrial uses(includes both light and heavy industrial uses)
Parks/Recreation/Conservation
State, Federal and local parks, active and passive recreation activities, and protected land; includes land preserved in land trust
Public/Institutional
Community facilities excluding utilities, government (schools, public safety facilities, courthouse, jail, health facilities, churches, and libraries)
Transportation/Communication/ Utilities
Land used transportation, communication or utility facilities (cell towers, power stations, water tower, and water treatment facilities)
Road Right-of-Way Land dedicated to road use including right of way
Undeveloped/Vacant
Land where no apparent active uses exist; property with dilapidated or abandoned structures or overgrown vacant lots
Areas Requiring Special Attention There is one primary area of land in Chattahoochee County that requires special attention; that is the land adjacent to the Fort Benning Military Installation. One of the biggest threats to Military Bases in the United States is encroachment by non-compatible land uses. Non–compatible land uses tend to be of a residential nature, although not all commercial or industrial uses are automatically base compatible. The area of land for which base compatibility is an issue is land located within 3,000 feet of the base boundaries. This generally consist of the area located north and south of River Bend Road, west of the 520\280–US 27 corridor down to River Bend Road and north of the 520/280 and SR 26 intersection east to the County line. Issues of concern include the impact of smoke and noise from Fort Benning on neighboring properties and the impact of light from surrounding development on Fort Benning operations.

15
Another area of concern is the rail line that runs through Downtown Cusseta-Chattahoochee County. There is a great opportunity to turn the abandoned line into a bike trail. The railroad line represents a great opportunity to connect residential areas to public uses, to include the County Administration Building/Court House, the new middle/high school and commercial areas located in the Town Center of Cusseta and commercial uses at the intersection of US 26 and 520/280. Broad Street also needs special attention. Retrofitting Broad Street for better pedestrian access and improving its appearance by incorporating it as a streetscape project along with a bike pedestrian project would be a great start to invigorating the Town Center of Chattahoochee County. The major corridors through Chattahoochee County are also areas of special concern. State routes 520/280, and SR 26 as well as U.S. Highway 27 are Chattahoochee County’s major transportation corridors. Opportunities exist for infill development, new development, retrofitting existing developments and encouraging better development types along the areas of those corridors that are currently undeveloped.
Areas Where Development is Likely to Occur Growth areas in Chattahoochee County include the intersections of 520/280 and SR26. The intersections of US 27 and 520/280 and the corridors themselves-US 27 down to River Bend Road, SR 520/280 down to Fire Tower Road and along the SR 26 corridor to Indian Hills Subdivision. Development opportunities exist along the roads that run just outside the old City limits of Cusseta such as Gordy Mill Pond Road, Old SR 137, and River Bend Road. Development pressures will also occur between the Fort Benning boundary and U.S. 27, 520/280, SR 26, and River Bend Road.
Significant Natural Resources The natural environment places certain opportunities and constraints on the way land is used. Soil conditions, slopes, flood frequency and wetlands all affect where development can safely and feasibly occur. In Chattahoochee County, areas adjacent to and affecting the Chattahoochee River should be reviewed for compliance with state and local ordinances and regulations.
Significant Cultural Resources A county-wide historic resources survey was completed in August, 2004. The survey identified 150 historic resources in the county. Of that 150, 19 were determined to be eligible for inclusion on the National Register of Historic Places. The survey identified three areas that based on unique character, local and regional significance, integrity and relationship to other important historic resources would be eligible historic districts: Cusseta Historic District, Antebellum Houses of Early Settlers, and Rosenwald Schools.
Areas with Significant In-fill Development Opportunities In-fill opportunities exist in and around the old city limits of Cusseta. The larger tracts are located off U.S. 27 and highway 520/280. Many vacant lots can also be found off of Old Louvale Road and Massey Road. Smaller tracts are also available north of the railroad tracks and south of SR 26, as well

16
as around King Street and Walsh Street. Large developable lots exist between Gordy Mill Pond Road and Broad Street. Overall, in-fill opportunities are good. Aforementioned areas have public water and public sewer is possible in the future. However, some of the existing vacant lots should be kept for park and open space.
Brownfields In general terms brownfields are abandoned or underused industrial or commercial properties where redevelopment is complicated by actual or perceived environmental contamination. There is no requirement on size, location, age or past use for brownfields. Some examples of brownfields include abandoned gas stations and unused former manufacturing plant. Some issues involving brownfields are the potential to cause harm to the population and the environment, reduction in employment opportunities and tax revenue, increase illegal dumping and graphite, reduction in the property value for the surrounding area. Redeveloping brownfields can restore property to productive use, increase property values, improve public health and the environment, and utilize existing public infrastructure and increasing job opportunities and local tax revenues. Potential brownfields in Cusseta-Chattahoochee County consist of a few old unused gas stations located mostly in the area formerly known as the City of Cusseta and a few junk yards located throughout the county.
Areas of Disinvestment, Needing Redevelopment, or Improvements to Aesthetics or Attractiveness All communities have areas of disinvestment or areas in need of improvement; Cusseta-Chattahoochee County is no different. As the county grows market forces will take care of (improve) most of the areas in need of improvement. However in some cases a public/private partnership will be needed to make improvements happen. Areas of concern include Broad Street from 520/280 to the Court House area. The rail line extending through Cusseta, and some of the residential neighborhoods located on either side of the rail line appear to be in need of improvements. Older residential areas in and around Cusseta have many vacant structures in need of demolishing or repair. One specific area of concern is the land located between highway 520-280 and Oakdale Street which has several abandoned mobile home units.
Recommended Character Areas Establishing character areas serve to recognize the land use trails of differences that exist in the urban and rural landscape of Cusseta-Chattahoochee County. Character areas define future development activities by recognizing what are good land development characteristics that need to be preserved and what are bad land development practices that need to be changed. Desired land use results are determined by establishing goals, objectives, policies and implementation strategies and tools for each defined community character area.

17
Character Area Table
Character Area Description/Predominant
Characteristics Development Plan
Parks/Recreation/Conservation
State, federal and local parks, active and passive recreation activity areas also includes protected open space (wetlands, floodplains, stream corridors, and natural buffers)
Limiting new development, promoting use of conservation easements, promote areas as passive-use tourism and recreation destinations, widening roadways should only be done when absolutely necessary and carefully designed
Agriculture/Forestry
Lands in open or cultivated state or sparsely settled, including woodlands and farm lands
Limiting new development, protecting farmland and open space (maintaining appropriate lot size), promoting use of conservation easements by land owners, limit the development of residential subdivisions, require compatible architecture designs that maintain the rural character, widening roadways should only be done when absolutely necessary and carefully designed. Any residential development should be done as rural cluster or conservation subdivision
Rural Residential Area
Rural, undeveloped land likely to face development pressures for lower density residential development, low pedestrian orientation and access, typically large lot, open space, and pastoral views
Permitting rural cluster or conservation subdivision design that incorporate significant amounts of open space, require compatible architecture designs that maintain the rural character
Residential
Predominantly residential with scattered civic buildings and varied street patterns, often curvilinear, low pedestrian orientation, little to no transit, high open space, moderate degree of building separation
Promote moderate density, traditional neighborhood development style residential subdivisions, mixed uses, blending residential development with schools, parks, recreation, retail businesses and services linked in a compact pattern that encourages walking and minimizes the need for auto trips within the subdivision, add traffic calming improvements, sidewalks, and improve street connections. Permit well-designed housing units to increase neighborhood density and income diversity.

18
Character Area Table (Continued)
Character Area Description/Predominant
Characteristics Development Plan
Town Center
Focal point for several neighborhoods with a concentration of activities (general retail, professional office, high-density housing, and appropriate public and open space uses easily accessible by pedestrians
Area which is very pedestrian oriented, walk able connections between different uses, enhance the pedestrian-friendly environment, by adding sidewalks and creating trail/bake routes linking to neighboring communities and major destinations, such as libraries, neighborhood center, health facilities, commercial clusters, parks, schools, etc. Including a relatively high-density mix or retail, offices, services and employment to serve a regional market area. Residential development should reinforce the town center by locating high density housing options adjacent to the center. Residential developments should be mixed income including multi-family town homes, apartments, duplexes and condominiums
Corridors (In-town, Gateway, Scenic, Major Highway)
Developed or undeveloped land on both sides of designated high-volume transportation facility, should include orientation of buildings to highway; high transit, including stops and shelters; on-site parking and large set-backs for buildings
All types of corridors should include driveway consolidation and landscape raised medians, bicycle accommodations, traffic calming, and a buffer for pedestrians
In-town Corridor
Developed or undeveloped land paralleling the route of a street or highway in town that is already or likely to experience uncontrolled strip development if growth is not properly managed
Encourage attractive boulevards with signage guiding visitors to downtown and scenic areas around the community, enhance corridor appearance through streetscaping (street lights, landscaping), enact design guidelines for new development to include minimal building setback requirements from the street, employ traffic calming measures among major roadways to reduce the impact of automobiles, provide basic access for pedestrians and bicycles
Scenic Corridor
Developed or undeveloped land paralleling the route of a street or highway in town that has significant natural, historic, or cultural features, and scenic or pastoral views
Establish guidelines to protect scenic values and addresses landscaping and architectural design, manage flow of traffic, provide pedestrian linkages to adjacent and nearby residential or commercial districts
Major Highway Corridor
Developer or undeveloped land on both sides of the designated high-volume transportation facility such as highways
Maintain a natural vegetation buffer along the corridor, ensure all new developments are setback behind the buffer with access roads, encourage landscaping, raised medians for automobile and pedestrian safety. Provide paved shoulders for bicycles or emergency breakdown lanes, manage access to keep traffic flowing.
Other/Special
Includes districts or areas that presently does not fit or is not envisioned fitting into any of the above categories. May also include also areas with single characteristics such as a hospital or others that are not likely to be replicated elsewhere within the community To be determined locally

19

COMPREHENSIVE PLAN
FOR THE
UNIFIED GOVERNMENT OF
CUSSETA-CHATTAHOOCHEE
COUNTY
COMMUNITY ASSESSMENT DATA
APPENDIX
2007-2030
Prepared by
THE LOWER CHATTAHOOCHEE
REGIONAL DEVELOPMENT CENTER

2
Cusseta-Chattahoochee County Comprehensive Plan 2007-2030
Community Assessment Data Appendix
Table of Contents
Introduction ...................................................................................................................................................5 Background ...................................................................................................................................................5 Geographical Location ..................................................................................................................................5 Brief History...................................................................................................................................................5 Historic Chattahoochee County ....................................................................................................................6 1.0 Population ........................................................................................................................................8 Total Population ............................................................................................................................................8 Inventory of Existing Conditions....................................................................................................................8 Growth Patterns ............................................................................................................................................9 Population by Gender .................................................................................................................................10 Population by Age .......................................................................................................................................11 Population by Race .....................................................................................................................................12 Income…….. ...............................................................................................................................................13 Educational Attainment ...............................................................................................................................14 2.0 Economic Development .................................................................................................................18 Regional Setting..........................................................................................................................................19 Industry Mix.................................................................................................................................................19 Labor Work-Force .......................................................................................................................................20 Resources ...................................................................................................................................................26 Major Development .....................................................................................................................................27 Tourism .......................................................................................................................................................27 Unique Economic Activities.........................................................................................................................28 3.0 Housing ..........................................................................................................................................29 Housing Types and Inventory .....................................................................................................................29 Housing Occupancy Characteristics ...........................................................................................................30 Housing Cost...............................................................................................................................................33 Jobs – Housing Balance .............................................................................................................................34 Cost Burdened Housing ..............................................................................................................................34 Housing Conditions .....................................................................................................................................35 Projected Housing Needs ...........................................................................................................................39 Special Housing Needs...............................................................................................................................40 4.0 Natural and Cultural Resources.....................................................................................................41 Public Water Supply Sources......................................................................................................................41 Water Supply Watershed ............................................................................................................................41 Underground Water Recharge Area ...........................................................................................................42 Wetlands .....................................................................................................................................................43

3
Protected Mountains ...................................................................................................................................44 Protected Rivers..........................................................................................................................................44 Coastal Resources......................................................................................................................................44 Flood Plains ................................................................................................................................................45 Soil Types....................................................................................................................................................46 Steep Slopes...............................................................................................................................................47 Prime Agricultural and Forest Land ............................................................................................................48 Plant and Animal Habitats...........................................................................................................................49
Endangered or Threatened Animal Species........................................................................................49 Endangered or Threatened Plant Species...........................................................................................49
Major Park, Recreation and Conservation Areas .......................................................................................51 Scenic Views and Sites...............................................................................................................................51 Cultural and Historic Resources .................................................................................................................52 Soil Suitability..............................................................................................................................................53 5.0 Community Facilities ......................................................................................................................54 Water Supply and Treatment ......................................................................................................................54
Assessment .........................................................................................................................................54 Sewage System ..........................................................................................................................................54
Assessment .........................................................................................................................................55 Solid Waste .................................................................................................................................................55
Assessment .........................................................................................................................................55 Public Safety ...............................................................................................................................................55
Assessment .........................................................................................................................................55 Fire Protection.............................................................................................................................................56
Assessment .........................................................................................................................................56 Health Services ...........................................................................................................................................56
Assessment .........................................................................................................................................56 Recreation...................................................................................................................................................56
Assessment .........................................................................................................................................57 General Government...................................................................................................................................57
Assessment .........................................................................................................................................58 Educational Facilities ..................................................................................................................................58 Utilities……. ................................................................................................................................................58 6.0 Transportation ................................................................................................................................60 Road Network .............................................................................................................................................60 Alternative modes .......................................................................................................................................60 Parking. .......................................................................................................................................................60 Railroads/ other Facilities............................................................................................................................61 Transportation and Land Use Connection ..................................................................................................61
Assessment .........................................................................................................................................61 7.0 Intergovernmental Coordination.....................................................................................................63 State Requirements ....................................................................................................................................63 Intergovernmental Relationships ................................................................................................................63 8.0 Consistency with Quality Community Objective ............................................................................65

4

5
Introduction Cusseta-Chattahoochee County began the planning process for its Comprehensive Plan by working with Planning Commission members, Cusseta-Chattahoochee County Staff, and the Chairman of the Unified Government of Cusseta-Chattahoochee County Board of Commissioner. Basic plan data and input was gathered and a public participation plan was crafted. All citizens of Cusseta-Chattahoochee County were given the opportunity to express their concerns and desires for the county regarding growth and development. A series of public hearings as well as vision and design meetings were advertised for and conducted to solicit and welcome comments on needs and wants in the community. All responses provided a valuable resource in forming the goals and objectives of this Plan.
The Comprehensive Plan presents the Statement of Purpose for the Unified Government of Cusseta-Chattahoochee County. The local government is responsible for the adoption and implementation of its purpose. This Plan is meant to be kept current. Changes in the conditions surrounding the community and new sentiments of citizens will be considered for incorporation into the Plan and future Plans as they arise and/or are formed. Furthermore, the maps illustrated in this Plan are intended as a guide for the county’s future development.
Background
Geographical Location Chattahoochee County is located immediately east of the Chattahoochee River in the Upper Coastal Plain. Laying in the Sand Hill Province, Chattahoochee County is commonly referred to as the fall line which separates the Piedmont Plateau and the Coastal Plain. The county’s borders include Muscogee County to the north, Marion County to the east, the Chattahoochee River to the west, and Stewart County to the south. The City of Cusseta is centrally located in the county; it is lies on the fringes of the Fort Benning Military Reservation.
Brief History Chattahoochee County was established on February 13, 1854 by combining parts of Marion and Muscogee Counties. It was named for the Chattahoochee River that forms the county’s western boundary. Chattahoochee County has a total area of 248.8 square miles. Prior to 2003, the

6
county consisted of one incorporated city, Cusseta, which was incorporate on December 22, 1855 and was the county seat. The City of Cusseta was named for one of the primary tribes of the Lower Creek Indians. Cusseta, originally known as Kasihta “the Peace Town of the Lower Creeks” was one of the two principal Muskogee towns in the Creek Confederation of the Indians. According to the census Kasihta had 1,918 residents in 1832-1833. In 2003, Cusseta-Chattahoochee County became one of three unified government operations in the state of Georgia. The Government changed from a Board of Council members, Mayor and
County manager to a board of five Commissioners, one Unified Government manager and other elected officials to include the County Sheriff, Tax Commissioner, and the Clerk of the Court. The county’s government has journeyed a long way since its first county officers were commissioned on March 11, 1854. The first government officials included a sheriff, superior court clerk, interior court clerk, ordinary, tax receiver, tax collector, surveyor, and coroner.
On July 22, 2005 Cusseta-Chattahoochee County proudly hosted the Grand Opening and Ribbon Cutting Ceremony of The Chattahoochee County High School. Many State and local leaders were invited to tour the new facility and learn about the programs that the school will offer. According to Georgia State Senator, Ed Harbison, "It's just another piece of the wheel that's grinding towards progress in expansion in this particular area". The addition of the new high school is one more step in the right direction for helping educate the community and further progress and development for the rural county. The county is home to the Fort Benning Military Reservation. Founded during War World I, Fort Benning covers an estimated eighty percent (80%) of the county’s 248.8 square miles. Fort Benning was named for General Henry Lewis Benning; a Confederate general and native of Columbus, Georgia. Fort Benning is the world’s largest infantry base and its’ county’s largest employer.
Historic Chattahoochee County The Chattahoochee County courthouse was constructed in 1854 out of select heart lumber from the Long Leaf Pine by slave labor. Listed on the National Register of Historic Places it is currently displayed at Westville in Lumpkin, Georgia. (Pictured to the right) The Historic Chattahoochee County Jail was constructed in 1902 by the Pauly Jail and Manufacturing Company of St. Louis, Missouri for $5,000. It was built to replace the wooden jail that had been in use since 1855. The jail consisted of a two story brick structure with a metal roof. Inside, the jail cells were built of pre-fabricated iron. The jail was purchased by the county government in 1854. Today the jail still stands in its

7
original location on Mt. Olive and Boyd Street in Cusseta, Georgia. Original hardware including a large plate lock on the outside door and the second floor’s jail cells remain in place. (Pictured to the right) This jail served the county until 1975. In 1986 the jail was placed on the National Register of Historic Places. The Chattahoochee County Historic Preservation Society, Inc. continues in its efforts to restore the jail and plans to open it as a museum. Also found in Chattahoochee County and listed on the National Register of Historic Places is the National Infantry Museum constructed in 1928 as a military hospital. Today the museum displays a collection of weapons, uniforms and artifacts illustrating the role of the infantry in our nation’s wars. The museum also consists of a 100-seat auditorium where a variety of films are shown daily. Two plants on the Georgia Protected Plant List can be found in Chattahoochee County, they are, Croomia Pauciflora and Rhododendron Prunifolium. Croomia Pauciflora was first found in Georgia by Hugh Neisler 1854, on an island in the Chattahoochee River near
Columbus. It is presently found in six counties throughout the state of Georgia. (Pictured to the left) Rhododendron Prunifolium is the rarest of our Eastern native deciduous azaleas and is being considered for the Endangered Species List by the federal government. It is only found in a handful of counties along the Georgia-Alabama border in the Chattahoochee River Valley, where it can be found in ravines and on steep stream banks that often are densely wooded with mixed hardwoods and pines. (Pictured to the right)
“We are a community where you can live in the country, and yet close enough to enjoy city life as well. It is a place where southern hospitality abounds and a person’s handshake is as good as their word.” (http://www.ugoccc.us/about.asp)

8
1.0 Population
Total Population A comprehensive understanding of a community’s past, present and future population characteristics and trends provides a basic and essential foundation for the planning process. The population element offers an overview of the socio-economic composition of Cusseta-Chattahoochee County while supplying a basis of the formulation of additional elements of their Comprehensive Plan. This population analysis includes data relating to age, sex, race, household size, education, and income.
Inventory of Existing Conditions Chattahoochee County’s population figures are misleading; an estimated ninety percent (90%) of the county’s population base is located on the Fort Benning Military Reservation. This fact causes significant fluctuations in the county’s population. During the 1980-1990 decade, Chattahoochee County lost 22.1% of its population; the city of Cusseta lost 9.1% of its population. The Fort Benning Division experienced a reduction of 26% of its population while the State of Georgia’s population grew by 18.06% in the same decade. During the 1990-2000 decade, the City of Cusseta regained a percentage of the population it had lost in the previous decade with a growth of 8%. During that same decade the Fort Benning Division lost 15.7% of its population. This continued decrease in population could be a result of the country’s role during the Gulf War in Saudi Arabia or the Middle East. According to the Department of Veterans Affairs, as of March 1, 2001, over 696,000 American Military Troops served in the Gulf War during the early 1990’s. Overall, during the twenty year period, Chattahoochee County experienced a decrease of 31.52%; the city of Cusseta, a marginal decrease of 1.81% in total population. Table 1.1 illustrates the population changes from 1980 to 2000 for the county and city. Calculations reflect population prior to County and City’s unification. Table 1.1: Total Population 1980-2000
1980 1990 2000 % Change
1980-1990 % Change 1990-2000
Chattahoochee County
21,732
16,934
14,882 -28.33 -13.79Rural Chattahoochee County 1,029 1,404 1,533 26.71 8.41City of Cusseta 1,218 1,107 1,196 -10.03 7.44
Fort Benning Division
19,485
14,423
12,153 -35.10 -18.68
State of Georgia
5,486,900
6,478,149
8,186,453 15.30 20.87Source: U.S. Bureau of the Census, 1980, 1990, 2000. Lower Chattahoochee RDC Staff, 2006.
9
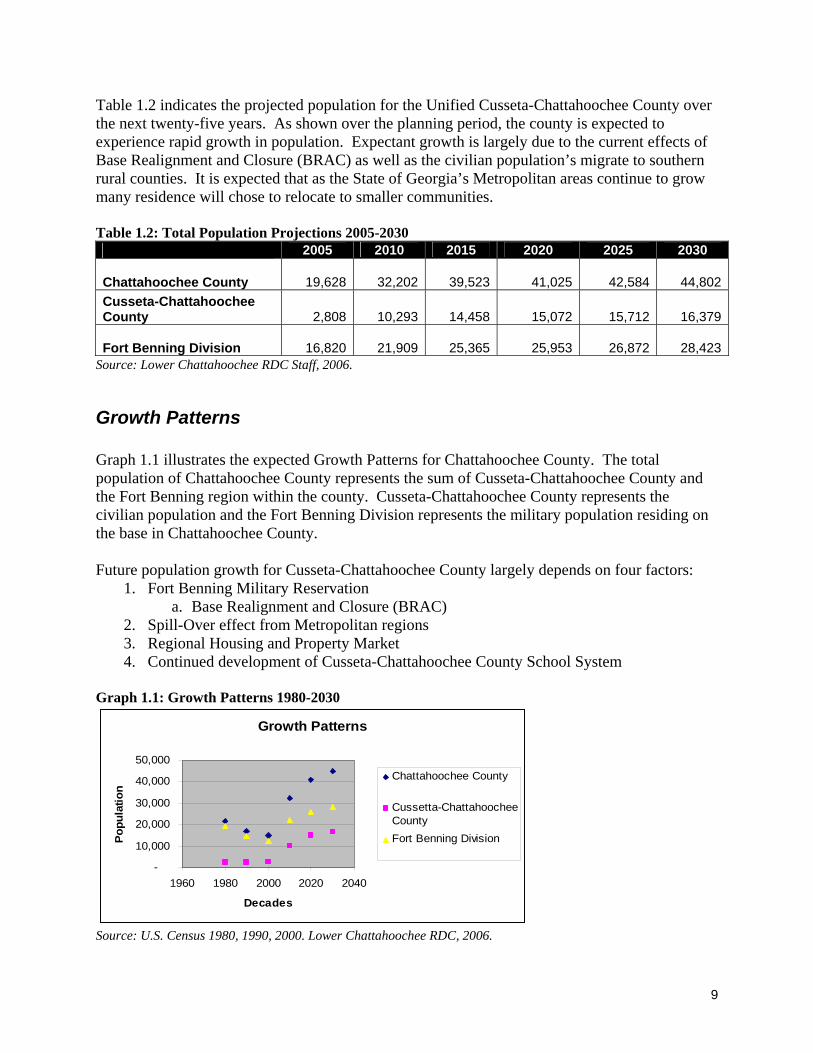
Table 1.2 indicates the projected population for the Unified Cusseta-Chattahoochee County over the next twenty-five years. As shown over the planning period, the county is expected to experience rapid growth in population. Expectant growth is largely due to the current effects of Base Realignment and Closure (BRAC) as well as the civilian population’s migrate to southern rural counties. It is expected that as the State of Georgia’s Metropolitan areas continue to grow many residence will chose to relocate to smaller communities. Table 1.2: Total Population Projections 2005-2030 2005 2010 2015 2020 2025 2030
Chattahoochee County
19,628
32,202
39,523
41,025
42,584
44,802 Cusseta-Chattahoochee County
2,808
10,293
14,458
15,072
15,712
16,379
Fort Benning Division
16,820
21,909
25,365
25,953
26,872
28,423 Source: Lower Chattahoochee RDC Staff, 2006.
Growth Patterns Graph 1.1 illustrates the expected Growth Patterns for Chattahoochee County. The total population of Chattahoochee County represents the sum of Cusseta-Chattahoochee County and the Fort Benning region within the county. Cusseta-Chattahoochee County represents the civilian population and the Fort Benning Division represents the military population residing on the base in Chattahoochee County. Future population growth for Cusseta-Chattahoochee County largely depends on four factors:
1. Fort Benning Military Reservation a. Base Realignment and Closure (BRAC)
2. Spill-Over effect from Metropolitan regions 3. Regional Housing and Property Market 4. Continued development of Cusseta-Chattahoochee County School System
Graph 1.1: Growth Patterns 1980-2030
Growth Patterns
-
10,000
20,000
30,000
40,000
50,000
1960 1980 2000 2020 2040
Decades
Popu
latio
n
Chattahoochee County
Cussetta-ChattahoocheeCountyFort Benning Division
Source: U.S. Census 1980, 1990, 2000. Lower Chattahoochee RDC, 2006.

10
Based on the factors listed above Cusseta-Chattahoochee County continues to expect and prepare for rapid growth over the next twenty five years. The County plans to build a new elementary school; having just opened its first high school in Fall 2005. Further more, the county has expansion plans for its housing market and Town Center area with several Planning Unit Development offers already being considered.
Population by Gender Tables 1.3 and 1.4 illustrate Chattahoochee County’s population based on gender. Chattahoochee County’s gender trends appear consistent. The male population is consistently 63 to 67 percent of the Total Population. That is on average 2.07 males per female. Table 1.3: Population by Gender 1980-2000
1980 1990 2000 % Change
1980-1990 % Change 1990-2000
Female Population
6,042
5,777
5,477 -4.59 -5.48
Male Population
15,690
11,157
9,405 -40.63 -18.63 Source: U.S. Bureau of the Census, 1980, 1990, 2000. Lower Chattahoochee RDC Staff, 2006. Graph 1.2 offers a visual illustration of the Chattahoochee County population by gender for fiscal year 2003. Graph 1.2: Population by Gender - 2003
Total Population 19,333
Males 13,302
69%
Females 6,031 31%
Source: The 2004 Georgia County Guide, The University of Georgia. Lower Chattahoochee RDC Staff, 2006. Table 1.4: Population by Gender Projections 2005-2030 2005 2010 2015 2020 2025 2030
Female Population
6,477
10,627
13,043
13,538
14,053
14,785
Male Population
13,151
21,575
26,480
27,487
28,531
30,017 Source: Lower Chattahoochee RDC, 2006.

11
Population by Age Tables 1.5 and 1.6 illustrate Chattahoochee County’s population based on age distribution. From 1980 to 2000, Chattahoochee County experienced a decrease in population among all age groups under age 35. The adult and senior citizen population grew from 6% to 33% over the same decades. The population age 65 and over had the most significant growth in past decades with 32.77% growth during the 1980-1990 decade. Similarly the population 55-64 years of age increased 33.03 % during the 1990-2000 decade. The population of senior citizens and retirees is expected to continue to rise as older adults chose to relocate to more rural communities. In the 1990’s the teenage (14-17) population decreased by over 64%. In 2005 Cusseta-Chattahoochee County opened the doors to its first and only high school allowing the county to better fulfill the academic needs of its teenage population. This age group is expected to be on the rise over the next twenty five years with an increase in population which will more than double in the first decade and then stabilize at a slower growth rate of 3%. Table 1.5: Age Distribution 1980-2000
1980 1990 2000 % Change
1980-1990 % Change 1990-2000
0 - 4 Years Old
1,586
1,362
1,245 -16.45 -9.39
5 - 13 Years Old
2,625
2,828
2,534 7.18 -11.60
14 - 17 Years Old
1,527
540
447 -182.77 -20.80
18 - 20 Years Old
4,746
2,351
1,791 -101.87 -31.27
21 - 24 Years Old
4,076
3,030
2,368 -34.52 -27.95
25 - 34 Years Old
4,794
3,980
3,528 -20.45 -12.81
35 - 44 Years Old
1,598
1,956
1,883 18.30 -3.88
45 - 54 Years Old
407
434
528 6.22 17.80
55 - 64 Years Old
193
218
290 11.47 24.83
65 and Over
177
235
268 24.68 12.31 Source: U.S. Bureau of the Census, 1980, 1990, 2000. Lower Chattahoochee RDC Staff, 2006. The age distribution projections shown in Table 1.6 illustrate a growth in all age brackets. However, being that 90% of the county’s population is derived from the Fort Benning Division it is highly likely that a high percentage of the population ages 18 through 44 are active duty military and/or military spouses. Similarly, a portion of the population ages 0 through 17 are likely to be military dependents. Therefore it is difficult to make an accurate assessment on this population, as changes in the population depend largely on the military which is not an exact factor.
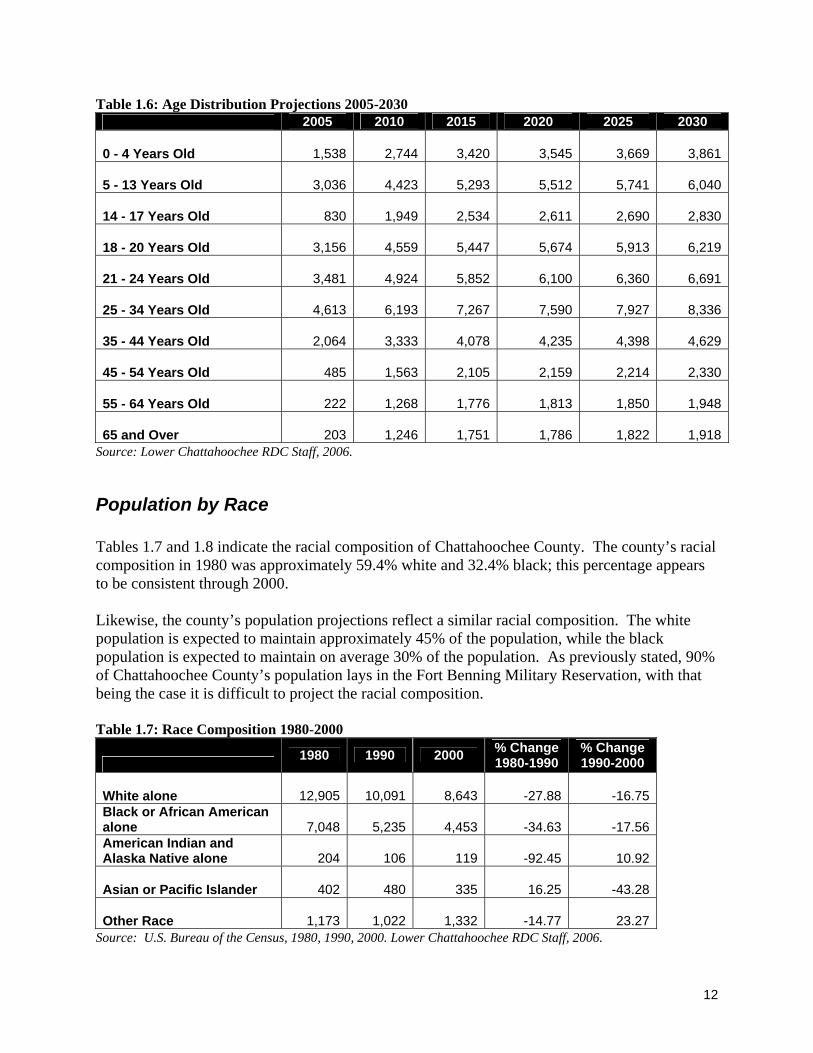
12
Table 1.6: Age Distribution Projections 2005-2030 2005 2010 2015 2020 2025 2030
0 - 4 Years Old
1,538
2,744
3,420
3,545
3,669
3,861
5 - 13 Years Old
3,036
4,423
5,293
5,512
5,741
6,040
14 - 17 Years Old
830
1,949
2,534
2,611
2,690
2,830
18 - 20 Years Old
3,156
4,559
5,447
5,674
5,913
6,219
21 - 24 Years Old
3,481
4,924
5,852
6,100
6,360
6,691
25 - 34 Years Old
4,613
6,193
7,267
7,590
7,927
8,336
35 - 44 Years Old
2,064
3,333
4,078
4,235
4,398
4,629
45 - 54 Years Old
485
1,563
2,105
2,159
2,214
2,330
55 - 64 Years Old
222
1,268
1,776
1,813
1,850
1,948
65 and Over
203
1,246
1,751
1,786
1,822
1,918 Source: Lower Chattahoochee RDC Staff, 2006.
Population by Race Tables 1.7 and 1.8 indicate the racial composition of Chattahoochee County. The county’s racial composition in 1980 was approximately 59.4% white and 32.4% black; this percentage appears to be consistent through 2000. Likewise, the county’s population projections reflect a similar racial composition. The white population is expected to maintain approximately 45% of the population, while the black population is expected to maintain on average 30% of the population. As previously stated, 90% of Chattahoochee County’s population lays in the Fort Benning Military Reservation, with that being the case it is difficult to project the racial composition. Table 1.7: Race Composition 1980-2000
1980 1990 2000 % Change
1980-1990 % Change 1990-2000
White alone
12,905
10,091
8,643 -27.88 -16.75 Black or African American alone
7,048
5,235
4,453 -34.63 -17.56
American Indian and Alaska Native alone
204
106
119 -92.45 10.92
Asian or Pacific Islander
402
480
335 16.25 -43.28
Other Race
1,173
1,022
1,332 -14.77 23.27 Source: U.S. Bureau of the Census, 1980, 1990, 2000. Lower Chattahoochee RDC Staff, 2006.

13
Table 1.8: Race Composition Projections 2005-2030 2005 2010 2015 2020 2025 2030
White alone
11,820
15,298
17,781
18,592
19,441
20,450 Black or African American alone
6,155
8,942
10,695
11,139
11,602
12,206
American Indian and Alaska Native alone
46
2,088
3,050
3,099
3,148
3,312
Asian or Pacific Islander
348
2,427
3,429
3,498
3,562
3,754
Other Race
1,259
3,447
4,568
4,697
4,831
5,080 Source: Lower Chattahoochee RDC Staff, 2006.
Income Table 1.9 illustrates the previous three decades per capita income for Chattahoochee County and the State of Georgia. The data shows that the per capita income has increased for the county but has remained significantly lower than that of the state. Table 1.9: Per Capita Income 1980-2000
1980 1990 2000 % Change 1980-1990
% Change 1990-2000
Chattahoochee County $4,818 $8,466 $8,617 43.09 1.75 State of Georgia $15,353 $20,715 $25,433 25.88 18.55
Source: U.S. Bureau of the Census, 1980, 1990, 2000. Lower Chattahoochee RDC Staff, 2006. Table 1.10 illustrates the projected Per Capita Income for Cusseta-Chattahoochee County. The data shows that the per capita income is expected to increase at a steady rate over the next twenty-five years. The increases in the per capita income as presented in Table 1.10 are significantly higher than those experienced by the county in the decades of 1980 through 2000. Table 1.10: Projected Per Capita Income 2005-2030 2005 2010 2015 2020 2025 2030 Cusseta-Chattahoochee County $17,036 $20,023 $23,010 $25,997 $28,984 $31,971
Source: Lower Chattahoochee RDC Staff, 2006. Table 1.11 shows the average household income for Chattahoochee County and the State of Georgia. The county’s household income has been on the raise and this trend is expected to continue over the next twenty-five (25) years. However the county’s average household income has remained significantly lower than the state’s.

14
Table 1.11: Average Household Income 1980-2000
1980 1990 2000 % Change 1980-1990
% Change 1990-2000
Chattahoochee County $15,259 $27,780 $43,735 45.07 36.48 State of Georgia N/A $36,810 $80,072 N/A 54.03
Source: U.S. Bureau of the Census, 1980, 1990, 2000. Lower Chattahoochee RDC Staff, 2006. As illustrated in Table 1.12 Chattahoochee County residents have moderate to middle income means with a majority (53.39%) of its income distribution falling in the ranges of $30,000 to $74,999 in 2000. In the same year 42.66% of the State of Georgia’s income distribution fell in the ranges of $30,000 to $74,999. Over 36% of Chattahoochee County’s income distribution falls in the lower income brackets ranging from $0 to $29,999. Similarly, 34.63% of the state’s income distribution falls in the ranges under $30,000. In 1997, 14.2% of the county’s population lived below the poverty level, compared to the state’s 14.7% and the national rate of 13.3%. In addition, 14.7% of the county’s population under age 18 lived below the poverty level. Nationally, 19.9% of the population under age 18 lived below the poverty level in 1997. Table 1.12: Household Income Distribution, 2000 compared to the State of Georgia
Chattahoochee County %
State of Georgia %
Less than $20,000 16.78 21.89$20,000 to $29,999 19.43 12.74$30,000 to $39,999 17.56 12.09$40,000 to $49,999 14.4 10.85$50,000 to $74,999 21.43 19.72$75,000 to $99,999 6.83 10.36$100,000 + 3.56 12.33
Source: U.S. Bureau of the Census, 1980, 1990, 2000. Lower Chattahoochee RDC Staff, 2006.
Educational Attainment Tables 1.13 and 1.14 indicate the education attainment for Chattahoochee County representing residents 25 years of age and over. In 1980 of 7,169 residents 25 years of age and older 521 possessed less than a ninth grade education. By 1990 the population of adults 25 years of age and older had decreased to 6,823 with 279 possessing less than a ninth grade education. Although the Chattahoochee County experienced an overall decrease in population over the decades of 1980, 1990 and 2000 there was a steady increase in the number of individuals, 25 years and older attaining some college but no degree as well as those attaining a Bachelor’s Degree.

15
Table 1.13: Education Attainment 1980-2000
1980 1990 2000 % Change 1980-1990
% Change 1990-2000
Less than 9th Grade
521
279
149 -86.74 -87.25 9th - 12th Grade (No Diploma)
775
514
555 -50.78 7.39
High School Graduate (Includes GED)
3,055
2,214
1,468 -37.98 -50.82
Some College (No Degree)
1,330
1,861
2,018 28.53 7.78
Associate Degree N/A
616
517 N/A -19.15
Bachelors' Degree
972
991
1,163 1.92 14.79 Graduate or Professional Degree
484
398
414 -21.61 3.86
Source: U.S. Bureau of the Census, 1980, 1990, 2000. Lower Chattahoochee RDC Staff, 2006. Table 1.14 illustrates Cusseta-Chattahoochee County’s projected education attainment levels for residents 25 years of age and older. As the population increases the number of individuals attaining a minimum of a high school diploma or General Education Diploma (GED) as well as those attaining some college and college degrees is expected to rise. This will reflect a lower percentage of the population possessing less than a ninth grade education. Table 1.14: Educational Attainment Projections 2005-2030
2005 2010 2015 2020 2025 2030
Less than 9th Grade
135
210
225
210
192
175 9th - 12th Grade (No Diploma)
681
1,229
1,515
1,597
1,591
1,693
High School Graduate (Includes GED)
2,437
4,365
5,479
5,643
5,952
6,267
Some College (No Degree)
1,990
3,569
4,466
4,632
4,805
5,042
Associate Degree
690
1,254
1,596
1,652
1,674
1,781
Bachelors' Degree
1,175
2,122
2,630
2,745
2,853
3,000 Graduate or Professional Degree
479
854
1,066
1,104
1,144
1,203
Source: Lower Chattahoochee RDC Staff, 2006. The following tables 1.15 through 1.17 provide comparable data on education attainment levels for Chattahoochee County, its surrounding counties and the State of Georgia for the adult population ages 25 and older.

16
Table 1.15: Educational Attainment for Chattahoochee County 1980-2000 Chattahoochee County
1980 1990 2000 Less than 9th Grade 7.26% 4.09% 2.29%9th - 12th Grade (No Diploma) 10.81% 7.53% 8.54%High School Graduate (Includes GED) 42.61% 32.45% 22.59%Some College (No Degree) 18.55% 27.27% 31.06%Associate Degree N/A 9.03% 7.96%Bachelors' Degree 13.56% 14.52% 17.90%Graduate or Professional Degree 6.75% 5.83% 6.37%
Source: U.S. Bureau of the Census, 1980, 1990, 2000. Lower Chattahoochee RDC Staff, 2006.
Table 1.16: Educational Attainment the State of Georgia 1980-2000 State of Georgia
1980 1990 2000 Less than 9th Grade 23.72% 12.00% 7.58%9th - 12th Grade (No Diploma) 19.92% 17.04% 13.85%High School Graduate (Includes GED) 28.52% 29.65% 28.65%Some College (No Degree) 13.35% 17.01% 20.41%Associate Degree N/A 4.96% 5.20%Bachelors' Degree 14.61% 12.92% 16.00%Graduate or Professional Degree N/A 6.41% 8.30%
Source: U.S. Bureau of the Census, 1980, 1990, 2000. Lower Chattahoochee RDC Staff, 2006.scogee Count Talbot County Harris County

17
Table 1.17: Educational Attainment for surrounding counties 1980-2000 Stewart County Talbot County
1980 1990 2000 1980 1990 2000 Less than 9th Grade 38.45% 26.83% 17.17%
Less than 9th Grade 37.61% 20.95% 12.97%
9th - 12th Grade (No Diploma) 25.67% 22.27% 19.36%
9th - 12th Grade (No Diploma) 22.12% 22.86% 22.28%
High School Graduate (Includes GED) 20.17% 32.44% 36.76%
High School Graduate (Includes GED) 25.94% 35.18% 40.27%
Some College (No Degree) 8.01% 9.40% 14.65%
Some College (No Degree) 6.39% 10.68% 13.35%
Associate Degree N/A 2.09% 2.04%
Associate Degree N/A 3.23% 3.25%
Bachelors' Degree 3.73% 5.04% 5.11%
Bachelors' Degree 7.99% 4.61% 4.59%
Graduate or Professional Degree 3.97% 3.03% 4.11%
Graduate or Professional Degree N/A 2.48% 3.29%
Muscogee County Harris County 1980 1990 2000 1980 1990 2000
Less than 9th Grade 21.39% 11.26% 7.00%
Less than 9th Grade 30.04% 15.32% 7.33%
9th - 12th Grade (No Diploma) 17.77% 17.21% 14.08%
9th - 12th Grade (No Diploma) 20.28% 19.70% 13.71%
High School Graduate (Includes GED) 32.61% 29.85% 28.17%
High School Graduate (Includes GED) 24.70% 32.07% 29.41%
Some College (No Degree) 15.41% 19.28% 24.04%
Some College (No Degree) 13.19% 15.12% 22.54%
Associate Degree N/A 5.78% 6.38%
Associate Degree N/A 4.19% 5.86%
Bachelors' Degree 12.90% 10.47% 12.35%
Bachelors' Degree 11.83% 8.65% 13.84%
Graduate or Professional Degree N/A 6.14% 7.97%
Graduate or Professional Degree N/A 4.95% 7.30%
Source: U.S. Bureau of the Census, 1980, 1990, 2000. Lower Chattahoochee RDC Staff, 2006.

18
2.0 Economic Development Chattahoochee County and Cusseta have had limited economic growth or expansion over the past few years. However, with the imminent expansion at the Fort Benning Military Installation the potential for growth, both residential and commercial has increased tremendously. The local government and Industrial Development Authority are working closely with the Fort Benning Future group and local developers to provide necessary information about available land, infrastructure, zoning, etc. Projected growth at Fort Benning over the next ten (10) years is a minimum of 30,000 soldiers, including families, and private contractors. The City of Columbus and Fort Benning cannot absorb all of the growth at the post, therefore soldiers and their families will be looking to other counties for housing. Downtown Cusseta is less than 15 minutes from the main gate at Fort Benning, making it a very attractive housing location. With these new families will come a demand for additional retail and service businesses such as restaurants, drug stores, banks, doctors, etc. Chattahoochee County will continue to rely heavily on the federal military and civil service sectors for employment opportunities however, there is a tremendous potential for business growth in the service industry. One new business, a military contractor, has already purchased land in the county. One of the key factors in their decision to locate in the Chattahoochee County was their proximity to Fort Benning. Land that was previously undesirable is now valuable because it adjoins Fort Benning. The unemployment rate of Chattahoochee County is higher than that of the State of Georgia and the United States. This excessively high unemployment rate can be attributed to the poor demographic characteristics of the community. Graph 2.1: Unemployment Rate Comparison
Unemployment Rate Comparison State of Georgia
United States Chattahoochee County
0.0%
5.0%
10.0%
15.0%
1990
1992
1994
1996
1998
2000
2002
2004
ChattahoocheeState of GeorgiaUnited States
Source: U.S. Bureau of the Census Numerous employment opportunities exist in nearby Muscogee County and provide some jobs for the residents of Chattahoochee County. Efforts have been made and should continue to use the proximity of Muscogee County to bring industrial development to Chattahoochee County.

19
An industrial park is located along Highway 26 and consists of approximately 60 acres. However, most of the park has been used for recreation including a County Recreation Center and softball fields. The Cusseta-Chattahoochee County Industrial Development Authority has identified available land in the county. Some of this land might be used for an Industrial Park. The County needs to acquire this land for an Industrial Park, run water and sewer to it, and actively market the Industrial Park. Overall, Chattahoochee County's economy is characterized by a high unemployment rate and limited job opportunities. However there is tremendous potential for growth of small businesses as well as military contractors because of the growth at Fort Benning. The county should continue to pursue spin-off industrial development from Muscogee County and Fort Benning.
Regional Setting Chattahoochee County is located in the Lower Chattahoochee region, approximately 15 miles south of downtown Columbus, Georgia and 136 miles southwest of Atlanta, Georgia. See Map. Chattahoochee County and Cusseta have had limited economic growth or expansion over the past few years. In the past the vast majority of the county's economy has been based on the employment of its work force by the Fort Benning Military Installation. However, this trend has not continued in recent years. (See list of largest employers below) County residents speculate that this has been caused by privatization of services on the post. Growth in industry and agriculture has been greatly curtailed due to the lack of space.
Industry Mix The Five (5) largest employers in the Chattahoochee County are as follows: 1. Cusseta Laundry, Inc. 2. Employment Source, Inc. 3. Lear Siegler Services, Inc. 4. Taylor Motors, Inc. 5. Thomas Brand Siding The Ten (10) largest employers in the Chattahoochee Area are as follows: 1. American Family Life Assurance (AFLAC) (Muscogee County) 2. Blue Cross Blue Shield (Muscogee County) 3. L & S Services LLC (Muscogee County) 4. Martin Army Hospital (Muscogee County) 5. St. Francis Hospital (Muscogee County) 6. Swift Textiles, Inc. (Muscogee County) 7. The Medical Center, Inc. (Muscogee County) 8. Total Systems Services, Inc. (Muscogee County) 9. W. C. Bradley Co. (Muscogee County) 10.Wal-Mart Associates Inc.(Muscogee County) Source: Georgia Department of Labor – 2004 Area Labor Profile

20
Labor Work-Force The following graph compares the number of persons employed by industry in Chattahoochee County, the State of Georgia and the United States and the percentage change between the years 1990-2000. The total civilian employed civilian population grew faster in the State of Georgia than in both Chattahoochee County and the United States. This was caused by the growth in population in the State of Georgia from migration from both other states and other countries. The greatest loss of jobs in Chattahoochee County was in Public Administration and Retail Trade, while the Arts, Entertainment, Recreation, Accommodation and Food Services Industry have almost doubled. Graph 2.2 illustrates the change in jobs by industry for Chattahoochee County from 1990 until 2000. Graph 2.2: Employment by Industry 1990-2000
-43.00%
90.00%
29.00%
10.00%
1.00%
0.00%
0.00%
-43.00%
15.00%
34.00%
27.00%
3.00%
10.00%
-54.00%
-100.00%
-50.00% 0.00% 50.00% 100.00%
% change1990 -2000
Total Employed CivilianPopulation
Agriculture, Forestry, Fishing,hunting & mining
Construction
Manufacturing
Wholesale Trade
Retail Trade
Transportation, warehousing,and utilities
Information
Finance, Insurance, & RealEstate
Professional, scientific,management, administrative,and waste management services
Educational, health and socialservices
Arts, entertainment, recreation,accommodation and foodservices
Other Services
Public Administration
Source: U.S. Bureau of the Census In both the State of Georgia and Chattahoochee County, the fastest growing industry is in the arts, entertainment, recreation, accommodation and food services industry. While the State of Georgia shows a decrease in several industries including transportation, warehousing and utilities; manufacturing; and wholesale trade; these industries grew in 2000 in Chattahoochee County. The high growth industries for the State of Georgia were Professional, scientific,

21
management, administrative and waste management services; educational, health and social services; and construction. While these were growth areas in Chattahoochee County, the growth was not as large as for the state. It is important to note that these growth industries are generally well paying jobs which provide good benefits. Table 2.1 illustrates Chattahoochee County’s, the State of Georgia and the United State of America’s Employment by Industry for decades 1980, 1990 and 2000 as well as their percent change. The United States is only listed in the category where numbers and statistics were able to be found.

22
Table 2.1: Employment by Industry 1980-2000
1980 1990 2000 % Change
1980-1990 % Change 1990-2000
Total Employed Civilian Population Chattahoochee County 1,435 2,047 2,280 29.90 10.22State of Georgia N/A 3,090,276 3,839,756 N/A 19.52United States N/A 115,681,202 129,721,512 N/A 11.00
Agriculture, Forestry, Fishing, Hunting & Mining Chattahoochee County 6 35 36 82.86 2.77State of Georgia N/A 82,537 53,201 N/A -55.14
Construction Chattahoochee County 70 108 148 35.18 27.02State of Georgia N/A 214,359 304,710 N/A 29.65
Manufacturing Chattahoochee County 221 166 251 -33.13 33.86State of Georgia N/A 585,423 568,830 N/A -2.92
Wholesale Trade Chattahoochee County 16 51 60 68.63 15.00State of Georgia N/A 156,838 148,026 N/A -5.95
Retail Trade Chattahoochee County 401 471 329 14.86 -43.16State of Georgia N/A 508,861 459,548 N/A -10.73
Transportation, Warehousing & Utilities Chattahoochee County 51 68 82 25.00 17.07State of Georgia N/A 263,419 231,304 N/A -13.88
Information Chattahoochee County N/A N/A 64 N/A N/AState of Georgia N/A N/A 135,496 N/A N/A
Finance, Insurance & Real Estate Chattahoochee County 81 164 166 50.61 1.20State of Georgia N/A 201,422 251,240 N/A 19.83
Professional, Scientific, Management, Administrative, & Waste Management Services Chattahoochee County 53 90 100 41.11 10.00State of Georgia N/A 151,096 362,414 N/A 58.31
Educational, Health & Social Services Chattahoochee County 301 382 537 21.20 28.86State of Georgia N/A 461,307 675,593 N/A 31.72
Arts, Entertainment, Recreation, Accommodation, & Food Services Chattahoochee County 63 15 155 -320.00 90.32State of Georgia N/A 31,911 274,437 N/A 88.37
Other Services Chattahoochee County 17 178 145 90.45 -22.76State of Georgia N/A 266,053 181,829 N/A -99.85
Public Administration Chattahoochee County 155 319 207 51.41 -54.11State of Georgia N/A 167,050 193,128 N/A 13.50
Source: U.S. Bureau of the Census

23
The following Table shows the projected employment by Industry for Chattahoochee County. Total employment is projected to grow as well as several other sectors. The largest growth will be in the Educational, health and social services industry. This chart does not reflect the projected growth in Retail Trade that is anticipated by the local government. With the increase in troops and their families at Fort Benning, it is expected that the loss of jobs in the Retail Trade Industry will be reversed in the next ten (10) years. Table 2.2: Employment by Industry Projections 2005-2030
2005 2010 2015 2020 2025 2030 Total Employed Civilian Population 2,491 2,703 2,914 3,125 3,336 3,566 Agriculture, Forestry, Fishing, Hunting & Mining 44 56 59 66 76 81Construction 201 225 243 263 279 298Manufacturing 259 266 274 281 292 302Wholesale Trade 71 77 93 104 115 129Retail Trade 311 293 275 259 246 241Transportation, Warehousing & Utilities 102 110 127 138 153 168Finance, Insurance & Real Estate 193 215 236 261 283 300Professional, Scientific, Management, Administrative, & Waste Management Services 112 129 143 152 164 185Educational, Health & Social Services 615 678 739 804 856 925Arts, Entertainment, Recreation, Accommodation, & Food Services 180 206 229 254 281 303Other Services 177 209 244 278 313 343Public Administration 226 239 252 265 278 291
Source: U.S. Bureau of the Census The following chart shows the labor force of Chattahoochee County by place of work as a percentage of total workforce. From 1990 to 2000 the percent of persons working in the state of residence and in the county of residence decreased. The total population and available workforce in Chattahoochee County also went down.

24
Graph 2.3: Labor Force by Place of Work 1990-2000
Labor Force by Place of Work Chattahoochee County
0.00% 10.00% 20.00% 30.00% 40.00% 50.00% 60.00%
Worked in State of residence
Worked in county of residence
Worked outside of county of residence
Worked outside of state of residence
Percentage of Total workforce
20001990
Source: U.S. Bureau of the Censu Table 2.3 and 2.4 provide the total number and percentages of Chattahoochee County residents employed within the county, within the State and outside the County and outside the State. Table 2.3: Labor Force of Residence 1990-2000
1990 2000 % Change
1990-2000 Total Population 16,934 14,882 -13.79
Worked in State of Residence 9,418 8,255 -14.09
Worked in County of Residence 6,672 5,482 -21.71Worked outside of State of Residence 2,746 2,773 0.97Worked outside of County of Residence 455 283 -60.78
Source: U.S. Bureau of the Census Table 2.4: Percentages of Labor Force of Residents 1990-2000 1990 2000 Worked in State of Residence 55.61% 55.47%Worked in County of Residence 39.40% 36.84%Worked outside of State of Residence 16.21% 18.63%Worked outside of County of Residence 2.69% 1.90%
Source: U.S. Bureau of the Census The following graph provides information on Average Weekly Wages in Chattahoochee County and the State of Georgia. While Average Weekly Wages have remained relatively flat with no tangible growth, Average Weekly Wages for the State of Georgia has consistently climbed for the past 14 years.

25
Graph 2.4: Average Weekly Wages 1990-2004
Comparison of Average Weekly Wages Chattahoochee County and
the State of Georgia
$0$200$400$600$800
$1,000
1990 2000 2001 2002 2003 2004
ChattahocheeCountyState of Georgia
Source: U.S. Bureau of the Census Tables 2.5 and 2.6 compare the sources of personal income for both Chattahoochee County and the State of Georgia for 1990 and 2000. For both Chattahoochee County and the State of Georgia the primary source of income is salary/wages; however, it is a greater percentage of total household income for Chattahoochee County residents than for residents in the State of Georgia. Residents in the State of Georgia have a larger percentage of their total income in other types of income including self-employment, interest, dividends, rental income, social security and public assistance. Table 2.5: Personal Income by Type (Percentages) 1990 & 2000
Chattahoochee County State of Georgia Category 1990 2000 1990 2000Aggregate Wage or Salary Income for Households 90.6% 88.1% 79.0% 78.0%Aggregate Other Types of Income for Households 0.9% 1.9% 1.0% 2.0%Aggregate Self-Employment Income for Households 1.8% 1.5% 6.0% 6.0%Aggregate interest, Dividends, or Net Rental Income 2.3% 4.0% 6.0% 5.0%Aggregate Social Security Income for Households 1.6% 1.8% 4.0% 4.0%
Aggregate Public Assistance Income for Households 0.5% 0.4% 1.0% 0.1%
Aggregate Retirement Income for Households 2.3% 2.4% 3.0% 5.0%
Source: U.S. Bureau of the Census

26
Table 2.6: Personal Income by Type (in dollars) 1990 & 2000
Chattahoochee County State of Georgia Category 1990 2000 1990 2000Aggregate Wage or Salary Income for Households
$74,809,309 $ 113,391,900 $68,393,747,335 $133,220,601,500
Aggregate Other Types of Income for Households $ 753,832 $ 2,449,900 $ 980,166,673 $ 2,897,846,900Aggregate Self-Employment Income for Households $ 1,477,368 $ 1,919,100 $ 5,450,375,467 $ 9,529,395,400Aggregate interest, Dividends, or Net Rental Income $ 1,881,388 $ 5,202,200 $ 4,897,744,200 $ 8,973,470,100Aggregate Social Security Income for Households $ 1,302,695 $ 2,286,500 $ 3,776,110,950 $ 6,881,827,400Aggregate Public Assistance Income for Households $ 452,133 $ 465,900 $ 625,890,309 $ 374,957Aggregate Retirement Income for Households $ 1,874,975 $ 3,044,500 $ 2,990,380,519 $ 7,776,117,500
Total Income
$82,551,700 $128,760,000 $87,114,415,453 $169,279,633,757Source: U.S. Bureau of the Census
Resources Chattahoochee County has many natural and human resources. The county has formed a Chamber of Commerce which has already completed several projects such as putting up new welcome signs at the major highway entrances into the county and hosting a golf tournament for developers. While there is no paid staff for the Chamber of Commerce, there are many active volunteers. The Chattahoochee County Industrial Development Authority (IDA) was reactivated several years ago and has been very energetic. After developing by-laws for the IDA, members designed a brochure to market the county. Members then took on the task of forming a Chamber of Commerce which has been very successful. More recently the IDA has identified parcels of land that are available for development and provided information to developers including location maps, owners, tax value and location of infrastructure.

27
Chattahoochee County has education and training opportunities that contribute to the local economic environment through the local high school and through Columbus Technical College. Staff of the Georgia Tech Regional Office, the University of Georgia’s Small Business Development Center, the Valley Partnership and the Lower Chattahoochee Regional Development Center provides technical support to local businesses throughout the county. A new high school has recently been completed with the first class graduating in 2009. The school is a great source of pride in the community and is also a source of opportunity because of the future growth at Fort Benning. While surrounding school districts are running out of room, Chattahoochee County is ready for new students in a new modern facility that meets all educational requirements.
Major Development As evidenced in the preceding Tables and their discussions, there have been no major developments in the economic development area in the county in the past several years. However, the anticipated growth at Fort Benning will have a tremendous impact on both the residential and commercial areas of the county. While the county has a water system for portions of the county, there is no sewer system. The county leadership has committed to addressing this problem within the next 2-3 years.
Tourism Chattahoochee County has been blessed with ample water resources including frontage along the Flint River. The County obtained control of River Bend Park in 2002 from the Corps of Engineers. This park is relatively undeveloped but does have a boat ramp and limited fishing facilities. In the County’s Master Plan, it lists several goals including running water, sewer and electricity to the park. The county has already achieved the goal of running electricity to the park and is working on the other infrastructure needs. Tourism is an important segment of the economic and will continue to grow. Further analysis of the tourism sector of the economy reveals that it plays a significant role. The Georgia Department of Economic Development commissions the Travel Industry of America every year to determine the impact of tourism on the state of Georgia. The following chart outlines the impact of tourism in Chattahoochee County in 2002, 2003 and 2004. Expenditures have increased each year as has payroll and taxes, both state and local. The contribution of tourism is being felt by local government and residents.
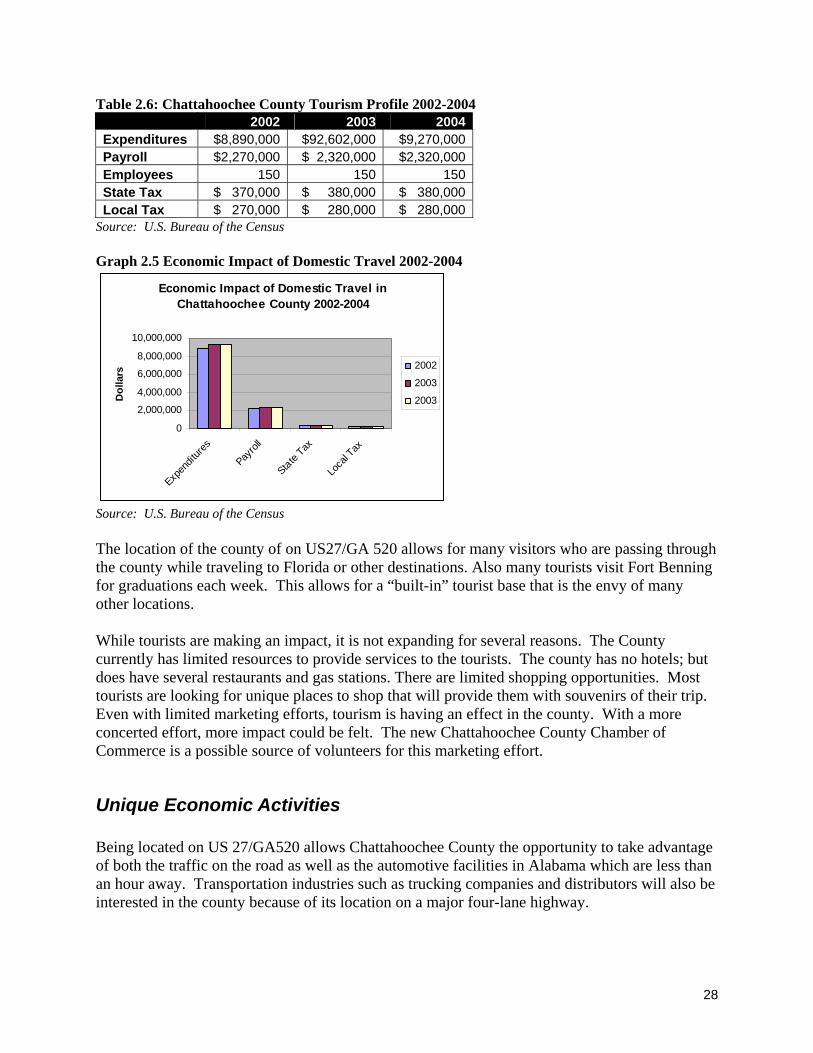
28
Table 2.6: Chattahoochee County Tourism Profile 2002-2004 2002 2003 2004Expenditures $8,890,000 $92,602,000 $9,270,000 Payroll $2,270,000 $ 2,320,000 $2,320,000 Employees 150 150 150State Tax $ 370,000 $ 380,000 $ 380,000 Local Tax $ 270,000 $ 280,000 $ 280,000
Source: U.S. Bureau of the Census Graph 2.5 Economic Impact of Domestic Travel 2002-2004
Economic Impact of Domestic Travel in Chattahoochee County 2002-2004
0
2,000,000
4,000,000
6,000,000
8,000,000
10,000,000
Expen
diture
s
Payrol
l
State Tax
Loca
l Tax
Dol
lars
2002
2003
2003
Source: U.S. Bureau of the Census The location of the county of on US27/GA 520 allows for many visitors who are passing through the county while traveling to Florida or other destinations. Also many tourists visit Fort Benning for graduations each week. This allows for a “built-in” tourist base that is the envy of many other locations. While tourists are making an impact, it is not expanding for several reasons. The County currently has limited resources to provide services to the tourists. The county has no hotels; but does have several restaurants and gas stations. There are limited shopping opportunities. Most tourists are looking for unique places to shop that will provide them with souvenirs of their trip. Even with limited marketing efforts, tourism is having an effect in the county. With a more concerted effort, more impact could be felt. The new Chattahoochee County Chamber of Commerce is a possible source of volunteers for this marketing effort.
Unique Economic Activities Being located on US 27/GA520 allows Chattahoochee County the opportunity to take advantage of both the traffic on the road as well as the automotive facilities in Alabama which are less than an hour away. Transportation industries such as trucking companies and distributors will also be interested in the county because of its location on a major four-lane highway.

29
3.0 Housing The housing stock in Cusseta-Chattahoochee County consists of a mixture of traditional stick-built homes, manufactured housing units and mobile homes. The county’s 2000 housing inventory consists of 3,316 housing units.
Housing Types and Inventory The number of housing units in Cusseta-Chattahoochee County has increased 6% since 1990. As indicated in Table 3.1, the majority of the county’s housing stock is single family units, comprising 58% of total units in 2000. Secondary housing components consist of multi-family and mobile home units. As of 2000 multi-family units comprised 22% of all housing units. In previous decades multi-family units have comprised close to 50% of the total housing stock. However, as the percent of multi-family housing has decreased the stock of mobile home units has increased. In 1980 mobile home units comprised less than 9% of the total housing units; by 2000 the number of mobile home units had grown to nearly 20% of the county’s housing stock. Table 3.1: Chattahoochee County Number of Household Units by Type 1980-2000
1980 1990 2000
Total Housing Units
3,192
3,108
3,316
Single Family Units
1,388
1,717
1,920
Multi-Family Units
1,518
901
738
Mobile Home/Trailer
286
450
658 All Other Units - 40 -
Source: U.S. Bureau of the Census, 1980, 1990, 2000. Chattahoochee County and the Columbus Metropolitan area are expected to experience a more rapid annual growth in its housing stock over the next two decades. The expected growth is largely due to the Fort Benning expansion as a result of BRAC (Base Realignment and Closure) as well as the state’s and U.S.’s population migrate to more rural areas in the southern states. Tables 3.2 and 3.3 reveal the number of housing units by type for the State of Georgia and the counties surrounding Chattahoochee County in the Lower Chattahoochee Region. Table 3.2: State of Georgia Number of Household Units by Type 1990-2000
1990 2000
Total Housing Units
2,638,418
3,281,737
Single Family Units
1,638,847
2,107,317
Multi-Family Units
671,683
775,169 Mobile Home/Trailer
305,055
394,938
Source: U.S. Bureau of the Census, 1990, 2000.

30
Table 3.3: Surrounding Counties Number of Household Units by Type 1990-2000 Stewart County Talbot County
1990 2000 1990 2000 Total Housing Units 2,156 2,354 Total Housing Units 2,645 2,871Single Family Units 1,478 1,434 Single Family Units 1,777 1,651Multi-Family Units 101 138 Multi-Family Units 110 113Mobile Home/Trailer 544 741 Mobile Home/Trailer 717 1,100All Other Units 33 41 All Other Units 41 7
Muscogee County Harris County 1990 2000 1990 2000
Total Housing Units 70,902 76,182 Total Housing Units 7,814 10,288Single Family Units 46,464 52,310 Single Family Units 5,691 8,325Multi-Family Units 20,757 21,009 Multi-Family Units 401 363Mobile Home/Trailer 2,942 2,863 Mobile Home/Trailer 1,611 1,600All Other Units 739 0 All Other Units 111 0
Source: U.S. Bureau of the Census, 1990, 2000.
Housing Occupancy Characteristics A high majority of the county’s housing units (64%) are rental units. In comparison, only 30% of total units in the State of Georgia were used as rental units in 2000. When compared to Stewart, Talbot, Muscogee and Harris Counties. Chattahoochee County outpaces the nearest competitor, Muscogee County; by 20 plus percentage points. The County with the lowest renters percentage is Harris County at 12%. Also to be noted is that the percentage of renters for Chattahoochee County went up by 8% between 1990 and 2000. The State of Georgia saw a larger percentage (18%) in renters than did Chattahoochee County. In the Region, Muscogee County saw a slight renter unit increase of less then 1% from 1990 to 2000. Harris County saw a 7.6% increase in rental units from 1990 to 2000. Both Stewart County and Talbot County decreased from 1990 to 200 in the number of rental units. Table 3.4: Chattahoochee County Housing Units and Occupancy Characteristics 1980-2000
1980 1990 2000 % Change 1980-1990
% Change 1990-2000
Total Housing Units
3,192
3,108
3,316 -2.70 6.27 Housing Units Vacant 180 224 384 N/A 41.66
Owner Occupied N/A
594
819 N/A 27.47
Renter Occupied N/A
2,290
2,113 N/A 8.38 Source: U.S. Bureau of the Census, 1980, 1990, 2000. Lower Chattahoochee RDC Staff, 2006.

31
Table 3.5: State of Georgia Housing Units and Occupancy Characteristics 1990-2000
1990 2000
Total Housing Units
2,638,418
3,281,737
Housing Units Vacant
271,803
275,368
Owner Occupied
1,536,829
2,029,293
Renter Occupied
829,786
977,076 Source: U.S. Bureau of the Census, 1990, 2000. Table 3.6: Surrounding Counties Housing Units and Occupancy Characteristics 1990-2000
Stewart County Talbot County 1990 2000 1990 2000 Total Housing Units 2,156 2,354
Total Housing Units 2,645 2,871
Housing Units Vacant 174 347
Housing Units Vacant 300 333
Owner Occupied 1,403 1,456 Owner Occupied 1,825 2,100Renter Occupied 579 551 Renter Occupied 520 438
Muscogee County Harris County 1990 2000 1990 2000 Total Housing Units 70,902 76,182
Total Housing Units 7,814 10,288
Housing Units Vacant 5,044 6,363
Housing Units Vacant 1,360 1,466
Owner Occupied 35,476 39,372 Owner Occupied 5,315 7,596Renter Occupied 30,382 30,447 Renter Occupied 1,139 1,226
Source: U.S. Bureau of the Census, 1990, 2000. The average household size in Chattahoochee County and in the region dropped from 1990 to 2000. Chattahoochee County went from 3.71 to 3.41; Stewart County, 2.80 to 2.48, Talbot County from 2.78 to 2.55, Muscogee County from 2.61 to 2.54 and Harris County from 2.73 to 2.66. Chattahoochee County does still have one of the highest populations per household in the Region however. Decreasing trends in persons per households is expected to continue for Chattahoochee County and the Region. Table 3.7: Chattahoochee County Number of Households, Average Household Size, and Overcrowding of Households 1980-2000
1980 1990 2000 Number of Households
3,012
2,884
2,932
Average Household Size 3.71 3.68 3.41More than 1 person per room (overcrowding) N/A 205 133
Source: U.S. Bureau of the Census, 1980, 1990, 2000.

32
In terms of over crowded households Chattahoochee County was below the State average in 2000 of 4.8%. In 2000 the percentage of households in Chattahoochee County considered overcrowded was 4.53%. One of the higher percentages in the Region is Stewart County at 6.1%. The lowest percentage of household overcrowding is Harris County at 2.77%. From 1990 to 2000 the number of households considered to be overcrowded dropped for Chattahoochee, Stewart and Talbot Counties but rose for Muscogee and Harris Counties. Table 3.9: Surrounding Counties Number of Households, Average Household Size, and Overcrowding of Households 1980-2000
Stewart County Talbot County 1990 2000 1990 2000
Number of Households 1,982 2,007 Number of Households 2,345 2,538
Average Household Size 2.80 2.48 Average Household Size 2.78 2.55More than 1 person per room (overcrowding) 184 123
More than 1 person per room (overcrowding) 141 93
Muscogee County Harris County 1990 2000 1990 2000
Number of Households 65,858 69,819 Number of Households 6,454 8,822
Average Household Size 2.61 2.54 Average Household Size 2.73 2.66More than 1 person per room (overcrowding) 2,984 3,144
More than 1 person per room (overcrowding) 220 245
Source: U.S. Bureau of the Census, 1990, 2000.

33
Housing Cost The median value of housing in Chattahoochee County has been significantly lower than that of the State of Georgia and the nearby Harris County. Historically, Chattahoochee County housing cost has been comparable to that of the region. Currently, its median housing value falls in the middle of Talbot and Muscogee counties’ but is greater than that of Stewart County and lower than that of Harris County. In 2000, the median housing cost for the State of Georgia was 71.6% higher than Chattahoochee County’s. Like wise, in 2000 Muscogee County’s median housing cost was 29.6% higher than Chattahoochee County’s. However for the same year, Chattahoochee County’s median housing cost was 23.2% higher than that of Stewart County and 12.3% higher than that of Talbot County. With the expected growth to the county and the county’s planned development the cost of housing is projected to increase significantly over the next several years making its median housing value more closely comparable to that of Muscogee County and Harris County. The median rent in Chattahoochee County proves to be greater than all of the counties represented from the Lower Chattahoochee Region. In 2000, Chattahoochee County’s median rent was 16.2% higher than Muscogee County’s and nearly 200% higher than Stewart County’s. In 1990 and 2000, respectively, Chattahoochee County’s median rent was 4.6% and 5.5% lower than the State of Georgia’s. Tables 3.10 through 3.12 illustrate the housing cost for Chattahoochee County, the State of Georgia and the surrounding counties. Table 3.10: Chattahoochee County Housing Cost (in dollars) 1990-2000
1990 2000 Median Value $ 43,100 $ 64,800 Median Rent $ 414 $ 581
Source: U.S. Bureau of the Census, 1990, 2000. Table 3.11: State of Georgia Housing Cost (in dollars) 1990-2000
1990 2000 Median Value $ 70,700 $ 111,200 Median Rent $ 433 $ 613
Source: U.S. Bureau of the Census, 1990, 2000. Table 3.12: Surrounding Counties Housing Cost (in dollars) 1990-2000
Stewart County Talbot County 1990 2000 1990 2000
Median Value $ 29,300 $ 44,000 Median Value $ 37,100 $ 57,700 Median Rent $ 196 $ 245 Median Rent $ 180 $ 307
Muscogee County Harris County 1990 2000 1990 2000
Median Value $ 58,100 $ 84,000 Median Value $ 65,000 $ 122,700 Median Rent $ 358 $ 500 Median Rent $ 311 $ 411
Source: U.S. Bureau of the Census, 1990, 2000.

34
Jobs – Housing Balance Historically, Chattahoochee County has not had a problem with its jobs-housing balance. There has been no significant difficulty in residence finding and maintaining affordable housing. Those who reside and work in the county have been able to maintain affordable housing as have those living in Chattahoochee County but working outside the county. In 2000 the median value of a home in Chattahoochee County was $64,800 while the median family income was $43,735. The median family income of the non-military, Chattahoochee County residences was $30,000 for that same year. Even with the difference of incomes between military and non-military housing cost remains affordable to the majority of people living in Chattahoochee County. However, over the last few years the median home value has increased substantially, according to Chattahoochee County’s Chief Appraiser. Price increase is due to the increase in land value. One acre lots in good subdivisions are now selling for $15,000 to $21,000; whereas a few years ago, lots were selling for $8,000 to $10,000 per acre. Furthermore, as land cost escalates housing affordability will become a greater issue for Cusseta-Chattahoochee County residences who work in and outside of the county.
Cost Burdened Housing Cusseta-Chattahoochee County has a lower rate of cost burdened home owners when compared to the Lower Chattahoochee Region and the State of Georgia. Twenty (20%) percent of the Cusseta-Chattahoochee County home owners are cost burdened compared to 21.1% in the region and 21% in the State of Georgia. This is a reflection of the many Cusseta-Chattahoochee County residences who are employed in Fort Benning or Columbus where wages and salaries are higher. In addition, the average housing cost in Cusseta-Chattahoochee County is significantly lower than that of Columbus and the State of Georgia. The median housing value in 2000 for Chattahoochee County was $64,800 this cost is over 23% lower to the median housing cost in Columbus which was $84,000 in 2000. The State of Georgia’s median housing value in 2000 was $111,200 this cost is 70% greater than Chattahoochee County’s. Information on the number of cost burdened renters in Chattahoochee County is difficult to ascertain. There is currently not efficient housing information available to calculate the cost burdened status of a large percentage of renters in Cusseta-Chattahoochee County due to the Fort Benning Military Installation. What is known is that 20% of renters paid less than 30% if gross income on housing cost, 50% of renters paid 30 to 40% of gross income on housing and 2% paid over 50% of gross income on housing. Within the State of Georgia and the Lower Chattahoochee Region 35.4% and 32.2% of renters, respectively were cost burdened while 16.5% in the State and 16.4% in the region were considered severely cost burdened.

35
Housing Conditions Tables 3.13 through 3.15 reveal the conditions of housing units found in Chattahoochee County, its surrounding counties and the State of Georgia. As of 2000 9.4% of all of Chattahoochee County’s housing units were built during or prior to 1939. From 1990 to 2000 the county experienced a reduction of 43% of its housing units built in or before 1939. Like wise, 1.5% of the county’s total housing units were lacking complete plumbing facilities. In addition, 1.1% of the county’s total housing units were lacking complete kitchen facilities. Table 3.13 illustrates the U.S. Bureau of the Census housing conditions as found in Chattahoochee County in 1990 and 2000. Table 3.13: Chattahoochee County Housing Conditions 1990-2000
1990 2000 Total Housing Units 3,108 3,316Built 1939 or earlier 547 312Complete Plumbing Facilities 3,065 3,266Lacking Plumbing Facilities 43 50Complete Kitchen Facilities 3,066 3,278Lacking Complete Kitchen Facilities 42 38
Source: U.S. Bureau of the Census, 1990, 2000. In the State of Georgia where 99% of all housing units had complete plumbing facilities and 99% had complete kitchen facilities. Less than 6% of the housing units throughout the State of Georgia were built in or before 1939. Table 3.14: State of Georgia Condition of Houses 1990-2000
1990 2000 Total Housing Units 2,638,418 3,281,737
Built 1939 or earlier
212,938
192,972 Complete Plumbing Facilities 2,609,956 3,252,197Lacking Plumbing Facilities
28,462
29,540
Complete Kitchen Facilities 2,614,404 3,250,200Lacking Complete Kitchen Facilities 24,014 31,717
Source: U.S. Bureau of the Census, 1990, 2000. Table 3.15 reveals the condition of housing in the counties surrounding Chattahoochee County

36
for the years the 1990 and 2000. In 2000 in Muscogee County as few as half a percent (.005) of housing units were lacking plumbing facilities; less than one percent of the housing units were lacking complete kitchen facilities. Furthermore, 19.4% of the houses in Muscogee County were built in or before 1939. One percent (1%) of Harris County housing units were found to be lacking plumbing facilities; while less than one percent were lacking complete kitchen facilities. Fifteen percent (15%) of the using units were built during or prior to 1939. In Talbot County 2.6% of housing units were lacking complete plumbing and 2% were lacking complete kitchen facilities. In regard to age, 20.4% of the housing units found in Talbot County in 2000 were built in or before 1939. In Stewart County 4.6% of the housing units were lacking plumbing facilities; similarly 4.6% housing units were also lacking complete kitchen facilities. In addition, 17.4% of the county’s housing units were built in or earlier than 1939. Table 3.15: Surrounding Counties Condition of Houses 1990-2000
Stewart County Talbot County 1990 2000 1990 2000
Total Housing Units 2,156 2,354 Total Housing Units 2,645 2,871Built 1939 or earlier 484 410 Built 1939 or earlier 679 586Complete Plumbing Facilities 1,951 2,246
Complete Plumbing Facilities 2,409 2,796
Lacking Plumbing Facilities 205 108
Lacking Plumbing Facilities 236 75
Complete Kitchen Facilities 1,990 2,246
Complete Kitchen Facilities 2,519 2,811
Lacking Complete Kitchen Facilities 166 108
Lacking Complete Kitchen Facilities 126 60
Muscogee County Harris County 1990 2000 1990 2000
Total Housing Units 70,902 76,182 Total Housing Units 7,814 10,288
Built 1939 or earlier
14,333
14,769 Built 1939 or earlier
1,813
1,553 Complete Plumbing Facilities 70,591 75,788
Complete Plumbing Facilities 7,533 10,178
Lacking Plumbing Facilities 311 394
Lacking Plumbing Facilities 281 110
Complete Kitchen Facilities 70,252 75,557
Complete Kitchen Facilities 7,608 10,195
Lacking Complete Kitchen Facilities 650 625
Lacking Complete Kitchen Facilities 206 93
Source: U.S. Bureau of the Census, 1990, 2000. A housing assessment was conducted in Cusseta, Georgia by the Lower Chattahoochee Regional Development Center in 2003. The assessment was conducted prior to the City of Cusseta and Chattahoochee County’s unification. At the time, prior to the unification a high majority of the county’s housing stock were located in the Cusseta city limits. Therefore the assessment is a

37
relatively accurate reflection of the housing stock county wide. The assessment found that 47% of all of the houses in the former Cusseta city limits are stick built homes, 52% are mobile homes or manufactured housing units and less than 1% are multi-family units. Seventy-five percent (75%) of the housing units were occupied at the time of the assessment the remaining 25% is considered vacant or abandoned. Graph 3.1: Percentage of all Housing Stock by Type
Housing Type
47%52%
1%0%
10%
20%
30%
40%
50%
60%
Stick Built MHU Multi-Family
Graph 3.2: Occupancy Status of all Housing Stock by Percentages
Occupancy Status
Occupied, 75%
Vacant/ abandoned,
25%
When analyzing only occupied units 80% of the stick built units were occupied, 71% of the mobile homes or manufactured housing units were occupied and 100% of the multi-family units were occupied. Similarly, 50% of all occupied housing was stick built, 49% of all occupied housing was mobile homes or manufactured housing units and the remaining 1% of all occupied housing were multi-family units. The remaining 20% of the stick built housing units and 29% of the mobile homes or manufactured housing units were considered vacant or abandoned. Thirty-seven percent (37%)
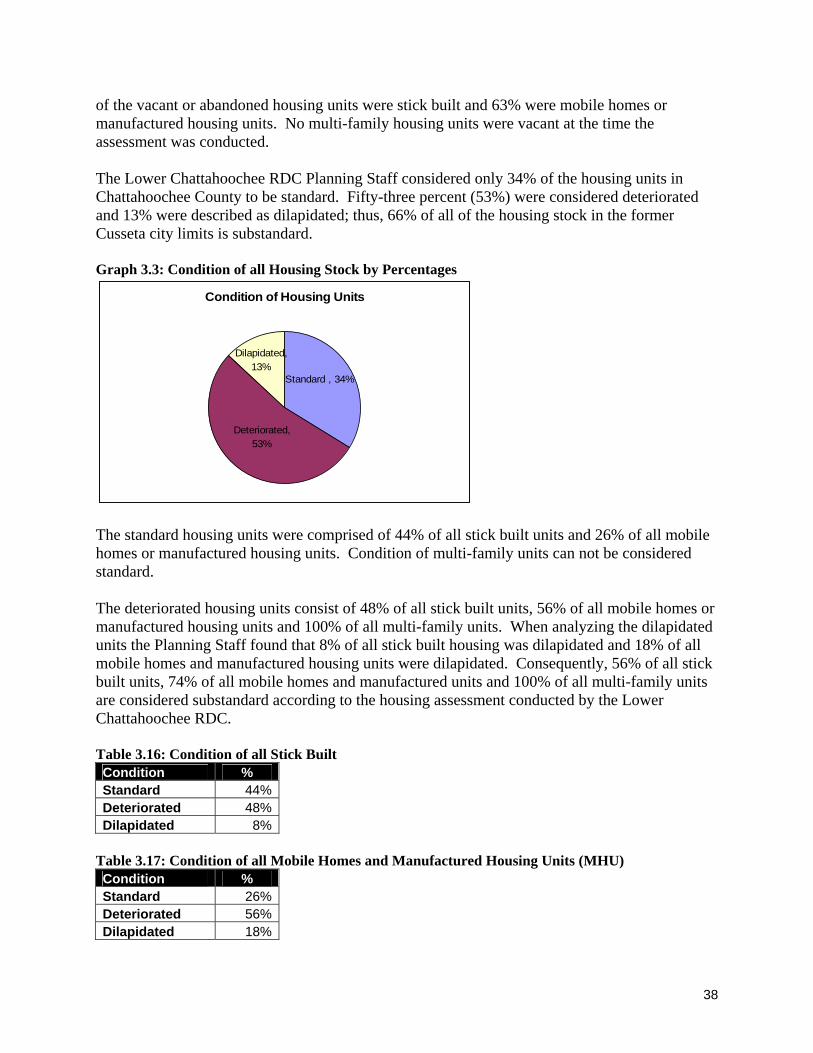
38
of the vacant or abandoned housing units were stick built and 63% were mobile homes or manufactured housing units. No multi-family housing units were vacant at the time the assessment was conducted. The Lower Chattahoochee RDC Planning Staff considered only 34% of the housing units in Chattahoochee County to be standard. Fifty-three percent (53%) were considered deteriorated and 13% were described as dilapidated; thus, 66% of all of the housing stock in the former Cusseta city limits is substandard. Graph 3.3: Condition of all Housing Stock by Percentages
Condition of Housing Units
Dilapidated, 13%
Standard , 34%
Deteriorated, 53%
The standard housing units were comprised of 44% of all stick built units and 26% of all mobile homes or manufactured housing units. Condition of multi-family units can not be considered standard. The deteriorated housing units consist of 48% of all stick built units, 56% of all mobile homes or manufactured housing units and 100% of all multi-family units. When analyzing the dilapidated units the Planning Staff found that 8% of all stick built housing was dilapidated and 18% of all mobile homes and manufactured housing units were dilapidated. Consequently, 56% of all stick built units, 74% of all mobile homes and manufactured units and 100% of all multi-family units are considered substandard according to the housing assessment conducted by the Lower Chattahoochee RDC. Table 3.16: Condition of all Stick Built Condition % Standard 44% Deteriorated 48% Dilapidated 8%
Table 3.17: Condition of all Mobile Homes and Manufactured Housing Units (MHU) Condition % Standard 26% Deteriorated 56% Dilapidated 18%

39
A further analysis was completed taking into consideration both housing unit type and occupancy status. Of all the housing units in the former Cusseta city limits 19% were occupied standard stick built; 12% were occupied standard mobile homes or manufactured housing units. Therefore, only 31% of all of the housing stock in what was formerly know as Cusseta, Georgia can be characterized as occupied standard. Two percent (2%) of the total housing stock were stick built and considered vacant or abandoned standard. While 1% were mobile homes or manufactured housing units and considered vacant or abandoned standard. Similarly, the composition of the housing stock considered occupied deteriorated/dilapidated consists of 19% of the total housing stock being stick built, 25% of the total housing stock being mobile homes or manufactured units. All of the multi-family units were considered occupied deteriorated/dilapidated. The vacant or abandoned deteriorated/dilapidated housing stock comprises 21% of the units, with 7% being stick built and 14% being mobile homes or manufactured housing units. Projected Housing Needs The following tables identify the projected housing needs in Cusseta-Chattahoochee County over the next twenty-five (25) years. The housing needed is expected to increase significantly over the next five (5) to ten (10) years and then begin to stabilize at slower annual growth rate by year 2015. All housing types, single family units, multi-family units and mobile home units are projected to increase; with the exception of mobile home units which are expected to decline by year 2015. This decline in mobile home units is largely expected as the result of increasing property values and the development of other types of affordable housing in Cusseta-Chattahoochee County. Table 3.18: Projected Number of Households and Household Size 2005-2030
2005 2010 2015 2020 2025 2030 Number of Households
2,932
4,256
4,389
4,481
4,503
4,563
Average Household Size 3.41 2.42 3.29 3.36 3.49 3.59
Source: U.S. Bureau of the Census, 1980, 1990, 2000. Lower Chattahoochee RDC Staff, 2006. Table 3.19: Projected Housing Types 2005-2030
2005 2010 2015 2020 2025 2030
Total Housing Units
3,329
4,729
4,823
4,871
4,895
4,907
Single Family Units
1,931
2,932
3,014
3,068
3,084
3,091
Multi-Family Units
732
1,040
1,061
1,120
1,155
1,162
Mobile Home/Trailer
666
757
748
683
656
654 Source: U.S. Bureau of the Census, 1980, 1990, 2000. Lower Chattahoochee RDC Staff, 2006. Housing in Cusseta-Chattahoochee County is expected to remain majority renter occupied. The number of owner occupied housing is expected to increase yearly at a steady rate and the number

40
of vacant housing is expected to decrease in the next ten (10) years as a result of current and expected growth. Development pressures will lessen by year 2015 as the county’s population begins to stabilize. Table 3.20: Projected Housing Units and Occupancy Characteristics 2005-2030
2005 2010 2015 2020 2025 2030
Total Housing Units
3,329
4,729
4,823
4,871
4,895
4,907
Housing Units Vacant
397
473
434
390
392
344
Owner Occupied
502
710
917
1,072
1,174
1,276
Renter Occupied
2,430
3,546
3,472
3,409
3,329
3,287 Source: U.S. Bureau of the Census, 1980, 1990, 2000. Lower Chattahoochee RDC Staff, 2006.
Special Housing Needs Due to Cusseta-Chattahoochee County’s juxtaposition to Columbus, the need to provide Special Housing is limited. Most individuals with special needs tend to locate in the larger communities were services are readily available. The percentage of population with AIDS, a physical or mental handicap is relatively small, being less than 9%. Cusseta-Chattahoochee County does not produce crops (other than timber) therefore there is no need for migrant farm worker housing. The biggest area of concern in special housing needs is for the ever increasing senior population. Chattahoochee County is expected see a significant increase in its senior population. For most seniors, housing issues revolve around housing accessibility (handicap ramps, handicap accessible restrooms, etc.) the provision of care and housing cost. Cusseta-Chattahoochee County, as other counties, will have to adopt policies to accommodate its growing senior population.
41
4.0 Natural and Cultural Resources The natural environment places certain opportunities and constraints on the way land is used. Soil conditions, slopes, flood frequency and wetlands all affect where development can safely and feasibly occur. These and other environmentally sensitive characteristics should be given consideration in the planning process and provided appropriate protection. The physiographic characteristics of Chattahoochee County are examined in the following element.
Public Water Supply Sources There is one (1) permitted public water system in Chattahoochee County with a total of four (4) active drinking water sources. The Unified Government of Cusseta-Chattahoochee County operates four (4) groundwater wells: Patti Drive, Hwy 137, Firetower Road, Sandi Street. See attached maps.
Water Supply Watershed Chattahoochee County falls within the Lower Middle Chattahoochee Watershed. Within incorporated Cusseta-Chattahoochee County there are four (4) moderately sized watersheds: Chattahoochee River-Hitchitee Creek, Hannahatchee Creek, Kinchafoonee Creek-Slaughter Creek, and Lower Upatoi Creek. See Chattahoochee County, Georgia, HUC 10 Watershed map. The Environmental Protection Division, under the Environmental Planning Criteria, has not required Cusseta-Chattahoochee County to adopt a Water Supply Watershed Protection Ordinance and they have not done so.

42
Underground Water Recharge Area Chattahoochee County is located in an important groundwater recharge area: the Cretaceous-Tertiary aquifer system. The Cretaceous-Tertiary aquifer system, which includes the Providence aquifer system, is an interconnected group of sub-systems that developed in the Late Cretaceous sands of the Coastal Plain Province. (Donahue, Groundwater Quality in Georgia for 2002). See Chattahoochee County, Georgia, Groundwater Recharge Area map. Due to procedural changes in the Environmental Planning Criteria, the Environmental Protection Division has not required that Cusseta-Chattahoochee County adopt a Groundwater Recharge Area Protection Ordinance and they have not done so.
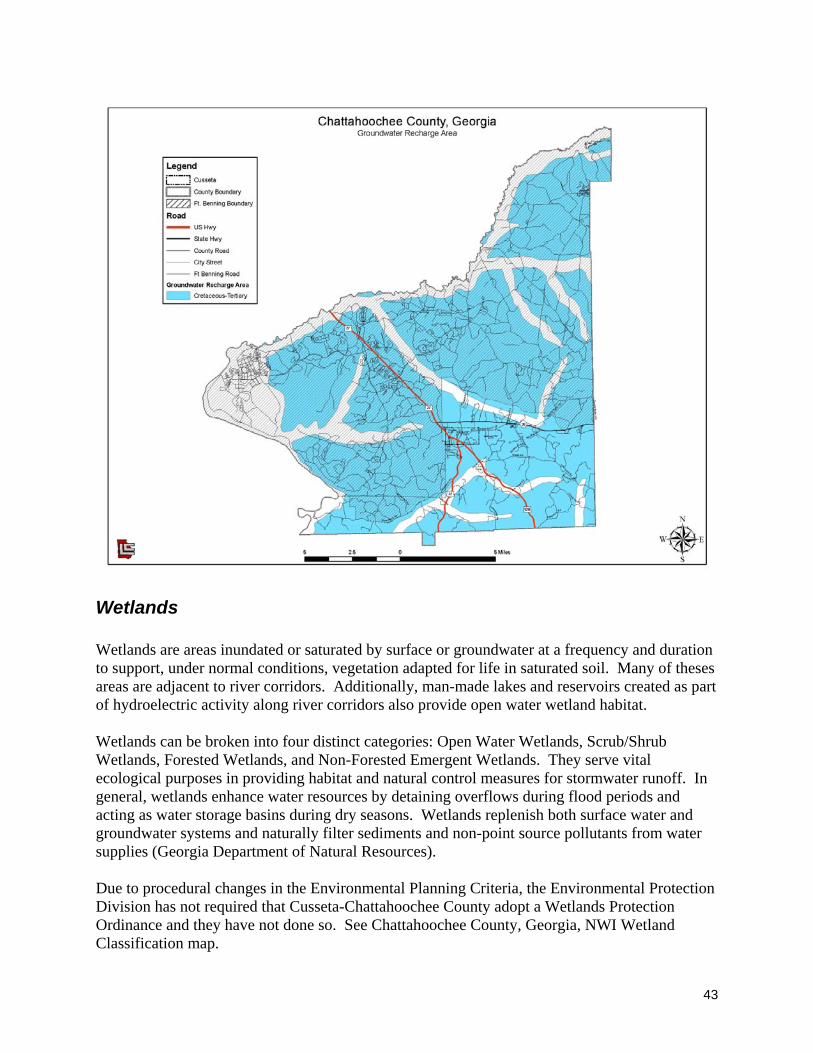
43
Wetlands Wetlands are areas inundated or saturated by surface or groundwater at a frequency and duration to support, under normal conditions, vegetation adapted for life in saturated soil. Many of theses areas are adjacent to river corridors. Additionally, man-made lakes and reservoirs created as part of hydroelectric activity along river corridors also provide open water wetland habitat. Wetlands can be broken into four distinct categories: Open Water Wetlands, Scrub/Shrub Wetlands, Forested Wetlands, and Non-Forested Emergent Wetlands. They serve vital ecological purposes in providing habitat and natural control measures for stormwater runoff. In general, wetlands enhance water resources by detaining overflows during flood periods and acting as water storage basins during dry seasons. Wetlands replenish both surface water and groundwater systems and naturally filter sediments and non-point source pollutants from water supplies (Georgia Department of Natural Resources). Due to procedural changes in the Environmental Planning Criteria, the Environmental Protection Division has not required that Cusseta-Chattahoochee County adopt a Wetlands Protection Ordinance and they have not done so. See Chattahoochee County, Georgia, NWI Wetland Classification map.

44
Protected Mountains There are no state designated Protected Mountains in Chattahoochee County.
Protected Rivers There are no state designated Protected River Corridors in Chattahoochee County. As a result, Cusseta-Chattahoochee County has not adopted the River Corridor Protection Ordinance as recommended by the Environmental Protection Division’s Environmental Planning Criteria.
Coastal Resources There are no Coastal Resources in Chattahoochee County.

45
Flood Plains Cusseta-Chattahoochee County has been mapped for flood prone areas under the Federal Emergency Management Agency program and participates in the National Flood Insurance Program. See Chattahoochee County, Georgia, Q3 Flood Data map.

46
Soil Types Chattahoochee County is located in the Southern Coastal Plain Province. The province consists of soils occupying broad interstream areas having gentle to moderate slopes with underlying marine sands, loam, and/or clays. The soil configuration of Chattahoochee County puts many constraints and limitations on development. Soil classifications include Bibb, Lakeland, Norfolk, Vaucluse, and Wagram. See the soils chart for discussions on recommended usage. See Chattahoochee County, Georgia, Soil map.

47
Steep Slopes The topography of Chattahoochee County also places constraints and limitations on placement of development. Much of the county has slopes exceeding 25%. Areas of 3% and less are found along the Chattahoochee River in the western part of the county. See Chattahoochee County, Georgia, Slope Classification map.

48
Prime Agricultural and Forest Land Prime Agricultural land is defined as those soil types, which are ideally suited for production of crops. There are 159,200 acres of land in Chattahoochee County. A majority of this acreage is federally owned and operated as part of Fort Benning Military Reservation. Of the acreage incorporated under Cusseta-Chattahoochee County, 4,351 acres are farmland with only 60 acres in harvest crops. See attached maps. The forested areas of Chattahoochee County are both aesthetically and ecologically valuable in the provision of natural beauty, wildlife habitat, and the maintenance of water quality. There are 147,400 acres of forestland in Chattahoochee County. The Federal government owns 110,000 acres of forestland as part of Fort Benning Military Reservation. This leaves 37,400 acres of forestland incorporated under Cusseta-Chattahoochee County. Of that acreage, 37,400 acres are privately owned forestland in timber production. The forestland provides a haven for wildlife. The hunting and fishing industries are increasingly important in the economic sector of the county. Chattahoochee County should require that forestry activities be consistent with best management practices established by the Georgia Forestry Commission in order to ensure the scenic and environmental value of this large land area.
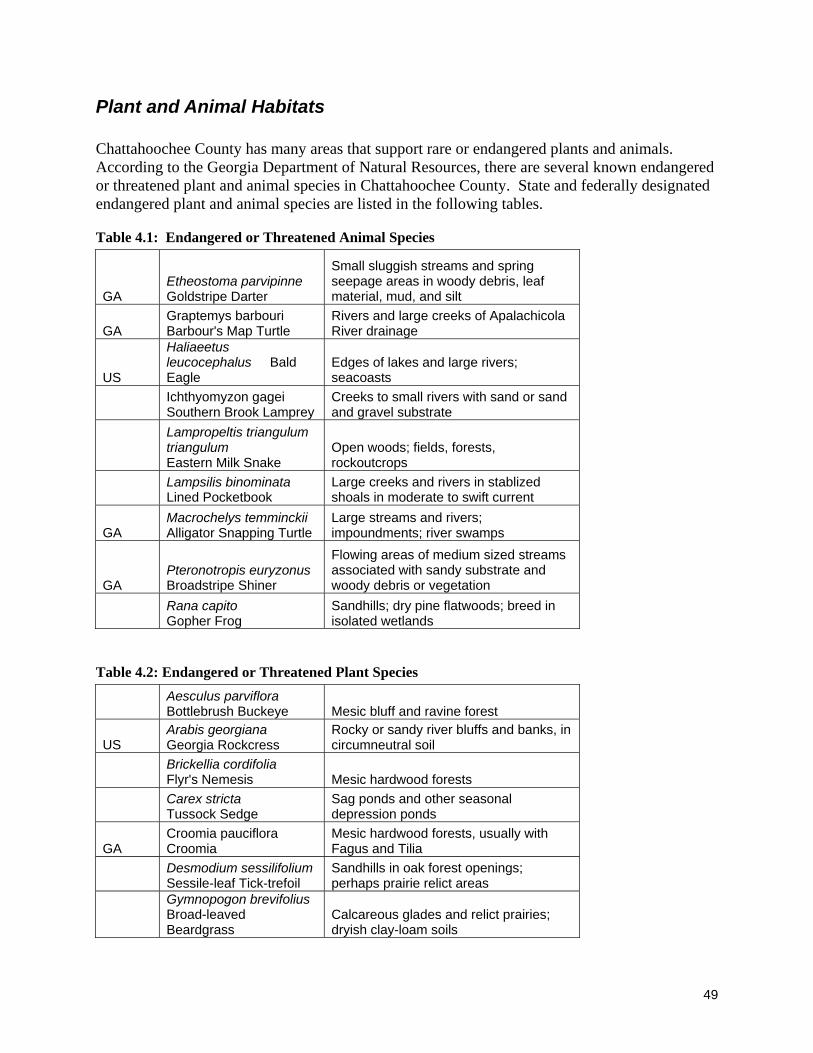
49
Plant and Animal Habitats Chattahoochee County has many areas that support rare or endangered plants and animals. According to the Georgia Department of Natural Resources, there are several known endangered or threatened plant and animal species in Chattahoochee County. State and federally designated endangered plant and animal species are listed in the following tables.
Table 4.1: Endangered or Threatened Animal Species
GA Etheostoma parvipinne Goldstripe Darter
Small sluggish streams and spring seepage areas in woody debris, leaf material, mud, and silt
GA Graptemys barbouri Barbour's Map Turtle
Rivers and large creeks of Apalachicola River drainage
US
Haliaeetus leucocephalus Bald Eagle
Edges of lakes and large rivers; seacoasts
Ichthyomyzon gagei Southern Brook Lamprey
Creeks to small rivers with sand or sand and gravel substrate
Lampropeltis triangulum triangulum Eastern Milk Snake
Open woods; fields, forests, rockoutcrops
Lampsilis binominata Lined Pocketbook
Large creeks and rivers in stablized shoals in moderate to swift current
GA Macrochelys temminckii Alligator Snapping Turtle
Large streams and rivers; impoundments; river swamps
GA Pteronotropis euryzonus Broadstripe Shiner
Flowing areas of medium sized streams associated with sandy substrate and woody debris or vegetation
Rana capito Gopher Frog
Sandhills; dry pine flatwoods; breed in isolated wetlands
Table 4.2: Endangered or Threatened Plant Species
Aesculus parviflora Bottlebrush Buckeye Mesic bluff and ravine forest
US Arabis georgiana Georgia Rockcress
Rocky or sandy river bluffs and banks, in circumneutral soil
Brickellia cordifolia Flyr's Nemesis Mesic hardwood forests
Carex stricta Tussock Sedge
Sag ponds and other seasonal depression ponds
GA Croomia pauciflora Croomia
Mesic hardwood forests, usually with Fagus and Tilia
Desmodium sessilifolium Sessile-leaf Tick-trefoil
Sandhills in oak forest openings; perhaps prairie relict areas
Gymnopogon brevifolius Broad-leaved Beardgrass
Calcareous glades and relict prairies; dryish clay-loam soils
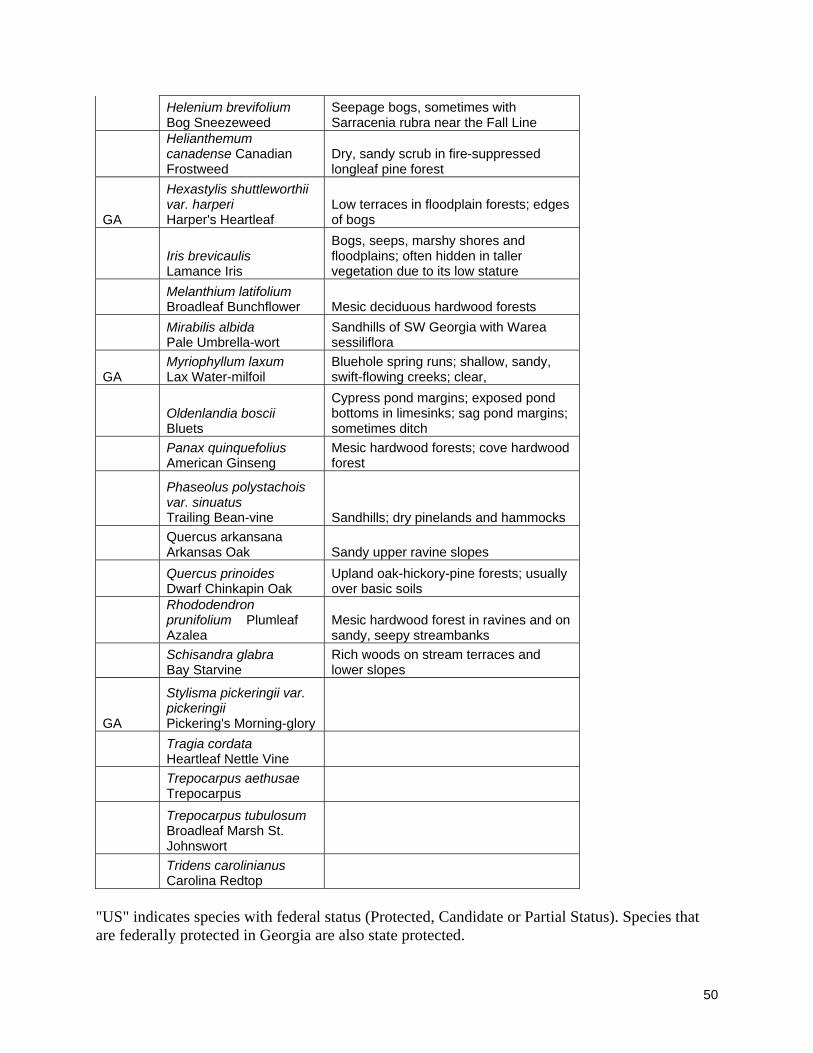
50
Helenium brevifolium Bog Sneezeweed
Seepage bogs, sometimes with Sarracenia rubra near the Fall Line
Helianthemum canadense Canadian Frostweed
Dry, sandy scrub in fire-suppressed longleaf pine forest
GA
Hexastylis shuttleworthii var. harperi Harper's Heartleaf
Low terraces in floodplain forests; edges of bogs
Iris brevicaulis Lamance Iris
Bogs, seeps, marshy shores and floodplains; often hidden in taller vegetation due to its low stature
Melanthium latifolium Broadleaf Bunchflower Mesic deciduous hardwood forests
Mirabilis albida Pale Umbrella-wort
Sandhills of SW Georgia with Warea sessiliflora
GA Myriophyllum laxum Lax Water-milfoil
Bluehole spring runs; shallow, sandy, swift-flowing creeks; clear,
Oldenlandia boscii Bluets
Cypress pond margins; exposed pond bottoms in limesinks; sag pond margins; sometimes ditch
Panax quinquefolius American Ginseng
Mesic hardwood forests; cove hardwood forest
Phaseolus polystachois var. sinuatus Trailing Bean-vine Sandhills; dry pinelands and hammocks
Quercus arkansana Arkansas Oak Sandy upper ravine slopes
Quercus prinoides Dwarf Chinkapin Oak
Upland oak-hickory-pine forests; usually over basic soils
Rhododendron prunifolium Plumleaf Azalea
Mesic hardwood forest in ravines and on sandy, seepy streambanks
Schisandra glabra Bay Starvine
Rich woods on stream terraces and lower slopes
GA
Stylisma pickeringii var. pickeringii Pickering's Morning-glory
Tragia cordata Heartleaf Nettle Vine
Trepocarpus aethusae Trepocarpus
Trepocarpus tubulosum Broadleaf Marsh St. Johnswort
Tridens carolinianus Carolina Redtop
"US" indicates species with federal status (Protected, Candidate or Partial Status). Species that are federally protected in Georgia are also state protected.

51
"GA" indicates Georgia protected species.
Major Park, Recreation and Conservation Areas Riverbend Park: Open daily from sunrise to sunset, River Bend Park is a public access facility on the shores of Lake Walter F. George. The habitat consists of open water intermixed on the north side with small vegetated islands. The uplands are forested with mixed pines and hardwoods. Park activities include boating, birding, and overnight primitive camping.
Scenic Views and Sites While the determination of scenic sites and views is subjective, one such view has been identified in the county. This view is located along Gordy Mill Pond Road, looking toward the south-west. This area is identified on the Natural and Historic/Cultural Resource Map. Other areas include views south off of River Bend Road, U.S. 27 and SR 520/280.

52
Cultural and Historic Resources A county-wide historic resources survey was completed in August, 2004. The survey identified 150 historic resources in the county. Of that 150, 19 were determined to be eligible for inclusion on the National Register of Historic Places. The survey identified three areas that based on unique character, local and regional significance, integrity and relationship to other important historic resources would be eligible historic districts: Cusseta Historic District, Antebellum Houses of Early Settlers, and Rosenwald Schools. Currently, there is only one National Register of Historic Places designation in Cusseta-Chattahoochee County: the Chattahoochee County Jail at the corner of Boyd and Mt. Olive Streets. The Unified Government of Cusseta-Chattahoochee County has not enacted a historic preservation ordinance or appointed a historic preservation commission; therefore, they are not eligible for the Certified Local Government program administered by the National Park Service nor are they eligible for the Historic Preservation Fund grant program offered through the State Historic Preservation Office. While an inventory of the historic sites, structures, and objects within the county’s borders was completed in 2004, there is no county-wide government entity to sponsor National Register listings, oversee the application for survey funds, maintain an inventory of local historic resources, and attempt to preserve endangered resources. At present, the Chattahoochee County Historic Preservation Society (a county-wide not-for-profit) and individual, private citizens carry out these goals.

53
Soil Suitability
Soil Classification
Dominant Slope % Drainage Permeability Use and Vegetation
Bibb 0-2 Poor Slow Runoff Moderate
A few areas have been cleared, drained, and used for pasture. Dominantly native woodland of sweetgum, loblolly pine, red maple, water oak, willow oak, green ash, baldcypress, swamp tupelo, and black willow.
Lakeland 0-12
Excessively Drained Slow Runoff Rapid
Many areas are cleared and used for peanuts, watermelons, peaches, corn, tobacco, and improved pasture. The natural vegetation consists of blackjack oak, turkey oak, post oak; scattered long leaf pine; and an understory of creeping bluestem, sandy bluestem, lopsided indiangrass, hairy panicum, fringeleaf paspalum, and native annual forbs.
Norfolk 0-10
Well-drained Negligible to Medium Runoff Moderate
Mostly cleared and used for general farm crops. Where cultivated-- corn, cotton, peanuts, tobacco, and soybeans. Where wooded-- pines and mixed hardwoods.
Vaucluse 2-25
Well-drained High Runoff
Moderately Slow
Forest, cropland. Where cultivated-- corn, cotton, small grain, soybeans, or pasture. Where wooded-- loblolly and longleaf pine.
Wagram 0-15
Well-drained Negligible to Medium Runoff Moderate
Cropland. Where cultivated-- tobacco, cotton, corn, and small grains. Where wooded-- loblolly and longleaf pine, white oak, red oak, turkey oak, and post oak; hickory, holly, and dogwood.
Source: National Cooperative Soil Survey, U.S.A..

54
5.0 Community Facilities Community facilities play an important role in maintaining and improving the quality of life in a community as well as attracting new development. The following is an inventory of the community facilities for Chattahoochee County.
Water Supply and Treatment The Unified Government of Cusseta-Chattahoochee County has four separate water supply and treatment systems. The County has the ability to join systems together in the event of a well or tank being damaged or out of service. Well #1 at 125 Patty Drive pumps approximately 165 gallons per minute (GPM) to tank #1 located at 841 Highway 27. Well #2 at 256 Highway 137 pumps approximately 165 gallons per minutes (GPM) to tank #2 located at 208 King Street. Well #3 located at 123 Fire Tower Road pumps approximately 170 gallons per minute (GPM) to it’s tank at the same location. Well #4 is located at 124 Sandy Street and pumps approximately 125 gallons per minute (GPM). The combined storage capacity of all four tanks is 450,000 gallons. The water at each well is treated with chlorine, Aqua Mag, and Hydrated Lime. Chlorine removes germs and bacteria prior to being pumped to the tanks. Hydrated Lime is used to raise the water’s PH to an average of 7.5 (alkaline vs. acidic below 7.0). The purpose of making water alkaline is to prevent damage to metal piping. Aqua Mag is a liquid used to bind minute particles prior to filtering at aid removal of the particles. The water system serves 1,277 customers at present. Our customers consist of commercial and residential users, with the majority of use being residential..
Assessment The existing water system can handle an additional 2,000 to 3,000 users. Beyond that the county will have to consider either adding more wells or applying for a surface water permit to drain water from the Chattahoochee River. The later option would also require the construction of a water facility.
Sewage System With the exception of the Chattahoochee County Industrial Park, the residents of Chattahoochee County and Cusseta employ septic tanks for the disposal of sewage. A sewage treatment facility is planned for he near future that will enable customers to avoid the cost and maintenance of individual septic tanks on their property. Without proper care and maintenance a septic tank can overfill and cause unsanitary conditions to exist for the property owner as well as neighbors. The Chattahoochee County Industrial Park is served by a sewage system with a capacity of 40,000 gallons per day. Percent usage is between 20,000 and 30,000 gallons per day by the
55
laundry located in the park. The system consists of two ponds for oxidation and settling, and a two-acre spray field.
Assessment All of Cusseta-Chattahoochee County utilizes a septic tank system, of which many of the septic tanks, especially in the area formerly know as the City of Cusseta, are failing; with the anticipated growth of Cusseta-Chattahoochee County a sewage system is a must. County officials are currently designing and seeking funding to build a sewage treatment facility.
Solid Waste The Solid Waste and Recycling Department is responsible for the pick up of household and yard debris. The county operates door-to-door trash pick-up to all residential and commercial establishments on a weekly basis. The recycling center offers many solutions for the recycling needs of Chattahoochee County residents. The recycling center accepts and recycles waste oil corrugated cardboard, used tires, white goods, scrap metal, building materials and concrete. The county currently has two forty-yard open top roll off containers and one forty-yard compacter container site. The county also operates two wash wagons. All of the county’s equipment is located at the recycling center located off Highway 137.
Assessment If Cusseta-Chattahoochee County has moderate to heavy growth over the next twenty (20) years, as it is expected, the current solid waste collection system will have to be expanded. Contracting with a private agency to collect waste is also an option.
Public Safety The Unified Government of Cusseta-Chattahoochee County operates a Sheriff’s Department where it employs a full-time sheriff and four deputies. The department has six full-time radio dispatchers. The department owns and operates six vehicles each equipped with radios. Holding cells are located in the courthouse with overnight prisoners taken to Muscogee County. The Sheriff’s Department is located on Broad Street.
Assessment On average Cusseta-Chattahoochee County has one deputy per 1,000 (non-Fort Benning) populations. If the county increases by 10,000 to 12,000 people over the next twenty (20) years the county may need to consider employing several more sheriffs, deputies/personnel. The number of additional staff may be less due to the small coverage area within the county.

56
Fire Protection The Cusseta-Chattahoochee County Fire Department is a volunteer unit with 27 firemen; it is located on Old Cusseta Road. The current ISO rating is 9 and the department currently has 8 fire trucks.
Assessment Currently the Fire Department is adequate for handling the existing conditions. The county may need to add one or two stations if growth reaches maximum levels. As the County expands both its fire department and its water system there is a good chance that the ISO rating will be lowered.
Health Services The City of Columbus provides Cusseta-Chattahoochee County with its Emergency Medical Services. However, Cusseta-Chattahoochee County does have a first response team which consists of the fire chief and assistant fire chief. The response team responds to any emergency call in attempt to stabilize the patient until an ambulance arrives. Cusseta-Chattahoochee County operates a County Health Department which provides the basic healthcare services to the population of Chattahoochee County. Due to the proximity of Muscogee County and its regional medical community and the Martin Army Hospital located on the Fort Benning military installation, the majority of medical services are provided outside of the county at this time. Martin Army Hospital serves the local military population, active duty and retirees as well as their dependents. In addition, ambulance services are provided by the Mid Georgia Ambulance Service for Columbus and Macon, GA., Stewart County’s ambulance service also provides emergency assistance in Cusseta-Chattahoochee County.
Assessment Cusseta-Chattahoochee County should continue to pursue its own Emergency Medical Services in order to ensure the most efficient medical attention as the county continues to grow. Also, a small medical clinic or doctor’s office providing primary care services is needed in the county.
Recreation Recreational facilities in Chattahoochee County are provided by the U.S. Army Corps of Engineers, the Chattahoochee County Board of Education, the Chattahoochee County Garden Club and the Chattahoochee County Board of Commissioners. The Corps of Engineers owns River Bend Park and maintained it until 2002. The park is located

57
at the end of River Bend Road along the Chattahoochee River. The park consists of 195 acres. The park has a boat ramp, restrooms, camping sites and walking trails available. River Bend Park was leased to Chattahoochee County in 2002 for 25 years, which means that the County is responsible for the operations and maintenance of the facility through 2027. The Chattahoochee County Board of Education has two gymnasiums for public use. The first is located at the Chattahoochee County Education Center located at 27 Merrill Street and the other at the new Middle/High School located at 360 Highway 26 in Cusseta. The Board of Education also maintains a ball field at the County Education Center. New fields are also being constructed at the Middle/High School. The Kasihta Garden Club is a nongovernmental organization which offers monthly programs in horticulture at the Neighborhood Services Center located on Broad Street. The Chattahoochee County Board of Commissioners operates the Roscoe Robinson Activity Center, which includes a gymnasium, recreation room and three multi-purpose fields. Also located in Cusseta-Chattahoochee County is the Red Oak Golf Course located on Gordy Mill Pond Road. The course is opened to the public and includes eighteen (18) holes.
Assessment As the county grows more parks (ball fields, play grounds, ect.) will be needed. Walking and bike trails are also in demand this is especially true for the young and the old populations.
General Government The United Government of Cusseta and Chattahoochee County Board of Commissioners office is located at 377 Broad Street in the Court House Annex. This building houses the office of the County Manager, Tax Assessor, Tax Commissioner, County Clerk and the Water Superintendent. The Chattahoochee County Court House houses the Probate, Magistrate and Superior Court offices and the Sheriffs office. Both facilities are at capacity. Other general government facilities include the community services building, located on McNughton Street, the Cusseta/Chattahoochee County Planning Commission located at 327 Road Street, the Public Works facility located on King Street and the Roscoe Robinson Recreation Center on Industrial Boulevard. The Community Services building houses the County Health Department, the Department of Family and Children Services, Family Connections and the Industrial Development Authority. The Planning Commission building houses the secretary to the Planning Commission, the building inspector/code enforcement officer and administrative assistant and the office of the County Commission Chairman.

58
The Public Works building houses the Public Works Superintendent, a secretary, Animal Control office and the County Garage. The Roscoe Robinson Recreation Center houses the Recreation Director and staff.
Assessment All of the aforementioned facilities are at capacity. New growth may cause a need for facility expansions and new structures.
Educational Facilities The Chattahoochee County Board of Education supervises two schools in the county. The Chattahoochee County Education Center located at 27 is Merrell Street, Cusseta, Georgia. The County’s elementary school containing grades Pre-K thru grade 5. The school currently has 348 students. See Table 5.1 for grade breakdown. Chattahoochee County in 2005 opened its new middle/ high school. The new/middle high school is located at 360 Highway 26 Cusseta, Georgia. The Chattahoochee County Middle/High School currently has 363 students enrolled in grades 6 thru 10. The County will add 11th grade for the 2006-2007 school year. See Table 5.2 for the number of students in each grade. The total number of students in the Chattahoochee County school system as of May 2006 is 711. The 2006-2007 school year will add an additional 100 students. With the expansion of Fort Benning, Chattahoochee County is expected to receive 100 plus student a year for the next several years. Table 5.1: Chattahoochee County School Enrollment 2006
Grade Pre-K Kindergarten 1 2 3 4 5 Sub-Total
# of Students 36 61 52 49 43 58 55 348
-K�Kindergarten�1�2�3�4�5# Sub-Total#
Table 5.2: Chattahoochee County Middle School and High School Enrollment 2006
Grade 6 7 8 9 10 Sub- Total
Total Students
# of Students 54 59 44 126 80 363 711
10#
Utilities Chattahoochee County and Cusseta are served by the Sumter Electric Membership Corporation. Telephone services are provided by Southern Bell. Natural gas is not available.

59

60
6.0 Transportation
Road Network Chattahoochee County is served by major federal and state roads. Highway 520 a four-lane which connects Columbus, Georgia to Brunswick, Georgia runs diagonally in an east-west direction. U.S. 27 (Georgia 1) which connects Columbus with Bainbridge is the main thorough fare for the south eastern section of the county while Georgia 26 crosses the county in the northern portion of the county. Cusseta developed at the junction of the three primary highways. Two of the highways (SR 520 and SR 26) converge in the center of Cusseta. The other primary route is old Georgia 137, which originates in Cusseta runs through Buena Vista and terminates north of Butler Georgia. The most heavily traveled route is Highway 520; SR 26 is the next most heavily traveled route. The County contains 101 miles of public roads. State routes consist of 32.79 miles, while county roads consist of 62.67 miles and 5.7 miles are city roads. Approximately 25 miles of road are unpaved. Off road drainage is primarily a ditch system along county roads and a storm drain system in Cusseta. State roads use a gutter system. Highway 520/280 and U.S. Highway 27 are well under carrying capacity and will be able to handle future generated traffic over the next 20 years. SR 26 is still under design capacity but will not be able to handle future traffic volumes. A widening of SR 26 is suggested. Also, two of three major highways converge at the north end of Chattahoochee County heading toward Fort Benning and Columbus. U.S. 27 connects with SR 520/280 not far below the R 26 and 520/280 intersection as well. They create potential bottle necks at the SR 26, 520/280 intersection. It is advised that Chattahoochee County consider a by-pass around the county to help move traffic across the county in a east to west direction
Alternative modes Alternative transportation modes are very limited in Chattahoochee County. Public Transit is available to the Fort Benning side of Chattahoochee County, but not to the non-Fort Benning area of Chattahoochee County. Bike/pedestrian facilities are also limited. Biking Routes are available along 520/280 and 27 but not along SR 26. Local Roads are not equipped for bike/pedestrian facilities. But there are opportunities to make bike/pedestrian facilities and mass-transit viable alternative modes of transportation as Chattahoochee County grows.
Parking Parking is not a problem in Cusseta or Chattahoochee County. The most parking pressure is in

61
the town center area of Cusseta around the Courthouse, which can become overused at times and along some of the commercial establishments along 520/280 which at peak times needs more parking space. There are not any obsolete parking areas that need retrofitting.
Railroads/ other Facilities Other transportation facilities include two rail lines, the Norfolk Southern Line between Columbus and Americus and a former CSX line between Columbus and Bainbridge which is currently inactive. There are no major trucking or port facilities or airports in Chattahoochee County. The inactive CSX line will make a great bike/pedestrian trail. The CSX line first needs to be declared as abandoned, however, before any work can be done on it.
Transportation and Land Use Connection The areas of congestion in Chattahoochee County include the SR 26, SR 520 intersection SR 26 to the new Middle / High School, the U.S. 27 SR 520 intersection and the Broad Street SR 520 intersection. These areas are very close in location and handle the majority of the County’s traffic. Although traffic is manageable now the situation could reverse as these areas are also the primary commercial and residential growth areas of the County. Congestion will only increase as development occurs in this core area. Traffic along Broad Street which is the main route to the Cusseta town center can also be heavy at times. Enough vacant land existing in and around Cusseta and along Broad to add numerous homes all of which will generate additional traffic on Broad Street.
Assessment None of the County’s roads, local, state or federal, are at capacity. U.S. 27 currently handles 3,000 vehicles a day and has a maximum capacity of over 12,000 vehicles a day. State Highway 520/280 has a current peak usage of 7950 vehicles a day and a capacity of 12,000 plus vehicles a day. State Route 26 has a capacity of 10,000 vehicles per day and a current daily usage of 4,090 vehicles. The highest traffic counts in Cusseta-Chattahoochee County are found on the U.S. 27, 520/280 link that runs through Fort Benning; with traffic levels averaging between 8,120 vehicles to 14,690 daily. Currently the roads through Fort Benning are being widened to handle future demands. U.S. 27 and SR 520/280 are wide enough to handle future projected populations. State Route 26 will need improvements to handle the future anticipated growth. County Collector Roads such as Fire Tower and Liberty Hill Roads are well below capacity. They are expected to be able to handle future growth. The highest traffic in town is found at CR 127 and Wells Street, this intersection is currently receiving 3,040 vehicles daily and CR 57 at Broad Street to Piper Drive currently serves 1,120 vehicles per day. These roads will need improvement as traffic counts rise.

62

63
7.0 Intergovernmental Coordination
State Requirements The State of Georgia requires that local governments must evaluate the consistency of their policies, activities, and development patterns. (See Chapter 110-12-1-.06, State Planning Goals and Objectives of the Standards and Procedures for Local Comprehensive Planning)
Intergovernmental Relationships In 2003 Chattahoochee County and the City of Cusseta consolidated into the Unified Government of Cusseta-Chattahoochee County. Chattahoochee County thus took over all of the services provided by the City of Cusseta to its residents. Thus intergovernmental coordination only exist with adjacent cities and counties; more specifically, Stewart County, Marion County and the City of Columbus. In addition, Chattahoochee County government coordinates with the County School Board, the Chamber of Commerce, the Valley Partnership, and Chattahoochee County Industrial Development Authority. Chattahoochee County is a member of the Lower Chattahoochee Regional Development Center (LCRDC). The LCRDC actively participates and assists the county with GIS mapping, Comprehensive Planning needs, Economic Development, grant preparation and zoning administration. The LCRDC prepared the existing Chattahoochee County Comprehensive Plan. According to the census, being that Chattahoochee County is in the Columbus urbanized area, securing federal and state funding for transportation improvements requires close coordination with the City of Columbus Metropolitan Planning Organization. All transportation projects utilizing federal or state funds must be a part of the long-range Columbus Regional Transportation Plan (RTP) and be listed on the current Transportation Improvement Program (TIP). In addition, to planning for the regional transportation needs, Columbus also carries out long-range transportation studies, the recommendations of such studies are often given priority in determining which transportation projects will be funded. The primary responsibility for intergovernmental coordination with the county government lies with the County Administrator’s Office. Since Incorporation Chattahoochee County solely provides all public services including …
1. Animal Control 2. Code Enforcement, Planning and Zoning 3. Coroner 4. Court Services 5. Elections 6. Garbage Collection 7. Law Enforcement

64
8. Parks and Recreation 9. Recycling 10. Roads 11. Tax 12. Water (agreement with Marion and Stewart County to provide water)
Responsibilities that are shared include Education/ Day Care, Family and Children’s Services, E-911, EMS, Extension Services, Fire Department, Jail, Library, Mental Health, Neighborhood Services, Public Health and Transportation. The primary responsibility of Education is the Chattahoochee County School Board’s which in 2005 opened its first middle/high school. Chattahoochee County has a service delivery agreement to help provide Day Care services with the school system. Family and Children Services are provided by the Department of Family and Children Services (DFACS) which is located in a county owned facility. General funds also go to help support DFACS. The E-911 system is done in conjunction with the City of Columbus. Emergency calls are routed through Columbus E-911, which then dispatches the calls to the Sheriff office, the Ambulance Service and the Fire Department. Chattahoochee County operates a first response EMS unit, which is operated through the Fire Department. The first response unit stabilizes the patient while waiting for an ambulance to arrive from Columbus. Agricultural Services are provided through the UGA Extension Service in cooperation with Marion County. Fire services are primarily provided by the Chattahoochee County Volunteer Fire Department. However the Georgia Forestry Commission helps in fire fighting activities. Chattahoochee County provides overnight services for inmates; those in custody longer than one day are transferred to the Columbus jail. Library Services are performed jointly with the Chattahoochee County School Board and Chattahoochee Valley Regional Library System. Mental Health Services are provided by New Horizons and the County Health Department. The County provides funding and building space. Soil Conservation Services are provided by NRCS in an agreement with Marion and Chattahoochee Counties. Chattahoochee County operates a rural transit program with Stewart County. All of the current agreements are operating at acceptable standards. Chattahoochee County would like to eventually add an ambulance service to its existing first response capabilities. The Service Delivery Strategy (SDS) is being updated in conjunction with the update of the Unified Government of Cusseta-Chattahoochee County Comprehensive Plan.

65
8.0 Consistency with Quality Community Objective State planning standard require that Chattahoochee County include a review of its development activities and policies in relation to the Quality Community Objectives identified in the State of Georgia Planning Goals and Objectives. Below is a review of the said Quality Community Objectives with comments if needed.

66

67

68

69

70

71

72

73

74

75

76