communicate your buildings energy rating - display · communicate your buildings energy rating ......
TRANSCRIPT

®
Communicate Your Buildings Energy Rating
An assessment of the impact of
communication activities:
A report on results from pre and
post-communication
surveys during
the Display®
Campaign
Prepared by the Institute of Energy and
Sustainable Development, De Montfort
University, The Gateway, Leicester. LE1
9BH
Authors:
Professor Paul Fleming
Dr Richard Bull
Dr Nell Chang
April 2011
The sole responsibility for the content of this report lies with the authors. It does not necessarily
re�ect the opinion of the European Union. Neither the EACI nor the European Commission are
responsible for any use that may be made of the information contained therein.

2 | P a g e
Executive summary
This paper presents the results of the pre and post communication surveys municipalities were required
to undertake as part of their communication activities, with the goal of behaviour change. The surveys
were administered with varying degrees of success. Seven municipalities organized pre-surveys and five
managed to administer post surveys. To mitigate this poor response and add greater validity to this
report information is presented from a secondary survey as part of research into buildings and energy
improvement.
Key Findings:
− Increased awareness of what Display Posters (and Energy Performance Certificate) are and where
they in located in municipalities who conduct communication campaigns.
− Buildings which publicly show their Display Posters show appear to show greater improvement in
their energy performance
− The most effective communication activities leading to greater improvement in their energy
performance include organize local media campaign; training 'energy champions' (people with
specific responsibilities for energy in a department) and organising a 'national users club event'
(Cyber Display Campaign events bringing together key local stakeholders),
1. Introduction
This report is to fulfill deliverable ‘2.3.4’ - a final report on the results from the pre and post-
communication surveys. This deliverable is part of a suite of outputs assessing and valuating the
communication and technical activities of partners and participating municipalities. The Display
Campaign is made up of 15 partners who form the consortium, thirteen of whom have committed to
developing local communication campaigns alongside producing and utilizing the Display certificate
where appropriate.
In this short report we present the results of the pre and post communication surveys that
municipalities were required to undertake as part of their communication activities, with the goal of
behaviour change. The aim of this particular report is to present the findings from the surveys and to see
what impact the communication campaigns had on their audience. Utilising information gained from a
secondary survey as part of our analysis on buildings and energy improvement we are able to present
additional information that addresses the underlying question, namely, how effective are
communication campaigns on changing the behaviour of their intended audience.
2. Methodology
The findings in this paper are based on two sets of surveys, for reasons outlined below.
Survey 1: The ‘pre and post communication survey’ (see Appendix 1) were intended to be distributed by
municipalities to their intended audience of their communication activities both before and after the
communication. The pre-survey was to be used to establish a benchmark or ‘baseline’ level of
knowledge around climate, energy and buildings. After the communication event the survey could be re-

3 | P a g e
administered and differences (if any) could be observed. The survey was translated into six European
languages and made available on-line through the website: www.surveymonkey.com. Both surveys were
accessible either on-line through the provision of a weblink or it could be printed off, completed ‘by
hand’ and the details then entered on-line. At the outset it must be started that there was a very
disappointing take-up of the survey. Of the 13 partners involved only seven municipalities successfully
administered the pre-survey, and only five did the post (with Cork only achieving four respondents, see
Table 1). This has obviously impeded what is possible to draw from these results.
Table 1: Partners who administered the pre and post survey
Municipality Country No. of Respondents
(Pre survey)
No. of Respondents
(Post survey)
Helsinki Finland 36 11
Milton Keynes England 20 20
Bristol England 153 0
Salerno Italy 870 178
Udine Italy 485 (52)* 48
Healthy Cities: Koprivnice
Czech 87 0
Healthy Cities:
Litomerice
Czech 157 0
Cork Ireland 251 4
Survey 2: Given the very low take-up of the main pre & post surveys an alternative was to be sought to
augment the limited response and add ‘validity’ to the findings. As part of De Montfort’s second
deliverable (2.2.2 Report on relationship between technical and infrastructural changes) we had
gathered data on the role and impact of producing certificates and communication campaigns (see
appendix 2). We had a much better response to the survey and the findings from this are highly
pertinent to the subject of this report. This survey was also hosted on survey monkey but was
specifically targeted to energy managers and key contacts within the Energy Cities network. A total of
383 responses were gathered which, after ‘cleaning the data’ (rigorously sifting through the responses
to remove incomplete or invalid responses and so on) left information on 286 buildings to consider. The
findings of this survey do provide some very interesting information that we shall consider after looking
at the findings of the first set of surveys.
* Whilst there was a very high initial response to Udine’s pre-surveys, only 48 people completed post-surveys
Therefore for the pre and post analysis only the 52 pre-survey responses that come from the same school classes
will be used for the analysis.
4 | P a g e
2. Research Findings (part 1)
2.1 Baseline findings as a result of the pre-communication surveys
As highlighted in the introduction, there was been a disappointing level of interest and response to the
survey, though the survey was well received in six organisations. To that end the survey has produced a
useful set of findings to form a ‘baseline’ to measure the progress in gaining the knowledge on climate
change and energy efficiency of respondents and possible change in related attitudes and behaviour
following the information campaigns of local communities of Display Campaign. The overall findings
show a good knowledge of respondents on climate change and its causes and effects. The respondents
also show good awareness on the effects of buildings on the environment ranking wasteful energy use,
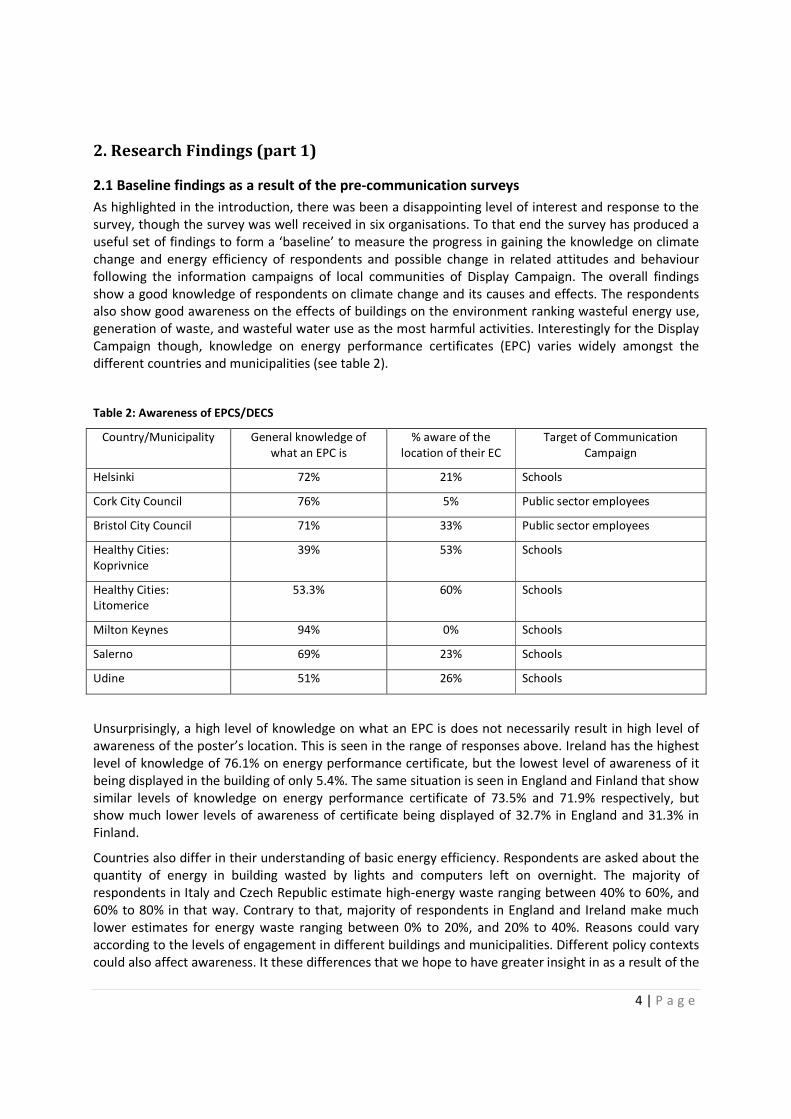
generation of waste, and wasteful water use as the most harmful activities. Interestingly for the Display
Campaign though, knowledge on energy performance certificates (EPC) varies widely amongst the
different countries and municipalities (see table 2).
Table 2: Awareness of EPCS/DECS
Country/Municipality General knowledge of
what an EPC is
% aware of the
location of their EC
Target of Communication
Campaign
Helsinki 72% 21% Schools
Cork City Council 76% 5% Public sector employees
Bristol City Council 71% 33% Public sector employees
Healthy Cities:
Koprivnice
39% 53% Schools
Healthy Cities:
Litomerice
53.3% 60% Schools
Milton Keynes 94% 0% Schools
Salerno 69% 23% Schools
Udine 51% 26% Schools
Unsurprisingly, a high level of knowledge on what an EPC is does not necessarily result in high level of
awareness of the poster’s location. This is seen in the range of responses above. Ireland has the highest
level of knowledge of 76.1% on energy performance certificate, but the lowest level of awareness of it
being displayed in the building of only 5.4%. The same situation is seen in England and Finland that show
similar levels of knowledge on energy performance certificate of 73.5% and 71.9% respectively, but
show much lower levels of awareness of certificate being displayed of 32.7% in England and 31.3% in
Finland.
Countries also differ in their understanding of basic energy efficiency. Respondents are asked about the
quantity of energy in building wasted by lights and computers left on overnight. The majority of
respondents in Italy and Czech Republic estimate high-energy waste ranging between 40% to 60%, and
60% to 80% in that way. Contrary to that, majority of respondents in England and Ireland make much
lower estimates for energy waste ranging between 0% to 20%, and 20% to 40%. Reasons could vary
according to the levels of engagement in different buildings and municipalities. Different policy contexts
could also affect awareness. It these differences that we hope to have greater insight in as a result of the

5 | P a g e
subsequent surveys and the results of the building analysis surveys we are conducting alongside this
research.
All countries show a good general knowledge on energy efficiency principles and possible energy savings
by ranking. Aside from Italy, the majority of local authorities view the small daily activities that individual
building users can have an affect on, for example, switching lights off and turning computers off
overnight, as being most effective. Simply displaying an energy performance certificate is ranked low
alongside working from home as being least effective. This is in many ways to be expected and would be
re-enforced by the Display Campaign itself which encourages communication campaigns and public
engagement alongside merely producing an energy certificate. These initial findings actually stand in
contrast to research from America which has found a large degree of ignorance about effective energy
efficiency behaviours and also scepticism that small individual actions make a difference.1 Encouragingly
also, it is these very actions that the communication campaigns are trying encourage.
Finally, the level of information / training on energy efficiency the respondents have received from their
employer is not high (ranging between 26.9% for Ireland to 57.7% for Finland) but this is as expected –
this survey was meant to be distributed before engagement and communication activities have taken
place. The hope is that as result of this campaign attitudes and behaviours will improve further still as a
result of these campaigns. How effective the post-communication surveys are in detecting these
changes will depend largely on how well the partners distribute them.
2.2 The impact of the communication campaigns on building users (post-communication
surveys)
Five municipalities conducted post-communication surveys; Cork though has been discounted due to
only having four completed questionnaires. This is deemed too low a sample to draw any meaningful
data from. The four municipalities who managed to conduct pre and post surveys were:
− Milton Keynes (England)
− Helsinki (Finland)
− Salerno (Italy)
− Udine (Italy)
Findings are presented for the four municipalities under the following three themes contained in the
survey:
1. Impact on understanding of Climate Change
2. Understanding how buildings affect the environment
3. Awareness of energy performance certificates (i.e Display Posters)
1 Attari et al (2010), Public Perceptions of Energy and Consumption and Savings.
www.pnas.org/cgi/doi/10.1073/pnas.1001509107

6 | P a g e
2.2.1 Impact on understanding of climate change
Milton Keynes − Increased number of people ‘unsure’ as to the causes of climate change. Those
agreeing it is due to human behaviour has decreased with an increase in those
unsure.
− The number of those who believe climate is changing due to natural changes has
remained the same, the number of those unsure has slightly increased.
− Concern about climate change has increased from 56.3% to 75%, while the number
of those being unsure has dropped to none.
Helsinki − Still general agreement that the climate is changing and this change is due to
human behaviour.
− However, the number of respondents of both surveys who disagree and agree that
climate change is caused by natural changes is almost equal.
− The number of respondents being fairly concerned about climate change has
increased from 43.8% to 63.6%.
Salerno − The majority of respondents of both pre and post-surveys agree and strongly agree
that the climate is changing, and that this change is due to mainly due to human
behaviour.
− The number of respondents being fairly concerned about climate change has
slightly increased, while the number of these being unsure about it has slightly
decreased.
− The majority of respondents of both surveys believe that climate change will have a
strong impacts on all aspects of their lives.
Udine − The number of respondents who strongly agree that the climate is changing has
increased, as well as the number of those believing that this is due to human
behaviour.
− Those who strongly disagree that climate is changing due to natural changes has
increased.
− Concerned about climate change has increased by 50%.
− The number of respondents being unsure about effects on all areas has decreased,
while the number of them believing that climate change will have large impacts on
all areas except weather has increased.
2.2.2 Buildings and the environment (How building affects the environment )
Milton Keynes − There is small difference in percentages between pre and post surveys, where
energy use is ranked the highest – 75% in pre-survey, while post-survey ranks the
waste generation -68.8% the highest (nb 68% was the same as in the pre-survey)
− Both surveys rank waste generation (68.8% both), energy use (75% pre, and 56.3%
post-survey) and CO2 emissions (31.3% both) as the main effects the building has
on the environment.

7 | P a g e
Helsinki − Wasteful energy use and waste generation in both surveys are listed as the main
effects of building on the environment.
− However, there is difference in percentage between pre and post-surveys related
to energy use and waste generation, where energy use percentage has decreased
from 71.9% in pre-survey to 45.5% in post-survey, and waste generation
percentage has increased from 56.3% in pre-survey to 72.7% in post-survey.
Salerno − There is no big change in ranking wasted energy where both surveys have shown
that energy is wasted in ranges between 40 and 60%, 60 and 80% and above 80%.
− However, there is big difference between percentages of energy wasted in range
above 80%, where post-survey shows 42.3% and pre-survey only 19.7% of energy
wasted.
− There is significant increase in energy efficiency information/training received
where 86.8% respondents of post-survey positively responded comparing to only
31.7% of pre-survey answers.
Udine − Both surveys rank energy use (80% pre, and 75% post-survey), water use (58% pre,
and 50% post-survey) and waste generation (70% pre, and 35.4% post-survey) as
the main effects the building has on the environment.
− There is decrease in percentage for CO2 emissions from 34% to 18.8%, and the
increase in percentage for construction process from 22% to 35.4.
2.2.3 Awareness of DECs/DISPLAY posters
Country/Municipality General knowledge of
what an EPC is (POST)
% aware of the location
of their EC (POST)
Target of Communication
Campaign
Helsinki 100% (previously 72%) 82% (previously 21%) Schools
Milton Keynes 100% (previously 94%) 94% (previously 0%) Schools
Salerno 55% (previously 30%) 85% (previously 33 %) Schools
Udine 29% (37.3%) 4.3% (15.7%) Schools
2.2.4 Observations
From these small samples and pockets of interviews it is clear that there are no simple conclusions to be
drawn. No clear themes, certainly we are not seeing significant changes in any categories. Awareness of
the impacts buildings have on the environment centre around energy consumption and waste and
again, does not vary significantly between pre and post surveys.
Where there is a strong variation and pattern though is in the awareness of the energy certificates. In
Helsinki, Milton Keynes and Salerno there is a strong increased awareness of both what an energy
certificate is, and where it is located. This is good news for the Display Campaign. Udine appears to be
the exception and must be treated as such. Findings are based on two specific classes and there could
be some specific localized reason to those classes why this decrease in understanding has occurred.

8 | P a g e
3. Research Findings (2) Findings from building analysis surveys
This section presents some relevant findings from a series of statistical tests done on data that has been
gathered on a sample of buildings in the Display Campaign over the last few years (the survey is
attached as Appendix 2). Note – we refer to the phrase ‘average movement’:
AVERAGE MOVEMENT EXPLAINED
To identify which buildings have either improved their energy ratings or actually deteriorated during the
course of the Display® Campaign, a methodology was developed to assess the changes that have
occurred during the course of the Campaign. Each building’s energy rating label will be used to establish
its progress.
Average movement is a comparison between a buildings first Display poster rating and its last. This
approach provides a picture of the overall trajectory of a building over time. It also shows the most
recent information with respect to changes in building performance. To do this a core metric was
designed to represent the effectiveness of efforts to improve building energy performance, based on
the progression of display energy ratings for a given building over time. In order to capture the overall
success, irrespective of when changes were made, the metric was based on the entire period of
available data. Ratings are provided between A to G, where A is the highest possible rating achieved by
the building and G lowest. Ratings are given a numerical value in ascending order with incremental
value of 1 starting from lowest building rating (G). Using this methodology, for each building with two
or more certificates issued, the earliest and latest energy ratings are determined. The difference
between these ratings is calculated to indicate the magnitude of change. ( )Earliestlatest −=∆ The
resultant metric, Δ represents the change in rating experienced by the building. Negative values
indicate deterioration, positive values indicate improvement. An analysis of these values forms the basis
of the remainder of this report. For example if the earliest certificate is of higher rating e.g. “A”
(numeric value 7) in year 2001 and latest rating is in year 2008 and is “E” (numeric value 3). The
movement in rating calculated will be -4 (Latest-Earliest) and if the case is vice versa it will be +4.
Negative movement in rating implies deterioration over time.
3.1 Impact of Display Posters on Building Performance
The first question then is what effect publicly displaying a poster has on a buildings performance. To do
this is a simple test is to see whether the buildings that have ‘publicly displayed’ their posters perform
better than those buildings that have do not. Calculating and comparing the average movement of the
two groups can do this. Over 75% of the buildings we surveyed physically displayed their posters. This
suggests the display of the poster is quite common but it has to be taken into account that energy
managers in a building that has the poster displayed might have higher tendency to complete the
survey. The result shows that the average movement of the buildings that have display of poster is
higher than those that have no display of poster (see figure 1).

9 | P a g e
Figure 1: Impact of showing DIsplay on movement.
In total 271 posters have been displayed with the earliest display started in 2006, and A3 size poster is
the most popular size. The majority (86%) of the posters were displayed at the entrance of the buildings
and 9.3% outside the buildings; other places include teacher’s room, classroom and caretaker’s room.
As well as where the poster is shown, who is shown the poster is important. Alongside displaying the
certificates in prominent positions such as building entrances, our research found that, aside from being
on public display the posters were mainly shown to the leaders of the organizations and the caretakers.
Besides energy managers and head of departments, other people that have been shown with the poster
include users of the building, governors and the public. This is significant because it these people who
ultimately make the decisions about buildings and are in a position to affect change. There may be little
a school child; teacher or local authority employee can do to affect change in a building beyond small-
scale actions. In contrast the energy manager, head of department or senior figures control financial
investment, energy budgets and carry responsibility for the public image of the buildings. Engaging and
communicating with these individuals should be a vital part of any communication programme and in
our final report (D: 2.2.2.) we show that financial investment and technical improvements are as much
as behaviour change as switching off lights and PC when not in use.
3.2 The role of communication campaigns.
61% of all the buildings we surveyed have carried out communication campaigns. The first question is
then to find out whether buildings with communication campaigns perform better than those that have
not. This is done by calculating and comparing the average movement of the two groups of buildings.
Our result shows that the average movement of the buildings with communication campaign is higher
than those buildings that have no communication campaign (see figure 2).

10 | P a g e
Figure 2: Average movement vs communication campaign
The most popular activities that municipalities conduct as part of their campaigns are: conducting
energy awareness training for staff and building users, organizing local media campaigns and using
promotional stickers. We the conducted a test to see which aspects of communication campaign may be
most effective in terms of leading to the highest average movement (see figure 3). We conclude that the
most effective activities a municipality can undertake are:
• Organize a local media campaign;
• Train 'energy champions' (people with specific responsibilities for energy in a department)
• Attended a 'national users club event' (Cyber Display Campaign events bringing together key
local stakeholders);
• Using promotional stickers.
This suggests these four types of communication campaign are more effective in the improvement of
building energy performance. Monitoring behaviour change also demonstrates quite a high average
movements. On the other hand the most popular communication campaign, conducted energy
awareness training of staff and building users, have the second lowest average movements.

11 | P a g e
Figure 3: Average movement vs communication campaign
4. Conclusion: Towards Class A?
One of the underlying hopes of the Display Campaign is that communication campaigns can lead to the
behaviour change of individuals in buildings, which in turn can lead to a reduction in the energy
consumption of buildings. This will be seen by an improvement in a buildings poster rating and more
buildings becoming ‘Class A’. This deliverable is one part of a suite of deliverables attempting to tackle
this complex question. Sadly, the limited response and use of pre-and post communication surveys has
to a large extent hindered what is possible to say with any real conviction. However, the evidence
presented to us by the four municipalities who did conduct the surveys shows consistently that running
creative engagement campaigns in schools leads to an increase in awareness in what an energy
certificate is, and where they are located. This is a promising start.
Furthermore, presenting the relevant findings from our second survey, to which we received an
excellent response, provides encouraging empirical and quantitative evidence to support the claim that
producing and displaying Display Posters, in conjunction with organized communication activities does
lead to an improvement in a buildings energy rating and move buildings a step closer ‘towards class a’.

12 | P a g e
Appendix 1: Overview of Key Findings of pre-communication surveys
The first half of the survey (see Appendix 2) aimed to capture levels of individual awareness and concern
about climate change, awareness of respondents about building’s effects on the environment, and
individual knowledge on energy performance certificate and its display in the building. There are lots of
national and international surveys to compare such findings to. They largely centre on awareness of
climate change; the cause of climate change, spatial and temporal impact of climate change and concern
about the impacts of climate change.2 For example, findings in the report ’Europeans’ attitudes towards
climate change’ (ECDG Communication, 2008) show that majority of people in all countries3 analysed
here believe that a climate change is a very serious problem. This coincides with our findings for the
concern about impact of climate change. This report also investigates the level of information about
climate change, its consequences and causes showing that our countries are mainly well informed about
both causes and consequences of climate change. This coincides with our findings outlined below.
All countries surveyed show very similar findings with regards to climate change awareness and concern
– all agreeing (and strongly agreeing) that climate is changing (see Table 2). They also show similar
findings in agreeing (and strongly agreeing) that climate change is a result of human behaviour.
However, the situation with the responses to the question whether climate is changing due to natural
changes is different. Here, only the respondents from Italy strongly disagree with significantly higher
(29.6%) percentage than all other countries (that have small percentages) that climate is changing due
to natural changes. However, similar number of respondents from Italy disagree (25.4%) and are unsure
(23.7%) about natural causes of climate change. Finland shows the highest number of people (36.7%)
disagreeing about natural changes causing the climate change of all countries, however it is similar to
number of those who agree (33.3%). England and Ireland show very similar figures for all options, with
the highest figures for respondents who agree and are unsure, and much smaller figures for other
options.
Table 2: Q4.3 If you agree, is climate change due to natural changes
Countries Strongly disagree Disagree Unsure Agree Strongly agree
Czech Republic 7% 25.2% 35.2% 23.5% 9.1%
England 5% 12.9% 37.9% 41.4% 2.9%
Finland 3.3% 36.7% 16.7% 33.3% 10%
Ireland 3% 13.3% 36.9% 42.9% 3.9%
Italy 29.6% 25.4% 23.7% 15.7% 5.6%
All countries demonstrate a good level of concern for the impact of climate change in their respective
countries. However the findings between countries vary. England, Ireland and Italy show the highest
2 See for example Lorenzoni, I and Hulme, M. ‘Believing is seeing: laypeople’s views of future socio-economic and
climate change in England and in Italy, Public Understanding of Science, 18 (2009), and/or
EC Directorate General for Communication, ’Europeans’ attitudes towards climate change’, Special Eurobarometer
300 / Wave 69.2 – TNS opinion & social, (2008). 3 UK data from the report were compared with data for England collected from pre-surveys.

13 | P a g e
numbers of respondents who are fairly concerned and very concerned, with much smaller numbers for
other options. Czech Republic shows similar number of respondents who are not very concerned (35%),
and those who are fairly concerned (32.1%), and also shows similar numbers for those being not all
concerned (10.7%), unsure (12%) and very concerned (10.3%). In Finland the majority of respondents
(43.8%) are fairly concerned, while similar number of respondents is very concerned (25%) and not very
concerned (21.9%).
Table 3: Q5 Concern about the impact of climate change
Countries Not at all
concerned
Not very
concerned
Unsure Fairly
concerned
Very
concerned
Czech Republic 10.7% 35% 12% 32.1% 10.3%
England 4.1% 8.2% 7.5% 49.7% 30.6%
Finland 3.1% 21.9% 6.3% 43.8% 25%
Ireland 1.8% 8.1% 10.8% 59% 20.3%
Italy 0.9% 4.3% 7.9% 52.2% 34.7%

14 | P a g e
Appendix 2: Display Campaign Pre & Post-Survey
Part 1: About you
1) About you.
Yes No
Are you a visitor?
Are you an employee?
2) Please tell us what building you are in?
Name
Type
City
Country
3) How often do you use the building?
Please Check
Occasionally, once a week or less
Frequently, more than once a week
Regularly
Part 2: Awareness of effects of buildings on climate change
4 Climate Change
Strongly
disagree
Disagree Unsure Agree Strongly agree
Do you agree that the
world’s climate is changing?
If you agree, is climate
change a result of human

15 | P a g e
behaviour?
If you agree, is climate
change a result of natural
changes?
5 How concerned are you about the impact of climate change in your country?
Not all
Concerned
Not very
Concerned
Unsure Fairly
Concerned
Very
concerned
6 In the future, do you think climate change will affect any of the following?
No Impact A little
impact
Unsure Some impact A large impact
Your holidays
Your health
Your safety
and security
The economy
in your
country
The weather
in your
country
Q7 How does this building affect the environment?
Environmental impact Please tick
Wasteful water use
Wasteful energy use

16 | P a g e
Carbon Dioxide (CO2) emissions
The construction process
Habitat loss
The generation of waste
Groundwater effects
Other?
Q8 Do you know what an ‘energy performance certificate’ is?
• Yes
• No
Q9 Are you aware of an energy performance certificate being displayed anywhere in this building?
• Yes
• No
• If yes, where is it located? _____________________
Part 3: Basic energy efficiency principles, i.e.
What kind of actions make a difference?
Q1. How much energy in buildings is wasted by lights and computers left on overnight in rooms
when no-one is in them: Is it . . .
Please tick
<20%
20-40%
40-60%
60-80%
>80%
17 | P a g e
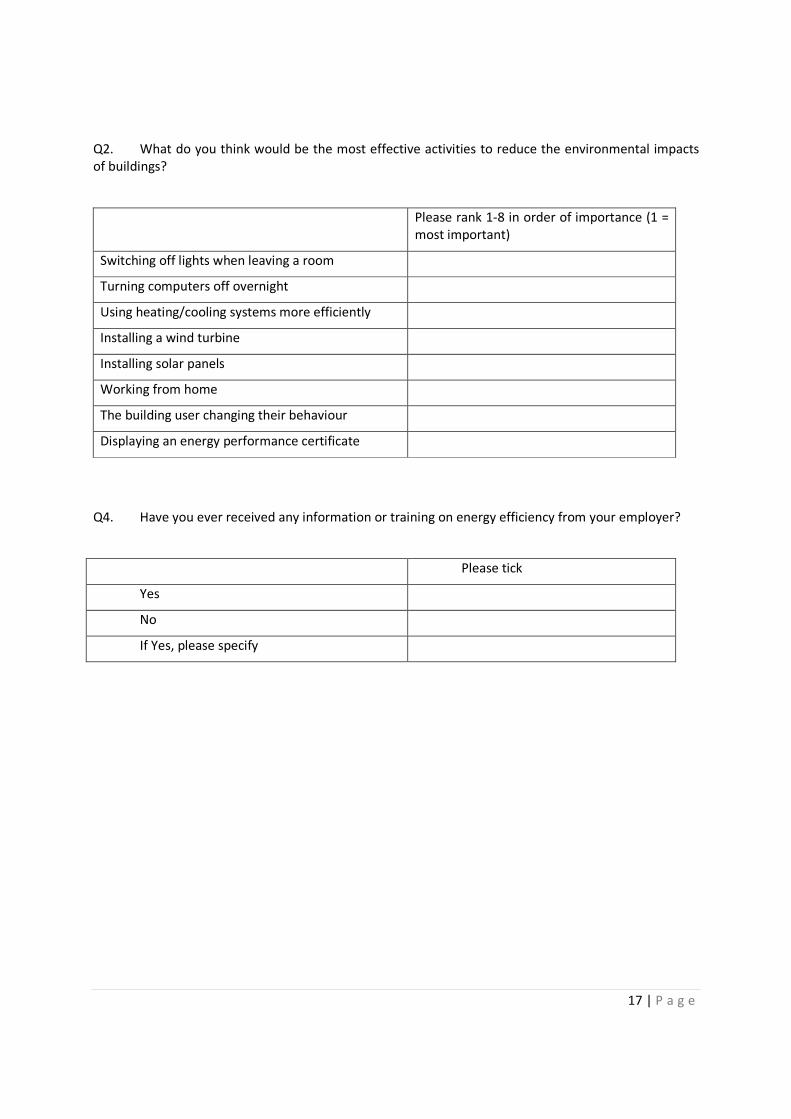
Q2. What do you think would be the most effective activities to reduce the environmental impacts
of buildings?
Please rank 1-8 in order of importance (1 =
most important)
Switching off lights when leaving a room
Turning computers off overnight
Using heating/cooling systems more efficiently
Installing a wind turbine
Installing solar panels
Working from home
The building user changing their behaviour
Displaying an energy performance certificate
Q4. Have you ever received any information or training on energy efficiency from your employer?
Please tick
Yes
No
If Yes, please specify

18 | P a g e
Appendix 2: Cyber Display Building Energy Analysis Survey
1. Building Details
* 1. Complete building details Please enter the provided Building Identification (ID) Building Name: Address:
City/Town: Country:
2. Please tick the best estimated date of construction of the building
cdefg
cdefg
cdefg
Before 1900
1900 to 1920
1921 to 1940
cdefg
cdefg
cdefg
1941 to 1960
1961 to 1980
1981 to 2000
cdefg after 2000