commonwealth of virginia's strategic highway safety plan
TRANSCRIPT
Commonwealth of Virginia’s Strategic Highway Safety Plan
2006-2010
Prepared by:
Virginia’s Surface Transportation Safety Executive Committee
Thank You Safety Partners!! This Strategic Highway Safety Plan presents the combined efforts of Virginia’s safety partners to improve transportation safety in the commonwealth. The Virginia Department of Transportation would like to thank the following organizations for their participation in creating this plan. The Surface Transportation Safety Executive Committee extends a special thank you to the many individuals who took the time to comment and shape the future of transportation safety in Virginia. “Together we will reduce injuries and deaths from crashes in Virginia” AAA Mid-Atlantic Alliance for Community Choice in Transportation (ACCT) American Traffic Safety Services Association (ATSSA) Bike Walk Virginia Commonwealth Transportation Board (CTB) DriveSmart Virginia Eastern Virginia Medical School (EVMS) Federal Highway Administration (FHWA) Federal Motor Carrier Safety Administration (FMCSA) Hampton Roads Planning District Commission (HRPDC) Harrisonburg Transportation Safety Commission Inova Fairfax Hospital Mothers Against Drunk Driving (MADD) National Highway Transportation Safety Administration (NHTSA) Old Dominion University (ODU) Prince William County Public Schools Richmond Highway Safety Commission (RHSC) Stafford County Transportation Commission Supreme Court of Virginia Thomas Jefferson Planning District Commission (TJPDC) Traffic Records Coordinating Committee (TRCC) Transportation Safety Board (TSB) Virginia Alcohol Safety Action Program (VA SAP) Virginal Alcoholic Beverage Control Board (VA ABC) Virginia Association of Chiefs of Police (VACP) Virginia Commonwealth University (VCU) Virginia Department for the Aging (VDA) Virginia Department of Education (DOE) Virginia Department of Health (VDH) Virginia Department of Motor Vehicles (DMV) Virginia Department of Rail and Public Transportation (VDRPT) Virginia Safe Kids Virginia Sheriffs’ Association Virginia State Police (VSP) Virginia Tech Virginia Transportation Research Council (VTRC) Virginia Trucking Association VTA Virginia’s Smart, Safe, and Sober Partnership Washington Regional Alcohol Program (WRAP)
Virginia’s Strategic Highway Safety Plan
TABLE OF CONTENTS
Secretary of Transportation’s Foreword...................................................................................... i
Executive Summary ...................................................................................................................... ii
INTRODUCTION ..................................................................................................1
Background.................................................................................................................................... 1
Transportation Safety as a Health Issue ..................................................................................... 1
Formation of the Virginia Surface Transportation Safety Executive Committee.................... 3
Virginia’s Mission Statement........................................................................................................ 4
Virginia’s Vision Statement .......................................................................................................... 4
Virginia’s 2010 Goals .................................................................................................................... 4
Virginia’s Transportation Safety Emphasis Areas..................................................................... 4
Public Outreach ............................................................................................................................. 6
PLAN ELEMENTS ...............................................................................................7
Driver Behavior .............................................................................................................................. 7
Special Users ............................................................................................................................... 19
Pedestrian and Bicyclist Safety ................................................................................................. 25
Intersection Safety ...................................................................................................................... 29
Roadway Departures................................................................................................................... 34
Work Zone Safety ........................................................................................................................ 38
Traffic Records ............................................................................................................................ 42
Transportation Safety Planning ................................................................................................. 46
CONCLUSION....................................................................................................48
REFERENCES ...................................................................................................50
Appendix A-1 Surface Transportation Safety Executive Committee Members…………… A-1
Appendix A-2 Virginia's Transportation Safety Charter……………………………………….. A-2
Appendix B Safety Funding Source Matrix.................................................................................B
Virginia’s Strategic Highway Safety Plan
Virginia’s Strategic Highway Safety Plan i
Secretary of Transportation’s Foreword
I’m excited to present our Strategic Highway Safety Plan for Virginia’s future. Over the next five years, significant investments will be made in our transportation infrastructure, education of our youngest drivers, enforcement of our traffic laws, and measures to help us quickly react to incidents on our highways. This plan is an accumulation of the work of the Surface Transportation Safety Executive Committee. This committee was asked to examine and evaluate ways to improve our safety record on our streets and highways for all travelers. Under multi-secretariat direction, which also includes the Secretaries of Public Safety, Education, and Health and Human Resources, we will move forward together to combat one of Virginia’s top health issues. More than 900 people were killed in traffic crashes on Virginia’s roads last year and more than 76,000 were injured. Motor vehicle crashes affect our citizens, particularly our youth, more than any other disease. This plan addresses long-standing safety issues with a renewed cooperation among multiple government agencies and their private sector and non-profit counterparts. This plan also recognizes that transportation safety is a personal and shared responsibility for all of Virginia’s residents and visitors traveling on our roadways. I am proud to be the first Secretary of Transportation to sign into action, the Commonwealth’s first Strategic Highway Safety Plan. Please join me and Arrive Alive on Virginia’s highways and byways.
Pierce R. Homer Pierce R. Homer Secretary of Transportation
Executive Summary
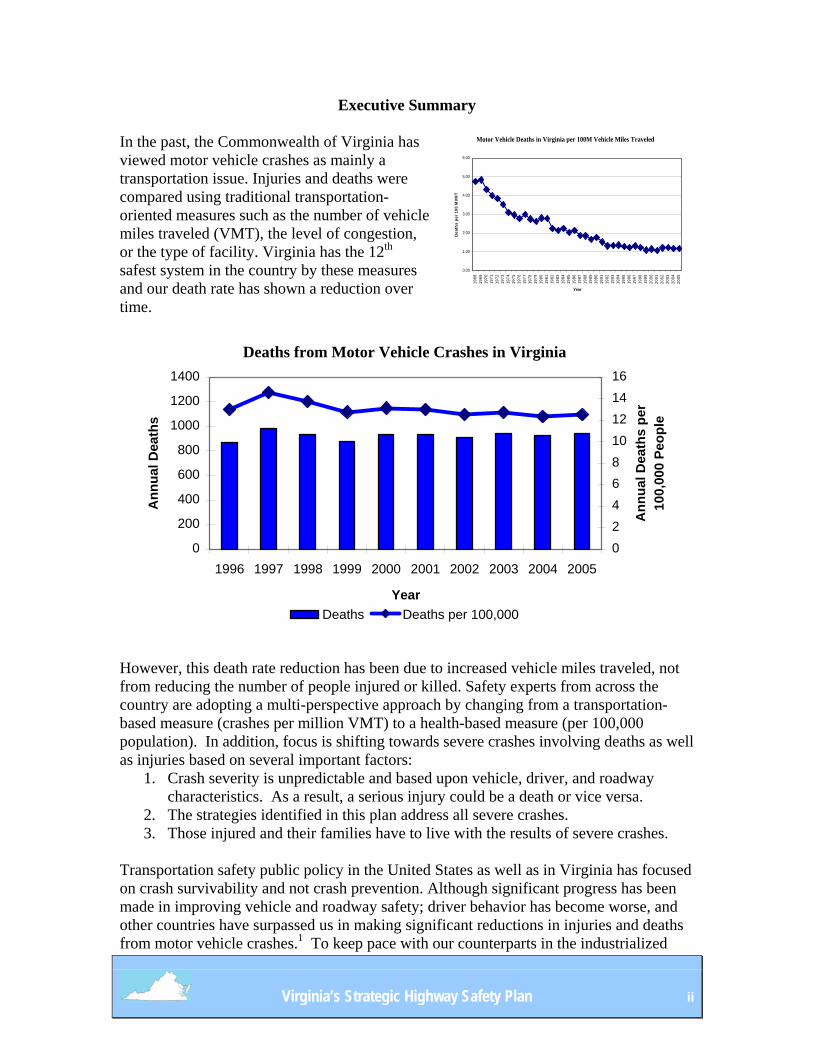
Motor Vehicle Deaths in Virginia per 100M Vehicle Miles Traveled
0.00
1.00
2.00
3.00
4.00
5.00
6.00
1968
1969
1970
1971
1972
1973
1974
1975
1976
1977
1978
1979
1980
1981
1982
1983
1984
1985
1986
1987
1988
1989
1990
1991
1992
1993
1994
1995
1996
1997
1998
1999
2000
2001
2002
2003
2004
2005
Year
Dea
ths
per 1
00 M
VMT
In the past, the Commonwealth of Virginia has viewed motor vehicle crashes as mainly a transportation issue. Injuries and deaths were compared using traditional transportation-oriented measures such as the number of vehicle miles traveled (VMT), the level of congestion, or the type of facility. Virginia has the 12th safest system in the country by these measures and our death rate has shown a reduction over time.
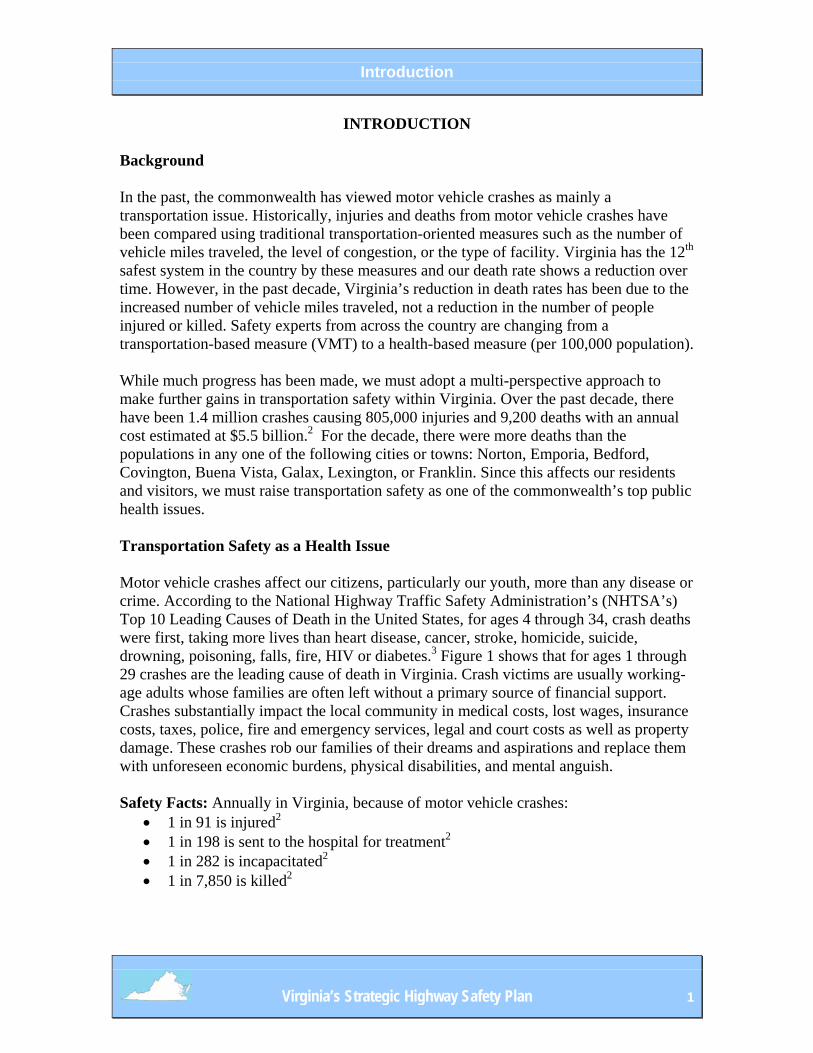
Deaths from Motor Vehicle Crashes in Virginia
0
200
400
600
800
1000
1200
1400
1996 1997 1998 1999 2000 2001 2002 2003 2004 2005
Year
Ann
ual D
eath
s
0246810121416
Ann
ual D
eath
s pe
r 10
0,00
0 Pe
ople
Deaths Deaths per 100,000
However, this death rate reduction has been due to increased vehicle miles traveled, not from reducing the number of people injured or killed. Safety experts from across the country are adopting a multi-perspective approach by changing from a transportation-based measure (crashes per million VMT) to a health-based measure (per 100,000 population). In addition, focus is shifting towards severe crashes involving deaths as well as injuries based on several important factors:
1. Crash severity is unpredictable and based upon vehicle, driver, and roadway characteristics. As a result, a serious injury could be a death or vice versa.
2. The strategies identified in this plan address all severe crashes. 3. Those injured and their families have to live with the results of severe crashes.
Transportation safety public policy in the United States as well as in Virginia has focused on crash survivability and not crash prevention. Although significant progress has been made in improving vehicle and roadway safety; driver behavior has become worse, and other countries have surpassed us in making significant reductions in injuries and deaths from motor vehicle crashes.1 To keep pace with our counterparts in the industrialized
Virginia’s Strategic Highway Safety Plan ii

Annual Injury and Deaths from Severe Crashes in Virginia
0
20,000
40,000
60,000
80,000
100,000
120,000
1996 1997 1998 1999 2000 2001 2002 2003 2004 2005
Year
Ann
ual I
njur
ies
and
Dea
ths
0
200
400
600
800
1000
1200
1400
Seve
re C
rash
Rat
e pe
r 10
0,00
0 Po
pula
tion
Injuries and Deaths Injury and Death Rate per 100,000 Population
world, focus must be shifted to correcting poor driver behavior and providing information about unexpected roadway and traffic conditions ahead. Intensified traffic law enforcement with focused education efforts, and strong adjudication is necessary to correct poor driver behavior. Engineering measures and vehicle safety improvements will continue to have long-term safety benefits as they take longer to deploy. This plan details all safety partner efforts to improve traffic safety in Virginia. It establishes a transportation safety charter and sets up realistic goals for reducing annual deaths by 100 and annual injuries by 4,000 from motor vehicle crashes statewide within the next five years. A multi-perspective approach is adopted to identify problems in three emphasis areas: human factors, environmental and fundamental. Countermeasures address these problems based on current research, intense discussions with safety partners, and experience. The top measures to reduce injuries and deaths in Virginia are identified as:
Raise public awareness and develop a safer driving culture. Focus on young drivers, aggressive drivers, impaired drivers and seat belt use through
legislation, education, enforcement, and adjudication. Improve intersection safety for all users in congested areas. Keep drivers on the roadway and minimize consequences if they depart. Incorporate transportation safety planning into all levels of government. Improve traffic records system to be more accurate and up to date.
With strong support from our safety partners, and Virginia citizens, we are confident that the implementation of this plan will bring transportation safety in Virginia to a new level and ultimately realize the goal of providing the safest transportation system in the nation.
Virginia’s Strategic Highway Safety Plan iii
Introduction
Virginia’s Strategic Highway Safety Plan 1
INTRODUCTION
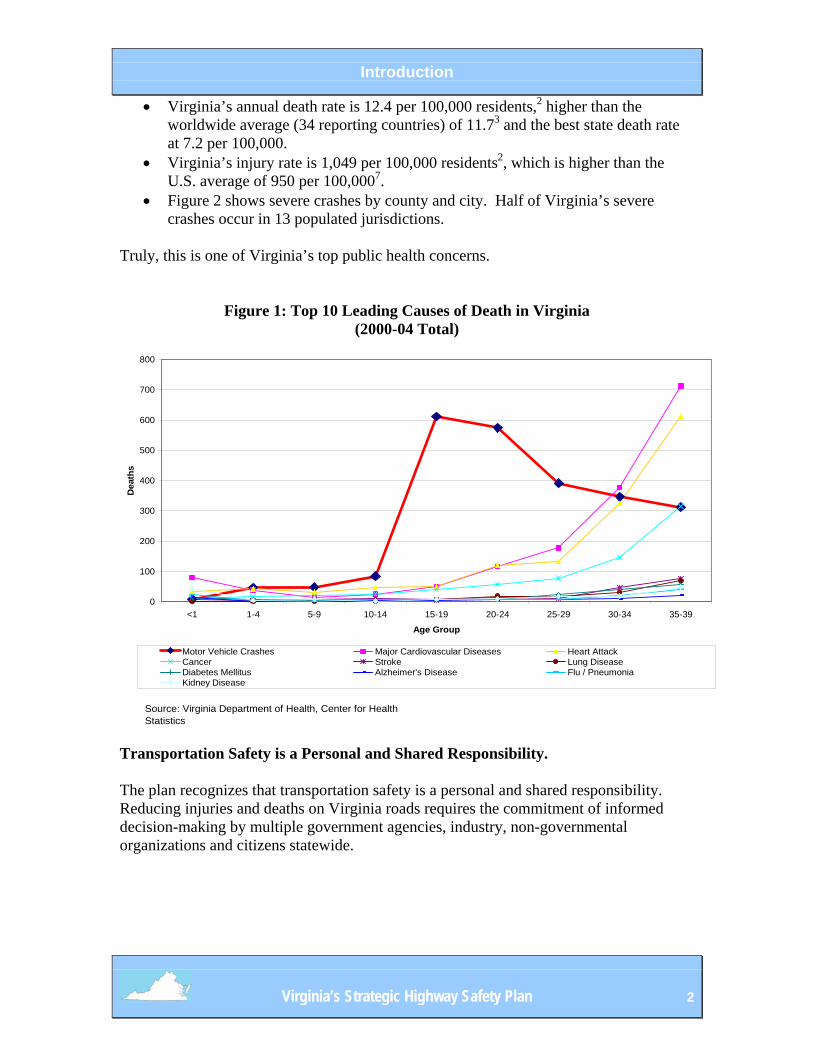
Background In the past, the commonwealth has viewed motor vehicle crashes as mainly a transportation issue. Historically, injuries and deaths from motor vehicle crashes have been compared using traditional transportation-oriented measures such as the number of vehicle miles traveled, the level of congestion, or the type of facility. Virginia has the 12th safest system in the country by these measures and our death rate shows a reduction over time. However, in the past decade, Virginia’s reduction in death rates has been due to the increased number of vehicle miles traveled, not a reduction in the number of people injured or killed. Safety experts from across the country are changing from a transportation-based measure (VMT) to a health-based measure (per 100,000 population). While much progress has been made, we must adopt a multi-perspective approach to make further gains in transportation safety within Virginia. Over the past decade, there have been 1.4 million crashes causing 805,000 injuries and 9,200 deaths with an annual cost estimated at $5.5 billion.2 For the decade, there were more deaths than the populations in any one of the following cities or towns: Norton, Emporia, Bedford, Covington, Buena Vista, Galax, Lexington, or Franklin. Since this affects our residents and visitors, we must raise transportation safety as one of the commonwealth’s top public health issues. Transportation Safety as a Health Issue Motor vehicle crashes affect our citizens, particularly our youth, more than any disease or crime. According to the National Highway Traffic Safety Administration’s (NHTSA’s) Top 10 Leading Causes of Death in the United States, for ages 4 through 34, crash deaths were first, taking more lives than heart disease, cancer, stroke, homicide, suicide, drowning, poisoning, falls, fire, HIV or diabetes.3 Figure 1 shows that for ages 1 through 29 crashes are the leading cause of death in Virginia. Crash victims are usually working-age adults whose families are often left without a primary source of financial support. Crashes substantially impact the local community in medical costs, lost wages, insurance costs, taxes, police, fire and emergency services, legal and court costs as well as property damage. These crashes rob our families of their dreams and aspirations and replace them with unforeseen economic burdens, physical disabilities, and mental anguish. Safety Facts: Annually in Virginia, because of motor vehicle crashes:
• 1 in 91 is injured2 • 1 in 198 is sent to the hospital for treatment2 • 1 in 282 is incapacitated2 • 1 in 7,850 is killed2
Introduction
• Virginia’s annual death rate is 12.4 per 100,000 residents,2 higher than the worldwide average (34 reporting countries) of 11.73 and the best state death rate at 7.2 per 100,000.
• Virginia’s injury rate is 1,049 per 100,000 residents2, which is higher than the U.S. average of 950 per 100,0007.
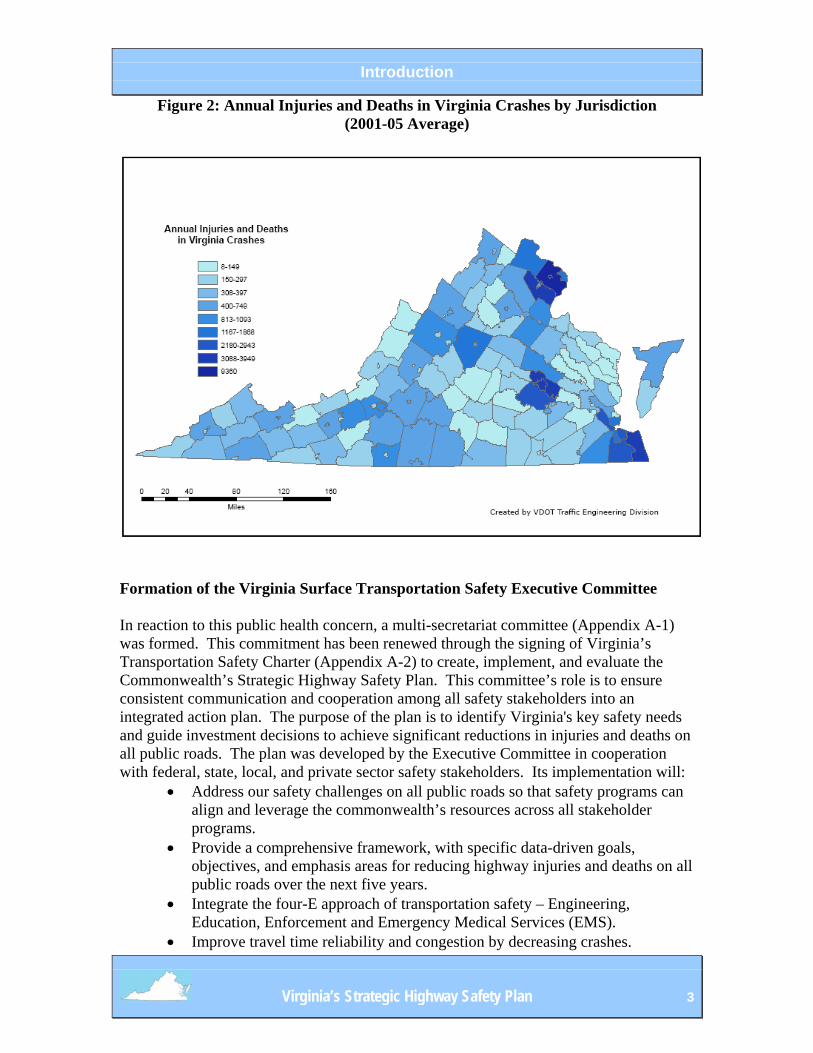
• Figure 2 shows severe crashes by county and city. Half of Virginia’s severe crashes occur in 13 populated jurisdictions.
Truly, this is one of Virginia’s top public health concerns.
Figure 1: Top 10 Leading Causes of Death in Virginia (2000-04 Total)
0
100
200
300
400
500
600
700
800
<1 1-4 5-9 10-14 15-19 20-24 25-29 30-34 35-39
Age Group
Dea
ths
Motor Vehicle Crashes Major Cardiovascular Diseases Heart AttackCancer Stroke Lung DiseaseDiabetes Mellitus Alzheimer's Disease Flu / PneumoniaKidney Disease
Source: Virginia Department of Health, Center for Health Statistics
Transportation Safety is a Personal and Shared Responsibility. The plan recognizes that transportation safety is a personal and shared responsibility. Reducing injuries and deaths on Virginia roads requires the commitment of informed decision-making by multiple government agencies, industry, non-governmental organizations and citizens statewide.
Virginia’s Strategic Highway Safety Plan 2
Introduction
Figure 2: Annual Injuries and Deaths in Virginia Crashes by Jurisdiction (2001-05 Average)
Formation of the Virginia Surface Transportation Safety Executive Committee In reaction to this public health concern, a multi-secretariat committee (Appendix A-1) was formed. This commitment has been renewed through the signing of Virginia’s Transportation Safety Charter (Appendix A-2) to create, implement, and evaluate the Commonwealth’s Strategic Highway Safety Plan. This committee’s role is to ensure consistent communication and cooperation among all safety stakeholders into an integrated action plan. The purpose of the plan is to identify Virginia's key safety needs and guide investment decisions to achieve significant reductions in injuries and deaths on all public roads. The plan was developed by the Executive Committee in cooperation with federal, state, local, and private sector safety stakeholders. Its implementation will:
• Address our safety challenges on all public roads so that safety programs can align and leverage the commonwealth’s resources across all stakeholder programs.
• Provide a comprehensive framework, with specific data-driven goals, objectives, and emphasis areas for reducing highway injuries and deaths on all public roads over the next five years.
• Integrate the four-E approach of transportation safety – Engineering, Education, Enforcement and Emergency Medical Services (EMS).
• Improve travel time reliability and congestion by decreasing crashes.
Virginia’s Strategic Highway Safety Plan 3
Introduction
Virginia’s Strategic Highway Safety Plan 4
Virginia’s Mission Statement To save lives and to reduce injuries from motor vehicle crashes in Virginia through the integration of education, enforcement, engineering, and emergency response actions. Virginia’s Vision Statement
To make Virginia’s surface transportation system the safest in the nation by 2025. Virginia’s 2010 Goals To reduce from 2005 levels, the annual number of injuries and deaths due to motor vehicle crashes in Virginia by 100 deaths and 4,000 injuries by 2010. These goals are based on implementation of many strategies identified in this plan. Many of the public policy strategies outlined in this plan are necessary to successfully meet these ambitious goals.
Virginia’s Transportation Safety Emphasis Areas Providing the most efficient and safest surface transportation facilities is of critical importance. The primary performance measures for transportation safety are reductions in annual injuries and deaths that occur statewide. To enhance and ensure that Virginia’s highway facilities are among the safest in the country, the committee selected three emphasis areas to direct our safety programs. The following emphasis areas provide the substance of the Strategic Highway Safety Plan: Human Factors
• Driver behavior • Special users • Pedestrian and bicyclist safety
Fundamental Emphasis Area
• Traffic records • Transportation safety planning
Environmental • Intersection safety • Roadway departures • Work zone safety • Pedestrian and bicycle safety
The plan’s elements were developed using Virginia vehicle crash data from 2001 to 2005. Figures 3 and 4 show a relative comparison between the different crash factors identified in the plan. However, these factors are not mutually exclusive and may have varying degrees of overlap.
Introduction
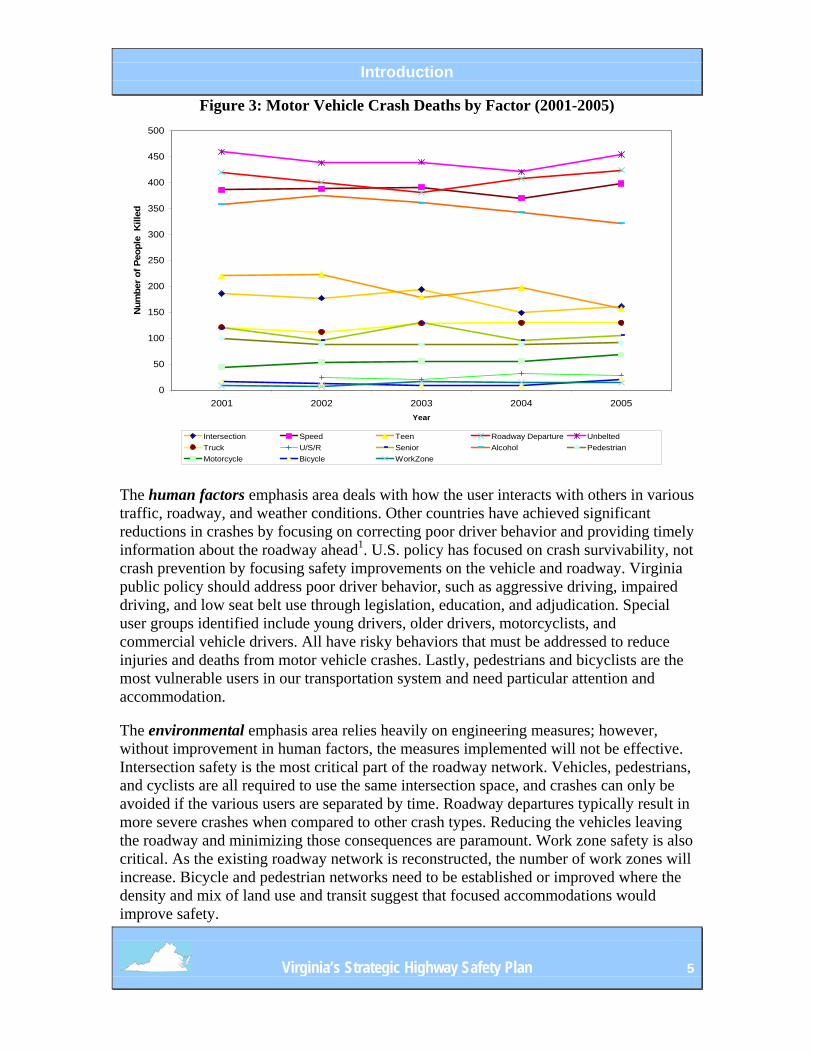
Figure 3: Motor Vehicle Crash Deaths by Factor (2001-2005)
0
50
100
150
200
250
300
350
400
450
500
2001 2002 2003 2004 2005Year
Num
ber o
f Peo
ple
Kill
ed
Intersection Speed Teen Roadway Departure UnbeltedTruck U/S/R Senior Alcohol PedestrianMotorcycle Bicycle WorkZone
The human factors emphasis area deals with how the user interacts with others in various traffic, roadway, and weather conditions. Other countries have achieved significant reductions in crashes by focusing on correcting poor driver behavior and providing timely information about the roadway ahead1. U.S. policy has focused on crash survivability, not crash prevention by focusing safety improvements on the vehicle and roadway. Virginia public policy should address poor driver behavior, such as aggressive driving, impaired driving, and low seat belt use through legislation, education, and adjudication. Special user groups identified include young drivers, older drivers, motorcyclists, and commercial vehicle drivers. All have risky behaviors that must be addressed to reduce injuries and deaths from motor vehicle crashes. Lastly, pedestrians and bicyclists are the most vulnerable users in our transportation system and need particular attention and accommodation. The environmental emphasis area relies heavily on engineering measures; however, without improvement in human factors, the measures implemented will not be effective. Intersection safety is the most critical part of the roadway network. Vehicles, pedestrians, and cyclists are all required to use the same intersection space, and crashes can only be avoided if the various users are separated by time. Roadway departures typically result in more severe crashes when compared to other crash types. Reducing the vehicles leaving the roadway and minimizing those consequences are paramount. Work zone safety is also critical. As the existing roadway network is reconstructed, the number of work zones will increase. Bicycle and pedestrian networks need to be established or improved where the density and mix of land use and transit suggest that focused accommodations would improve safety.
Virginia’s Strategic Highway Safety Plan 5
Introduction
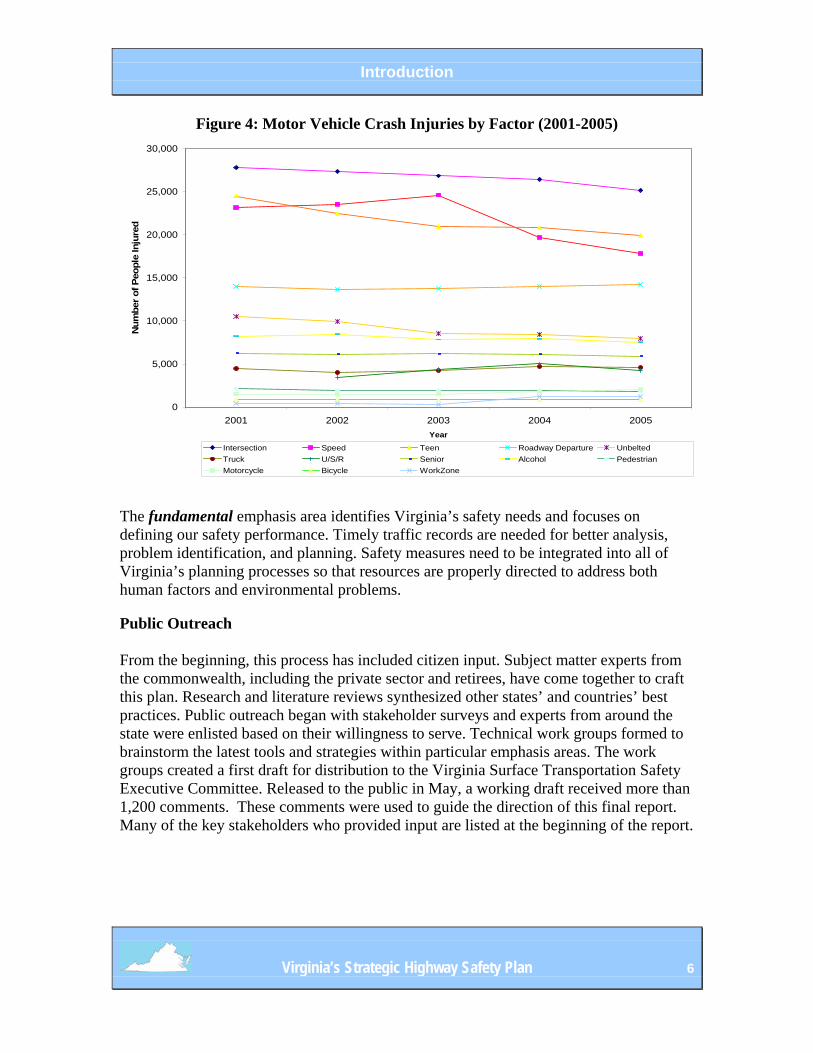
Figure 4: Motor Vehicle Crash Injuries by Factor (2001-2005)
0
5,000
10,000
15,000
20,000
25,000
30,000
2001 2002 2003 2004 2005Year
Num
ber o
f Peo
ple
Inju
red
Intersection Speed Teen Roadway Departure UnbeltedTruck U/S/R Senior Alcohol PedestrianMotorcycle Bicycle WorkZone
The fundamental emphasis area identifies Virginia’s safety needs and focuses on defining our safety performance. Timely traffic records are needed for better analysis, problem identification, and planning. Safety measures need to be integrated into all of Virginia’s planning processes so that resources are properly directed to address both human factors and environmental problems. Public Outreach From the beginning, this process has included citizen input. Subject matter experts from the commonwealth, including the private sector and retirees, have come together to craft this plan. Research and literature reviews synthesized other states’ and countries’ best practices. Public outreach began with stakeholder surveys and experts from around the state were enlisted based on their willingness to serve. Technical work groups formed to brainstorm the latest tools and strategies within particular emphasis areas. The work groups created a first draft for distribution to the Virginia Surface Transportation Safety Executive Committee. Released to the public in May, a working draft received more than 1,200 comments. These comments were used to guide the direction of this final report. Many of the key stakeholders who provided input are listed at the beginning of the report.
Virginia’s Strategic Highway Safety Plan 6
Plan Elements
Virginia’s Strategic Highway Safety Plan 7
PLAN ELEMENTS
Plan elements will be discussed by emphasis area (human factors, environmental, and fundamental). Each element has the following sections: problem identification, injuries and deaths targeted, major strategies, and challenges. For each strategy, the responsible agency is provided in parenthesis. A list of acronyms can be found in the beginning of the report.
Human Factors Emphasis Area: Driver Behavior
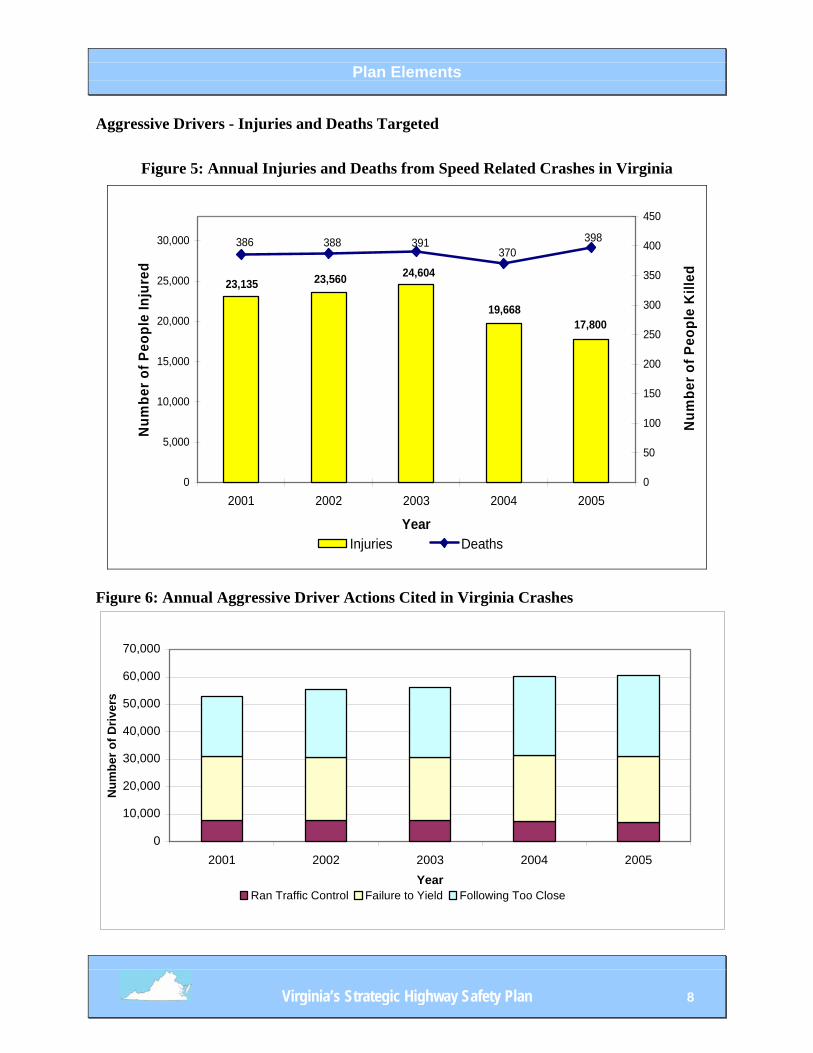
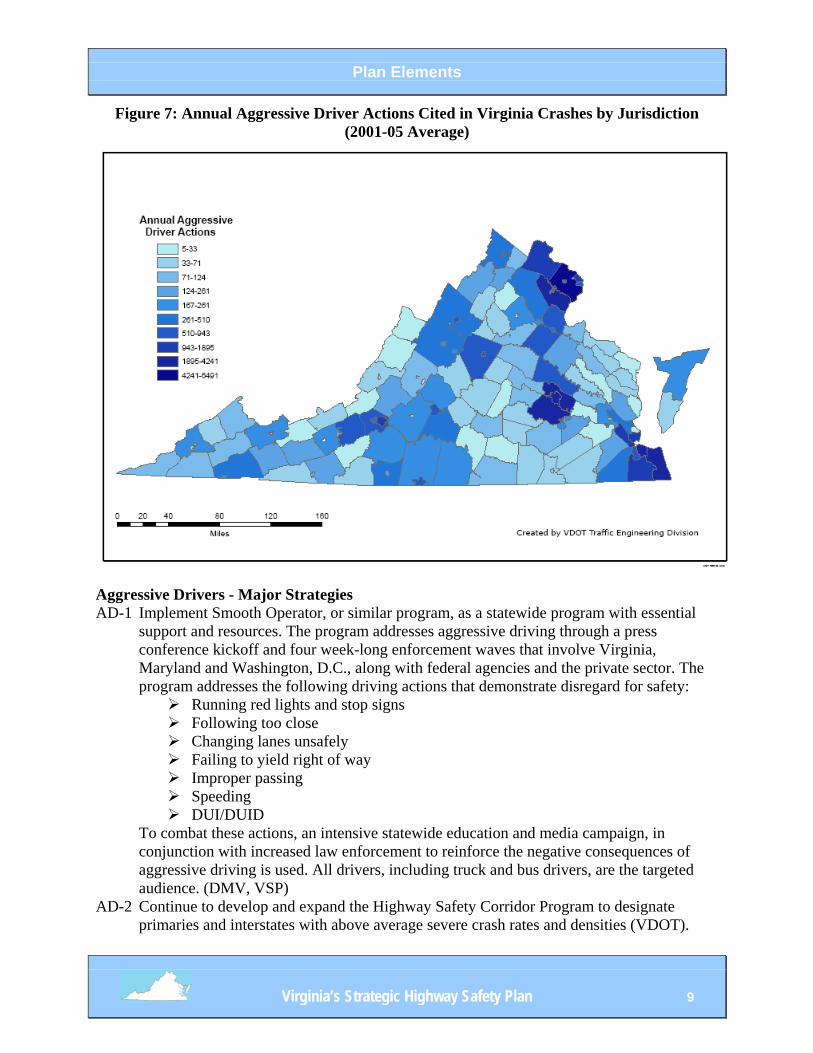
Aggressive Drivers - Problem Identification Aggressive driving is increasing in seriousness. In an average year, 41 percent of deaths (387) and 28 percent of injuries (21,700) involved speeding in Virginia (Figure 5). Seven-thousand six-hundred drivers were cited for following too close, 23,400 were cited for failure to yield and 26,000 drivers were cited for running traffic control (Figure 6).7 The National Highway Traffic Safety Administration (NHTSA) defines aggressive driving as the operation of a motor vehicle in a manner which endangers or is likely to endanger persons or property.8 According to AAA surveys8, both drivers and law enforcement perceive that aggressive driving is becoming more frequent. Lack of responsible behavior, lack of adequate enforcement resources to address poor driver behavior; and increased congestion have all contributed to this increase. Figure 7 shows the jurisdictional distribution of annual aggressive driver actions cited in Virginia crashes. The top 20 jurisdictions comprise nearly 70 percent of the annual aggressive driving actions. A wide range of views exist among judges in whether reckless driving laws are sufficient or if there is a need for the existing aggressive driving legislation. Adjudication of aggressive driving charges often results in reckless driving-type sentencing, thereby minimizing the stigma of aggressive driving to the public and media. Also, manufacturers’ marketing of high-performance vehicles often glamorizes speed and fails to note the danger or illegality of behavior depicted in the advertisements. What the consumer sees on television is often not legal on public roads anywhere in the country.
Plan Elements
Aggressive Drivers - Injuries and Deaths Targeted
Figure 5: Annual Injuries and Deaths from Speed Related Crashes in Virginia
23,135 23,560 24,604
19,66817,800
386 388 391370
398
0
5,000
10,000
15,000
20,000
25,000
30,000
2001 2002 2003 2004 2005
Year
Num
ber o
f Peo
ple
Inju
red
0
50
100
150
200
250
300
350
400
450
Num
ber o
f Peo
ple
Kill
ed
Injuries Deaths
Figure 6: Annual Aggressive Driver Actions Cited in Virginia Crashes
0
10,000
20,000
30,000
40,000
50,000
60,000
70,000
2001 2002 2003 2004 2005Year
Num
ber o
f Driv
ers
Ran Traffic Control Failure to Yield Following Too Close
Virginia’s Strategic Highway Safety Plan 8
Plan Elements
Figure 7: Annual Aggressive Driver Actions Cited in Virginia Crashes by Jurisdiction (2001-05 Average)
Aggressive Drivers - Major Strategies AD-1 Implement Smooth Operator, or similar program, as a statewide program with essential
support and resources. The program addresses aggressive driving through a press conference kickoff and four week-long enforcement waves that involve Virginia, Maryland and Washington, D.C., along with federal agencies and the private sector. The program addresses the following driving actions that demonstrate disregard for safety:
Running red lights and stop signs Following too close Changing lanes unsafely Failing to yield right of way Improper passing Speeding DUI/DUID
To combat these actions, an intensive statewide education and media campaign, in conjunction with increased law enforcement to reinforce the negative consequences of aggressive driving is used. All drivers, including truck and bus drivers, are the targeted audience. (DMV, VSP)
AD-2 Continue to develop and expand the Highway Safety Corridor Program to designate primaries and interstates with above average severe crash rates and densities (VDOT).
Virginia’s Strategic Highway Safety Plan 9
Plan Elements
AD-3 Address aggressive driving in the commonwealth through increasing the number of targeted driver improvement programs and other education programs. Educate the public about ways to prevent events that trigger aggressive driving acts, including the development of anger management skills. (DOE, DMV, VASAP)
AD-4 Increase public awareness of aggressive driving behaviors and their destructive consequences around automobiles, trucks and buses and in work zones. (DMV)
AD-5 Work with the General Assembly to adopt the use of advanced tools and techniques to support enforcement efforts. (VSP)
AD-6 Create a safety social culture that stigmatizes aggressive driving as a socially unacceptable behavior through public awareness, increased law enforcement, stiffer penalties for lawbreakers and behavioral intervention. (DMV)
AD-7 Implement appropriate timing of traffic signal devices, progression, and the installation of signal systems that smooth traffic flows and minimize stops and starts. (VDOT)
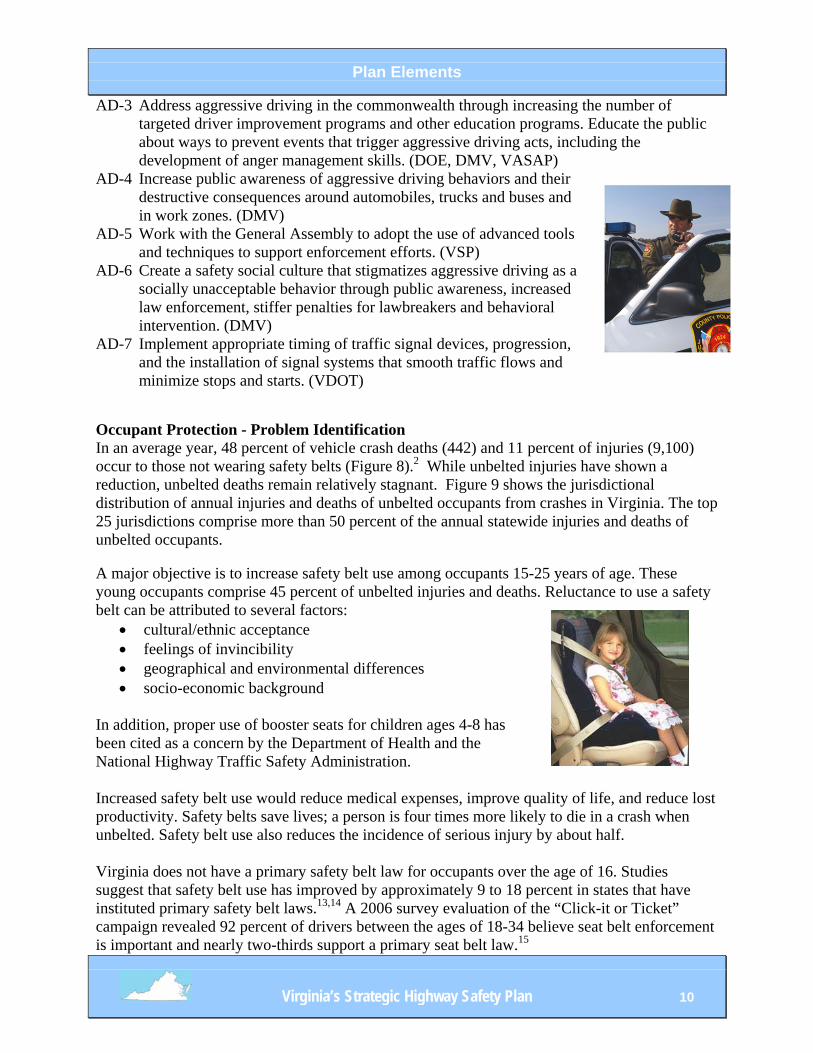
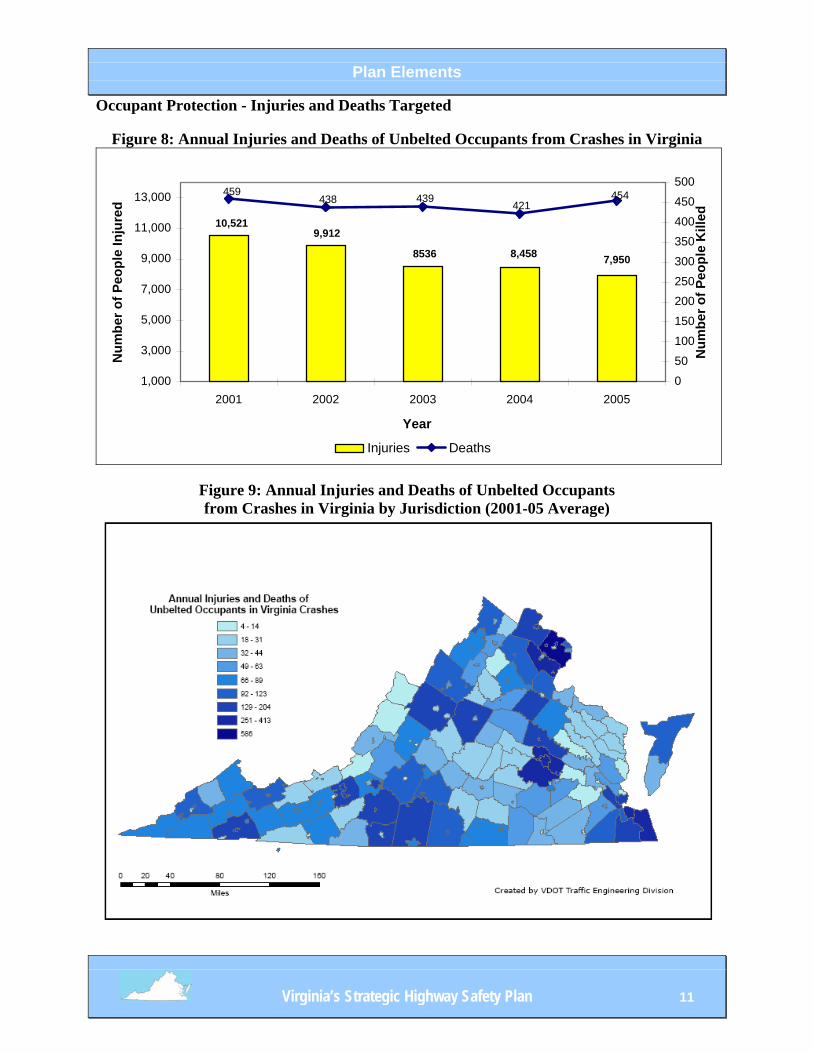
Occupant Protection - Problem Identification In an average year, 48 percent of vehicle crash deaths (442) and 11 percent of injuries (9,100) occur to those not wearing safety belts (Figure 8).2 While unbelted injuries have shown a reduction, unbelted deaths remain relatively stagnant. Figure 9 shows the jurisdictional distribution of annual injuries and deaths of unbelted occupants from crashes in Virginia. The top 25 jurisdictions comprise more than 50 percent of the annual statewide injuries and deaths of unbelted occupants. A major objective is to increase safety belt use among occupants 15-25 years of age. These young occupants comprise 45 percent of unbelted injuries and deaths. Reluctance to use a safety belt can be attributed to several factors:
• cultural/ethnic acceptance • feelings of invincibility • geographical and environmental differences • socio-economic background
In addition, proper use of booster seats for children ages 4-8 has been cited as a concern by the Department of Health and the National Highway Traffic Safety Administration. Increased safety belt use would reduce medical expenses, improve quality of life, and reduce lost productivity. Safety belts save lives; a person is four times more likely to die in a crash when unbelted. Safety belt use also reduces the incidence of serious injury by about half. Virginia does not have a primary safety belt law for occupants over the age of 16. Studies suggest that safety belt use has improved by approximately 9 to 18 percent in states that have instituted primary safety belt laws.13,14 A 2006 survey evaluation of the “Click-it or Ticket” campaign revealed 92 percent of drivers between the ages of 18-34 believe seat belt enforcement is important and nearly two-thirds support a primary seat belt law.15
Virginia’s Strategic Highway Safety Plan 10
Plan Elements
Occupant Protection - Injuries and Deaths Targeted
Figure 8: Annual Injuries and Deaths of Unbelted Occupants from Crashes in Virginia
8,4588536
9,91210,521
7,950
421439459
438 454
1,000
3,000
5,000
7,000
9,000
11,000
13,000
2001 2002 2003 2004 2005
Year
Num
ber o
f Peo
ple
Inju
red
0
50
100
150
200250
300
350400
450
500
Num
ber o
f Peo
ple
Kill
ed
Injuries Deaths
Figure 9: Annual Injuries and Deaths of Unbelted Occupants from Crashes in Virginia by Jurisdiction (2001-05 Average)
Virginia’s Strategic Highway Safety Plan 11
Plan Elements
Virginia’s Strategic Highway Safety Plan 12
Occupant Protection - Major Strategies OP-1 Encourage the General Assembly to pass a primary seat belt law. No other safety device
has the potential for immediately preventing injuries and deaths in motor vehicle crashes. The District of Columbia and 22 states have enacted primary seat belt laws (DMV).
OP-2 Encourage the General Assembly to pass child passenger safety legislation to meet NHTSA recommended guidelines for booster seats. (DMV, VDH)
OP-3 Continue public education and enforcement campaigns such as “Click it or Ticket.” Seat belt use has increased measurably since the beginning of “Click It or Ticket.” In 2006, Virginia recorded a 79 percent use rate.12 While this is an all-time high for Virginia, This is below the 82 percent national use rate. Continue to aggressively pursue “Click it or Ticket” for the foreseeable future with an aim at achieving or exceeding the national rate. (DMV)
OP-4 Continue to partner with the military community and higher education, which has such a large presence in Virginia and includes one of the largest concentrations of 18-25 year olds. (DMV, Dept. of Military Affairs, DOE)
OP-5 Continue education programs on the correct installation of child safety seats. (VDH) OP-6 Conduct corridor-based seat belt enforcement campaigns on corridors that traverse
multiple jurisdictions. (VSP) Impaired Drivers - Problem Identification Driving under the influence of alcohol or other drugs continues to be a major factor in crashes that cause injuries and deaths throughout the commonwealth. In an average year, 38 percent of vehicle-crash deaths (352) and 10 percent of injuries (8,000) involved drinking (Figure 10).2
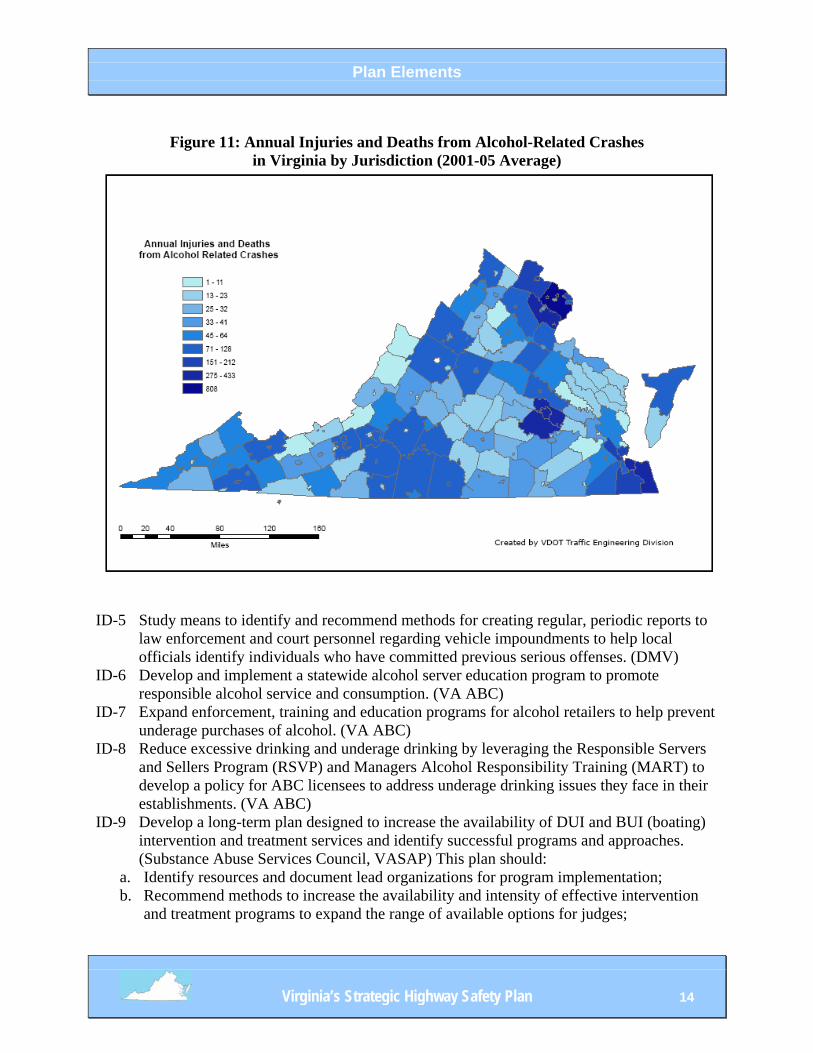
Over the past five years, there has been a reduction in injuries and deaths statewide. Figure 11 shows the jurisdictional distribution of injuries and deaths from alcohol-related crashes in Virginia. The top 25 jurisdictions comprise nearly 60 percent of the annual alcohol-related statewide injuries and deaths. Each year, impaired driving costs Virginians approximately $707 million.2 Underage drinking is also a significant problem. In 2005, 809 teens were injured and 32 died as a result of impaired driving.4 The extent to which distracted and drowsy driving contribute to crash injuries and deaths is not known; however, these two types of impaired driving behaviors are addressed by this plan. Drunk or drugged drivers seldom realize the pain and suffering their actions impose on their victims. More information is needed to determine the extent to which drunk or drugged driving offenders do not appear in court. Fifteen percent of offenders referred to special programs fail to comply with court-imposed requirements. Methods and mechanisms are also needed to detect offenders who have multiple serious offenses relating to vehicle operation. A contributing factor to impaired driving due to underage drinking is the sale of alcohol products to minors. In 2005, Virginia’s ABC retail stores’ percentage of alcohol sales to minors was two percent.9 In Virginia’s other licensed establishments, the percentage of alcohol sales is higher – at 11 percent. Sixty-five percent of youth obtain the alcohol they drink from their parents or friends.10 In many instances, underage and college-age impaired driving can be attributed to abuse of alcohol products.

Plan Elements
Innovative programs are needed to ensure rehabilitation serves the needs of impaired driving offenders through better prevention, intervention and treatment techniques. Proposed programs need to be based on best practices and reflect research-proven methods to alter or reduce destructive behaviors. A stable source of revenue is needed to fund programs to abate dangerous behaviors exhibited by impaired drivers. Impaired Drivers - Injuries and Deaths Targeted
Figure 10: Annual Alcohol-Related Injuries and Deaths in Virginia Crashes
75127911781984658211
322343
361375358
0
2,000
4,000
6,000
8,000
10,000
12,000
2001 2002 2003 2004 2005
Year
NU
mbe
r of P
eopl
e In
jure
d
0
50
100
150
200
250
300
350
400
Num
ber o
f Peo
ple
Kill
ed
Injuries Fatal
Impaired Drivers - Major Strategies ID-1 Initiate legislation to extend the first offense
Administrative License Revocation from seven up to 90 days. (DMV)
Virginia’s Strategic Highway Safety Plan 13
ID-2 Initiate legislation to adopt an Open Container Law that meets the criteria outlined by NHTSA. (DMV)
ID-3 Initiate legislation to institute a suspension period after conviction and before restricted licensing to 30 days or longer. (DMV)
ID-4 Determine the feasibility and impact of creating a dedicated funding stream (supported through fines and user fees) to support local DUI enforcement programs, public education campaigns and substance abuse prevention, intervention and treatment services. (DMV)
Plan Elements
Figure 11: Annual Injuries and Deaths from Alcohol-Related Crashes in Virginia by Jurisdiction (2001-05 Average)
ID-5 Study means to identify and recommend methods for creating regular, periodic reports to
law enforcement and court personnel regarding vehicle impoundments to help local officials identify individuals who have committed previous serious offenses. (DMV)
ID-6 Develop and implement a statewide alcohol server education program to promote responsible alcohol service and consumption. (VA ABC)
ID-7 Expand enforcement, training and education programs for alcohol retailers to help prevent underage purchases of alcohol. (VA ABC)
ID-8 Reduce excessive drinking and underage drinking by leveraging the Responsible Servers and Sellers Program (RSVP) and Managers Alcohol Responsibility Training (MART) to develop a policy for ABC licensees to address underage drinking issues they face in their establishments. (VA ABC)
ID-9 Develop a long-term plan designed to increase the availability of DUI and BUI (boating) intervention and treatment services and identify successful programs and approaches. (Substance Abuse Services Council, VASAP) This plan should:
a. Identify resources and document lead organizations for program implementation; b. Recommend methods to increase the availability and intensity of effective intervention
and treatment programs to expand the range of available options for judges;
Virginia’s Strategic Highway Safety Plan 14
Plan Elements
c. Recommend a coordinated system to conduct or catalog substance abuse needs assessments, by locality, for youth and at-risk populations to document problems, measure progress and guide resource allocation decision-making; and
d. Identify prevention, intervention and treatment approaches and programs that have documented success.
e. Identify and promote standardized substance abuse screening tools and treatment programs to enhance intervention and reduce recidivism rates.
f. Identify and promote standardized assessment tools that can be used by all service providers to match individuals to appropriate intervention and treatment programs (specifically targeting repeat offenders and those with high blood alcohol concentrations).
ID-10 Expand efforts to create and support community and college coalitions designed to prevent underage and excessive drinking. (VA ABC)
ID-11 Enforce DUI laws by publicizing and enforcing zero tolerance laws for drivers under 21 including programs such as Checkpoint Strikeforce, None for the Road, Holiday Lifesaver Weekend, and on-going selective enforcement projects conducted throughout the commonwealth. (VSP)
ID-12 Work with the Supreme Court and General District Courts to explore the feasibility of initiating policies and procedures to increase the percentage of court appearances on DUI dockets where problems exist. (VASAP)
ID-13 Encourage local ASAP offices to use victim impact panels. Panels would be composed of volunteers who are willing to discuss with offenders the direct impact that impaired driving and/or boating had on their lives. (VASAP)
ID-14 Pilot a DUI work release jail program that integrates education and treatment for repeat and high BAC offenders. Serve as an information resource for jails considering programs that integrate education/treatment with incarceration and work release. (VASAP, VDOT)
ID-15 Ensure that the Supreme Court and individual General District Court judges are familiar with the DUI court concept and encourage, when appropriate, the creation of specially designed DUI courts and/or dockets. (VASAP)
ID-16 Study the feasibility of instituting a conformance bond system that would provide a financial incentive to offenders to comply with court orders by returning a portion of the bond upon successful completion of all requirements. (VASAP)
ID-17 Ensure that prosecutors and judges understand that plea bargaining and other diversionary strategies, that fail to fully prosecute DUI offenders, often prevent these offenders from receiving much needed education and treatment interventions from organizations like VASAP. (VASAP)
ID-18 Prosecute, impose sanctions on, and treat DUI offenders by eliminating diversion programs and plea bargains to non-alcohol offenses. (Commonwealth’s Attorney)
ID-19 Control high-BAC and repeat offenders by monitoring all VASAP-referred DUI offenders closely and incarcerating offenders. (VASAP, DMV, Commonwealth’s Attorney)
ID-20 Encourage the General Assembly to pass appropriate legislation that encourages safe driving habits by targeting drunk, drugged, distracted (e.g., cell phones), or drowsy drivers. (DMV)
Virginia’s Strategic Highway Safety Plan 15
Plan Elements
ID-21 Seek adequate resources for raised levels of law enforcement and technology where severe crash trends exist. (VSP)
ID-22 Encourage the courts to provide appropriate levels of adjudication, such that judges send a clear message about intolerance towards aggressive driving, driving under the influence, and occupant protection. Penalties should be swift and certain. (VASAP)
ID-23 Continue Checkpoint Strikeforce through saturation patrols and checkpoints. This campaign is held semi-annually to reduce incidence of drunk driving in Virginia via raising awareness of sobriety checkpoints. (VSP, DMV) The objectives include:
Incorporate state and local law enforcement partners via radio campaign to communicate a number of proactive transportation safety messages;
Increase visibility of sobriety checkpoints; Educate about drunk driving laws and how drunk driving impacts lives. Increase
perceived risk of arrest for drunk driving in Virginia; Target high-risk drivers (21-35 years of age); and Build community support for sobriety checkpoints as a means to identify and
apprehend drunk drivers. ID-24 Provide safe rest areas by improving access as well as security and services in rest areas.
(VDOT) ID-25 Increase driver awareness of the risks of drowsy and distracted driving and promote driver
focus (DMV) by: • Conducting education and awareness campaigns targeting motorists; • Promoting awareness of statutes to deter distracted and drowsy driving; • Incorporating information on distracted and drowsy driving into education programs
and materials for young drivers; and • Encouraging employers to offer fatigue management programs to employees working
nighttime or rotating shifts. Unlicensed / Suspended / Revoked Drivers – Problem Identification
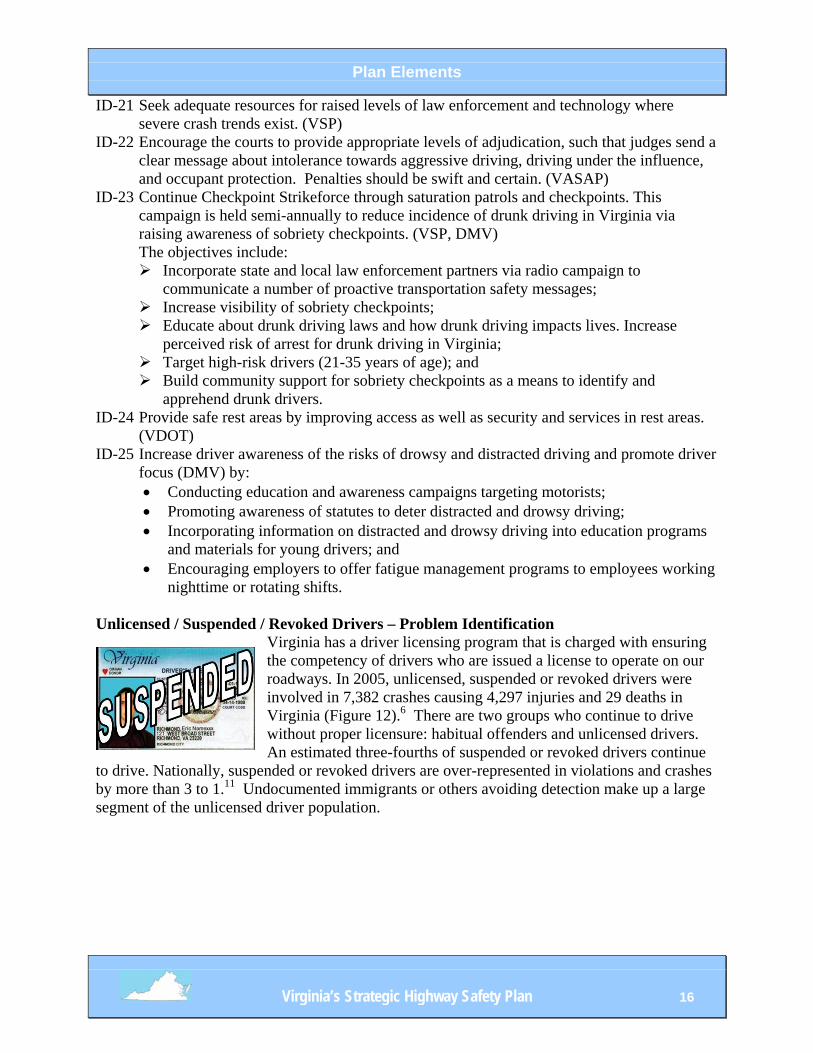
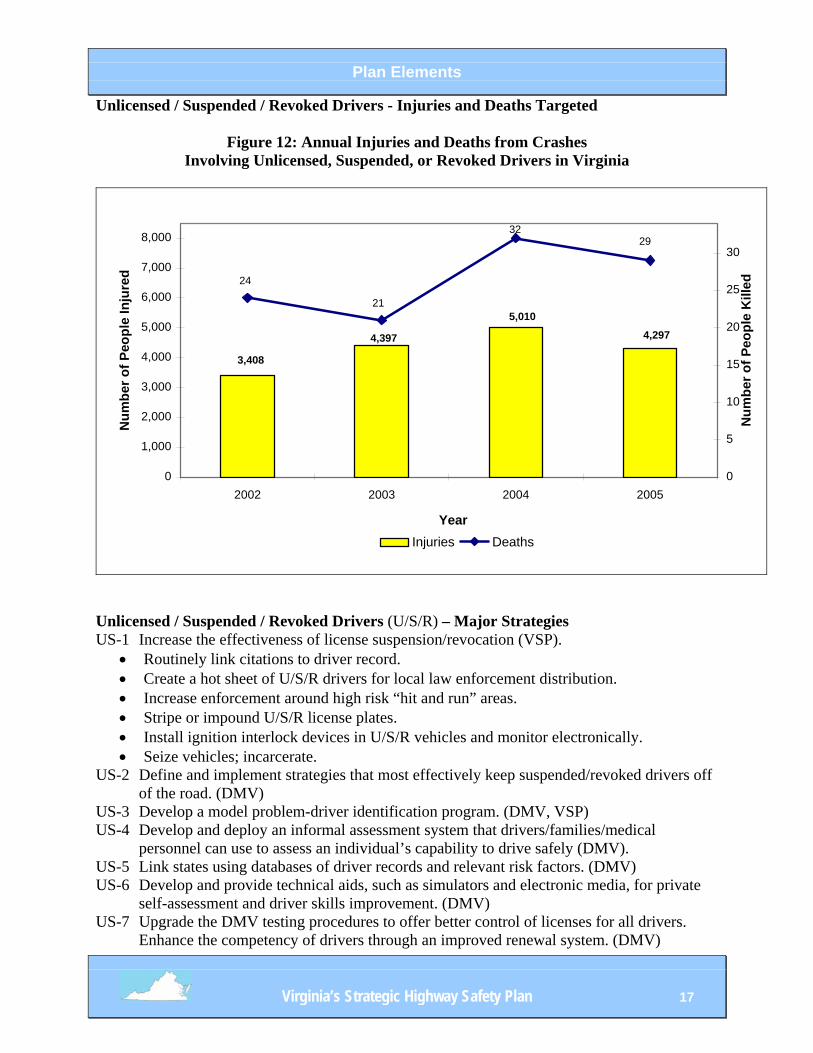
Virginia has a driver licensing program that is charged with ensuring the competency of drivers who are issued a license to operate on our roadways. In 2005, unlicensed, suspended or revoked drivers were involved in 7,382 crashes causing 4,297 injuries and 29 deaths in Virginia (Figure 12).6 There are two groups who continue to drive without proper licensure: habitual offenders and unlicensed drivers. An estimated three-fourths of suspended or revoked drivers continue
to drive. Nationally, suspended or revoked drivers are over-represented in violations and crashes by more than 3 to 1.11 Undocumented immigrants or others avoiding detection make up a large segment of the unlicensed driver population.
Virginia’s Strategic Highway Safety Plan 16
Plan Elements
Unlicensed / Suspended / Revoked Drivers - Injuries and Deaths Targeted
Figure 12: Annual Injuries and Deaths from Crashes Involving Unlicensed, Suspended, or Revoked Drivers in Virginia
4,297
5,010
4,397
3,408
2932
24
21
0
1,000
2,000
3,000
4,000
5,000
6,000
7,000
8,000
2002 2003 2004 2005
Year
Num
ber o
f Peo
ple
Inju
red
0
5
10
15
20
25
30
Num
ber o
f Peo
ple
Kill
ed
Injuries Deaths
Unlicensed / Suspended / Revoked Drivers (U/S/R) – Major Strategies US-1 Increase the effectiveness of license suspension/revocation (VSP).
• Routinely link citations to driver record. • Create a hot sheet of U/S/R drivers for local law enforcement distribution. • Increase enforcement around high risk “hit and run” areas. • Stripe or impound U/S/R license plates. • Install ignition interlock devices in U/S/R vehicles and monitor electronically. • Seize vehicles; incarcerate.
US-2 Define and implement strategies that most effectively keep suspended/revoked drivers off of the road. (DMV)
US-3 Develop a model problem-driver identification program. (DMV, VSP) US-4 Develop and deploy an informal assessment system that drivers/families/medical
personnel can use to assess an individual’s capability to drive safely (DMV). US-5 Link states using databases of driver records and relevant risk factors. (DMV) US-6 Develop and provide technical aids, such as simulators and electronic media, for private
self-assessment and driver skills improvement. (DMV) US-7 Upgrade the DMV testing procedures to offer better control of licenses for all drivers.
Enhance the competency of drivers through an improved renewal system. (DMV)
Virginia’s Strategic Highway Safety Plan 17
Plan Elements
Virginia’s Strategic Highway Safety Plan 18
Driver Behavior Challenges 1. Aggressive driving education – Some believe that aggressive driving is a “police problem”
that can be solved by enforcing existing laws. The public tends to see only speeding as constituting aggressive driving and not the compilation of more than one act which the Virginia code describes.
2. Increasing seat belt use – Changing cultural norms through education to reach various ages, languages, and incomes will continue to be a challenge. Providing enforcement with the proper legislative tools is the major issue.
3. Law enforcement resources – Focus, funding and manpower have become a bigger challenge in the last several years as homeland security has taken center stage.
4. Accepting motor vehicle deaths as a public health issue – Motor vehicle injuries and deaths affect more than 80,000 people a year in Virginia and that is a public health issue.
5. Design and control systems that don’t conflict with driver and pedestrian human factor expectations. When identified after implementation, they should be removed to prevent future injuries and deaths. Resources should be placed in the design phase to eliminate these problems and to meet human factor requirements prior to implementation.
6. Courts are understaffed and do not have the manpower to implement programs to increase the percentage of court appearances on DUI dockets.
7. VASAP would have to create an administrative mechanism to manage volunteer victim panelist participation.
8. The costs associated with a DUI work release jail program that integrates education and treatment for repeat and high BAC offenders is projected to be $1 million per year. This would be prohibitive without grant support. Similar programs operate on a cost-neutral basis, recouping their expenses through payment of fees and third-party insurance reimbursements.
9. Projected costs for each specially-designated DUI court or docket include an additional 78 hours of judicial time per 100 DUI convictions annually, 91 hours of additional court clerk time per 100 DUI convictions annually, and one additional ASAP community corrections case manager per 200 DUI convictions.
10. The courts have not been responsive to the requests of the National Center for State Courts to undertake the study of implementing a conformance bond system. The system would require administrative costs that the courts may not be able to recoup.
Plan Elements
Human Factors Emphasis Area: Special Users
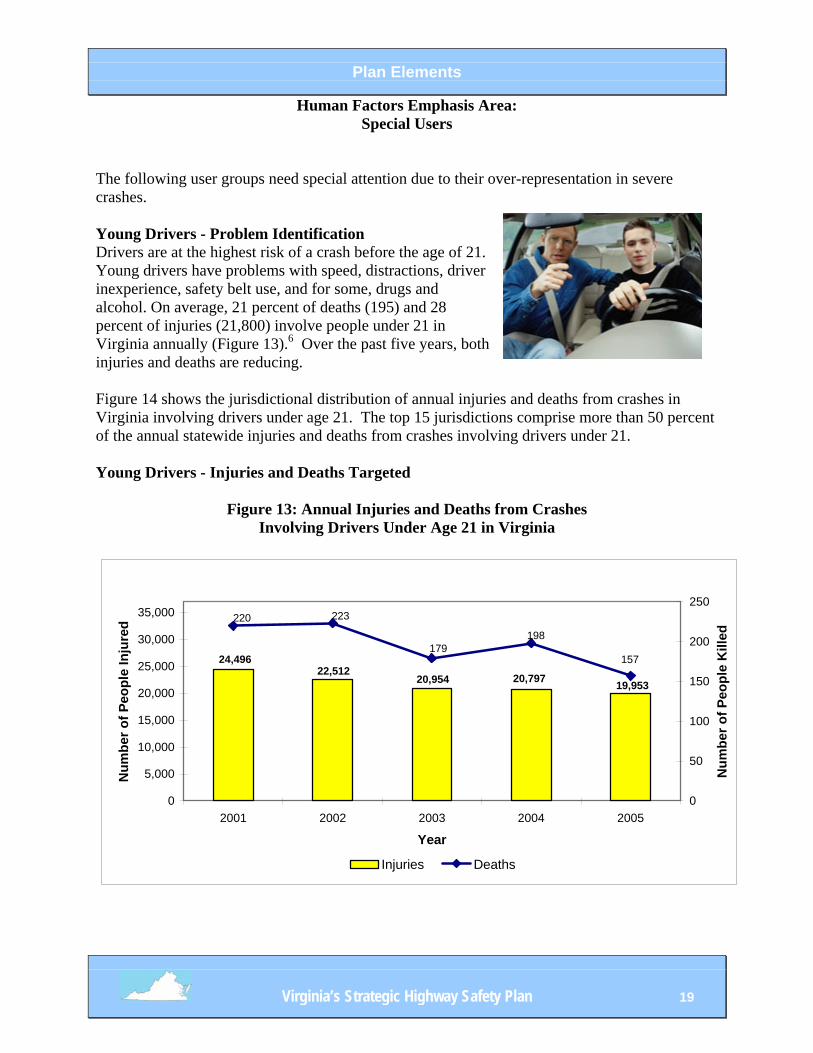
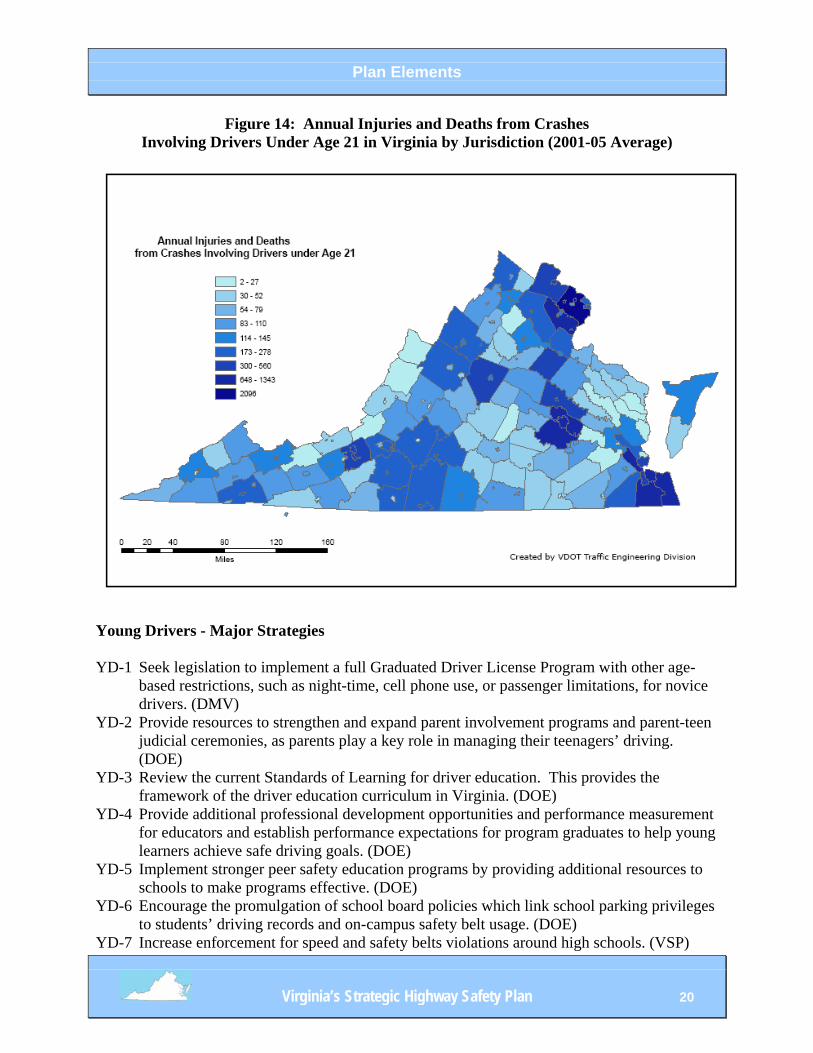
The following user groups need special attention due to their over-representation in severe crashes. Young Drivers - Problem Identification Drivers are at the highest risk of a crash before the age of 21. Young drivers have problems with speed, distractions, driver inexperience, safety belt use, and for some, drugs and alcohol. On average, 21 percent of deaths (195) and 28 percent of injuries (21,800) involve people under 21 in Virginia annually (Figure 13).6 Over the past five years, both injuries and deaths are reducing. Figure 14 shows the jurisdictional distribution of annual injuries and deaths from crashes in Virginia involving drivers under age 21. The top 15 jurisdictions comprise more than 50 percent of the annual statewide injuries and deaths from crashes involving drivers under 21. Young Drivers - Injuries and Deaths Targeted
Figure 13: Annual Injuries and Deaths from Crashes Involving Drivers Under Age 21 in Virginia
24,49622,512
20,79720,954 19,953
220
179198
157
223
0
5,000
10,000
15,000
20,000
25,000
30,000
35,000
2001 2002 2003 2004 2005
Year
Num
ber o
f Peo
ple
Inju
red
0
50
100
150
200
250
Num
ber o
f Peo
ple
Kill
ed
Injuries Deaths
Virginia’s Strategic Highway Safety Plan 19
Plan Elements
Figure 14: Annual Injuries and Deaths from Crashes
Involving Drivers Under Age 21 in Virginia by Jurisdiction (2001-05 Average)
Young Drivers - Major Strategies YD-1 Seek legislation to implement a full Graduated Driver License Program with other age-
based restrictions, such as night-time, cell phone use, or passenger limitations, for novice drivers. (DMV)
YD-2 Provide resources to strengthen and expand parent involvement programs and parent-teen judicial ceremonies, as parents play a key role in managing their teenagers’ driving. (DOE)
YD-3 Review the current Standards of Learning for driver education. This provides the framework of the driver education curriculum in Virginia. (DOE)
YD-4 Provide additional professional development opportunities and performance measurement for educators and establish performance expectations for program graduates to help young learners achieve safe driving goals. (DOE)
YD-5 Implement stronger peer safety education programs by providing additional resources to schools to make programs effective. (DOE)
YD-6 Encourage the promulgation of school board policies which link school parking privileges to students’ driving records and on-campus safety belt usage. (DOE)
YD-7 Increase enforcement for speed and safety belts violations around high schools. (VSP)
Virginia’s Strategic Highway Safety Plan 20
Plan Elements
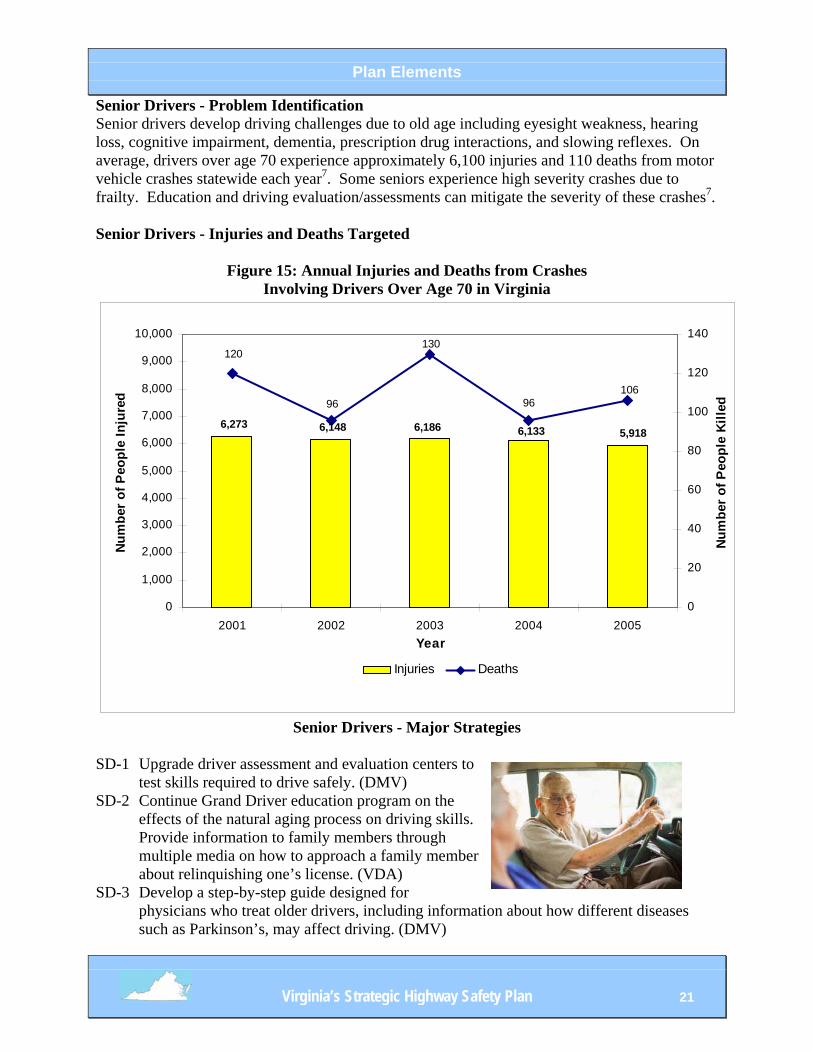
Senior Drivers - Problem Identification Senior drivers develop driving challenges due to old age including eyesight weakness, hearing loss, cognitive impairment, dementia, prescription drug interactions, and slowing reflexes. On average, drivers over age 70 experience approximately 6,100 injuries and 110 deaths from motor vehicle crashes statewide each year7. Some seniors experience high severity crashes due to frailty. Education and driving evaluation/assessments can mitigate the severity of these crashes7. Senior Drivers - Injuries and Deaths Targeted
Figure 15: Annual Injuries and Deaths from Crashes Involving Drivers Over Age 70 in Virginia
5,9186,1336,1486,273 6,186
10696
130
96
120
0
1,000
2,000
3,000
4,000
5,000
6,000
7,000
8,000
9,000
10,000
2001 2002 2003 2004 2005Year
Num
ber
of P
eopl
e In
jure
d
0
20
40
60
80
100
120
140
Num
ber o
f Peo
ple
Kille
d
Injuries Deaths
Senior Drivers - Major Strategies SD-1 Upgrade driver assessment and evaluation centers to
test skills required to drive safely. (DMV)
Virginia’s Strategic Highway Safety Plan 21
SD-2 Continue Grand Driver education program on the effects of the natural aging process on driving skills. Provide information to family members through multiple media on how to approach a family mabout relinquishing one’s license. (VDA)
ember
SD-3 Develop a step-by-step guide designed for physicians who treat older drivers, including information about how different diseases such as Parkinson’s, may affect driving. (DMV)
Plan Elements
SD-4 Upgrade traffic signage, pavement markings, and traffic signal improvements to improve visibility for older drivers and meet new federal guidelines. Incorporate recommendations found in the FHWA Highway Design Handbook for Older Drivers and Pedestrians. (VDOT)
SD-5 Develop transportation programs for seniors who surrender their license at the local, regional and state levels. (VDRPT)
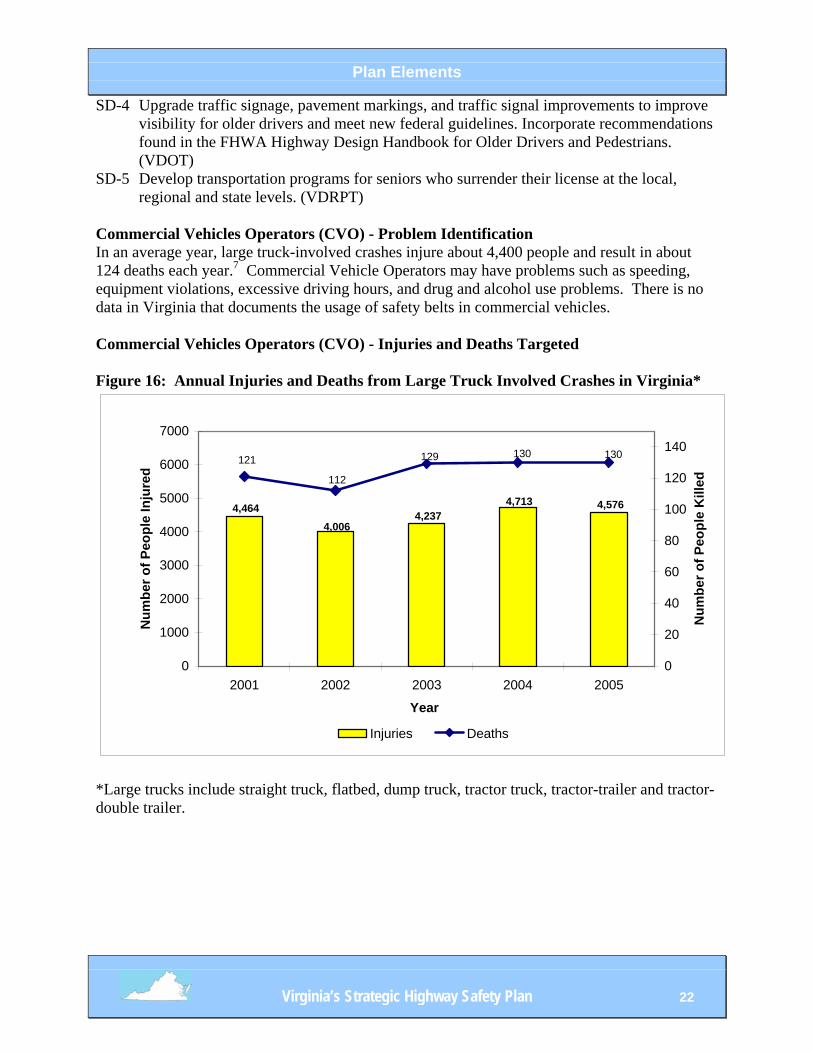
Commercial Vehicles Operators (CVO) - Problem Identification In an average year, large truck-involved crashes injure about 4,400 people and result in about 124 deaths each year.7 Commercial Vehicle Operators may have problems such as speeding, equipment violations, excessive driving hours, and drug and alcohol use problems. There is no data in Virginia that documents the usage of safety belts in commercial vehicles. Commercial Vehicles Operators (CVO) - Injuries and Deaths Targeted Figure 16: Annual Injuries and Deaths from Large Truck Involved Crashes in Virginia*
4,4644,006
4,2374,713 4,576
121
112
129 130 130
0
1000
2000
3000
4000
5000
6000
7000
2001 2002 2003 2004 2005
Year
Num
ber o
f Peo
ple
Inju
red
0
20
40
60
80
100
120
140
Num
ber o
f Peo
ple
Kill
ed
Injuries Deaths
*Large trucks include straight truck, flatbed, dump truck, tractor truck, tractor-trailer and tractor-double trailer.
Virginia’s Strategic Highway Safety Plan 22
Plan Elements
Commercial Vehicle Operators - Major Strategies CV-1 Educate drivers on the affects of fatigue and hours of service
as well as speed and use of safety belts. Use Drive Smart Virginia’s guide to running a successful safety belt campaign for truckers. (DMV)
CV-2 Continue to review through engineering analysis the adequacy of truck routes and recommend restrictions or geometric improvements.(VDOT)
CV-3 Increase targeted enforcement in high crash areas of speed, equipment, and weight enforcement violations based on crash data analysis. (VSP)
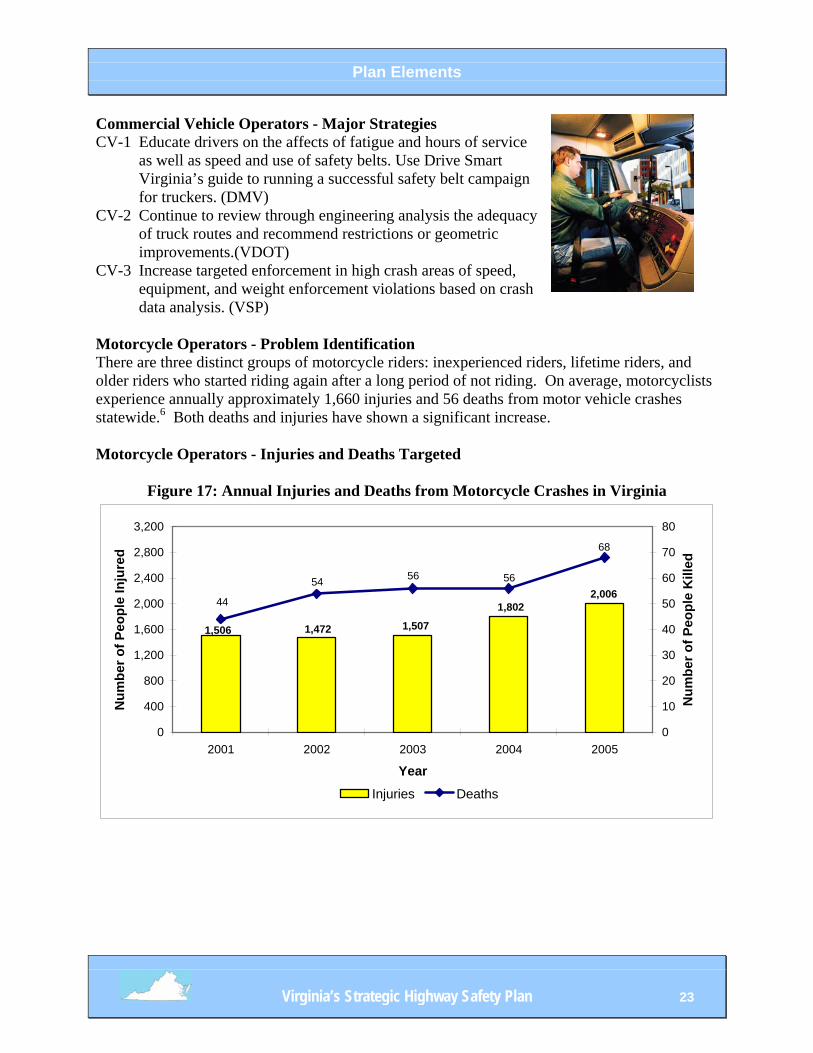
Motorcycle Operators - Problem Identification There are three distinct groups of motorcycle riders: inexperienced riders, lifetime riders, and older riders who started riding again after a long period of not riding. On average, motorcyclists experience annually approximately 1,660 injuries and 56 deaths from motor vehicle crashes statewide.6 Both deaths and injuries have shown a significant increase. Motorcycle Operators - Injuries and Deaths Targeted
Figure 17: Annual Injuries and Deaths from Motorcycle Crashes in Virginia
1,472 1,507
2,006
1,506
1,802
68
565654
44
0
400
800
1,200
1,600
2,000
2,400
2,800
3,200
2001 2002 2003 2004 2005
Year
Num
ber o
f Peo
ple
Inju
red
0
10
20
30
40
50
60
70
80
Num
ber o
f Peo
ple
Kill
ed
Injuries Deaths
Virginia’s Strategic Highway Safety Plan 23
Plan Elements
Motorcycle Operators - Major Strategies MO-1 Increase the number of training schools around the state.
(DMV) MO-2 Increase education and awareness statewide. (DMV) MO-3 Encourage all motorcyclists to complete a training
program. (DMV) MO-4 Increase enforcement of non-compliant helmets and lack
of proper endorsements. (VSP) Limited English Proficiency (LEP) Drivers - Problem Identification Drivers with limited English fluency may not understand safety messages. Virginia offers many materials in Spanish, but not in other languages. The number of injuries and deaths experienced by this group is unknown due to lack of data. Limited English Proficiency (LEP) Drivers - Major Strategies LE-1 Identify opportunities to provide safety messages in other languages. (DMV) LE-2 Improve information provided on crash reports to better
understand LEP crashes. (DMV)
Virginia’s Strategic Highway Safety Plan 24
LE-3 Develop new outreach and educational initiatives in multiple languages. Partner with schools, refugee and immigrant placement services (i.e. faith-based initiatives), LEP programs, and ethnic advisory councils to provide educational and outreach materials. (DOE, DMV)
LE-4 Encourage widespread use of signs, markings, and traffic signal indications using symbols instead of words, where appropriate. (VDOT)
Special User Challenges
Education – School-based driver education programs capture most young drivers, but some drivers receive licensing from other states and do not receive the benefits of Virginia’s programs. It is important that all educators have the knowledge and skill sets required to reach the intended drivers. Effectively communicating the effects of dangerous driving behavior is a difficult skill to develop. Drivers may need additional education to assist with particular issues. LEP drivers complicate education efforts. Group Dynamics – Some “special users” may feel they are being unfairly targeted for their problems. The development of programs that help groups monitor themselves will decrease the feelings of being targeted. Involving special users in the development of programs will reduce perceived unfairness and increase programmatic cultural competencies and thereby increase compliance.

Plan Elements
Human Factors / Environmental Emphasis Area: Pedestrian and Bicyclist Safety
Problem Identification Pedestrian and bicyclist safety crosses the human factors and environmental emphasis areas. Non-motorized travelers are particularly at risk when mixed with vehicular traffic. Here are some of the primary safety issues: General
Virginia’s Strategic Highway Safety Plan 25
• 11 percent of vehicle-crash deaths (104) and 4 percent of injuries (2,800) involved walkers and bicyclists in an average year in Virginia (2001-05).7
• Non-motorized crashes predominantly occur in urban areas. Seventy-five percent of all non-motorized crashes occur in 18 urban jurisdictions.7 About 70 percent of non-motorized crashes occur on non-VDOT maintained roads, which are usually urban.6 Of the bike and pedestrian crashes on VDOT roadways, approximately 70 percent occur on urban facilities.6
• Many roadways lack facilities for pedestrians and cyclists, particularly in suburban areas developed in the last 60 years.
• Non-motorized deaths have remained relatively constant. More research is needed to determine if these findings are the result of less travel or better safety practices.
• Non-motorized crashes occur more frequently on Fridays and less frequently on Sundays.6 They typically occur during the morning and afternoon peak traffic hours but are common from 3 to 9 p.m.6
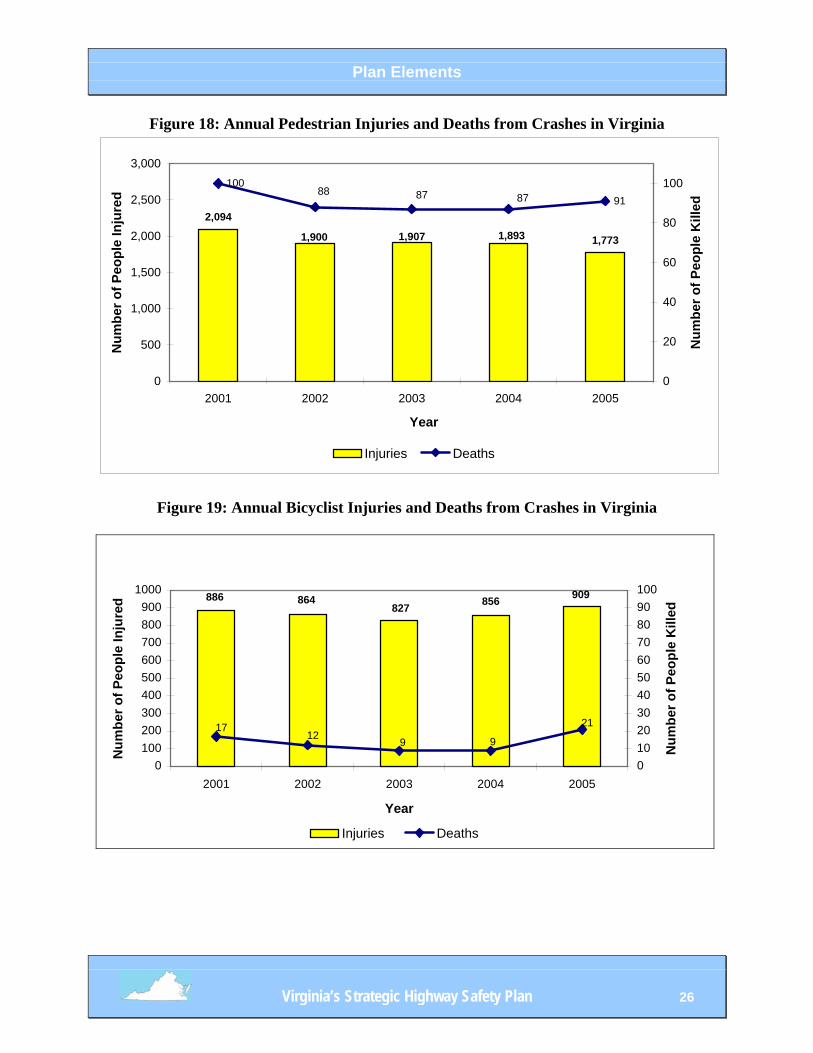
Pedestrians • Annual pedestrian injuries from crashes have declined to just below 1,800 per year
(Figure 18).7 • People under 25, particularly men, and people over 70 are over-represented age groups
for pedestrian crashes.7 Fifteen to 20 year olds are involved in 13.5 percent of pedestrian crashes.2 People over 25 appear to have pedestrian crashes less often than people under 25.2 Males are involved in more crashes than females in every age group.2
• Pedestrian actions are difficult to ascertain from police reports. Bicyclists
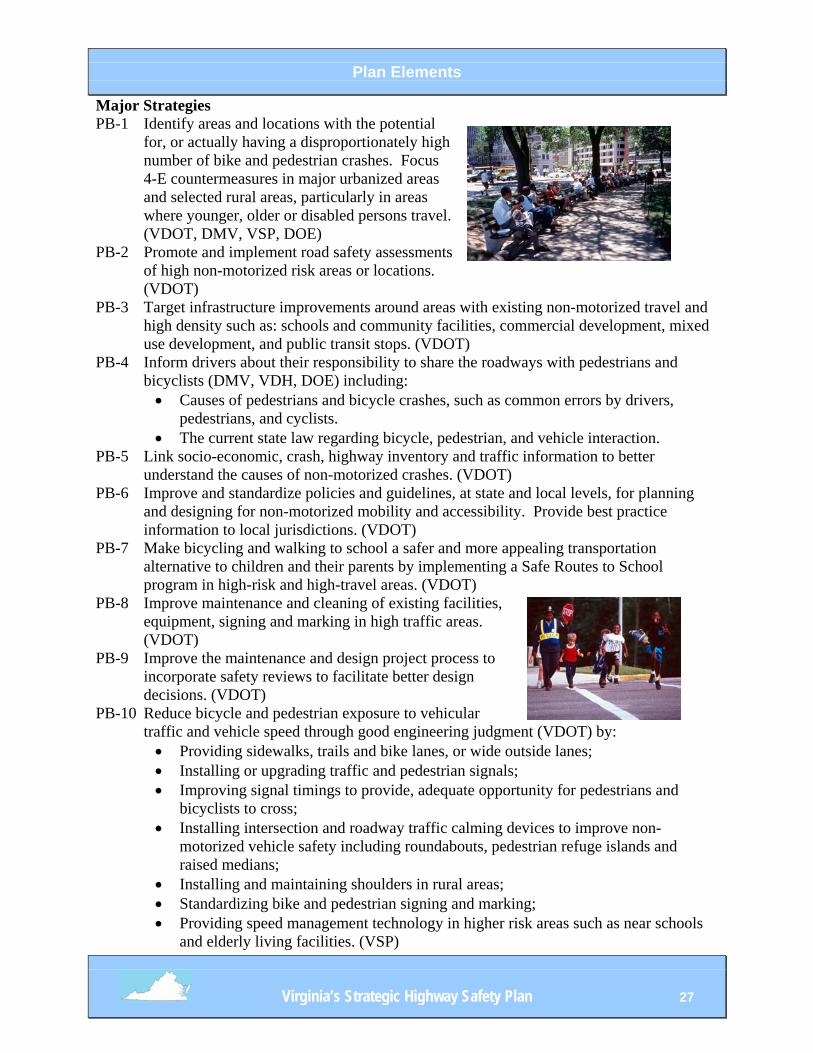
• Bicycle-involved crashes in Virginia average around 900 annual injuries and 14 deaths (Figure 19).2
• People ages 10 to 20, particularly males, are the most prone to vehicle-bicycle crashes accounting for 26 percent.2 People between 25 and 34 years of age appear to have fewer bicycle crashes; however, those 35-45 are involved in more crashes.2
Injuries and Deaths Targeted Reducing bicyclist and pedestrian-involved targeted crashes must incorporate both human factors and environmental strategies.
Plan Elements
Figure 18: Annual Pedestrian Injuries and Deaths from Crashes in Virginia
1,773
2,094
1,900 1,8931,907
10091
88 87 87
0
500
1,000
1,500
2,000
2,500
3,000
2001 2002 2003 2004 2005
Year
Num
ber o
f Peo
ple
Inju
red
0
20
40
60
80
100
Num
ber o
f Peo
ple
Kill
ed
Injuries Deaths
Figure 19: Annual Bicyclist Injuries and Deaths from Crashes in Virginia
909856827864886
1712 9 9
21
0100200300400500600700800900
1000
2001 2002 2003 2004 2005
Year
Num
ber o
f Peo
ple
Inju
red
0102030405060708090100
Num
ber o
f Peo
ple
Kill
ed
Injuries Deaths
Virginia’s Strategic Highway Safety Plan 26
Plan Elements
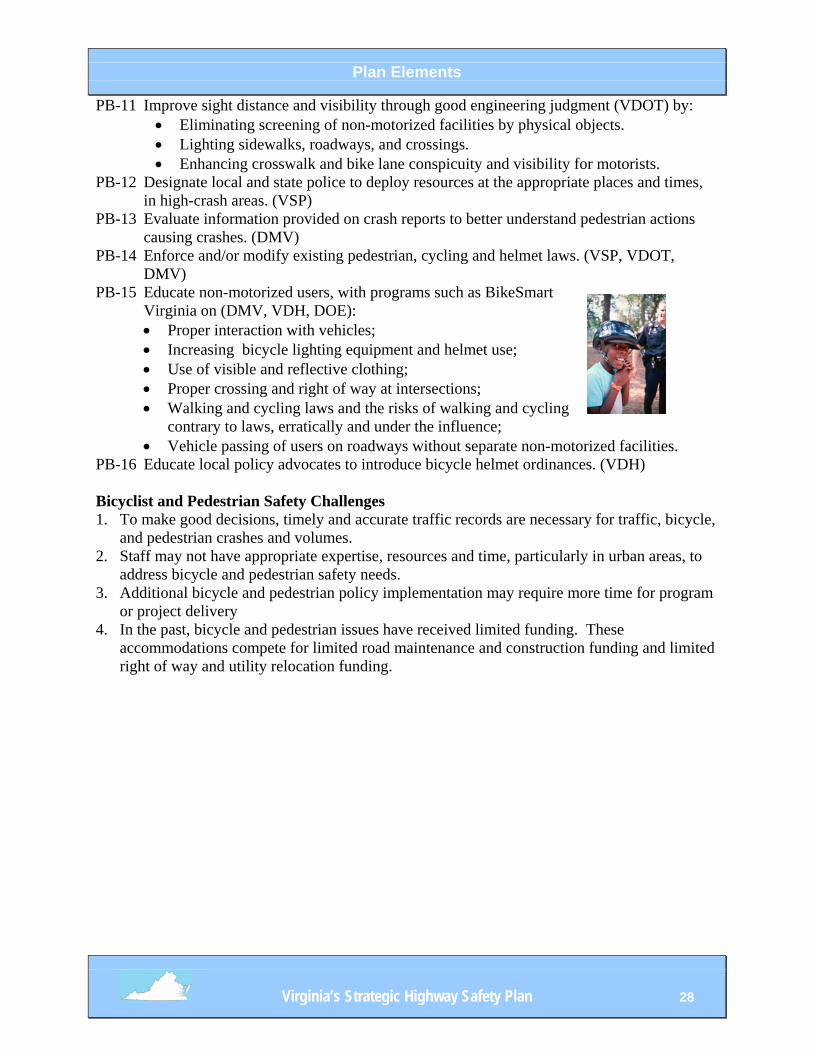
Major Strategies PB-1 Identify areas and locations with the potential
for, or actually having a disproportionately high number of bike and pedestrian crashes. Focus 4-E countermeasures in major urbanized areas and selected rural areas, particularly in areas where younger, older or disabled persons travel. (VDOT, DMV, VSP, DOE)
PB-2 Promote and implement road safety assessments of high non-motorized risk areas or locations. (VDOT)
PB-3 Target infrastructure improvements around areas with existing non-motorized travel and high density such as: schools and community facilities, commercial development, mixed use development, and public transit stops. (VDOT)
PB-4 Inform drivers about their responsibility to share the roadways with pedestrians and bicyclists (DMV, VDH, DOE) including: • Causes of pedestrians and bicycle crashes, such as common errors by drivers,
pedestrians, and cyclists. • The current state law regarding bicycle, pedestrian, and vehicle interaction.
PB-5 Link socio-economic, crash, highway inventory and traffic information to better understand the causes of non-motorized crashes. (VDOT)
PB-6 Improve and standardize policies and guidelines, at state and local levels, for planning and designing for non-motorized mobility and accessibility. Provide best practice information to local jurisdictions. (VDOT)
PB-7 Make bicycling and walking to school a safer and more appealing transportation alternative to children and their parents by implementing a Safe Routes to School program in high-risk and high-travel areas. (VDOT)
PB-8 Improve maintenance and cleaning of existing facilities, equipment, signing and marking in high traffic areas. (VDOT)
Virginia’s Strategic Highway Safety Plan 27
PB-9 Improve the maintenance and design project process to incorporate safety reviews to facilitate better design decisions. (VDOT)
PB-10 Reduce bicycle and pedestrian exposure to vehicular traffic and vehicle speed through good engineering judgment (VDOT) by: • Providing sidewalks, trails and bike lanes, or wide outside lanes; • Installing or upgrading traffic and pedestrian signals; • Improving signal timings to provide, adequate opportunity for pedestrians and
bicyclists to cross; • Installing intersection and roadway traffic calming devices to improve non-
motorized vehicle safety including roundabouts, pedestrian refuge islands and raised medians;
• Installing and maintaining shoulders in rural areas; • Standardizing bike and pedestrian signing and marking; • Providing speed management technology in higher risk areas such as near schools
and elderly living facilities. (VSP)
Plan Elements
PB-11 Improve sight distance and visibility through good engineering judgment (VDOT) by: • Eliminating screening of non-motorized facilities by physical objects. • Lighting sidewalks, roadways, and crossings. • Enhancing crosswalk and bike lane conspicuity and visibility for motorists.
PB-12 Designate local and state police to deploy resources at the appropriate places and times, in high-crash areas. (VSP)
PB-13 Evaluate information provided on crash reports to better understand pedestrian actions causing crashes. (DMV)
PB-14 Enforce and/or modify existing pedestrian, cycling and helmet laws. (VSP, VDOT, DMV)
PB-15 Educate non-motorized users, with programs such as BikeSmart Virginia on (DMV, VDH, DOE): • Proper interaction with vehicles; • Increasing bicycle lighting equipment and helmet use; • Use of visible and reflective clothing; • Proper crossing and right of way at intersections; • Walking and cycling laws and the risks of walking and cycling
contrary to laws, erratically and under the influence; • Vehicle passing of users on roadways without separate non-motorized facilities.
PB-16 Educate local policy advocates to introduce bicycle helmet ordinances. (VDH) Bicyclist and Pedestrian Safety Challenges 1. To make good decisions, timely and accurate traffic records are necessary for traffic, bicycle,
and pedestrian crashes and volumes. 2. Staff may not have appropriate expertise, resources and time, particularly in urban areas, to
address bicycle and pedestrian safety needs. 3. Additional bicycle and pedestrian policy implementation may require more time for program
or project delivery 4. In the past, bicycle and pedestrian issues have received limited funding. These
accommodations compete for limited road maintenance and construction funding and limited right of way and utility relocation funding.
Virginia’s Strategic Highway Safety Plan 28
Plan Elements
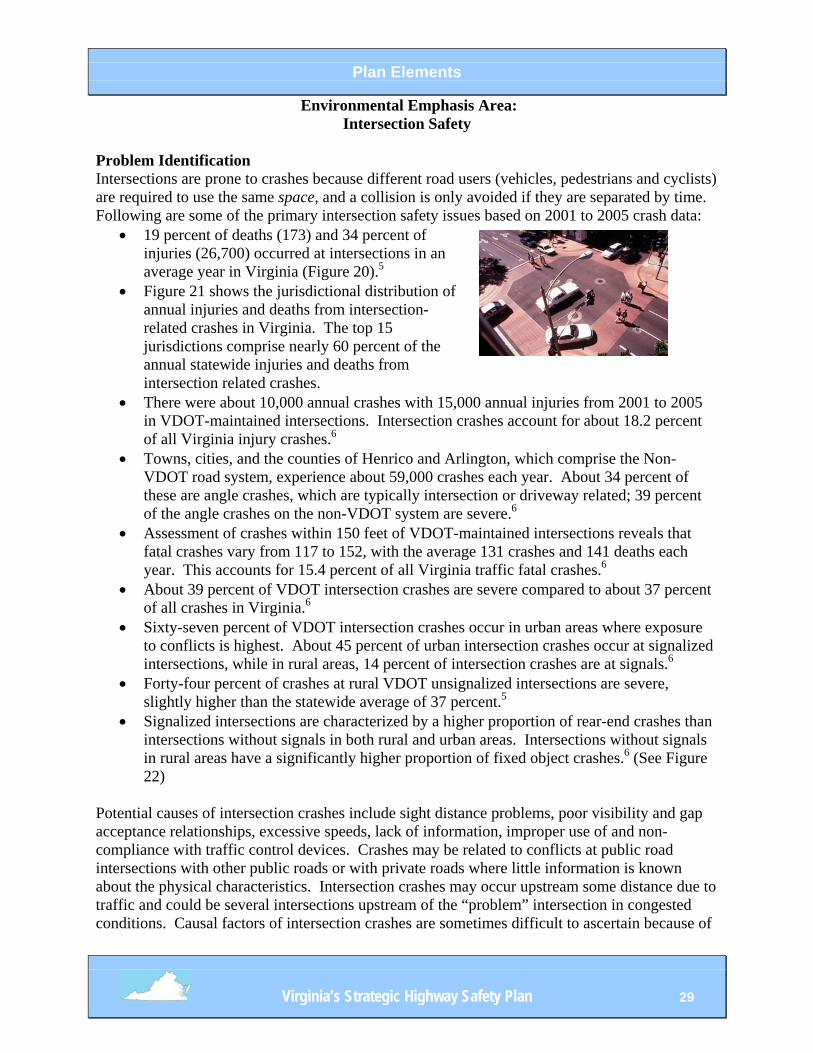
Environmental Emphasis Area: Intersection Safety
Problem Identification Intersections are prone to crashes because different road users (vehicles, pedestrians and cyclists) are required to use the same space, and a collision is only avoided if they are separated by time. Following are some of the primary intersection safety issues based on 2001 to 2005 crash data:
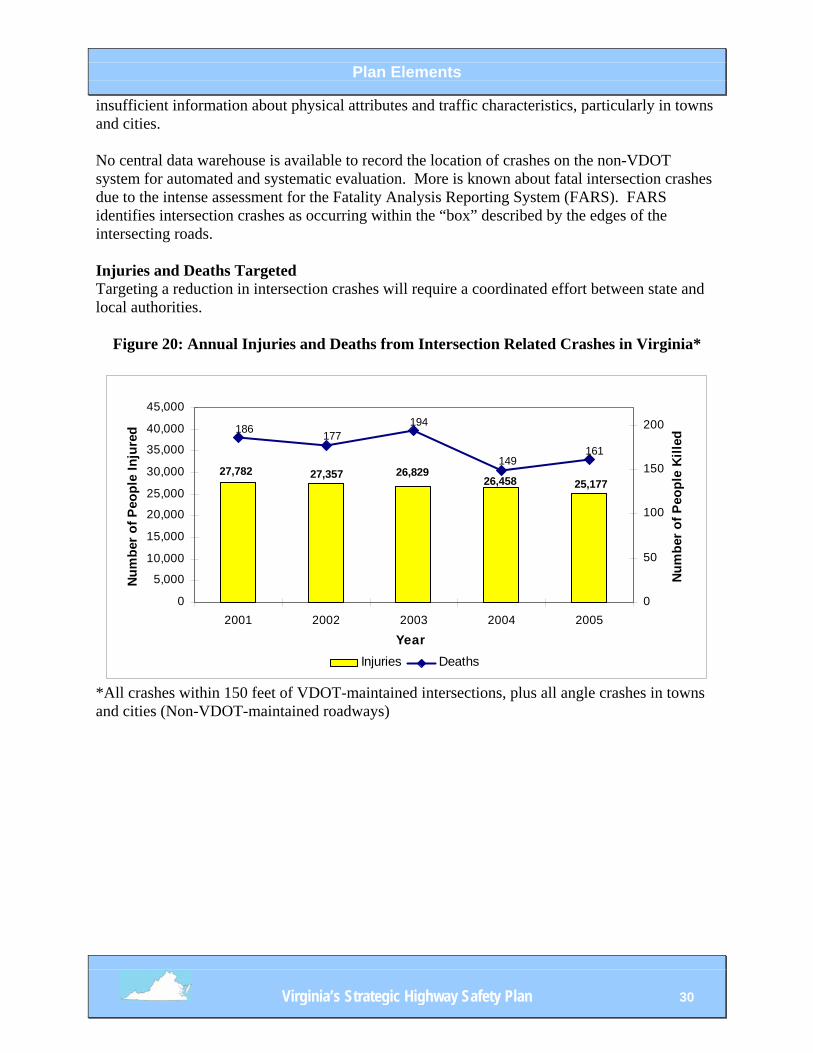
• 19 percent of deaths (173) and 34 percent of injuries (26,700) occurred at intersections in an average year in Virginia (Figure 20).5
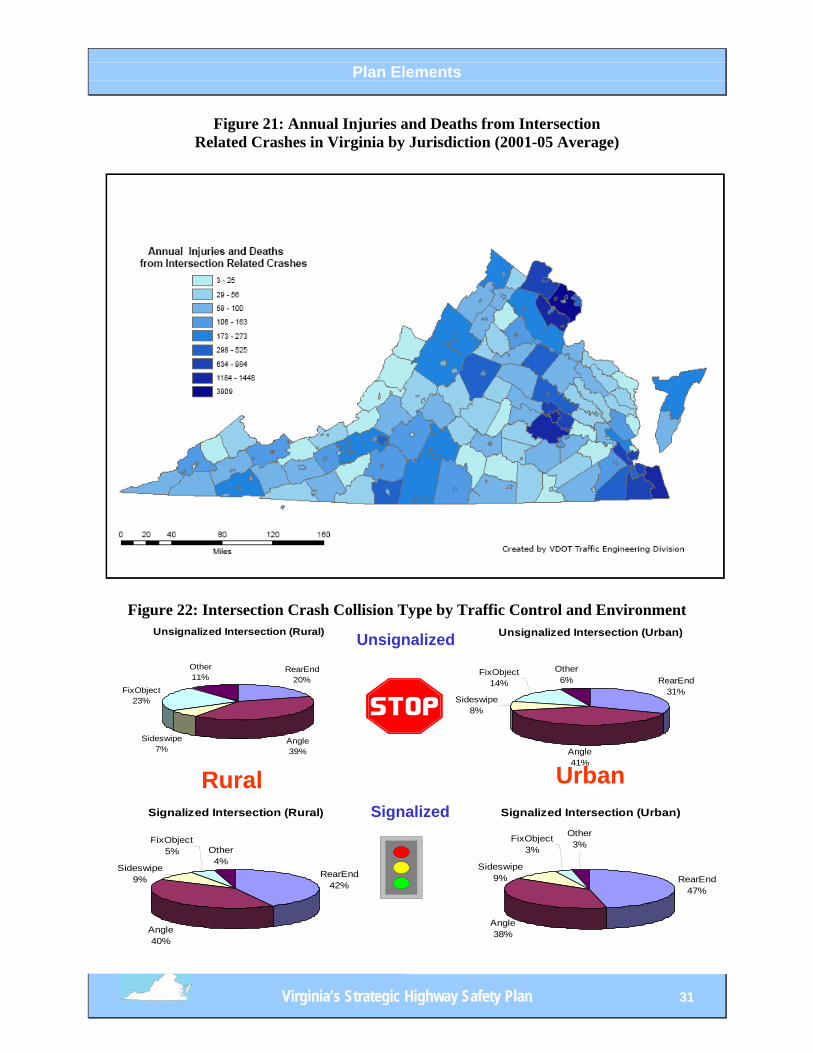
• Figure 21 shows the jurisdictional distribution of annual injuries and deaths from intersection- related crashes in Virginia. The top 15 jurisdictions comprise nearly 60 percent of the annual statewide injuries and deaths from intersection related crashes.
• There were about 10,000 annual crashes with 15,000 annual injuries from 2001 to 2005 in VDOT-maintained intersections. Intersection crashes account for about 18.2 percent of all Virginia injury crashes.6
• Towns, cities, and the counties of Henrico and Arlington, which comprise the Non-VDOT road system, experience about 59,000 crashes each year. About 34 percent of these are angle crashes, which are typically intersection or driveway related; 39 percent of the angle crashes on the non-VDOT system are severe.6
• Assessment of crashes within 150 feet of VDOT-maintained intersections reveals that fatal crashes vary from 117 to 152, with the average 131 crashes and 141 deaths each year. This accounts for 15.4 percent of all Virginia traffic fatal crashes.6
• About 39 percent of VDOT intersection crashes are severe compared to about 37 percent of all crashes in Virginia.6
• Sixty-seven percent of VDOT intersection crashes occur in urban areas where exposure to conflicts is highest. About 45 percent of urban intersection crashes occur at signalized intersections, while in rural areas, 14 percent of intersection crashes are at signals.6
• Forty-four percent of crashes at rural VDOT unsignalized intersections are severe, slightly higher than the statewide average of 37 percent.5
• Signalized intersections are characterized by a higher proportion of rear-end crashes than intersections without signals in both rural and urban areas. Intersections without signals in rural areas have a significantly higher proportion of fixed object crashes.6 (See Figure 22)
Potential causes of intersection crashes include sight distance problems, poor visibility and gap acceptance relationships, excessive speeds, lack of information, improper use of and non-compliance with traffic control devices. Crashes may be related to conflicts at public road intersections with other public roads or with private roads where little information is known about the physical characteristics. Intersection crashes may occur upstream some distance due to traffic and could be several intersections upstream of the “problem” intersection in congested conditions. Causal factors of intersection crashes are sometimes difficult to ascertain because of
Virginia’s Strategic Highway Safety Plan 29
Plan Elements
Virginia’s Strategic Highway Safety Plan 30
insufficient information about physical attributes and traffic characteristics, particularly in towns and cities. No central data warehouse is available to record the location of crashes on the non-VDOT system for automated and systematic evaluation. More is known about fatal intersection crashes due to the intense assessment for the Fatality Analysis Reporting System (FARS). FARS identifies intersection crashes as occurring within the “box” described by the edges of the intersecting roads. Injuries and Deaths Targeted Targeting a reduction in intersection crashes will require a coordinated effort between state and local authorities.
Figure 20: Annual Injuries and Deaths from Intersection Related Crashes in Virginia*
26,45826,82927,35727,782
25,177
186 177
149
194
161
0
5,000
10,000
15,000
20,000
25,000
30,000
35,000
40,000
45,000
2001 2002 2003 2004 2005
Year
Num
ber
of P
eopl
e In
jure
d
0
50
100
150
200
Num
ber
of P
eopl
e K
illed
Injuries Deaths
*All crashes within 150 feet of VDOT-maintained intersections, plus all angle crashes in towns and cities (Non-VDOT-maintained roadways)
Plan Elements
Virginia’s Strategic Highway Safety Plan 31
Unsignalized Intersection (Urban)
RearEnd31%
Angle41%
Sideswipe8%
FixObject14%
Other6%
Unsignalized Intersection (Rural)
RearEnd20%
Angle39%
Sideswipe7%
FixObject23%
Other11%
Signalized Intersection (Rural)
RearEnd42%
Angle40%
Sideswipe9%
FixObject5% Other
4%
Signalized Intersection (Urban)
RearEnd47%
Angle38%
Sideswipe9%
FixObject3%
Other3%
Urban Signalized
Rural
Unsignalized
Figure 21: Annual Injuries and Deaths from Intersection
Related Crashes in Virginia by Jurisdiction (2001-05 Average)
Figure 22: Intersection Crash Collision Type by Traffic Control and Environment
Plan Elements
Major Strategies IS-1 Improve the roadway inventory and the process to identify intersections with a
disproportionately large number of crashes. (VDOT) IS-2 Promote and implement road safety assessments of identified high crash intersections.
(VDOT) IS-3 Seek ways to link crash data, highway inventory and traffic information to better
understand the causes of intersection crashes. (VDOT, DMV) IS-4 Improve the maintenance and design project process to explicitly incorporate safety
review considerations and to facilitate better design decisions. (VDOT) IS-5 Reduce the frequency and severity of crashes at high crash and high risk intersections
through limiting conflicts through geometric, traffic control and lighting improvements (VDOT) by: • Applying state-of-the-art access management practices on all public roadways
through standards, ordinances and safety assessments. • Using safety analysis procedures and software tools to assist with access decisions
and working to eliminate redundant access points, particularly near high-crash intersections.
• Assessing the mobility and movements of all intersection users for driver information, capacity and safety on a regular basis through policy, standards and funding requirements.
• Deploying an Unsignalized Intersection Review Program to regularly assess – traffic signal, signing, and marking needs, traffic control visibility and conspicuity, sight distance, and speed reduction techniques.
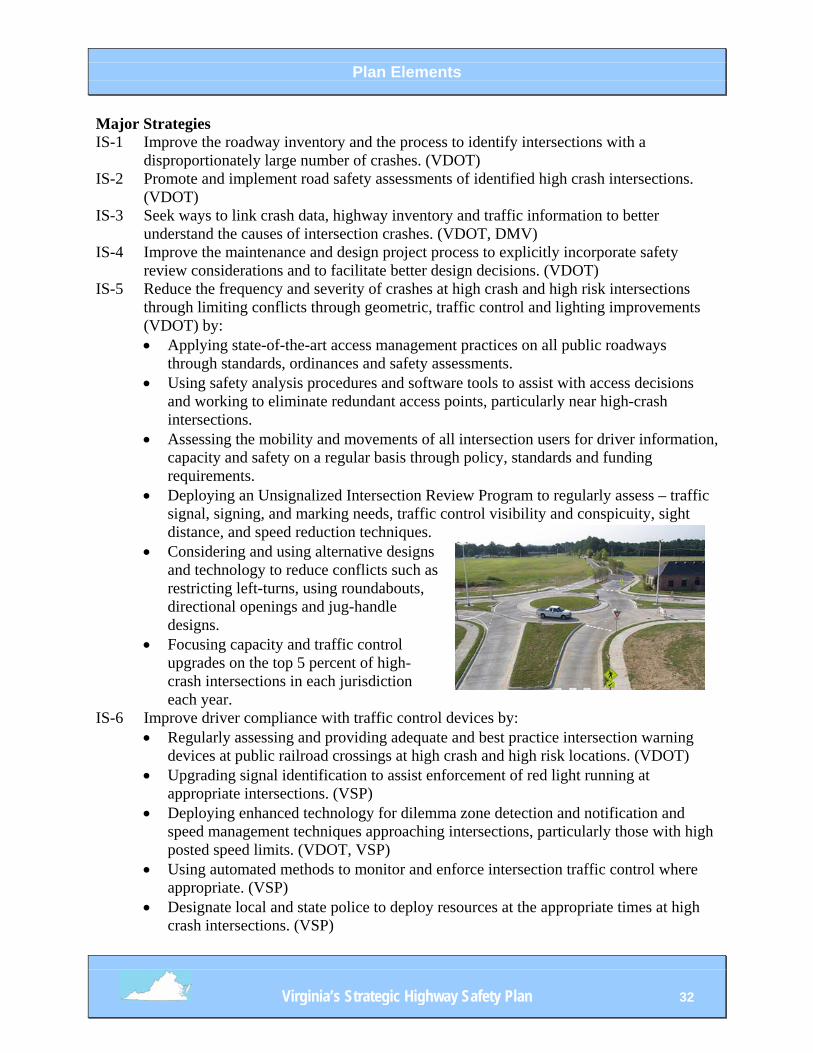
• Considering and using alternative designs and technology to reduce conflicts such as restricting left-turns, using roundabouts, directional openings and jug-handle designs.
• Focusing capacity and traffic control upgrades on the top 5 percent of high-crash intersections in each jurisdiction each year.
IS-6 Improve driver compliance with traffic control devices by: • Regularly assessing and providing adequate and best practice intersection warning
devices at public railroad crossings at high crash and high risk locations. (VDOT) • Upgrading signal identification to assist enforcement of red light running at
appropriate intersections. (VSP) • Deploying enhanced technology for dilemma zone detection and notification and
speed management techniques approaching intersections, particularly those with high posted speed limits. (VDOT, VSP)
• Using automated methods to monitor and enforce intersection traffic control where appropriate. (VSP)
• Designate local and state police to deploy resources at the appropriate times at high crash intersections. (VSP)
Virginia’s Strategic Highway Safety Plan 32
Plan Elements
Virginia’s Strategic Highway Safety Plan 33
IS-7 Educate users (DOE, DMV): • about high-crash intersections in each jurisdiction; • to better understand and comply with traffic control devices; • to better judge vehicle speeds and available gaps between vehicles; and • to provide proper right of way to all users.
Challenges 1. Intersection inventory attributes are neither comprehensive, nor consistent with police
reports. This inventory is not well maintained, mostly unknown in towns and cities, and not easily used or linked to crash data. Detailed traffic volume information is limited.
2. Expertise, resources and time is sparse. There is a need for extensive training of latest analysis tools and techniques for intersection safety.
3. Improvements compete for limited maintenance and construction funding. The high cost of right of way and utility relocation add time for program or project delivery.
4. Enforcement resources for intersection focus may be limited. Legislation is required for automated enforcement and access management laws.
Plan Elements
Virginia’s Strategic Highway Safety Plan 34
Environmental Emphasis Area:
Roadway Departures Problem Identification Motorists are particularly at risk when their vehicles leave the appropriate travel lanes or the roadway. Following are some of the primary road departure safety issues based on 2001 to 2005 crash data:
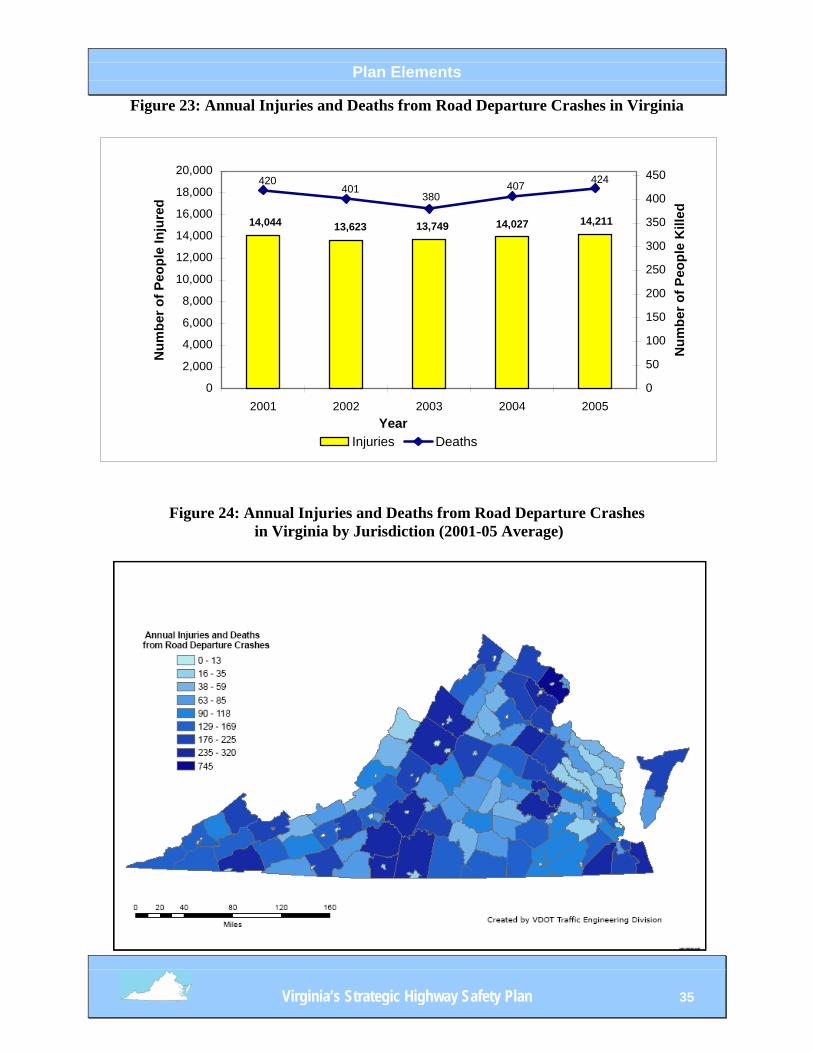
• In an average year, 44 percent of deaths (406) and 18 percent of injuries (14,000) in Virginia involved crashes where the motorist left the travel lane (Figure 23).6
• Figure 24 shows that the top 30 jurisdictions comprise over 50 percent of the annual roadway departure statewide injuries and deaths.
• Although the proportions have declined in recent years, almost half of the 23,000 roadway departure crashes each year are severe (compared to about 37 percent of all crashes in Virginia). These crashes tend to be severe because of the speed differential involved with vehicles striking a fixed object or an oncoming vehicle. Road departure crashes account for 15 percent of all crashes but about 20 percent of severe crashes.6
• About half of VDOT system road departure crashes occur on rural undivided roadways. Ninety-five percent of VDOT’s 56,000 miles of primary and secondary roads are undivided.
• About 86 percent of roadway departure crashes involve striking a fixed object. Nearly half of those crashes involve colliding with roadside earth or a tree. Of the major roadway departure collision types, 45 percent of fixed-object crashes are severe, 60 percent of non-collisions are severe, and 78 percent of head-on crashes are severe compared to 37 percent of all Virginia crashes being severe.6 (See Figure 25)
• Although more vehicles depart their lanes to the right side, 41 percent of roadway departure crashes are to the left. Head-on crashes, which are both lane and roadway departures, are primarily to the left by definition. There are on average about 1,500 head-on crashes each year in Virginia, with 60 percent on VDOT-maintained roadways. Seventy percent of head-on crashes on VDOT-maintained roads are severe; with the most severe (88 percent) on urban divided roads. Non-VDOT systems has less severe crashes with a ratio of 55 percent.6
Injuries and Deaths Targeted Roadway departure crashes are generally dispersed, requiring systematic strategies; however, roadway segments may be identified where specific 4-E (Engineering, Enforcement, Education and Emergency response) countermeasures will be effective.
Plan Elements
Figure 23: Annual Injuries and Deaths from Road Departure Crashes in Virginia
14,02713,74913,62314,044 14,211
420401
380407 424
0
2,000
4,000
6,000
8,000
10,000
12,000
14,000
16,000
18,000
20,000
2001 2002 2003 2004 2005Year
Num
ber o
f Peo
ple
Inju
red
0
50
100
150
200
250
300
350
400
450
Num
ber o
f Peo
ple
Kill
ed
Injuries Deaths
Figure 24: Annual Injuries and Deaths from Road Departure Crashes in Virginia by Jurisdiction (2001-05 Average)
Virginia’s Strategic Highway Safety Plan 35
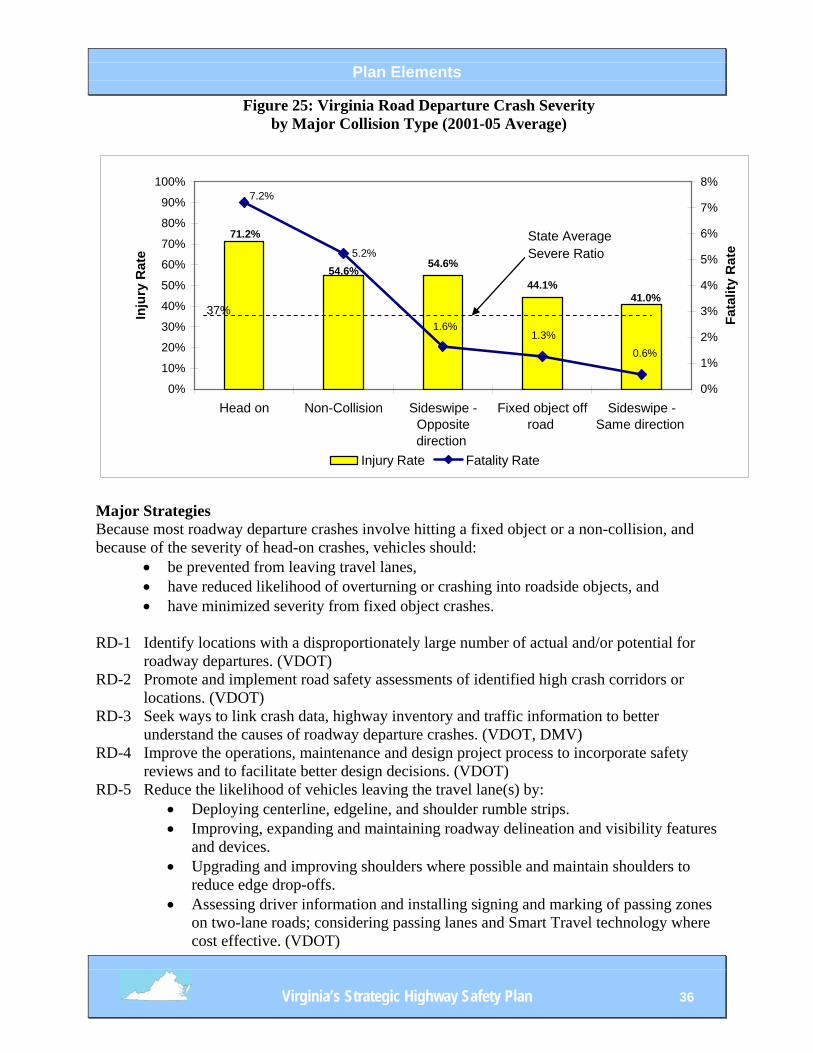
Plan Elements
Figure 25: Virginia Road Departure Crash Severity by Major Collision Type (2001-05 Average)
54.6%
44.1%
71.2%
54.6%
41.0%
5.2%
0.6%
1.6%1.3%
7.2%
0%
10%
20%
30%
40%
50%
60%
70%
80%
90%
100%
Head on Non-Collision Sideswipe -Oppositedirection
Fixed object offroad
Sideswipe -Same direction
Inju
ry R
ate
0%
1%
2%
3%
4%
5%
6%
7%
8%
Fata
lity
Rat
e
Injury Rate Fatality Rate
State Average Severe Ratio
37%
Major Strategies Because most roadway departure crashes involve hitting a fixed object or a non-collision, and because of the severity of head-on crashes, vehicles should:
• be prevented from leaving travel lanes, • have reduced likelihood of overturning or crashing into roadside objects, and • have minimized severity from fixed object crashes.
RD-1 Identify locations with a disproportionately large number of actual and/or potential for roadway departures. (VDOT)
RD-2 Promote and implement road safety assessments of identified high crash corridors or locations. (VDOT)
RD-3 Seek ways to link crash data, highway inventory and traffic information to better understand the causes of roadway departure crashes. (VDOT, DMV)
RD-4 Improve the operations, maintenance and design project process to incorporate safety reviews and to facilitate better design decisions. (VDOT)
RD-5 Reduce the likelihood of vehicles leaving the travel lane(s) by: • Deploying centerline, edgeline, and shoulder rumble strips. • Improving, expanding and maintaining roadway delineation and visibility features
and devices. • Upgrading and improving shoulders where possible and maintain shoulders to
reduce edge drop-offs. • Assessing driver information and installing signing and marking of passing zones
on two-lane roads; considering passing lanes and Smart Travel technology where cost effective. (VDOT)
Virginia’s Strategic Highway Safety Plan 36
Plan Elements
Virginia’s Strategic Highway Safety Plan 37
RD-6 Minimize the adverse consequences of leaving the roadway at high crash and high risk locations by:
• Reviewing and improving roadside safety devices, where appropriate, as part of restoration, rehabilitation and reconstruction projects.
• Modifying roadside clear zones particularly in the vicinity of obstacles. • Removing, relocating, shielding or delineating trees, utilities and other fixed
objects. • Installing appropriate medians and median barriers in narrow widths where left-
side roadway departure crashes occur. (VDOT) RD-7 Designate local and state police to deploy resources at the appropriate places and times.
(VSP) RD-8 Educate drivers to: (DOE, DMV):
• Properly negotiate curves. • Drive appropriately for traffic and weather conditions. • Make passing maneuvers following signing and marking, particularly on two-lane
roads. • Recover safely after leaving the travel lanes.
RD-9 Educate EMS about roadway departure crashes and the secondary incidents sometimes caused by EMS response. Develop a comprehensive incident management approach that will ensure appropriate and timely EMS responses on high crash or high risk roadway departure corridors, particularly in rural areas. (VDH)
Challenges 1. Traffic volume, crash and roadway inventory data must be accurately and efficiently
collected and disseminated. Potential versus actual risk needs to be consistently measured. 2. Expertise, resources and time is sparse. There is a lack of good analysis tools. The need for
extensive training of latest tools and techniques for roadway departure safety remains. 3. Roadway departure safety improvements compete for limited maintenance and construction
funding. The high cost of right of way and utility relocation add time for program or project delivery. There is also a strong potential for project scopes to increase beyond their original intent.
4. There is also additional time for driver training to cover emergency situations. Driver acceptance and appropriate use of new technology and designs are important.
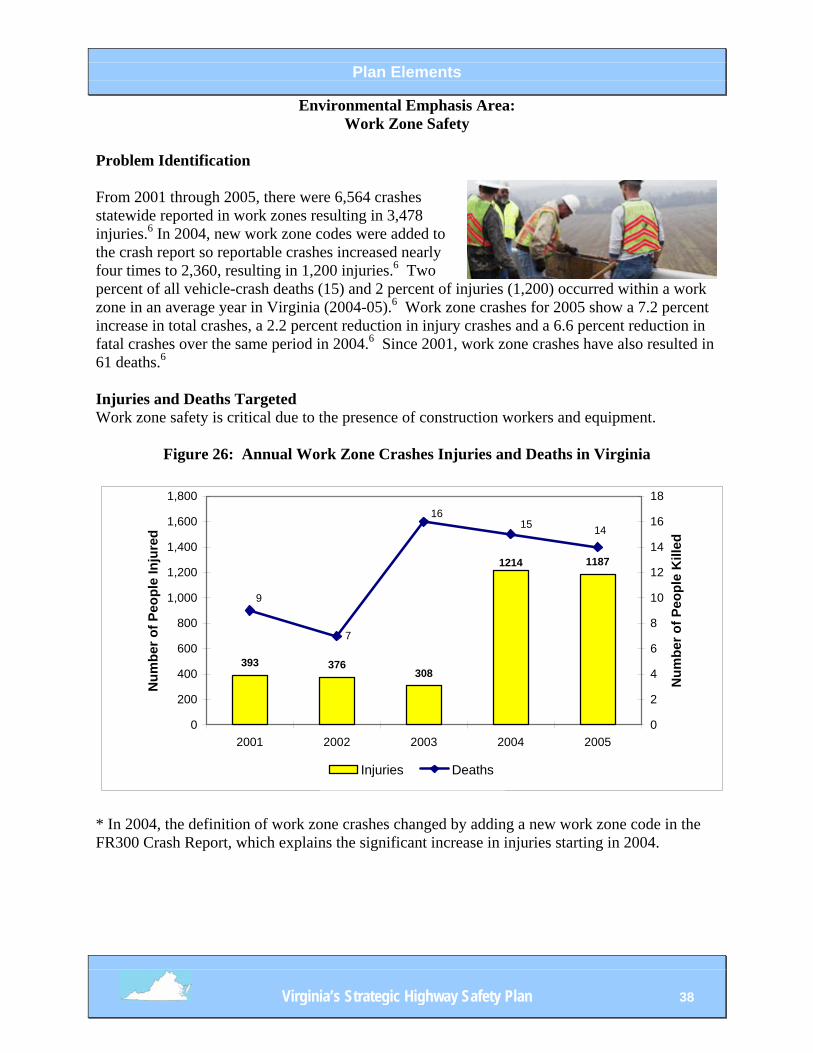
Plan Elements
Environmental Emphasis Area: Work Zone Safety
Problem Identification
Virginia’s Strategic Highway Safety Plan 38
njuries (1,200) occurred within a work t
in
From 2001 through 2005, there were 6,564 crashes statewide reported in work zones resulting in 3,478 injuries.6 In 2004, new work zone codes were added to the crash report so reportable crashes increased nearly four times to 2,360, resulting in 1,200 injuries.6 Two percent of all vehicle-crash deaths (15) and 2 percent of izone in an average year in Virginia (2004-05).6 Work zone crashes for 2005 show a 7.2 percenincrease in total crashes, a 2.2 percent reduction in injury crashes and a 6.6 percent reduction fatal crashes over the same period in 2004.6 Since 2001, work zone crashes have also resulted in61 deaths.6 Injuries and Deaths Targeted Work zone safety is critical due to the presence of construction workers and equipment.
Figure 26: Annual Work Zone Crashes Injuries and Deaths in Virginia
393 376308
11871214
7
9
1615 14
0
200
400
600
800
1,000
1,200
1,400
1,600
1,800
2001 2002 2003 2004 2005
Year
Num
ber o
f Peo
ple
Inju
red
0
2
4
6
8
10
12
14
16
18
Num
ber o
f Peo
ple
Kill
ed
Injuries Deaths
* In 2004, the definition of work zone crashes changed by adding a new work zone code in the FR300 Crash Report, which explains the significant increase in injuries starting in 2004.
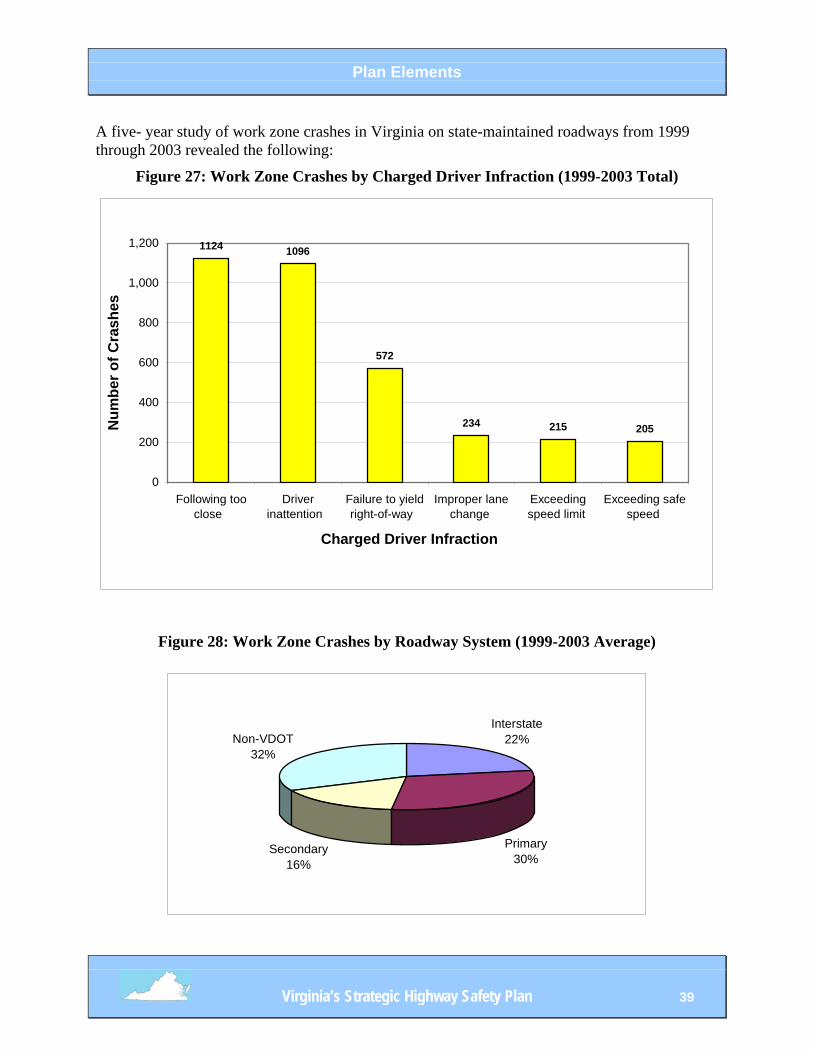
Plan Elements
A five- year study of work zone crashes in Virginia on state-maintained roadways from 1999 through 2003 revealed the following:
Figure 27: Work Zone Crashes by Charged Driver Infraction (1999-2003 Total)
1124 1096
572
234 215 205
0
200
400
600
800
1,000
1,200
Following tooclose
Driverinattention
Failure to yieldright-of-way
Improper lanechange
Exceedingspeed limit
Exceeding safespeed
Charged Driver Infraction
Num
ber o
f Cra
shes
Figure 28: Work Zone Crashes by Roadway System (1999-2003 Average)
Interstate22%
Primary30%
Secondary16%
Non-VDOT32%
Virginia’s Strategic Highway Safety Plan 39

Plan Elements
Virginia’s Strategic Highway Safety Plan 40
Work Zone Crashes by Driver by Age Group and Gender6: - 24 percent were 21-30 yrs. old (61 percent male) - 22 percent were 31-40 yrs. old (63 percent male) - 18 percent were 41-50 yrs. old (62 percent male) - 14 percent were 15-20 yrs. old (57 percent male) - 12 percent were 51-60 yrs. old (66 percent male) - 6 percent were 61-70 yrs. old (63 percent male) - 5 percent were > 70 yrs. old (61 percent male)
Focusing on high-volume, high-speed work zones and reducing rear end collisions, driver inattention, and excessive speeds are all necessary for reductions in severe crashes. Targeting efforts to motorists between the ages of 15-50 years old will make our work zones safer. Major Strategies WZ-1 Improve work zone design and implementation with better data analysis and with more
detailed plans. Traffic flow and safety needs to be considered in the early design phase of construction and maintenance projects. (VDOT)
WZ-2 Develop mandatory work zone safety training for work zone designers, installers, and reviewers. Trained personnel will enhance the implementation of temporary traffic control plans. Work crew leader accreditation will ensure compliance in construction, maintenance, utility, and permit work zones. (VDOT)
WZ-3 Provide motorists real-time work zone information and traffic conditions through the use of Smart Travel technology on high volume roadways. Up-to-date queue lengths, travel times, or delays provide advance warning enabling motorists to choose another route and reduce congestion. (VDOT)
WZ-4 Improve traveler information and route planning by requiring advance notification of work zone lane closures and openings and posting on Virginia’s 511 system. (VDOT)
WZ-5 Investigate using brighter traffic control devices in work zones to improve visibility and delineation of the travel way. Enhancements include brighter sheeting for plastic drums, use of all-weather continuous pavement markings, and improved sign sheeting for long-term post-mounted signing. (VDOT)
WZ-6 Deploy speed display trailers in high-volume, high-speed construction projects and coordinate increased enforcement with the Virginia State Police. The combined use of speed display trailers and the presence of the law enforcement should reduce excessive speeds and tailgating. (VSP)
WZ-7 Increase public awareness of how to safely navigate work zones. Avenues for increased awareness include: National Work Zone Awareness Week, VTCA/VDOT Work Zone High School Driver Education Awareness, public information plans for all significant projects on the national highway system, and funding for driver awareness campaigns. (VDOT)
Plan Elements
Virginia’s Strategic Highway Safety Plan 41
Work Zone Safety Challenges
1. Development of traffic control plans requires: additional manpower; funding to purchase analyzing tools and training time to become proficient, and additional time to adequately monitor and evaluate the effectiveness of the temporary traffic control.
2. Training all personnel involved in the design, installation, and review of work zone traffic control requires: funding, time needed to attend, and availability of state forces while training is being performed.
3. Use of Smart Travel technologies requires: funding, training, development of specifications, and manpower for monitoring and evaluating the technology devices and/or systems in the field.
4. Notification of work zone lane closures requires policy development and distribution, and time required by contractors/VDOT personnel and Smart Traffic Centers to track closure times.
5. The use of brighter work zone traffic control devices requires additional funding to purchase, and time to develop/revise policy and implement.
6. The use of speed trailers in work zone with coordination by the Virginia State Police requires: funding for purchasing speed trailers and available state police/law enforcement to monitor and implement the program.
7. Increasing the public’s awareness to work zone hazards requires funding and additional manpower.
Plan Elements
Virginia’s Strategic Highway Safety Plan 42
Fundamental Emphasis Area: Traffic Records
As each of the emphasis areas seeks to improve highway safety, complete and accurate safety data will be required. Traditionally, this has been crash information; however other types of data are essential, such as emergency response times, hospital patient data, and citation adjudication, in order to fully measure the success or failure of the plan. Traffic records are the foundation for all decisions to effectively target roadway, driver and vehicle safety improvements. While the standardization of crash data has undergone significant improvements over the past decade, problems related to data accuracy, completeness, accessibility, and timeliness still exist. Problem Identification Transportation safety information within the commonwealth is currently warehoused by separate agencies in a variety of formats ranging from paper to electronic databases. These data are difficult to query quickly and are not always consistent or integrated across agencies. Understanding and making optimal use of information technology is a critical challenge facing Virginia’s transportation professionals. The foundation of a comprehensive traffic safety analysis system is the identification of the root causes of traffic crashes. Crash, traffic, roadway inventory, citations, medical, judiciary, and driver records must be integrated and available so proper decisions about safety policies and projects can be made. A complete traffic records program is necessary for problem identification planning, operational management, and evaluation of a state’s safety activities. An integrated traffic records system is essential to the implementation of all highway safety countermeasures and is the key ingredient to measuring their effectiveness. When a traffic crash occurs, law enforcement (state or local) complete an FR300 Crash Report for any crash involving injury, death, or property damage of $1,000 or more. The report is reviewed by a supervisor for completeness and forwarded to DMV in a hard-copy format. The report is processed by multiple agencies (DMV, VDOT, and enforcement agencies) resulting in data quality and timely access issues. Like many other states, Virginia is experiencing difficulty capturing crash data for a variety of reasons:
• The existing FR300 does not capture all downstream information (such as citation disposition).
• The process of collecting information is time-consuming and technically cumbersome. • The report is handled by multiple agencies with information supplied by several
departments. • Substantial manual effort is expended to complete and correct the report. • There is a significant backlog of reports (four to five months) to be processed. • The data is not directly accessible by all groups and persons needing it.
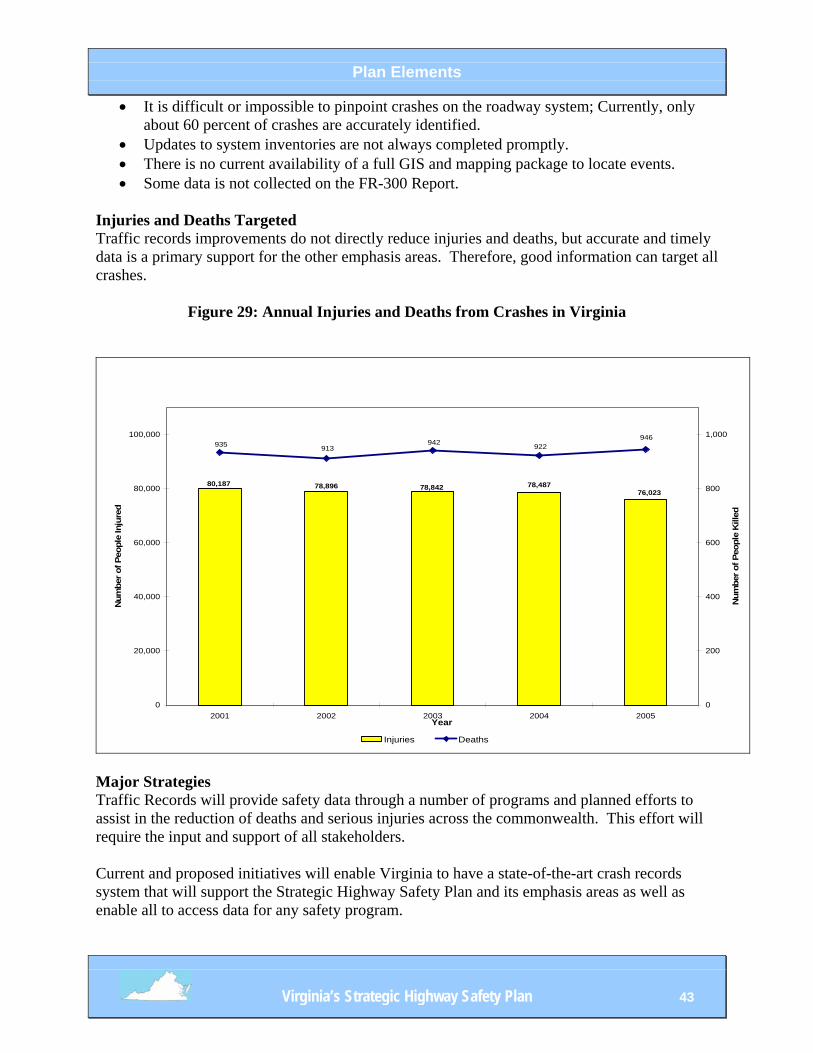
Plan Elements
• It is difficult or impossible to pinpoint crashes on the roadway system; Currently, only about 60 percent of crashes are accurately identified.
• Updates to system inventories are not always completed promptly. • There is no current availability of a full GIS and mapping package to locate events. • Some data is not collected on the FR-300 Report.
Injuries and Deaths Targeted Traffic records improvements do not directly reduce injuries and deaths, but accurate and timely data is a primary support for the other emphasis areas. Therefore, good information can target all crashes.
Figure 29: Annual Injuries and Deaths from Crashes in Virginia
76,02378,48778,84278,89680,187
946922942
913935
0
20,000
40,000
60,000
80,000
100,000
2001 2002 2003 2004 2005Year
Num
ber o
f Peo
ple
Inju
red
0
200
400
600
800
1,000
Num
ber o
f Peo
ple
Kill
edInjuries Deaths
Major Strategies Traffic Records will provide safety data through a number of programs and planned efforts to assist in the reduction of deaths and serious injuries across the commonwealth. This effort will require the input and support of all stakeholders. Current and proposed initiatives will enable Virginia to have a state-of-the-art crash records system that will support the Strategic Highway Safety Plan and its emphasis areas as well as enable all to access data for any safety program.
Virginia’s Strategic Highway Safety Plan 43
Plan Elements
Virginia’s Strategic Highway Safety Plan 44
The following strategies will be implemented to improve traffic records: TR-1 Realign the Traffic Records Coordinating Committee (TRCC) to have a more
multidisciplinary membership that includes managers, collectors, and users of traffic records including public health and injury control data systems. (VDOT, DMV, VSP)
TR-2 Adopt a state traffic safety information systems strategic plan through TRCC with implementation of the Traffic Records Electronic Data System (TREDS) project as a cornerstone. TREDS will serve as a state-of-the-art integrated system that will have the capability to provide current and future safety data needs to support multiple agencies. The system will:
• Streamline data collection for law enforcement. • Increase efficiency and data quality by use of automated edit checks. • Provide the ability to process crash reports electronically. • Provide a GIS mapping interface to more accurately locate crashes with GPS. • Provide electronic submission of reports to DMV. • Eliminate manual data entry of the same report by multiple agencies. • Include flexible architecture to address different analysis needs. • Provide more robust and accessible reporting capabilities.
TR-3 Adopt the National Agenda for improvement of highway safety information systems. (TRCC) The goals are to:
• instill an appreciation of the value of highway safety information systems among leaders who develop and manage highway safety policy;
• coordinate highway safety information among organizations at all jurisdictional levels for developing better highway transportation policy;
• integrate highway safety programs and information systems planning;. • provide highway safety information managers and users with resources needed to
select appropriate technology to support their needs;. • establish a cadre of highway safety professionals trained in analytic methods
appropriate for highway safety information evaluation; • establish and promote technical standards for highway safety information systems
that are critical to highway transportation safety programs and policies. TR-4 Capture data elements related to large truck deaths. The goal of the Federal Motor
Carrier Safety Administration (FMCSA) is to reduce the large truck death rate by 41 percent from 1996 to 2008. Certain data elements should be included on future crash reports. These data elements will benefit FMCSA and other state program needs. Currently only Virginia State Police furnish information for the Commercial Vehicle Accident Reporting System. Commercial vehicles crashes statewide will be uploaded to FMCSA through TREDS. (FMCSA)
TR-5 Capture crash injury outcomes using the Crash Outcome Data Evaluation System to link statewide traffic records with injury outcome data and support highway safety decision-making at the all levels. This will reduce deaths, non-fatal injuries and health care costs resulting from motor vehicle crashes. Currently, the system only incorporates information where an individual is admitted to the hospital, not those who are treated in an emergency room and released. A wealth of untapped information relating to crash injury outcomes will now be captured. (TRCC).
Plan Elements
Virginia’s Strategic Highway Safety Plan 45
TR-6 Automate the Fatality Analysis Reporting System (FARS) FARS data, available online and from DMV, is used to project yearly outcomes and forecast trends for safety decisions. This is a labor intensive effort and should be automated. (TRCC, DMV, NHTSA)
Traffic Records Challenges The success of Virginia’s integrated traffic records system will require the support of multiple agencies and development of working relationships through the Traffic Records Coordinating Committee. As with any major statewide initiative, there are obstacles that must be overcome. A primary challenge will be linking various data elements available from different sources. To accomplish this, the following must be considered: 1. Multiple state agencies and local jurisdictions need to understand the importance of TREDS
and sharing data for the common good of highway safety. The various enforcement agencies must commit to the proposed electronic crash reporting concept.
2. For TREDS to grow and remain technologically current, it will require a steady funding stream. These funds will be necessary to maintain data, maintenance of systems, and future upgrades that may be necessary as technology changes. Attracting and retaining personnel with unique skill sets will also be challenging.
3. A complete and up-to-date GIS mapping package is necessary to provide the necessary technology to enable enforcement personnel and internal DMV/VDOT staff to accurately locate crashes on public roadways. It is important that everyone receives the latest in software upgrades and mapping needs as quickly as possible. The public roadway inventory needs to be kept current for locating purposes to satisfy the 100 percent location requirement of all crashes.
4. With two major projects occurring simultaneously (Roadway Network System and TREDS) there must be consistent communication to ensure similar requirements.
5. Confidentiality of certain information needs to be considered in the linking of systems and data.
Plan Elements
Virginia’s Strategic Highway Safety Plan 46
Fundamental Emphasis Area: Transportation Safety Planning
Problem Identification Transportation safety planning provides the foundation for addressing human factor issues and environmental hazards. Good transportation safety planning relies on accurate and timely traffic records. To be successful, Virginia needs to integrate safety as a critical component of all statewide, regional, and local transportation planning. A multi-perspective, system-wide, multimodal approach is needed to facilitate the review of all potentially hazardous transportation conditions and provide targeted recommendations. Transportation safety planning is not a documented process or a standard practice in Virginia; however, many safety concerns are reviewed and resolved by various agencies and qualify as such. Individual jurisdictions, as well as state and regional agencies have widely varied transportation safety planning practices. For example, roadway safety assessments of existing and proposed facilities are not consistently implemented statewide. To make informed decisions about highway crash trends, state, regional, and local agencies need current data and analysis for accurate problem identification. With good crash records, strategies can be implemented to address the causes of crashes. Additionally, safety between modes of transportation needs to be more fully addressed. A regularly updated Strategic Highway Safety Plan is necessary to allow key stakeholders to identify strategies and actions that can be implemented to reduce injuries and deaths from motor vehicle crashes statewide. Major Strategies TS-1 Incorporate transportation safety planning and best safety practices into all human
factors-related and environment-related projects and programs through the 4-Es (engineering, enforcement, education and emergency response) at the state, regional, and local levels through consistent goals, communication, policies, procedures, research, marketing, training, and evaluation. (VDOT, DMV, VSP, VDH, DOE)
TS-2 Identify and target the highest crash corridors and regions in the commonwealth for high-priority improvements through the 4-Es and seek resources to mitigate these crash trends. A listing of safety funding opportunities can be found in Appendix B. (VDOT, DMV, VSP, VDH, DOE)
TS-3 Develop and implement a safety certification process to identify crash trends and incorporate appropriate countermeasures on surface transportation projects in the commonwealth, including design, maintenance, construction, and operations. (VDOT)
TS-4 Continue to enhance communication and cooperation by federal and state partners through Virginia’s Surface Transportation Safety Executive Committee by monitoring and annually evaluating the commonwealth’s Strategic Highway Safety Plan with an update every five years. (VDOT, DMV)
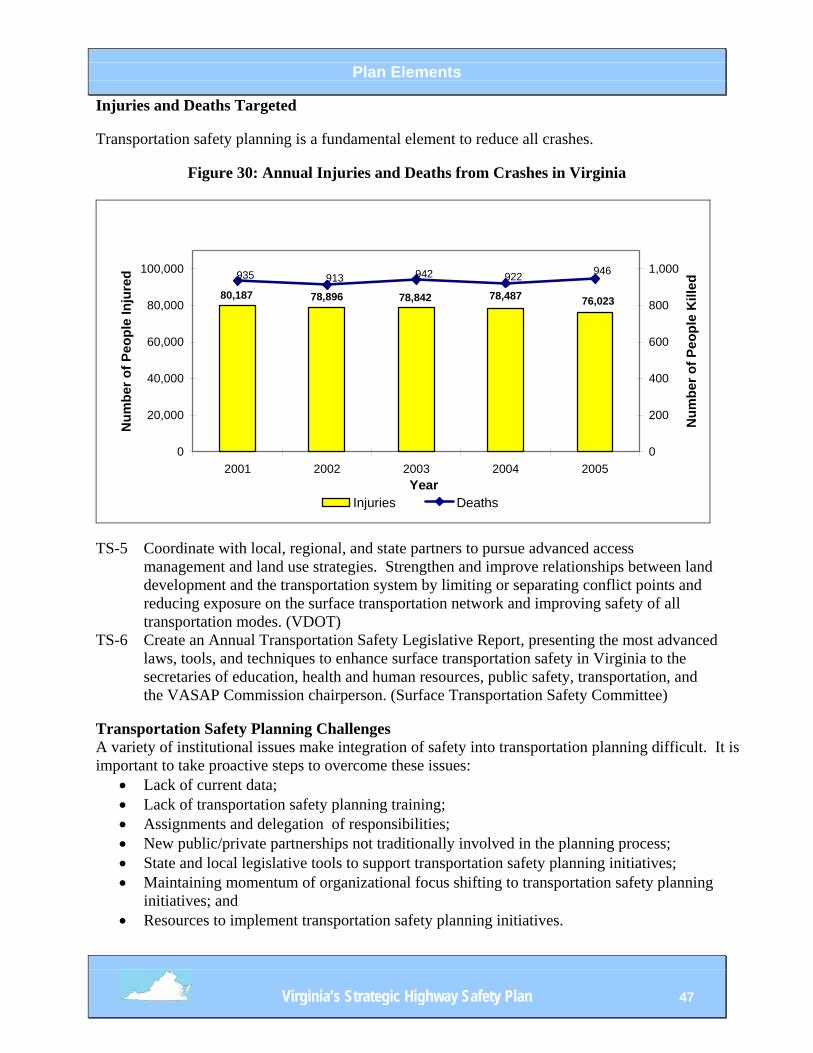
Plan Elements
Injuries and Deaths Targeted Transportation safety planning is a fundamental element to reduce all crashes.
Figure 30: Annual Injuries and Deaths from Crashes in Virginia
76,02378,48778,84278,89680,187
946922942913935
0
20,000
40,000
60,000
80,000
100,000
2001 2002 2003 2004 2005Year
Num
ber o
f Peo
ple
Inju
red
0
200
400
600
800
1,000
Num
ber o
f Peo
ple
Kill
ed
Injuries Deaths
TS-5 Coordinate with local, regional, and state partners to pursue advanced access
management and land use strategies. Strengthen and improve relationships between land development and the transportation system by limiting or separating conflict points and reducing exposure on the surface transportation network and improving safety of all transportation modes. (VDOT)
TS-6 Create an Annual Transportation Safety Legislative Report, presenting the most advanced laws, tools, and techniques to enhance surface transportation safety in Virginia to the secretaries of education, health and human resources, public safety, transportation, and the VASAP Commission chairperson. (Surface Transportation Safety Committee)
Transportation Safety Planning Challenges A variety of institutional issues make integration of safety into transportation planning difficult. It is important to take proactive steps to overcome these issues:
• Lack of current data; • Lack of transportation safety planning training; • Assignments and delegation of responsibilities; • New public/private partnerships not traditionally involved in the planning process; • State and local legislative tools to support transportation safety planning initiatives; • Maintaining momentum of organizational focus shifting to transportation safety planning
initiatives; and • Resources to implement transportation safety planning initiatives.
Virginia’s Strategic Highway Safety Plan 47
Conclusion and Next Steps
Virginia’s Strategic Highway Safety Plan 48
CONCLUSION
Virginia’s Strategic Highway Safety Plan establishes a transportation safety charter and sets up ambitious, but realistic goals for reducing annual deaths by 100 and annual injuries by 4,000 from motor vehicle crashes statewide within the next five years. The plan, a joint effort by Virginia safety partners, presents these messages on transportation safety in Virginia: Transportation Safety is a Top Public Health Concern. The plan recognized that transportation safety is a top public heath concern in the commonwealth. It costs almost 1,000 lives in Virginia every year and is the leading cause of death for ages one to 29. Transportation Safety Should be Addressed Systematically. This plan identifies transportation safety issues and proposes multi-perspective strategies to address the problem. It views the surface transportation system as a whole and understands the interaction between the roadway, driver, and vehicle. It identifies two critical factors to reduce crashes – correcting poor driver behavior and providing the driver with timely information about the roadway ahead. To enhance road safety in Virginia, the plan identifies the following three emphasis areas:
Human Factors which includes driver behavior, driver subgroups and pedestrian and bicyclist safety.
Environmental which includes roadway departure, intersection safety, work zone safety and pedestrian and bicyclist safety.
Fundamental which includes traffic records and transportation safety planning. Motor vehicle crashes are to some extent predictable and thus preventable. In this plan, many state-of-art countermeasures are identified based on current research, discussions with safety partners, and best practices worldwide. Transportation Safety is a Personal and Shared Responsibility. The plan recognizes that transportation safety is a personal and shared responsibility. Reducing injuries and deaths on Virginia roads requires the commitment of informed decision-making by multiple government agencies, industry, non-governmental organizations and citizens statewide.

Conclusion and Next Steps
Virginia’s Strategic Highway Safety Plan 49
NEXT STEPS
The Strategic Highway Safety Plan will be Supported with Safety Action Plans. Each involved state agency is developing a Safety Action Plan to be updated annually. The purpose of these plans is to implement the strategies listed in this plan. Some of the strategies may face constraints such as funding, manpower, or legislative requirements. It will be the purpose of the action plan to track the progress and status of each strategy through the following categories:
Strategy description Tactic description Responsible agency Partners Development stage Priority Safety benefit
Time frame New to agency Funding source Resource level Estimated cost Annual benchmark Constraints
The Plan is a Living Document. This plan is a living document. The Virginia Surface Transportation Safety Executive Committee will consolidate and monitor agency action plans and provide annual updates to the sponsoring Secretaries and other advocacy groups. As new strategies and technological advances are developed, the Executive Committee will encourage agencies to amend their action plans. The Executive Committee will continue to monitor and report Virginia’s safety performance through quarterly and annual reports. For more information, please contact: [email protected] This plan will increase awareness of the full spectrum of Virginia’s transportation safety programs. It is hoped that the plan will inspire and facilitate increased cooperation, innovation and commitment to reducing injuries and deaths on Virginia’s streets and highways. Now, it is time for action. “Together, we will reduce injuries and deaths from crashes in Virginia.”
References
Virginia’s Strategic Highway Safety Plan 50
REFERENCES 1. Lawley Publications, Britain Reduces Traffic Fatalities by Half While U.S. Shows
Little Change, The Urban Transportation Monitor, VOL 19, No 20, Nov. 11,2005 2. Virginia Department of Motor Vehicles, Virginia Crash Facts (1999-2004) 3. National Highway Traffic Safety Administration, Motor Vehicle Traffic Crashes as a
Leading Cause of Death in the United States, 2001-2004 4. National Safety Council, 2002. International Accident Facts (3rd ed.), Author, Itasca,
IL. 5. National Highway Traffic Safety Administration, Motor Vehicles Crash Fatalities
and Injuries, 2005 Projections, presentation found in http://www-nrd.nhtsa.dot.gov/pdf/nrd-30/NCSA/PPT/2006/810583.pdf, Accessed on July 17, 2006
6. Virginia Department of Transportation, Highway and Traffic Records Information System
7. Virginia Department of Motor Vehicles, Citizen Services System and Centralized Accident Processing System.
8. Virginia Department of Education, Preventing aggressive Driving, curriculum and administrative guide for driver education in Virginia, 2003
9. Virginia Department of Alcoholic Beverage Control, Control-Service-Revenue: Achieving the Balance, 2005 Annual Report, found in http://www.abc.virginia.gov/admin/annual/docs/2005ar.pdf, Accessed on July 17, 2006
10. The Century Council, Fact Sheet — 65 percent Campaign, Joining Together to Fight Underage Drinking, found in http://www.centurycouncil.org/underage/65_factsheet.html, Accessed on July 17, 2006
11. National Cooperative Highway Research Program, NCHRP Report 500 12. Cheryl W. Lynn, Kennedy, Jami l, Safety belt and motorcycle helmet use in Virginia :
the Summer 2005 update , Virginia Transportation Research Council, Survey Technical Report,2005, found in http://vtrc.virginiadot.org/PubDetails.aspx?PubNo=06-R4, Accessed on July 18, 2006
13. Houston, D.J., and Richardson, L.E., Jr. Getting Americans to Buckle Up: The Efficacy of State Seat Belt Laws. Accident Analysis and Prevention, Vol. 37, 2005, pp. 1114-1120.
14. Shults, R.A., Elder, R.W., Sleet, D.A., Thompson, R.S., and Nichols, J.L. Primary Enforcement Seat Belt Laws Are Effective Even in the Face of Rising Belt Use Rates: Short Communication. Accident Analysis and Prevention, Vol. 36, No. 3, 2004, pp. 491-193
15. Virginia Department of Motor Vehicles, 2006 Survey on “Click it or Ticket it “, 2006
Appendix A-1
Virginia’s Strategic Highway Safety Plan A-1 - 1 -
Surface Transportation Safety Executive Committee Members David Mitchell – Co-Chair Deputy Commissioner Transportation Safety Services Department of Motor Vehicles 2300 West Broad St. Richmond, VA 23220 Phone: 804-367-6715 [email protected] Raymond Khoury – Co-Chair State Traffic Engineer Traffic Engineering Division Virginia Department of Transportation 1221 East Broad Street Richmond, VA 23219 Phone: 804-786-2965 [email protected] Gary Brown Director Office of Emergency Medical Services Virginia Department of Health 109 Governor St., Suite UB55 Richmond, VA 23219 Phone: 804-864-7600 [email protected]
Angela Coleman Field Services Supervisor Virginia Alcohol Safety Action Program 701 E. Franklin St. Richmond, VA 23219 Phone: 804-786-5895 [email protected] Lt. Col. Gene Stockton Director, Bureau of Field Operations Virginia State Police P.O. Box 27472 7700 Midlothian Turnpike Richmond, VA 23261-7472 Phone: 804-674-2013 [email protected] Vanessa Wigand Health, Physical Education, & Driver Education Specialist Virginia Department of Education P.O. Box 2120 Richmond, VA 23284-3024 Phone: 804-225-3300 [email protected]
Appendix A-2
Virginia’s Transportation Safety Charter WHEREAS, the Commonwealth of Virginia seeks to identify and seize all opportunities to enhance the safety of Virginia’s surface transportation system by reducing the risk of deaths, injuries, and crashes;
WHEREAS, the U.S. Congress enacted the Safe, Accountable, Flexible, Efficient Transportation Equity Act: A Legacy for Users (SAFETEA-LU) and SAFETEA-LU authorizes the Federal surface transportation programs for highways, highway safety, and transit from 2005-2009;
WHEREAS, SAFETEA-LU establishes a new core Highway Safety Improvement Program that is structured and funded to make significant progress in reducing highway injuries and deaths and creates a positive agenda for increased safety on our highways by almost doubling the funds for infrastructure safety and requiring data driven, results-oriented strategic highway safety planning efforts to create an effective integrated and coordinated transportation safety program;
WHEREAS, Virginia established through interagency agreement in January 1999, the Safety Management System Executive Committee; WHEREAS, Virginia is preparing a new Strategic Highway Safety Plan to meet the current safety challenges for the following elements: driver behavior, special users, bicyclists and pedestrians, intersections, roadway departures, work zones, traffic records, and transportation safety planning; THEREFORE, be it resolved that the parties to this agreement will commit to continue their support of the work of the Surface Transportation Safety Executive Committee, which includes representation as follows: The Executive Steering Committee shall be comprised of the following agencies:
Commission of the Virginia Alcohol Safety Action Program (VASAP) Department of Education (DOE) Department of Health (VDH) Department of Motor Vehicles (DMV) Department of Transportation (VDOT) Virginia State Police (VSP)
Ad hoc Membership shall include:
Department for the Aging Department of Rail and Public Transportation (DRPT) Federal Highway Administration (FHWA)
Virginia’s Strategic Highway Safety Plan A-2
Appendix A-2
Federal Motor Carrier Safety Administration (FMCSA) National Highway Traffic Safety Administration (NHTSA) Virginia Transportation Research Council (VTRC)
The committee shall be co-chaired by VDOT and DMV representatives and shall meet quarterly, at a minimum, although the co-chairs may call special meetings as necessary. The purpose of this committee shall be to integrate and coordinate all transportation safety programs, in particular those programs established to comply with the mandates outlined in SAFETEA-LU and the National Highway Safety Act of 1966 to reduce the number of deaths and injuries from motor vehicle crashes in the commonwealth The general tasks to be preformed by this committee are as follows:
1. Establish statewide surface transportation safety goals and objectives. 2. Prepare and update the Commonwealth of Virginia’s Strategic Highway
Safety Plan. 3. Ensure that all opportunities to improve highway safety are identified,
prioritized, supported, and implemented as appropriate and evaluated in all phases of enforcement, education, engineering, and emergency response.
4. Regularly gather, analyze, and distribute information for selecting and implementing effective highway safety strategies and projects.
5. Establish multi-disciplinary subcommittees, such as the Traffic Records Coordinating Committee, and develop communication plans as needed, to review, recommend, implement and report on safety emphasis areas.
6. Provide an annual status report on the implementation of the Strategic Highway Safety Plan to the Secretaries of Transportation, Public Safety, Education and Health and Human Resources, and VASAP Commission Chair.
Virginia’s Strategic Highway Safety Plan A-2
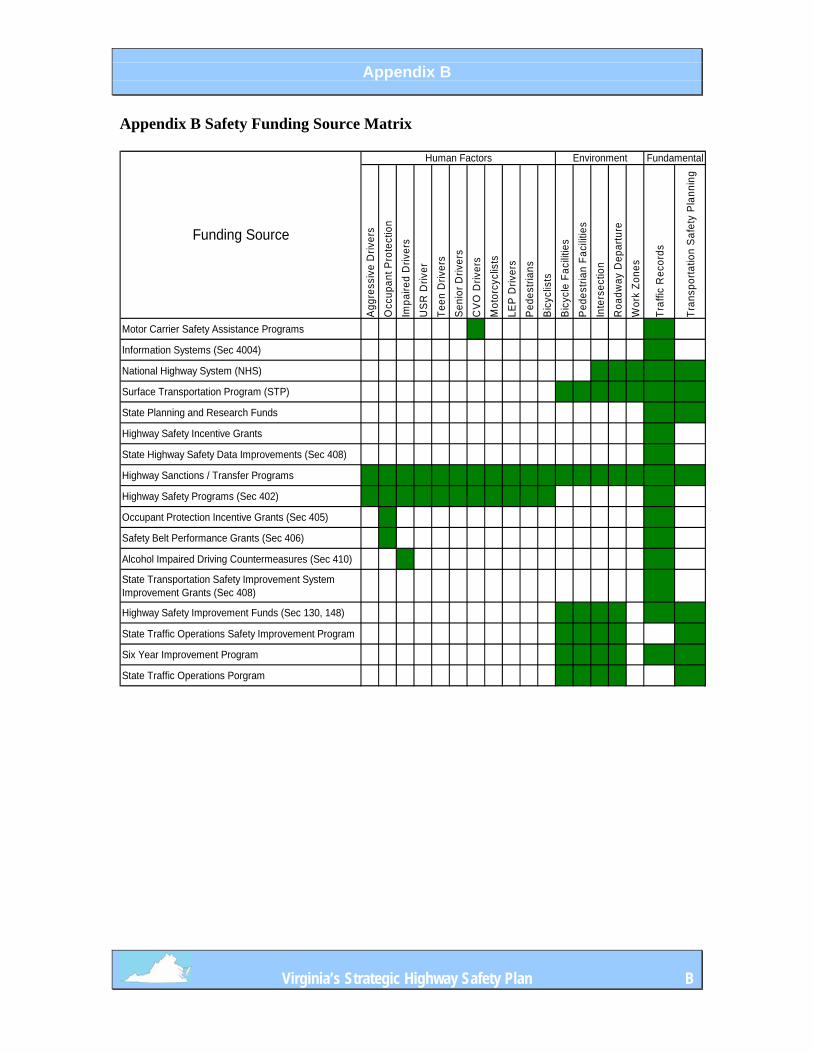
Appendix B
Appendix B Safety Funding Source Matrix
Aggr
essi
ve D
river
sO
ccup
ant P
rote
ctio
nIm
paire
d D
river
sU
SR D
river
Teen
Driv
ers
Seni
or D
river
sC
VO D
river
sM
otor
cycl
ists
LEP
Driv
ers
Pede
stria
ns
Bicy
clis
tsBi
cycl
e Fa
cilit
ies
Pede
stria
n Fa
cilit
ies
Inte
rsec
tion
Roa
dway
Dep
artu
reW
ork
Zone
s
Traf
fic R
ecor
ds
Tran
spor
tatio
n Sa
fety
Pla
nnin
g
Motor Carrier Safety Assistance Programs
Information Systems (Sec 4004)
National Highway System (NHS)
Surface Transportation Program (STP)
State Planning and Research Funds
Highway Safety Incentive Grants
State Highway Safety Data Improvements (Sec 408)
Highway Sanctions / Transfer Programs
Highway Safety Programs (Sec 402)
Occupant Protection Incentive Grants (Sec 405)
Safety Belt Performance Grants (Sec 406)
Alcohol Impaired Driving Countermeasures (Sec 410)
State Transportation Safety Improvement System Improvement Grants (Sec 408)
Highway Safety Improvement Funds (Sec 130, 148)
State Traffic Operations Safety Improvement Program
Six Year Improvement Program
State Traffic Operations Porgram
FundamentalHuman Factors Environment
Funding Source
Virginia’s Strategic Highway Safety Plan B - B -