common operating picture (cop)...
TRANSCRIPT

Common Operating Picture (COP) Products Playbook # RSC-09
i
Naval Postgraduate School Earthquake Response Project
Playbook #: RSC-09
10/15/2013
Approved for public release; distribution is unlimited
Common Operating Picture
(COP) Products
Common Operating Picture (COP) Products Playbook # RSC-09
ii
Playbook Table of Contents
Executive Summary……………….………………………………………... iii Overview……………….……………………………………………………… 1 Purpose/Objectives……………….………………………………………… 3 Hardware Required……………….…………………………………………. 4 Software Required……………….………………………………………….. 4 Data Overview……………….……………………………………………….. 4 Product Descriptions…………….…………………………………………. 4 Instructions……………….………………………………………………...... 5 Playbook Directory……….…………………………………………………. 22 Scientific Background and Additional Notes……….……..……………. 23 References……….…………………………………………………………… 30
Common Operating Picture (COP) Products Playbook # RSC-09
iii
Executive Summary This Playbook provides a description of the Sensor Island, a systems and software middleware component used for the Naval Postgraduate School/Department of Homeland Security Earthquake Response Project to collect and disseminate baseline and specialized imagery, geographic analysis products, and geographic information in support of Monterey County and City. This middleware component is physically located at the Naval Postgraduate School Center for Asymmetric Warfare (CAW) facility in Naval Base Ventura County California and is accessible to Monterey County and City emergency management and geographic systems personnel via network access provided by the CAW. The playbook describes the Sensor Island architecture and provides specific information as to how a user uploads new products into Sensor Island, how they can access geographic information via Common Operational Pictures provided by the Sensor Island, and how they can connect to geographic webservices published by the Sensor Island for consumption using other geographic viewers. It also describes an implementation of Unified Incident Command Decision Support System (UICDS) to allow passing information to the WebEOC common operating picture. The Playbook Directory near the end of this document shows the NPS Earthquake Response Playbook sequence to help put this Playbook into perspective and give an overview of products resulting from this research and some aspects of practical implementation. The content of each Playbook is briefly described; however, users are referred to the specific named and numbered Playbooks for full product descriptions. These provide additional detailed product information, instructions on how to separately utilize the individual products, and how to combine them into an integrated system for improved earthquake response.
Common Operating Picture (COP) Products Playbook # RSC-09
1
Overview Sponsored by the Department of Homeland Security (DHS) Science & Technology Directorate, the Remote Sensing Center (RSC) at the Naval Postgraduate School (NPS) has developed a series of instructional playbooks designed to assist 1st responders and emergency managers with the use of remote sensing technology for improving earthquake response.
This playbook (Playbook #: RSC-09) describes the Naval Postgraduate School-Center for Asymmetric Warfare’s Sensor Island system “Sensor Island” and links through the Unified Incident Command Decision Support (UICDS) systems to the WebEOC common operating picture.
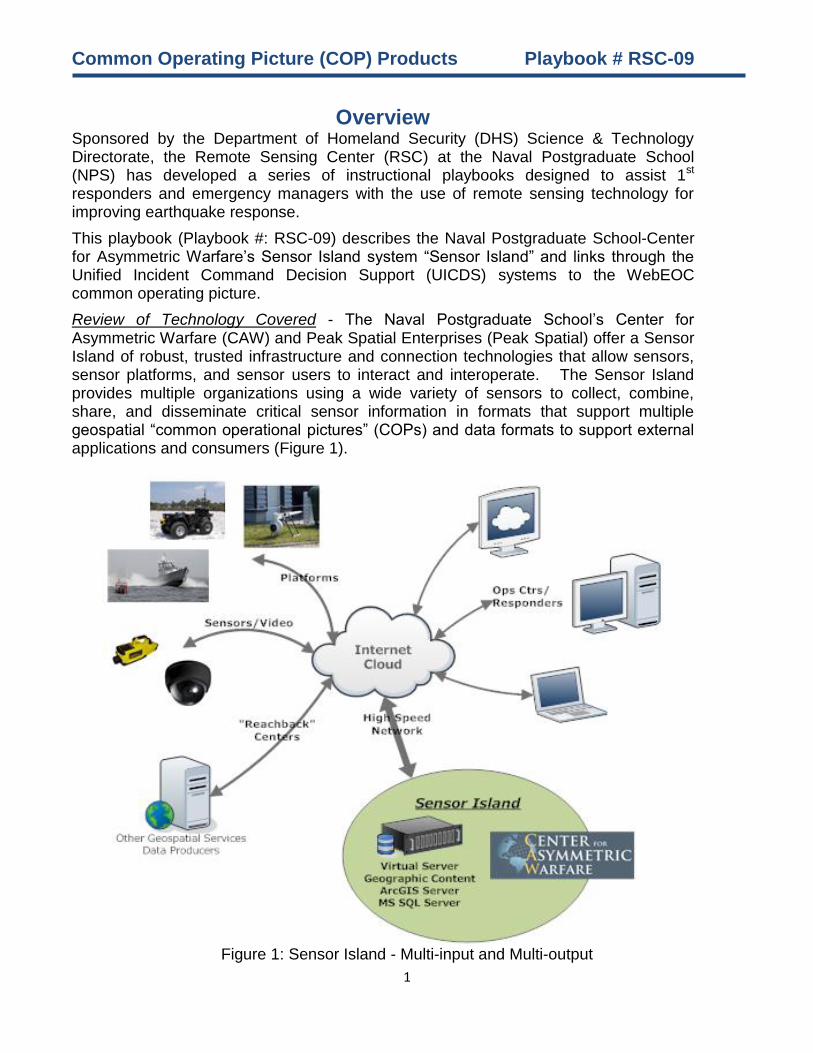
Review of Technology Covered - The Naval Postgraduate School’s Center for Asymmetric Warfare (CAW) and Peak Spatial Enterprises (Peak Spatial) offer a Sensor Island of robust, trusted infrastructure and connection technologies that allow sensors, sensor platforms, and sensor users to interact and interoperate. The Sensor Island provides multiple organizations using a wide variety of sensors to collect, combine, share, and disseminate critical sensor information in formats that support multiple geospatial “common operational pictures” (COPs) and data formats to support external applications and consumers (Figure 1).
Figure 1: Sensor Island - Multi-input and Multi-output

Common Operating Picture (COP) Products Playbook # RSC-09
2
The Sensor Island is a refined set of hardware, software, communications, and system components operating on the Center for Asymmetric Warfare’s high bandwidth network. The island allows customers to integrate and share information from real and near-real time sensors and other dynamic objects (e.g. - robots, UAVs, USVs) among geospatial operational pictures using web service concepts and capabilities. The island is always on and when subscribers deploy and turn on their systems and sensors, the island will recognize that they are deployed and operating and will begin to disseminate information to participating organizations in the form of sensor data feeds and geospatial sensor overlays. The Sensor Island team and facility provides customers the technical expertise and infrastructure to establish connections, build on existing sensor protocols, produce new protocols, task organize the dissemination of sensor data among participating organizations and/or maintain closed access to unique sensor networks. The island concept reduces IT and security burdens on customer operations by insulating the data collection and transmission from the larger geospatial enterprise through the use of controlled web service feeds. Organizations need not load specialized software for themselves or their users but only connect, as needed, to the island and ingest sensor data into their existing geographic displays/common operational pictures or a COP provided by the island. Partners Involved - In addition to the CAW and Peak Spatial, the Sensor Island connects with remote sensing data producers permitting the update of geographic products in support of emergency and disaster response. The implementation of Sensor Island tested during the Earthquake Response Project included products from San Diego State University and TerraPan Labs LLC who produced specialized high spatial resution imagery an products (See Playbook #: RSC-04A). The Sensor Island team developed data import and updates capabilities and also created the data exchange mechanisms, allowing subscribers to download and/or view the imagery updates using their web browsers and common operational picture/situational awareness tools. Implementation Review - The specific implementation for the NPS Earthquake Response project includes the Sensor Island software, hardware and communications components operating at the NPS CAW facility in Naval Base Ventura County California. This can be connected with field components such as remote webcams and Emergency Operations Center systems such as the NPS Cloud Computing Center’s “EOC in a Box” (See Playbook #: RSC-10). Sensors and systems can be interconnected with the Sensor Island through existing communications or emergency communications set up after an event, including WIMAX and satellite communications for field and field to internet connections. Once data and imagery products are uploaded to the Sensor Island, the high speed internet connections at the CAW provides linkage to EOCs and online consumers.

Common Operating Picture (COP) Products Playbook # RSC-09
3
Purpose/Objectives The objective of Sensor Island is to provide an “always on” external collection, storage, and dissemination of sensor and geographic imagery products and information among responding organizations. Sensor Island provides open-geographic-standards-based connectivity to responders and emergency operations centers that connects sensor and dynamically changing geographic information updates to a variety of geographic viewing systems so that the data are consistent across the responding enterprise. Use of the Sensor Island and the open geographic web services that it publishes, ensures that there is a single authoritative source of dynamic data throughout a response situation. In addition to providing situational updates to responders in the field, the Sensor Island also provides field data with reach back capabilities to analysis and support organizations such as remote sensing processing centers or threat modelers. This capability eliminates the need for field responders to produce their own analyses of the data and connects them with subject matter experts who can conduct that analysis and send actionable information back to the responders. For example transmitting sensor information, via the Sensor Island, to an organization like the Defense Threat Reduction Agency (DTRA) or the Department of Homeland Security’s Domestic Nuclear Detection Office, who could ingest the sensor data, produce algorithmic output such as threat/hazard plumes, and returning that data to the emergency operations centers and responders reacting to a situation. In this example, the field responders and EOCs would benefit from the immediate sensor alarms and also from the value added products that those sensors triggered. Published dynamic sensor and imagery data are disseminated via geographic web services that can be viewed in most commonly used desktop and web based COPs and mapping applications and architectures such as those provided by ESRI, GoogleEarth, ERDAS, WebEOC (both Yahoo maps and Mapping Professional), and commercial response systems such as Adashi, which use ESRI components as part of their geographic mapping tools. The Sensor Island can be configured to support any geospatial COP that supports Open Geospatial Consortium (OGC) Web Feature and Web Mapping service (WFS and WMS) and has been customized to support unique data feeds as well. Sensor Island also provides a baseline web based common operational picture (COP) of its own. This allows responders and responding organizations who don’t have that capability the added benefits that this situational awareness capability provides. The organic Sensor Island COP includes dynamic sensor layers displayed on common geographic layers such as road maps, satellite imagery, political/jurisdictional maps, and other useful baseline datasets.

Common Operating Picture (COP) Products Playbook # RSC-09
4
Hardware Required The basic hardware components for the Sensor Island, which include servers and communications elements, operate out of the CAW facility. The only hardware requirements for use at the Monterey County or City EOCs are computers (laptops, desktops, tablets) that are connected to a relatively high bandwidth network to connect to the internet.
Software Required All Sensor Island software operates on NPS/CAW hardware and networks and consists primarily of ESRI ArcGIS Server and MS SQL Server customized with Sensor Island software provided by Peak Spatial Enterprises. Sensor Island COP Software - The required software for accessing Sensor Island Common Operational Picture components is a compatible browser. Internet Explore 9, Mozilla Firefox, and Google Chrome have all been successfully tested Sensor Island Web Services Access - To access Sensor Island geographic web services, the Monterey County EOC will require a geographic mapping software package such as ESRI ArcGIS (a component of WebEOC’s mapping solution) or Google Earth. These software packages provide connectivity to web services as part of their functionality. Upload to Sensor Island – “Bitkinex”, a freeware utility program, provides the secure Dropbox client and is installed on all the Virtual Machine clients in the EOC-in-a-Box. This allows the EOC to upload remote sensing products created on the EOC-in-a-Box to the Sensor Island.
Data Overview Data used in Sensor Island can be contributed by a number of participants. The basic data organic to the Sensor Island are provided by the NPS Remote Sensing team or are publically accessible geographic files from geographic web services. Data products developed by specific NPS Remote Sensing applications are described in the playbooks associated with those particular products.
Product Description(s) The Sensor Island as described above is the product. Also see other Playbooks in the NPS Remote Sensing Earthquake Response series for descriptions of specific remote sensing products that Sensor Island disseminates.
Common Operating Picture (COP) Products Playbook # RSC-09
5
Instructions The Sensor Island operates out of the Naval Postgraduate School’s Center for Asymmetric Warfare at Naval Base Ventura County California and system access to all operations is controlled by the Chief Technology Officer. The system operates continuously and is updated as needed to support operations, events, and response activities. The primary POC for all Sensor Island activities is Naval Postgraduate School/Center for Asymmetric Warfare Director/Principal Investigator, Attn: Alan Jaeger Email: [email protected] Office Phone: 805-989-1786 Fax: 805-989-0905 Once access and accounts are established, the following specific Sensor Island instructions apply for the main client/user activities:
1. Access and use of the Sensor Island Common Operational Pictures 2. Accessing the Sensor Island Geographic Web Services 3. Uploading Remote Sensing and Other Products to the Sensor Island
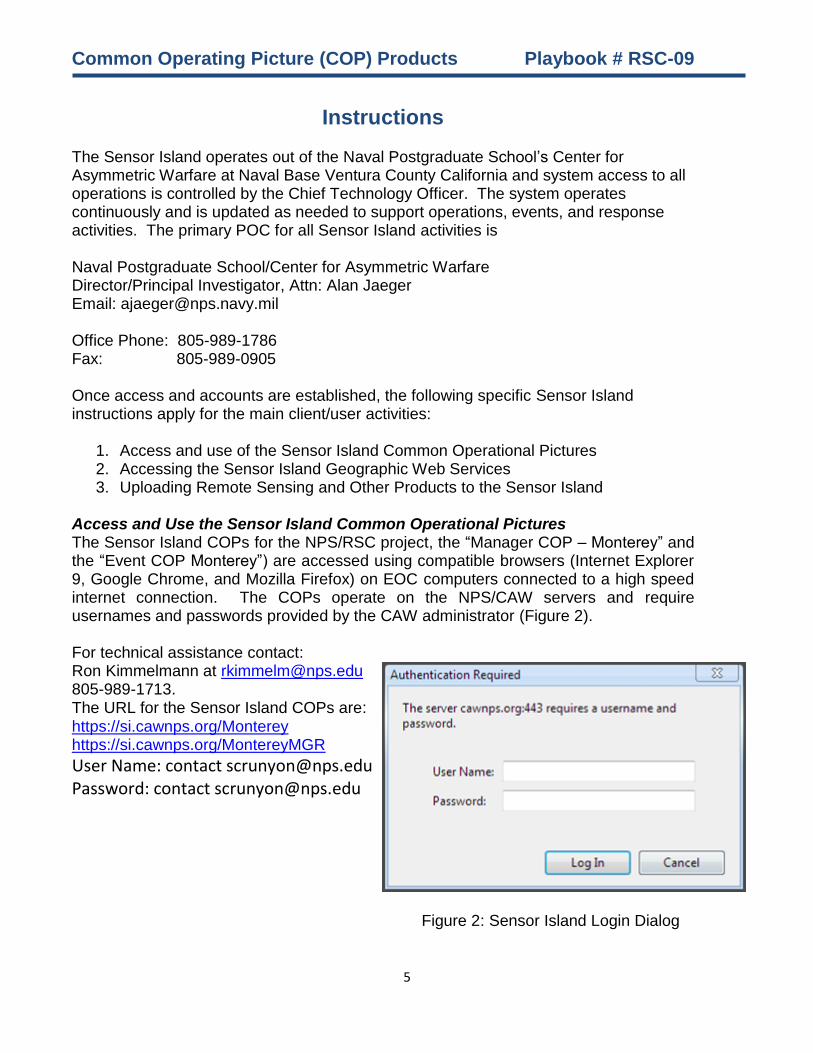
Access and Use the Sensor Island Common Operational Pictures The Sensor Island COPs for the NPS/RSC project, the “Manager COP – Monterey” and the “Event COP Monterey”) are accessed using compatible browsers (Internet Explorer 9, Google Chrome, and Mozilla Firefox) on EOC computers connected to a high speed internet connection. The COPs operate on the NPS/CAW servers and require usernames and passwords provided by the CAW administrator (Figure 2). For technical assistance contact: Ron Kimmelmann at [email protected] 805-989-1713. The URL for the Sensor Island COPs are: https://si.cawnps.org/Monterey https://si.cawnps.org/MontereyMGR
User Name: contact [email protected]
Password: contact [email protected]
Figure 2: Sensor Island Login Dialog
Common Operating Picture (COP) Products Playbook # RSC-09
6
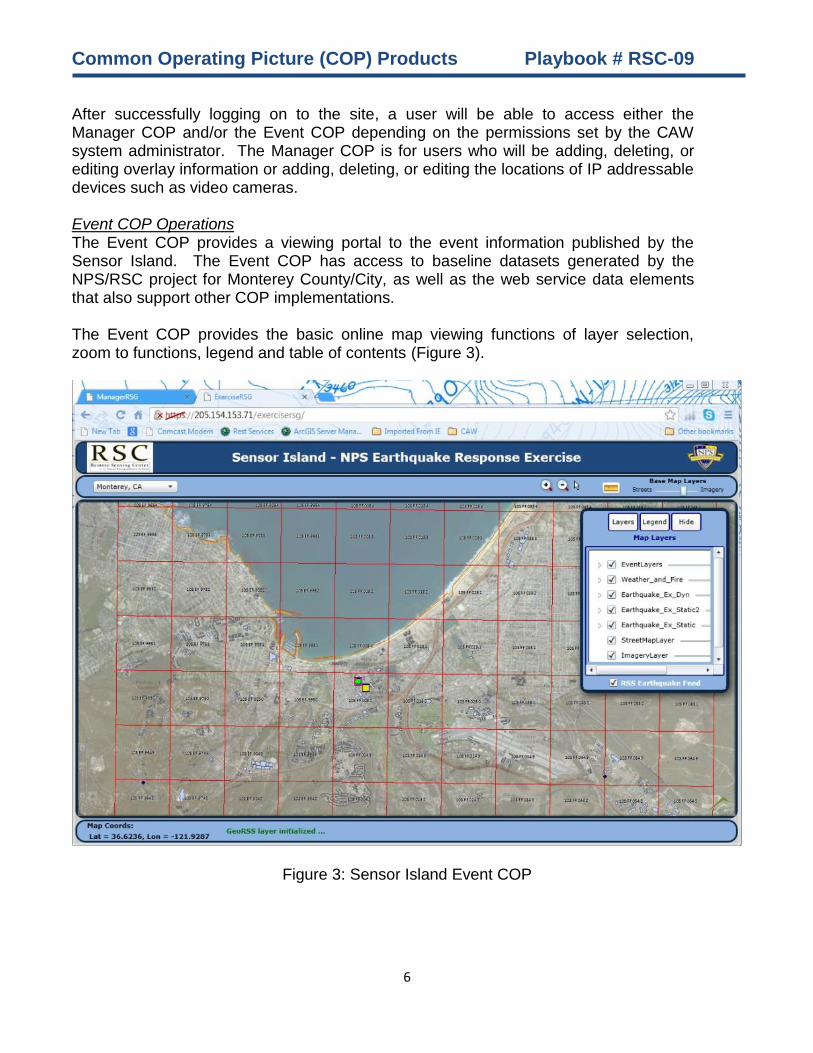
After successfully logging on to the site, a user will be able to access either the Manager COP and/or the Event COP depending on the permissions set by the CAW system administrator. The Manager COP is for users who will be adding, deleting, or editing overlay information or adding, deleting, or editing the locations of IP addressable devices such as video cameras. Event COP Operations The Event COP provides a viewing portal to the event information published by the Sensor Island. The Event COP has access to baseline datasets generated by the NPS/RSC project for Monterey County/City, as well as the web service data elements that also support other COP implementations. The Event COP provides the basic online map viewing functions of layer selection, zoom to functions, legend and table of contents (Figure 3).
Figure 3: Sensor Island Event COP

Common Operating Picture (COP) Products Playbook # RSC-09
7
Manager COP Operations The Manager COP provides an EOC geographic information and event manager the ability to add control measures in the form of points, lines, and polygons with basic attribute information about the particular control measure such as descriptions, data/time information including “stale” date/time, and color selections. The Manager COP also provides a simple capability to add response infrastructure components such as sensors, communications nodes, and mobile platforms (i.e. boats, aircraft, and unmanned vehicles) to the Sensor Island for dissemination to the Event COP and the geographic web services viewable by other COP architectures. The primary difference in the user interface for the Manager COP is the table of contents which includes additional tabs that allow the manager to create new icons and attributes associated with those icons (Figure 4). These new icons are automatically added to the web service and published out to consumers.
Figure 4: Sensor Island Manager COP (aka Editor)

Common Operating Picture (COP) Products Playbook # RSC-09
8
Accessing the Sensor Island Geographic Web Services The Sensor Island produces three separate geographic web services for consumption by
geographic software viewers that can consume standard Open Geospatial Consortium (OGC)
services. The three web services are:
http://si.cawnps.org/ArcGIS/services
o Public/Monterey_Dyn
o This web service includes new geographic products uploaded into the Sensor
Island such as the San Diego State University change detection products
(Playbook #: RSC-4A)
http://si.cawnps.org/ArcGIS/services
o Public/Monterey_Static
o This web service provides baseline data assembled by NPS RSC for Monterey
County/City areas that remains accessible to Sensor Island subscribers.
http://si.cawnps.org/ArcGIS/services
o Public/Monterey_Editor
o This web service includes all updates and edits made using the Manager COP
provided by Sensor Island. These updates are available to the Event COP and
to other COPs subscribing to these services.
This set of instructions provides basic information about these services. Access to the
services is controlled by username and passwords that can be requested from the CAW (see
contact information in the Sensor Island COP paragraphs). Connection to the services
depends on a user’s specific application. Users should consult their software guides from
ESRI, Google Earth, and/or the Unified Incident Command Decision Support (UICDS) system
to determine how to add a service to those viewers and make the information from the Sensor
Island services visible as a layer or product within that viewing environment. The Sensor
Island web services connected to and operating in GoogleEarth (using KML the specific
address would be
http://si.cawnps.org/ArcGIS/services/Public/Monterey_Dyn/MapServer/KMLServer).
Each KML service would be specifically named for each particular project/service and ESRI
environment. Data overlays from the web services are similar in either viewing environment
though they may appear visually different (color, font etc.) depending on the default settings of
the viewer. Versions for Google Earth and ESRI viewers are shown in Figure 5.

Common Operating Picture (COP) Products Playbook # RSC-09
9
Figure 5: Web Service Overlays in ESRI and Google Earth Viewers
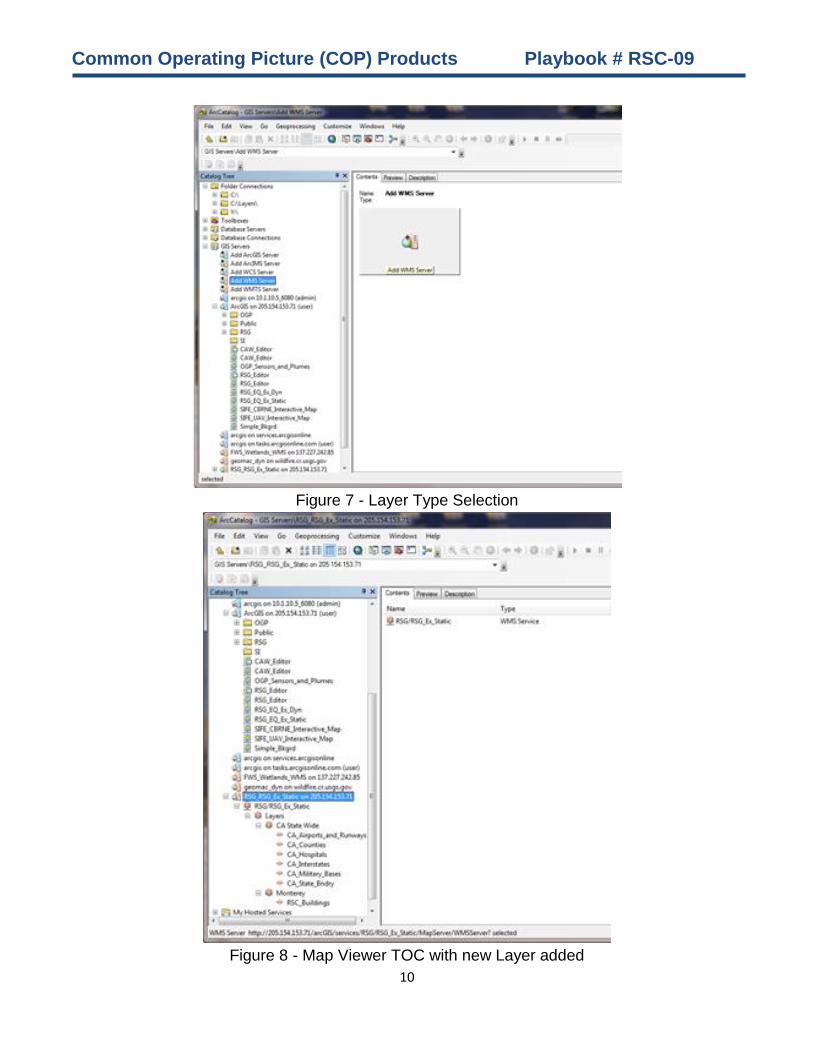
The basic process for accessing geographic web services is shown in Figures 6 – 8 below for
Web Mapping Services (WMS) and Web Feature Services (WFS) using a typical ESRI
geographic information system software mapping package. This process is highlighted for this
playbook because the Monterey County and City EOC systems include ESRI based mapping
software. Nearly every mapping display software provides an “add layer” function seen in the
Figure 6. This function is further refined for a user into the type of layer (e.g. WMS and WFS)
that is to be added. Once the type is selected the user is typically led through a couple of
interface options that allow the user to identify the specific location of the layer in the form of
an IP address or url (shown here in the second figure. Once the address of the new layer is
added, the mapping software typically places that layer in the table of contents of the user’s
map viewer and they will see the contents associated with that layer. Examples shown here
are taken from selected NPS/RSC data examples and are representative of what a web
service subscriber will see when connecting to these services from either ArcMap or another
geographic viewer. For example, the address for the WMS service for the Monterey dynamic
background data is: http://si.cawnps.org/arcGIS/services/public/Monterey_dyn/MapServer/WMSServer?
Figure 6: Layer Address
Common Operating Picture (COP) Products Playbook # RSC-09
10
Figure 7 - Layer Type Selection
Figure 8 - Map Viewer TOC with new Layer added
Common Operating Picture (COP) Products Playbook # RSC-09
11
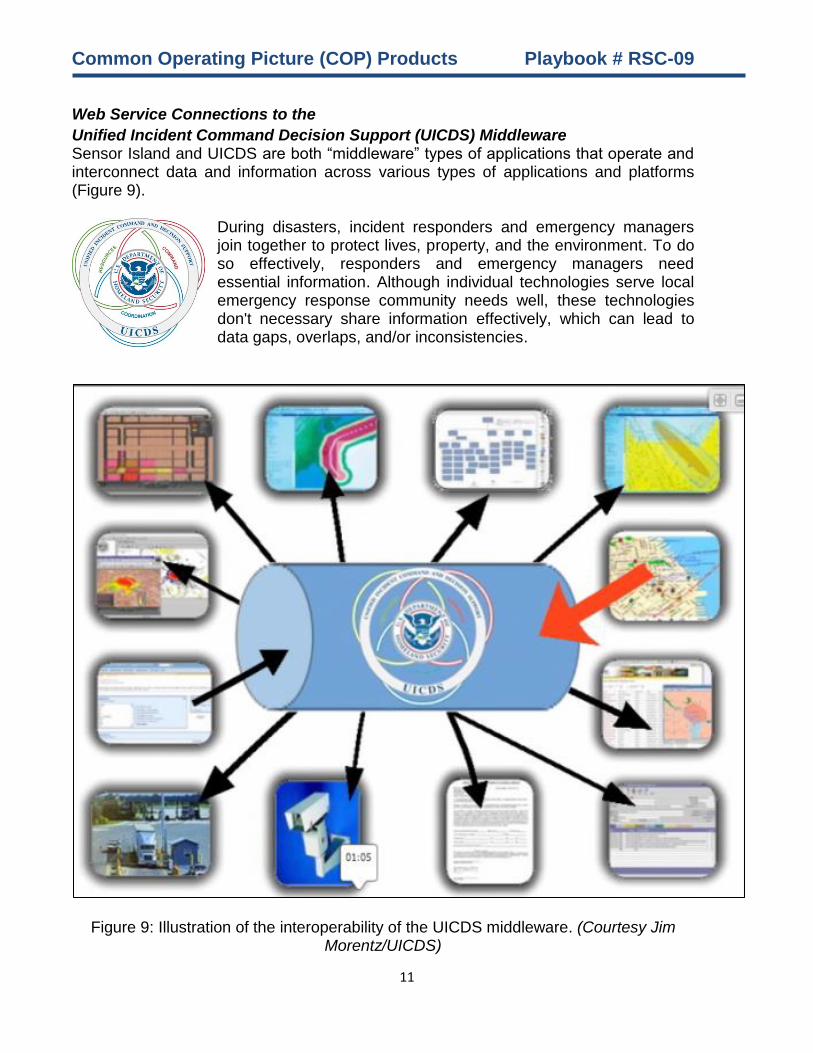
Web Service Connections to the
Unified Incident Command Decision Support (UICDS) Middleware Sensor Island and UICDS are both “middleware” types of applications that operate and interconnect data and information across various types of applications and platforms (Figure 9).
During disasters, incident responders and emergency managers join together to protect lives, property, and the environment. To do so effectively, responders and emergency managers need essential information. Although individual technologies serve local emergency response community needs well, these technologies don't necessary share information effectively, which can lead to data gaps, overlaps, and/or inconsistencies.
Figure 9: Illustration of the interoperability of the UICDS middleware. (Courtesy Jim Morentz/UICDS)
Common Operating Picture (COP) Products Playbook # RSC-09
12
Sensor Island web services can potentially be connected to the UICDS system in the same fashion as the web services connections to ESRI and Google Earth mapping environments. Unlike ESRI and Google Earth, however, UICDS is not a mapping application. The Sensor Island/UICDS connection was not fully exploited for this project. This was a consequence of the Monterey County OES instance of UICDS being currently housed on a third-party server instead of at the Monterey County OES. As a result, for our demonstrations, data was fed directly to both Sensor Island and UICDS separately. While the capability is there, future collaboration between the Sensor Island web services and the future Monterey County UICDS instance would need to take place. For the Monterey County Office of Emergency Services operations, the goal was to be able to convert field data, collected using the Lighthouse-ODK Android application (see Playbook #6), to UICDS work product. Field data is made available to UICDS through both Sensor Island services and by Java-based communication programs. Once the data is housed on the UICDS board, it can then be reposted as part of UICDS web services to the commercial WebEOC capability used by the Monterey County OES. Operability of the Sensor Island Dropbox service is covered by the next section. Manual communication to the UICDS board is done using two Java-based programs provided by UICDS. Field data collected using the Lighthouse Application can be exported into JavaScript Object Notation (JSON) file format. Please see Playbook #6 for details on how to export field data into JSON format. To convert and upload data to the UICDS Board: The ATC-20 Damage Assessment Form was provided to NPS by the Monterey County OES and was digitized for field work using the Lighthouse Application (Playbook #RSC06). Once data have been exported into a JSON file format from Lighthouse, the JSON2Adapter Java program is used to convert the JSON file into an XML file and then parses the information from the new XML file and uploads the data to the UCIDS Board.
1. Export the data from the Lighthouse Application as JSON files, and save these JSON files into the same folder that houses the JSON2Adapter code:
\Monterey_Earthquake_Project_Playbooks\Supporting_Data\Playbook_9_Java_Files
2. Right-click on the JSON file(s), and select rename. Rename each of the JSON
files to unique names. These filenames will be used in a few steps from now.
3. Open the folder containing the JSON2Adapter program on the USB Disk:
\Monterey_Earthquake_Project_Playbooks\Supporting_Data\Playbook_9_Java_Files

Common Operating Picture (COP) Products Playbook # RSC-09
13
4. Go to Start > All Programs > Accessories > Notepad to open the Notepad text editor. Click on File > Open and browse for the configuration file named “config-atc.props” in the directory above. Open “config-atc.props” in Notepad.
5. Configure the file to take in any JSON file by changing the value of ‘jsonfile’. Currently it is set to look for ATC20.json within the same directory.
6. If an ‘atc-1.tmp’ file is present in the directory, make sure to delete it by either dragging it into the Recycle Bin, or right-clicking on it and selecting ‘Delete’. If this file is not removed, this will caused the JSON2Adapter Java program to fail.
7. Open a command window in the folder by holding down the Shift key and right-clicking on an empty space somewhere in the folder. Select “Open Command Window here’.
8. At the command prompt, type “java -jar json2incidentAdapter.jar config-atc.props” and press Enter. The program will convert the JSON file to XML, and uploads the parsed data into the UICDS Board.
9. To view the incidents on the UICDS Board, navigate a browser to https://uicds-
host2.saic.com/uicds/Console.html. You will be prompted to enter your access
credentials to the UICDS Core named in the network link (currently, user: nps, password: nps2013).
NOTE: Currently, only one JSON file can be converted at a time. Although the Lighthouse Application can group reports together into one large JSON file, it is not recommended as the JSON2Adapter cannot handle multiple-report JSON files at this time. To run the WebEOC Adapter:
1. Open a command window in the folder by holding down the Shift key and right-clicking on an empty space somewhere in the folder. Select “Open Command Window here’.
2. At the command prompt, type “java -jar WebEOCAdapter.jar” and press Enter.
3. After some time, the adapter will turn on and begin “listening” for reports from a specific UICDS Board tailored for Monterey County. Any new reports that are posted onto the Board are immediately reposted onto WebEOC.
4. The Adapter will run continuously once executed. This is perfectly normal. In order to stop it, at the command line, press Control-C once, and the Adapter routine will come to an end.

Common Operating Picture (COP) Products Playbook # RSC-09
14
Example: Figure 10 represents the JSON2Adapter Java program workflow. The top panel of Figure 10 illustrates the Lighthouse-ODK Submission Summary page. Highlighted in red is the sample report (Emery Rd. Fire) that has been exported as a JSON file. The JSON2Adapter program has converted and uploaded the data contained in the JSON as an incident in UICDS. There is now a listed incident on UICDS called “Emery Rd. Fire” (highlighted in purple) and the data has been parsed out, as seen in the UICDS incident properties window (bottom left).
Figure 10: Graphical representation of how the JSON2Adapter Java program works with
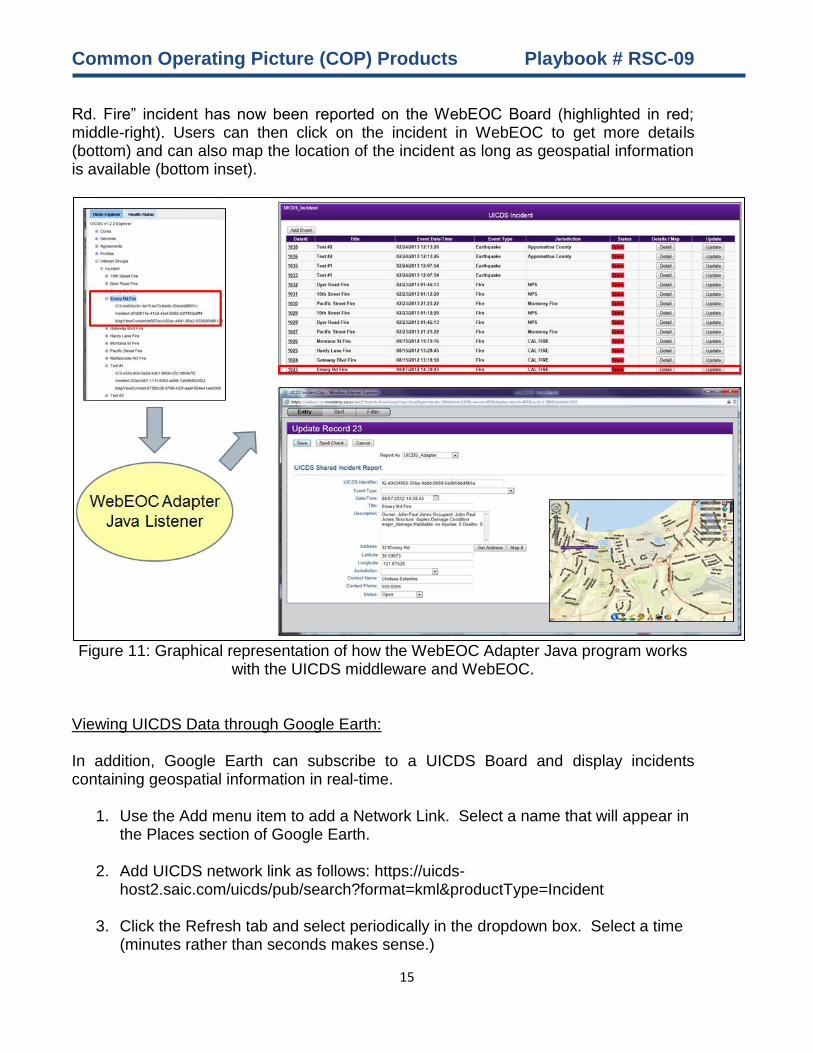
the UICDS middleware. Figure 11 illustrates the WebEOC Adapter workflow. Highlighted in red (upper left) is the same “Emery Rd. Fire” UICDS incident report shown above in Figure 10. When the WebEOC Adapter has been executed, it continuously ‘listens’ to a designated UICDS Board for any new incidents being reported. In this example, when the WebEOC Adapter ‘hears’ the “Emery Rd. Fire” incident, it reposts the report as an incident onto the collaborating WebEOC Board. In Figure 11 below, it can be seen that an “Emery
Common Operating Picture (COP) Products Playbook # RSC-09
15
Rd. Fire” incident has now been reported on the WebEOC Board (highlighted in red; middle-right). Users can then click on the incident in WebEOC to get more details (bottom) and can also map the location of the incident as long as geospatial information is available (bottom inset).
Figure 11: Graphical representation of how the WebEOC Adapter Java program works
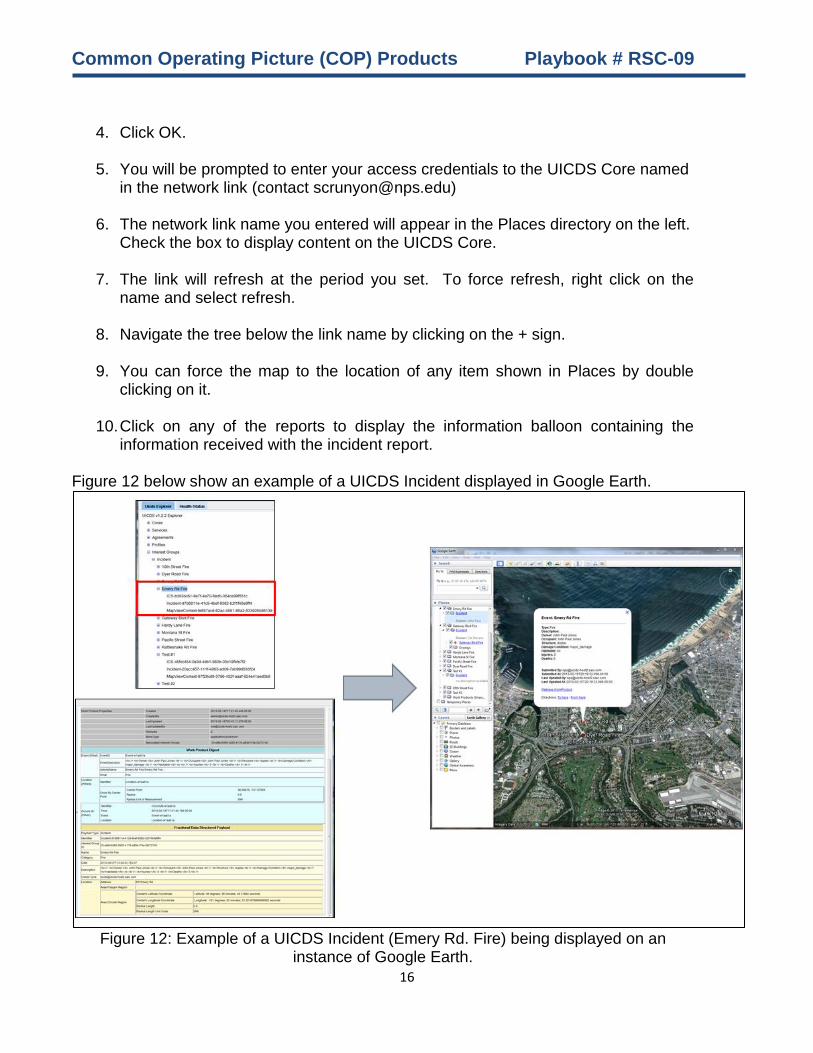
with the UICDS middleware and WebEOC. Viewing UICDS Data through Google Earth: In addition, Google Earth can subscribe to a UICDS Board and display incidents containing geospatial information in real-time.
1. Use the Add menu item to add a Network Link. Select a name that will appear in the Places section of Google Earth.
2. Add UICDS network link as follows: https://uicds-
host2.saic.com/uicds/pub/search?format=kml&productType=Incident 3. Click the Refresh tab and select periodically in the dropdown box. Select a time
(minutes rather than seconds makes sense.)
Common Operating Picture (COP) Products Playbook # RSC-09
16
4. Click OK. 5. You will be prompted to enter your access credentials to the UICDS Core named
in the network link (contact [email protected]) 6. The network link name you entered will appear in the Places directory on the left.
Check the box to display content on the UICDS Core. 7. The link will refresh at the period you set. To force refresh, right click on the
name and select refresh.
8. Navigate the tree below the link name by clicking on the + sign.
9. You can force the map to the location of any item shown in Places by double clicking on it.
10. Click on any of the reports to display the information balloon containing the information received with the incident report.
Figure 12 below show an example of a UICDS Incident displayed in Google Earth.
Figure 12: Example of a UICDS Incident (Emery Rd. Fire) being displayed on an
instance of Google Earth.

Common Operating Picture (COP) Products Playbook # RSC-09
17
Uploading Remote Sensing Products to the Sensor Island A variety of products can be uploaded to the Sensor Island. They include remote sensing products such as those produced using the San Diego State University algorithms (kml files) in Playbook #: RSC-04A, map compositions (pdf files) produced using ArcGIS desktop software (Playbook #: RSC-08, and JSON (JavaScript Object Notation) reports (social media feeds) in Open Data Kit (ODK) formats. For file format details see “Scientific Basis and Additional Notes” section of this Playbook. This section of the Playbook describes how products developed on the EOC server are uploaded from that workstation to the Sensor Island. It’s important to note that this particular set of instructions could also be extended to other data producers supporting an emergency response event who are external to the EOC since the geographic products can be added, from other providers, to the Sensor Island architecture and disseminated via the web services described in previous paragraphs. The primary connection between data produced on the EOC server and the Sensor Island is a “dropbox” where products can be placed. This dropbox is the one piece of connection software between the EOC server and the Sensor Island. Sensor Island automatically watches this dropbox for updates and translates those data updates to the web services and Sensor Island COPs. Dropbox Instructions The dropbox used to connect the EOC server with Sensor Island uses Bitkinex software. This must be installed and set up as shown below prior to attempting any product uploads. Once the dropbox is setup, these steps will not need to be repeated though this same setup could support other data producers who aren’t using this specific EOC server.
1. Download & Install BitKinex from http://www.bitkinex.com/
2. Run program BitKinex
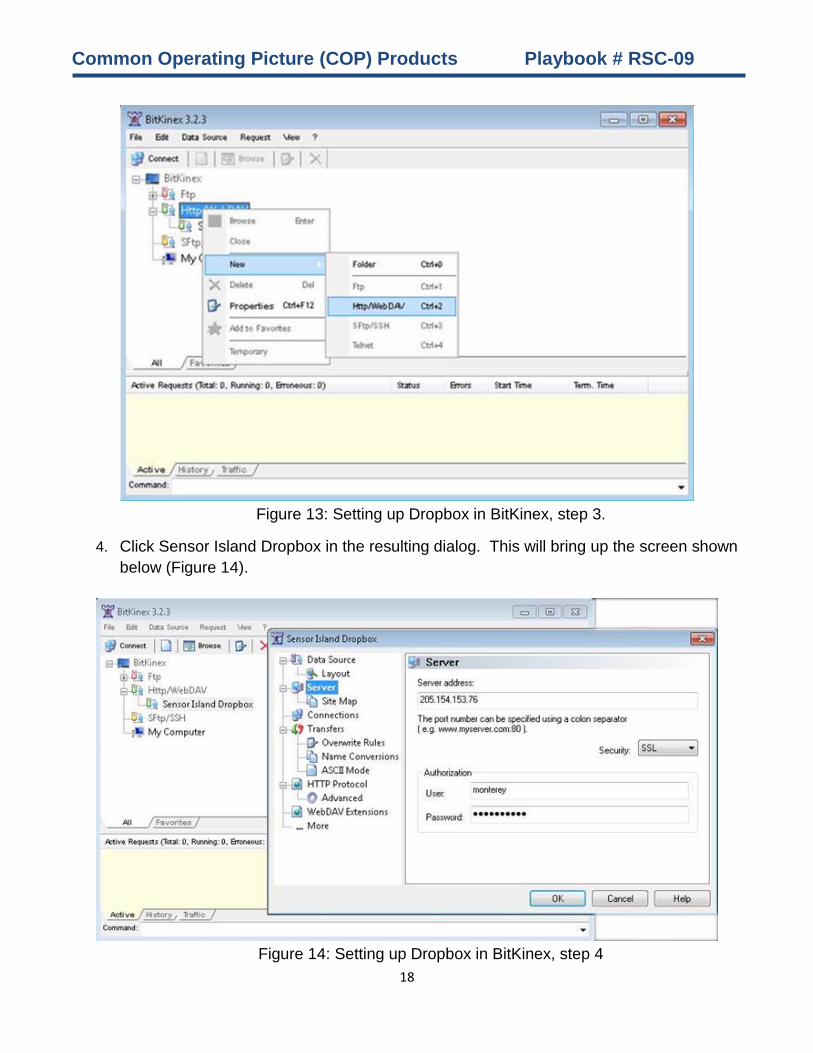
3. Right Click on the http/WebDAV, mouse over New, click http/WebDAV, Name it Sensor
Island Dropbox (Figure 13).
Common Operating Picture (COP) Products Playbook # RSC-09
18
Figure 13: Setting up Dropbox in BitKinex, step 3.
4. Click Sensor Island Dropbox in the resulting dialog. This will bring up the screen shown
below (Figure 14).
Figure 14: Setting up Dropbox in BitKinex, step 4
Common Operating Picture (COP) Products Playbook # RSC-09
19
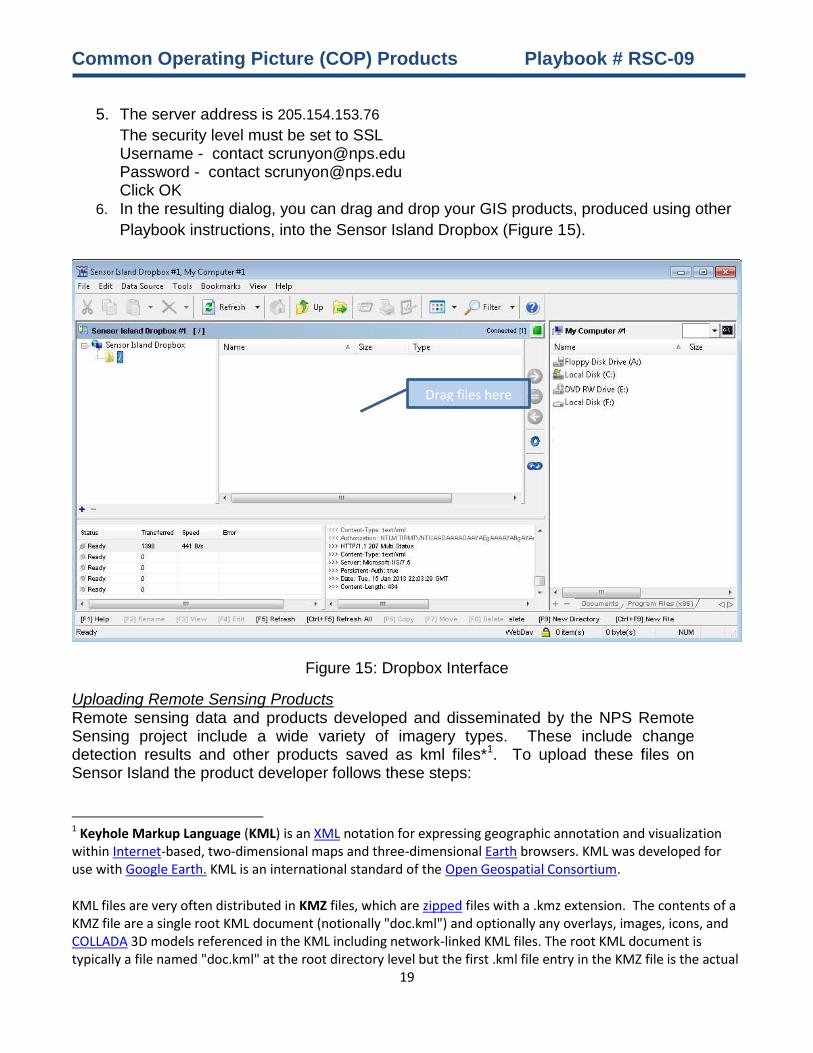
5. The server address is 205.154.153.76
The security level must be set to SSL Username - contact [email protected] Password - contact [email protected] Click OK
6. In the resulting dialog, you can drag and drop your GIS products, produced using other
Playbook instructions, into the Sensor Island Dropbox (Figure 15).
Figure 15: Dropbox Interface
Uploading Remote Sensing Products Remote sensing data and products developed and disseminated by the NPS Remote Sensing project include a wide variety of imagery types. These include change detection results and other products saved as kml files*1. To upload these files on Sensor Island the product developer follows these steps:
1 Keyhole Markup Language (KML) is an XML notation for expressing geographic annotation and visualization within Internet-based, two-dimensional maps and three-dimensional Earth browsers. KML was developed for use with Google Earth. KML is an international standard of the Open Geospatial Consortium.
KML files are very often distributed in KMZ files, which are zipped files with a .kmz extension. The contents of a KMZ file are a single root KML document (notionally "doc.kml") and optionally any overlays, images, icons, and COLLADA 3D models referenced in the KML including network-linked KML files. The root KML document is typically a file named "doc.kml" at the root directory level but the first .kml file entry in the KMZ file is the actual
Drag files here
Common Operating Picture (COP) Products Playbook # RSC-09
20
1. Produce a .kml file using one of the other Playbooks (E.g. Playbook #: RSC-04A
change detection result, or Playbook #8 map product) or an external program. 2. Using the file/directory system on the production system, copy the saved *.kml
file to the dropbox folder. 3. Once uploaded to the dropbox folder, Sensor Island collects that information and
updates its geographic database, and the product is disseminated via webservices and via the Sensor Island COPs.
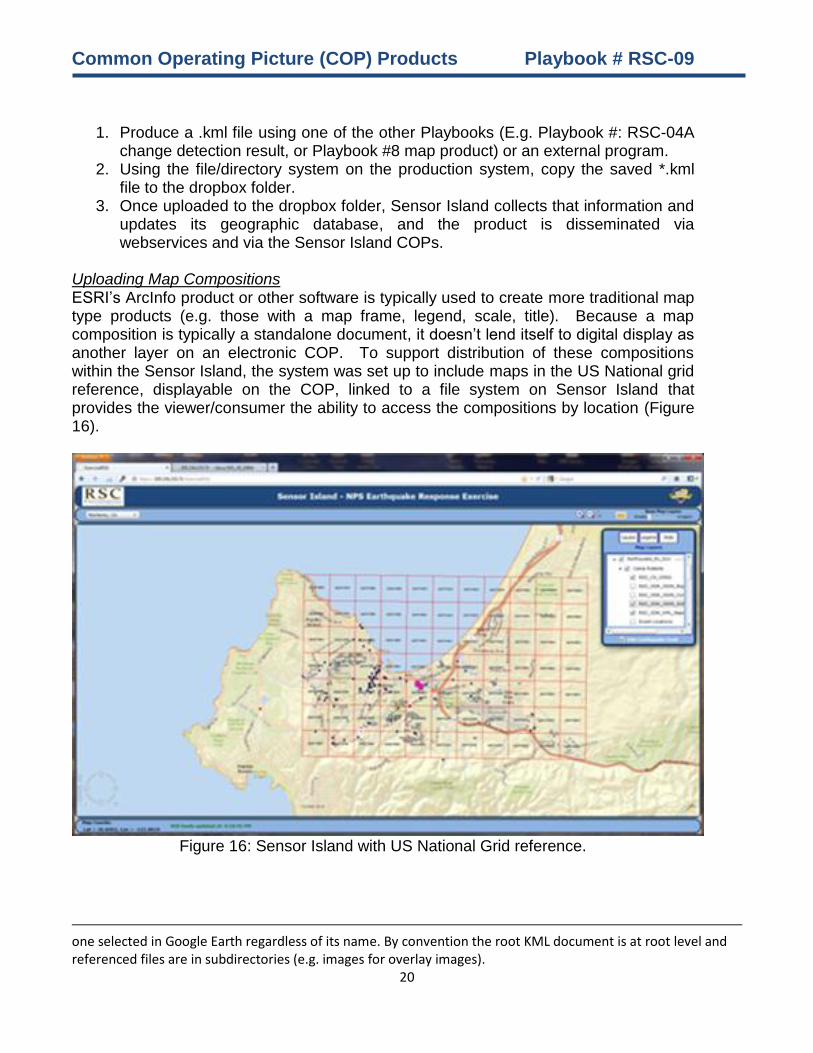
Uploading Map Compositions ESRI’s ArcInfo product or other software is typically used to create more traditional map type products (e.g. those with a map frame, legend, scale, title). Because a map composition is typically a standalone document, it doesn’t lend itself to digital display as another layer on an electronic COP. To support distribution of these compositions within the Sensor Island, the system was set up to include maps in the US National grid reference, displayable on the COP, linked to a file system on Sensor Island that provides the viewer/consumer the ability to access the compositions by location (Figure 16).
Figure 16: Sensor Island with US National Grid reference.
one selected in Google Earth regardless of its name. By convention the root KML document is at root level and referenced files are in subdirectories (e.g. images for overlay images).

Common Operating Picture (COP) Products Playbook # RSC-09
21
The specific National Grid reference numbers are visible on the Sensor Island COPs and are also published as part of the Sensor Island web services. Examples of these numbers are as follows:
10S_FE_9954 10S_GE_9757 10S_EF_9848 10S_FF_0048 A user/map composition producer should name the product with the grid reference number of the primary location of the product and a descriptive name. This allows the Sensor Island to put the product into folders that become accessible via the COPs through selection of the specific grid reference folder. Uploading map compositions into this grid referenced file system on Sensor Island is accomplished using the following steps:
1. Produce a map composition using ArcMap or other product and save the map composition as a *.pdf file that includes the specific grid zone as part of the name.
2. Upload the file to the EOC dropbox. 3. Map compositions are copied to the Sensor Island grid zone directory associated
with that product and are accessible to users via a grid zone query on the COPs.
Uploading Social Media - JSON/ODK formatted Reports The final type of product disseminated by the Sensor Island is geographically referenced social media input from Lighthouse-ODK (a smart phone/social media type application) that allows a user to collect digital photos and produce text reports from tablets and smartphones. The product that results from this input is formatted as a JSON/ODK report visible to the COP user as a unique map icon that, when selected, shows the content, text and any digital attachments, of the report. Social media uploads to Sensor Island are accomplished following these steps:
1. Produce the social media/JSON report using the Lighthouse-ODK export feature (see Playbook #: RSC-06)
2. Upload the report to the dropbox folder for Sensor Island following the instructions provided earlier in this playbook for dropbox operations
3. Once uploaded to the dropbox folder, Sensor Island collects that information and updates its geographic database, and the product is disseminated via webservices and via the Sensor Island COPs.

Common Operating Picture (COP) Products Playbook # RSC-09
22
Playbook Directory This Playbook is one of a series of Playbooks designed to cover the technical breadth of the NPS-DHS Earthquake Response Project. Each Playbook describes one series of products and its use. These Playbooks can be printed, transmitted electronically as Portable Document Format (PDF) documents, or stored locally on existing emergency management networks, workstations, or mobile devices. The following summarizes the individual Playbooks developed as part of this project and available to emergency responders. See the listed Playbook for specifics and details.
Playbook#RSC-01: NPS-DHS Remote Sensing Project/Products Overview
Playbook documenting project and scope and big picture for other Playbooks
Playbook#RSC-02: Monterey County Baseline Products and Pre-Event Data Processing
Playbook documenting baseline data, preprocessing, use/analysis of basic products
Playbook#RSC-03: Monterey (City) Infrastructure Products
Critical Infrastructure data (location, description, pre-event photos, geolocated imagery
frames and metadata)
Playbook#RSC-04A: Airborne Imagery Change Detection Products (SDSU) Monterey baseline imagery of critical infrastructure, Camp Roberts imagery, and selected
change detection example products. Full-Resolution NEOS imagery
Playbook#RSC-04B: NOAA Night Lights/Power Change Detection and Fire Detection Products Night lights/power and fire detections (NOAA)
Playbook#RSC-05A: Social Networking Products (Ushahidi)
Ushahidi implementation and instructions for Monterey City/County
Playbook#RSC-05B: Social Networking Products (Twitter)
Twitter implementation and instructions for Monterey City/County
Playbook#RSC-06: Mobile Application Damage Assessment Product Lighthouse damage assessment application download, install, configure, execute
Playbook#RSC-07: Post Event Processing Scenarios Products
LiDAR DEM, DSM, derived products, NAIP/WV-2 Change Detection Examples
Playbook#RSC-08: Soft and Hardcopy Output Products and Distribution
GeoPDF Products, Monterey Map Books, w/National Grid Index, PDF and Printed
Playbook#RSC-09: Common Operating Picture (COP) Products
Sensor Island Common Operating Picture, UICDS to WebEOC Link
Playbook#RSC-10: Systems Integration, Transition, and Training
Hardware/Software Installation Details, Coordination, and Integration

Common Operating Picture (COP) Products Playbook # RSC-09
23
Scientific Basis and Additional Notes
Detailed Sensor Island Overview Objective and End Product – The objective and end product of Sensor Island is to provide an “always on” external collection, storage, and dissemination of sensor and geographic imagery products and information among responding organizations. Sensor Island provides open-geographic-standards-based connectivity to responders and emergency operations centers that connects sensor and dynamically changing geographic information updates to a variety of geographic viewing systems so that the data are consistent across the responding enterprise. Use of the Sensor Island and the open geographic web services that it publishes, ensures that there is a single authoritative source of dynamic data throughout a response situation. In addition to providing situational updates to responders in the field, the Sensor Island also provides field data with reach back capabilities to analysis and support organizations such as remote sensing processing centers or threat modelers. This capability eliminates the need for field responders to produce their own analyses of the data and connects them with subject matter experts who can conduct that analysis and send actionable information back to the responders. For example transmitting sensor information, via the Sensor Island, to an organization like the Defense Threat Reduction Agency (DTRA) or the Department of Homeland Security’s Domestic Nuclear Detection Office, who could ingest the sensor data, produce algorithmic output such as threat/hazard plumes, and returning that data to the emergency operations centers and responders reacting to a situation. In this example, the field responders and EOCs would benefit from the immediate sensor alarms and also from the value added products that those sensors triggered. In addition to a common sensor and geographic data collection and dissemination system, the Sensor Island also provides a baseline web based common operational picture (COP) of its own. This allows responders and responding organizations who don’t have that capability the added benefits that this situational awareness capability provides. The organic Sensor Island COP includes dynamic sensor layers displayed on common geographic layers such as road maps, satellite imagery, political/jurisdictional maps, and other useful baseline datasets. Published dynamic sensor and imagery data are disseminated via geographic web services that can be viewed in most commonly used desktop and web based COPs and mapping applications and architectures such as those provided by ESRI, GoogleEarth, ERDAS, WebEOC (both Yahoo maps and Mapping Professional), and commercial response systems such as Adashi, which use ESRI components as part of their geographic mapping tools. The Sensor Island can be configured to support any geospatial COP that supports Open Geospatial Consortium (OGC) Web Feature and Web Mapping service (WFS and WMS) and has been customized to support unique data feeds as well.
Common Operating Picture (COP) Products Playbook # RSC-09
24
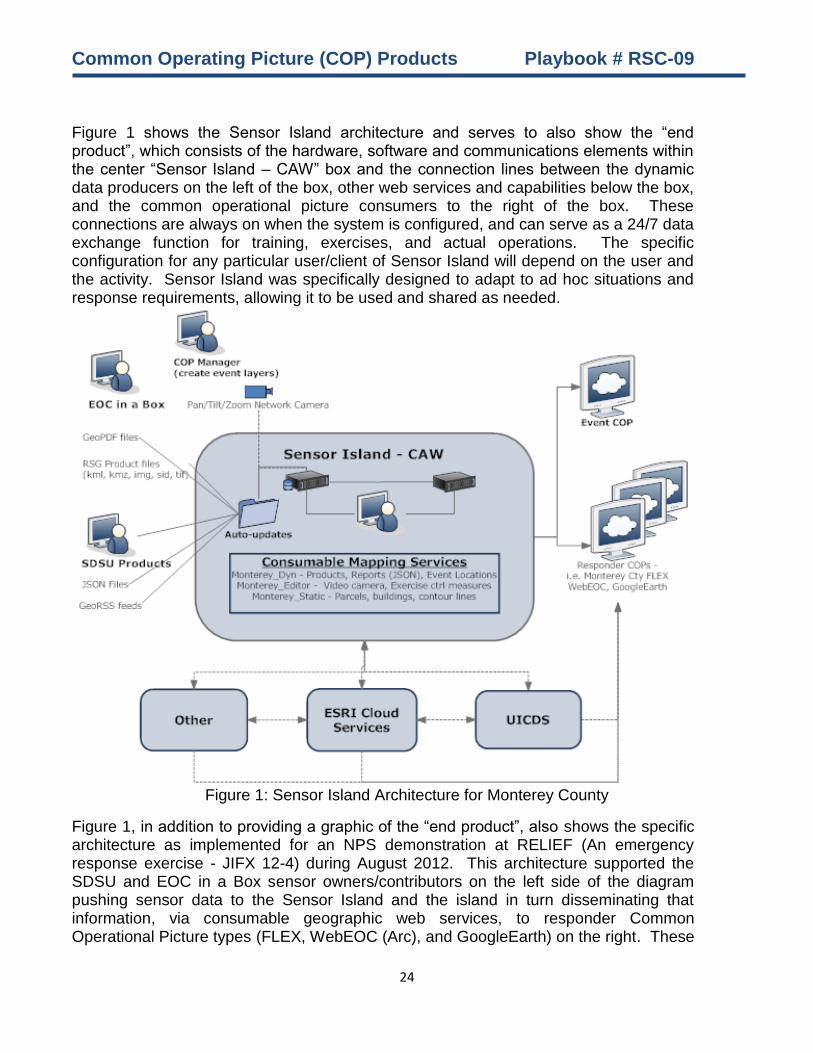
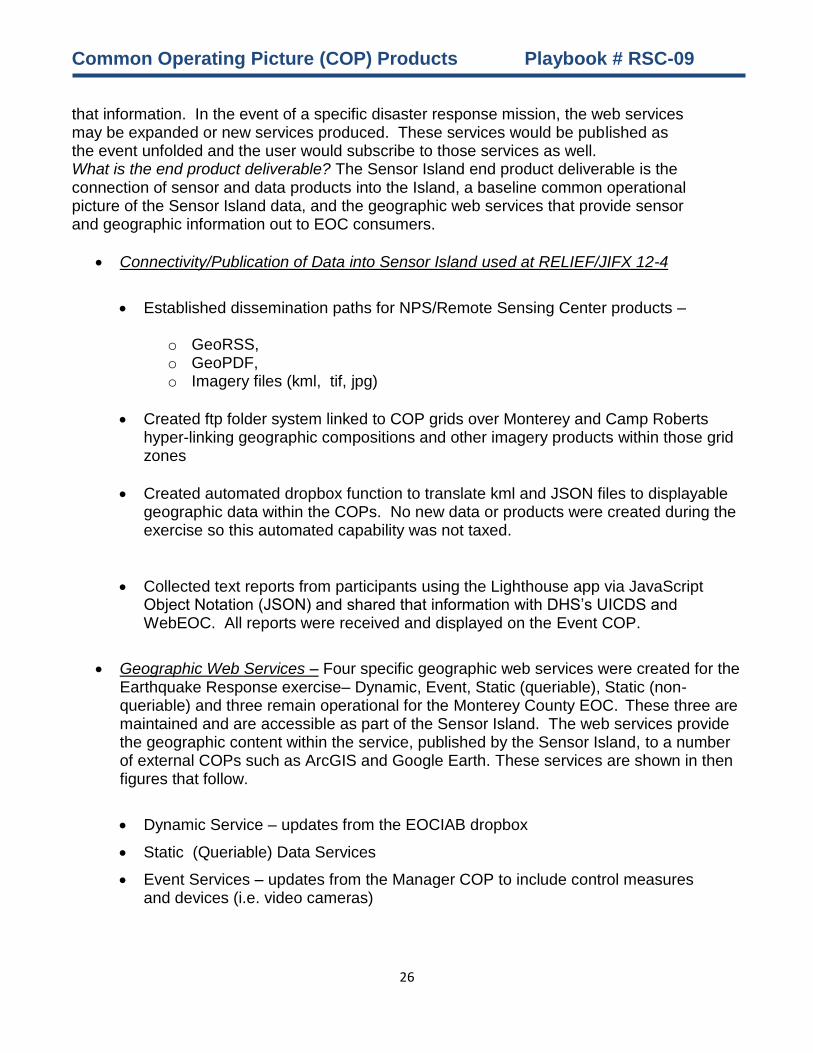
Figure 1 shows the Sensor Island architecture and serves to also show the “end product”, which consists of the hardware, software and communications elements within the center “Sensor Island – CAW” box and the connection lines between the dynamic data producers on the left of the box, other web services and capabilities below the box, and the common operational picture consumers to the right of the box. These connections are always on when the system is configured, and can serve as a 24/7 data exchange function for training, exercises, and actual operations. The specific configuration for any particular user/client of Sensor Island will depend on the user and the activity. Sensor Island was specifically designed to adapt to ad hoc situations and response requirements, allowing it to be used and shared as needed.
Figure 1: Sensor Island Architecture for Monterey County
Figure 1, in addition to providing a graphic of the “end product”, also shows the specific architecture as implemented for an NPS demonstration at RELIEF (An emergency response exercise - JIFX 12-4) during August 2012. This architecture supported the SDSU and EOC in a Box sensor owners/contributors on the left side of the diagram pushing sensor data to the Sensor Island and the island in turn disseminating that information, via consumable geographic web services, to responder Common Operational Picture types (FLEX, WebEOC (Arc), and GoogleEarth) on the right. These
Common Operating Picture (COP) Products Playbook # RSC-09
25
COPs represent both external consumers of the sensor information coming from the contributors but also represent COPs that are resident at the contributor’s location. Why is this capability useful? – The Sensor Island provides comprehensive situational awareness and response capability made available across the response “enterprise”. Each individual contributor provides their unique sensor information to the island and only needs to connect to the Sensor Island to disseminate their output products. Those products could be an alarm or some sort of geographic product update. By connecting to the Sensor Island, a consumer of information such as the Monterey County EOC, need not make individual connections with every data producer, just the Sensor Island.
Who would find this product useful? - There are two primary users of the Sensor Island product, the data producers (sensors and geographic data producers) and the data consumers (emergency operations centers and responders). Data producers such as the San Diego State University and TerraPan Labs contributors to the JIFX 12 -4 exercise, used the Sensor Island as a means of distributing their products to emergency operations centers. Data consumers would either connect to Sensor Island to pull these products into their own geographic viewing/common operational pictures or log on to the Sensor Island site and use the island’s COP. When should this product be used? - The Sensor Island should be used on a daily basis to support day-to-day operations and to be ready to respond in the event of an emergency or disaster situation. The basic functions of the Sensor Island are always on so any common sensor layout that serves a particular client, i.e. Monterey County video cameras, meteorological and geodetic sensors, or tsunami alarms, could always be connected and operating within the common operational picture framework of the EOC. The sensor information would be coming into the EOC via published geographic web services that could always be turned on and operating. Where would this product be used? The Sensor Island operates out of the CAW at all times in this particular situation. The connections to Sensor Island would be made by consumers with approved access to the Sensor Island. This access would allow some users access to the published services that connect the dynamic data into their existing information and mapping infrastructure. In this instance, the product would be used in conjunction with their organization’s common operational picture/mapping system. For users who don’t have a particular COP/mapping system, the user would connect to the Sensor Island provided COP and the Sensor Island information through the use of a web browser on their viewing system, whether that system is a desktop, laptop, or tablet computer. How would this product be used? The Sensor Island would be used as part of the setup and operations of a consumer’s common operational picture. This COP is often a stand-alone capability or could be part of a commercial or government provided emergency response framework such as WebEOC or UICDS. These systems include the ability to access the common geographic web services published by Sensor Island. Once configured to subscribe/connect to those services the customer’s COP will receive
Common Operating Picture (COP) Products Playbook # RSC-09
26
that information. In the event of a specific disaster response mission, the web services may be expanded or new services produced. These services would be published as the event unfolded and the user would subscribe to those services as well. What is the end product deliverable? The Sensor Island end product deliverable is the connection of sensor and data products into the Island, a baseline common operational picture of the Sensor Island data, and the geographic web services that provide sensor and geographic information out to EOC consumers.
Connectivity/Publication of Data into Sensor Island used at RELIEF/JIFX 12-4
Established dissemination paths for NPS/Remote Sensing Center products –
o GeoRSS, o GeoPDF, o Imagery files (kml, tif, jpg)
Created ftp folder system linked to COP grids over Monterey and Camp Roberts hyper-linking geographic compositions and other imagery products within those grid zones
Created automated dropbox function to translate kml and JSON files to displayable geographic data within the COPs. No new data or products were created during the exercise so this automated capability was not taxed.
Collected text reports from participants using the Lighthouse app via JavaScript Object Notation (JSON) and shared that information with DHS’s UICDS and WebEOC. All reports were received and displayed on the Event COP.
Geographic Web Services – Four specific geographic web services were created for the Earthquake Response exercise– Dynamic, Event, Static (queriable), Static (non-queriable) and three remain operational for the Monterey County EOC. These three are maintained and are accessible as part of the Sensor Island. The web services provide the geographic content within the service, published by the Sensor Island, to a number of external COPs such as ArcGIS and Google Earth. These services are shown in then figures that follow.
Dynamic Service – updates from the EOCIAB dropbox
Static (Queriable) Data Services
Event Services – updates from the Manager COP to include control measures and devices (i.e. video cameras)
Common Operating Picture (COP) Products Playbook # RSC-09
27
These services can change as exercises and emergency response events dictate, with the CAW team providing dynamic updates as needed.
Common Operational Pictures - The Sensor Island common operational pictures include an “Event” COP and a “Manager” COP. Each of these COPs operate on the Sensor Island hardware and software architecture located at the Center for Asymmetric Warfare and are accessed by the user on their computers/browsers through CAW provided URL addresses. The primary difference between the two is that the Exercise COP is a “view only” COP and the Manager COP allows select users, usually at the CAW or members of the GIS team supporting an EOC, to add control measure overlays and sensors to the Sensor Island that are then disseminated out to the “view only” Exercise COP.
Sensor Island Ingest Formats: for KML and JSON files
Introduction
Sensor Island’s ingest of KML and JSON formatted data files is targeted at receiving on-scene information in a disaster response scenario. These reports come from the Lighthouse ODK application(s) and Ushahidi clients which allow users to quickly collect names and descriptions of events occurring at their location. It was NOT intended as a general purpose KML reader or file conversion function. This capability could be implemented but is a significantly different project than the original task.
KML formatted reports
The KML processor looks for general file information as well as for Placemark Point data. Note only POINT placemarks are handled. Also, items with the same ID are considered to be the same item. If additional reports are received that reference an already reported ID, the feature with that ID in the SDE database will be updated with the new information. The reporting applications used a guaranteed unique ID approach to distinguish different reported items. File Information:
Id – string Name – string Balloon – string Description -string
Placemark Information: Id – string Name – string latitude – double longitude –double
JSON formatted reports
The JSON processor looks for three “categories” of JSON data; 1) CAL_FIRES produced data, 2) San Diego produced files, and 3) any other JSON producer. The processor will attempt to extract the following information

Common Operating Picture (COP) Products Playbook # RSC-09
28
depending on the category. The category is determined by the file name. As with the KML reports, items with the same ID are considered to be the same item. If additional reports are received that reference an already reported ID, the feature with that ID in the SDE database will be updated with the new information. The reporting applications used a guaranteed unique ID approach to distinguish different reported items.
1) “CAL FIRES” data (file names starting with “CAL”, capitalization doesn’t matter)
start – date time
end – date time today = date time deviceid – string imei – string phonenumber – string latitude – double longitude – double altitude -= double accuracy – double geopoint_manual – string address_number – integer address_street_name – string occupant – string owner – string describe_structure – string number_assigned – integer residential_dwellings – integer vehicles – integer foundation_card_number – string gps_waypoint_number – string structure_damage_condition string dwellings_structure_habitable – string property_use – string defensive_actions – string length – integer width – integer structure_height – integer construction_quality – string property_management – string civilian_injuries – integer civilian_deaths – integer area_origin – string certainty_area_origin – string heat_ignition – string certainty_heat_ignition – string fire_protection_systems – string photograph – string additional_comments – string instanceID – string

Common Operating Picture (COP) Products Playbook # RSC-09
29
2) “San Diego “ data (file names starting with “San”, capitalization doesn’t matter)
report_number – integer
start – date time
end – date time today = date time incident_name – string apn – string team_number – string property_owner_manual – string property_address_number – integer street_name – string city – string state – string zip_code– string primary_structure – string basement – string number_of_stories – integer other_structures_on_site – string separate_assessment_related – string separate_assessment _report_number - string primary_occupancy – string other – string instructions – string collapse - string leaning - string severe_damage_distress - string falling_hazard – string severe_movement – string other_hazard – string overall_rating – string photo – string latitude – double longitude – double altitude -= double accuracy – double recommendation - string detailed_eval – string other_eval – string barricades – string comments – string
3) Any other JSON file
start – date time
end – date time today = date time latitude – double longitude – double
Common Operating Picture (COP) Products Playbook # RSC-09
30
altitude -= double accuracy – double comments - string
Any exceptions caught while processing these data files will cause the file to simply be ignored. Log messages are recorded for all processing steps.
References