common core state standards with california ... - agile · pdf file© california...
TRANSCRIPT
Publisher: Agile Mind Inc Program Title: CCSS CA Algebra I Components:
© California Department of Education Common Core State Standards Map January 16, 2013 Page 1
Common Core State Standards with California Additions1 Standards Map
Algebra I
*Indicates a modeling standard linking mathematics to everyday life, work, and decision-making
Publisher Citations Meets
Standard
For Reviewer Use Only
Standard No.
Standard Language2 Primary Citations Supporting Citations
Y N Reviewer Notes
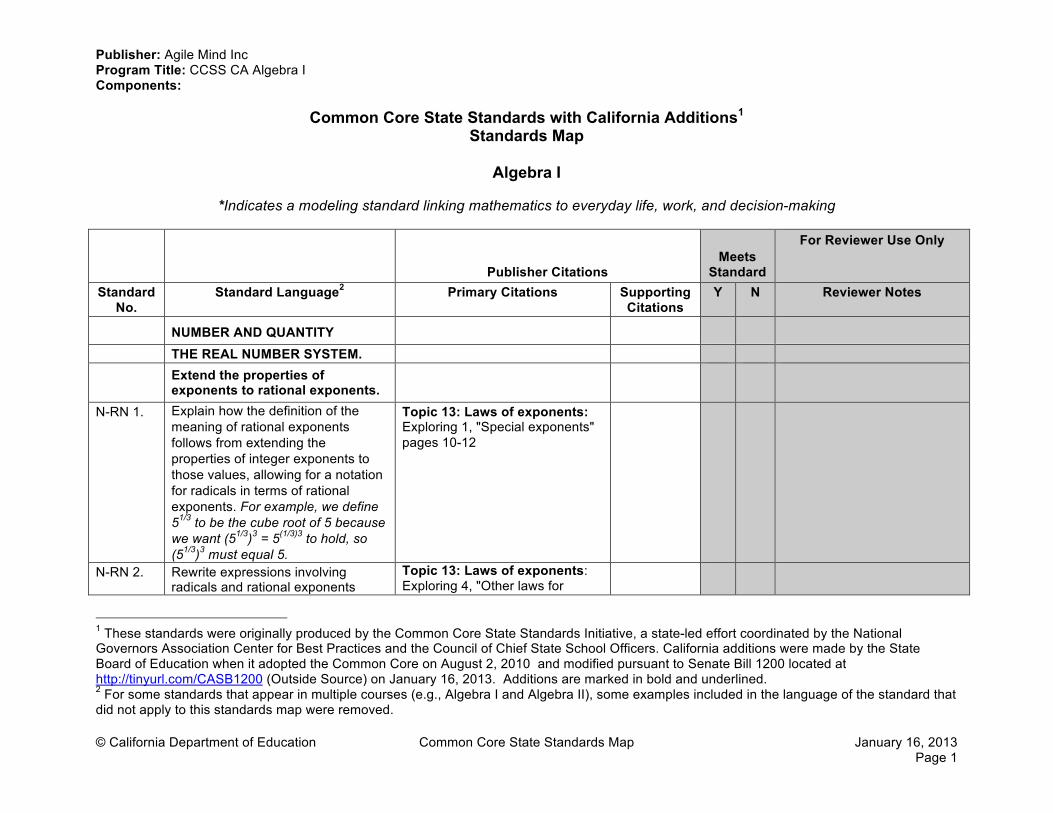
NUMBER AND QUANTITY
THE REAL NUMBER SYSTEM. Extend the properties of
exponents to rational exponents.
N-RN 1. Explain how the definition of the meaning of rational exponents follows from extending the properties of integer exponents to those values, allowing for a notation for radicals in terms of rational exponents. For example, we define 51/3 to be the cube root of 5 because we want (51/3)3 = 5(1/3)3 to hold, so (51/3)3 must equal 5.
Topic 13: Laws of exponents: Exploring 1, "Special exponents" pages 10-12
N-RN 2. Rewrite expressions involving radicals and rational exponents
Topic 13: Laws of exponents: Exploring 4, "Other laws for
1 These standards were originally produced by the Common Core State Standards Initiative, a state-led effort coordinated by the National Governors Association Center for Best Practices and the Council of Chief State School Officers. California additions were made by the State Board of Education when it adopted the Common Core on August 2, 2010 and modified pursuant to Senate Bill 1200 located at http://tinyurl.com/CASB1200 (Outside Source) on January 16, 2013. Additions are marked in bold and underlined. 2 For some standards that appear in multiple courses (e.g., Algebra I and Algebra II), some examples included in the language of the standard that did not apply to this standards map were removed.
Publisher: Agile Mind Inc Program Title: CCSS CA Algebra I Components:
© California Department of Education Common Core State Standards Map January 16, 2013 Page 2
Publisher Citations Meets
Standard
For Reviewer Use Only
Standard No.
Standard Language2 Primary Citations Supporting Citations
Y N Reviewer Notes
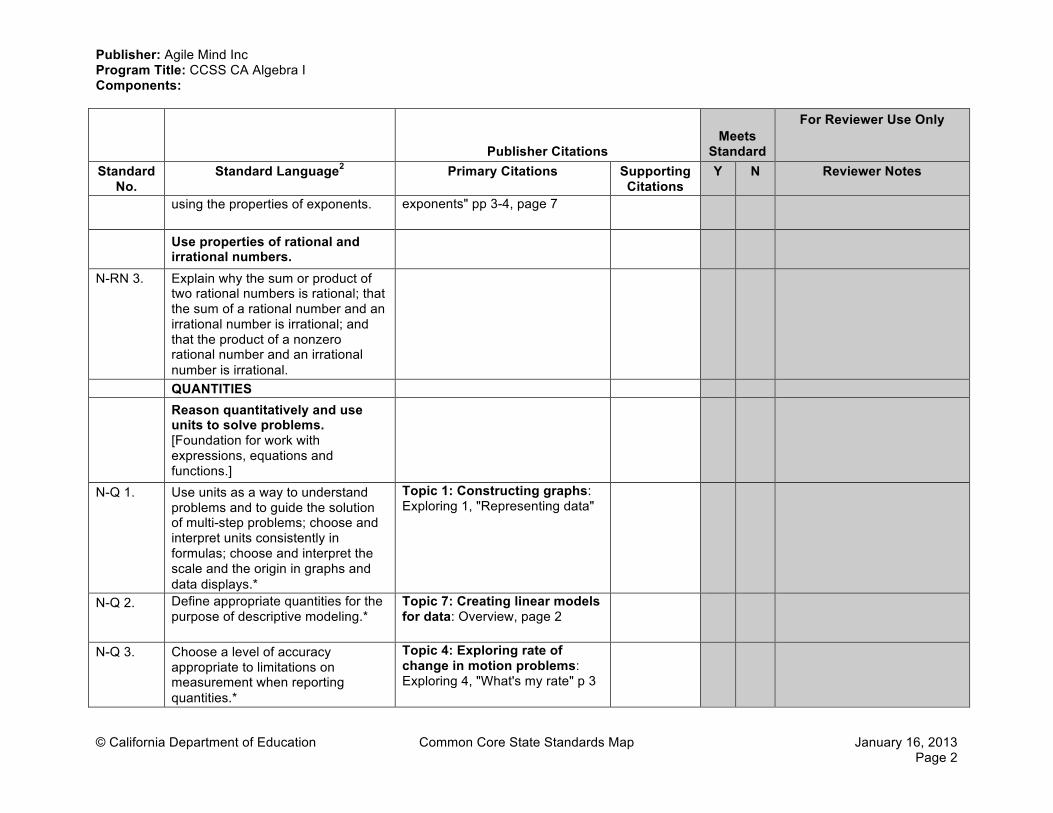
using the properties of exponents. exponents" pp 3-4, page 7
Use properties of rational and irrational numbers.
N-RN 3. Explain why the sum or product of two rational numbers is rational; that the sum of a rational number and an irrational number is irrational; and that the product of a nonzero rational number and an irrational number is irrational.
QUANTITIES Reason quantitatively and use
units to solve problems. [Foundation for work with expressions, equations and functions.]
N-Q 1. Use units as a way to understand problems and to guide the solution of multi-step problems; choose and interpret units consistently in formulas; choose and interpret the scale and the origin in graphs and data displays.*
Topic 1: Constructing graphs: Exploring 1, "Representing data"
N-Q 2. Define appropriate quantities for the purpose of descriptive modeling.*
Topic 7: Creating linear models for data: Overview, page 2
N-Q 3. Choose a level of accuracy appropriate to limitations on measurement when reporting quantities.*
Topic 4: Exploring rate of change in motion problems: Exploring 4, "What's my rate" p 3
Publisher: Agile Mind Inc Program Title: CCSS CA Algebra I Components:
© California Department of Education Common Core State Standards Map January 16, 2013 Page 3
Publisher Citations Meets
Standard
For Reviewer Use Only
Standard No.
Standard Language2 Primary Citations Supporting Citations
Y N Reviewer Notes
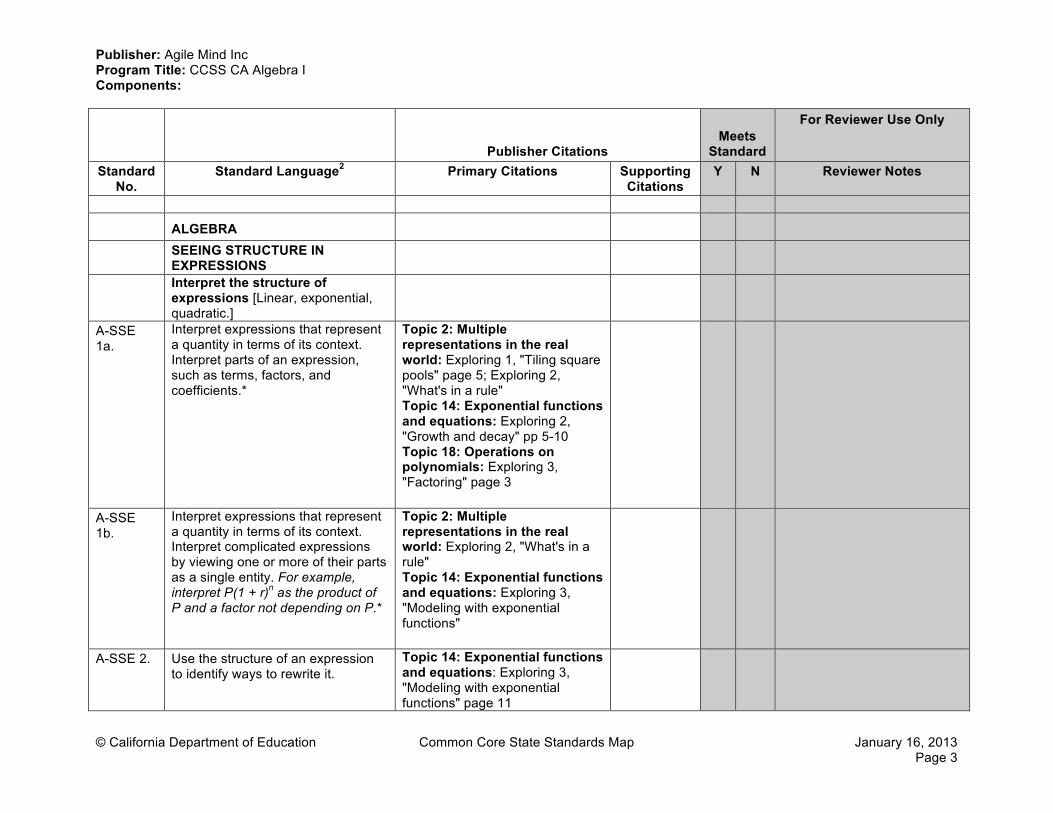
ALGEBRA
SEEING STRUCTURE IN EXPRESSIONS
Interpret the structure of expressions [Linear, exponential, quadratic.]
A-SSE 1a.
Interpret expressions that represent a quantity in terms of its context. Interpret parts of an expression, such as terms, factors, and coefficients.*
Topic 2: Multiple representations in the real world: Exploring 1, "Tiling square pools" page 5; Exploring 2, "What's in a rule" Topic 14: Exponential functions and equations: Exploring 2, "Growth and decay" pp 5-10 Topic 18: Operations on polynomials: Exploring 3, "Factoring" page 3
A-SSE 1b.
Interpret expressions that represent a quantity in terms of its context. Interpret complicated expressions by viewing one or more of their parts as a single entity. For example, interpret P(1 + r)n as the product of P and a factor not depending on P.*
Topic 2: Multiple representations in the real world: Exploring 2, "What's in a rule" Topic 14: Exponential functions and equations: Exploring 3, "Modeling with exponential functions"
A-SSE 2. Use the structure of an expression to identify ways to rewrite it.
Topic 14: Exponential functions and equations: Exploring 3, "Modeling with exponential functions" page 11
Publisher: Agile Mind Inc Program Title: CCSS CA Algebra I Components:
© California Department of Education Common Core State Standards Map January 16, 2013 Page 4
Publisher Citations Meets
Standard
For Reviewer Use Only
Standard No.
Standard Language2 Primary Citations Supporting Citations
Y N Reviewer Notes
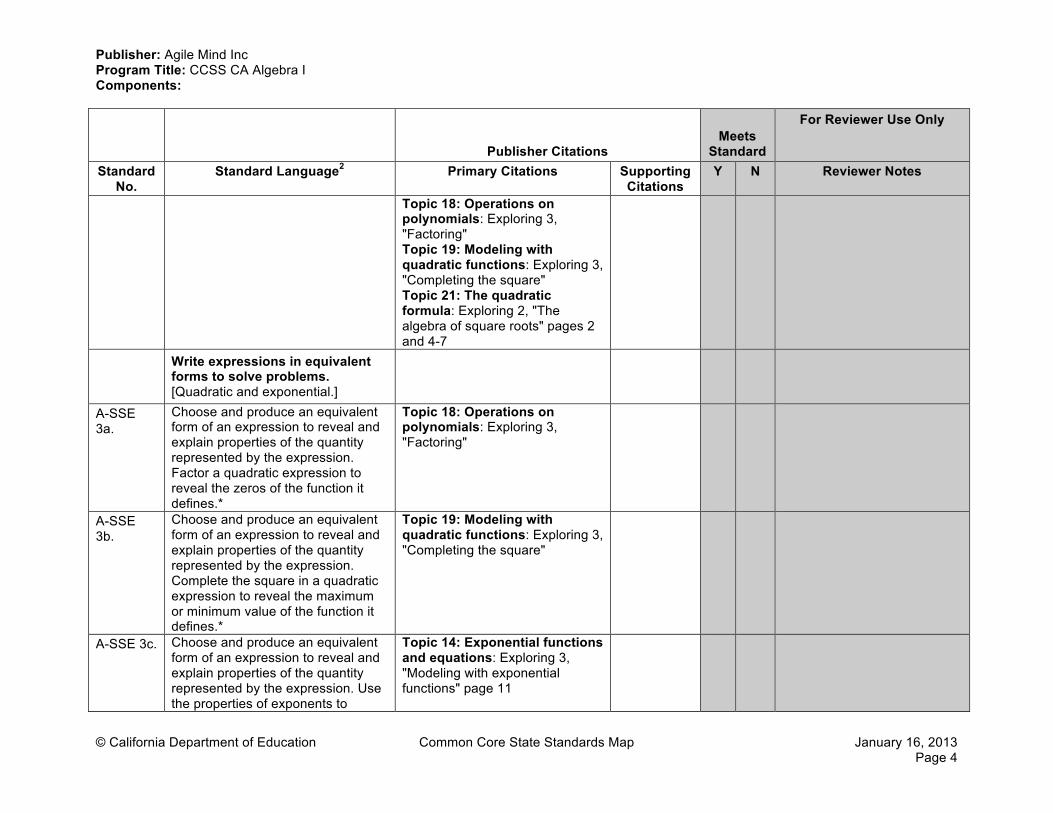
Topic 18: Operations on polynomials: Exploring 3, "Factoring" Topic 19: Modeling with quadratic functions: Exploring 3, "Completing the square" Topic 21: The quadratic formula: Exploring 2, "The algebra of square roots" pages 2 and 4-7
Write expressions in equivalent forms to solve problems. [Quadratic and exponential.]
A-SSE 3a.
Choose and produce an equivalent form of an expression to reveal and explain properties of the quantity represented by the expression. Factor a quadratic expression to reveal the zeros of the function it defines.*
Topic 18: Operations on polynomials: Exploring 3, "Factoring"
A-SSE 3b.
Choose and produce an equivalent form of an expression to reveal and explain properties of the quantity represented by the expression. Complete the square in a quadratic expression to reveal the maximum or minimum value of the function it defines.*
Topic 19: Modeling with quadratic functions: Exploring 3, "Completing the square"
A-SSE 3c. Choose and produce an equivalent form of an expression to reveal and explain properties of the quantity represented by the expression. Use the properties of exponents to
Topic 14: Exponential functions and equations: Exploring 3, "Modeling with exponential functions" page 11
Publisher: Agile Mind Inc Program Title: CCSS CA Algebra I Components:
© California Department of Education Common Core State Standards Map January 16, 2013 Page 5
Publisher Citations Meets
Standard
For Reviewer Use Only
Standard No.
Standard Language2 Primary Citations Supporting Citations
Y N Reviewer Notes
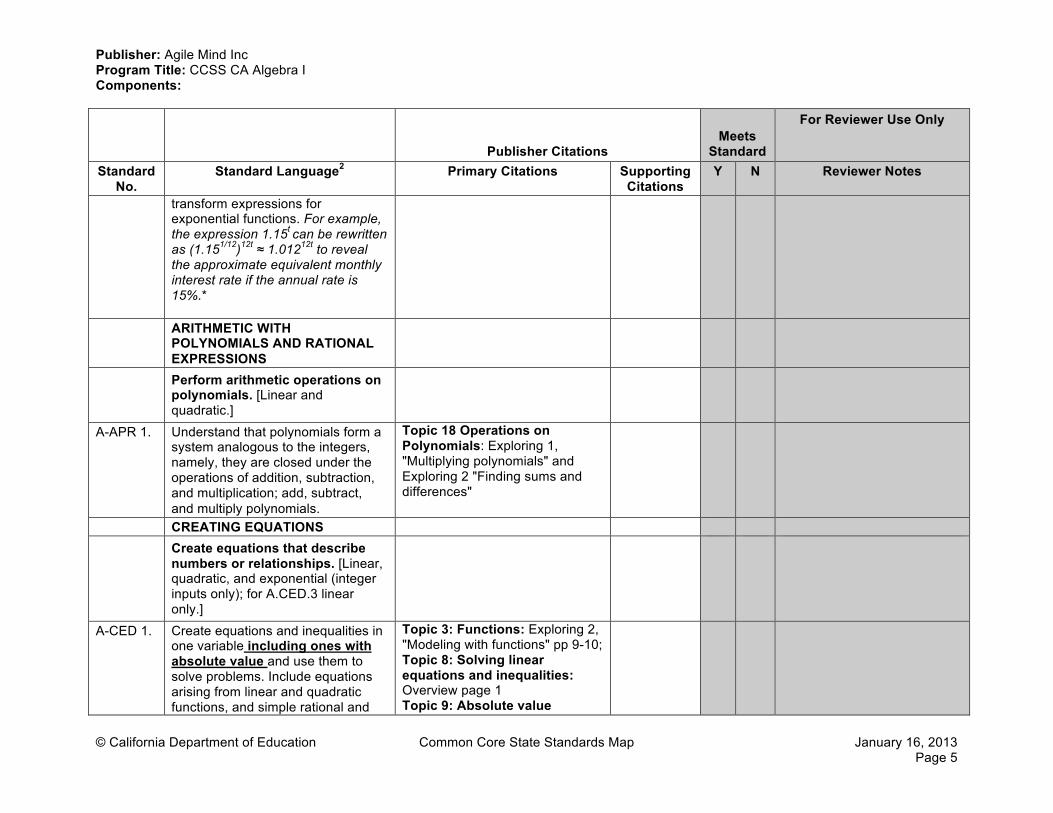
transform expressions for exponential functions. For example, the expression 1.15t can be rewritten as (1.151/12)12t ≈ 1.01212t to reveal the approximate equivalent monthly interest rate if the annual rate is 15%.*
ARITHMETIC WITH POLYNOMIALS AND RATIONAL EXPRESSIONS
Perform arithmetic operations on polynomials. [Linear and quadratic.]
A-APR 1. Understand that polynomials form a system analogous to the integers, namely, they are closed under the operations of addition, subtraction, and multiplication; add, subtract, and multiply polynomials.
Topic 18 Operations on Polynomials: Exploring 1, "Multiplying polynomials" and Exploring 2 "Finding sums and differences"
CREATING EQUATIONS Create equations that describe
numbers or relationships. [Linear, quadratic, and exponential (integer inputs only); for A.CED.3 linear only.]
A-CED 1. Create equations and inequalities in one variable including ones with absolute value and use them to solve problems. Include equations arising from linear and quadratic functions, and simple rational and
Topic 3: Functions: Exploring 2, "Modeling with functions" pp 9-10; Topic 8: Solving linear equations and inequalities: Overview page 1 Topic 9: Absolute value
Publisher: Agile Mind Inc Program Title: CCSS CA Algebra I Components:
© California Department of Education Common Core State Standards Map January 16, 2013 Page 6
Publisher Citations Meets
Standard
For Reviewer Use Only
Standard No.
Standard Language2 Primary Citations Supporting Citations
Y N Reviewer Notes
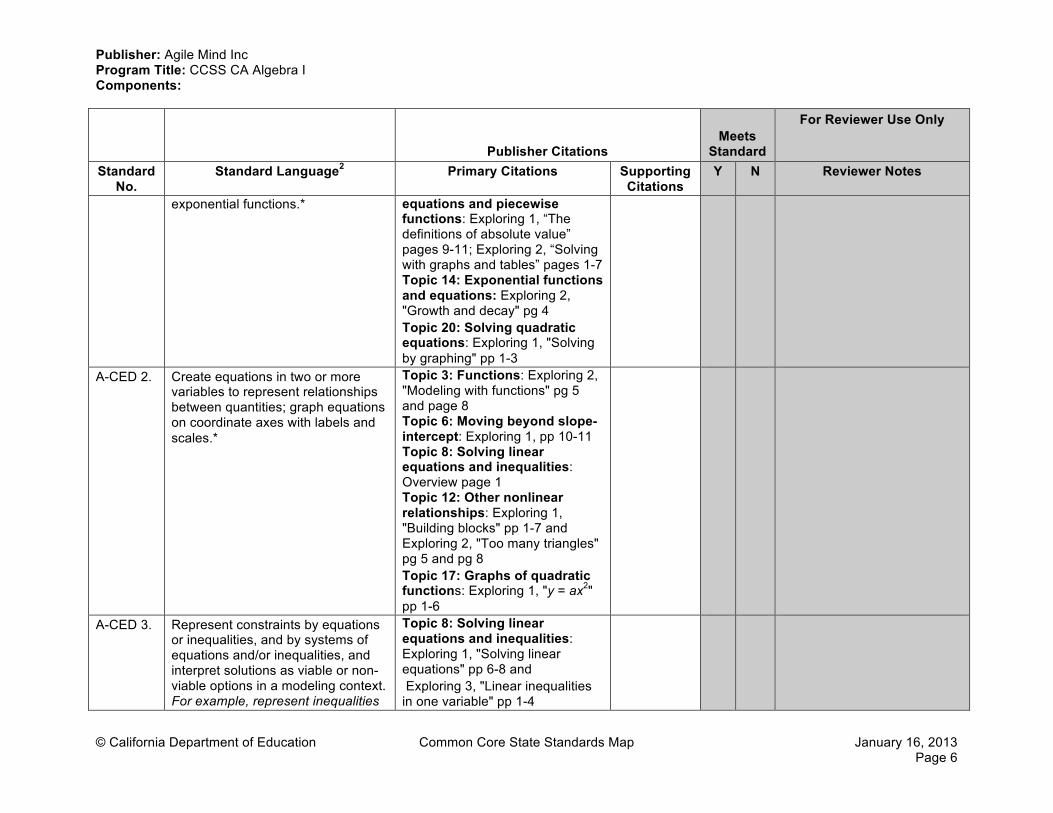
exponential functions.* equations and piecewise functions: Exploring 1, “The definitions of absolute value” pages 9-11; Exploring 2, “Solving with graphs and tables” pages 1-7 Topic 14: Exponential functions and equations: Exploring 2, "Growth and decay" pg 4 Topic 20: Solving quadratic equations: Exploring 1, "Solving by graphing" pp 1-3
A-CED 2. Create equations in two or more variables to represent relationships between quantities; graph equations on coordinate axes with labels and scales.*
Topic 3: Functions: Exploring 2, "Modeling with functions" pg 5 and page 8 Topic 6: Moving beyond slope-intercept: Exploring 1, pp 10-11 Topic 8: Solving linear equations and inequalities: Overview page 1 Topic 12: Other nonlinear relationships: Exploring 1, "Building blocks" pp 1-7 and Exploring 2, "Too many triangles" pg 5 and pg 8 Topic 17: Graphs of quadratic functions: Exploring 1, "y = ax2" pp 1-6
A-CED 3. Represent constraints by equations or inequalities, and by systems of equations and/or inequalities, and interpret solutions as viable or non-viable options in a modeling context. For example, represent inequalities
Topic 8: Solving linear equations and inequalities: Exploring 1, "Solving linear equations" pp 6-8 and Exploring 3, "Linear inequalities in one variable" pp 1-4
Publisher: Agile Mind Inc Program Title: CCSS CA Algebra I Components:
© California Department of Education Common Core State Standards Map January 16, 2013 Page 7
Publisher Citations Meets
Standard
For Reviewer Use Only
Standard No.
Standard Language2 Primary Citations Supporting Citations
Y N Reviewer Notes
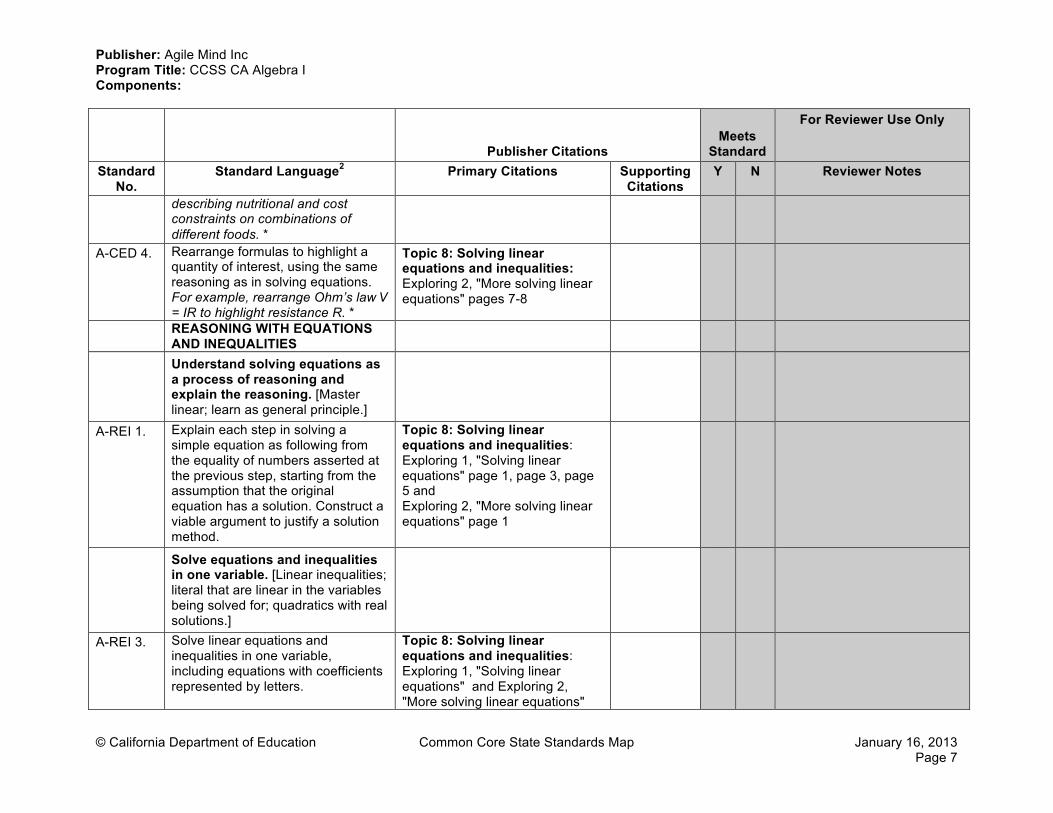
describing nutritional and cost constraints on combinations of different foods. *
A-CED 4. Rearrange formulas to highlight a quantity of interest, using the same reasoning as in solving equations. For example, rearrange Ohm’s law V = IR to highlight resistance R. *
Topic 8: Solving linear equations and inequalities: Exploring 2, "More solving linear equations" pages 7-8
REASONING WITH EQUATIONS AND INEQUALITIES
Understand solving equations as a process of reasoning and explain the reasoning. [Master linear; learn as general principle.]
A-REI 1. Explain each step in solving a simple equation as following from the equality of numbers asserted at the previous step, starting from the assumption that the original equation has a solution. Construct a viable argument to justify a solution method.
Topic 8: Solving linear equations and inequalities: Exploring 1, "Solving linear equations" page 1, page 3, page 5 and Exploring 2, "More solving linear equations" page 1
Solve equations and inequalities in one variable. [Linear inequalities; literal that are linear in the variables being solved for; quadratics with real solutions.]
A-REI 3. Solve linear equations and inequalities in one variable, including equations with coefficients represented by letters.
Topic 8: Solving linear equations and inequalities: Exploring 1, "Solving linear equations" and Exploring 2, "More solving linear equations"
Publisher: Agile Mind Inc Program Title: CCSS CA Algebra I Components:
© California Department of Education Common Core State Standards Map January 16, 2013 Page 8
Publisher Citations Meets
Standard
For Reviewer Use Only
Standard No.
Standard Language2 Primary Citations Supporting Citations
Y N Reviewer Notes
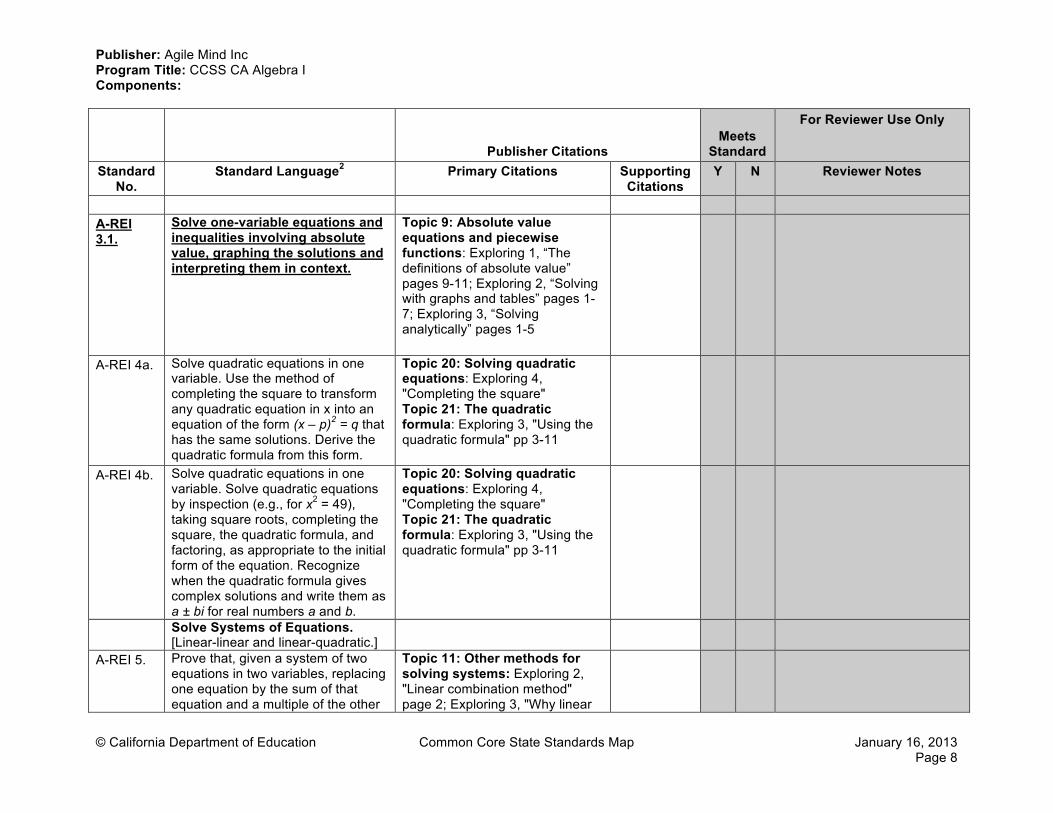
A-REI 3.1.
Solve one-variable equations and inequalities involving absolute value, graphing the solutions and interpreting them in context.
Topic 9: Absolute value equations and piecewise functions: Exploring 1, “The definitions of absolute value” pages 9-11; Exploring 2, “Solving with graphs and tables” pages 1-7; Exploring 3, “Solving analytically” pages 1-5
A-REI 4a. Solve quadratic equations in one variable. Use the method of completing the square to transform any quadratic equation in x into an equation of the form (x – p)2 = q that has the same solutions. Derive the quadratic formula from this form.
Topic 20: Solving quadratic equations: Exploring 4, "Completing the square" Topic 21: The quadratic formula: Exploring 3, "Using the quadratic formula" pp 3-11
A-REI 4b. Solve quadratic equations in one variable. Solve quadratic equations by inspection (e.g., for x2 = 49), taking square roots, completing the square, the quadratic formula, and factoring, as appropriate to the initial form of the equation. Recognize when the quadratic formula gives complex solutions and write them as a ± bi for real numbers a and b.
Topic 20: Solving quadratic equations: Exploring 4, "Completing the square" Topic 21: The quadratic formula: Exploring 3, "Using the quadratic formula" pp 3-11
Solve Systems of Equations. [Linear-linear and linear-quadratic.]
A-REI 5. Prove that, given a system of two equations in two variables, replacing one equation by the sum of that equation and a multiple of the other
Topic 11: Other methods for solving systems: Exploring 2, "Linear combination method" page 2; Exploring 3, "Why linear
Publisher: Agile Mind Inc Program Title: CCSS CA Algebra I Components:
© California Department of Education Common Core State Standards Map January 16, 2013 Page 9
Publisher Citations Meets
Standard
For Reviewer Use Only
Standard No.
Standard Language2 Primary Citations Supporting Citations
Y N Reviewer Notes
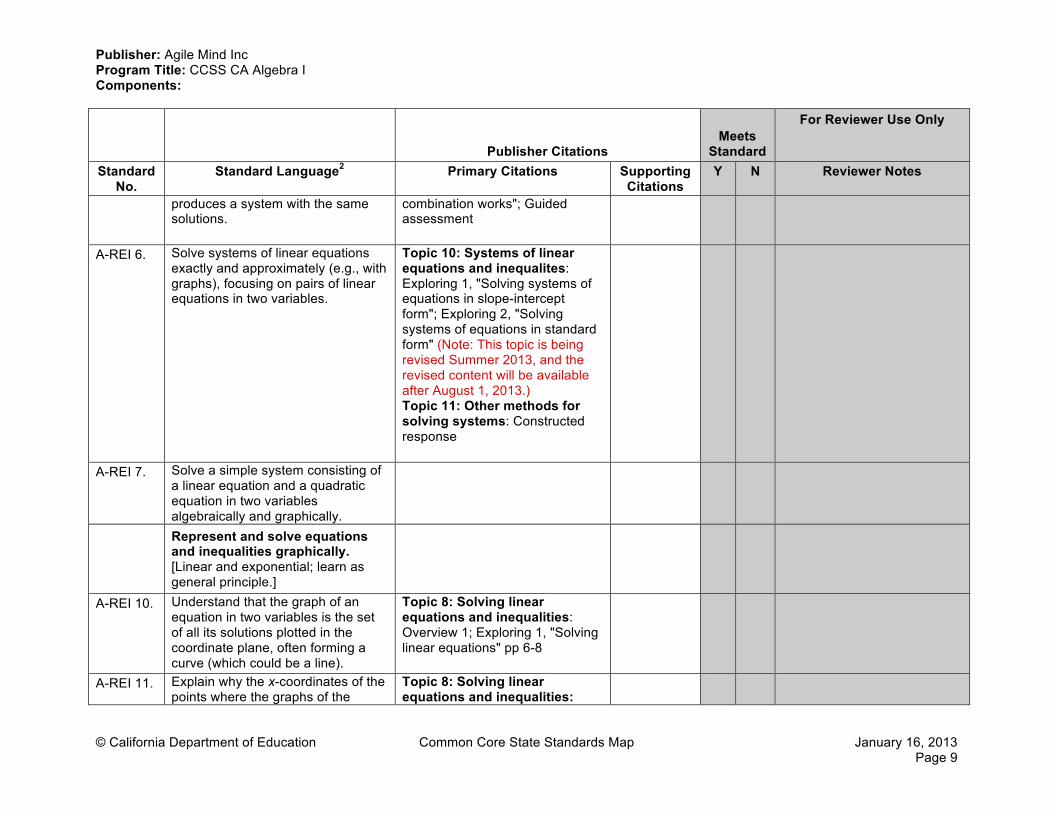
produces a system with the same solutions.
combination works"; Guided assessment
A-REI 6. Solve systems of linear equations exactly and approximately (e.g., with graphs), focusing on pairs of linear equations in two variables.
Topic 10: Systems of linear equations and inequalites: Exploring 1, "Solving systems of equations in slope-intercept form"; Exploring 2, "Solving systems of equations in standard form" (Note: This topic is being revised Summer 2013, and the revised content will be available after August 1, 2013.) Topic 11: Other methods for solving systems: Constructed response
A-REI 7. Solve a simple system consisting of a linear equation and a quadratic equation in two variables algebraically and graphically.
Represent and solve equations and inequalities graphically. [Linear and exponential; learn as general principle.]
A-REI 10. Understand that the graph of an equation in two variables is the set of all its solutions plotted in the coordinate plane, often forming a curve (which could be a line).
Topic 8: Solving linear equations and inequalities: Overview 1; Exploring 1, "Solving linear equations" pp 6-8
A-REI 11. Explain why the x-coordinates of the points where the graphs of the
Topic 8: Solving linear equations and inequalities:
Publisher: Agile Mind Inc Program Title: CCSS CA Algebra I Components:
© California Department of Education Common Core State Standards Map January 16, 2013 Page 10
Publisher Citations Meets
Standard
For Reviewer Use Only
Standard No.
Standard Language2 Primary Citations Supporting Citations
Y N Reviewer Notes
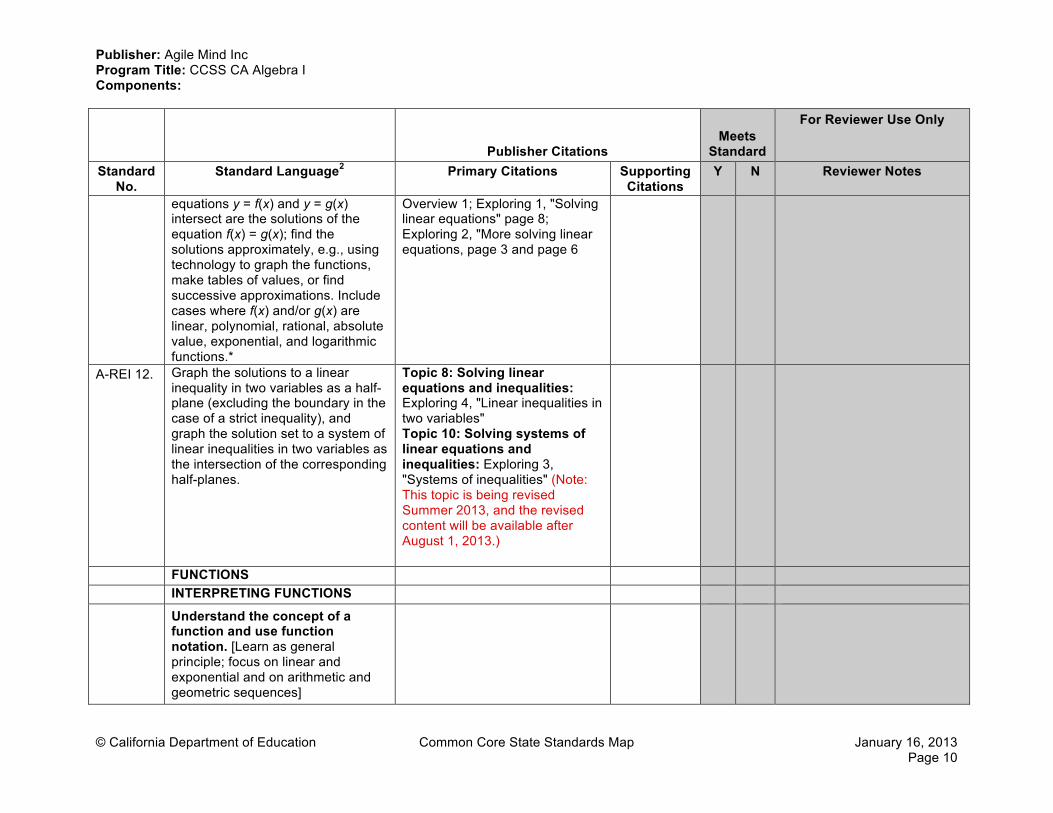
equations y = f(x) and y = g(x) intersect are the solutions of the equation f(x) = g(x); find the solutions approximately, e.g., using technology to graph the functions, make tables of values, or find successive approximations. Include cases where f(x) and/or g(x) are linear, polynomial, rational, absolute value, exponential, and logarithmic functions.*
Overview 1; Exploring 1, "Solving linear equations" page 8; Exploring 2, "More solving linear equations, page 3 and page 6
A-REI 12. Graph the solutions to a linear inequality in two variables as a half-plane (excluding the boundary in the case of a strict inequality), and graph the solution set to a system of linear inequalities in two variables as the intersection of the corresponding half-planes.
Topic 8: Solving linear equations and inequalities: Exploring 4, "Linear inequalities in two variables" Topic 10: Solving systems of linear equations and inequalities: Exploring 3, "Systems of inequalities" (Note: This topic is being revised Summer 2013, and the revised content will be available after August 1, 2013.)
FUNCTIONS INTERPRETING FUNCTIONS Understand the concept of a
function and use function notation. [Learn as general principle; focus on linear and exponential and on arithmetic and geometric sequences]
Publisher: Agile Mind Inc Program Title: CCSS CA Algebra I Components:
© California Department of Education Common Core State Standards Map January 16, 2013 Page 11
Publisher Citations Meets
Standard
For Reviewer Use Only
Standard No.
Standard Language2 Primary Citations Supporting Citations
Y N Reviewer Notes
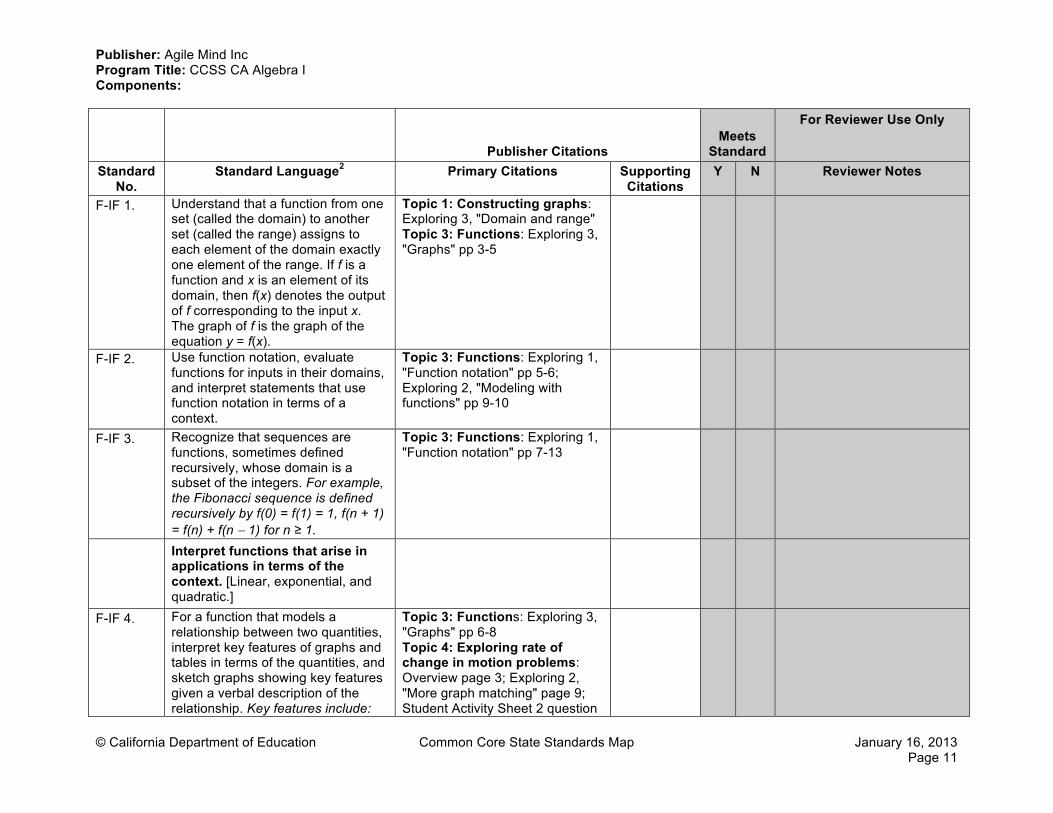
F-IF 1. Understand that a function from one set (called the domain) to another set (called the range) assigns to each element of the domain exactly one element of the range. If f is a function and x is an element of its domain, then f(x) denotes the output of f corresponding to the input x. The graph of f is the graph of the equation y = f(x).
Topic 1: Constructing graphs: Exploring 3, "Domain and range" Topic 3: Functions: Exploring 3, "Graphs" pp 3-5
F-IF 2. Use function notation, evaluate functions for inputs in their domains, and interpret statements that use function notation in terms of a context.
Topic 3: Functions: Exploring 1, "Function notation" pp 5-6; Exploring 2, "Modeling with functions" pp 9-10
F-IF 3. Recognize that sequences are functions, sometimes defined recursively, whose domain is a subset of the integers. For example, the Fibonacci sequence is defined recursively by f(0) = f(1) = 1, f(n + 1) = f(n) + f(n − 1) for n ≥ 1.
Topic 3: Functions: Exploring 1, "Function notation" pp 7-13
Interpret functions that arise in applications in terms of the context. [Linear, exponential, and quadratic.]
F-IF 4. For a function that models a relationship between two quantities, interpret key features of graphs and tables in terms of the quantities, and sketch graphs showing key features given a verbal description of the relationship. Key features include:
Topic 3: Functions: Exploring 3, "Graphs" pp 6-8 Topic 4: Exploring rate of change in motion problems: Overview page 3; Exploring 2, "More graph matching" page 9; Student Activity Sheet 2 question
Publisher: Agile Mind Inc Program Title: CCSS CA Algebra I Components:
© California Department of Education Common Core State Standards Map January 16, 2013 Page 12
Publisher Citations Meets
Standard
For Reviewer Use Only
Standard No.
Standard Language2 Primary Citations Supporting Citations
Y N Reviewer Notes
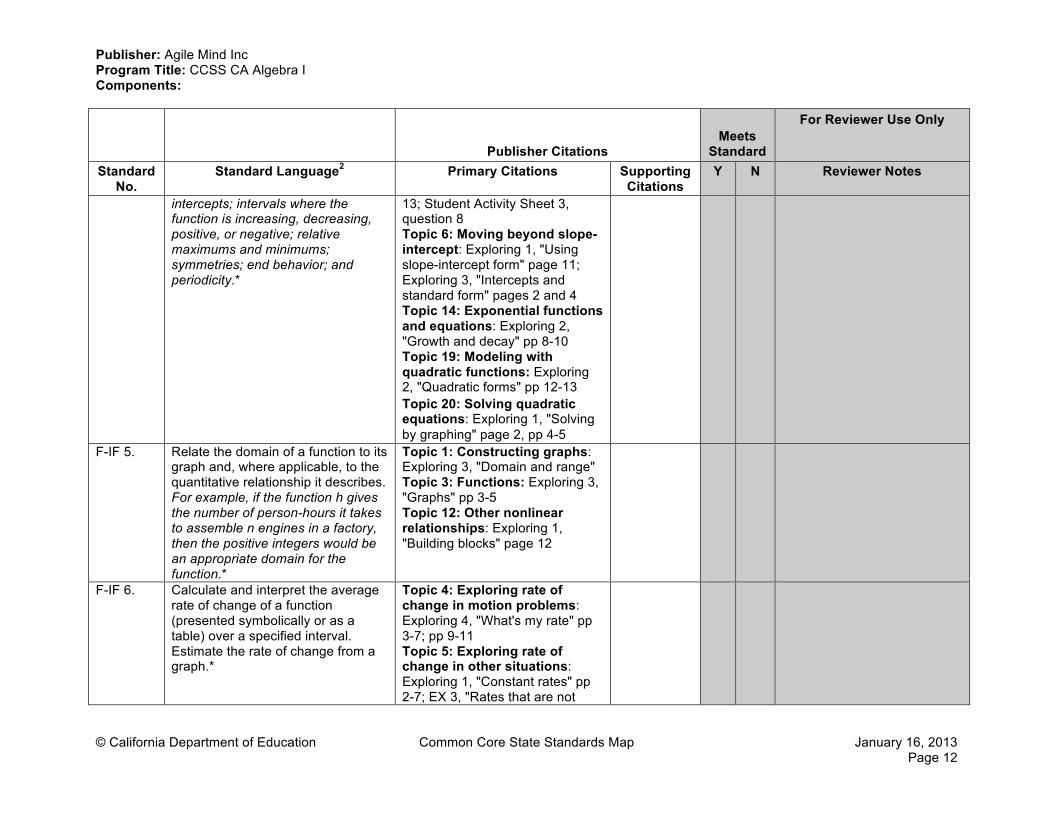
intercepts; intervals where the function is increasing, decreasing, positive, or negative; relative maximums and minimums; symmetries; end behavior; and periodicity.*
13; Student Activity Sheet 3, question 8 Topic 6: Moving beyond slope-intercept: Exploring 1, "Using slope-intercept form" page 11; Exploring 3, "Intercepts and standard form" pages 2 and 4 Topic 14: Exponential functions and equations: Exploring 2, "Growth and decay" pp 8-10 Topic 19: Modeling with quadratic functions: Exploring 2, "Quadratic forms" pp 12-13 Topic 20: Solving quadratic equations: Exploring 1, "Solving by graphing" page 2, pp 4-5
F-IF 5. Relate the domain of a function to its graph and, where applicable, to the quantitative relationship it describes. For example, if the function h gives the number of person-hours it takes to assemble n engines in a factory, then the positive integers would be an appropriate domain for the function.*
Topic 1: Constructing graphs: Exploring 3, "Domain and range" Topic 3: Functions: Exploring 3, "Graphs" pp 3-5 Topic 12: Other nonlinear relationships: Exploring 1, "Building blocks" page 12
F-IF 6. Calculate and interpret the average rate of change of a function (presented symbolically or as a table) over a specified interval. Estimate the rate of change from a graph.*
Topic 4: Exploring rate of change in motion problems: Exploring 4, "What's my rate" pp 3-7; pp 9-11 Topic 5: Exploring rate of change in other situations: Exploring 1, "Constant rates" pp 2-7; EX 3, "Rates that are not
Publisher: Agile Mind Inc Program Title: CCSS CA Algebra I Components:
© California Department of Education Common Core State Standards Map January 16, 2013 Page 13
Publisher Citations Meets
Standard
For Reviewer Use Only
Standard No.
Standard Language2 Primary Citations Supporting Citations
Y N Reviewer Notes
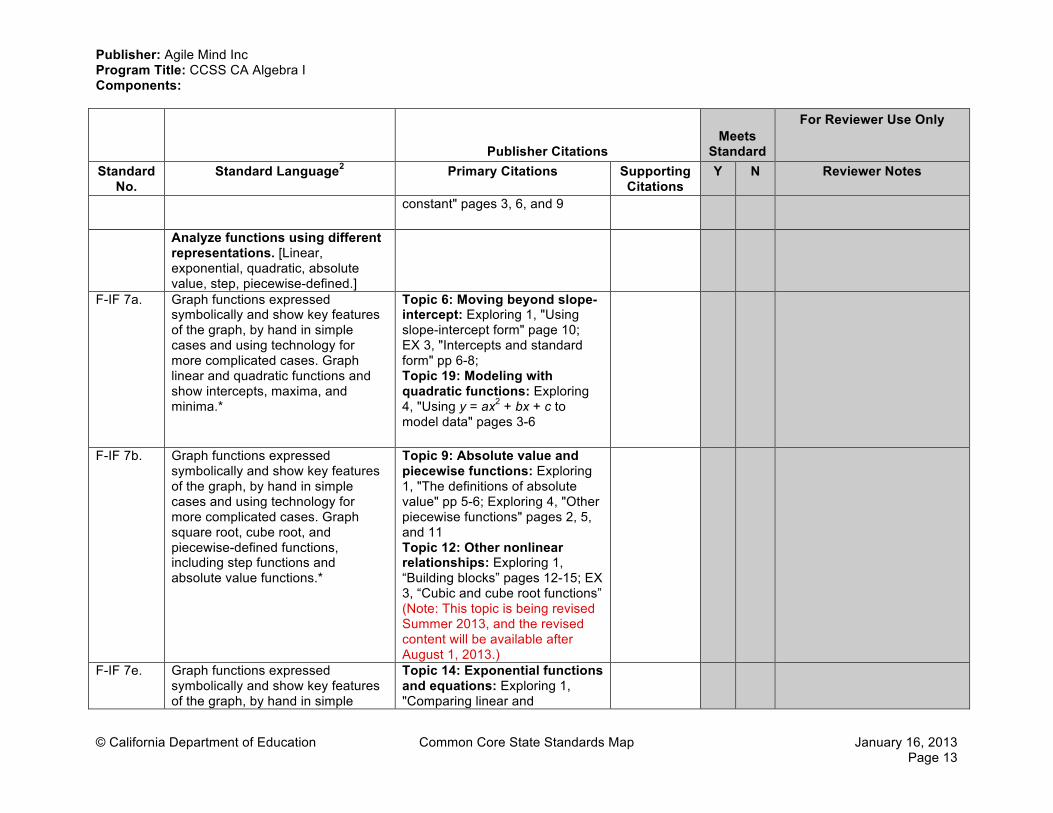
constant" pages 3, 6, and 9
Analyze functions using different representations. [Linear, exponential, quadratic, absolute value, step, piecewise-defined.]
F-IF 7a. Graph functions expressed symbolically and show key features of the graph, by hand in simple cases and using technology for more complicated cases. Graph linear and quadratic functions and show intercepts, maxima, and minima.*
Topic 6: Moving beyond slope-intercept: Exploring 1, "Using slope-intercept form" page 10; EX 3, "Intercepts and standard form" pp 6-8; Topic 19: Modeling with quadratic functions: Exploring 4, "Using y = ax2 + bx + c to model data" pages 3-6
F-IF 7b. Graph functions expressed symbolically and show key features of the graph, by hand in simple cases and using technology for more complicated cases. Graph square root, cube root, and piecewise-defined functions, including step functions and absolute value functions.*
Topic 9: Absolute value and piecewise functions: Exploring 1, "The definitions of absolute value" pp 5-6; Exploring 4, "Other piecewise functions" pages 2, 5, and 11 Topic 12: Other nonlinear relationships: Exploring 1, “Building blocks” pages 12-15; EX 3, “Cubic and cube root functions” (Note: This topic is being revised Summer 2013, and the revised content will be available after August 1, 2013.)
F-IF 7e. Graph functions expressed symbolically and show key features of the graph, by hand in simple
Topic 14: Exponential functions and equations: Exploring 1, "Comparing linear and
Publisher: Agile Mind Inc Program Title: CCSS CA Algebra I Components:
© California Department of Education Common Core State Standards Map January 16, 2013 Page 14
Publisher Citations Meets
Standard
For Reviewer Use Only
Standard No.
Standard Language2 Primary Citations Supporting Citations
Y N Reviewer Notes
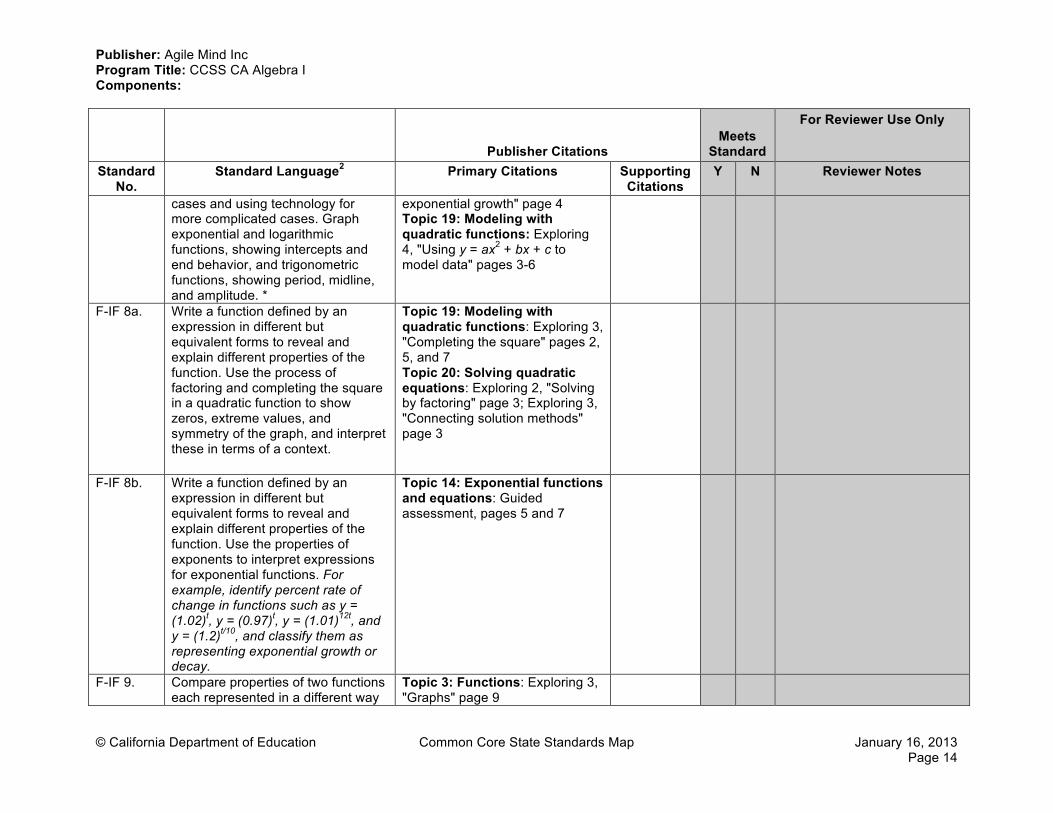
cases and using technology for more complicated cases. Graph exponential and logarithmic functions, showing intercepts and end behavior, and trigonometric functions, showing period, midline, and amplitude. *
exponential growth" page 4 Topic 19: Modeling with quadratic functions: Exploring 4, "Using y = ax2 + bx + c to model data" pages 3-6
F-IF 8a. Write a function defined by an expression in different but equivalent forms to reveal and explain different properties of the function. Use the process of factoring and completing the square in a quadratic function to show zeros, extreme values, and symmetry of the graph, and interpret these in terms of a context.
Topic 19: Modeling with quadratic functions: Exploring 3, "Completing the square" pages 2, 5, and 7 Topic 20: Solving quadratic equations: Exploring 2, "Solving by factoring" page 3; Exploring 3, "Connecting solution methods" page 3
F-IF 8b. Write a function defined by an expression in different but equivalent forms to reveal and explain different properties of the function. Use the properties of exponents to interpret expressions for exponential functions. For example, identify percent rate of change in functions such as y = (1.02)t, y = (0.97)t, y = (1.01)12t, and y = (1.2)t/10, and classify them as representing exponential growth or decay.
Topic 14: Exponential functions and equations: Guided assessment, pages 5 and 7
F-IF 9. Compare properties of two functions each represented in a different way
Topic 3: Functions: Exploring 3, "Graphs" page 9
Publisher: Agile Mind Inc Program Title: CCSS CA Algebra I Components:
© California Department of Education Common Core State Standards Map January 16, 2013 Page 15
Publisher Citations Meets
Standard
For Reviewer Use Only
Standard No.
Standard Language2 Primary Citations Supporting Citations
Y N Reviewer Notes
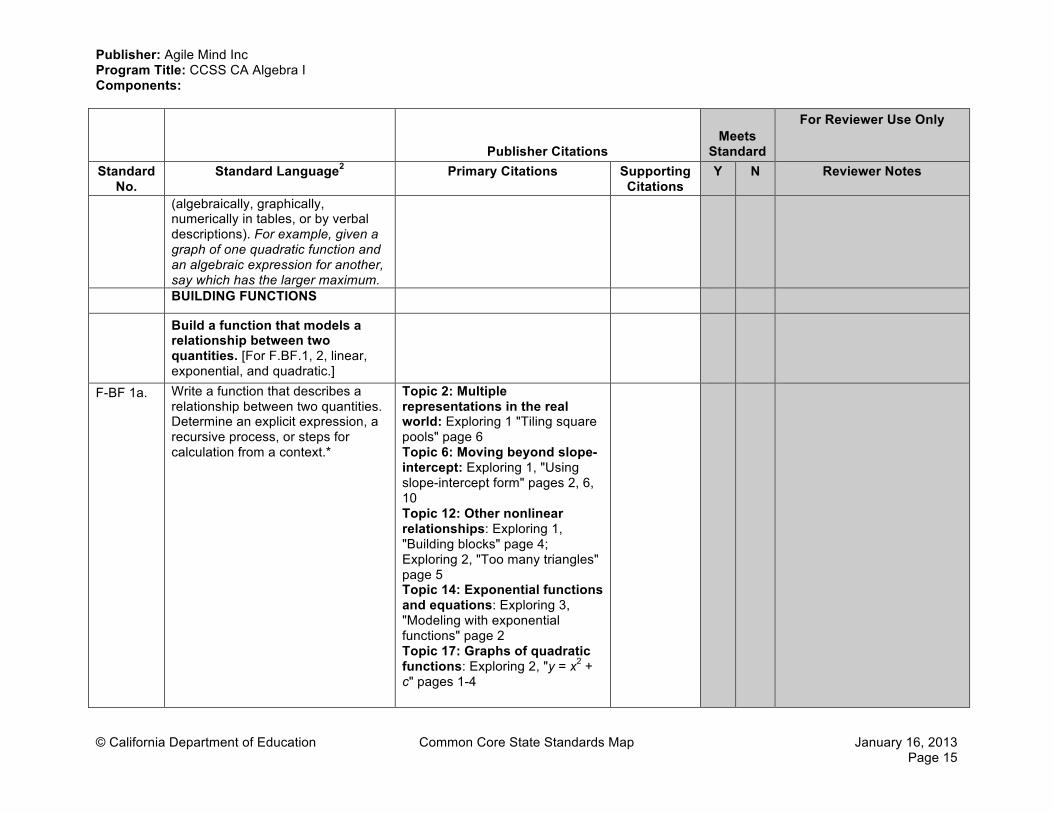
(algebraically, graphically, numerically in tables, or by verbal descriptions). For example, given a graph of one quadratic function and an algebraic expression for another, say which has the larger maximum.
BUILDING FUNCTIONS
Build a function that models a relationship between two quantities. [For F.BF.1, 2, linear, exponential, and quadratic.]
F-BF 1a. Write a function that describes a relationship between two quantities. Determine an explicit expression, a recursive process, or steps for calculation from a context.*
Topic 2: Multiple representations in the real world: Exploring 1 "Tiling square pools" page 6 Topic 6: Moving beyond slope-intercept: Exploring 1, "Using slope-intercept form" pages 2, 6, 10 Topic 12: Other nonlinear relationships: Exploring 1, "Building blocks" page 4; Exploring 2, "Too many triangles" page 5 Topic 14: Exponential functions and equations: Exploring 3, "Modeling with exponential functions" page 2 Topic 17: Graphs of quadratic functions: Exploring 2, "y = x2 + c" pages 1-4
Publisher: Agile Mind Inc Program Title: CCSS CA Algebra I Components:
© California Department of Education Common Core State Standards Map January 16, 2013 Page 16
Publisher Citations Meets
Standard
For Reviewer Use Only
Standard No.
Standard Language2 Primary Citations Supporting Citations
Y N Reviewer Notes
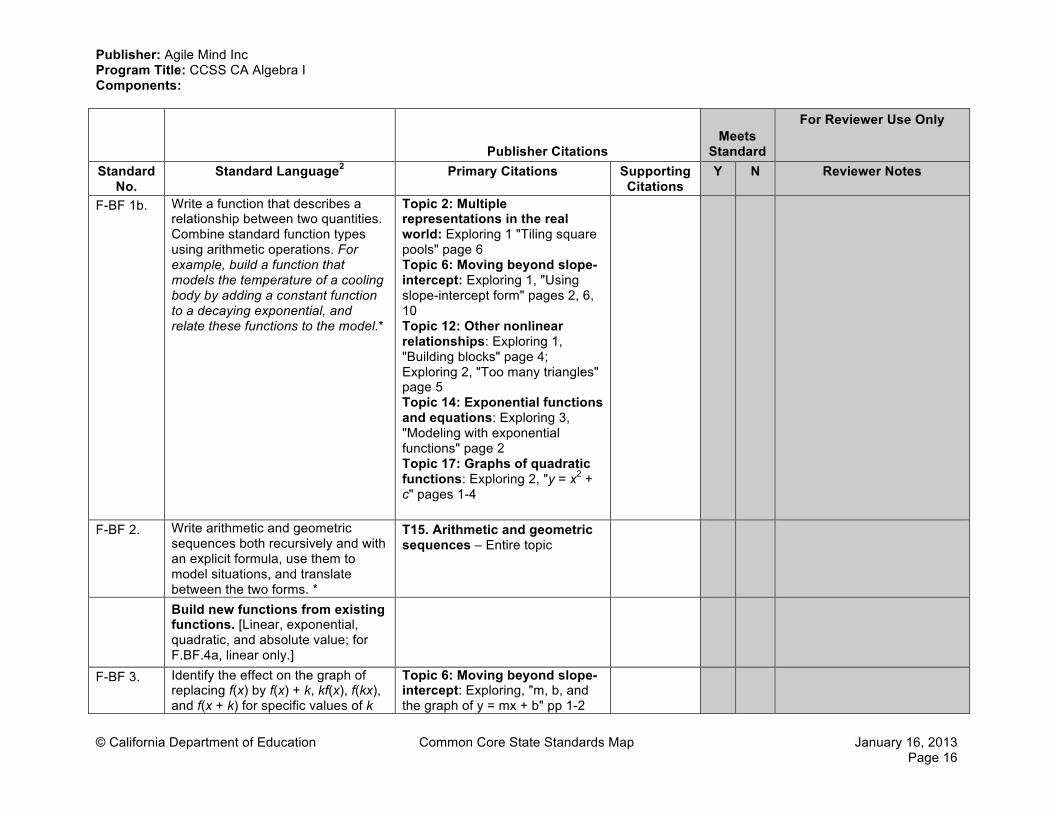
F-BF 1b. Write a function that describes a relationship between two quantities. Combine standard function types using arithmetic operations. For example, build a function that models the temperature of a cooling body by adding a constant function to a decaying exponential, and relate these functions to the model.*
Topic 2: Multiple representations in the real world: Exploring 1 "Tiling square pools" page 6 Topic 6: Moving beyond slope-intercept: Exploring 1, "Using slope-intercept form" pages 2, 6, 10 Topic 12: Other nonlinear relationships: Exploring 1, "Building blocks" page 4; Exploring 2, "Too many triangles" page 5 Topic 14: Exponential functions and equations: Exploring 3, "Modeling with exponential functions" page 2 Topic 17: Graphs of quadratic functions: Exploring 2, "y = x2 + c" pages 1-4
F-BF 2. Write arithmetic and geometric sequences both recursively and with an explicit formula, use them to model situations, and translate between the two forms. *
T15. Arithmetic and geometric sequences – Entire topic
Build new functions from existing functions. [Linear, exponential, quadratic, and absolute value; for F.BF.4a, linear only.]
F-BF 3. Identify the effect on the graph of replacing f(x) by f(x) + k, kf(x), f(kx), and f(x + k) for specific values of k
Topic 6: Moving beyond slope-intercept: Exploring, "m, b, and the graph of y = mx + b" pp 1-2
Publisher: Agile Mind Inc Program Title: CCSS CA Algebra I Components:
© California Department of Education Common Core State Standards Map January 16, 2013 Page 17
Publisher Citations Meets
Standard
For Reviewer Use Only
Standard No.
Standard Language2 Primary Citations Supporting Citations
Y N Reviewer Notes
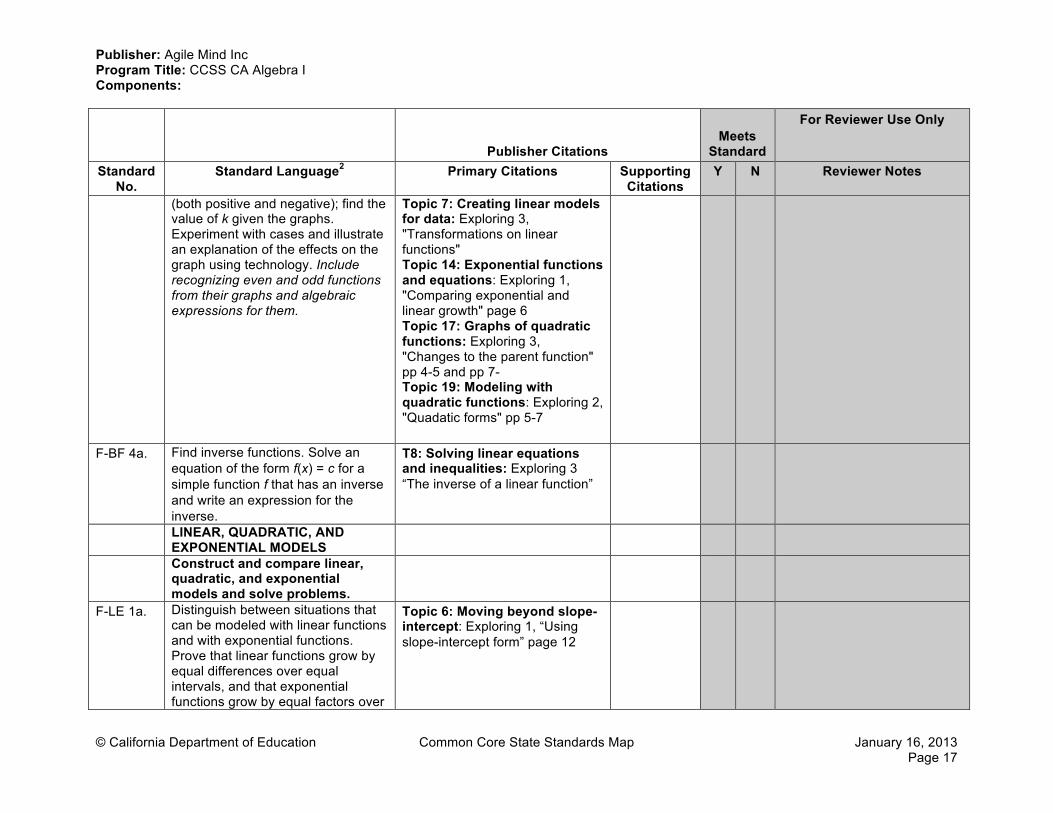
(both positive and negative); find the value of k given the graphs. Experiment with cases and illustrate an explanation of the effects on the graph using technology. Include recognizing even and odd functions from their graphs and algebraic expressions for them.
Topic 7: Creating linear models for data: Exploring 3, "Transformations on linear functions" Topic 14: Exponential functions and equations: Exploring 1, "Comparing exponential and linear growth" page 6 Topic 17: Graphs of quadratic functions: Exploring 3, "Changes to the parent function" pp 4-5 and pp 7- Topic 19: Modeling with quadratic functions: Exploring 2, "Quadatic forms" pp 5-7
F-BF 4a. Find inverse functions. Solve an equation of the form f(x) = c for a simple function f that has an inverse and write an expression for the inverse.
T8: Solving linear equations and inequalities: Exploring 3 “The inverse of a linear function”
LINEAR, QUADRATIC, AND EXPONENTIAL MODELS
Construct and compare linear, quadratic, and exponential models and solve problems.
F-LE 1a. Distinguish between situations that can be modeled with linear functions and with exponential functions. Prove that linear functions grow by equal differences over equal intervals, and that exponential functions grow by equal factors over
Topic 6: Moving beyond slope-intercept: Exploring 1, “Using slope-intercept form” page 12
Publisher: Agile Mind Inc Program Title: CCSS CA Algebra I Components:
© California Department of Education Common Core State Standards Map January 16, 2013 Page 18
Publisher Citations Meets
Standard
For Reviewer Use Only
Standard No.
Standard Language2 Primary Citations Supporting Citations
Y N Reviewer Notes
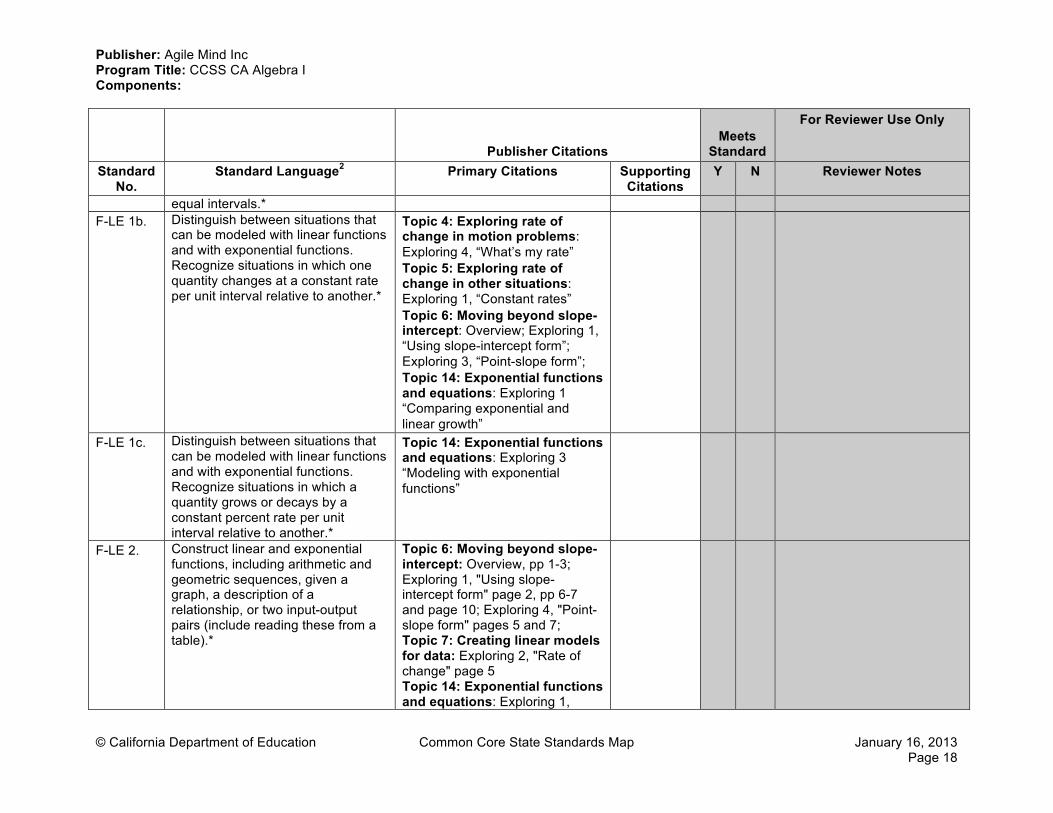
equal intervals.* F-LE 1b. Distinguish between situations that
can be modeled with linear functions and with exponential functions. Recognize situations in which one quantity changes at a constant rate per unit interval relative to another.*
Topic 4: Exploring rate of change in motion problems: Exploring 4, “What’s my rate” Topic 5: Exploring rate of change in other situations: Exploring 1, “Constant rates” Topic 6: Moving beyond slope-intercept: Overview; Exploring 1, “Using slope-intercept form”; Exploring 3, “Point-slope form”; Topic 14: Exponential functions and equations: Exploring 1 “Comparing exponential and linear growth”
F-LE 1c. Distinguish between situations that can be modeled with linear functions and with exponential functions. Recognize situations in which a quantity grows or decays by a constant percent rate per unit interval relative to another.*
Topic 14: Exponential functions and equations: Exploring 3 “Modeling with exponential functions”
F-LE 2. Construct linear and exponential functions, including arithmetic and geometric sequences, given a graph, a description of a relationship, or two input-output pairs (include reading these from a table).*
Topic 6: Moving beyond slope-intercept: Overview, pp 1-3; Exploring 1, "Using slope-intercept form" page 2, pp 6-7 and page 10; Exploring 4, "Point-slope form" pages 5 and 7; Topic 7: Creating linear models for data: Exploring 2, "Rate of change" page 5 Topic 14: Exponential functions and equations: Exploring 1,
Publisher: Agile Mind Inc Program Title: CCSS CA Algebra I Components:
© California Department of Education Common Core State Standards Map January 16, 2013 Page 19
Publisher Citations Meets
Standard
For Reviewer Use Only
Standard No.
Standard Language2 Primary Citations Supporting Citations
Y N Reviewer Notes
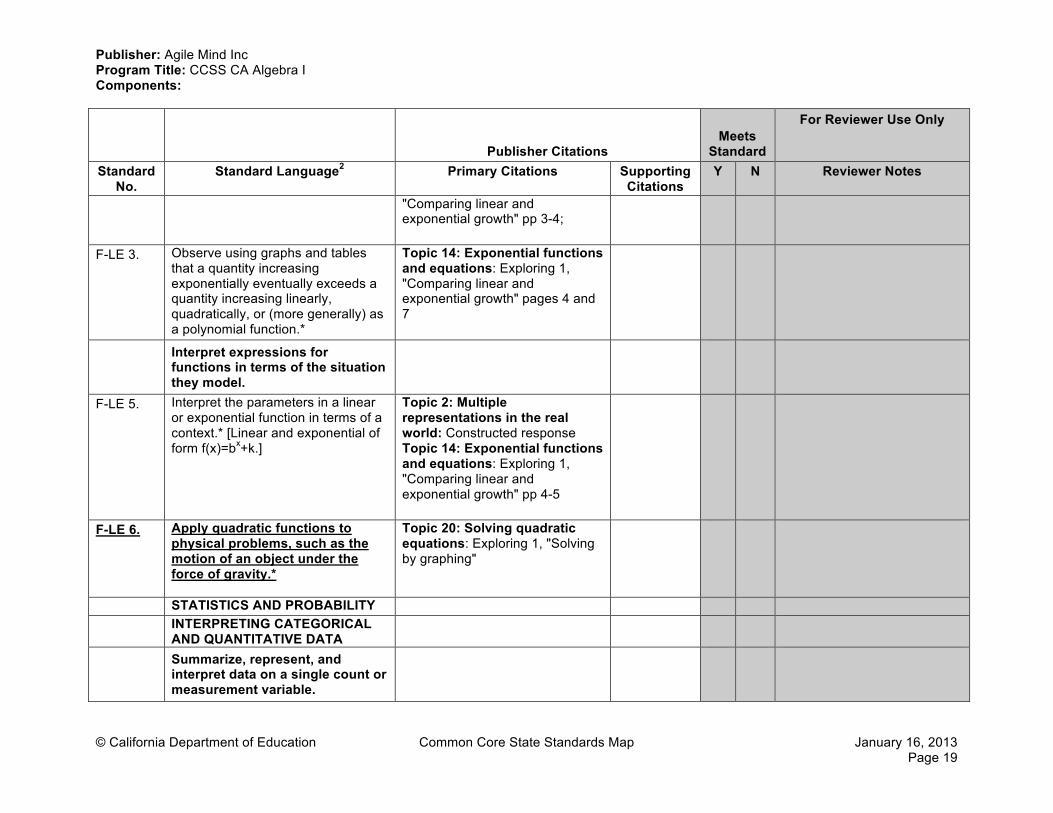
"Comparing linear and exponential growth" pp 3-4;
F-LE 3. Observe using graphs and tables that a quantity increasing exponentially eventually exceeds a quantity increasing linearly, quadratically, or (more generally) as a polynomial function.*
Topic 14: Exponential functions and equations: Exploring 1, "Comparing linear and exponential growth" pages 4 and 7
Interpret expressions for functions in terms of the situation they model.
F-LE 5. Interpret the parameters in a linear or exponential function in terms of a context.* [Linear and exponential of form f(x)=bx+k.]
Topic 2: Multiple representations in the real world: Constructed response Topic 14: Exponential functions and equations: Exploring 1, "Comparing linear and exponential growth" pp 4-5
F-LE 6. Apply quadratic functions to physical problems, such as the motion of an object under the force of gravity.*
Topic 20: Solving quadratic equations: Exploring 1, "Solving by graphing"
STATISTICS AND PROBABILITY INTERPRETING CATEGORICAL
AND QUANTITATIVE DATA
Summarize, represent, and interpret data on a single count or measurement variable.
Publisher: Agile Mind Inc Program Title: CCSS CA Algebra I Components:
© California Department of Education Common Core State Standards Map January 16, 2013 Page 20
Publisher Citations Meets
Standard
For Reviewer Use Only
Standard No.
Standard Language2 Primary Citations Supporting Citations
Y N Reviewer Notes
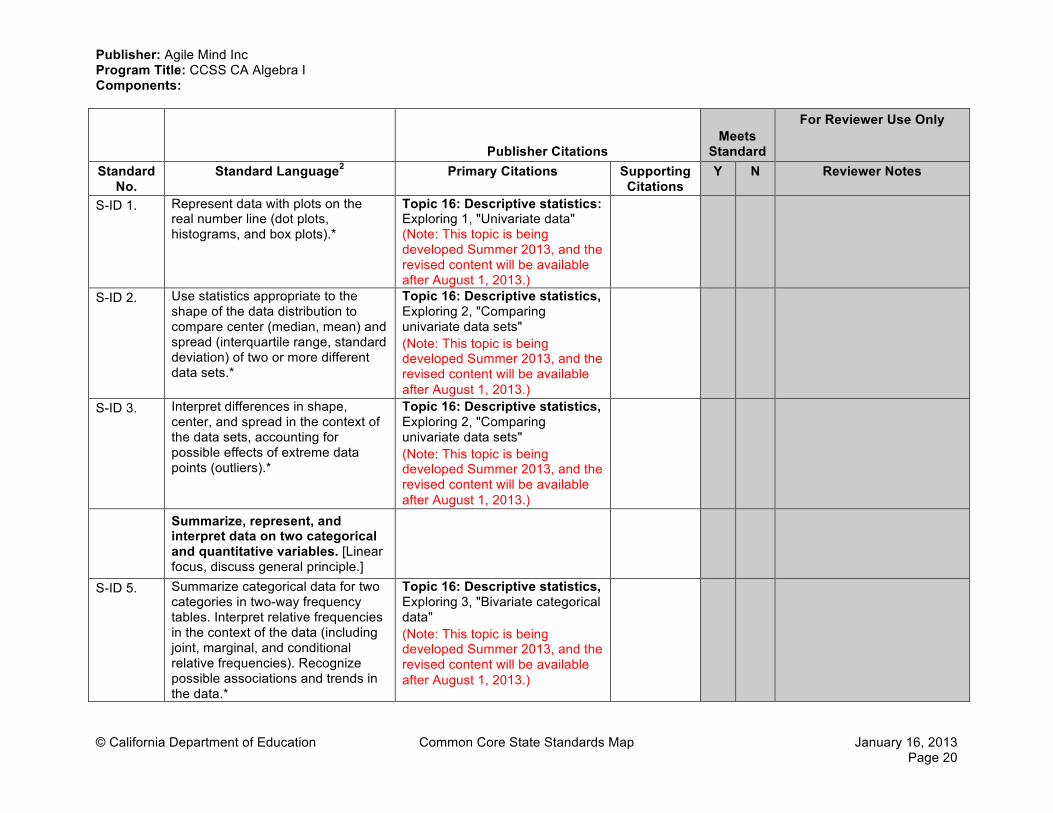
S-ID 1. Represent data with plots on the real number line (dot plots, histograms, and box plots).*
Topic 16: Descriptive statistics: Exploring 1, "Univariate data" (Note: This topic is being developed Summer 2013, and the revised content will be available after August 1, 2013.)
S-ID 2. Use statistics appropriate to the shape of the data distribution to compare center (median, mean) and spread (interquartile range, standard deviation) of two or more different data sets.*
Topic 16: Descriptive statistics, Exploring 2, "Comparing univariate data sets" (Note: This topic is being developed Summer 2013, and the revised content will be available after August 1, 2013.)
S-ID 3. Interpret differences in shape, center, and spread in the context of the data sets, accounting for possible effects of extreme data points (outliers).*
Topic 16: Descriptive statistics, Exploring 2, "Comparing univariate data sets" (Note: This topic is being developed Summer 2013, and the revised content will be available after August 1, 2013.)
Summarize, represent, and interpret data on two categorical and quantitative variables. [Linear focus, discuss general principle.]
S-ID 5. Summarize categorical data for two categories in two-way frequency tables. Interpret relative frequencies in the context of the data (including joint, marginal, and conditional relative frequencies). Recognize possible associations and trends in the data.*
Topic 16: Descriptive statistics, Exploring 3, "Bivariate categorical data" (Note: This topic is being developed Summer 2013, and the revised content will be available after August 1, 2013.)
Publisher: Agile Mind Inc Program Title: CCSS CA Algebra I Components:
© California Department of Education Common Core State Standards Map January 16, 2013 Page 21
Publisher Citations Meets
Standard
For Reviewer Use Only
Standard No.
Standard Language2 Primary Citations Supporting Citations
Y N Reviewer Notes
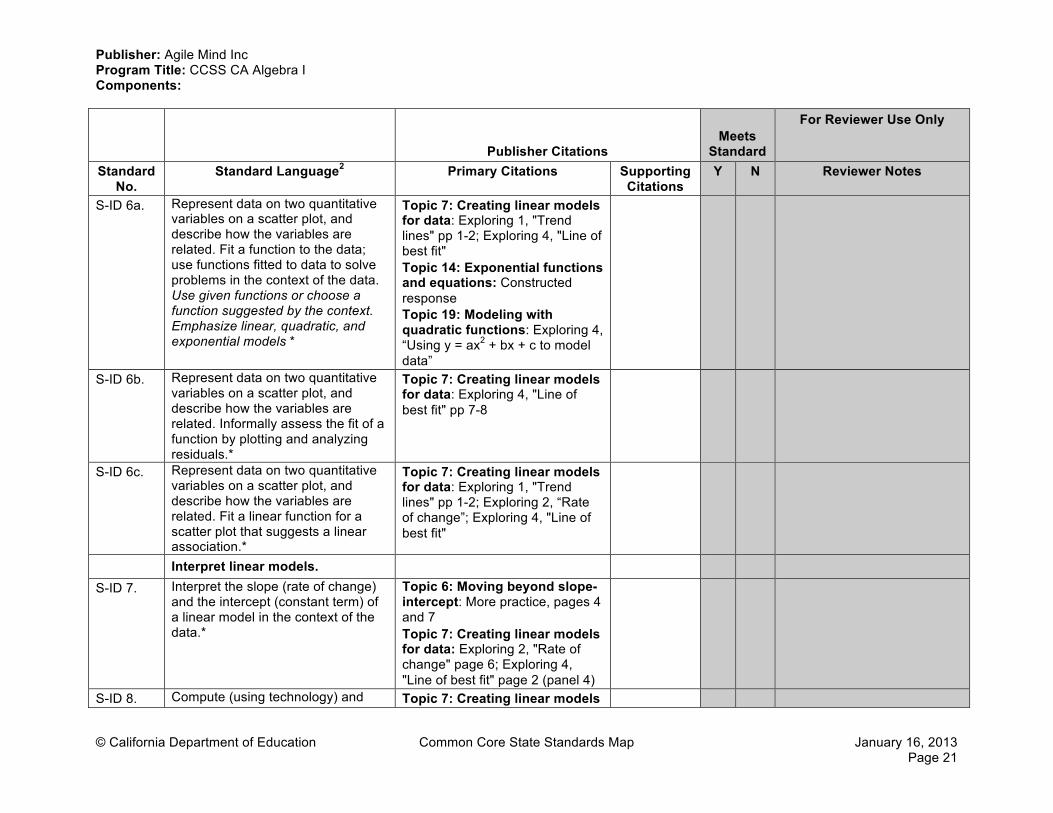
S-ID 6a. Represent data on two quantitative variables on a scatter plot, and describe how the variables are related. Fit a function to the data; use functions fitted to data to solve problems in the context of the data. Use given functions or choose a function suggested by the context. Emphasize linear, quadratic, and exponential models *
Topic 7: Creating linear models for data: Exploring 1, "Trend lines" pp 1-2; Exploring 4, "Line of best fit" Topic 14: Exponential functions and equations: Constructed response Topic 19: Modeling with quadratic functions: Exploring 4, “Using y = ax2 + bx + c to model data”
S-ID 6b. Represent data on two quantitative variables on a scatter plot, and describe how the variables are related. Informally assess the fit of a function by plotting and analyzing residuals.*
Topic 7: Creating linear models for data: Exploring 4, "Line of best fit" pp 7-8
S-ID 6c. Represent data on two quantitative variables on a scatter plot, and describe how the variables are related. Fit a linear function for a scatter plot that suggests a linear association.*
Topic 7: Creating linear models for data: Exploring 1, "Trend lines" pp 1-2; Exploring 2, “Rate of change”; Exploring 4, "Line of best fit"
Interpret linear models.
S-ID 7. Interpret the slope (rate of change) and the intercept (constant term) of a linear model in the context of the data.*
Topic 6: Moving beyond slope-intercept: More practice, pages 4 and 7 Topic 7: Creating linear models for data: Exploring 2, "Rate of change" page 6; Exploring 4, "Line of best fit" page 2 (panel 4)
S-ID 8. Compute (using technology) and Topic 7: Creating linear models
Publisher: Agile Mind Inc Program Title: CCSS CA Algebra I Components:
© California Department of Education Common Core State Standards Map January 16, 2013 Page 22
Publisher Citations Meets
Standard
For Reviewer Use Only
Standard No.
Standard Language2 Primary Citations Supporting Citations
Y N Reviewer Notes
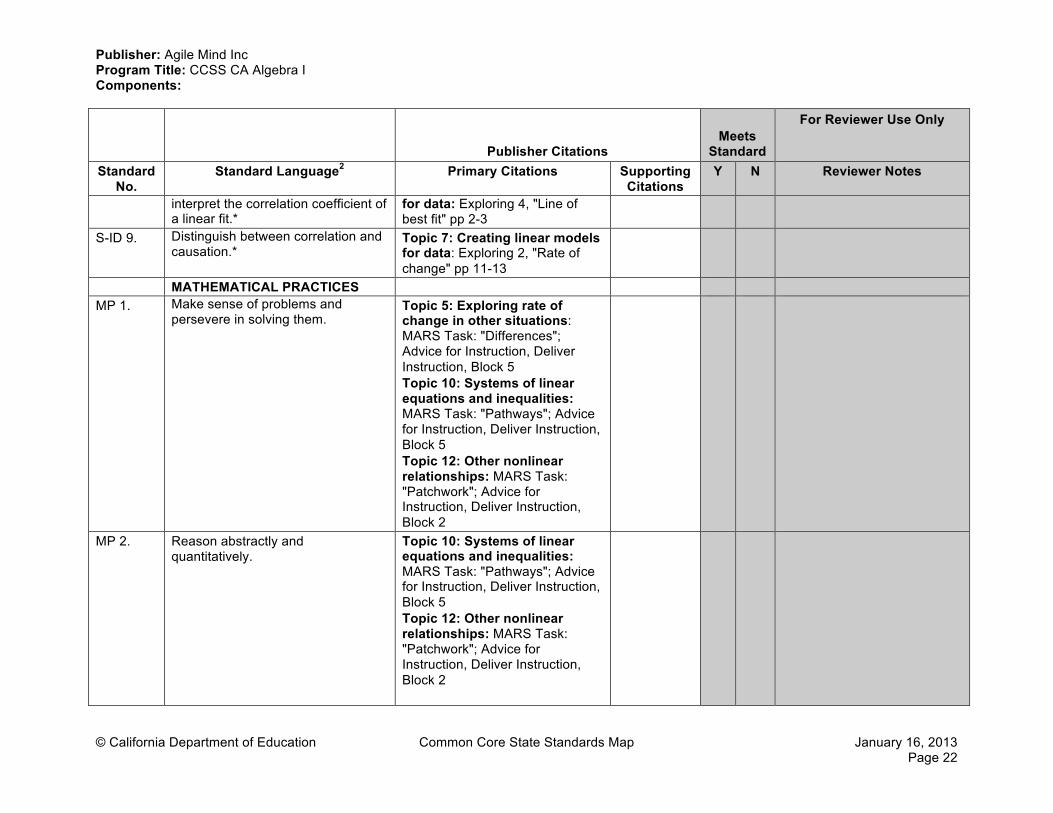
interpret the correlation coefficient of a linear fit.*
for data: Exploring 4, "Line of best fit" pp 2-3
S-ID 9. Distinguish between correlation and causation.*
Topic 7: Creating linear models for data: Exploring 2, "Rate of change" pp 11-13
MATHEMATICAL PRACTICES MP 1. Make sense of problems and
persevere in solving them. Topic 5: Exploring rate of change in other situations: MARS Task: "Differences"; Advice for Instruction, Deliver Instruction, Block 5 Topic 10: Systems of linear equations and inequalities: MARS Task: "Pathways"; Advice for Instruction, Deliver Instruction, Block 5 Topic 12: Other nonlinear relationships: MARS Task: "Patchwork"; Advice for Instruction, Deliver Instruction, Block 2
MP 2. Reason abstractly and quantitatively.
Topic 10: Systems of linear equations and inequalities: MARS Task: "Pathways"; Advice for Instruction, Deliver Instruction, Block 5 Topic 12: Other nonlinear relationships: MARS Task: "Patchwork"; Advice for Instruction, Deliver Instruction, Block 2
Publisher: Agile Mind Inc Program Title: CCSS CA Algebra I Components:
© California Department of Education Common Core State Standards Map January 16, 2013 Page 23
Publisher Citations Meets
Standard
For Reviewer Use Only
Standard No.
Standard Language2 Primary Citations Supporting Citations
Y N Reviewer Notes
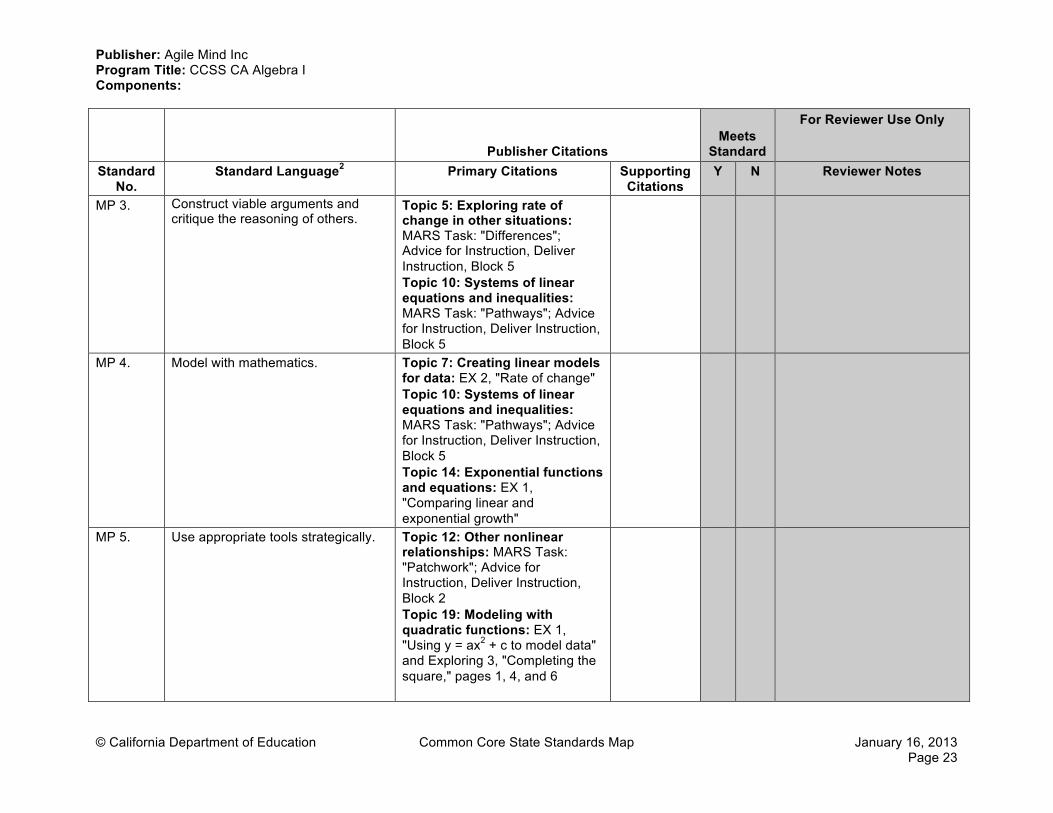
MP 3. Construct viable arguments and critique the reasoning of others.
Topic 5: Exploring rate of change in other situations: MARS Task: "Differences"; Advice for Instruction, Deliver Instruction, Block 5 Topic 10: Systems of linear equations and inequalities: MARS Task: "Pathways"; Advice for Instruction, Deliver Instruction, Block 5
MP 4. Model with mathematics. Topic 7: Creating linear models for data: EX 2, "Rate of change" Topic 10: Systems of linear equations and inequalities: MARS Task: "Pathways"; Advice for Instruction, Deliver Instruction, Block 5 Topic 14: Exponential functions and equations: EX 1, "Comparing linear and exponential growth"
MP 5. Use appropriate tools strategically. Topic 12: Other nonlinear relationships: MARS Task: "Patchwork"; Advice for Instruction, Deliver Instruction, Block 2 Topic 19: Modeling with quadratic functions: EX 1, "Using y = ax2 + c to model data" and Exploring 3, "Completing the square," pages 1, 4, and 6
Publisher: Agile Mind Inc Program Title: CCSS CA Algebra I Components:
© California Department of Education Common Core State Standards Map January 16, 2013 Page 24
Publisher Citations Meets
Standard
For Reviewer Use Only
Standard No.
Standard Language2 Primary Citations Supporting Citations
Y N Reviewer Notes
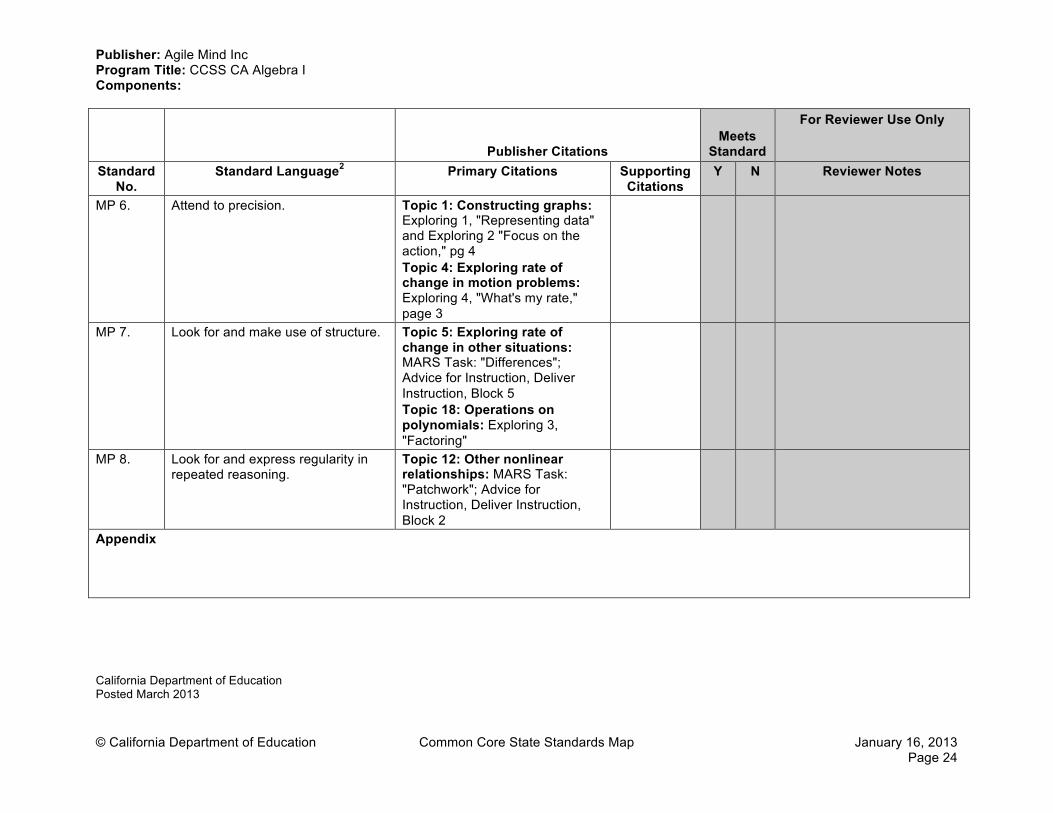
MP 6. Attend to precision. Topic 1: Constructing graphs: Exploring 1, "Representing data" and Exploring 2 "Focus on the action," pg 4 Topic 4: Exploring rate of change in motion problems: Exploring 4, "What's my rate," page 3
MP 7. Look for and make use of structure. Topic 5: Exploring rate of change in other situations: MARS Task: "Differences"; Advice for Instruction, Deliver Instruction, Block 5 Topic 18: Operations on polynomials: Exploring 3, "Factoring"
MP 8. Look for and express regularity in repeated reasoning.
Topic 12: Other nonlinear relationships: MARS Task: "Patchwork"; Advice for Instruction, Deliver Instruction, Block 2
Appendix California Department of Education Posted March 2013