committee for water resources undp project national plan ... · national plan for integrated water...
TRANSCRIPT

Committee for Water Resources Ministry of Agriculture of the Republic of Kazakhstan
UNDP Project
National Plan for Integrated Water Resources Management and Water Efficiency in Kazakhstan
REPoRt
ACCEss to DRINKINg WAtER AND sANItAtIoN IN thE REPUblIC of
KAzAKhstAN
January 2006

�
ForewordSupplying population of the Republic of Kazakhstan with adequate quality drinking water is one of the priority directions of the social-economic development of the country. For Kazakhstan the Millennium Development Goals are the long-term goals, which are closely related to the National Development Strategy “Kazakhstan-2030”. The problem of supply of population with drinking water is reflected in such national documents as the Conception of the Water Economic and Political Sector Development of the Republic of Kazakhstan until 2010, the Strategy for Industrial and Innovation Development of the Republic of Kazakhstan for 2003-2015, as well as the Water Code of the Republic of Kazakhstan.
Kazakhstan carries out a systematic work on water supply and sanitation in the framework of the sectoral Program “Drinking water” and the National Program on Development of Rural Territories. Under these programs the construction and reconstruction of the water supply systems in urban and rural areas is carried out. For the next 10 years of the program implementation 115 billion tenge are planned to be allocated from the republican budget. At the same time the factors inhibitory to stable and successful programme implementation are the following: a high level of deterioration of water supply networks and units, insufficient development and equipment of the water pipes traffic departments, as well as insufficiency in reliable official data on the accessibility of drinking water to population of Kazakhstan.
Together with all UN member countries, Kazakhstan signed the declaration on achieving the Millennium Development Goals (2000), thus committing itself in the area of water supply to reduce by half the proportion of people without sustainable access to safe drinking water by 2015. Based on the international commitments taken and the main seven priorities defined in the Program “Drinking water”, Committee of Water Resources with the support from UNDP within the framework of the Project “National Integrated Water Resources Management and Water Efficiency Plan for Kazakhstan” has started the development of the Strategy on achieving MDG on water supply and sanitation in the Republic of Kazakhstan. The present report is the first important step in the development of the Strategy. The report contains detailed information on access of population of Kazakhstan to the drinking water and sanitation by region and city.
To get more objective information there were two approaches used in the survey on access to drinking water: technical and sociological. Technical survey was conducted in 260 urban and 7440 rural settlements. Sociological survey consisted of 7515 questionnaires, 240 interviews and 16 focus-groups with water users. The survey has been carried out by the leading water supply and sanitation specialists of Kazakhstan and by the specialists of involved organizations.
In the current report the independent experts presented their assessment of the water supply and sanitation in Kazakhstan. This assessment includes a description of a methodology, according to which conclusions were made. The report also presents detailed information by cities and rural settlements, which helps the specialists to see a real picture and forecast the development in each specific settlement.
The rapid economic growth of Kazakhstan for the first 10 years of political and economic reforms makes possible the successful implementation of the MDG in Kazakhstan. The year 2015 specified in Millennium Declaration as indicative appears to be a good benchmark for evaluating medium results of the on-going implementation of the national strategy “Kazakhstan-2030”. In support of the point the President of the Republic of Kazakhstan during the second Civil Forum on September 19, 2005 stated that “by the beginning of the second decade we should resolve the issue of drinking water accessibility… There will not be a single settlement, which will use water from open water sources or which will not comply the standards”.
Anatoliy Dmitrievich RYABTSEV
The Chairman of the Committee for Water Resources under the Ministry of Agriculture of the Republic of Kazakhstan
�
Table of Contents 1 Introduction . . . . . . . . . . . . . . . . . . . . . . . . . . . . . . . . . . . . . . . . . . . . . . . . . . . . . . . . . . . . . . . . . . . . . . . . . . . . . . . . . . . . . . . . . . . . . . . . 5
1 .1 . Millennium Development Goals (MDG) in a Nutshell . . . . . . . . . . . . . . . . . . . . . . . . . . . . . . . . . . . . . . . . . . . . . . . . . . . . 5
1 .� . MDGs in the Republic of Kazakhstan in the Context in Water Supply and Sanitation . . . . . . . . . . . . . . . . . . . . 6
1 .� . The Structure of the Report . . . . . . . . . . . . . . . . . . . . . . . . . . . . . . . . . . . . . . . . . . . . . . . . . . . . . . . . . . . . . . . . . . . . . . . . . . . 8
1 .4 . Technical and Social Surveys on Evaluation of the Access Level to Water and Sanitation in the Republic of Kazakhstan . . . . . . . . . . . . . . . . . . . . . . . . . . . . . . . . . . . . . . . . . . . . . . . . . . . . . . . . . . . . . . . . . . . . . . . . . 9
� The Current State of Water Supply and Sanitation in Kazakhstan . . . . . . . . . . . . . . . . . . . . . . . . . . . . . . . . . . . . . . . . . .�1
� The Current State of the Urban Water Supply and Sanitation in Kazakhstan by Technical Survey Findings . .��
4 The Current State of Rural Water Supply and Sanitation in Kazakhstan by Technical Survey Findings . . . . . . .��
5 Findings of Social Survey on Evaluation of the Constant Access of the Population of the Republic of Kazakhstan to Drinking Water and Sanitation . . . . . . . . . . . . . . . . . . . . . . . . . . . . . . . . . . . . . . . . . . . . . . . . . . . . . . . . . . .51
5 .1 . Socio-economic and Demographic Data . . . . . . . . . . . . . . . . . . . . . . . . . . . . . . . . . . . . . . . . . . . . . . . . . . . . . . . . . . . . . .51
5 .� . The Current Situation of Water Supply and Sanitation in Kazakhstan by Findings of Social Survey . . . . .5�
5 .� .1 The Coverage of Kazakhstan’s Population by Central Water Supply . . . . . . . . . . . . . . . . . . . . . . . . . . . . . .5�
5 .� .� The Level of Coverage of Kazakhstan’s Population by Decentralized Water Supply Sources . . . . . .54
5 .� .� The Sustainability of Water Supply Systems in Kazakhstan . . . . . . . . . . . . . . . . . . . . . . . . . . . . . . . . . . . . . .56
5 .� .4 Opinion of Kazakhstan’s Residents on the Quality of Drinking Water . . . . . . . . . . . . . . . . . . . . . . . . . . . .59
5 .� .5 Human Health Issues in Kazakhstan . . . . . . . . . . . . . . . . . . . . . . . . . . . . . . . . . . . . . . . . . . . . . . . . . . . . . . . . . . . .6�
5 .� .6 The Intention and Capacity for Connection to Central Water Supply and Service Fees . . . . . . . . . . .65
5 .� .7 Sanitary Conditions in Kazakhstan . . . . . . . . . . . . . . . . . . . . . . . . . . . . . . . . . . . . . . . . . . . . . . . . . . . . . . . . . . . . . .70
5 .� .8 Public Participation in Water Resource Management . . . . . . . . . . . . . . . . . . . . . . . . . . . . . . . . . . . . . . . . . . .7�
5 .� . An Estimation of Safe Access to Drinking Water . . . . . . . . . . . . . . . . . . . . . . . . . . . . . . . . . . . . . . . . . . . . . . . . . . . . . .7�
6 Canclusions and Recommendations . . . . . . . . . . . . . . . . . . . . . . . . . . . . . . . . . . . . . . . . . . . . . . . . . . . . . . . . . . . . . . . . . . . . . . .75
6 .1 . Urban Water Supply . . . . . . . . . . . . . . . . . . . . . . . . . . . . . . . . . . . . . . . . . . . . . . . . . . . . . . . . . . . . . . . . . . . . . . . . . . . . . . . . . .75
6 .� . Rural Water Supply . . . . . . . . . . . . . . . . . . . . . . . . . . . . . . . . . . . . . . . . . . . . . . . . . . . . . . . . . . . . . . . . . . . . . . . . . . . . . . . . . .77
6 .� . Social Survey . . . . . . . . . . . . . . . . . . . . . . . . . . . . . . . . . . . . . . . . . . . . . . . . . . . . . . . . . . . . . . . . . . . . . . . . . . . . . . . . . . . . . . . .78
Footnotes . . . . . . . . . . . . . . . . . . . . . . . . . . . . . . . . . . . . . . . . . . . . . . . . . . . . . . . . . . . . . . . . . . . . . . . . . . . . . . . . . . . . . . . . . . . . . . . .79
Reference literature and other materials used . . . . . . . . . . . . . . . . . . . . . . . . . . . . . . . . . . . . . . . . . . . . . . . . . . . . . . . . . . . . . . . . . .80
Annex I Access of the Urban Population to Water and Sanitation in Kazakhstan: Results of Technical Survey . . .81
Annex II Access to Water and Sanitation in Rural Areas of Kazakhstan: Results of Technical Survey . . . . . . . . . . 1�5

4
List of Acronyms RBO River Basin Organization
CEECCA Countries of Eastern Europe, Caucasus, and Central-Asian Republics
WSF Water and Sewage Facility
WHO World Health Organization
CWS Central Water Supply
GWP Global Water Partnership
IWRM Integrated Water Resources Management
CWR Committee for Water Resources
MA Ministry of Agriculture
UN United Nations
UTS Urban-type Settlement
UNDP United Nations Development Program
NSOE National State-Owned Enterprise
RK Republic of Kazakhstan
CIS Commonwealth of Independent States
SNiP Construction Rules and Norms
RS Rural Settlement
JMP Joint Monitoring Program
CSS Central Sewage System
FS Feasibility Study
MDG Millennium Development Goals
WPF Water-pipe pumping facility
SPF Sewerage pumping facility
RSE Republican state enterprise

5
The major goal of the Millennium Declaration is to create favorable conditions for the liquidation of poverty and achieve sustainable development both at national and global levels.
POVERTY, HUNGER, THE LACK OF CLEAN DRINKING WATER, ILLITERACY, DISEASES, THE SPREAD OF HIV-AIDS, CLIMATE CHANGE…
The era of rapid globalization made these issues not only the problems of specific countries, but a challenge for all of humanity.
1.1. Millennium Development Goals (MDG) in a Nutshell
On the threshold of a new millennium, 147 heads of state and government gathered at the UN General Assembly session to develop a combined approach and strategy to resolve common tasks . Today this summit is the largest forum in history in terms of the number of participating heads of states . The summit adopted the Millennium Declaration, which had already been signed by 191 countries, including Kazakhstan .
Based upon the resolutions of world summits and international conferences of the 1990s, the Millennium Declaration expresses a common vision and the concordance of the international community with an action plan for the new millennium .
The Millennium Declaration consists of a set of key development measures that pave the way to a world without poverty and poverty-caused deprivation: Goal 1 – eradicate extreme poverty and hunger; Goal � – achieve universal primary education; Goal � – promote gender equality and empower women; Goal 4 – reduce child mortality; Goal 5 – improve maternal health; Goal 6 – combat HIV/AIDS, malaria, and other diseases; Goal 7 – ensure environmental sustainability .
This set of goals is known as the UN Millennium Development Goals (MDGs) . It is important that the criteria for performance assessment be set: 11 related tasks to be completed by a specific period of time (�015) and �1 indicators .
To implement the goals set, there is a need to regularly monitor their performance and assess achievements, trends, and gaps .
MDGs have already been adopted by a number of governments and are becoming a part of the national development strategies . In becoming national tasks, MDGs facilitate a large degree of concurrence and better coordination of national efforts .
At the global level, the UN Secretary General submits an annual report on MDGs’ international performance . The national reports provide a review of what has been performed by a specific country towards achieving MDGs, as well as problems that the country faces .
1INTroDuCTIoN

UNDP ProjectNational Plan for Integrated Water Resources Management and Water Efficiency in Kazakhstan
ACCEss to DRINKINg WAtER AND sANItAtIoN IN thE REPUblIC of KAzAKhstAN
6
1.2. MDGs in the republic of Kazakhstan in the Context of Water Supply and Sanitation
The UN Millennium Declaration (�000) outlined the general vision and concordance of the international community on an action plan for relieving the world from poverty and poverty-related destitution . Together with all UN member countries, Kazakhstan signed the declaration on achieving the MDGs, thus committing itself to the fulfillment of this declaration .
MDGs were adopted to reduce the inadmissible poverty level in the world . The issue of water supply is assumed in all seven millennium development goals and eleven objectives, which makes it an inalienable part of each goal’s achievement .
Kazakhstan’s commitment in the field of water supply is defined by Goal 7: “To guarantee environmental sustainability”, more specifically, by Objective 10: “Reduce by half the proportion of people without sustainable access to safe drinking water” and Objective 9: “Incorporate the sustainable development principles into the national strategies and programs and reverse the loss of natural resources .”
MDGs define crucial tasks of humanity in the area of development . The strict wording of the goals and tasks and their concrete number for a predetermined period help to focus national and international priorities and enable communication on the issues of human development .
The year 1990 has served as a base point for MDGs . It is planned that the goals will be attained by �015 . For Kazakhstan and other countries that rose after the collapse of the Soviet Union, the year 1990 taken as a base point creates difficulties not applicable to other countries, as the change of political regime caused a number of state institutes to be abolished and completely new institutions to rise . Nevertheless, the rapid economic growth of Kazakhstan and the development of the national potential of political and economic reforms in the first ten years made it possible for the country to succeed in achieving MDGs .
For Kazakhstan, MDGs are long-term goals closely related to the national development strategy Kazakhstan-�0�0 . Therefore, the year �015 is a convenient point for summing up achievements, being half-way from the implementation of the national strategy Kazakhstan-�0�0 .
Over the past two decades, the world’s concern over the planet’s water resources has been growing . Since the world’s population continues to increase amid developing industrialization, water demand is also on the rise . Despite limited fresh water reserves, rivers and other water objects are being widely and unmanageably polluted . As a result, water resources are becoming more expensive, unfit, or even hazardous to use .
For Kazakhstan as well as for many Central Asian countries, water resources are the major factor that defines sustainable socio-economic development . Surface water resources across the country are unevenly distributed and are characterized by perennial and annual dynamics .
Due to the climatic peculiarities of the country, nearly all surface water sources emerge in the winter period . The reserves of the country’s surface resources add up to 5�9 km� a year on average . This includes 190 km� of lake surface waters; river and reservoir water resources amount to 100 .5� and 95 .5 km� accordingly, secular glacier volume to 95 km�, and underground waters to 58 km� .
Together with all UN member countries, Kazakhstan signed the UN Millennium Declaration in 2000
The country’s surface water storage amounts to 539 km3 a year on average, including 190 km3 of water in lakes; river and reservoirs storage add up to 100.5 and 95.5 km3 accordingly, secular glacier volume to 95 km3, and underground waters to 58 km3.

7
INTRODUCTION
Kazakhstan has a considerable number of underground water storage spaces, which are the least pollution prone, but their extremely uneven distribution across the country and heterogeneous quality do not allow for their full utilization in economic operations . As a result, of the forecasted and proven underground water storage totals above, the approved reserves on 1 January �00� amounted to only 16 .04 km� .
Potentially recyclable water composed of collection and drainage, discharge, irrigation waste waters, water from industrial operations, and households is seen as an additional resource that can be utilized . With the increase in water consumption and contemporary low technological production level, the volume of such resources tends to grow annually by �%-5% . It is further estimated that as water systems are modernized and full-circulation and water-saving technologies introduced, the volume of such waters would drop . Today return waters in the country amount to only 9 .0 km�/year; only � .0 km� are returned to water sources, and the rest are dispersed across the area, lost, used for pasture irrigation, or for ecosystems maintenance . The major part of return waters flows into the basins of the rivers Syrdariya (47%) and Irtysh (�4%), while the remaining volume empties into the rivers of Ili and Nura (19%) .
With regard to the level of water supply, Kazakhstan takes the last place among CIS countries, with the specific level of water supply amounting to �7,000 m� per 1 km� or 6,000 m� per person per year . The average perennial river flow (general surface water resources) amounts to 100 .5 km�, of which 56 .5 km� are generated domestically . The total volume of water flows from the neighboring countries amount to 44 .0 km�, including 18 .9 km� from China, 14 .6 km� from Uzbekistan, 7 .5 km� from Russia, and � .0 km� from Kyrgyzstan . The flows of most large rivers are generated outside the country, thus making Kazakhstan economically dependant on neighboring countries .
The aggregate volume of available water resources that can be economically utilized does not exceed 4� km� a year on average, as a considerable volume of water (57 .5 km�) is employed to satisfy environmental, fishery, transportation, and energy needs, or it is filtered or in other ways lost . In average-flow and low-flow years volume of awailable water resources decreases to �� km� and �5 km� accordingly . Due to an uneven flow from year to year, the country’s available water resources vary from �5 km� to 4� km� . The correlation of water resources in different years and Kazakhstani economic demand have evinced the countrywide and region-wide water deficit .
The deficit of water resources, which is aggravated by their irrational use and pollution, contributes to environmental degradation, the desiccation of lake and river ecosystems, and the growing morbidity rate of the population . The limited water resource storage restrains the utilization of available lands for agricultural production and potential land reclamation in the south of the country .
Between 1995 and �004, the annual water consumption of economic sectors of Kazakhstan varied from �0 km� to �9 km�, subject to natural and climatic conditions, economic conditions, as well as underway organizational and structural transformations . At the same time, economic sectors receive 85% of water primarily from surface water sources, while the remaining part comes from underground, sea, and waste waters .
As regards the supply of quality drinking water and sanitation to the population, Kazakhstan has the following problems:
∆ The functions of the supply of drinking water to the population by distribution networks of cities and other settlements are performed by local executive bodies, but not a single central public body is in charge;
∆ There are insufficient investments in the water and sewerage sector;
As regards the level of water supply, Kazakhstan takes the last place among CIS countries, with the specific level of water supply amounting to 37,000 m3 per 1 km2 or 6,000 m3 per person per year.
The deficit in water resources aggravated by their irrational use and pollution contributes to the environmental degradation, desiccation of lake and river ecosystems, and the growing morbidity rate of the population.
UNDP ProjectNational Plan for Integrated Water Resources Management and Water Efficiency in Kazakhstan
ACCEss to DRINKINg WAtER AND sANItAtIoN IN thE REPUblIC of KAzAKhstAN
8
∆ There is poor control over the quality of drinking water in rural settlements due to SES laboratories’ poor equipment for the control of the quality of drinking water .
The UN MDR in Kazakhstan (�00�) assesses the likelihood of achieving Objective 10 on water supply and sanitation by �015 as ‘probable’ . As a consequence, with effective international support, Kazakhstan should be able to attain the goal on water supply and sanitation, and this will considerably facilitate the achievement of other MDGs .
The sectoral program Drinking Waters for �00�-�010 outlined seven major priorities which underlay the strategy of achieving the MDG on water supply and sanitation, to be developed by CWR with the support of the UNDP project . Other major documents relevant to the issue include Strategy Kazakhstan-�0�0, The Concept of the Development of the Water Sector and Water Policy of the Republic of Kazakhstan by the year �010, the Strategy for the Industrial and Innovation Development of the Republic of Kazakhstan for �00�-�015, and the Water Code of the Republic of Kazakhstan (�00�) .
1.3. The Structure of the report The report consists of an introduction that provides general information on MDGs and activities on their attainment in the Republic of Kazakhstan in the area of water supply and sanitation . Various standards on criteria for the access to drinking water and sanitation are compared, and the criteria for water and sanitation access are defined for the Republic of Kazakhstan .
The second chapter gives general information on drinking water and the sanitation access of the population across Kazakhstan, while the third and fourth chapters focus on the same issues in the cities and rural settlements of Kazakhstan .
The fifth chapter represents the results of social surveys on identifying safe access to drinking water and sanitation for the people of Kazakhstan .
The appendix includes tables that accompany technical and social surveys on evaluation of the current water and sanitation access levels of all rural settlements (RS), cities, towns, and urban-type settlements (UTS) in Kazakhstan .
Goal 7, Objective 10: “To halve the number of people that have no access to clean drinking water and sanitation, by 2015”

9
INTRODUCTION
1.4.1 Comparison of Different Standards of Water and Sanitation Access Criteria
Due to a controversy over the lack of data on the population’s access to clean drinking water in the country, the year �000 instead of 1999 was selected as the base point upon which such indicators were fixed (the share of the urban population without uninterrupted access to clean drinking water came to 15%, and that of the rural population to �7%) . However, due to deficient records in Kazakhstan, it is still difficult to determine the share of the population with sustainable access to safe drinking water .
Therefore, one of the primary goals of the UNDP project in the context of the development of the Strategy to achieve the MDG on access to drinking water and sanitation in Kazakhstan is to better define ‘the permanent access of the Kazakhstani population to clean (safe) drinking water’ and its relation to international definitions .
The �00� UN MDR on Kazakhstan provides the following criteria for the population’s safe access to clean drinking water:
1 . Clean drinking water is water that does not cause an acute sickness immediately after its use; it is water it conforms to major bacteriological and chemical requirements . Both treated and untreated water can be regarded as safe drinking water if they originated from uncontaminated sources such as springs, wells, and protected drilled boreholes .
� . If the water source is located within the radius of one kilometer from a given water user’s house and can supply at least �0 liters of water per person per day, then such a source can be called ‘reliable’ . Reliable water sources include the water pipe, common standpipe, drilled borehole, closed well, and protected spring .
� . Neither canned nor bottled water is considered a ‘reliable source’ but this is not because of the quality of either . The main factor here is the accessible volume of water . Unprotected reservoirs, springs, and water delivered in tanks can not be considered reliable water sources either .
It should be noted that not all the definitions are unanimously interpreted in the context of Kazakhstan .
a) ‘Safe’ drinking water
As regards the definition of ‘safe’ drinking water, Kazakhstan introduced sanitary rules and norms (SanPiN) to which the term ‘drinking’ should conform . If water is ‘drinking’ water, it conforms to the requirements of the above-mentioned sanitary rules and norms; if the water is incompliant, then it is not ‘drinking’ water, but water of a different type (technical, irrigation, etc .) .
b) Water consumption rate
There is some difference in definitions of the water consumption rate, i .e ., the specific daily average drinking and household water consumption in settlements per resident (over a year) in l/day . This norm is regulated by point � .1 of the Construction Rules and Norms of the Republic of Kazakhstan (SNiP RK) 4 .01-0�-�001 . The norm varies across the country from 1�5 l/day to �50 l/day per person for built-in areas equipped with a local water pipeline and a sewage facility subject to residential built-in area development . Regarding the
Due to controversial data, it is difficult to define the share of the population in Kazakhstan without sustainable access to safe drinking water.
International minimal criteria of safe access to drinking water:
1. Water conforms to chemical and bacteriological requirements and originates from uncontaminated sources.
2. The water source is located within the radius of 1 km from the water user’s house.
3. The source supplies 20 liters of water per person per day.
1.4. Technical and Social Surveys on Evaluation of the Access Level to Water and Sanitation in the republic of Kazakhstan

UNDP ProjectNational Plan for Integrated Water Resources Management and Water Efficiency in Kazakhstan
ACCEss to DRINKINg WAtER AND sANItAtIoN IN thE REPUblIC of KAzAKhstAN
10
built-in areas that use water from standpipes, the specific average daily water consumption per resident (over a year) shall be taken as �0 l/day to 50 l/day .
Therefore, when designing drinking water supply systems in Kazakhstan, the minimal admissible water consumption norm shall exceed �0 l/day per person . It must further be noted that the World Health Organization (WHO) has also recommended introducing a minimal admissible water consumption rate per person in the amount of �0 l/day .
c) Distance to water source
Kazakhstani standards for defining the normative distance to a water supply source differ from those of the UN . Thus, point 8 .�0 of SNiP RK 4 .01-0�-�001 specifies the radius of a standpipe location as not exceeding 100 m, while the UN provides for the water source location to lie within the radius of one kilometer from a given water user’s place of residence .
d) ‘Reliable’ water sources
Another definition that needs to be elaborated on is the UN term of ‘water in tanks’ – delivered water . Such water, by UN definition, cannot be regarded as a reliable source of drinking water supply . In Kazakhstan, delivered water is not considered to be a reliable source of drinking water supply . However, there are, exceptions to the rule, with the water supply from the settlement of Sochinskoye of Akmola oblast, Atbasar rayon as an example .
This settlement has around 1,000 residents . Before the mid-1990s, the settlement received water from the clustered water supply system (CWSS) . Later, following frequent breakdowns of the main pipeline and the high cost of water supply, the water supply of the settlement from the CWSS was discontinued . In the following 7-8 years, drinking water was delivered to the settlement by trucks from the neighboring settlements, which were 50km-60km away from the settlement of Sochinskoye . Each house has a metal tank of � m� to 10 m� capacity buried nearby . The required volume of water was poured into these tanks upon residents’ requests . The entire community was spending some � million tenge (�1,500 USD) annualy on drinking water supply . In addition to this, the settlement has a water reservoir nearby, the water of which is utilized for technical needs (for irrigation, as drinking water for livestock, and for other household needs) .
In �00�, the community procured and installed a factory-made compact water treatment plant to obtain drinkable water . However, water from a water-purification system is still supplied by trucks to each household, as the community has no money to repair and renovate the distribution networks of the settlement . Now the community spends under 700,000 tenge (5,�00 USD) on water treatment and drinking water supply .
Thus, despite the fact that residents of the settlement of Sochinskoye have drinking water supplied to their houses by trucks, the residents have access to drinkable water any time of day in their households . It is also closer than water from a standpipe would be .
Perhaps in this case we are not speaking of water delivery defined by the term ‘delivered water’, but we are speaking rather of water distribution inside the settlement, meaning supplying water to each household .
The criteria for safe water and sanitation access have also been employed in the work (concerning water supply and sanitation) of the Joint Monitoring Program (JMP) of WHO/UNICEF, which is an official mechanism for monitoring the progress on MDGs’ achievement in ensuring access to improved water supply sources and sanitation . At the same time, the JMP noted that before its data could be utilized, a few warnings should be formulated:
a) Due to limited information in the JMP database, any conclusion that can

11
INTRODUCTION
be made on the basis of this information will be of indicative rather than exhaustive nature . This is particularly true of the Countries of Eastern Europe, Caucasus, and Central Asia (CEECCA);
b) The definition of the indicators employed in JMP is technologically based . In order for JMP preconditions to reflect reality, full technological functioning should serve as a premise . The operational failure and current repair in CEECCA countries suggests that technology does not work as planned, thus negating the JMP premises .
In view of the above-mentioned warnings, the JMP data can be used to analyze three important aspects of water supply and sanitation: population coverage, achieved progress, and the gap between urban and rural areas .
According to available generalized data, the water supply and sewage coverage of the populations in CEECCA countries is the same or slightly better than the coverage in Northern Africa .
As regards the progress achieved, the improved water supply for the urban population is the CEECCA countries’ only successful indicator being achieved ahead of schedule . Rural water supply and sanitation are critical, as sewage remains a substantive issue for cities as well .
The difference between water supply and sanitation in urban and rural areas of CEECCA should not be side-stepped . While the share of the urban population amounts to �6% of the total population (�00� data), the rural population shall be prioritized and targeted .
This can be summed up as follows:
1 . The JMP data cannot provide a real picture of the situation regarding the safety of the water supply system and adequate sanitation in the CEECCA region . There is a need for further work in assessing the situation as well as the receipt of detailed data on population coverage on the extended geographical level .
� . Compared to other regions of Europe, the situation in the CEECCA region is the worst . It is the same as in Northern Africa, or slightly better .
� . According to JMP data, CEECCA countries fall short of achieving Indicator 10 . In particular, there is an urgent need for targeted events to improve the rural sewage system .
4 . The gap between urban and rural settlements is large . With the urban population comprising �6% of the total population, there is a need for the specific events mentioned in point � .
When defining the criteria of access to safe drinking water, special attention shall also be paid to the quality of tap water . Thus, the Danish Ministry of Environment published the data on the water supply in the CEECCA countries as an appendix to its �004 report (Table 1 .1) .
Table 1 .1 includes the data on the population’s water supply coverage and the quality of supplied services in accordance with the appropriateness of networks and equipment . Further information provided in the report suggests that there is not a single country in the CEECCA that has an uninterrupted central water supply .
Unfortunately, there is no systematic data collection on microbiological and chemical discrepancies between the norms of tap water in the European region . However, the fragmented data is collected within the UN EEC, entitled “The Review of Environmental Activity Efficiency”, and some of this data comes from the national data sources .
In the RK, the central water systems’ irregular water supply is regulated by
According to available data, the water supply and sewage coverage of the populations in CEECCA countries is the same or slightly better than that in Northern Africa.

UNDP ProjectNational Plan for Integrated Water Resources Management and Water Efficiency in Kazakhstan
ACCEss to DRINKINg WAtER AND sANItAtIoN IN thE REPUblIC of KAzAKhstAN
1�
table 1.1. Percentage of the population with access to ‘improved/safe’ water supply sources that don’t require urgent repair and equipment renovation
Percent of the population with access to ‘improved/safe’ water
supply sources that don’t require urgent repair
Percent of the population with access to ‘improved/safe’ water supply sources that don’t require urgent repair and equipment
renovation
total Urban Rural total Urban Rural
Armenia 66 69 58 89 90 89
Azerbaijan 54 65 41 80 85 65
Belarus 80 80 80 90 90 90
Georgia 55 66 4� 89 89 89
Kazakhstan 66 69 64 89 89 89
Kyrgyzstan 44 6� �4 75 78 58
Moldova 64 68 61 88 89 86
Russian Federation 80 80 80 90 90 90
Tajikistan 38 55 �� 81 79 59
Turkmenistan 60 68 51 88 88 76
Ukraine 68 69 64 88 89 86
Uzbekistan 53 6� 48 83 79 61
Total in CEECCA 71 75 64 88 89 81
point 4 .4 of SNiP RK 4 .01-0�-�001 “Water Supply . Public Utilities .” The code divides the central water supply systems into three categories according to the level of water supply:
1st – the water supply for household needs and drinking can be dropped by not more than �0% of the estimated flow; for production needs the water supply may be decreased to the level set by the enterprise’s emergency operation schedule . The duration of supply drop shall not exceed three days . The interruption of water supply or supply drop below the fixed level may occur when the disabled system’s elements are shut down with backup elements activated (equipment, fittings, facilities, pipelines, etc .), but for no longer than ten minutes;
�nd – the value of admissible water supply drop is the same as for the first category . The duration of the water supply drop shall not exceed ten days . Interruption of the water supply or a supply drop below the fixed level may occur when the disabled system’s elements are shut down with backup elements activated, but not for more than six hours;
�rd – the value of admissible water supply drop is the same as for the first category . The duration of the water supply drop shall not exceed fifteen days . The interruption of the water supply or supply drop below the fixed level may occur during the repair period, but not for more than twenty-four hours;
The united cold water supply and production pipelines of the settlements with populations exceeding 50,000 residents shall be referred to the first category; that with residents numbering 5,000 to 50,000 to the second category, and that with fewer than 5,000 people to the third category . The category of rural clustered water supply systems shall be regarded as the settlement with the highest number of residents .

1�
INTRODUCTION
1.4.2 Defining Water and Sanitation Access Criteria in the republic of Kazakhstan
Having compared various standards of water and sanitation access criteria, in particular, the criteria of UN, JMP, WHO/UNICEF, and standards of Kazakhstan, it is recommended that the following criteria for evaluation of the population’s access to safe water and sanitation be introduced in the Republic of Kazakhstan (Tables 1 .� and 1 .�) .
It should be noted that one of the major criteria of drinking water affordability is its price affordability . This is an especially crucial issue for the rural population, whose paying capacity is lower than that of the urban population . The need to register tariff affordability was confirmed during the implementation of the sectoral program Drinking Waters, when the rural population refused to pay for 1m� of drinking water due to a high net price following the construction of water-purification systems .
To illustrate, in �00� in Atyrau oblast there occurred a situation in which Struya water-purification systems were built in eight settlements at local expense . Up to date, the systems have not been put into operation for the reason mentioned above . A similar situation has occurred in Northern Kazakhstan oblast, where the clustered water pipes of Ishimsky, Sergeyevsky, Bulayevsky, Sokolovsky, and Presnovsky operate supply to �90 settlements . However, 1�7 settlements have refused to use water pipes as most distribution networks are inoperable and water sale units are under private ownership . As a consequence, the selling price is three times higher than the fixed tariff .
The Water Code of the RK and the government decree of the RK of �004 establish measures for the governmental support of waterworks . In particular, article 1�5 provides for subsidies of drinking water supply services from especially important clustered water supply systems that are the single
Criteria of safe access to drinking water in Kazakhstan:
1. Improved water supply (central water pipe, common standpipe, protected drilled borehole, protected well or spring);
2. Conformance of water quality to SanPiN 2.1.4.559-96;
3. Minimal admissible consumption rate of 30 liters of water/day per person;
4. Distance to the source – not over 100 m from home.
5. Price affordability of drinking water*
table 1.2. Criteria for the population’s access to safe drinking water in the RK
Criteria for the population’s access to safe drinking water in the RK Accessible safe drinking water No access to safe drinking water
Source of drinking water Improved water supply:1 . Central water pipe is connected
to a household (apartment);� . Public standpipe;� . Protected borehole;4 . Protected well;5 . Protected spring .
Unimproved water supply technology:1 . Unprotected well;� . Unprotected spring;� . Unprotected reservoir;4 . Water supplied in tanks;5 . Water transported in cisterns;6 . Delivered water;7 . Bottled water;8 . Rain and ice water collection .
Water quality Conformance to SanPiN � .1 .4 .559-96
Non-conformance to SanPiN � .1 .4 .559-96
Minimally admissible water consumption rate
Over �0 l/day per person Under �0 l/day per person
Distance to drinking water source Under 100 m from the house Over 100 m from the house
Price affordability of drinking water
Note. Neither canned water nor bottled water is regarded as a “reliable source”; this has to do with accessible quantity and is not related to the water’s quality.

UNDP ProjectNational Plan for Integrated Water Resources Management and Water Efficiency in Kazakhstan
ACCEss to DRINKINg WAtER AND sANItAtIoN IN thE REPUblIC of KAzAKhstAN
14
source of drinking water supply . Therefore, in the future planning of drinking water supply projects and strategy development, it is important to stipulate government subsidies for the operation of drinking water supply facilities as well as rigid state control over expenditures .
1.4.3 Methodology of the Technical Survey on Identifying Water and Sanitation Access in the rK
The technical survey on identifying water and sanitation access in the Republic of Kazakhstan within this project was conducted separately for cities, towns, UTS, and RS, and its methods involved the following activities:
Cities, towns, and UTS of the Republic of Kazakhstan
1 . The project consultants on urban water supply and sanitation defined and clarified the list of settlements (cities, towns, and UTS) to be covered by this technical survey . The list included �60 settlements and was coordinated with the project specialist in rural water supply and sanitation to cover all the settlements of the Republic of Kazakhstan and to cash in small settlements that formerly had the status of urban-type settlements .
� . To define and further analyze the technical conditions of water supply and water discharge systems in cities, towns, and UTS, as well as the population’s access to such systems, the project consultants on urban water supply and sanitation developed a detailed questionnaire for managers and specialists of enterprises operating such systems (Appendix �) .
The questionnaire within this project was updated after being compared to the questions on the social survey for the water users, water managers, and specialists of enterprises that provide water supply and water discharge services or take part in the supply of such services to the population . This was done to correlate and combine the results of two surveys (technical and social) .
� . To obtain fundamental information on water supply and water discharge systems in cities, towns, and UTS, as well as information on the population’s access to such systems, this questionnaire was distributed to oblast, city, and rayon akimats .
4 . As the fundamental information was submitted upon request, it was processed in a specifically developed form and inputted in the interim database of the project (Appendix 4) . The developed form of the general data (the name of settlements, service enterprises of water supply, and water discharge systems) included a description of the current conditions of water supply and water discharge systems, specifying the current level of population access to water supply and sanitation and the quality of potable water .
The access to sewage sanitary technologies is assessed by the percentage of the population that uses improved sewage services. Improved sewage technologies mean the technologies that ensure frequent isolation and the use of hygienic means.
table 1.3. Criteria for the population’s access to sewage systems in the RK
Improved sewage Unimproved sewage
1 . Connection to public sewage
� . Connection to septic system
� . Lavatory with flushing system
4 . Cesspit
5 . Ventilated lavatory
1 . Service lavatory
� . Latrine bucket
� . Public lavatories
4 . Lavatories with an open pit

15
INTRODUCTION
In addition, the form on each settlement included a forecast of future population access to water supply and sanitation based on an analysis of the fulfillment of the governmental urban development program Drinking Waters; regional, oblast, and city water supply programs (Taza Su, Clean Water, etc .); and the analysis of information obtained from enterprises that operate and maintain the water supply and water discharge systems .
5 . The main barrier to the receipt of fundamental information, its processing, and analysis was the submission of initial information by many enterprises and organizations in incomplete, unexpanded, or distorted forms, or the provision of incorrect data on enterprise activity . This was especially true of settlements serviced by two or more enterprises that operate water supply and water discharge systems .
In all such cases, the additional requests were sent to oblast, city, and rayon akimats as well as to enterprises that supply drinking water and offer water discharge services . Furthermore, the active information dissemination program on the importance and the necessity of the ongoing survey for the Republic of Kazakhstan was carried out with officers of akimats and departments in charge of the operation and maintenance of water supply and water discharge systems of settlements and with directors and administrative staff of water supply companies .
6 . Ultimately, all the information was specifically tabulated in the form of conclusions on identification of the level of access to water and sanitation in all cities, towns, and UTS in the Republic of Kazakhstan .
Rural Settlements of the Republic of Kazakhstan
1 . The fundamental data for the identification of the access level of Kazakhstan’s rural population to drinking water were collected from public and water utilities as well as from sanitary and epidemiological stations . To this end, oblast centers were visited, namely the cities of Kyzylorda, Shymkent, Pavlodar, Atyrau, Aktau, and even Astana (the Water Resource Committee of the MA) .
� . The number of RS was clarified in the context of oblasts, as data available from akimats, statistics bodies, the State Rural Development Program, and the Center for Systematic Research of the Presidential Administration of RK are rather variable . Such clarification is one of the requirements of the Committee for Water Resources of the Ministry of Agriculture of RK .
� . The work was done in close coordniation with the Committee for Water Resources (CWR) . All necessary background information for the survey was provided by the CWR, where as it has been submitted by the oblasts to the specialist in water supply and sanitation .
4 . The project documents necessary to define specific indicators of the milestones that would indicate specific areas, oblasts, and projects on the whole were received from water supply project designers and included in the construction plan for the near future:
∆ construction costs of 1 km of water pipelines of various diameters and pipe materials;
∆ construction costs of specific water supply facilities (pump stations, water reservoirs, water towers, etc .);
∆ construction costs of water supply system in a settlement referred to one resident;
∆ cost of 1 m� of supplied drinking water .
Hence, the last two indicators play an important role in defining the capacity of the population to pay for water supply services or invest in water supply
UNDP ProjectNational Plan for Integrated Water Resources Management and Water Efficiency in Kazakhstan
ACCEss to DRINKINg WAtER AND sANItAtIoN IN thE REPUblIC of KAzAKhstAN
16
facilities, and in defining the share of the population’s income absorbed by such expenses . This should be taken into account when defining the economic and financial mechanisms of program implementation as well as when developing the mechanism of investment support of specific water supply systems in the first stage of their operation . The size of financing for the construction/reconstruction of water supply facilities shall be defined both by the cost of specific projects and specific expenses .
5 . While analyzing the information submitted by the oblast and regional inspection programs, akimats submitted laboratory test data on the quality of drinking water in some cities and settlements of a number of oblasts .
In addition, the Committee for Sanitary and Epidemiological Supervision of the Ministry of Public Health of the Republic of Kazakhstan has specific information on the quality of drinking water and the water supply situation in rural settlements . Pursuant to the decree of chief public sanitary doctor of RK №�9 as of �4 .06 .�00� “On Public Sanitary and Epidemiological Supervision of Household and Drinking Water Supply”, oblast departments control the sanitary and technical conditions of water pipes, open reservoirs, decentralized water supply sources, and water quality monitoring by bacteriological, chemical, radiological, parasitological, and virologic indicators .
Accordingly, for receipt of fuller information on water quality, sanitary and epidemiological conditions of systems, and drinking water supply facilities in rural areas, the project specialist in rural water supply and sanitation submitted a letter on behalf of CWR to the Ministry of Public Health of the Republic of Kazakhstan requesting relevant information .
6 . During the collection of fundamental data, special attention was paid to data on project implementation of programs that were underway during �00�-�004, work plans, and progress in �005 in the context of settlements that were needed to identify the current share of the population with access to drinking water .
In addition, an assessment of required capital investments was made within the sectoral program Drinking Waters . This was done to encourage the development of the water supply systems of cities, settlements, and rural settlements (RS) for the medium-term period of �006-�008, with a forecast up to �010 .
7 . The database was generated for each RS in the context of oblasts as fundamental documents were collected .
Apart from general data (the name of the RS, its administrative status, the number of residents in 1999 and �00�, the socio-economic development potential, source of water supply, quality of drinking water, availability and extension of water distribution systems), the list of database fields by specific settlements included:
∆ Implemented projects and their costs on all programs over �00�-�004;
∆ Projects planned for implementation in �005 on all budget programs;
∆ Projects planned for �006-�008 and up to �010 by request of the CWR and oblast akimats at the expense of national and local budgets, grants, and loans as well as extra-budgetary resources .
8 . The fully completed database on each RS enabled the calculation of the timing for the achievement of MDGs, subject to implementation of all planned projects in the regions and oblasts overall .
Hence, all the calculations on the level achieved were made by means of the statistical reporting adopted in the Republic of Kazakhstan, i .e ., the percentage of the population with access to drinking water was defined .

17
INTRODUCTION
The following calculation procedure was used:
1) The current percentage of RS population with access to drinking water was defined (end of �004);
�) The number of the population that can get access to drinking water in each subsequent year subject to implementation of all planned program projects with all financing sources was defined;
�) The percentage of the population with access to drinking water at the beginning of each accounting year was defined . The year �011 was also included, as this year marks the final term for the implementation of the sectoral program Drinking Waters;
4) The regions (oblasts) which would not be able to halve the share of the population without access to drinking water by the year �011 were defined;
5) The projects and the volume of investments required to achieve MDGs, aimed at halving the share of the population without access to drinking water, are being defined .
9 . Further stages to achieve the MDGs in water and sanitation shall be the following:
∆ To establish the projects in determined regions (oblasts) and the size of investments necessary to achieve the MDG by �015;
∆ To consider the possibility of reallocating capital investments among regions (oblasts) where the MDG can be achieved much earlier;
∆ To consider an increase in the size of financing and possible financing sources for regions (oblasts) where, as the preliminary calculation suggests, the MDG will not be reached by �015 .
10 . The preliminary analysis suggests that the MDG on the population’s access to drinking water and sanitation is likely to be achieved by �015 in the rural areas of Kazakhstan, and well in advance of this date in most regions and oblasts . Hence, special attention shall be paid to establishing new structures and supporting the existing organizations in terms of the operation of water supply facilities as well as the entry of private operators on the water supply market . This, in turn, necessitates the improvement of the legislative framework in the area of water supply and water discharge .
1.4.4 Methodology of Social Survey on Evaluation of Water and Sanitation Access in the republic of Kazakhstan
The social survey included three major elements:
∆ Questionnaire survey with a sampling of 7,500 people in rural and urban areas of Kazakhstan;
∆ Semi-structured interviews with �40 representatives of water users and specialists in water supply from cities and towns, villages, and settlements across the country;
∆ Sixteen focus groups with a range of stakeholder groups .
1) Questionnaire surveyThe questionnaire survey was carried out by the Institute of Comparative Social Studies CESSI-Kazakhstan, which has ample experience in conducting similar large-scale research in Kazakhstan . The English version of the questionnaire was

UNDP ProjectNational Plan for Integrated Water Resources Management and Water Efficiency in Kazakhstan
ACCEss to DRINKINg WAtER AND sANItAtIoN IN thE REPUblIC of KAzAKhstAN
18
translated into Russian and Kazakh languages and then translated back to verify the quality of the questionnaire . Prior to the main survey, the questionnaire was tested on �0 rural and urban respondents . The questionnaire survey was undertaken in two stages . The first stage of the survey was conducted in the Balkhash-Alakol river basin in February-March �005 . The results were processed and included in the SPSS program (version 1�) . The SPSS program is a statistical package specifically intended for processing and analyzing the data of social surveys . It is widely used by social scientists and health and market research for analyzing and studying the data via questionnaire survey . The results of the pilot research underlaid further questionnaire improvements . During the second stage, the updated questionnaire was distributed across Kazakhstan (7,515 respondents) .
∆ Questionnaire development
The questionnaire was specifically constructed for this project based on the questionnaire tested within the DFID project on Nura-Ishim River Basin Management (�00�) . The draft questionnaire for this project was developed in early September �004 and discussed with a number of counterparts, representatives of the Committee for Water Resources, river basin departments, water supply companies, the Kazgiprovodhoz Institute, and government SES, all of whom attended two round-table sessions in the middle and end of September �004 . The questionnaire was further updated after discussions at such meetings .
∆ Questionnaire composition
The questionnaire consisted of seven chapters (from A to G): respondent location; household water supply, including water supply and its quality; drinking water; generalized view on water quality; health and sanitation; willingness to pay for water supply services; information source; and finally, general socio-economic and demographic information .
∆ Field work on questionnaire survey
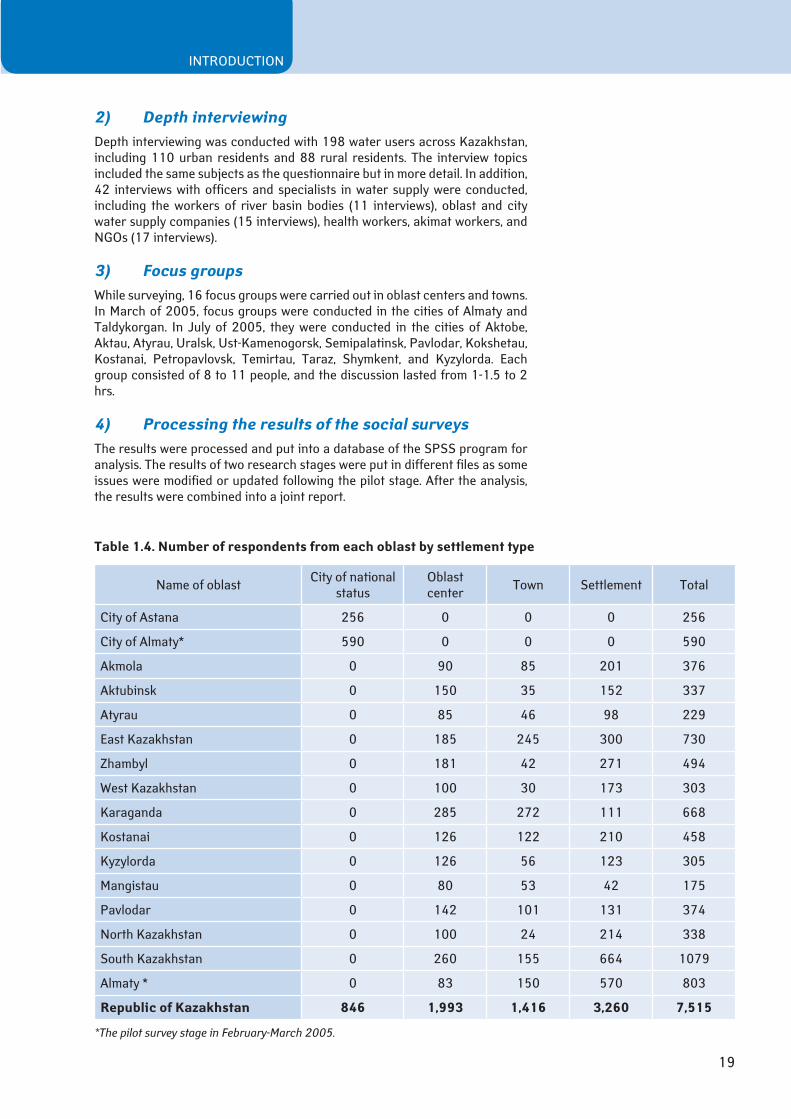
A total of 7,515 questionnaires were distributed across Kazakhstan, including 1,�9� questionnaires during the first stage (February-March �005) and 6,1�� during the second stage (May-August �005) . The questionnaires were disseminated in fourteen oblasts and two cities of national status (Astana and Almaty) in order to consider population groups from various settlements: major cities, oblast centers, and urban and rural settlements (Table 1 .4) .
The questionnaire survey took �0-60 minutes per person . The rule of household selection in settlements was applicable:
∆ One survey site includes 10 interviews on average;
∆ One survey site is allocated an itinerary, upon which the interviewer takes note of each step;
∆ The interviewer selects a starting point and proceeds to work . Beginning with the first household, the interviewer moves on to other households unless the required number of interviews have been conducted;
∆ Having interviewed the household of one apartment, the interviewer should each time afterwards (i .e ., after each interview) skip five (5) apartments (or � houses in a settlement);
∆ In the event that there are a few families in one building (shared apartment; parents and their children’s families live separately), then the rule of the left hand applies – on entering the building, the first room on the left shall be the household to interview;
∆ The interviewer is not allowed to conduct more than three (�) interviews in one apartment BUILDING . This means that if the interviewer conducted three interviews in 1, �, or � porches and still many apartments remain, the interviewer shall not seek other respondents this apartment building .
19
INTRODUCTION
2) Depth interviewing Depth interviewing was conducted with 198 water users across Kazakhstan, including 110 urban residents and 88 rural residents . The interview topics included the same subjects as the questionnaire but in more detail . In addition, 4� interviews with officers and specialists in water supply were conducted, including the workers of river basin bodies (11 interviews), oblast and city water supply companies (15 interviews), health workers, akimat workers, and NGOs (17 interviews) .
3) Focus groupsWhile surveying, 16 focus groups were carried out in oblast centers and towns . In March of �005, focus groups were conducted in the cities of Almaty and Taldykorgan . In July of �005, they were conducted in the cities of Aktobe, Aktau, Atyrau, Uralsk, Ust-Kamenogorsk, Semipalatinsk, Pavlodar, Kokshetau, Kostanai, Petropavlovsk, Temirtau, Taraz, Shymkent, and Kyzylorda . Each group consisted of 8 to 11 people, and the discussion lasted from 1-1 .5 to � hrs .
4) Processing the results of the social surveys The results were processed and put into a database of the SPSS program for analysis . The results of two research stages were put in different files as some issues were modified or updated following the pilot stage . After the analysis, the results were combined into a joint report .
table 1.4. Number of respondents from each oblast by settlement type
Name of oblast City of national status
Oblast center Town Settlement Total
City of Astana �56 0 0 0 �56
City of Almaty* 590 0 0 0 590
Akmola 0 90 85 �01 �76
Aktubinsk 0 150 �5 15� ��7
Atyrau 0 85 46 98 ��9
East Kazakhstan 0 185 �45 �00 7�0
Zhambyl 0 181 4� �71 494
West Kazakhstan 0 100 �0 17� �0�
Karaganda 0 �85 �7� 111 668
Kostanai 0 1�6 1�� �10 458
Kyzylorda 0 1�6 56 1�� �05
Mangistau 0 80 5� 4� 175
Pavlodar 0 14� 101 1�1 �74
North Kazakhstan 0 100 �4 �14 ��8
South Kazakhstan 0 �60 155 664 1079
Almaty * 0 8� 150 570 80�
Republic of Kazakhstan 846 1,993 1,416 3,260 7,515
*The pilot survey stage in February-March 2005.

UNDP ProjectNational Plan for Integrated Water Resources Management and Water Efficiency in Kazakhstan
ACCEss to DRINKINg WAtER AND sANItAtIoN IN thE REPUblIC of KAzAKhstAN
�0

�1
2Over 39% of the population of the Republic of Kazakhstan does not have permanent access to quality drinking water.
ThE CurrENT STATE oF WATEr SuppLy AND SANITATIoN IN KAzAKhSTAN
More detailed information on the access of the country’s urban and rural population to drinking water and sanitation as well as the state of drinking water supply systems and sewerage is given in chapters 3 and 4. This chapter outlines general information on the existing level of access to water and sanitation across the country, which is presented by Table 2.1.
table 2.1. Access to drinking water and sanitation of the population of the RK
PopulationNumber of Access to drinking water Access to sewage
people % people % people %
Urban 8,5�0,��� 57 .0 6,777,789 79 .4 5,�7�,499 6� .1
Rural 6,4��,510 4� .0 �,�19,�60 �6 .1
Total in RK 14,95�,7�� 100 .0 9,097,149 60 .8
As the table suggests, over �9% of the country’s population has no permanent access to quality drinking water . The issue is especially acute in rural areas, where slightly over one-third of all rural residents have permanent access to quality drinking water .
It should be noted that rural sewage access is mainly defined in the project by the data of the social survey and was excluded from the table above as rural settlements nearly universally have individual in-yard toilets . Only a marginal percentage of the rural population has in-house lavatories, and this is indicative of a very low level of rural sanitation .
The overall low access level to drinking water in the country can be explained by the poor technical conditions of water supply systems built �5-�0 or more years ago . Repair and rehabilitation work was limited or not carried out at all due to limited financing in the 1990s . The system equipment is fully worn-out and outdated . Only over the past few years have funds been allocated to rehabilitate drinking water supply systems following the adoption of the sectoral program Drinking Waters, the State Rural Development Program, and other programs .
The disadvantages mentioned above should also include the sectoral institutional issues that arise both from the low status of the state authorized body on water resource management and protection (CWR), and from the body’s capacity-building needs . Over the past five years, CWR has been repeatedly reorganized and relocated, and this has negatively affected its
UNDP ProjectNational Plan for Integrated Water Resources Management and Water Efficiency in Kazakhstan
ACCEss to DRINKINg WAtER AND sANItAtIoN IN thE REPUblIC of KAzAKhstAN
��
human resources . The number of CWR staff workers was reduced several times, and now there are only �4 people on the staff list .
All of these factors indicate the need for a considerable improvement in the management of the country’s limited and unsustainable water resources . The existing status and organizational capacity of the Committee for Water Resources hinder full performance of the duties assigned to the committee by the Water Code and other laws and regulations .
One of the major causes underlying the ineffective management of Kazakhstan’s water resources is the distribution of functions of water resource management between different government departments and organizations . Hence, CWR does not have the sufficient authority to coordinate and control the operations of those departments and organizations . CWR is the lowest organization in the structure of Kazakhstan’s Ministry of Agriculture; this gives rise to a conflict of interests between water resource administration and the Ministry of Agriculture, which is the largest water user . Poor status also weakens the Committee’s ability to secure the necessary authorities to negotiate on the issues of transboundary water resources .
One of the major causes underlying the ineffective management of Kazakhstan’s water resources is the CWR’s lack of sufficient status for coordinating and controlling the operations of main departments and organizations in this sphere.

��
3ThE CurrENT STATE oF ThE urbAN WATEr SuppLy AND SANITATIoN IN KAzAKhSTAN by TEChNICAL SurvEy FINDINGS
The country’s urban population amounts to 8,520,200 people, including 7,569,900 urban residents and 950,300 residents of urban-type settlements. The central water supply systems of 86 cities and 176 settlements supply water to 81 cities and 139 settlements. Cities and settlements where less than 30% of the population has access to a water supply system are referred to by the category “Decentralized water supply sources”.
Situation in Kazakhstan
The distribution of administrative and territorial units and the number of the population of oblasts and cities of national subordination are presented in Table � .1 .
table 3.1. the number and location of the population by cities and urban-type settlements
№ Name Number of cities
Number of settle-
ments
Total number of urban
population, 000’ ps
Number of population in cities, 000’ps
Number of population in
urban-type settlements, 000’ps
1 Akmola oblast 10 15 �50 .1 �0� .4 47 .7
� Almaty oblast 10 15 470 .� �70 .5 99 .8
� Aktubinsk oblast 8 � �74 .� �5� .0 �� .�
4 Atyrau oblast � 11 �60 .0 195 .0 65 .0
5 East Kazakhstan oblast 10 �5 856 .8 748 .4 108 .4
6 Zhambyl oblast 4 1� 4�0 .� �99 .4 �0 .8
7 West Kazakhstan oblast � 5 �60 .6 ��� .6 �7 .0
8 Karaganda oblast 11 �9 1105 .6 960 145 .6
9 Kostanai oblast 5 1� 494 .7 �9� .� 101 .5
10 Kyzylorda oblast � 1� �6� .� 198 .0 165 .�
11 Mangistau oblast � 6 �68 .6 ��4 .5 44 .1
1� Pavlodar oblast � 7 479 .4 44� .5 �5 .9
1� North Kazakhstan oblast 5 ��� .9 ��� .9
14 South Kazakhstan oblast 8 11 818 .0 760 .9 57 .1
15 City of Almaty 1 1�40 .0 1�40 .0
16 City of Astana 1 � 514 .6 514 .6
Total in the Republic of Kazakhstan 86 174 8,5�0 .� 7,569 .9 950 .�
�4
UNDP ProjectNational Plan for Integrated Water Resources Management and Water Efficiency in Kazakhstan
ACCEss to DRINKINg WAtER AND sANItAtIoN IN thE REPUblIC of KAzAKhstAN
Overall, underground waters are the predominant source of the drinking water supply of urban populations (65%) . The share of surface waters increases from 55% to 90% in Kostanai, Mangistau, Akmola, and Pavlodar oblasts . Urban water consumption in Atyrau oblast is fully provided for by surface waters . It should be noted that over the past few years nearly all the surface sources of water supply suffered from considerable pollution by anthropogenic substances, and their water quality is incompliant with regulatory requirements . The pollution of surface sources is particularly difficult in the cities of Kokshetau, Kyzylorda, Shardara, Ekibastuz, Ridder, Lenger, etc .
The utilization of underground waters predominates (80% – 100%) in Aktubinsk, Zhambyl, and South Kazakhstan oblasts . The quality of underground waters in most settlements conforms to regulatory requirements thus rendering pre-treatment unnecessary .
The data of water supply companies and akimats underlay the conclusions on access to quality drinking water . It should be noted, however, that with current levels of water source pollution, unsatisfactory sanitation, and expiration of water supply distribution networks and facilities, it would be unrealistic for 100% of drinking water to be compliant with regulatory requirements without the renovation work for the water user .
The monitoring data suggests that the loss of the quality of water that water users receive is mainly caused by the aptness of most parts of the distribution system to rust, along with the fouling of the internal surfaces of the pipeline . These problems arise due to long-term operation and the lack of timely flushing . The water is supplied irregularly or by schedule in 68 settlements . In some settlements, water is supplied several hours a day, while in other settlements water is not supplied at nights .
For drinking or household needs, 537,300 people or 6.3% of the total urban population utilizes water from common wells or in-yard wells, boreholes or surface waters as well as transported water .
All available boreholes and common wells intended for decentralized water supply are derelict; sanitary zones are not compliant, and sanitary control is insufficient .
Pipeline leakage, water cuts, and emergencies not only cause the loss of water and irregular water supply, but distort the sanitary welfare of the population and sometimes give rise to infectious diseases . However, this situation is not always indicative of the contamination of supplied water . The dissemination of infections in most cases is aided not by the water itself, but rather by a “waterless” factor, in which water is supplied irregularly or by schedule . A clear example is the city of Abai of Karaganda oblast, where water is supplied for two hours a day; the population is afraid to utilize non-boiled water not only for drinking but even for household needs such as floor cleaning .
Network deterioration affects systems’ low water pressure . Thus, residents of upper floors have water access only at night or no access at all (in the cities of Aktobe and Kyzylorda) .
The urban drinking-water consumption level per person is quite high . The specific water consumption per resident is 1 .5-� times higher than in the countries of Western Europe .
Water cannot be used effectively without the introduction of the billing system . To illustrate, with 98 .4% meter coverage in the city of Shymkent, water consumption dropped from 450l/ day per person to 10� l/day or by more than 4 times, while the same indicator dropped twice in the city of Almaty, even though only �7% used meters . At the same time, less than �0% of the populations of 58 cities use water meters . The water fee is calculated by the water consumption rate and remains a marginal part of the household budget, while water users remain unaware of the real cost of water supply services .
Over the past few years, all primary surface water sources have suffered from pollution by anthropogenic substances, and their water quality, for the most part, is incompliant with regulatory requirements.
The level of water supply services coverage is relatively high; 6, 771,800 people or 79.4% of the urban population has 24-hour access to quality drinking water.
Pipeline leakages, water cuts, and emergencies not only cause the loss of water and irregular water supply, but distort the sanitary well-being of the population and sometimes give rise to infectious diseases.

�5
THE CURRENT STATE OF THE URBAN WATER SUPPLY AND SANITATION IN KAZAKHSTAN BY TECHNICAL SURVEY FINDINGS
Water discharge infrastructure connections are widespread, ranging from 1�% in the city of Ayagoz to 98% in the city of Satpayev . The oblast centers and cities of Astana and Almaty have 60%-94% of residents connected to water discharge systems . Many industrial cities such as Ridder, Zyryanovsk, Karatau, Satpayev, Zheskazgan, and Zhanatas enjoy high connection levels to water discharge systems--exceeding 90% . The worst sanitation example can be seen in the settlements where such systems are not widespread .
Water infrastructure deterioration in most settlements of the country amounts to 40%-70%, sometimes reaching 100% .
The regional data suggest that the major expiration of distribution networks amounts to 80 .5% in Almaty oblast, 67 .�% in Akmola oblast, 65 .6% in Pavlodar oblast, 65% in Atyrau oblast, and 6� .5% in East Kazakhstan oblast . Sectoral regulations classify the physical deterioration of water supply systems over 50% as critical, for further deprecation sharply increases the accident rate, which causes damage that significantly increases the cost of its prevention .
The length of networks in the country’s cities amounts to 23,468 km of water supply and 11,133 km of sewage systems . Most water pipelines were put into operation or overhauled over �5-�0 years ago . More than half of the networks require replacement or overhaul .
In addition, the cities have abandoned networks (not included in the balance of local utilities), formerly owned by central departments; these networks require complete replacement .
The overall loss in the distribution networks caused by pipe deterioration reaches �0%-50% and more for water produced . The number of network emergencies grows annually by 4%-5% on average . The number of emergencies per 100 km of water distribution networks grew from 15-�0 in the mid-1990s to 70 in �004 . The water supply and distribution system is deteriorating rapidly, thus causing greater accident risk and a higher number of leakages . Obsolete communications waste �50,000 m� – �00,000 m� of water a day .
The overall construction of water distribution facilities falls considerably behind the pace of civil housing construction . An analysis of the growth of pipeline length has demonstrated its drop by more than 15 times .
Preventive maintenance of networks, including maintenance for the equipment of water supply and water discharge systems has been replaced by accident recovery work, the unit cost of which is � .5-� times higher than that of scheduled repair of the same facilities . Such a situation further aggravates the lack of resources and causes an accrual of the number of unrepaired facilities and loss of their reliability . This has already negatively affected the supply of quality drinking water of sufficient quantity for the country’s population . Water supply treatment facilities are in need of reconstruction, reconditioning, new operating procedures, and new chemical reagents . Every third water treatment facility is improper .
The electricity-driven equipment of operating water pump and sewage pump stations in nearly all settlements need to be reconstructed or replaced . Forty-five percent of WPS and �4% of SPS in cities and settlements have been depreciated by over 70% .
One-third of the 86 operating urban sewage treatment facilities are technically unsatisfactory . Thirty-nine cities and settlements have no treatment facilities at all; thus, waste waters are discharged untreated . Untreated flows are discharged directly into filtration fields as in the city of Taraz, in ponds in the cities of Kokshetau, Kyzylorda, Uralsk, Petropavlovsk, and to the ground relief of adjacent areas in Kostanai . A considerable volume of wastewater from enterprises (up to �4% in some cities) goes directly to urban treatment facilities which are not intended for the treatment of industrial waste waters . Recently, household waste waters are predominated by hard-to-treat foreign-
Water infrastructure deterioration in most settlements of the country amounts to 40%-70%, sometimes reaching 100%.

�6
UNDP ProjectNational Plan for Integrated Water Resources Management and Water Efficiency in Kazakhstan
ACCEss to DRINKINg WAtER AND sANItAtIoN IN thE REPUblIC of KAzAKhstAN
made detergents with a lasting adverse environmental impact that pollutes water sources .
Many operating treatment facilities have already worked out their operational resources and are in need of repair . Other facilities have overload capacity which makes the waste water technology incompliant with the design data . The treatment facilities of the cities of Taldykorgan, Atyrau, Pavlodar, Ust-Kamenogorsk, and Semipalatinsk are overloaded by 1 .5-� times . The waste ponds are frequently filled up to the limit, endangering water objects and settlements with the accidental breaking of dams . When operating the Taldykol pond in Astana city in the freshet period, there is a danger of its overfilling and washout; therefore, water is discharged to the adjacent areas according to emergency procedures .
The situation in the oblastsThe existing access level of the populations of the cities of national status, oblast centers, cities and towns, and urban-type settlements to drinking quality water and sewage system is represented in Table � .� .
The table illustrates that the number of the urban population of the Republic of Kazakhstan with permanent access to quality drinking water amounts to
table 3.2. summary of access of the urban population of the Republic of Kazakhstan to water supply and sanitation systems
№ Territorial division Population (ps .)
Number of people with �4-hour-a-day
access to quality drinking water (ps .,%)
Access type to sewage system (ps . /%)
Central supply Cesspool Unequipped lavatory
1 Akmola oblast �50,166 9�,54� or �6 .4% 160,97�/46 .0 14,67�/4 .0 17�,5�1/50 .0
� Almaty oblast 470,�19 ��0,907 or 70 .�% 168,�9�/�5 .8 �,�00/0 .7 �98,7�7/6� .5
� Aktubinsk oblast �74,166 �51,4�� or 9� .9% ��6,97�/60 .7 �,99�/1 .0 14�,�01/�8 .�
4 Atyrau oblast �60,04� 165,911 or 6� .8% 116,�59/44 .7 �,746/1 .5 1�9,9�7/5� .8
5 East Kazakhstan oblast 856,79� 7�4,�17 or 85 .7% 5�1,94�/60 .9 14,89�/1 .7 �19,959/�7 .4
6 Zhambyl oblast 4�0,16� �86,005 or 89 .8% 14�,085/�� .� 8,488/� .0 �78,589/64 .7
7 West Kazakhstan oblast �60,575 �5�,508 or 96 .9% 195,550/75 .0 8,670/� .� 56,�54/�1 .7
8 Karaganda oblast 1,105,5�5 997,�69 or 90 .�% 817,49�/7� .9 �7,�87/� .4 �50,645/�� .7
9 Kostanai oblast 494,7�� �67,868 or 74 .4% ��4,515/67 .6 �0,57�/4 .� 1�9,6�7/�8 .�
10 Kyzylorda oblast �6�,�18 8�,145 or �� .6% 105,81�/�9 .1 �,�84/1 .0 �54,0�1/69 .9
11 Mangistau oblast �68,619 17�,401 or 64 .5% ��8,�96/85 .0 �,79�/1 .4 �6,4�0/1� .6
1� Pavlodar oblast 479,�69 �45,66� or 7� .1% 410,776/85 .7 1,409/0 .� 67,165/14 .0
1� North Kazakhstan oblast ���,900 190,589 or 81 .4% 146,�04/6� .5 �,567/1 .1 85,0�9/�6 .4
14 South Kazakhstan oblast 818,070 55�,118 or 67 .5% �74,�7�/�� .1 16,�94/� .0 5�7,40�/64 .9
15 City of Almaty 1,�40,000 1,��5,148 or 99 .6% 995,100/80 .� �44,900/19 .8
16 City of Astana 514,575 51�,875 or 99 .9% �84,�88/74 .7 1�0,187/�5 .�
total 8,520,222 6,771,789 or 79.4% 5,373,499/63.1 3,146,723/36.9
�7
THE CURRENT STATE OF THE URBAN WATER SUPPLY AND SANITATION IN KAZAKHSTAN BY TECHNICAL SURVEY FINDINGS
79 .4%; the number with permanent access to improved sewage is 6� .1% . Hence, �6 .9% of the urban population uses unimproved sewage systems .
The situation concerning water supply in the oblasts is detailed below.
The urban population of Akmola oblast amounts to �50,100 people, including �0�,400 city residents and 47,700 urban-type settlement residents . The central water supply covers ten cities and fourteen settlements out of the existing ten cities and fifteen settlements .
The share of water users connected to the central water supply varies from 6� .�%-100% . Fourteen settlements recover water from underground water sources, but their percentage share to the number of the population is marginal: 10�,�7� people or �9 .5% . The remaining 11 settlements partly (the city of Kokshetau 78 .�% and the city of Yesil 6�%) or fully recover water from surface sources . The quality of surface waters is incompliant with the standards fixed for drinking water . At the same time, due to the absence of treatment facilities or physical deterioration, four settlements (144,151 people or 41 .�%) have to use untreated water of non-standard quality for household needs and drinking . Water treatment facilities require reconstruction, reconditioning, new operating procedures, and new chemical reagents .
The situation is even worse than this would indicate because nine settlements have irregular or scheduled water supply . Due to long-term operation and the absence of timely flushing, a considerable part of the internal surface of the pipelines is corroded and encrusted, and water gets contaminated again when transported to water users . Water infrastructure deterioration in most settlements amounts to 60%-70%, sometimes reaching 100% (in the settlements of Borovoye and Birlestik) .
The urban population of Almaty oblast amounts to 470,000 people, including �70,500 city residents and 99,800 urban-type settlement residents . The central water supply covers nine cities and fourteen settlements out of the existing ten cities and fifteen settlements . The share of water users connected to the central water supply varies from �4 .5%-100% . Twenty-two settlements partly or fully recover water from underground sources (44�,�00 people or 94 .�% of the entire urban population in the oblast) . The quality of underground waters is good and compliant with the regulatory requirements of SanPiN and GOST . The situation of people using water from surface sources is worse . Due to the absence of treatment facilities or their physical deterioration, the populations of the cities of Talgar, Lepsy, and Ulken use water of non-standard quality for drinking .
The situation is aggravated by the fact that six settlements have irregular or scheduled water supply . Due to lasting operation and the absence of timely flushing, a considerable part of the internal surface of the pipelines is corroded and encrusted, and water gets contaminated again when transported to water users . Water infrastructure deterioration in most settlements amounts to 60%-70%, reaching 100% in the settlement of Ulken .
The urban population of Aktubinsk oblast amounts to �74,�00 people, including �5�,000 city residents and ��,�00 urban-type settlement residents . The central water supply covers eight cities and two settlements . The share of water users connected to the central water supply amounts to 100% . Hence, it should be noted that apart from the settlement of Kenkiyak, all settlements under consideration have regular water supply .
The oblast’s urban population utilizes underground waters for water supply . The quality of water in most settlements is compliant with regulatory requirements, thus rendering pre-treatment unnecessary . However, due to the high degree of physical deterioration of diversion facilities, the population overall suffers
Quality drinking water and regular water supply services in Akmola oblast are accessible to 26.4% of urban residents or 92,542 people.
Quality drinking water is accessible to 330,900 people or 70.3% of Almaty oblast 24 hours a day.
Quality drinking water in Aktubinsk oblast is accessible 24 hours a day to 351,423 people or 93.9% of the urban population.

�8
UNDP ProjectNational Plan for Integrated Water Resources Management and Water Efficiency in Kazakhstan
ACCEss to DRINKINg WAtER AND sANItAtIoN IN thE REPUblIC of KAzAKhstAN
from water deficit . Consequently, there is a need for measures on expanding diversion facilities, underground water resources, exploratory works for the discovery of new fields, and activities for water protection from deterioration and pollution .
Water infrastructure deterioration in most settlements exceeds 70%, reaching 100% in the settlements of Zhem and Emba . Official data from the cities suggest that water is 100% compliant with regulatory requirements . However, in view of the deterioration of water distribution networks and the number of network emergencies in a year, such data seem doubtful .
The urban population of Atyrau oblast amounts to �60,000 people, including 195,000 city residents and 65,000 urban-type settlement residents . The central water supply covers two cities and seven settlements out of the two existing cities and eight settlements . The share of water users connected to the central water supply varies from 48 .1% to 100% . The urban population utilizes surface waters for water supply . Though the quality of surface waters is incompliant with the standards fixed for drinking water, six settlements (�0,000 people or 11 .5% of entire urban population in the oblast) have to use water of non-standard quality for household needs and drinking due to the absence of treatment facilities or their physical deterioration .
Seven settlements have irregular or scheduled water supply (61,600 people or �� .7% of entire urban population in the oblast) . Due to lasting operation and the absence of timely flushing, a considerable part of the internal surface of the pipelines is corroded and encrusted, and water gets contaminated again when transported to water users .
Water infrastructure deterioration in most settlements amounts to 60%-70%, sometimes reaching 100% (in the settlements of Koschagyl) .
Quality drinking water and regular water supply are mainly accessible to residents of the city of Atyrau and the settlements of Balykshi and Zhumysker, which are serviced by Atyrau’s city water supply company .
The urban population of East Kazakhstan oblast (EKO) amounts to 856,800 people, including 784,400 city residents and 108,400 urban-type settlement residents . Because of the level of water supply, EKO is referred to as the most trouble-free of all settlements . The central water supply covers ten cities and twenty-one settlements out of the existing ten cities and twenty-five settlements . The share of water users connected to the central water supply varies from 4� .1% to 100% . The urban population utilizes surface waters for water supply . Twenty-five settlements fully or partially recover water from underground water sources . The quality of underground waters is good and compliant with the requirements of SanPiN and GOST . The situation of people using water from surface sources is worse . In most settlements with combined water recovery or surface water recovery, water treatment technologies became ineffective following the increased degree of contamination or the physical deterioration of water treatment facilities (in the settlements of Novaya Bukhtarma, Oktyabrsky, Pribrezhny, and Ognevka) .
The manufacturing control over the quality of supplied water is compliant with state standards only in the cities, as in most cases it comes down to an evaluation of organoleptic indicators, residual chlorine, and the level of bacterial contamination .
Four settlements have irregular or scheduled water supply . Due to lasting operation and the absence of timely flushing, a considerable part of the internal surface of the pipelines is corroded and encrusted, and water gets contaminated again when transported to water users .
Water infrastructure deterioration in most settlements amounts to 60%-70%, sometimes reaching 100% (in the settlement of Oktyabrsky) .
The number of the urban population with quality drinking water and regular water supply in Atyrau oblast is 165,900 or 63.8% of the population.
The number of the urban population with 24-hour access to quality drinking water in East Kazakhstan oblast amounts to 85.7% or 734,300 people.
�9
THE CURRENT STATE OF THE URBAN WATER SUPPLY AND SANITATION IN KAZAKHSTAN BY TECHNICAL SURVEY FINDINGS
The urban population of Zhambyl oblast amounts to 4�0,�00 people, including �99,400 city residents and �0,800 urban-type settlement residents . The central water supply covers four cities and eight settlements out of the existing four cities and twelve settlements . The share of water users connected to the central water supply varies from 18 .6% to 56 .6% .
The oblast’s urban population mainly utilizes underground waters for water supply (4�5,800 people or 98 .9% of entire urban population in the oblast) . Owing to the overall availability of underground waters, water is supplied to oblast cities and settlements by local water pipes . The quality of water in most settlements is compliant with regulatory requirements, thus rendering pre-treatment unnecessary .
Water infrastructure deterioration in all settlements exceeds 50%, and they are nonfunctioning due to the state of emergency .
The urban population of West Kazakhstan oblast (WKO) amounts to �60,600 people, including ���,800 city residents and �7,000 urban-type settlement residents . The central water supply covers two cities and three settlements out of the existing two cities and five settlements . The share of water users connected to the central water supply varies from 9 .6%-9� .�% . Three settlements with populations numbering �8,700 recover water from underground sources . The quality of underground waters is good and compliant with the requirements of SanPiN and GOST . The remaining population partly or fully utilizes water from surface sources . Hence, the sustainable operation of water treatment facilities ensures the standard quality of the water .
Two settlements have irregular or scheduled water supply .
Water infrastructure deterioration in most settlements amounts to 60%-70% .
The urban population of Karaganda oblast amounts to 1,105,600 people, including 960,000 city residents and 145,600 urban-type settlement residents . The central water supply covers eleven cities and thirty-four settlements out of the existing eleven cities and thirty-nine settlements . The share of water users connected to the central water supply in the oblast varies from 18 .8% to 98 .8% . Five settlements fully or mostly use water from surface sources . Due to the high degree of surface water contamination and the considerable deterioration of water treatment facilities, the available water preparation technology appears to be ineffective in the spring and summer time and is sometimes incompliant with regulatory requirements .
The remaining settlements utilize water from underground sources . The quality of underground waters is mostly compliant with the standards fixed for drinking water, and water is distributed without pre-treatment .
Ten settlements have irregular or scheduled water supply . Due to lasting operation and the absence of timely flushing, a considerable part of the internal surface of the pipelines is corroded and encrusted, and water gets contaminated again when transported to water users .
Water infrastructure deterioration in most settlements amounts to 60%-70%, sometimes reaching 100% (e .g ., in the settlement of Novdolinsky, which has 6,600 residents) .
The findings on access to quality drinking water are based on the data obtained from water supply companies and local administrations, though the printed media repeatedly reported outbreaks of enteric fever in the cities of Temirtau, Shakhtinsk, and Abai, citing the water factor as the cause . Thus, the real situation concerning the access to quality drinking water in the cities and settlements may be a lot worse .
The urban population of Kostanai oblast amounts to 494,700 people, including �9�,�00 city residents and 101,500 urban-type settlement residents .
The number of the urban population with 24-hour access to quality drinking water in Zhambyl oblast amounts to 89.8% or 386,000 people.
The number of the urban population of West Kazakhstan oblast with 24-hour access to quality drinking water amounts to 96.9% or 252,500 people.
In Karaganda oblast, 997,400 people (90.2% of the urban population) have access to a permanent drinking water supply.

�0
UNDP ProjectNational Plan for Integrated Water Resources Management and Water Efficiency in Kazakhstan
ACCEss to DRINKINg WAtER AND sANItAtIoN IN thE REPUblIC of KAzAKhstAN
The central water supply covers five cities and eleven settlements out of the existing five cities and twelve settlements . The share of water users connected to the central water supply varies from 18% to 100% . Eight settlements fully or partially recover water from surface sources . Due to the high degree of surface water contamination and the considerable deterioration of water treatment facilities, the available water treatment appears to be ineffective, and the population, in particular that of the city of Arkalyk and the settlement of Kachar, utilizes water that is not always compliant with regulatory requirements . Water supply treatment facilities are in need of reconstruction, reconditioning, new operating procedures, and new chemical reagents .
Four settlements have irregular or scheduled water supply . Due to lasting operation and the absence of timely flushing, a considerable part of the internal surface of the pipelines is corroded and encrusted, and water gets contaminated again when transported to water users . Even considering the regularity of the supply in the city of Lisakovsk, the quality of water in the distribution network is not compliant with regulatory requirements and exceeds the admissible level of 5% .
Water infrastructure deterioration in most settlements amounts to 60%-70% .
The urban population of Kyzylorda oblast amounts to �6�,�00 people, including 198,000 city residents and 165,�00 urban-type settlement residents . The central water supply covers three cities and eleven settlements out of the existing three cities and twelve settlements . The share of water users connected to the central water supply varies from �� .4% to 100% .
The oblast’s urban population mostly utilizes surface waters, while settlement residents recover underground waters . The quality of underground waters in most settlements conforms to regulatory requirements thus rendering pre-treatment unnecessary .
Following the high degree of surface water contamination and the high deterioration level of water treatment facilities, the population of the city of Kyzylorda and Aralsk utilizes water incompliant with regulatory requirements . Water treatment facilities are in need of reconstruction and reconditioning .
Water infrastructure deterioration in all settlements exceeds 40%, reaching over 80% in five settlements (the settlement of Toretam, the city of Aralsk, the settlement of Shiyeli, etc .)
The findings on access to quality drinking water are based on the data obtained from water supply companies and local administrations, though the real situation regarding access to quality drinking water in the oblast settlements may be a lot worse . The settlement of Shiyeli was repeatedly cited by the media as an unfavorable environmental area, with non-quality water being one of the reasons for this .
The urban population of Mangistau oblast amounts to �68,600 people, including ��4,500 city residents and 44,100 urban-type settlement residents . The central water supply covers two cities and two settlements out of the existing three cities and six settlements . The share of water users connected to the central water supply varies from �4 .�% to 100% .
Water is supplied to the urban population by the Astrakhan-Mangyshlak water pipe and by means of water conversion . To satisfy the water quality requirements and in view of a large length of the Astrakhan-Mangyshlak water pipe, as well as the lasting period of source-to-user water transportation, the project initially provided for two-stage water treatment . The first stage involves the treatment of water from the river of Kigach at main treatment facilities . The second stage entails water treatment in the area of consumption . The quality of supplied water is compliant with regulatory requirements .
The number of the urban population in Kostanai oblast with 24-hour access to quality drinking water amounts to 74.4% (367,900 people).
In Kyzylorda oblast, the number of the population with 24-hour access to quality drinking water amounts to 22.6% or 82,100 people.
The number of the urban population with 24-hour access to quality drinking water in Mangistau oblast amounts to 64.5% (173,400 people).

�1
THE CURRENT STATE OF THE URBAN WATER SUPPLY AND SANITATION IN KAZAKHSTAN BY TECHNICAL SURVEY FINDINGS
Water infrastructure deterioration in four settlements exceeds 80% (e .g ., the city of Fort Shevchenko, the settlement of Munaishy) . Three settlements have water supplied to them by specialized trucks (the settlements of Zhetybai, Mangistau, and Kyzylsai) as intra-settlements’ distribution networks are lacking or in a state of emergency .
Moreover, three settlements (e .g ., the settlement of Tenge) with central supply systems have the water supplied by schedule . Due to lasting operation and the absence of timely flushing, a considerable part of the internal surface of the pipelines is corroded and encrusted, and water gets contaminated again when transported to water users .
The urban population of Pavlodar oblast amounts to 479,400 people, including 44�,500 city residents and �5,900 urban-type settlement residents . The central water supply covers three cities and four settlements out of the existing three cities and seven settlements . The share of water users connected to the central water supply varies from 19 .5% to 9� .�% .
Most settlements utilize surface waters . Following the high degree of surface water contamination, the high deterioration level of water treatment facilities, and the lasting operation of the distribution networks, the populations of the city of Ekibastuz and the settlement of Maikaien utilize water incompliant with regulatory requirements . Water treatment facilities are in need of reconstruction and reconditioning .
The urban population of North Kazakhstan oblast (NKO) is contained in five cities and amounts to ���,900 people . The central water supply covers all five cities . The share of water users connected to the central water supply varies from 6�% to 100% .
All five cities recover water from surface sources for household needs and drinking . Apart from the city of Petropavlovsk, which self-recovers water from the river of Ishim, the remaining settlements receive water from clustered water supply systems . The quality of water supplied is compliant with the standards fixed for drinking water .
Two settlements have irregular or scheduled water supply . Due to lasting operation and the absence of timely flushing, a considerable part of the internal surface of the pipelines is corroded and encrusted, and water gets contaminated again when transported to water users .
Water infrastructure deterioration in most settlements amounts to 50%-70%, reaching 100% in the city of Taiynsha .
The urban population of South Kazakhstan oblast (SKO) amounts to 818,000 people, including 760,900 city residents and 57,100 urban-type settlement residents . The central water supply covers seven cities and eight settlements out of the existing eight cities and eleven settlements . The share of water users connected to the central water supply varies from 18 .�% to 100% .
Sixteen settlements partly or fully recover water from underground sources, which are utilized by 77�,�00 urban residents or 94 .4% . The quality of the underground water is good and compliant with the regulatory requirements of SanPiN and GOST . The situation of people using water from surface sources is worse . Due to the high degree of contamination of surface water sources and the physical deterioration of treatment facilities, the populations of Saryagash, Shardary, and Lenger utilize water of non-standard quality for drinking .
Nine settlements have irregular or scheduled water supply . Due to lasting operation and the absence of timely flushing, a considerable part of the internal surface of the pipelines is corroded and encrusted, and water gets contaminated again when transported to water users .
In Pavlodar oblast, the number of the urban population with 24-hour access to quality drinking water amounts to 72.1% (345,700 people).
The number of the urban population with 24-hour access to quality drinking water in North Kazakhstan oblast amounts to 89.9% (210,400 people).
The number of the urban population with 24-hour access to quality drinking water in South Kazakhstan Oblast amounts to 67.5% (552,100 people).

��
UNDP ProjectNational Plan for Integrated Water Resources Management and Water Efficiency in Kazakhstan
ACCEss to DRINKINg WAtER AND sANItAtIoN IN thE REPUblIC of KAzAKhstAN
Water infrastructure deterioration in most settlements amounts to 60%-70%, reaching 100% (in the settlement of Saryagash) .
Regarding the population’s access to quality drinking water and regular water supply, such is provided to 55�,100 people or 67 .5% of the oblast’s urban population .
It may be concluded from an analysis of the current state of water utilities that the situation of water supply and water discharge systems in many cities and urban-type settlements is critical . If no effective measures are taken to prevent a crisis, this situation can negatively affect the water supply system within the next five or six years, and even completely destroy water supply and water discharge facilities, which represent comprehensive engineering and technical complexes . The cost of rehabilitation would be incommensurably high, and new construction work would be time-consuming . The critical situation that now exists may grow into a catastrophe .

��
4ThE CurrENT STATE oF rurAL WATEr SuppLy AND SANITATIoN IN KAzAKhSTAN by TEChNICAL SurvEy FINDINGS
According to the data of the Agency for Statistics of the Republic of Kazakhstan, at the end of 2004 the rural population amounted to 6,433,500 people, dispersed across fourteen oblasts in 7,440 settlements and auls. Nearly 60% of the population lives in settlements of over 1,000 residents, which makes the the solution of water supply issues much easier and reduces costs of 1 m3 of supplied water.
The number of administrative territorial units along with population numbers are shown in Table 4 .1 .
For this report, the total number of rural settlements was taken from the State Rural Development Program (SRDP) for �004-�006 . According to SRDP,
table 4.1. the rural population and its distribution
N OblastNumber of
settlements, items
Popula-tion,
‘000 ps .
Population distribution
regional centers settlements, auls
administrative units, items
population, ‘000 ps .
administrative units, items
population, ‘000 ps .
1 Akmola 705 �99 .78 5 �6 .10 700 �7� .68
� Aktobe 4�6 �0� .60 6 �7 .97 4�0 �64 .6�
� Almaty 811 1,106 .47 4 6� .80 807 1,04� .67
4 Atyrau 195 196 .1� 4 �� .86 191 16� .�6
5 East-Kazakhstan 818 598 .�9 9 7� .50 809 5�5 .89
6 Zhambyl �67 54� .95 8 110 .50 �59 4�� .45
7 West-Kazakhstan 498 �44 .�8 11 64 .60 487 �79 .68
8 Karaganda 496 ��1 .90 � 10 .6� 49� �11 .�7
9 Kostanai 750 418 .1� 10 55 .88 740 �6� .�5
10 Kyzylorda �70 �45 .8� 0 0 �70 �45 .8�
11 Mangystau 44 8� .91 0 0 44 8� .91
1� Pavlodar 449 �6� .0� 9 5� .05 440 �09 .97
1� North-Kazakhstan 740 4�7 .56 5 �6 .�8 7�5 �91 .18
14 South-Kazakhstan 871 1�8� .57 7 88 .�� 864 1,195 .�4
total: 7,440 6,433.51 81 651.60 7,359 5,781.91

�4
UNDP ProjectNational Plan for Integrated Water Resources Management and Water Efficiency in Kazakhstan
ACCEss to DRINKINg WAtER AND sANItAtIoN IN thE REPUblIC of KAzAKhstAN
the number of 7,660 administrative units included 1�6 entirely abandoned settlements and 8� settlements where residents are considered urban . Since the SRDP approval, some settlements have changed their status; some rural settlements have become urban, and some have ceased to exist . Table 4 .� presents comparative data on the numbers of rural settlements; data are provided by various organizations and departments .
During the normal functioning of water networks, some households equipped their houses with internal lavatories and baths . In some regions and oblasts, �0% or more of housing space was equipped with water pipes .
The rural water supply infrastructure, which was built primarily from 1960-1990, distinguished Kazakhstan from other developing countries . The availability of forecasting resources and explored groundwater resources determined the scheme of rural water supply development . In areas with water supply, local water networks were constructed .
In areas with limited water resources or predominately mineralized waters, such as in West Kazakhstan, Kostanai, Akmola, Atyrau, and Kyzylorda oblasts, group water supply systems 50 -�000 km long were constructed to serve hundreds of settlements . The overall length of such water supply systems reached 17,100 km, and they supplied water to 1,�76 rural settlements . Unique water pipelines operated for more than two decades . All of them were exploited with significant subsidies from the government .
A total of seventy-nine clustered water supply systems functioned across the country . Two thousand five hundred settlements had local water pipes totaling
table 4.2. the number of rural settlements according to various organizations
N Oblast The 1999 census
SPRD �00� Agency for Statistics of the RK
Cen
tre
for
Syst
emat
ic
Res
earc
h un
der
the
Pre
side
nt
Adm
inis
trat
ion
of th
e R
K, a
s of
�1
.1� .
�00�
Obl
ast g
over
nmen
ts
as o
f 01 .
01 .�
004 .
(a
ccep
ted
in th
is
repo
rt)
Tota
l re
view
ed
incl
udin
g ru
ral
sett
lem
ents
as o
f 01
.01 .
�004
as o
f 01
.01 .
�005
1 Akmola 7�9 689 675 710 688 714 705
� Aktobe 454 441 4�9 4�8 4�6 465 4�6
� Almaty 799 8�6 798 810 769 797 811
4 Atyrau 180 198 187 190 184 �00 195
5 East-Kazakhstan 846 857 857 855 8�6 970 818
6 Zhambyl �66 �8� �70 �67 �67 �51 �67
7 West-Kazakhstan 509 517 498 498 477 517 498
8 Karaganda 5�4 506 487 558 498 �9� 496
9 Kostanai 779 766 746 757 7�9 7�4 750
10 Kyzylorda �69 �74 �57 �69 �65 175 �70
11 Mangystau 49 40 �9 50 49 4� 44
1� Pavlodar 5�0 509 450 494 444 414 449
1� North-Kazakhstan 764 759 750 75� 741 765 740
14 South-Kazakhstan 896 896 888 9�� 874 894 871
Total: 7,684 7,660 7,441 7,681 7,�47 7,��1 7,440
During the normal functioning of water networks, some households equipped their houses with internal lavatories and baths. In some regions and oblasts, 30% or more of housing space was equipped with water pipes.

�5
THE CURRENT STATE OF RURAL WATER SUPPLY AND SANITATION IN KAZAKHSTAN BY TECHNICAL SURVEY FINDINGS
�9,000 km in length . In total, up to 65% of the country’s rural population had access to high quality drinking water; the figure reached 70% and 95% in specific regions and oblasts .
In the difficult period of Kazakhstan’s economic reforms, state financing of water supply system maintenance dropped sharply; consequently, the amount of construction and reconstruction of water supply systems was reduced as well .
According to the Agency for Statistics, at the end of �00�, the specific weight of overall housing square on average in the country was the following:
Water pipe 17% (fluctuations by oblast from �% to �8%);
Sewage 6% (1% -1�%)
Baths (showers) �% (1% – 5%)
Heating �% (from 0 .1% to 6%)
Gas 91% (from 65% to 95%)
Currently, not more than forty-six clustered water supply systems are functioning or being reconstructed . Based on information from oblast organizations and the actual useful life of the water supply systems, which exceeds �5-�0 years, it is obvious that systems 70% deteriorated .
Indicators for North Kazakhstan oblast represent an example, because this oblast used to have a clustered water supply trunk line which was foremost in terms of the length and number of serviced settlements:
1991 �000 �004
Length, km 5,68� .8 4,075 .0 �,958 .1
Number of serviced settlements 497 �90 16�
The current conditions of water supply are presented in Table 4 .� . The indicators by region and oblast are shown in the appendix . As the table suggests, 6� .9% of the population utilizes water from in-yard and common wells as well as from surface sources and delivered water . A central water supply system serves �,07� settlements .
Clustered water pipes are predominantly present in North Kazakhstan, Mangystau, and Atyrau oblasts . A small part of the population in Kyzylorda, Kostanai, Akmola, and East Kazakhstan oblasts is also served by clustered water supply systems due to the lack of local sources in some areas . In general, local water supply systems prevail .
Over the past �-� years, in the areas with insufficient water supply or with predominantly mineralized underground water, nearly 100 local water treatment facilities have been installed .
Due to the constantly deteriorating technical conditions of water distribution networks and facilities, the specific weight of non-standard tap water samples increases in terms of bacteriological indicators . According to the data of the Sanitary Epidemiological Station, the specific weight has reached 50% or more .
Presently, all existing boreholes and common wells intended for decentralized water supply are derelict . The specific weight of non-standard samples from decentralized water supply sources in terms of microbiological and chemical indicators frequently reaches 45%-55%, with the average national indicator amounting to �1 .5% .
In the period of Kazakhstan’s economic reforms, the amount of construction and reconstruction of water supply systems was reduced considerably, and in some years work was stopped completely.

�6
UNDP ProjectNational Plan for Integrated Water Resources Management and Water Efficiency in Kazakhstan
ACCEss to DRINKINg WAtER AND sANItAtIoN IN thE REPUblIC of KAzAKhstAN ta
ble
4.3
. sta
te o
f wat
er s
uppl
y of
rur
al s
ettl
emen
ts b
y th
e en
d of
20
04
№O
blas
t
Number of settlements
Number of population, ‘000 ps
Cen
tral
sup
ly c
over
age
Use
of w
ater
from
loca
l sou
rces
Use
of d
eliv
ered
w
ater
Length of water distribution
networks, km
Num
ber
of
sett
lem
ents
Pop
ulat
ion
with
acc
ess
to p
orta
ble
wat
er, ‘0
00 p
s
unde
rgro
und
surf
ace
Number of settlements
Num
ber
of
popu
latio
n,
‘000
ps
Num
ber
of
sett
lem
ents
Num
ber
of
popu
latio
n,
‘000
ps
Num
ber
of
sett
lem
ents
Num
ber
of
popu
latio
n,
‘000
ps
1A
kmol
a 70
5�9
9 .78
�78
178 .
46�5
719
6 .5�
6 .�6
4918
.5�
�,45
1 .0
�A
ktub
insk
4�6
�0� .
6071
98 .�
5�5
1�0
� .41
00
40 .
945�
0 .4
�A
lmat
y81
11,
106 .
47�9
157
� .4�
�5�
507 .
7655
�� .0
41�
� .�5
�,�1
4 .0
4A
tyra
u19
519
6 .1�
5068
.79
616�
.01
10 .
4�8�
64 .8
958
1 .9
5Ea
st K
azak
hsta
n81
859
8 .�9
���
164 .
��48
940
1 .50
67��
.�5
�0 .
��1�
01 .9
6Zh
amby
l�6
754
� .95
109
176 .
�5�5
1�6
4 .�1
10 .
4�6
1 .98
1,17
� .4
7W
est K
azak
hsta
n49
8�4
4 .�8
8110
� .61
�59
�01 .
8�44
�1 .7
514
8 .11
448 .
0
8K
arag
anda
496
��1 .
901�
�91
.68
�59
1�5 .
680
014
4 .54
9�� .
4
9K
osta
nai
750
418 .
1�11
61�
0 .4�
5��
�55 .
6��1
10 .4
17�
�1 .6
81,
611 .
5
10K
yzyl
orda
�70
�45 .
8�11
81�
7 .8�
1��
115 .
6511
1 .70
90 .
656�
� .1
11M
angy
stau
448�
.91
1��0
.94
��45
.61
00
87 .
�64�
.�
1�P
avlo
dar
449
�6� .
0�9�
85 .�
8��
716
7 .5�
�58 .
51�
0 .69
569 .
5
1�N
orth
Kaz
akhs
tan
740
4�7 .
5618
41�
9 .05
551
�84 .
0017
6 .�0
��8 .
�166
0 .�
14So
uth
Kaz
akhs
tan
871
1�8�
.57
�1�
�7� .
0649
�75
6 .66
5448
.51
11�
106 .
�51,
781 .
8
totA
l:7
,44
06
,43
3.5
12
,07
22
,31
9.3
64
,64
63
,68
8.0
73
06
16
9.4
84
14
25
6.5
91
4,8
20
.4
in %
of t
otal
num
ber
of to
tal n
umbe
r1
00
10
0.0
02
83
6.1
62
57
.34
2.6
64
.0

�7
THE CURRENT STATE OF RURAL WATER SUPPLY AND SANITATION IN KAZAKHSTAN BY TECHNICAL SURVEY FINDINGS
The most widespread indicators of poor water quality are a high content of salts, iron, manganese, and a high or low content of fluorine and other components that ensure safety, harmlessness, and organoleptic water characteristics .
Therefore, the current conditions of rural central water supply systems cannot be considered satisfactory .
The common factors that negatively affect the operation of all the systems and reduce water quality and accessibility are the following:
∆ high deterioration of distribution networks and facilities that in some cases have already worked out their useful life by 1 .5-� times . This leads to considerable water losses (up to �0%-40%) and, as a consequence, to high electrical energy costs and high prices for 1m� of water;
∆ secondary water pollution in the pipes by the output of bacterial activity and encrusted internal pipe surface;
∆ inadequate level of development and equipment, and in most cases lack of water pipe maintenance .
The insufficiency of public investments in both the construction of new water supply systems and the reconstruction of existing systems has almost transformed the technical issue into a financial and economic problem .
During the past �-4 years, specific attention has been paid to the issue of water supply to the population living in the country; this is confirmed by the size of sectoral investments:
2001 – 1.85 billion tenge;
2002 – 6.50 billion tenge;
2003 – 12.50 billion tenge;
2004 – 14.11 billion tenge.
The construction and reconstruction of water supply systems for the settlements are carried out according to the state sectoral program “Drinking Waters” and the State Rural Development Program . Pursuant to the programs, oblasts have developed appropriate regional programs . The activities are financed from national and local budgets as well as from external loans, grants, and the funds of economic entities . In �004, the project Rural Water Supply of Karaganda Oblast was launched on a loan from the Islamic Development Bank . A grant from Japan’s government was utilized for implementation of the project Water Supply of Rural Settlements in the Republic of Kazakhstan, i .e ., North Kazakhstan and Akmola oblasts .
However, the measures undertaken and the size of finances have failed to ensure sustainable improvement: the pace of water supply system deterioration is progressing .
The construction and reconstruction of water supply systems for the settlements are carried out according to the state sectoral program “Drinking Waters” and the State Rural Development Program.

�8
UNDP ProjectNational Plan for Integrated Water Resources Management and Water Efficiency in Kazakhstan
ACCEss to DRINKINg WAtER AND sANItAtIoN IN thE REPUblIC of KAzAKhstAN
Sanitation issuesThe lack of water and lasting water supply interruptions have predetermined extremely low sanitary, hygienic, and epidemiologic standards for the rural population .
Not much attention has been devoted to the construction of rural sanitation facilities due to the fact that water supply has been considered a priority issue . Sewage systems were built predominantly in the regional centers and larger settlements . Moreover, only the waste of administrative buildings, schools, hospitals, and multi-storied buildings has been disposed of . In rural settlements mainly the sewage waste disposal systems were installed; the sewage (floatable) system represented �%-5% of all the systems .
The data of the social survey, conducted by UNDP project, demonstrates that only � .8% of rural houses are connected to a central sewage system . On average, 5 .�% of interviewees have in-house lavatories, including 1 .7% with lavatories connected to central sewage systems, mostly wet pits . This proves yet again that the sanitation level in rural settlements is low .
The sanitary conditions of settlements, in view of forthcoming water supply costs, can initially be ameliorated without the installation of sewage systems, but just by improving individual lavatories and wet pits at public and industrial places .
table 4.4. the rural population’s access to drinking water
№ Oblast Population, ‘000 ps .Population with access to potable water
‘000 ps . % of total number
1 Akmola �99 .78 178 .46 44 .6
� Aktubinsk �0� .60 98 .�5 �� .5
� Almaty 1,106 .47 57� .4� 51 .8
4 Atyrau 196 .1� 68 .79 �5 .1
5 East Kazakhstan 598 .�9 164 .�� �7 .5
6 Zhambyl 54� .95 176 .�5 �� .5
7 West Kazakhstan �44 .�8 10� .61 �9 .8
8 Karaganda ��1 .90 91 .68 41 .�
9 Kostanai 418 .1� 1�0 .4� �8 .8
10 Kyzylorda �45 .8� 1�7 .8� 5� .0
11 Mangystau 8� .91 �0 .94 �6 .9
1� Pavlodar �6� .0� 85 .�8 �� .5
1� North Kazakhstan 4�7 .56 1�9 .05 �0 .�
14 South Kazakhstan 1,�8� .57 �7� .06 �9 .0
TOTAL: 6,4�� .51 �,�19 .�6 �6 .1
The lack of water and lasting water supply interruptions have predetermined extremely low sanitary, hygienic, and epidemiologic standards of life for the rural population. For the most part, the current state of water supply and sanitation in rural areas of Kazakhstan is considered unsatisfactory.

�9
THE CURRENT STATE OF RURAL WATER SUPPLY AND SANITATION IN KAZAKHSTAN BY TECHNICAL SURVEY FINDINGS
The current level of the rural population’s access to waterAccording to the results of a survey and analysis, �,�19,�60 people in rural areas have access to drinkable tap water: this is �6 .1% of the country’s total population . The analysis was conducted by administrative units, oblasts, and each settlement using defined water access criteria in accordance with the developed methodology .
Table 4 .4 illustrates the results of the analysis . Regional indicators are shown in the appendix .
The overall poor access level to water in the country and specific oblasts is explained by the poor technical conditions of water supply systems built �5-�0 years ago and earlier . Repair and rehabilitation work was limited due to poor financing . The equipment has become completely used up and is outdated .
In nine oblasts, including North Kazakhstan, West Kazakhstan, and Kostanai, water access is below the average national access level . Previously in these oblasts a considerable part of the population was supplied with water from clustered water supply systems . Currently, most of the systems are not fully operating, and some are not operating at all .
The data provided by the Yesil Su public enterprise, which operates clustered water supply systems in North Kazakhstan oblast, suggest that intra-settlement distribution networks, with rare exceptions, are inoperable not because of their impropriety, but rather for the sake of saving and because of the easiness of water tariff collection .
Since Yesil Su has a monopoly on the water supply sphere, it supplies water to wholesale consumers only when presented with a permit from the country’s antimonopoly department . Wholesale buyers are responsible for water intake at the end of the clustered water supply system, or so-called water supply points, and for the retail sale of water to the local population .
Moreover, a big portion of the rural population connected to the water supply system has no access to drinking water .
On the 19th of April �005, a round table was held in the Mazhilis of the Parliament of the Republic of Kazakhstan on the Progress on Implementation of the Drinking Waters Program . The participants stated that 54 .�% of the country’s rural population receives water from central supply systems . Officially, this proportion of the population was considered to have access to drinking water . The real picture suggests that this part of the rural population receives water by schedule and sometimes on an hourly basis, with different levels of water access .
Concerning the networks of operating pipes, up to 80% of standpipes are inoperable or disassembled; distribution networks require urgent replacement . A number of the settlements surveyed by the report’s authors--from North Kazakhstan, Akmola, and Karaganda oblasts--can serve as examples .
the settlement of smirnovo, a regional centre of the Akkaiyn region, North Kazakhstan oblast. The population consists of 6,600 people . The settlement is connected to the Bulayevsky clustered water pipe . The settlement networks are almost out of service . The water is sold at six water supply points, and from these points it is transported to houses in buckets, trolleys, or horses at distances of 1-� km . Private enterpreneurs have negotiated water delivery to the households by truck; they also pour the water into tanks .
the settlement of Priishimskoye, in osakarov region, Karaganda oblast. The water supply system is managed by a farm . Water supply is irregular because the system, built over twenty-five years ago, is in poor technical condition . A great number of standpipes are not operating or are
Moreover, a big portion of the rural population connected to the water supply system has no access to drinking water.
Concerning the networks of operating pipes, up to 80% of standpipes are inoperable or disassembled; distribution networks require urgent replacement.
Water transportation by horse, Smirnovo settlement, North Kazakhstan oblast
In rural areas, 2,319,360 people (36.1% of the country’s population) have access to clean tap water.
In nine oblasts, including North Kazakhstan, West Kazakhstan, and Kostanai, water access is below the average national access level.

40
UNDP ProjectNational Plan for Integrated Water Resources Management and Water Efficiency in Kazakhstan
ACCEss to DRINKINg WAtER AND sANItAtIoN IN thE REPUblIC of KAzAKhstAN
fully disassembled . Some wells are totally flooded with water . Even though many households installed in-house water connections, some streets are not supplied with water as not all of the networks operate .
Similar situations exist throughout the republic, including in the settlements of Malyi barap of Akmola oblast and litvinskoye of Karaganda oblast. Obviously, with water supply in such a state, the official figure reporting that 54 .�% of people have access to water seems to be an overstatement .
Taking all of this into account, we may conclude that the current level of the population with access to drinking water is more objectively reflected by the figure of �6 .1%, which was obtained by the technical survey .
An analysis of the current conditions of water supply certifies an extremely low level of drinking water supply to the rural population . Because of the unsatisfactory technical conditions of trunk lines and intra-settlement distribution networks, the central water supply from most clustered water supply systems is not guaranteed . The existing scheme of water supply for 64% of the population is based on decentralized local sources . At the same time, drinking needs are satisfied by in-yard and common wells, delivered water, and the surface water of rivers, lakes, and small water sources .
Wells are usually located close to wet pits, cesspools, and places frequented by cattle . This poses the danger of bacterial water contamination and, as a consequence, the outbreak of infections related to the aquatic transfer factor . In addition, perched water (the upper layer of ground water) that feeds the wells has limited resources, so the guaranteed supply of drinking water of necessary quantity is problematic . In addition, water quality deteriorates from excessive mineralization and a high hardness level, both of which are due to a high level of fluoride, iron, and other elements that have an adverse effect on human health .
Therefore, considering the complexity, significance, and omnitude of water supply and sanitation issues, it is necessary to move away from rigid uniform standards of water consumption rates and determine more flexible criteria dictated by the new economic conditions of the market .
Expected rural water access level required to achieve the MDG on water and sanitationDue to the existing critical conditions of drinking water supply systems in the country, and in order to improve the health of citizens of the Republic of Kazakhstan, in �00� the government adopted the Sectoral Program Drinking Waters for �00�-�010 (Government Decree No . of �� .01 .0�) .
The main goal of the “Drinking waters” program is to provide the population with a sustainable supply of drinking water in necessary quantity and guaranteed quality .
The total volume of investments into the implementation of planned activities was set at 11 billion tenge . The funds were planned to be allocated from the national and local budgets, external loans, grants, and other sources .
The implementation of the program’s activities was planned in two stages: Stage I (�00�-�005) and Stage II (�006-�010) .
In �004, the State Rural Development Program for �004-�010 was launched after being approved by the Presidential Decree of the Republic of Kazakhstan No . 1149 on 10 July �00� . Both the construction and reconstruction of water supply systems are carried out according to these programs .
Between �00� and �004, local water treatment stations were installed in eighty-six settlements .
The main goal of the “Drinking waters” program is to provide the population with a sustainable supply of drinking water in necessary quantity and guaranteed quality.
The current level of the population with access to drinking water is more objectively reflected by the figure of 36.1%, which was obtained by the technical survey.

41
THE CURRENT STATE OF RURAL WATER SUPPLY AND SANITATION IN KAZAKHSTAN BY TECHNICAL SURVEY FINDINGS
Among the activities on the establishment of new technological manufactures and on improvement of quality and quantity in the cities of Almaty, Atyrau, Kyzylorda, Uralsk, and Karaganda enterprises for the production of polyethylene pipes were founded; and the production of water-measuring devices and water treatment installations was opened up .
Over �00� and �004, some �� .� billion tenge was utilized for the implementation of the program’s activities on water supply to the urban and rural population, including:
National budget – 16.8 billion tenge;
local budgets – 11.81 billion tenge;
Economic entities – 2.57 billion tenge;
External grants and loans – 2.02 billion tenge.
The investment projects implemented over this period to supply water to specific rural settlements were taken into account when calculating the current access level to drinking water . Some 17 .77 billion tenge was utilized for urban and rural water supply activities from all financing sources, including � .�6 billion tenge for the construction and reconstruction of clustered water supply systems to supply water to rural settlements . The water pipes are listed in Table 4 .5 .
This year, the first stage of the Drinking Waters Program will be completed. With the funds intended for 2005, a total of 50.97 billion tenge will be spent on program implementation.
table 4.5. the list of clustered water supply systems under construction or reconstruction.
№ Oblast Name of water pipe Activity type Allocated funds, million tenge
1 Akmola Seletinsky Reconstruction 50 .0
Nurinsky Reconstruction 1�0 .0
� Atyrau Kulsary-Turguzba-Shokpartugai-Akkiztogai
Reconstruction 144 .65
Koyandinsky Construction 100 .0
Koskulak-Tasshagyl Construction 50 .0
� Almaty Turgensky (line II) Reconstruction 115 .�8
4 East Kazakhstan Belagachsky (line II) Reconstruction 50 .0
5 West Kazakhstan Kamensky – a set of stations for drinking water treatment
Construction 150 .0
6 Kyzylorda Aralo-Sarybulaksky ( line IV) Construction �50 .0
Aralo-Sarybulaksky ( line V) Construction 5� .0
Oktyabrsky Construction 17 .�
Zhidelinsky Construction 150 .0
7 North Kazakhstan Bulayevsky ( line II) Reconstruction �50 .0
Ishimsky ( line II) Reconstruction �55 .�4
Sokolovsky ( line II) Reconstruction �50 .0
Presnovsky ( line I-II) Reconstruction �75 .6
8 South Kazakhstan Kentau-Turkestansky Reconstruction 400 .0
9 Kostanai Zhelkuarsky Reconstruction 180 .0
Ishimsky Reconstruction 50 .0
Ashi-Tastinsky Reconstruction 150 .0

4�
UNDP ProjectNational Plan for Integrated Water Resources Management and Water Efficiency in Kazakhstan
ACCEss to DRINKINg WAtER AND sANItAtIoN IN thE REPUblIC of KAzAKhstAN
table 4.6. Rural water supply system construction and reconstruction
№ Oblast Number of settlements
with central water supply as of
01 .01 .�005
Settlement input
�005 �006-�008 �009-�010
1 Akmola 705 �78 �6 194 80
� Aktubinsk 4�6 71 6 66 40
� Almaty 811 �91 �4 99 70
4 Atyrau 195 50 �0 �7 �1
5 EKO 818 ��� 19 118 75
6 Zhambyl �67 109 14 1�0 57
7 WKO 498 81 �1 84 �6
8 Karaganda 496 1�� �� 96 54
9 Kostanai 750 116 10 78 50
10 Kyzylorda �70 118 �5 �8 ��
11 Mangistau 44 1� 8 �� 5
1� Pavlodar 449 9� 16 1�0 60
1� NKO 740 184 �4 180 98
14 SKO 871 �1� �4 ��5 111
totAl: 7,440 2,072 279 1,498 770
The national budget is planned to be utilized for the construction of local water supply systems in forty-three UTSs and the reconstruction of the systems in thirty-four UTSs . In view of all financing sources, the activities for the improvement of the state of water supply will be implemented in �79 settlements . The oblast indicators are listed in Table 4 .6 .
The number of settlements is given along with the lists of investment projects prepared by oblast administrations . The size of financing planned for such objectives amounts to 9 .409 billion tenge, i .e ., over half of finances are planned to be allocated for rural water supply facilities . The data on sources and oblasts are listed in the Table 4 .7 below .
This year, the first stage of the Drinking Waters Program will be completed . With the funds intended for �005, a total of 50 .97 billion tenge will be spent on program implementation .
On �9 March �005, the government of the Republic of Kazakhstan reviewed the progress of the implementation of the Drinking Waters Program for �00�-�010 . In accordance with the output, the appropriate ministries and oblast administrations were instructed to do the following:
∆ modify and update the program in view of the priority investment ranking of areas with the lowest water-supply;
∆ take measures on the timely and efficient utilization of funds intended for supplying the population with quality drinking water;
∆ take necessary measures and launch the existing and newly-installed water supply facilities into operation .
The decision to modify the program was also due to the introduction of a new Water Code of the Republic of Kazakhstan and adoption of State Rural

4�
THE CURRENT STATE OF RURAL WATER SUPPLY AND SANITATION IN KAZAKHSTAN BY TECHNICAL SURVEY FINDINGS
Development Program . In addition, MA RK educed and identified the factors that hold back the implementation of the program:
∆ poor quality of pre-design and design estimates;
∆ shortcoming of the legislation on public procurement, which causes an unreasonable decrease in the cost of construction and reconstruction work done to drinking water supply facilities ;
∆ complicated procedure of identifying contractors and service suppliers;
∆ poor operating efficiency of clustered water supply systems following the lack or poor technical conditions of distribution networks .
In �00�, within the development of Regional Infrastructure Development Priorities in the Republic of Kazakhstan to the year �010, the Centre of Systematic Studies of the Presidential Administration of the Republic of Kazakhstan prepared a document dedicated to the state and investment needs of Kazakhstan’s drinking water supply sector . It was determined that ��8 billion tenge would be needed to develop systems of drinking water supply .
In view of the above-mentioned factors, the program, subject to proposals submitted by the Committee for Water Resources, was slightly modified and updated in terms of the progress and outcomes of the first stage of implementation . This was done to significantly increase budget funds for the second stage of implementation (�006-�010) . To improve the state of the country’s water supply, funds of around �55 .� billion tenge are needed over this period . The preliminary data on oblasts and financing sources are represented in Table 4 .8 .
In May �005, the program was submitted to all concerned ministries, departments, and oblast administrations . A number of amendments,
table 4.7. the size of investments and financing sources for rural water supply systems in 2005 (million tenge)
N Oblast Total by sources of financing
National budget Local budget Funds from economic entities
External grants and loans
1 Akmola 59� .04 �00 .00 9� .09 40 .59 159 .�6
� Aktubinsk �11 .51 �9� .51 18 .00 0 0
� Almaty 547 .�9 ��7 .07 �10 .�� 0 0
4 Atyrau 779 .59 598 .59 0 181 .00 0
5 East Kazakhstan 456 .05 �4� .04 �1� .01 0 0
6 Zhambyl 55� .�� ��7 .45 �15 .88 0 0
7 West Kazakhstan 955 .4� 798 .0� 157 .40 0 0
8 Karaganda 8�1 .0� 176 .�5 48 .10 0 606 .67
9 Kostanai �80 .00 �80 .00 0 0 0
10 Kyzylorda 80� .�� 606 .60 195 .7� 0 0
11 Mangistau 195 .�1 0 154 .51 40 .80 0
1� Pavlodar 47� .64 �18 .07 154 .57 0 0
1� North Kazakhstan 1,759 .56 1�69 .80 ��0 .40 0 159 .�6
14 South Kazakhstan 771 .8� �97 .5� ��7 .40 0 146 .90
total in the country 9,408.92 5,955.93 2,118.30 262.39 1,072.29
Malyi Barap settlement, Akmola oblast

44
UNDP ProjectNational Plan for Integrated Water Resources Management and Water Efficiency in Kazakhstan
ACCEss to DRINKINg WAtER AND sANItAtIoN IN thE REPUblIC of KAzAKhstAN ta
ble
4.8
. fi
nan
cin
g so
urce
s by
obl
asts
(cit
ies,
tow
ns,
an
d ru
ral s
ettl
emen
ts) p
rovi
ded
wit
hin
the
sect
oral
pro
gram
Dri
nki
ng
Wat
ers
for
20
02
-20
10
№N
ame
of o
blas
t
Nat
iona
l bud
get (
mill
ion
teng
e)Lo
cal b
udge
t (m
illio
n te
nge)
Pla
nned
fu
nds,
m
illio
n te
nge
�006
�007
�008
�009
�010
Pla
nned
fu
nds,
m
illio
n te
nge
�00�
�00�
�004
�005
�010
1A
kmol
a7,
048 .
651,
�9� .
941,
177 .
181,
�55 .
77�,
�10 .
1991
� .57
7,96
8 .5�
1,�7
8 .68
1,�9
9 .48
1,85
� .89
�,46
� .�9
97� .
08
�A
ktub
insk
4,98
6 .91
1,1�
5 .7�
1,07
� .75
975 .
119�
9 .68
88� .
655,
�17 .
611,
�00 .
�71,
14� .
891,
0�9 .
7799
1 .��
94� .
�5
�A
lmat
y1�
,790
.1�
�,4�
� .�0
1,74
7 .47
�,98
� .47
�,0�
6 .4�
�,59
0 .56
1�,6
�8 .�
7�,
594 .
551,
86� .
�5�,
180 .
�5�,
��7 .
78�,
76� .
�4
4A
tyra
u4,
919 .
9�1,
�16 .
781,
176 .
7�85
� .98
810 .
8976
1 .54
5,�4
6 .17
1,40
4 .10
1,�5
4 .76
910 .
6186
4 .66
81� .
04
5Ea
st K
azak
hsta
n5,
980 .
551,
498 .
��1,
40� .
711,
058 .
101,
01� .
161,
008 .
�57,
�99 .
�51,
597 .
691,
440 .
111,
617 .
4�1,
469 .
��1,
174 .
79
6Zh
amby
l4,
458 .
7467
4 .50
91� .
8�1,
��4 .
7�97
9 .8�
655 .
864,
754 .
4�71
9 .��
974 .
4�1,
�16 .
601,
044 .
8169
9 .�6
7W
est
Kaz
akhs
tan
1,85
� .�6
�81 .
98�9
0 .�8
�77 .
00�6
� .48
�41 .
5��,
076 .
�850
7 .�1
416 .
�740
� .00
�86 .
5��6
4 .17
8K
arag
anda
8,57
5 .80
�,07
� .86
1,8�
6 .58
1,7�
� .57
1,5�
� .69
1,4�
1 .10
9,8�
7 .9�
�,90
� .75
1,94
7 .71
1,84
7 .46
1,6�
� .66
1,51
5 .�4
9K
osta
nai
4,54
0 .78
916 .
0081
� .85
1,01
9 .75
904 .
9588
7 .��
4,84
1 .89
976 .
7486
6 .75
1,08
7 .�7
964 .
9694
6 .07
10K
yzyl
orda
�,69
� .46
980 .
957�
4 .��
7�7 .
7�75
6 .64
50� .
9��,
884 .
061,
046 .
007�
� .�4
77� .
7�80
6 .8�
5�6 .
�7
11M
angi
stau
4,97
0 .97
1,�8
6 .�6
96� .
�99�
4 .04
901 .
5979
6 .79
5,�0
0 .6�
1,47
8 .19
1,0�
6 .10
985 .
��96
1 .�8
849 .
6�
1�P
avlo
dar
�,�5
1 .0�
608 .
8548
9 .�4
�67 .
9���
6 .44
448 .
57�,
4�0 .
�764
9 .71
69� .
�970
1 .78
71� .
1�67
4 .47
1�N
orth
K
azak
hsta
n4,
160 .
�795
7 .97
898 .
4490
1 .5�
790 .
0961
� .�5
�,5�
� .��
508 .
5045
8 .0�
461 .
�144
� .55
65� .
85
14So
uth
Kaz
akhs
tan
17,0
15 .4
��,
�46 .
�1�,
496 .
58�,
454 .
00�,
576 .
80�,
141 .
7�18
,0�4
.1�
�,45
8 .�9
�,7�
8 .45
�,68
� .05
�,81
4 .�6
�,�5
0 .07
Tota
l in
the
coun
try
87,�
44 .9
718
,99�
.65
17,0
9� .�
517
,964
.68
18,�
�0 .8
514
,964
.54
94,1
5� .7
��0
,4��
.11
17,8
�� .8
519
,859
.57
19,7
8� .4
716
,�5�
.7�

45
THE CURRENT STATE OF RURAL WATER SUPPLY AND SANITATION IN KAZAKHSTAN BY TECHNICAL SURVEY FINDINGS
tabl
e 4
.8.
con
tin
ued
№N
ame
of o
blas
t
Econ
omic
ent
ities
(mill
ion
teng
e)Lo
ans
and
gran
ts (m
illio
n te
nge)
Pla
nned
fu
nds,
m
illio
n te
nge
�006
�007
�008
�009
�010
Pla
nned
fu
nds,
m
illio
n te
nge
�00�
�00�
�004
�005
�010
1A
kmol
a�,
905 .
5775
7 .9�
865 .
9�8�
9 .�4
917 .
5�5�
4 .95
�,�0
� .9�
67� .
�457
5 .65
618 .
�14�
6 .7�
0 .00
�A
ktub
insk
�,9�
� .�8
659 .
916�
8 .86
571 .
6�54
4 .99
518 .
000 .
000
00
00 .
00
�A
lmat
y6,
141 .
�11,
4�6 .
�51,
0�4 .
�81,
141 .
681,
0�0 .
�01,
518 .
601,
499 .
040
14� .
6960
6 .67
749 .
670 .
00
4A
tyra
u�,
884 .
1077
1 .91
689 .
8150
0 .61
475 .
�544
6 .4�
0 .00
00
00
0 .00
5Ea
st K
azak
hsta
n4,
474 .
7087
8 .��
85� .
1791
� .�7
917 .
�791
� .46
�,85
4 .40
016
0 .00
544 .
001,
11� .
601,
0�6 .
80
6Zh
amby
l�,
614 .
04�9
5 .70
5�5 .
697�
� .80
574 .
�8�8
4 .47
0 .00
00
00
0
7W
est
Kaz
akhs
tan
1,08
6 .46
��� .
9���
8 .85
��1 .
00�1
� .49
�00 .
�00 .
000
00
00
8K
arag
anda
5,�0
8 .��
1,49
6 .16
1,07
0 .75
1,01
5 .64
89� .
618�
� .06
749 .
6774
9 .67
00
00
9K
osta
nai
�,66
1 .8�
5�6 .
9647
6 .50
597 .
785�
0 .49
5�0 .
100 .
000
00
00
10K
yzyl
orda
�,16
� .48
575 .
044�
4 .54
4�4 .
5444
� .55
�94 .
810 .
000
00
00
11M
angi
stau
�,91
4 .0�
81� .
6456
4 .10
541 .
685�
8 .5�
467 .
080 .
000
00
00
1�P
avlo
dar
1,8�
0 .84
�56 .
91�8
0 .59
�80 .
78�5
6 .�0
�56 .
�6�,
854 .
400
160 .
0054
4 .00
1,11
� .60
1,0�
6 .80
1�N
orth
K
azak
hsta
n�,
09� .
7844
7 .��
451 .
0�41
0 .17
4�6 .
�5�5
8 .90
�,�0
� .9�
67� .
�457
5 .65
618 .
�14�
6 .7�
0
14So
uth
Kaz
akhs
tan
7,16
5 .5�
78� .
501,
474 .
071,
406 .
5�1,
659 .
7418
41 .7
0�,
098 .
9446
8 .�5
575 .
6561
8 .�1
4�6 .
7�0
Tota
l in
the
coun
try
48,1
66 .�
710
,1��
.59
9,66
7 .�7
9,67
8 .4�
9,50
9 .96
9,18
8 .0�
14,6
64 .�
1�,
564 .
41�,
189 .
6��,
549 .
614,
�87 .
07�,
07� .
60

46
UNDP ProjectNational Plan for Integrated Water Resources Management and Water Efficiency in Kazakhstan
ACCEss to DRINKINg WAtER AND sANItAtIoN IN thE REPUblIC of KAzAKhstAN
table 4.9. Planned financial resources for the implementation of the second stage of the Drinking Waters Program
Name of oblastTotal
in �006-�010 (billion, tenge)
financial resources by years (billion tenge)
�006 �007 �008 �009-�010
Akmola 11 .97 4 .44 4 .00 � .09 0 .44
Aktubinsk 4 .9� 0 .76 1 .16 1 .06 1 .95
Almaty 4 .�6 1 .11 0 .85 1 .�6 1 .04
Atyrau 7 .�7 � .�6 1 .81 1 .97 1 .��
East Kazakhstan 9 .57 1 .04 1 .5� 1 .70 5 .�1
Zhambyl 6 .56 0 .9� 1 .�6 1 .68 � .60
West Kazakhstan � .8� 1 .49 0 .6� 0 .99 0 .7�
Karaganda 8 .08 � .11 � .4� � .09 1 .46
Kostanai 7 .6� 1 .59 1 .67 1 .40 � .97
Kyzylorda 9 .16 1 .88 1 .84 � .15 � .�9
Mangistau 0 .5� 0 .�7 0 .1� 0 .07 0 .05
Pavlodar 11 .9� 1 .�� 1 .89 � .7� 6 .00
North Kazakhstan 9 .96 � .46 � .�6 � .14 � .10
South Kazakhstan �� .57 � .05 � .59 7 .10 9 .8�
Country’s total 119.34 24.80 25.12 30.42 39.0
modifications, and remarks were made; these were mostly related to the program’s budget, water tariffs and subsidizing, and the lack of local budget funds . Once all necessary amendments are made, the Program will be submitted to the government for consideration .
When defining the term required for possible achievement of the MDG on water and sanitation in Kazakhstan, a goal was set to identify the number of the population that would be able to receive access to drinking water by the end of �010, once the Drinking Waters Program and the State Rural Development Program are implemented .
A calculation was made on the basis of specific settlements included in the list of investment projects in the context of regions and oblasts . A set of investment projects and financial volumes on the accounts of the national and local budgets was adopted by the Committee for Water Resources, based on the data of medium-term and long-term programs of oblast administrations .
The volume of investments in the form of loans and grants was accepted upon the data of the Committee for Water Resources along with the implemented projects . The planned financial resources in the regional and oblast context are outlined in the appendix, while the overall national data is represented in Table 4 .9 .
The aggregate volume of financial resources over �006-�010 in the rural water supply sector is set in the amount of 119 .�4 billion tenge .
The calculation results of the forecasted oblast access level in the regional context are given in the appendix, while the national data is represented in Table 4 .10 .
The aggregate volume of financial resources over 2006-2010 in the rural water supply sector is set in the amount of 119.34 billion tenge.

47
THE CURRENT STATE OF RURAL WATER SUPPLY AND SANITATION IN KAZAKHSTAN BY TECHNICAL SURVEY FINDINGS
tabl
e 4
.10
for
ecas
ted
leve
l of t
he R
ural
Pop
ulat
ion
’s A
cces
s to
Dri
nki
ng
Wat
er
№O
blas
t
Population as of 1 .01 .�004, (ps .)
Population with access to potable
water as of 1 .01 .�005, (ps .)
Pop
ulat
ion
with
acc
ess
to p
otab
le w
ater
(in
% o
f tot
al p
opul
atio
n)
as of 1 .01 .�005
�005 increase in number of
people
as of 1 .01 .�006
�006 increase in number of
people
as of 1 .01 . �007
�007increase in number of
people
as of 1 .01 .�008
�008 increase in number of
people
as of 1 .01 .�009
�009 increase in number of
people
as of 1 .01 .�010
�010 increase in number of
people
as of 1 .01 .�011
1A
kmol
a�9
9,77
717
8,46
�44
.615
,70�
48 .6
46,1
9660
.1�1
,457
68 .0
��,�
067�
.610
,000
76 .1
11,6
9179
.0
�A
ktub
insk
�0�,
60�
98,�
5���
.54,
���
�� .9
16,4
51�9
.�19
,849
45 .9
�7,�
9�54
.9�1
,0��
61 .9
�0,1
0071
.8
�A
lmat
y1,
106,
468
57�,
417
51 .8
��,7
�854
.865
,056
60 .7
6�,5
5466
.464
,�56
7� .�
�0,�
1075
.0�4
,000
78 .0
4A
tyra
u19
6,11
768
,790
�5 .1
9,64
840
.0�8
,749
54 .7
�0,9
6165
.�11
,807
71 .4
5,00
07�
.96,
�56
77 .�
5Ea
st
Kaz
akhs
tan
598,
�89
164,
��0
�7 .5
�8,9
�7��
.��9
,499
�7 .�
75,1
�649
.855
,4�6
59 .0
�4,�
466�
.1��
,1�0
67 .0
6Zh
amby
l54
�,95
417
6,�5
0��
.511
,177
�4 .5
�4,1
1��9
.0�9
,4�5
46 .�
57,0
�756
.7�6
,7�4
6� .5
65,1
4475
.5
7W
est
Kaz
akhs
tan
�44,
�8�
10�,
606
�9 .8
�6,7
6��7
.6��
,�56
46 .9
�7,�
�554
.9�5
,�94
6� .�
18,5
0067
.6�0
,060
7� .5
8K
arag
anda
��1,
901
91,6
7841
.�11
,0��
46 .�
1�,1
615�
.�1�
,���
57 .8
11,�
576�
.810
,800
67 .7
15,7
0074
.8
9K
osta
nai
418,
1�9
1�0,
4�1
�8 .8
�,4�
5�9
.6�8
,7�6
�6 .5
��,4
604�
.11�
,110
45 .�
40,5
��54
.94�
,5��
65 .1
10K
yzyl
orda
�45,
8�8
1�7,
8�1
5� .0
16,6
8�58
.811
,997
6� .7
7,55
166
.78,
8��
70 .�
8,00
07�
.68,
479
77 .0
11M
angi
stau
8�,9
07�0
,94�
�6 .9
8,��
�46
.71�
,014
6� .�
9,0�
�7�
.010
,079
85 .0
1,�0
086
.4�,
�64
89 .�
1�P
avlo
dar
�6�,
018
85,�
84��
.54,
670
�4 .�
19,5
7441
.8��
,11�
50 .�
��,4
546�
.6�1
,890
74 .8
�4,4
6�88
.0
1�N
orth
K
azak
hsta
n4�
7,56
11�
9,05
1�0
.��1
,790
�7 .6
��,�
5745
.�4�
,41�
55 .�
41,7
8065
.1�7
,�64
71 .5
�6,0
0079
.9
14So
uth
Kaz
akhs
tan
1,�8
�,57
1�7
�,05
6�9
.0�8
,800
�1 .�
89,1
00�8
.�77
,�00
44 .�
19�,
�80
59 .�
177,
800
7� .1
14�,
684
84 .�
Tot
al6,
4��,
505
�,�1
9,�6
��6
.1��
�,91
0�9
.745
0,15
846
.747
�,78
954
.057
4,51
�6�
.044
�,�7
969
.947
�,68
477
.�
In S
outh
Kaz
akhs
tan
obla
st th
e de
crea
se in
the
num
ber
of r
ural
pop
ulat
ion
is e
xpla
ined
by
the
mer
ge o
f som
e ru
ral s
ettle
men
ts w
ith S
hym
kent
city
.

48
UNDP ProjectNational Plan for Integrated Water Resources Management and Water Efficiency in Kazakhstan
ACCEss to DRINKINg WAtER AND sANItAtIoN IN thE REPUblIC of KAzAKhstAN
Depending on whether complete financial support is given to the program by the end of �010, 77 .�% of the country’s rural population may be provided with tap water in the necessary quantity and of secure quality as shown in the figure 4 .� . �� .8% of the population will be supplied with water from decentralized systems, and local budgetary funds will provide for the improvement of the systems’ conditions .
The figure below reflects the forecasted growth of the population’s access level to drinking water in accordance with the calculations made .
At present, 6� .9% of the rural population has no access to drinkable tap water . The MDG provides for cutting this amount in half, meaning that at least 68% of the country’s population shall have access to clean drinking water .
The calculation made suggests that by the end of �009, 69 .9% of the rural population will have access to drinkable tap water, and therefore the MDG will be attained .
The investment in the construction and reconstruction of water supply systems shall be at the level of 105-110 billion tenge (�005 included) . As Table 4 .7 shows, Almaty, East Kazakhstan, Zhambyl, and Kyzylorda oblasts have a �%-�% gap, while the gap of Aktubinsk oblast varies from 4%-5% . A major gap (9 .5%) occurs in Kostanai oblast . In all of the oblasts mentioned, the MDG may be attained by the end of �010 .
Hence, specific costs will amount to the following:
per rural resident on average 18,500 tenge
per resident who additionally received access to drinking water 54,600 tenge
per resident with access to drinking water in accordance with MDG �7,�00 tenge
All of the specific costs above are comparable with specific indicators of proxy objects (see Table 4 .11) . As a consequence, the planned financial resources for �006-�010 will suffice to improve the state of the water supply of 68% of the rural population; this will help to attain the MDGs .
The pace of sector investment growth suggested by the oblasts seems rather unrealistic in the time frame of the next 1-� years, as prepared pre-design documentation and design estimates are lacking, and the construction sector basis is underdeveloped, among other reasons . Subject to the solution of the above-mentioned issues, the pace of the investment project’s implementation planned by sectoral programs may be achieved . It is necessary to emphasize that even with a less intensive ramp up of the construction volumes planned by the programs, MDGs may be attained by �01�-�01� . This is illustrated by the figures .
The �006 budget for the rural water supply sector has not been finalized yet . The assumption is that it can reach the level of 1� .51 billion tenge . There is another assumption regarding the preservation of the pace of �005-�006, i .e ., annual investment growth will come to four billion tenge, meaning that the MDG may be attained by the end of the decade . This was exactly the goal set in the speech given by the President of Kazakhstan, N . Nazarbaev, at the Second Civil Forum in Astana on 1� September �005 .
Rather realistic but somewhat pessimistic scenarios of a 10% growth of investment volumes, beginning in �005 or �006, predetermine the achievement of the MDG by �011 and �01� accordingly .
Figure 4 .1 Population with access to potable tap water
Figure 4 .� Forecasted growth of the population’s access level to potable water
Predicted levels
Akm
ola
Akt
ubin
skA
lmat
yA
tyra
uEa
st K
azak
hsta
nZh
amby
lW
est K
azak
hsta
nK
arag
anda
Kos
tana
iK
yzyl
orda
Man
gist
auP
avlo
dar
Nor
th K
azak
hsta
nSo
uth
Kaz
akhs
tan
Cou
ntry
’s ov
eral
l

49
THE CURRENT STATE OF RURAL WATER SUPPLY AND SANITATION IN KAZAKHSTAN BY TECHNICAL SURVEY FINDINGS
table 4.11 list of proxy objects
Name of facilityConstruction cost, million
tenge
Number of residents,
people
Specific cost, thousand
tenge/resident
Almaty oblast
1 . Repair and rehabilitation operations in the settlement of Mynbaevo, Zhambyl region �0 .6 �,000 6 .87
� . Reconstruction and construction of the water supply system of the Alakol settlement, Balkhash region �6 .76 759 48 .4�
� . Reconstruction and construction of the water supply system of the Bekbolat Ashekeyev settlement, Karasay region 7� .�0 �,�8� �� .0
4 . Reconstruction and construction of the water supply system of the Kamyskala settlement, Alakol region 46 .�� 1,608 �8 .8
Akmola oblast
1 . Reconstruction of the water supply system from the underground source of the Turgai settlement, Yereimentau region �0 .98 1,550 19 .80
East Kazakhstan oblast
1 . Reconstruction of the water and sewage network of the Urdzhar settlement 81� .61 18 .9 4� .05
West Kazakhstan oblast
1 . Reconstruction of the water supply system of the regional centre of Dzhangala, Dzhangala region 96 .65 6,�50 15 .0
� . Reconstruction of the water supply system and installation of the Struya water treatment station in the Mashteksai settlement, Dzhangala region
46 .96 1,800 �6 .1
� . Reconstruction of the water supply system and installation of the Membrana water treatment station in Karasu settlement, Kaztal region
54 .75 1,100 49 .78
4 . Reconstruction of the water supply system and installation of the Tazasu water treatment station in the Karakamys settlement, Karatobe region
60 .40 1,600 �7 .75
Pavlodar oblast
1 . Reconstruction of the water pipeline and distribution facilities in the Ozernoe settlement, Zhelezin region �5 .56 640 �9 .94
� . Reconstruction of the water pipeline and distribution facilities in the Novochernoyarka settlement, Pavlodar region 16 .94 1,�65 1� .41
� . Reconstruction of the water pipeline and distribution facilities in the Sherbakty settlement, Sherbakty region 64 .51 8,08� 7 .98
4 . Reconstruction of the water pipeline and distribution facilities in the Karatomar settlement, Bayanaul region �8 .04 414 91 .88
south Kazakhstan oblast
1 . Reconstruction of the water supply system of the Karakur settlement, Suzak region 51 .45 �,100 �4 .5
� . Reconstruction and construction of the water pipeline system of the regional center of Temirlanovka, Ordabasyn region 6� .4� 11,554 5 .5

50
UNDP ProjectNational Plan for Integrated Water Resources Management and Water Efficiency in Kazakhstan
ACCEss to DRINKINg WAtER AND sANItAtIoN IN thE REPUblIC of KAzAKhstAN
Figure 4 .� Volume of investments into rural water supply by proposal of oblast administration
Figure 4 .4 Scenarios of the pace of investments into rural water supply activities for MDGs’ attainment
Proposals by oblast administrations �005-�006 pace preserved Optimal 10% drowth from �005 Optimal 10% growth from �006
Country’s overall National budget Local budget
Economic entities External grants and loans

51
5.1. Socio-economic and demographic datagender. Out of 7515 persons surveyed, 56 .5% are females . Women prevail in all urban areas, while men predominate in rural areas .
Age. The survey covered population from 18 to 9� years of age . The average age of the respondents is 46 .
Population and migration. According to official data, the population of Kazakhstan has fallen from 16 .� million to 15 million people since 1991 . The population fell from �5-�0% in such areas as Karaganda, Akmola, East-Kazakhstan, and Kostanay oblasts . The results of the survey show that the population will continue to decrease, as 68� persons or 11% of the respondents reported that they are planning to leave the region of their residence in the nearest future due to the extremely limited employment and education opportunities, poor water supply system, and water quality .
Employment. Nearly half of respondents are employed . Twenty-two percent of respondents are unemployed . Pensioners account for �0% of the total sample .
family size. Respondents’ families, on average, consist of four people .
type of housing. The most common type of housing among the surveyed is the owner-occupied dwelling, which provides living quarters for 58% of the sampling . The remaining �9% live in apartment houses .
Cumulative family income on average is very low . The majority of people’s income starts from �0,000 to �0,000 tenge ($150-��5) a month . Twenty percent reported their income as less than 10,000 tenge, and only 1�% of respondents have income of more than �0,000 tenge a month . тенге в месяц . It is noteworthy that 70% of the income of Kazakhstan’s rural population is less than 5,000 tenge a month per family .
garden plot. The majority of rural residents have garden plots as a supplementary source of income and source of livelihood . For more than one-third of rural residents, garden plots form more than 40% of consumed food products . People heavily depend on their garden plots in Almaty, North Kazakhstan, East Kazakhstan, and Pavlodar oblasts .
5FINDINGS oF SoCIAL SurvEy oN EvALuATIoN oF ThE SAFE ACCESS oF ThE popuLATIoN oF ThE rEpubLIC oF KAzAKhSTAN To DrINKING WATEr AND SANITATIoN
The goal of the survey was to collect and analyze data to find out the current level of safe access of the rural and urban populations of the Republic of Kazakhstan to drinking water and sanitation.
The analyzed data provided the following findings and conclusions.
Figure 5 .1 . Reasons to move (number of respondents = 766)
More employment opportunities in other places
Hard conditions for living and harsh climate
Poor quality of water supply and sanitation
No employment opportunities
Others moving
No gas or electrical energy
To unify the family
Other
Hard to say

5�
UNDP ProjectNational Plan for Integrated Water Resources Management and Water Efficiency in Kazakhstan
ACCEss to DRINKINg WAtER AND sANItAtIoN IN thE REPUblIC of KAzAKhstAN
5.2. The Current Situation of Water Supply and Sanitation in Kazakhstan by Findings of Social Survey
5.2.1 The Coverage of Kazakhstan’s population by Central Water Supply
The survey data suggest that the number of households connected to the functioning system of the central water supply amounts to 55 .1% .
Table 5 .1 demonstrates the number of surveyed households connected to the central water supply system in the oblast context . Across the country as a whole c . 55 .1% of respondents reported that their homes are served by a CWSS, although this figure varies considerably between oblasts-- from less than ��% of the surveyed population in North Kazakhstan to nearly 95% in Almaty City . A further 4 .4% of the households surveyed indicated that although they are connected to a CWSS it is no longer working .
The number of connections across the different settlement types varies considerably . For example, the questionnaire survey indicated that the number of household connections in Kazakhstan’s two main cities as well as the 14 oblast centres, is high, with over 90% of the people surveyed reporting that their home is connected to a CWSS .
Approximately 7�% of the households surveyed in small urban settlements are connected to a CWSS, with the level of connection ranging from no connections--in the case of North Kazakhstan-to 100% connection, in Atyrau oblast . In both of these cases, however, the figures are based on the findings
Figure 5 .� Percent share of nutrition that people get from garden plots, by settlement type
table 5.1. the percentage of households surveyed with an operational CWss
Oblast Connected Not connected
Connected, but no longer functioning Total % of households by oblast
connected to a working CWSS
City of Astana ��5 �0 1 �56 91 .7
City of Almaty 561 �8 1 590 94 .9
Akmola 174 191 11 �76 46 .�
Aktobe 180 157 0 ��7 5� .4
Atyrau 197 �0 � ��9 86 .0
East Kazakhstan 45� �54 �4 7�0 61 .9
Zhambyl �1� �5� �9 494 4� .9
West Kazakhstan 91 �11 1 �0� �0 .0
Karaganda 549 94 �5 668 8� .�
Kostanai �08 177 7� 458 45 .5
Kyzylorda 167 1�7 1 �05 54 .7
Mangystau 11� 57 5 175 64 .6
Pavlodar �07 166 1 �74 55 .�
North Kazakhstan 77 ��5 �6 ��8 �� .8
South Kazakhstan 510 474 95 1,079 47 .�
Almaty �09 59�* 1* 80� �6 .1
Kazakhstan 4,142 3,077 295 7,515 55.1
unde
r �0
%
�0-4
0%
40-6
0%
60-8
0%
over
80%
Don
’t kn
ow (D
K)
Rural settlementTownOblast centerCity of national status

5�
FINDINGS OF SOCIAL SURVEY ON EVALUATION OF THE SAFE ACCESS OF THE POPULATION OF THE REPUBLIC OF
KAZAKHSTAN TO DRINKING WATER AND SANITATION
table 5.2. Percentage of households without an in-house CWss but with a central water network in city rayon (by settlement type)
Connected % Not connected % Connected but
not functioning %
Oblast center 46 �5 .00 1�7 74 .46 1 0 .54
Urban settlement 149 48 .06 10� �� .90 59 19 .0�
Rural settlement �71 1� .1� 15�8 68 .85 4�5 19 .0�
from a single urban settlement . In most cases, the level of connection is between 50 and 80% . A loss of connections can be observed in two oblasts: South Kazakhstan and Zhambyl oblasts . Over one-third of respondents noted that their central water supply system is already non-functioning .
The service level in rural areas is extremely low compared to the level in cities . Of the �,�60 surveyed households, 5�1 or 16% are connected to a CWSS .
Although a few people report that their CWSS stopped functioning prior to independence in 1991, the vast majority who were able to state when their piped water supply stopped said it had done so in the last 5-10 years . Although the rate of disconnection has slowed down, it is clear that the system is continuing to deteriorate with c . 18% of respondents who reported a lost connection to their home saying that it had occurred in the last 5 years .
Such data are confirmed by the views of people expressed during in-depth interviews and focus groups . Here is a comment provided by a respondent from Akmola oblast:
‘…there once was a water pipeline. It worked until 1995, but everything collapsed with the breakdown of the collective farm.’ (Female interviewee, Rural Akmola)
Similar comments were made by numerous rural residents from Kostanai Oblast .‘There was a pipeline a long time ago--some 10 years ago.’
(Male interviewee, Rural Kostanai)
‘There is a pipeline, but it has not been working for 5 years. The house was connected and it is connected now, but the water pipeline is not functioning. The settlement is collapsing. People leave and the authorities have changed and abandoned everything’ (Male interviewee, Rural Kostanai).
Approximately 8 .� million people have piped water in their homes, with 6 .7 million people getting water from other sources .
The respondents without an in-house CWSS can take water from the common standpipes of urban areas or rural settlements, or from individual wells connected to a CWSS . Over ��% fell under this category . Remarkably, some 600 respondents used to have tap water, but their water pipes are no longer functioning now . However, most respondents in this category (59% – 1,949 people) stated that their city rayon has never been connected to a CWSS .
Overall, 55 .1% of the respondents surveyed have a piped water supply in their homes . An additional 10 .�% are served by piped water at the level of urban district/settlement . Taken together, this means that c . 65% of the surveyed population has a piped water supply . Moreover, a total of 65� (8 .8%) respondents said that they had been connected to a piped water supply in the past but it no longer worked . This suggests that when the system was fully functional, nearly 75% of the surveyed population was served by a piped water supply . Rural settlements suffered the most from the breakup of pipelines beginning in 1991 .
In Kazakhstan, 55.1% of households are connected to a functioning central water supply system.
91% of the population of cities of national status and oblast centers is connected to a central water supply system (CWSS).
73% of urban households are connected to an operable CWSS.
Nearly 16% of rural households are connected to a CWSS.
Most respondents who report that their piped water supply is no longer functioning said it collapsed between 5 and 10 years ago.
Nearly 18% of respondents stated that houses are not connected to a CWSS and have access to water from a water pipe in their block or settlement.

54
UNDP ProjectNational Plan for Integrated Water Resources Management and Water Efficiency in Kazakhstan
ACCEss to DRINKINg WAtER AND sANItAtIoN IN thE REPUblIC of KAzAKhstAN
Most people without a piped water supply in their homes collect their water on foot, but as the distance to the source increases, other forms of transport are used.
5.2.2 The Level of Coverage of Kazakhstan’s population by Decentralized Water Supply Sources
Nearly 45% of the people surveyed do not have a piped water supply in their homes and rely on a range of other sources for water . Of this group, c .48% reported that they obtain their water from an individual (private) standpipe, with hand and electric pump standpipes representing the two most common types . A further �9% of the households surveyed obtain their water from common (public) standpipes serving a number of households, with communal hand pumps serving nearly a quarter of the households falling into this category . Open water sources are also important, with 8% of the surveyed population taking their water from rivers, springs, lakes, and irrigation canals . A comparable number of people (8%) are reliant on water that is delivered to their settlement . Figure 5 .� represents main water supply sources for households not connected to a central water supply system .
These data will be used in the development of the Millennium Development Strategy, as they account for a degree of sustainable access to drinking water . For example, nearly half a million people in the country use water from open sources such as rivers, lakes, and pitches, or they utilize delivered water . Along with the definition provided in the first part, this portion of the population has no sustainable access to drinking water .
Distance to water source The distance to a water source is one of the criteria of access to drinking water . Nearly 70% of the surveyed households that do not have a piped water connection in their homes have a water supply within 100 m, and 41% said they have to go less than �0 m to reach their nearest water source . But for a significant number of households (�5%), the nearest water source is over 100 m from their home, and 7% of the surveyed population (c . �00 of the households) does not have a domestic water supply within 500 m of their homes .
While the vast majority of people who rely on such sources have a water supply relatively close by (within 100 m), this does not mean that getting water is an easy chore; even having a pump in the yard can be problematic . Respondents mentioned that it is slippery, cold, and inconvenient to carry water . It is difficult to get water from standpipes in the winter period, as the area around the pipe is frozen: ‘We have to warm the pipe’, ‘Standpipes can be over-frozen in the winter time, and we open them with boiling water’ .
During such periods, people have to use snow for water and as one interviewee noted:
‘There is also a problem with water in the winter. We use water from melted snow or from ice holes…..some households take water from the so-called ‘pull-out’ reservoirs, where water from melted snow and groundwater flows.’
(Male interviewee, rural West Kazakhstan)
The situation for people in urban areas is often no better, and for many households the distance that must be covered and the number of households that are served by one pump create many problems.
‘Of course we are tired of going to the pump to get water. It is not very close to our house (the pump)... It is localed 200 m away from the
Figure 5 .� Main water source for respondents without a CWSS connection across Kazakhstan (number of respondents =�,��8)
Nearly 70% of respondents not connected to a CWSS have water within the radius of 100 m from their houses.
Public open wellPublic water reservoirPublic standpipe with electric pumpCommon standpipePublic well with electric pumpIndividual open well Individual water reservoirIndividual standpipeIndividual well with electric pumpIndividual well with sucker-rod pumpSpring, river, lakeDitch, irrigation canalDelivered waterOtherDK
An estimated one half of a million people across Kazakhstan get their water delivered by tankers.

55
FINDINGS OF SOCIAL SURVEY ON EVALUATION OF THE SAFE ACCESS OF THE POPULATION OF THE REPUBLIC OF
KAZAKHSTAN TO DRINKING WATER AND SANITATION
house and serves 50 homes. It is all icy around the pump in winter. We have to break the ice. The access to water is nearly frozen.’
(Female interviewee, Uralsk City)
‘Getting water in the winter time is a huge problem. Standpipes are always frozen or broken. You have to get water with an axe.’
(Male interviewee, Semipalatinsk City)
Means of getting waterMost people go for water by foot . Many use carts . Others use a cart with a horse or bring water by car . Some have to cover a distance of 500 – 1000m, and in order to do so they use cars (Figure 5 .5) .
Time for water deliveryIn half of the cases, people spend less than 10 minutes on water delivery . The remaining �0% of respondents reported that they spend 10-�0 minutes on water delivery . The time it takes, however, can be very variable and depends not only on the distance to the source but also on access once you get there . In situations in which many people are served by a single supply, the time spent queuing can be significant . This fact was highlighted in a number of interviews by the following statements, which were typical of responses from interviewees:
‘My husband brings five water bottles (40 liters each) by car. It’s 2 km to the water tower and he goes 1-2 times a week. If the queue is not long it takes about 30 minutes, but if there are many people it can take over an hour.’
(Female interviewee, rural North Kazakhstan)
As discussed, in this study access to ‘safe’ water is considered to mean having access to an improved water source, including household connections, public standpipes, boreholes, protected wells, and protected spring and rainwater collection capable of providing �0 litres per capita per day at a distance of no more than 100 metres . Water taken from open sources, unprotected wells, and delivered water is not acceptable . Based on this definition, 1,�15 of the surveyed households (c . 17 .5%) do not have access to a ‘safe’ water supply .
It is doubtful, however, whether even 100 m is an acceptable distance to go for water, particularly during the winter months . The climate of the northern part of Kazakhstan, for example, is strongly continental and is characterised by long, cold winters and short, hot summers . The coldest month is January, at which time temperatures average -18°C and can fall to as low as -40 to -45 °C . The winter months also witness a significant number of windy days, with about 50% having a wind speed of 4-8 m/s . As a result, snowstorms and ground blizzards are recorded on approximately 80 days during the winter period . People interviewed in these regions commented at length on the issues and noted that while they might not have to go far to reach the nearest standpipe, during the winter standpipes often freeze and they have to go elsewhere in search of water . Moreover, the area around the standpipe is frequently icy and extremely dangerous . This situation is particularly hazardous for the elderly--one of the most vulnerable sectors of society . Thus, while provision might technically be classified as safe since it is close by, it clearly is not safe . Furthermore, given that the northern part of the country has the lowest percentage of households connected to a piped water supply, along with the fact that the population in these oblasts is (in comparison to the rest of the country) very aged, being obliged to go even 100 m for water during the winter months is unacceptable .
Figure 5 .4 Distance to potable water source to be covered by people not connected to a CWSS
Under �0 m
�0-50 m
50-100 m
100-�00 m
�00-�00 m
Figure 5 .5 Water delivery methods and distances to cover
Und
er �
0 m
�0-5
0 m
50-1
00 m
100-
�00
m
�00-
�00
m
�00-
500
m
500-
1000
m
Ove
r 10
00 m DK
OtherDKBy carBy horse and cartBy cartBy bicycle By foot
Over 17% of the total surveyed population does not have access to an improved water source within 100 m of their homes.
�00-500 m
500-1000 m
Over 1000 m
DK

56
UNDP ProjectNational Plan for Integrated Water Resources Management and Water Efficiency in Kazakhstan
ACCEss to DRINKINg WAtER AND sANItAtIoN IN thE REPUblIC of KAzAKhstAN
5.2.3 The Sustainability of Water Supply Systems in Kazakhstan
Although physical access to water is crucial, the security of the supply also needs to be considered; therefore, what is really important is, access to an uninterrupted water supply . The survey findings demonstrate that people connected to a central water supply system have their cold water cut off regularly . Sixty-eight percent of respondents agreed that this is the case (Table 5 .�) . Residents of Almaty city have fewer cuts (1�% of respondents) . In contrast, in Akmola oblast 98% of respondents reported permanent cuts .
Even though most respondents did not know the exact duration of the cuts, it was clear from the answers that water cuts are more frequent in the summer than in the winter time .
The issue of water supply sustainability was studied in more depth through focus groups and in-depth interviews . There was not a single city in which people did not mention water cuts .
Water cuts happen periodically, at a specific time of year . In some settlements, water is supplied at specific hours, usually in the mornings or early evenings .
‘Water supply is frequently interrupted. Water is supplied twice a day from 09:00 to 10:00 and from 19:00 to 20:00.’
(Male interviewee, Aral City)
‘We have a centralized connection (in the settlement) but we have
For approximately 68% of households connected to a CWSS, the provision of water is frequently irregular.
table 5.3. the share of respondents connected to a CWss suffering from frequent irregularities of water supply
Oblast Irregularities No irregularities % of respondents with water supply irregularities
City of Astana 164 71 69 .79
City of Almaty 76 484 1� .81
Akmola 170 4 97 .70
Aktobe 1�6 54 70 .00
Atyrau 181 16 91 .88
East Kazakhstan 400 5� 88 .50
Zhambyl 1�9 7� 65 .57
West Kazakhstan 8� 9 90 .11
Karaganda 476 7� 86 .70
Kostanai 181 �7 87 .0�
Kyzylorda 14� �5 85 .0�
Mangystau 101 1� 89 .�8
Pavlodar 181 �6 87 .44
North Kazakhstan 61 16 79 .��
South Kazakhstan �87 ��� 56 .�7
Almaty* 4� 166 �0 .57
Kazakhstan 2,810 1,331 67.85

57
FINDINGS OF SOCIAL SURVEY ON EVALUATION OF THE SAFE ACCESS OF THE POPULATION OF THE REPUBLIC OF
KAZAKHSTAN TO DRINKING WATER AND SANITATION
water only twice a day for one hour each time. The water does not get higher than the basement, so you might call it a pump!’
(Male interviewee, rural settlement, Atyrau)
Low water pressure is also an issue for many people with a piped water supply, and respondents who live on the upper floors of high-rise buildings are more likely to experience supply interruptions . Thus, while c . 67% of people living on the first floor of a building experience cuts in supply, this figure rises to over 90% for people living on the 7th floor or higher .
‘We are living on the 5th floor, and the water pressure is very low. Therefore, we can say that we never have water. Sometimes we turn on the water, wait while it fills the bath drop by drop, and then we wash ourselves one person at a time.’
(Focus group participant, Aktau City)
Receiving prior warning about cuts is clearly an issue, as only �0% of the households surveyed reported that they are routinely informed if their supply is to be interrupted . In some oblasts, such as Atyrau and Kyzylorda, people received little if any information about their water supply, but others said they knew when to expect the cuts, unless there was an emergency .
‘Very rarely are we informed’ but as such cuts are ‘usually the result of accidents they do not have an opportunity to warn us in advance.’
(Focus group participant, Aktau City)
‘In the case of an emergency – no (we are not informed). People are informed 7 to 10 days prior to seasonal water supply interruption.’
(Male interviewee, Rudny City).
However, in some regions people are often informed . In Almaty City, for example, one interviewee noted that
‘…we are always informed in advance … small notes are placed on our doors.’
(Female interviewee, Almaty City)
Interestingly, people living in rural settlements with a CWSS are the most likely to receive information about cuts, while people living in oblast centres are the least likely to be given information .
The situation appears to be somewhat different for those not connected to a CWSS . Slightly over ��% of the surveyed population in this category has water supply irregularities . Table 5 .4 covers the situation by oblast .
At the same time, for a large number of people who use common standpipes (some 6�%), water supply is an issue . Like people with a CWSS, relatively few respondents in this category could say how often and for how long their water was cut off, but like those with a CWSS, those without seem more certain about cuts in the summer than in the winter months . Relatively few of the households surveyed said that they routinely received notifications that their supply was to be cut .
Security of supply is clearly an important issue, and although 55 .1% of the surveyed population has a piped water supply, for a large percentage of these households the supply is often interrupted with little or no warning . Summarizing the figures for the entire population of Kazakhstan, slightly over one-third (some 5,044,�00 people) has uninterrupted access to water . Accordingly, 9 .8 million people have no permanent access . Since water cuts may entail greater water pollution, we may also say that the latter population group has no safe access to drinking water .
Priishimskoye settlement, Karaganda oblast
One-third of the households surveyed enjoy an uninterrupted water supply, whereas over 9.8 million people across Kazakhstan suffer from intermittent or regular cuts in water supply.

58
UNDP ProjectNational Plan for Integrated Water Resources Management and Water Efficiency in Kazakhstan
ACCEss to DRINKINg WAtER AND sANItAtIoN IN thE REPUblIC of KAzAKhstAN
table 5.4. the percentage of households that experience cuts in water supply and do not have a piped water supply in their homes, by oblast
Oblast There are Irregularities No irregularities
% of people with water supply irregularities
City of Astana �0 1 95 .�4
Akmola 109 9� 54 .��
Aktobe �� 1�5 �0 .�8
Atyrau 1 �1 � .1�
East Kazakhstan 67 �11 �4 .10
Zhambyl 19 �6� 6 .74
West Kazakhstan 6 �06 � .8�
Karaganda �7 8� �1 .09
Kostanai 47 �0� 18 .80
Kyzylorda 98 40 71 .01
Mangystau 6 56 9 .68
Pavlodar 66 101 �9 .5�
North Kazakhstan 15 �46 5 .75
South Kazakhstan 70 499 1� .�0
Almaty �15 499 �0 .11
Kazakhstan 808 �,655 �� .��

59
FINDINGS OF SOCIAL SURVEY ON EVALUATION OF THE SAFE ACCESS OF THE POPULATION OF THE REPUBLIC OF
KAZAKHSTAN TO DRINKING WATER AND SANITATION
5.2.4 opinion of Kazakhstan’s residents on the Quality of Drinking Water
The quality of the water that people have access to is clearly of paramount importance, not only in terms of the actual quality as measured by its chemical, biological, nutrient, and aesthetic qualities, but also in terms of people’s perception of this water’s quality . Over 40% of respondents asserted that there is a problem with the quality of drinking water . This figure increases for people connected to a CWSS (44%) .
table 5.5. the percentage of respondents who believe that they have problems with water quality, with and without a piped water supply in their homes
Oblast Connected to a CWSS Not connected to a CWSS
City of Astana 55 .74 71 .4�
Akmola 55 .17 47 .76
Aktobe �5 .00 �4 .84
Atyrau �7 .56 84 .�8
East Kazakhstan �9 .49 4� .81
Zhambyl 14 .69 �7 .66
West Kazakhstan 57 .14 �0 .66
Karaganda 65 .57 �6 .1�
Kostanai 49 .5� �� .�0
Kyzylorda 50 .�0 �7 .68
Mangystau 69 .90 61 .�9
Pavlodar �6 .�� �4 .7�
North Kazakhstan 75 .�� 51 .�4
South Kazakhstan �� .99 49 .74
Almaty �� .01 44 .70
City of Almaty �6 .08 �0 .00
Although a smaller percentage of the surveyed people without a piped water supply in their homes believed that water quality was an issue, it was clear from the findings from the questionnaire survey that water from certain sources was more likely to be perceived as having problems with quality . For example, the vast majority of the small but significant number of people who take their water from open sources such as communal reservoirs, aryks, and springs and lakes were concerned about water quality, as were a large number of people who take their water from individual open wells and wells with sucker rod pumps (Table 5 .5) .
The issue of water quality was reviewed in detail during focus-groups and interviews . Respondents expressed strong concern about water quality . In city regions, only people of the cities of Taraz and Shymkent appeared to be satisfied with their water’s quality .
‘Water is normal. We sometimes boil it, but usually it’s good. We may even drink tap water.’
(Focus group participant, City of Taraz)
More than 40% of respondents believe there is a problem with the quality of their water.

60
UNDP ProjectNational Plan for Integrated Water Resources Management and Water Efficiency in Kazakhstan
ACCEss to DRINKINg WAtER AND sANItAtIoN IN thE REPUblIC of KAzAKhstAN
‘… We are used to our water and drink raw water easily.’(Focus group participant, City of Shymkent)
At the same time, most urban residents find water unsafe .
‘I think that water is good for washing and cleaning, but we don’t take the risk of using it for drinking.’
(Male respondent, City of Rudniy)
‘Water is unsafe. We boil it.’(Female respondent, City of Astana)
‘Water is unsafe. It should be treated and boiled. We do not drink tap water, as it is too chlorinated.’
(Female respondent, City of Ust-Kamenogorsk)
Notably, respondents from cities not connected to a CWSS evaluate water quality in a more positive way than those connected to a CWSS .
To illustrate, respondents from rural areas of West Kazakhstan noted:
‘The water in the water tower is very clean, nearly without additives. It is tasty and transparent. We may drink such water without boiling it.’
(Female respondent, settlement, West Kazakhstan)
‘It is hazardous to drink water from the river without pre-treatment. Water from wells or delivered water should always be treated.’
(Female respondent, settlement, West Kazakhstan)
‘Water quality is the second most important issue in our settlement (after roads). Many people constantly suffer from stomach ache; there are frequent incidents of poisoning. People often get sick with jaundice.’
(Female respondent, settlement, West Kazakhstan)
The main water quality issues highlighted by the survey included coloration of the water, dirty water containing sediment, and water leaving stains on the dishes . Nearly a third of the respondents who had problems with water quality highlighted taste as a problem; 14% of the respondents who considered water quality to be an issue cited the main problem as being the fact that the water is salty . (Figure 5 .6)
The issues of water quality vary according to the type of water supply source . A considerable number of respondents with individual water supply sources reported water saltiness . For respondents who use water from open sources, the residue is the issue .
The findings of the questionnaire on water quality were reconfirmed during interviews and group discussions . Residents of the city of Uralsk, for instance, stated that water quality in the city is ‘disastrous’ and water is ‘…totally unfit for drinking . It is rusty .’ In the City of Petropavlovsk it was stated that ‘water quality leaves much to be desired . Sometimes water smells bad .’
Moreover, for some respondents there has been a notable decline in water quality in recent years .
‘…until 12 years ago the water was perfect. Now it is yellow and dirty.’ (Male interviewee, Uralsk City)
‘The water is salty and hard and contaminated because of the obsolete water pipeline system.’
(Male interviewee, rural Akmola).
Figure 5 .6 . Major issues of water quality across Kazakhstan (respondents’ views) (number of respondents = �,56�)
Yellow waterWater with sedimentsStrange odourBad smellResidue_ on dishesWater too saltyDKOther

61
FINDINGS OF SOCIAL SURVEY ON EVALUATION OF THE SAFE ACCESS OF THE POPULATION OF THE REPUBLIC OF
KAZAKHSTAN TO DRINKING WATER AND SANITATION
It is evident that water quality is an issue for many people, both in rural and urban settlements . While many simply accept the fact that water quality is poor, for some the fact that the government and private sector can invest in new buildings but not improve the water supply is a mystery . As one interviewee in Astana comments:
‘Low water quality is an issue in our city. I would like to believe that the wonderful architecture could be supplemented by good quality drinking water.’
(Male interviewee, Astana City)
Water treatment for drinkingIn Kazakhstan, 46% of the population treats water prior to drinking . Over 60% of interviewees in the oblasts of Karaganda, West Kazakhstan, Kostanai, and the city of Astana treat water prior to use . This figure is lower in Aktubinsk, East Kazakhstan, and South Kazakhstan oblasts (40%) with �4% in Zhambyl oblast .
Urban water users treat water more often . For example, in the city of Astana over 65% of residents treat water, while this indicator comes to 46% in towns . Residents of rural settlements treat water less often (�9%) .
There is a clear difference between those residents who are connected to a CWSS and those who are not . Fifty-three percent of residents connected to a CWSS purify water, and the same is done by 46% of residents without connections . Of people using public reservoirs or rivers and ditches, 8�% purify water . People do not purify water from individual wells .
Poor water quality and health concerns were the main reasons cited for treating drinking water . By far the most common reason was the fact that the water is opaque; a significant number of people highlighted the fact that they need to treat their drinking water to remove sediment . Approximately �5% of the households that treat their water cite health-related reasons, with issues of taste also being important .
Boiling water is the most widespread method of purifying water for drinking, and over 80% boil water . Another 1�% let water settle, but most do both (Figure 5 .7)
A small number of respondents filter their water, with the vast majority of these people being in the higher income bracket . Many people, however, complain that filters do not work for long .
‘… a schungite filter costs 1000 tenge, and it stopped working after three months so we don’t use it.’
(Female interviewee, Rudny City).
‘We buy filters that cost 7000 tenge or more. They stop working quickly so distilling or boiling water is inevitable.’
(Female interviewee, Aksai City).
‘We used to buy the Russian filter ‘Rodnichok’. However, now they are not sold. Therefore, we just pass the water through cotton wool. Everyone does this.’
(Focus Group participant, Aktau City).
The time spent on boiling water varies from 10 minutes to several hours a day . Atyrau residents boil water the longest — for 6� minutes . Boiling assumes extra time and money .
Approximately 46% of the surveyed population treats water before drinking it.
Figure 5 .7 Major methods of water treatment (number of respondents=�,�40)
BoilingDefecationFilteringOther

6�
UNDP ProjectNational Plan for Integrated Water Resources Management and Water Efficiency in Kazakhstan
ACCEss to DRINKINg WAtER AND sANItAtIoN IN thE REPUblIC of KAzAKhstAN
‘…We boil water and spend on electrical energy.’(Female respondent, city of Zheskazgan)
‘My wife boils water. We did not count the related costs but we know that we spend a lot on gas and electricity.’
(Male respondent, City of Astana)
‘We boil water and pay for electrical energy.’(Female respondent, rural settlement, East Kazakhstan oblast)
Purchase of bottled waterBuying bottled water for drinking can be another indicator of whether water quality is an issue, and in the survey as a whole c . 4�% of the households purchased bottled water . The majority of respondents (45%) commented that they drink bottled water just like any other non-alcoholic beverage . A significant number of respondents, however, stated issues of water quality and safety, i .e ., health safety, as the reason for buying bottled water . This issue was raised by numerous interviewees, many of whom routinely purchase bottled water .
‘We regularly buy a 20-liter bottle …. to prevent stomach problems and kidney diseases. We pay about 300 tenge a bottle, which is enough for one day.’
(Male interviewee, Aksai City)
‘We never drink water from the tap. We buy huge bottles of water for drinking….Big bottles cost 450 tenge.’
(Focus group participant, Petropavlovsk City)
‘We buy mineral water all the time because it is dangerous to drink tapped water as it is chlorinated.’
(Female interviewee, Ust-Kamenogorsk City)
The price issue was mentioned by a number of respondents; some said they could not afford to buy water .
‘We can buy only 1-2 bottles (20L) a week and only for drinking-if we want to drink clean and tasty water. This costs us 600-800 tenge a week.’
(Female respondent, rural settlement, West Kazakhstan)
The issue of cost was mentioned by a number of interviewees, with some people commenting that they simply could not afford to buy water .
‘We can afford to buy only 1 to 2 bottles (20 liters) a week, and only to drink it when we want pure and tasty water. It cost us about 600-800 tenge a week.’
(Female interviewee, rural West Kazakhstan).
In a number of regions, in particular the city of Atyrau (68%), West Kazakhstan oblast (57%), Karaganda (64%), and Kyzylorda (75%), water quality and sanitary conditions are the primary reasons for buying bottled water .
In most cases, (56%) people buy 1 .5 L bottles of water . On average, households buy a bottle per person each week . The price per bottle varies from �5 tenge to 75 tenge; the average price is 50 tenge per bottle . Over a year, people pay some �,500 tenge per person for bottled water .
The survey ascertained that there is a connection between the demand in bottled water and people’s views on the fitness of water for drinking . During
Over 40% of households regularly buy bottled water.
Bulandinsky settlement, Akmola oblast

6�
FINDINGS OF SOCIAL SURVEY ON EVALUATION OF THE SAFE ACCESS OF THE POPULATION OF THE REPUBLIC OF
KAZAKHSTAN TO DRINKING WATER AND SANITATION
the questionnaire, respondents were asked to evaluate the water in their region regarding its fitness for drinking, cooking, washing, and personal hygiene . Slightly over �7% of respondents believe that water in their region is fully fit to drink . This number varies from 1�% in Karaganda oblast to 4�% in the city of Almaty . On the other hand, over 50% of respondents in Karaganda and Atyrau oblasts find water in their region partly or fully unfit to drink, and �0% in the city of Atyrau think their water is absolutely unfit .
there is a positive correlation (r= 0.618) between the percent share of respondents in each oblast who find water in their region partly or fully unfit to drink, and the percent share of respondents who buy bottled water . This correlation is important at the level of 0 .01 in the application of Pearson’s one-sided correlation . It follows that the purchase of bottled water itself may be considered an indicator of region-wide water quality .
5.2.5 human health Issues in Kazakhstan
Diseases such as gastritis, gastrointestinal disease, and hepatitis are often related to poor water quality and poor water supply . Thus, the questionnaire included a question on whether people had been sick over the past 1� months . Some �5% answered in the affirmative, and 6% responded that a family member had been sick over the past year . The question was worded thus: “Have you or a family member had health problems over the past 1� months? If so, what was the exact nature of the problem (headache, stomach ache, hepatitis, skin disease, etc .)?” It was discovered that the population of Kazakhstan frequently suffers from headaches . Twenty percent have gastrointestinal problems . A lesser but still considerable number of people contracted hepatitis and skin disease . Other frequent diseases included heart disease, irregular blood pressure, liver desease, acute respiratory disease, etc . (Table 5 .6)
table 5.6. the sickness rate over the past 12 months as specified by respondents
Description Number of sickness cases over the past 1� months
Intestinal diseases 1,5�7
Hepatitis ��9
Headaches �,048
Dermal diseases 580
Other 857
Intestinal diseasesIt was detected that the rate of intestinal diseases is not dependent on a CWSS connection . At the same time, there is a strong connection between sustainable water supply and sickness rate . For example, �5% of people with frequent water cuts have gastrointestinal problems . There are a number of reasons for this . First, personal hygiene during water cuts may be on the fall and can contribute to the spread of the infections by fecal and oral contamination . Second, with the irregular operation of the water supply system, water may be contaminated by the contaminated water flowing in the pipeline through broken connections or fractures in water distribution networks .
Over the course of the survey, a connection was established between the type of water supply source and the sickness rate . People who use common standpipes suffer less from stomach diseases than people who use individual
The change of the demand structure in bottled water may be regarded as the indicator of water quality change.
Over 16% of the surveyed population indicated that they or their family members contracted intestinal diseases over the past 12 months.
Respondents connected to a CWSS stand double the chance of getting sick with intestinal diseases compared to those with irregular water supply.
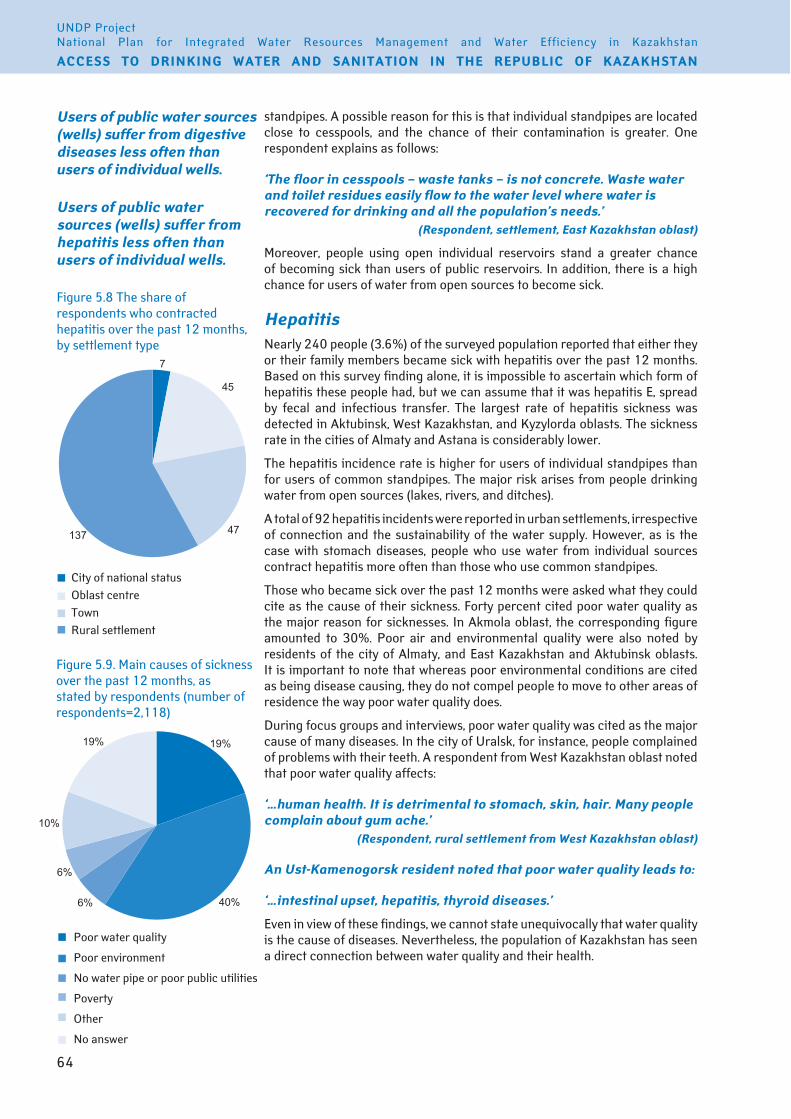
64
UNDP ProjectNational Plan for Integrated Water Resources Management and Water Efficiency in Kazakhstan
ACCEss to DRINKINg WAtER AND sANItAtIoN IN thE REPUblIC of KAzAKhstAN
Figure 5 .9 . Main causes of sickness over the past 1� months, as stated by respondents (number of respondents=�,118)
standpipes . A possible reason for this is that individual standpipes are located close to cesspools, and the chance of their contamination is greater . One respondent explains as follows:
‘The floor in cesspools – waste tanks – is not concrete. Waste water and toilet residues easily flow to the water level where water is recovered for drinking and all the population’s needs.’
(Respondent, settlement, East Kazakhstan oblast)
Moreover, people using open individual reservoirs stand a greater chance of becoming sick than users of public reservoirs . In addition, there is a high chance for users of water from open sources to become sick .
Hepatitis Nearly �40 people (� .6%) of the surveyed population reported that either they or their family members became sick with hepatitis over the past 1� months . Based on this survey finding alone, it is impossible to ascertain which form of hepatitis these people had, but we can assume that it was hepatitis E, spread by fecal and infectious transfer . The largest rate of hepatitis sickness was detected in Aktubinsk, West Kazakhstan, and Kyzylorda oblasts . The sickness rate in the cities of Almaty and Astana is considerably lower .
The hepatitis incidence rate is higher for users of individual standpipes than for users of common standpipes . The major risk arises from people drinking water from open sources (lakes, rivers, and ditches) .
A total of 9� hepatitis incidents were reported in urban settlements, irrespective of connection and the sustainability of the water supply . However, as is the case with stomach diseases, people who use water from individual sources contract hepatitis more often than those who use common standpipes .
Those who became sick over the past 1� months were asked what they could cite as the cause of their sickness . Forty percent cited poor water quality as the major reason for sicknesses . In Akmola oblast, the corresponding figure amounted to �0% . Poor air and environmental quality were also noted by residents of the city of Almaty, and East Kazakhstan and Aktubinsk oblasts . It is important to note that whereas poor environmental conditions are cited as being disease causing, they do not compel people to move to other areas of residence the way poor water quality does .
During focus groups and interviews, poor water quality was cited as the major cause of many diseases . In the city of Uralsk, for instance, people complained of problems with their teeth . A respondent from West Kazakhstan oblast noted that poor water quality affects:
‘…human health. It is detrimental to stomach, skin, hair. Many people complain about gum ache.’
(Respondent, rural settlement from West Kazakhstan oblast)
An Ust-Kamenogorsk resident noted that poor water quality leads to:
‘…intestinal upset, hepatitis, thyroid diseases.’
Even in view of these findings, we cannot state unequivocally that water quality is the cause of diseases . Nevertheless, the population of Kazakhstan has seen a direct connection between water quality and their health .
Users of public water sources (wells) suffer from hepatitis less often than users of individual wells.
Figure 5 .8 The share of respondents who contracted hepatitis over the past 1� months, by settlement type
City of national statusOblast centreTownRural settlement
Poor water quality
Poor environment
No water pipe or poor public utilities
Poverty
Other
No answer
Users of public water sources (wells) suffer from digestive diseases less often than users of individual wells.
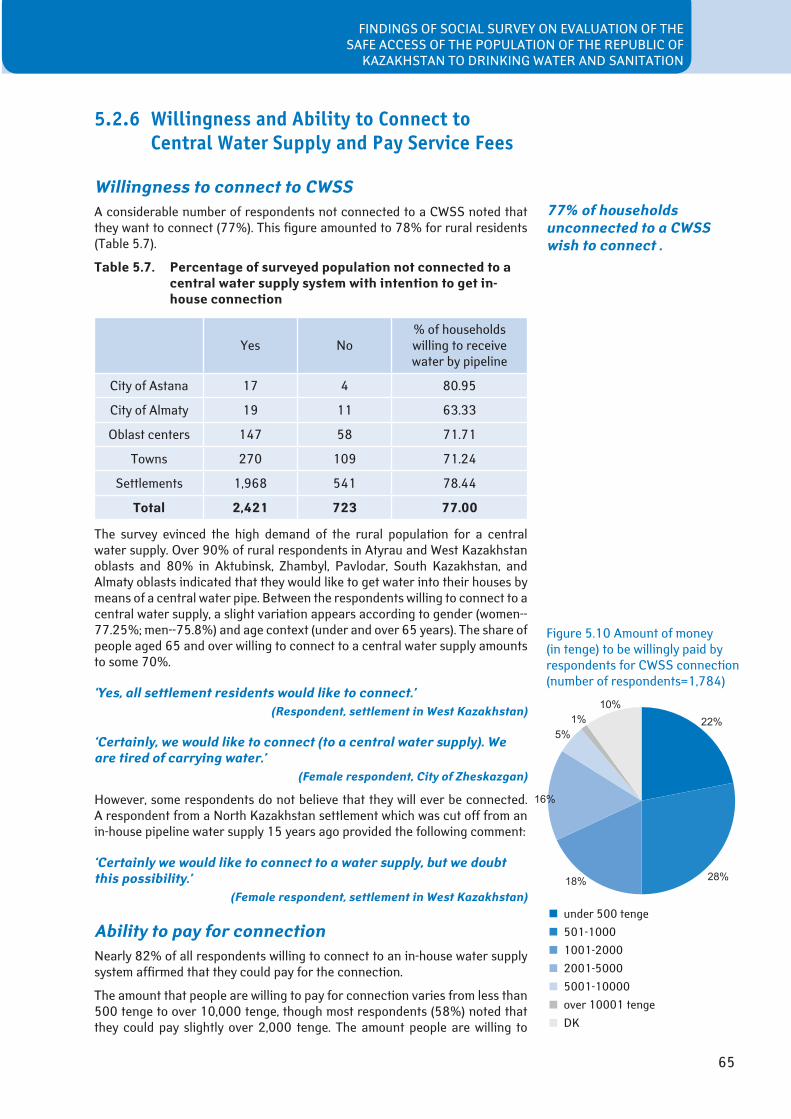
65
FINDINGS OF SOCIAL SURVEY ON EVALUATION OF THE SAFE ACCESS OF THE POPULATION OF THE REPUBLIC OF
KAZAKHSTAN TO DRINKING WATER AND SANITATION
5.2.6 Willingness and Ability to Connect to Central Water Supply and pay Service Fees
Willingness to connect to CWSSA considerable number of respondents not connected to a CWSS noted that they want to connect (77%) . This figure amounted to 78% for rural residents (Table 5 .7) .
table 5.7. Percentage of surveyed population not connected to a central water supply system with intention to get in-house connection
Yes No% of households willing to receive water by pipeline
City of Astana 17 4 80 .95
City of Almaty 19 11 6� .��
Oblast centers 147 58 71 .71
Towns �70 109 71 .�4
Settlements 1,968 541 78 .44
total 2,421 723 77.00
The survey evinced the high demand of the rural population for a central water supply . Over 90% of rural respondents in Atyrau and West Kazakhstan oblasts and 80% in Aktubinsk, Zhambyl, Pavlodar, South Kazakhstan, and Almaty oblasts indicated that they would like to get water into their houses by means of a central water pipe . Between the respondents willing to connect to a central water supply, a slight variation appears according to gender (women--77 .�5%; men--75 .8%) and age context (under and over 65 years) . The share of people aged 65 and over willing to connect to a central water supply amounts to some 70% .
‘Yes, all settlement residents would like to connect.’(Respondent, settlement in West Kazakhstan)
‘Certainly, we would like to connect (to a central water supply). We are tired of carrying water.’
(Female respondent, City of Zheskazgan)
However, some respondents do not believe that they will ever be connected . A respondent from a North Kazakhstan settlement which was cut off from an in-house pipeline water supply 15 years ago provided the following comment:
‘Certainly we would like to connect to a water supply, but we doubt this possibility.’
(Female respondent, settlement in West Kazakhstan)
Ability to pay for connectionNearly 8�% of all respondents willing to connect to an in-house water supply system affirmed that they could pay for the connection .
The amount that people are willing to pay for connection varies from less than 500 tenge to over 10,000 tenge, though most respondents (58%) noted that they could pay slightly over �,000 tenge . The amount people are willing to
77% of households unconnected to a CWSS wish to connect .
Figure 5 .10 Amount of money (in tenge) to be willingly paid by respondents for CWSS connection (number of respondents=1,784)
under 500 tenge501-1000 1001-�000�001-50005001-10000over 10001 tengeDK

66
UNDP ProjectNational Plan for Integrated Water Resources Management and Water Efficiency in Kazakhstan
ACCEss to DRINKINg WAtER AND sANItAtIoN IN thE REPUblIC of KAzAKhstAN
pay differs across the country (Figure 5 .10) . Nearly 40% of respondents in West Kazakhstan oblast, for example, are willing to pay �,000 tenge or more for connection, while in Akmola oblast most people who are willing to pay for connection cited the sum of �,000 tenge or less .
The main reason for people’s unwillingness to pay for connection is the price (59%) . A considerable part of respondents believed that connection costs should be covered by the state . Obviously, the price is the main issue for many people who cannot afford to pay for such costs .
‘All settlement residents would like to connect, but not all of them agree or could afford to pay for connection. There is a high unemployment rate in the settlement, and over half of residents survive by their subsidiary plots.’
(Female respondent, settlement in East Kazakhstan)
‘We would pay, but not all our neighbors can afford it.’(Female respondent, City of Zheskazgan)
‘We would like to pay, but we couldn’t. We have low salaries.’(Respondent, City of Uralsk)
Some respondents deem that the cost of the service should be shared, and one respondent from Kostanai noted that the connection cost should be covered:
‘…partly by owners, but mostly by the state.’
‘All residents of the settlement are willling to be connected to CWSS, but not all of them are able to pay for connection. There is a high level of unemployment in the settlement. More than half of the population survive by the means of their garden plot and subsidiary farm.’
(Female respondent, settlement in Eastern Kazakhstan)
Water tariffOf the 4,1�1 questionnaire respondents connected to a central water supply, only 1�� do not pay for water supply services . Of the remaining �,988 respondents, ��% pay �00 tenge or less for water each month, �1% pay �01-�00 tenge, and another �0% pay �01-500 tenge a month . Nearly 500 of the surveyed households (nearly 11%) pay the amount of 500 tenge a month for water supply services .
The sum paid by households for tap water depends on two main factors: the number of household members and the presence or absence of water meters.
table 5.8. the sum paid monthly by households with/without water meters
Amount paid by households
With cold water meter % Without cold
water meter %
0 tenge 1 4 .55 �1 95 .45
1-100 tenge �18 74 .47 109 �5 .5�
101-�00 tenge 414 4� .81 55� 57 .19
�01-�00 tenge �67 �� .54 5�9 66 .46
�01-400 tenge 16� �0 .6� �67 69 .�8
401-500 tenge 1�1 4� .�7 158 56 .6�
Over 501 tenge 1�5 �9 .80 �18 70 .�0
DK ��0 �8 .7� �48 61 .�7

67
FINDINGS OF SOCIAL SURVEY ON EVALUATION OF THE SAFE ACCESS OF THE POPULATION OF THE REPUBLIC OF
KAZAKHSTAN TO DRINKING WATER AND SANITATION
The sum paid by households for tap water depends on two main factors: the number of household members and the presence or absence of water meters .
In view of the presence or absence of water meters, it is obvious that households with water meters pay considerably less for water than households without water meters (Table 5 .8) . To illustrate, 75% of households with meters pay 100 tenge or less for water, and slightly less than �0% pay over 500 tenge a month . Clearly, the size of the household, monthly water fee, and the meter all demonstrate that small households (of 4 members or less) with meters pay less than same-sized households without meters . In the case of larger households, this correlation is not very clear: it is noted that larger households with meters pay more for water than same-sized households without meters .
Slightly over �8% of households not connected to a CWSS pay for water supply services . The survey findings demonstrated that households dependant on central water supply services are likely to pay for water, and they include a considerable part (nearly 64%) of respondents who receive water from common standpipes, for which they pay . Nearly 60% of households that use delivered water also pay for it . A considerably lower number of people that use water from individual sources pay for water .
The sum that households were able to pay differs significantly . On average, households pay �00 tenge or less each month for water supply services . However, people that use delivered water pay more for water (Figure 5 .11) .
In addition to the water fee, some people bear related costs . As shown, a considerable part of people boil water for drinking, and pay for the coal or gas used to fulfill this goal . Though it is impossible to count the real cost of water boiling, the questionnaire survey shows that electricity costs are the largest for many families . In the city of Almaty, households without gas meters pay some 180 tenge per person for gas . With the average size of a household consisting of three people and the assumption that �5% of this cost goes into boiling water, this adds some 1,600 tenge to annual water pay .
An even more expensive option resorted to by many households is the purchase of drinking water .
Willingness to pay for improved quality of water supply servicesAs in the questionnaire survey, participants of focus groups and in-depth interviews were asked whether they would pay extra for improved water supply services . Slightly over 4�% of questionnaire respondents answered that they would be able to do so . The percentage of respondents that expressed their willingness was lower in Astana and Almaty, and greater in Akmola oblast . It is not surprising that residents of two major cities are less prone to pay more . Residents of Astana now pay more for water than in most parts of the country . In Almaty, the security of the water supply is rather good, and it is unlikely that respondents would think that they should pay for any improvements to it .
Though many respondents (19%) who expressed their wish to pay for an improved water supply failed to answer the amount they could pay, 81% did provide an answer . Most of them cited the sum of �00 tenge or less per household per month, though a considerable part (�4%) of respondents indicated that they could pay �00 tenge or more for supplied water delivery in the quantity demanded (Figure 5 .1�) .
The main reasons for any unwillingness to pay for system improvements are additional costs and the availability of a sustainable water supply . However, a considerable part (15 .5%) believe that the state should cover the cost of the services, and another 1� .7% stated its lack of trust in the central water supply or secured water supply .
Figure 5 .11 Monthly tariff paid by residents, subject to water supply type
OtherDelivered waterDitch, irrigation channelSpring, river, lakePublic water reservoirIndividual water reservoirPublic open wellPublic well with electric pumpPublic well with sucker-rod pumpIndividual open wellIndividual well with electric pumpIndividual well with sucker-rod pumpCommon stand-pipeIndividual stand-pipeWater pipe connected to the house
50 а
з�1
-100
101-
150
151-
�00
�01-
�50
�51-
�00
�01-
�50
�51-
400
401-
500
5001
көп
Біл
мйе
мін

68
UNDP ProjectNational Plan for Integrated Water Resources Management and Water Efficiency in Kazakhstan
ACCEss to DRINKINg WAtER AND sANItAtIoN IN thE REPUblIC of KAzAKhstAN
Figure 5 .1� Amount (in tenge) that the population of Kazakhstan is willing to pay for permanent water access (number of respondents =�,�41)
table 5.9. the percentage of respondents in each oblast willing to pay more for water supply in the quality demanded
Oblast %
City of Astana �4 .61
City of Almaty �9 .8�
Akmola �� .78
Aktubinsk 60 .�4
Atyrau 44 .10
East Kazakhstan �8 .��
Zhambyl 57 .89
West Kazakhstan 51 .8�
Karaganda 4� .��
Kostanai �4 .9�
Kyzylorda 55 .41
Mangistau 50 .86
Pavlodar �8 .�4
North Kazakhstan 51 .48
South Kazakhstan �8 .00
Almaty 47 .95
Kazakhstan 4� .6�
table 5.10. Reasons for unwillingness to pay more for a secure water supply
Reasons for unwillingness to pay more for permanent water supply %
The state should pay 15 .5�
I would like to pay more but cannot afford it �4 .86
There are more important things to spend money on 8 .59
I have no faith in the reliability of the central WSS 1� .70
CWSS reliability does not concern me �4 .69
Water quality is more important � .�6
Other � .6�
No answer 8 .65
under 100101-�00�01-�00�01-400over 401DK

69
FINDINGS OF SOCIAL SURVEY ON EVALUATION OF THE SAFE ACCESS OF THE POPULATION OF THE REPUBLIC OF
KAZAKHSTAN TO DRINKING WATER AND SANITATION
Willingness to pay more for improved water qualityThe willingness to pay for improved water quality was also considered within the questionnaire and interviews . Overall in the country, over 45% of respondents expressed their willingness to pay for improved water quality . As regards a secure water supply, this figure was higher among respondents not connected to a central water supply . Respondents from Aktubinsk oblast are prone to pay more than respondents from Astana, Almaty, and Kostanai (Table 5 .11) . Of the people not connected to a central water supply, the figure significantly differed, and slightly over 71% of respondents in this category from Taraz expressed their willingness to pay; the corresponding figure in Atyrau came to 1�% .
As with a secure water supply, a large percent of respondents (�7%) who expressed willingness to pay for improved water quality could not cite which sum they would be willing to pay . For 50% of respondents, nevertheless, the affordable price was �00 tenge or less, and another ��% of respondents mentioned the sum of �00 tenge or more . Therefore, respondents are inclined to pay slightly more for improved quality than for a secured water supply .
A considerable number of respondents cited the main reason for their unwillingness to pay for improved water quality as being their inability to evaluate whether the water quality would actually be improved . This concern was expressed by a number of interviewees .
‘I would agree to pay, but as always, I’m afraid. The company may raise the fee but the quality would remain the same or worse and it would not justify the company’s actions.’
(Male respondent, City of Aksai)
‘I simply don’t believe that the water supply can be improved.’(Female respondent, settlement in North Kazakhstan)
Some people are not only unwilling to pay, but they think that they pay enough for water already .
‘We would like to improve water quality but we don’t want to pay extra money… We already pay for the operation of the water department and for unused water and untreated water flows. Who would give us a breakdown of the fee?’
(Male respondent, City of Rudniy)
Therefore, most people pay directly or indirectly for water supply services . Though it is hard to provide the exact sum paid by individuals, the amount is relatively high . Annually, household payment amounting to 10,000 tenge seems to be the norm . Coupled with indirect costs, this figure is higher in many households . Despite this, people have a strong desire to pay for water and, in particular, for improved water supply and water quality . However, people have no idea how much this service should cost . Individuals unwilling to pay see no problem with water supply, cannot afford extra costs, or believe that the state should cover such costs . All this should be taken into account when developing a comprehensive strategy . It is also important to note that the country’s water users have regular information on the net costs of water supply services as well as the measures taken to improve the system . Moreover, people should realize that if they do not pay for water directly, they pay for it indirectly anyway .
45% of respondents noted their intention to pay more for improved water quality.
table 5.11. the percentage of respondents in each oblast willing to pay more for improved water quality
Oblast %
City of Astana �0 .47
City of Almaty �� .54
Akmola 41 .��
Aktubinsk 64 .69
Atyrau 57 .64
East Kazakhstan 45 .�1
Zhambyl 5� .4�
West Kazakhstan 5� .15
Karaganda 50 .90
Kostanai �7 .07
Kyzylorda 50 .8�
Mangistau 41 .71
Pavlodar 4� .51
North Kazakhstan 5� .85
South Kazakhstan �9 .�9
Almaty 5� .4�
Republic of Kazakhstan 45 .�6

70
UNDP ProjectNational Plan for Integrated Water Resources Management and Water Efficiency in Kazakhstan
ACCEss to DRINKINg WAtER AND sANItAtIoN IN thE REPUblIC of KAzAKhstAN
5.2.7 Sanitary Conditions in Kazakhstan
table 5.12. the share of respondents in each oblast connected to a Css
Oblast Connected % of connections Not connected
City of Astana ��8 89 .06 �8
City of Almaty 48� 81 .69 108
Akmola 150 �9 .89 ��6
Aktubinsk 178 5� .8� 159
Atyrau 116 50 .66 11�
East Kazakhstan �7� 51 .10 �57
Zhambyl 1�1 �4 .49 �7�
West Kazakhstan 90 �9 .70 �1�
Karaganda 50� 75 .�0 165
Kostanai 19� 4� .14 �65
Kyzylorda 8� �7 .�1 ���
Mangistau 111 6� .4� 64
Pavlodar 17� 46 .�6 �01
North Kazakhstan 71 �1 .01 �67
South Kazakhstan 159 14 .74 9�0
Almaty 104 1� .95 699
table 5.13. the percentage of respondents from various types of settlements connected to a Css
Oblast City of
national status (%)
Oblast center (%) Town (%)
Rural settlement
(%)
City of Astana 89
City of Almaty 8�
Akmola 81 74 7
Aktubinsk 97 74 5
Atyrau 84 87 5
East Kazakhstan 90 70 1�
Zhambyl 54 57 0
West Kazakhstan 67 70 1
Karaganda 96 8� 4
Kostanai 71 81 �
Kyzylorda 65 � 0
Mangistau 98 57 7
Pavlodar 74 66 1
North Kazakhstan 70 0 0
South Kazakhstan 61 0 0

71
FINDINGS OF SOCIAL SURVEY ON EVALUATION OF THE SAFE ACCESS OF THE POPULATION OF THE REPUBLIC OF
KAZAKHSTAN TO DRINKING WATER AND SANITATION
The second important goal of the questionnaire was the data on the sanitation level in Kazakhstan . The survey findings demonstrate that 4�% of respondents are connected to a central sewage system (CSS) . As with water supply, the level of sewage connection differs by oblast . In the major cities of Kazakhstan–Almaty and Astana--the sewage connection level is high . In other oblasts, the sewage connection level is below �0%; in South Kazakhstan oblast this level is below 15% (Table 5 .1�)
Respondents without sewage systems were asked if they wished to connect . Over 46% answered in the affirmative . Ninety percent of the population not connected to a CSS answered in the affirmative in North Kazakhstan oblast and 16% in South Kazakhstan oblast .
Respondents not wishing to connect to a CWSS basically cited lack of demand as the reason . For some respondents, there was the issue of payment, especially for residents of Aktobe, East Kazakhstan, and Pavlodar . In some oblasts, the main reason was the fact that the region has no sewage networks and it is impossible to connect .
Most interviewees (81%) wishing to connect to a CWSS stated their willingness to pay even partly for the connection . The amount they were prepared to pay was 100 tenge .
Lavatory typeCurrently, the most common type of toilet is a cesspool: 58% of respondents use such toilets; another 40% have toilets connected to a CWSS .
A greater number of toilets connected to a CWSS and sewage are available to the populations of cities of national status . To illustrate, 90% of respondents from the cities of Almaty and Astana have such toilets . In oblast centres, this figure amounts to 75%, and in towns to 60% . For comparison, only �% of interviewed residents of rural settlements have access to toilets with waste tanks connected to sewage . Even though a large number of people have modern toilets, 8�% of them suffer from irregular water supply, at which time their toilets dysfunction . Respondents said that they always take in water, but when water disconnections last, hygienic and sanitary conditions deteriorate, thus increasing the risk of diseases .
During the survey, it was discovered that 150 respondents (�%) share toilets with several families . Twenty-eight respondents stated that they have no toilet at all or use public toilets . The situation looks very pessimistic here .
‘The toilet in the yard is disastrous. It is used by 12 families… The toilet has no doors, and it is always overfilled. It was cleaned only once.’
(Male respondent, City of Uralsk)
‘We share a toilet with 8 families (24 people). It is a nightmare.’(Female respondent, City of Pavlodar)
Those with individual toilets would basically like to improve sanitary conditions . This is a topical issue for the northern region of Kazakhstan, where people mostly have outside cesspools . For many of these people, toilet use in the winter is difficult .
‘We would like to have an in-house toilet. We live in the 21st century but we do not have a sense of civilization.’
(Female respondent, rural settlement of Akmola oblast)
‘We would like to have an in-house toilet. It is very convenient to have an in-house toilet, especially in the winter time… A warm toilet is important for a woman in the winter, as there is every possibility of
Figure 5 .1� Available lavatory types among the population of Kazakhstan
Modern lavatory connected to sewage and a CWSSLavatory connected to a CWSS but not to sewageCesspool
Lavatory connected neither to a CWSS nor to sewageOther
Figure 5 .14 Lavatory type subject to settlement type across Kazakhstan
Cap
ital
Obl
ast
cent
er
Smal
l tow
n
Rur
al
sett
lem
ent
Other
Pit latrine
Toilet, connected to CWS, but not connected to sewage
Modern toilet, connected to sewage system

7�
UNDP ProjectNational Plan for Integrated Water Resources Management and Water Efficiency in Kazakhstan
ACCEss to DRINKINg WAtER AND sANItAtIoN IN thE REPUblIC of KAzAKhstAN
getting chilled. Children also suffer; they are afraid to go to the toilet at night.’
(Female respondent, settlement of North Kazakhstan oblast)
Bath/showerOut of the entire sampling, 1,�50 people have no shower or bath . They mainly use conveniences at neighbors’ or relatives’ places or boil water in order to wash at home . A large percent use public baths, and some out of this number pay 50 to 100 tenge to do so .
5.2.8 public participation in Water resource Management
One section of a questionnaire asked respondents if they think that the public should have a share in water management issues . Overall, 68% agreed with the need to involve the public in the management process . This indicator came to 50% in South Kazakhstan oblast and 88% in Aktubinsk oblast . Responses did not differ by settlement type or respondent age, although it was expected by the authors that young people would be more actively involved than elderly people .
table 5.14 the percentage of respondents in each oblast with the view that the public should influence the management of water resources
Oblast %
City of Astana 74 .��
Akmola 6� .8�
Aktubinsk 87 .8�
Atyrau 79 .91
East Kazakhstan 77 .�6
Zhambyl 80 .77
West Kazakhstan 77 .89
Karaganda 78 .44
Kostanai 6� .��
Kyzylorda 66 .��
Mangistau 69 .14
Pavlodar 75 .1�
North Kazakhstan 66 .�7
South Kazakhstan 50 .4�
Almaty 58 .�8
City of Almaty 54 .41
Kazakhstan 67 .57
Respondents outlined a number of possibilities for the public to participate in the management process . The most common were the submission of letters to the government, the conduction of thematic meetings, and the participation of representatives in official committees . (Figure 5 .15)
Respondents who believe that public participation is not needed in the management process explained that the government would take notie of the water users’ interests .
Figure 5 .15 How water users can be involved in water management issues (number of respondents=4,�89)
Letters should be sent to authorities
Thematic sessions should be organized
Officially authorized committees should be appealed to
Other
No answer
Figure 5 .16 Main causes for public inactivity in water management issues (number of respondents=1,8��)
Water users are not specialistsWater users are not concernedGovernment will not pay attentionOtherNo answer
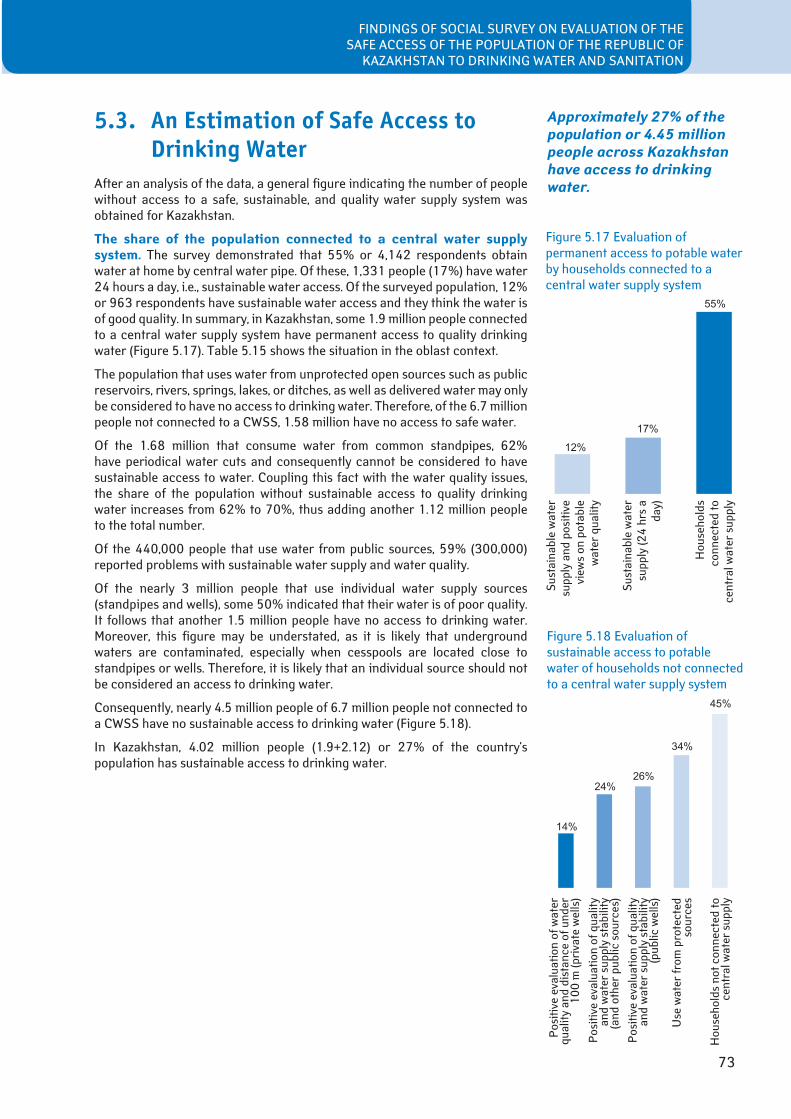
7�
FINDINGS OF SOCIAL SURVEY ON EVALUATION OF THE SAFE ACCESS OF THE POPULATION OF THE REPUBLIC OF
KAZAKHSTAN TO DRINKING WATER AND SANITATION
5.3. An Estimation of Safe Access to Drinking Water
After an analysis of the data, a general figure indicating the number of people without access to a safe, sustainable, and quality water supply system was obtained for Kazakhstan .
the share of the population connected to a central water supply system. The survey demonstrated that 55% or 4,14� respondents obtain water at home by central water pipe . Of these, 1,��1 people (17%) have water �4 hours a day, i .e ., sustainable water access . Of the surveyed population, 1�% or 96� respondents have sustainable water access and they think the water is of good quality . In summary, in Kazakhstan, some 1 .9 million people connected to a central water supply system have permanent access to quality drinking water (Figure 5 .17) . Table 5 .15 shows the situation in the oblast context .
The population that uses water from unprotected open sources such as public reservoirs, rivers, springs, lakes, or ditches, as well as delivered water may only be considered to have no access to drinking water . Therefore, of the 6 .7 million people not connected to a CWSS, 1 .58 million have no access to safe water .
Of the 1 .68 million that consume water from common standpipes, 6�% have periodical water cuts and consequently cannot be considered to have sustainable access to water . Coupling this fact with the water quality issues, the share of the population without sustainable access to quality drinking water increases from 6�% to 70%, thus adding another 1 .1� million people to the total number .
Of the 440,000 people that use water from public sources, 59% (�00,000) reported problems with sustainable water supply and water quality .
Of the nearly � million people that use individual water supply sources (standpipes and wells), some 50% indicated that their water is of poor quality . It follows that another 1 .5 million people have no access to drinking water . Moreover, this figure may be understated, as it is likely that underground waters are contaminated, especially when cesspools are located close to standpipes or wells . Therefore, it is likely that an individual source should not be considered an access to drinking water .
Consequently, nearly 4 .5 million people of 6 .7 million people not connected to a CWSS have no sustainable access to drinking water (Figure 5 .18) .
In Kazakhstan, 4 .0� million people (1 .9+� .1�) or �7% of the country’s population has sustainable access to drinking water .
Approximately 27% of the population or 4.45 million people across Kazakhstan have access to drinking water.
Figure 5 .17 Evaluation of permanent access to potable water by households connected to a central water supply system
Figure 5 .18 Evaluation of sustainable access to potable water of households not connected to a central water supply system
Sust
aina
ble
wat
er
supp
ly a
nd p
ositi
ve
view
s on
pot
able
w
ater
qua
lity
Sus
tain
able
wat
er
supp
ly (�
4 hr
s a
day)
Hou
seho
lds
conn
ecte
d to
ce
ntra
l wat
er s
uppl
y
Pos
itive
eva
luat
ion
of w
ater
qu
ality
and
dis
tanc
e of
und
er
100
m (p
riva
te w
ells
) P
ositi
ve e
valu
atio
n of
qua
lity
and
wat
er s
uppl
y st
abili
ty
(and
oth
er p
ublic
sou
rces
) P
ositi
ve e
valu
atio
n of
qua
lity
and
wat
er s
uppl
y st
abili
ty
(pub
lic w
ells
)
Use
wat
er fr
om p
rote
cted
so
urce
s
Hou
seho
lds
not c
onne
cted
to
cent
ral w
ater
sup
ply

74
UNDP ProjectNational Plan for Integrated Water Resources Management and Water Efficiency in Kazakhstan
ACCEss to DRINKINg WAtER AND sANItAtIoN IN thE REPUblIC of KAzAKhstAN
table 5.15. the share of the population in each oblast (connected to a central water supply system) with sustainable access to high-quality drinking water
Oblast
Num
ber
of
resp
onde
nts
with
su
stai
nabl
e ac
cess
to
qua
lity
drin
king
w
ater
, peo
ple
Tota
l num
ber
of
inte
rvie
wee
s, p
eopl
e
% o
f res
pond
ents
w
ith a
cces
s
Pop
ulat
ion
(tho
usan
ds o
f peo
ple)
Pop
ulat
ion
of
Kaz
akhs
tan
with
su
stai
nabl
e ac
cess
to
qual
ity d
rink
ing
wat
er
(tho
usan
d pe
ople
)
City of Astana �5 �56 1� .67 50� .00 68,6��
City of Almaty �57 590 60 .51 1,147 .5 694,��5
Akmola 0 �76 0 .00 748 .� 0 .000
Aktubinsk 47 ��7 1� .95 668 .� 9�,�05
Atyrau 15 ��9 6 .55 45� .00 �9,607
East Kazakhstan 46 7�0 6 .�0 1,466 .00 9�,�78
Zhambyl 7� 494 14 .57 979 .5 14�,761
West Kazakhstan 8 �0� � .64 601 .9 15,89�
Karaganda �5 668 � .74 1,��� .6 49,910
Kostanai �0 458 4 .�7 919 .1 40,1�5
Kyzylorda �0 �05 6 .56 60� .8 �9,59�
Mangistau 6 175 � .4� ��8 .5 11,606
Pavlodar �� �74 5 .88 748 .7 44,041
North Kazakhstan 8 ��8 � .�7 68� .1 16,144
South Kazakhstan 15� 1,079 14 .09 �,110 .8 �97,�51
Almaty 1�0 80� 16 .19 1,560 .5 �5�,6�4
Republic of Kazakhstan 96� 7,515 1� .81 14,86� .00 1,904,47�

75
6.1. urban Water Supply
6.1.1 ConclusionAn analysis of the current conditions of water and sewage facilities in cities of national status, oblast centers, cities and towns, and urban-type settlements enable the major conclusions presented below .
∆ Vodocanals have a high degree of consumption of fixed capital. Despite the activities underway on rehabilitation and development of water supply and water discharge systems, the conditions of systems in most settlements remain critical .
∆ Inadequate investments in water and sewage facilities. All sectors developed their own programs within the development of the sectoral program Drinking Waters . Accordingly, all program activities carried out were compiled along with the programs produced by regional and city administrations . However, the lack of qualified specialists in water supply and water discharge in the structure of settlement, regional, and oblast administrations disallowed a full identification of the list of necessary work, along with the scale and prioritization of activities for the improvement of water supply to the settlement . The programs that were developed fail to fully reflect the critical situation and the measures required to improve the population’s access level to drinking water �4 hours a day . The funds planned for the implementation of activities on the rehabilitation and reconstruction of urban water supply are not fully allocated by local budgets .
Hence, the socio-economic situation in the country at the time of the creation of the programs, the lack of feasibility studies (FS) with water departments of the reconstruction and development of urban water supply, and the lack of developed investment projects predetermined the subjectivity and underestimation of planned investments . An accurate evaluation of the necessary financing for rehabilitation, as well as reconstruction of old and construction of new water supply systems is nearly impractical without FSs, as chances are that the calculation error would be high .
The inadequacy of tariffs for water supply and water discharge services and enterprises’ costs caused a financial deficit despite the 100% collection rate of service fees .
∆ Vodocanals undergo serious financial crisis. The financing issues come down to deficient or absent public subsidies or subsidies to water departments over the past 15 years . The dependence on public subsidies was caused by incompliance with tariff policy, under which tariffs should not only be self-supporting, but they should generate the specific profit needed to develop water and sewage facilities (WSF) .
Inadequate investments in water and sewage facilities make it impractical to duly plan the activities on improvement of settlement water supply.
An analysis of the current conditions of water and sewage facilities in cities of national status, oblast centers, cities and towns, and urban-type settlements enable the major conclusions presented below.
6CoNCLuSIoN AND rECoMMENDATIoNS

76
UNDP ProjectNational Plan for Integrated Water Resources Management and Water Efficiency in Kazakhstan
ACCEss to DRINKINg WAtER AND sANItAtIoN IN thE REPUblIC of KAzAKhstAN
The water supply systems with 50%-70% deterioration should be prioritized.
∆ the operations of water providers are administered without serious centralized coordination. Local administrations, having deficient professional and technical knowledge of water department activities, as well as neither the advanced technologies of water and sewage facilities nor the foreign experience of water supply and water discharge operation, are unable to pursue the policy in this area . At the same time, water departments have no regulating national body authorized by the state . There is no one in charge either of the development of water and sewage sector strategy or of the sector’s overall coordination and regulation . Currently, the operation of water departments is distorted and decentralized .
∆ the activities of the sectoral program Drinking Waters, oblast programs taza su, Clean Water, and others fail to sufficiently facilitate the improvement of the rural water supply. The primary issue is the lack of due control by local administrations . The accounting system based on what has been explored, the low quality of work, incompletion of projects for construction and reconstruction of water supply systems, use of obsolete technologies and materials, and some other reasons prevent the attainment both of the goals set and expected oUTSomes .
∆ Insufficient autonomy restricts efficient water department management. Utilities are often considered an extension of the local political machine, but not because of the efficiency of their operation . Though water departments are in charge of the operation of water supply and water discharge systems, the decisions on a director’s appointment, subsidy allocation, investment recourse, reconstruction and development of the systems, and the inclusion of specific activities into the program of water supply improvement are made by local authorities . Moreover, pricing issues are tacitly regulated; that is, without the Akim’s approval, the Water Department would never file a request for a tariff increase .
6.1.2 recommendations To attain the financial sustainability of water departments, alternative financing should be provided . One option is to increase the subsidies of water departments from the state (national and local) budgets . Additional funds may also be obtained by grants and soft loans .
∆ there is a need to change the approach for achieving MDgs in the RK. Attention should not only be paid to settlements and cities currently without water supply sources or central water supply systems, but also to facilities with 50% -70% deterioration of existing networks .
Should urgent measures on rehabilitation and reconstruction of water supply networks not be implemented by �015, the number of the population with safe access to drinking water and sanitation will fall rather than rise .
∆ Institutional reforms. To increase the level of sectoral and regional programs’ performance in the field of drinking water supply, there is a need to improve institutional reforms in the following areas:
- public control: conduction of state policy through the nationally authorized body on water supply and water discharge to be stipulated by the Water Code of the Republic of Kazakhstan;
- adoption of a sectoral specialized law on Water Supply and Water Discharge to regulate relations between Consumer and Service Providers;
- development and adoption of the Concept (Strategy) of the development of the water and sewage sector in the Republic of Kazakhstan, endorsed by the government .
∆ When making investment projects in water supply and water
The inadequacy of tariffs for water supply and water discharge services and enterprises’ costs caused a financial deficit despite the 100% collection rate of service fees.
Poor accounting and control systems entails poor quality of works.

77
CONCLUSION AND RECOMMENDATIONS
discharge systems, there is a need for feasibility studies; hence, the national budget shall cover the costs of such development.
6.2. rural Water Supply
6.2.1 Conclusion
The analysis of contemporary water supply confirms that an extremely low level of the rural population has access to drinking water:
∆ the central water supply by most clustered water supply systems is not secured because of the improper technical conditions of the trunk lines and intra-settlement distribution networks. The high operating costs of long-distance water transportation increase the cost of supplied water . To ensure the collection of water payments, water is provided at supply points . This procedure has been introduced in all clustered water supply systems in North Kazakhstan oblast .
∆ the technical conditions of most local water pipelines are unacceptable. Most of them operate with frequent failures or water supply granted on an hourly basis .
∆ the existing system of water supply for 64% of the rural population is based on decentralized local sources. At the same time, drinking needs are satisfied by the use of in-yard and common wells, delivered water, and the surface water of rivers, lakes, and small channels .
∆ As a rule, wells are installed near septic facilities, cesspools, and places frequented by cattle. Wells conceal the great danger of bacterial water contamination and as a consequence, the outbreak of infections related to the aquatic transfer factor . The latter may be attributed to surface sources .
∆ Perched waters that feed wells with limited resources contribute to the issue of secure drinking water supply in sufficient quantity. The price of delivered water is comparable to tap water, or it is sometimes higher, but the costs of its use are regulated by an extremely low water consumption rate (10-15 l/day per person) .
∆ the lack of fresh water determines the use of mineralized water, which is harder and contains fluorine, iron, and other components at a level high enough to adversely affect human health.
∆ Due to poor water coverage, the level of sanitation and hygienic conditions in most settlements is low as well.
6.2.2 recommendations
∆ The solution to the issues of improved water supply and increasing the population’s access to drinking water should take into account local, natural, and existing economic conditions, the availability and technical conditions of existing systems, and water supply facilities .
∆ Water consumption rates should be based on flexible criteria of water use in view of the new socio-economic conditions .
∆ Delivered water should be eliminated as a water supply source to settlements, as it fails to ensure the required water consumption rates, it incapacitates the watering of subsidiary plots or the feeding of cattle, and causes poor sanitary conditions for settlements and their populations . As a result, settlement residents find themselves in extremely tough socio-economic conditions .

78
UNDP ProjectNational Plan for Integrated Water Resources Management and Water Efficiency in Kazakhstan
ACCEss to DRINKINg WAtER AND sANItAtIoN IN thE REPUblIC of KAzAKhstAN
∆ An increase in the share of safe access to drinking water should be attained over the long-term in the following areas: further rehabilitation and improvement of existing systems; construction of new systems in the regions the least provided for; exploration of new and development of alternative water supply sources; improvement of the quality of potable water and its efficient use; establishment as well as material and technical furnishing of companies for the operation of drinking water supply systems .
6.3. Social Survey
6.3.1 Conclusion
∆ Unsustainable water supply and scheduled water supply are the key issues for urban and rural residents of Kazakhstan. While 55% of Kazakhstan’s population uses water from a central supply system, only 17% have water �4 hours a day . An unsustainable water supply entails water contamination, deteriorates sanitary and hygienic conditions, and increases the population’s sickness rate . To illustrate, the chance of contracting intestinal disease doubles for people in households that have regular water cuts, as compared to those who have water �4 hours a day .
∆ A change of demand for bottled water can be considered an indicator either of the deterioration or improvement of water quality in Kazakhstan. The following connection is established: the more repondents’ opinion of the quality of drinking water is negative, the more bottled water they use for drinking .
∆ the distance to a water supply source is not a determining indicator of safe access to drinking water. The survey findings demonstrated that people with private in-yard standpipes had the highest chance of contracting intestinal diseases or hepatitis . In contrast, users of common standpipes have less chance of contracting infectious diseases; in addition, they treat water prior to drinking it more often . Furthermore, the safety of access to drinking water is defined by many other factors, such as climatic conditions, the age of the population, income, sanitary conditions, etc .
∆ sanitary and hygienic conditions are closely related to the quality of the water supply and the population’s health. Owners of individual standpipes often have unequipped toilets (cesspools, toilets with open pits, etc .) near wells, standpipes, and other individual sources of water supply . As a consequence, the danger of bacterial water contamination is high .
∆ the access level to drinking water affects the economic wellbeing of the population (especially the rural population). Since the subsidiary plot takes a large share of the rural population’s income, the uninterrupted operation of the water supply system is a determinant of their employment and means for living .
6.3.2 recommendations
∆ There is a need to provide water users with a centralized informational program on water treatment methods, water quality in specific settlements, the connection between sanitary conditions, water quality, and human health, safe methods of household waste and the utilization of waste products, and also on effective and planned government programs regarding the country’s water supply .
∆ The priorities of the Strategy’s development shall be the issues of sanitation, regular water supply, and water quality and its effect on human health . These are needed as the economic and social consequences of intestinal and other water-related diseases may be huge and irreversible .

79
FooTNoTESi UN Development Goals on the Threshold of the Millennium in Kazakhstan . UNDP . �00� .
ii Government Decree of the Republic of Kazakhstan of �� March �00� №9� “On the Sectoral Program ‘Drinking Waters’ for �00�-�010” .
iii Kazakhstan – �0�0 . The address of the president to the people of Kazakhstan, 1997 .
iv Government Regulation of the Republic of Kazakhstan of �1 .01 .�00� №71 “On the Development Concept of the Economic Water Sector and Water Policy of the Republic of Kazakhstan by �010” .
v Presidential Decree of the Republic of Kazakhstan of �� 17 .05 .�00� №1096 “On State Strategy of Industrial and Innovation Development of the Republic of Kazakhstan for �00�-�015” .
vi Water Code of the RK of 09 .07 .�00� №481 .
vii Sanitary Rules and Norms (SanPiN) � .1 .4 .559-96 “Drinking Water, Hygienic Requirements for the Water Quality of Central Drinking Water Supply Systems . Quality Control .”
viii Construction Rules and Norms of the RK (SNiP RK) 4 .01-0�-�001 “Water Supply . Public Utilities .”
ix Access to safe drinking water is assessed by the share of the population that uses improved water supply sources . Similarly, access to sanitation sewage technologies is assessed by the percent rate of the population that uses improved sewage services . The phrase ‘Improved sewage technologies’ often denotes the technologies that ensure frequent isolation and use of hygienic means . The phrase ‘Improved technologies of drinking water supply’ denotes the ways to supply safe drinking water, which cannot be attained with unimproved technologies .
x The term ‘improved’ is based on the following definitions provided by process methods:
• Improved water supply: household connections; public well, drilled well, protected well, protected spring, rain water collection;
• Improved sewage: connection to public sewage, connection to septic system, lavatory with flushing system, cesspool, ventilated lavatory;
• Unimproved water supply technology: unprotected well, unprotected spring, water delivered by supplier, bottled water, water transported in cisterns;
• Unimproved sewage: service lavatory or a latrine, public lavatories, lavatories with open pit .
Note. In Kazakhstan, the collection of rain (and ice) water has never been regarded and should not be regarded as improved water supply.
xi The Report on Balkhash-Alakol Research Stage can be found on www .voda .kz
xii The exhaustive questionnaire was created within the DfiD project on the management of the Nura-Ishim river basin . The questionnaire consisted of 8 modules focused on municipal, production, and agricultural water consumption . This questionnaire was also developed after the depth surveys and a series of interviews and focus groups were held with concerned parties from both river basins . Each module aimed at the study of specific aspects of water use in Kazakhstan and was developed in such a way as to enable CWR to have the prepared questionnaires as the basis for future surveys . The questionnaire was tested on two basins in March �00� . For that survey, we modified four modules on drinking water, water for household use, sanitation, and informational sources . A copy of the questionnaire may be found in the Report on the management of the Nura-Ishim river basin . The Final Report, volume 5, Social Surveys on Water Resource Management by DfiD, CWR . January �004 .
xiii Despite the fact that the total number of respondents amounted to 7,515, some information inevitably got lost in the data-processing stage . As a consequence, not all final figures would equal 7,515 .
xiv There is no data on household connections in rural settlements of Almaty oblast .
xv In some households, more than one resident got sick over this year . As a consequence, despite the fact that a total of 1,5�7 people suffered from intestinal diseases over the past 1� months, the number of households that reported such cases amounted to 1,�1� .
xvi This fact was confirmed by statistical values by applying the Chi-Square test .

80
reference literature 1 . Sectoral Program Potable Waters for �00�-�010 endorsed by the Government Decree of the Republic of
Kazakhstan of �� March �00� No . 9� .
� . State Rural Development Program of the Republic of Kazakhstan endorsed by the Presidential Decree of 10 July �00� No .1149 .
� . Water Code of the Republic of Kazakhstan of 1� June �001 .
4 . The Government Decree of the Republic of Kazakhstan of �� January �004 No . 75 “On Endorsement of the Rules of Attribution of a Water Object to Potable Water Supply Sources .”
5 . The Government Decree of the Republic of Kazakhstan of �� January �004 No .76 “On Endorsement of the Rules of Subsidizing Potable Water Supply from Critical Clustered Water Supply Systems which Are Non-Alternative State-Owned Water Supply Sources .”
6 . The Government Decree of the Republic of Kazakhstan of 1� December �00� “On Endorsement of the List of Critical Clustered Water Supply Systems which Are Non-Alternative Water Supply Sources .”
7 . The �004 collection of Regions of Kazakhstan . Agency for Statistics of the Republic of Kazakhstan .
8 . Water Resources of Kazakhstan in the New Millennium . UNDP in Kazakhstan publications series .
9 . Papers of the round table dedicated to the issue of the Progress of Implementation of the First Stage of the Potable Waters Sectoral Program held on 19 April �005 in the Parliament Mazhilis of the Republic of Kazakhstan .
10 . Speech of the president of Kazakhstan N . Nazarbaev at the opening session of the Second Civil Forum in the city of Astana on 1� September �005 .
11 . Papers of the seminars held by a group of UNDP projects within the project of the National Plan of Integrated Water Resource Management and Water Efficiency in Kazakhstan .
1� . Rural development in Kazakhstan: issues and prospects . UNDP National Human Development Report . The Atlas of Rural Development in Kazakhstan, Almaty �00� .
1� . CWR working papers: inquiry to the government on the progress of the Program’s implementation, annual reports of oblast public water management enterprises, and other documents related to the Drinking Waters Program .
ANNEX I
Access of urban population to Water and Sanitation in Kazakhstan; results of Technical Survey

UNDP Project National Plan for Integrated Water Resources Management and Water Efficiency in Kazakhstan
ACCEss to DRINKINg WAtER AND sANItAtIoN IN thE REPUblIC of KAzAKhstAN
8�
sum
mar
y ta
ble
on A
cces
s of
Urb
an P
opul
atio
n to
Wat
er s
uppl
y an
d se
wer
age
syst
ems
in th
e R
epub
lic
of K
azak
hsta
n
№
Adm
inis
trat
ive
Uni
t (O
blas
t, ci
ties
of
Alm
aty
and
Ast
ana)
Pop
ula-
tion,
(ps)
Leng
th o
f P
ipel
ine
(km
)
Pop
ulat
ion
havi
ng
perm
anen
t (�4
hr
s) a
cces
s to
w
ater
(ps .
/%)
Pop
ulat
ion
havi
ng
perm
anen
t (�4
hr
s) a
cces
s to
go
od q
ualit
y of
w
ater
(ps .
/%)
Num
ber
of
Pop
ulat
ion
havi
ng
inte
rrup
ted
(lim
ited)
acc
ess
to w
ater
(ps .
/%)
Type
of W
ater
Sup
ply
(ps .
/%)
Typ
e of
Sew
erag
e Sy
stem
(ps .
/%)
Length of Sewers (km)
wel
l de
liver
ed
wat
er
othe
r ce
ntra
lized
sy
stem
se
ptic
pit
outd
oor
toile
t
1A
kmol
a�5
0,16
61,
�59 .
0��
7,�0
9 /
64 .9
9�,5
4� /
�6 .
465
,��6
/ 1
8 .6
49,9
40 /
14
.�7,
000
/ � .
079
1 /
0 .�
160,
97�
/ 46
.014
,67�
/ 4
.017
�,5�
1 /
50 .0
518 .
0
�A
lmat
y47
0,�1
91,
808 .
6�7
6,46
4 /
80 .0
��0,
907
/ 70
.��6
,719
/ 5
.760
,995
/
1� .0
5,50
0 /
1 .�
640
/ 0 .
116
8,�9
� /
�5 .8
�,�0
0 /
0 .7
�98,
7�7
/ 6�
.576
� .8
�A
ktob
e�7
4,16
61,
�44 .
1�6
�,4�
� /
96 .8
�51,
4��
/ 9�
.911
,167
/ �
.057
6 /
0 .�
��6,
97�
/ 60
.7�,
99�
/ 1
14�,
�01
/ �8
.�58
4 .8
4A
tyra
u�6
0,04
�45
9 .9
168,
058
/ 64
.616
5,91
1 /
6� .8
61,6
0� /
�� .
74,
856
/ 1 .
9�5
,5�6
/ 9
.811
6,�5
9 /
44 .7
�,74
6 /
1 .5
1�9,
9�7
/ 5�
.8�0
1 .6
5Ea
st-
Kaz
akhs
tan
856,
79�
�,0�
� .8
794,
4�7
/ 9�
.77�
4,�1
7 /
85 .7
7,��
1 /
0 .9
54,6
55 /
6 .4
�80
/ 0 .
15�
1,94
� /
60 .9
14,8
9� /
1 .7
�19,
959
/ �7
.41,
141 .
�
6Zh
amby
l4�
0,16
�89
� .5
�86,
005
/ 89
.8�8
6,00
5 /
89 .8
�0,�
60 /
7 .0
7,61
� /
1 .8
6,�8
4 /
1 .5
14�,
085
/ ��
.�8,
488
/ � .
0�7
8,58
9 /
64 .7
418 .
7
7W
est-
Kaz
akhs
tan
�60,
575
55� .
1�5
�,50
8 /
96 .9
�5�,
508
/ 96
.9�,
751
/ 1 .
44,
�15
/ 1 .
619
5,55
0 /
75 .0
8,67
0 /
� .�
56,�
54 /
�1 .
7�4
� .0
8K
arag
anda
1,10
5,5�
5�,
819 .
61,
04�,
810
/ 94
.499
7,�6
9 /
90 .�
�6,7
48 /
� .4
��,0
�� /
� .9
1,51
0 /
0 .1
1,4�
� /
0 .1
817,
49�
/ 7�
.9�7
,�87
/ �
.4�5
0,64
5 /
�� .7
�,17
4 .�
9K
osta
nai
494,
7��
1,78
1 .5
44�,
468
/ 89
.6�6
7,86
8 /
74 .4
�8,0
5� /
7 .7
10,�
91 /
� .1
�,81
1 /
0 .6
��4,
515
/ 67
.6�0
,57�
/ 4
.�1�
9,6�
7 /
�8 .�
95� .
5
10K
yzyl
orda
�6�,
�18
8�8 .
6�5
8,��
� /
71 .1
8�,1
45 /
�� .
659
,97�
/ 1
6 .5
��,4
18 /
9 .�
11,6
06 /
� .�
105,
81�
/ �9
.1�,
�84
/ 1 .
0�5
4,0�
1 /
69 .9
�59 .
4
11M
angi
stau
�68,
619
54� .
817
�,40
1 /
64 .5
17�,
401
/ 64
.559
,506
/ �
� .�
�5,7
15 /
1�
.���
8,�9
6 /
85 .0
�,79
� /
1 .4
�6,4
�0 /
1� .
6�6
1 .�
1�P
avlo
dar
479,
�69
1,1�
7 .5
466,
608
/ 97
.��4
5,66
� /
7� .1
701
/ 0 .
111
,116
/ �
.�1,
464
/ 0 .
�41
0,77
6 /
85 .7
1,40
9 /
0 .�
67,1
65 /
14 .
084
6 .0
1�N
orth
-K
azak
hsta
n��
�,90
041
7 .8
�10,
4�9
/ 89
.919
0,58
9 /
81 .4
16,0
50 /
6 .9
6,41
1 /
� .7
146,
�04
/ 6�
.5�,
567
/ 1 .
185
,0�9
/ �
6 .4
�45 .
0
14So
uth-
Kaz
akhs
tan
818,
070
�,81
9 .�
571,
�68
/ 69
.855
�,11
8 /
67 .5
9�,4
01 /
11 .
�1�
9,96
8 /
15 .8
�4,4
�� /
� .0
�74,
�7�
/ ��
.116
,�94
/ �
.05�
7,40
� /
64 .9
748 .
9
15A
lmat
y ci
ty1,
�40,
000
�,�9
0 .0
1,��
5,14
8 /
99 .6
11,
��5,
148
/ 99
.61
4,85
� /
0 .�9
995,
100
/ 80
.�5
�44,
900
/ 19
.75
1,��
� .0
16A
stan
a ci
ty
514,
575
600 .
051
�,87
5 /
99 .9
51�,
875
/ 99
.970
0 /
0 .1
�84,
�88
/ 74
.71�
0,18
7 /
�5 .�
�50 .
0
Tota
l:8,
5�0,
���
��,4
68 .0
7,4
8�,�
�� /
87
.8
6,7
71,7
89 /
79
.4
499
,487
/ 5
.9
410
,96�
/
4 .8�
1
��,5
48 /
1 .
44
�,8
10 /
0 .
04
5,�
7�,4
99 /
6� .
1 of
peo
ple
has
acce
ss to
sew
erag
e sy
stem
�,
146,
7��
/ �6
.911
,1��
.5

8�
ANNExES
Dat
a on
Acc
ess
to D
rin
kin
g W
ater
of g
ood
Qua
lity
of U
rban
Pop
ulat
ion
in A
kmol
a o
blas
t
№P
opul
ated
Are
a
Pop
ulat
ion
havi
ng
acce
ss to
w
ater
supp
ly
(ps .
/%)
Pop
ulat
ion
havi
ng
perm
anen
t (�
4 hr
s)
acce
ss to
w
ater
(ps .
/%)
Pop
ulat
ion
havi
ng
inte
rmitt
ent
(lim
ited)
ac
cess
to
wat
er (p
s ./%
)
Pop
ulat
ion
havi
ng
perm
anen
t (�4
hr
s) a
cces
s to
dr
inki
ng w
ater
of
goo
d qu
ality
(p
s ./%
)
Type
of W
ater
Sup
ply
(ps .
/%)
Leve
l of
Serv
ice
Mai
n R
easo
n fo
r Lo
w L
evel
of
Ser
vice
ce
ntra
lized
co
mm
on
stan
d pi
pe
wel
lde
liver
edot
her
1�
�4
56
78
910
111�
1�
1A
stan
a 51
�,87
5 /
99 .9
051
�,87
5 /
99 .9
051
�,87
5 /
99 .9
051
�,87
5 /
99 .9
070
0 /
0 .10
high
�K
oksh
etau
106,
8�0
/ 84
.�0
106,
8�0
/ 84
.�0
75,0
04 /
59
.�0
�1,8
16 /
�5
.10
19,9
55 /
15
.70
med
ium
wea
r le
vel o
f net
wor
k re
ache
d 86
.�%
�St
epno
gors
k40
,�76
/
96 .9
040
,�76
/
96 .9
040
,�76
/ 9
6 .90
40,�
76 /
96
.90
1,�8
9 /
� .10
high
4A
kkol
, RC
*1�
,5�1
/
100 .
001�
,5�1
/
100 .
00�0
6� /
15 .
�511
,459
/
84 .7
5 m
ediu
mw
ater
ava
ilabl
e on
ly �
-4 h
rs
a da
y to
som
e pa
rt o
f peo
ple
5M
akin
sk, R
C*
1�,0
00 /
70
.90
1�,0
00 /
70
.90
7450
/ 4
44,
550
/ �6
.90
4,94
0 /
�9 .�
0 lo
wlo
ng d
ista
nce
till w
ater
so
uRC
*e, i
nter
rupt
ed w
ater
su
pply
6St
epny
ak, R
C*
�,81
0 /
65 .�
0�,
810
/ 65
.�0
�,81
0 /
65 .�
01,
500
/ �4
.80
low
high
leve
l of n
etw
ork
depr
ecia
tion,
inte
rrup
ted
wat
er s
uppl
y
7Ye
reim
anta
u,
RC
*9,
411
/ 75
.90
9,41
1 /
75 .9
09,
411
/ 75
.90
6,57
0 /
5� .0
0�,
841
/ ��
.90
�,98
� /
�4 .1
0 lo
whi
gh le
vel o
f net
wor
k de
prec
iatio
n, in
adeq
uate
qu
ality
of w
ater
8Es
il, R
C*
1�,4
08 /
10
0 .00
1�,4
08 /
10
0 .00
1�,4
08 /
100
.00
6,14
� /
49 .5
06,
�66
/ 50
.50
med
ium
100%
of w
ater
pip
e ne
twor
k is
wor
n ou
t
9D
erzh
avin
sk,
RC
*�0
0 /
4 .50
�00
/ 4 .
50�0
0 /
4 .50
6,��
0 /
95 .5
0 lo
w10
0% o
f net
wor
k is
wor
n ou
t, in
terr
upte
d w
ater
sup
ply
10A
tbas
ar, R
C*
�8,4
05 /
98
.90
�8,4
05 /
98
.90
11,4
87 /
40
.00
16,9
18 /
58
.90
�19
/ 1 .
10m
ediu
min
terr
upte
d w
ater
sup
ply
11Sc
huch
insk
, R
C*
�1,�
84 /
75
.60
�1,�
84 /
75
.60
17,5
87 /
4�
.50
1�,6
97 /
��
.10
10,0
97 /
�4
.50
med
ium
86 .9
% o
f wat
er p
ipe
netw
ork
need
s re
plac
emen
t
1�A
rsha
ly, R
C*
5,�0
5 /
99 .4
05,
�05
/ 99
.40
5,�0
5 /
99 .4
0�,
580
/ 67
.00
1,7�
5 /
�� .4
0�0
/ 0
.60
med
ium
�5%
of w
ater
pip
e ne
twor
k ne
eds
repl
acem
ent

UNDP Project National Plan for Integrated Water Resources Management and Water Efficiency in Kazakhstan
ACCEss to DRINKINg WAtER AND sANItAtIoN IN thE REPUblIC of KAzAKhstAN
84
1�
�4
56
78
910
111�
1�
1�Sh
orta
ndy,
RC
**4,
704
/ 85
.60
4,70
4 /
85 .6
04,
704
/ 85
.671
� /
1� .0
0�,
99�
/ 7�
.60
791
/ 14
.40
med
ium
�4%
wat
er p
ipe
netw
ork
and
70%
of s
ewer
net
wor
k ne
ed
repl
acem
ent
14St
ants
ionn
y�,
��0
/ 10
0 .00
�,��
0 /
100 .
00�,
��0
/ 10
0 .00
incl
uded
in
dat
a fo
r K
oksh
etau
incl
uded
in
dat
a fo
r K
oksh
etau
med
ium
wea
r le
vel o
f wat
er p
ipe
netw
ork
reac
hed
86,�
%
15Za
vods
koi
�,01
� /
76 .7
5�,
01�
/ 76
.75
�,01
� /
76 .7
5�,
01�
/ 76
.75
507
/ 1�
.9�
405
/ 10
.��
med
ium
81 .�
% o
f wat
er p
ipe
netw
ork
need
s re
plac
emen
t
16A
ksy
5,50
0 /
100 .
005,
500
/ 10
0 .00
5,50
0 /
100 .
00lo
whi
gh le
vel o
f net
wor
k de
prec
iatio
n, in
terr
upte
d w
ater
sup
ply
17Za
ozer
ny49
0 /
100 .
0049
0 /
100
490
/ 10
0 .00
med
ium
high
leve
l of n
etw
ork
depr
ecia
tion,
inte
rrup
ted
wat
er s
uppl
y
18B
esto
be6,
8�8
/ 10
0 .00
low
nono
pera
tiona
l con
ditio
n of
w
ater
sup
ply
syst
em
19K
rasn
ogos
ky99
� /
100 .
0099
� /
100
99�
/ 10
0 .00
low
inte
rrup
ted
wat
er s
uppl
y
�0Sh
anto
be
4,51
8 /
100 .
004,
518
/ 10
0 .00
4,51
8 /
100 .
00�,
5�7
/ 78
.�0
981
/ �1
.70
high
�1Zh
olym
bet
4,45
0 /
100 .
004,
450
/ 10
0 .00
4,45
0 /
100 .
00�9
9 /
6 .70
4,14
9 /
9� .�
0m
ediu
m58
% o
f wat
er p
ipe
netw
ork
need
s re
plac
emen
t
��Zl
elez
nodo
rojn
y /
/
/
��N
auch
ny1,
0��
/ 10
0 .00
1,0�
� /
100 .
001,
0��
/ 10
0 .00
�07
/ �0
.00
716
/ 70
.00
low
80%
of w
ater
pip
e ne
twor
k ne
eds
repl
acem
ent
�4B
orov
oe�,
710
/ 70
.00
�,71
0 /
70 .0
0�,
710
/ 70
.00
1,87
6 /
�5 .4
01,
8�4
/ �4
.60
1,��
5 /
�5 .0
0�6
5 /
5 .00
med
ium
100%
of n
etw
ork
is w
orn
out
�5A
leks
eevk
a1,
�07
/ 10
0 .00
1,�0
7 /
100 .
001,
�07
/ 10
01,
�07
/ 10
0 .00
1,�0
7 /
100 .
00m
ediu
min
terr
upte
d w
ater
sup
ply
�6B
irle
stik
�88
/ 6�
.�0
�88
/ 6�
.�0
�88
/ 6�
.�0
�88
/ 6�
.�0
167
/ �6
.70
low
100%
of w
ater
pip
e ne
twor
k is
wor
n ou
t
Tota
l in
Obl
ast:
�9�,
4�5
/ 8�
.50
��7,
�09
/ 64
.90
65,�
�6 /
18
.60
9�,5
4� /
�6 .
4018
1,68
4 /
51 .9
011
0,75
1 /
�1 .6
049
,940
/
14 .�
07,
000
/ � .
0079
1 /
0 .�0
Tota
l in
Ast
ana
city
:51
�,87
5 /
99 .9
051
�,87
5 /
99 .9
051
�,87
5 /
99 .9
051
�,87
5 /
99 .9
0 of
peo
ple
has
acce
ss to
wat
er s
uppl
y sy
stem
700
/ 0 .
10
Not
e*: R
C* -
Ray
on C
ente
r

85
ANNExES
Data on Water Quality and tariffs of Urban Water supply in Akmola oblast
№ Populated Area Quality Grade* Problem Type Cause of Problem Length of
Pipelines (km)Water Tariff
(KZT/m�)Water Tariff
Collection Rate (%)
1 Astana � 600 .00 �0 .6� 100
� Kokshetau � biologicalpurification system
has technical trouble
�80 .90 �4 .70 100
� Stepnogorsk � 10� .60 18 .89 100
4 Akkol, RC* � �1 .50 �9 .�� 80-85
5 Makinsk, RC* � metalspurification system
has technical trouble
5 .90 41 .70 100
6 Stepnyak, RC* � 1� .50 �00 .00 95 .6
7 Yereimantau, RC* � other secondary pollution
of water 54 .00 55 .00 98
8 Esil, RC* � 110 .�0 �1 .58 80
9 Derzhavinsk, RC* 1 biological absence of water
purification facilities �� .00 57 .�0 100
10 Atbasar, RC* � metals secondary pollution of water 199 .80 4� .80 95
11 Schuchinsk, RC* � all absence of water purification facilities 97 .50 �� .8� 95
1� Arshaly, RC* � �7 .00 45 .00 – LLP/�500
people/; 40 .9� – JSC “Kazshpal”
70 .00 – “Arshaly vodservice”
LLP; 85 .00 -JSC “Kazshpal”
1� Shortandy, RC* � �� .70 5� .90 80
14 Stantsionny � �5 .�0 �4 .70 100
15 Zavodskoi � 17 .00 18 .89 100
16 Aksy 1 biological/metals
purification system has technical
trouble �9 .80 50 .00 100
17 Zaozerny � �5 .00 �00 .00 95 .6
18 Bestobe 0 metals absence of water purification facilities – 0 .00
19 Krasnogosky � 17 .�0 160 .00 60
�0 Shantobe � 90 .00 19 .07 94
�1 Zholymbet � other secondary pollution of water 4� .00 �0 .�0 50
�� Zleleznodorojny �
�� Nauchny � other secondary pollution of water � .00 7� .00 7�
�4 Borovoe � 6 .00 �0 .00 56
�5 Alekseevka � �0 .00 no more than 50 .00 80
�6 Birlestik � secondary pollution of water 5 .00 no more than 50 .00 46
Total in Oblast: 1,�59 .00
Total in Astana 600 .00 Note: * quality of water ranges from grade 0 to grade 3 where very poor water is deemed under grade 0 and water meeting standard refers to grade 3. ; RC* – Rayon Center

UNDP Project National Plan for Integrated Water Resources Management and Water Efficiency in Kazakhstan
ACCEss to DRINKINg WAtER AND sANItAtIoN IN thE REPUblIC of KAzAKhstAN
86
Data on Access to Urban sewerage system in Akmola oblast
№ Populated Area
Type of Sewerage Supply System (ps ./%) Water Tariff
(KZT/m�)
Availability of Sewerage Treatment*
Length of Sewers (km)centralized
system septic pit outdoor toilet
1 Astana �84,�88 / 74 .70
has access to sewerage system
1�0,187 / �5 .�0 14,6� M and B �50,00
� Kokshetau 75,004 / 59 .�0 5,�67 / 4 .�0 46,404 / �6 .60 ��,08 M and B �18,7�
� Stepnogorsk 40,151 / 96 .60 1�5 / 0 .�0 1,�89 / � .10 19,50 M and B 10�,6
4 Akkol, RC* �,900 / �1 .40 10,6�1 / 78 .6 4�,00 0 18,00
5 Makinsk, RC* 5,000 / �9 .50 11,940 / 70 .50 0 11,00
6 Stepnyak, RC* 4,�10 / 100 0,00 0 0,00
7 Yereimantau, RC* �,718 / �0 .00 8,676 / 70 ��,00 0 ��,00
8 Esil, RC* 1,11� / 9 .00 �,0�6 / �4 .50 8,�60 / 66 .50 ��,09 M and B 5,80
9 Derzhavinsk, RC* 6,615 / 100 0,00 0 100% – worn out
10 Atbasar, RC* 7,�9� / �5 .40 4,�00 / 14 .60 17,��1 / 60 .�0 1�,�0 0 60,80
11 Schuchinsk, RC* 15,518 / �7 .50 1,�41 / � .00 �4,6�� / 59 .50 �9,55 M and B 81,90
1� Arshaly, RC* 600 / 11 .�0 4,7�5 / 88 .80 М �,�0
1� Shortandy, RC* 550 / 10 .00 �5� / 4 .60 4,69� / 85 .40 �4,14 M �7,10
14 Stantsionnyaccounted in data for Kokshetau
accounted in data for Kokshetau
��,08 M and B 10,07
15 Zavodskoi �,560 / 65 .�� 45� / 11 .5� 91� / �� .�4 19,50 M and B 1�,60
16 Aksy 5,500 / 100 0,00 01� .00
– in emergency conditions
17 Zaozerny 490 / 100 0,00 0 100% – worn out
18 Bestobe 6,8�8 / 100 0,00 0 0,00
19 Krasnogosky 99� / 100 .00 60,00 0 �,50
�0 Shantobe �,5�7 / 78 .�0 981 / �1 .70 �1,9� M and B �0,00
�1 Zholymbet 4,450 / 100 0,00 0 0,00
�� Zleleznodorojny
�� Nauchny �16 / �1 .�0 807 / 78 .90 0,00 0 �,40
�4 Borovoe 1,8�0 / �4 .�0 �,480 / 65 .70 150,00 0 17,00
�5 Alekseevka 1,�07 / 100 0,00 0 0,00
�6 Birlestik 455 / 100 0,00 0 0,00
Total in Akmola Oblast: 160,97� / 46 .00 14,67� / 4 .00 17�,5�1 / 50 518,80
Total in Astana city: �84,�88 / 74 .70 has access to sewerage system 1�0,187 / �5 .� �50,00
Note*: M – availability of mechanical treatment facilities; B – availability of biological treatment facilities; RC* – Rayon Center

87
ANNExES
Dat
a on
Acc
ess
to D
rin
kin
g W
ater
of g
ood
Qua
lity
of U
rban
Pop
ulat
ion
in A
lmat
y o
blas
t
№P
opul
ated
A
rea
Pop
ulat
ion
havi
ng a
cces
s to
wat
er
supp
ly (p
s ./%
)
Pop
ulat
ion
havi
ng
perm
anen
t (�
4 hr
s)
acce
ss to
w
ater
(ps .
/%)
Pop
ulat
ion
havi
ng
inte
rmitt
ent
(lim
ited)
ac
cess
to
wat
er (p
s ./%
)
Pop
ulat
ion
havi
ng
perm
anen
t (�4
hr
s) a
cces
s to
dr
inki
ng w
ater
of
goo
d qu
ality
(p
s ./%
)
Type
of W
ater
Sup
ply
(ps .
/%)
Leve
l of
Serv
ice
Mai
n R
easo
n fo
r Lo
w L
evel
of
Ser
vice
ce
ntra
lized
co
mm
on
stan
d pi
pe
wel
lde
liver
edot
her
1�
�4
56
78
910
111�
1�
1A
lmat
y1,
��5,
148
/ 99
.61
1�,�
5148
/
99 .6
11,
��5,
148
/ 99
.61
1,�0
7,6�
0 /
97 .4
0�7
,5�8
/ �
.�1
4,85
� /
0 .�9
high
�K
apsh
agai
�9,1
60 /
100
�9,1
60 /
100
�9,1
61 /
100
�8,9
�0 /
99
.40
�40
/ 0 .
60 m
ediu
m80
% o
f net
wor
k ne
eds
repl
acem
ent
�Ta
ldyk
orga
n96
,606
/ 9
0 .5
96,6
06 /
90
.50
96,6
06 /
90 .
5076
,858
/
7� .0
019
,748
/ 1
8 .5
10,1
41 /
9 .5
0 m
ediu
m40
% o
f net
wor
k ne
eds
repl
acem
ent
4Te
keli
16,7
�� /
70 .
416
,7��
/
70 .4
016
,7��
/ 7
0 .40
15,5
�6 /
65
.40
1,18
7 /
5 .00
7,0�
4 /
�9 .6
0 m
ediu
m7�
.5%
of n
etw
ork
need
s re
plac
emen
t
5Ta
lgar
, RC
*4�
,�50
/ 1
004�
,�50
/ 1
00�1
,�1�
/
7� .0
01�
,1�8
/
�8 .0
0lo
whi
gh le
vel o
f net
wor
k de
prec
iatio
n, p
erm
anen
t tr
oubl
e in
wat
er q
ualit
y
6U
shar
al, R
C*
9,��
9 /
51 .6
9,��
9 /
51 .6
09,
��9
/ 51
.60
�,09
5 /
11 .6
07,
��4
/ 40
.00
8,75
� /
48 .4
0m
ediu
m�0
% o
f net
wor
k ne
eds
repl
acem
ent
7Es
ik, R
C*
��,�
�0 /
80 .
���
,��0
/
80 .�
0��
,��0
/ 8
0 .�0
18,�
56 /
66
.00
�,96
4 /
14 .�
05,
500
/ 19
.80
med
ium
80%
of n
etw
ork
need
s re
plac
emen
t
8K
aske
len,
RC
*�7
,��0
/ 1
00�7
,��0
/ 1
00�7
,��0
/ 1
00�5
,540
/
95 .5
01,
680
/ 4 .
50m
ediu
m90
% o
f net
wor
k ne
eds
repl
acem
ent
9U
shto
be, R
C*
�,64
1 /
9 .4
�,64
1 /
9 .40
�,64
1 /
9 .40
�,60
4 /
9 .�0
�7 /
0 .1
0�5
,�59
/
90 .5
6lo
w47
,�%
of m
ain
pipe
line
need
s re
plac
emen
t, fr
eque
nt
emer
genc
ies
10Zh
arke
nt, R
C*
��,8
15 /
7� .
6��
,815
/
7� .6
0��
,815
/ 7
� .60
19,1
�5 /
61
.70
�,69
0 /
11 .9
8,�0
0 /
�6 .4
0hi
gh
11Sa
rkan
d, R
C*
15,�
47 /
100
15,�
47 /
100
15,�
47 /
100
�,�7
6 /
�� .0
011
,971
/
78 .0
0m
ediu
m61
% o
f net
wor
k ne
eds
repl
acem
ent
1�Zh
ansu
guro
v,
RC
*8,
8�0
/ 10
08,
8�0
/ 10
08,
8�0
/ 10
01,
895
/ �1
.50
6,9�
5 /
78 .5
0hi
gh
1�Sa
ryoz
ek, R
C*
1�,0
00 /
100
1�,0
00 /
100
1�,0
00 /
100
4,40
0 /
�6 .7
07,
600
/ 6�
.�m
ediu
m60
% o
f wat
er p
ipe
netw
ork
need
s re
plac
emen
t, fr
eque
nt
emer
genc
ies

UNDP Project National Plan for Integrated Water Resources Management and Water Efficiency in Kazakhstan
ACCEss to DRINKINg WAtER AND sANItAtIoN IN thE REPUblIC of KAzAKhstAN
88
1�
�4
56
78
910
111�
1�
14B
alpy
kbi
14,1
45 /
100
14,1
45 /
10
0�,
816
/ 19
.90
11,�
75 /
80
.10
med
ium
6�%
of n
etw
ork
need
s re
plac
emen
t, in
terr
upte
d su
pply
in s
umm
er
15K
arab
ulak
, R
C*
14,�
57 /
100
14,�
57 /
100
14,�
57 /
100
10,9
�0 /
76
.60
�,��
6 /
�� .4
0 m
ediu
m50
% o
f net
wor
k ne
eds
repl
acem
ent
16M
atai
�,60
0 /
100
�,60
0 /
100
1,89
5 /
7� .9
070
5 /
�7 .1
0m
ediu
m70
% o
f net
wor
k ne
eds
repl
acem
ent,
inte
rrup
ted
wat
er s
uppl
y
17M
ulal
y�5
0 /
100
�50
/ 10
0�5
0 /
100
med
ium
90%
of w
ater
pip
e ne
twor
k ne
eds
repl
acem
ent,
inte
rrup
ted
wat
er s
uppl
y
18D
osty
k�,
19�
/ 10
0�,
19�
/ 10
0�,
19�
/ 10
0�,
156
/ 98
.�0
�7 /
1 .7
0m
ediu
m50
% o
f net
wor
k ne
eds
repl
acem
ent
19U
lken
�,�0
7 /
100
�,�0
7 /
100
�,�0
7 /
100
med
ium
100%
of n
etw
ork
need
s re
plac
emen
t
�0B
oral
dai
9,84
� /
100
9,84
� /
100
9,84
� /
100
9,84
� /
100
med
ium
high
leve
l of n
etw
ork
depr
ecia
tion
�1P
ervo
mai
sky
7,49
9 /
100
7,49
9 /
100
7,49
9 /
100
med
ium
51%
of w
ater
pip
e ne
twor
k ne
eds
repl
acem
ent,
inte
rrup
ted
wat
er s
uppl
y in
w
inte
r sea
son
��P
okro
vka
�,�6
6 /
100
�,�6
6 /
100
�,�6
6 /
100
�,09
7 /
9� .�
0�6
9 /
7 .80
med
ium
79%
of n
etw
ork
need
s re
plac
emen
t
��Le
psi
700
/ �4
.570
0 /
�4 .5
070
0 /
�4 .5
01,
516
/ 5�
.60
640
/ ��
.40
low
inte
rrup
ted
supp
ly –
4-5
hrs
a
day
�4R
udni
chny
1,04
9 /
100
1,04
9 /
100
1,04
9 /
100
1,0�
1 /
98 .�
018
/ 1
.70
high
�5O
tege
n B
atyr
17,�
6� /
100
17,�
6� /
100
17,�
6� /
100
15,9
16 /
9�
.�0
1,�4
6 /
7 .80
high
�6Tu
yuk
1,4�
5 /
100
1,4�
5 /
100
1,4�
5 /
100
low
70%
of w
ater
pip
e ne
twor
k ne
eds
repl
acem
ent,
inte
rrup
ted
wat
er s
uppl
y
Tota
l in
Alm
aty
Obl
ast:
40�,
18�
/ 85
.7�7
6,46
4 /
80 .0
0�6
,719
/
5 .70
��0,
907
/ 70
.�0
�08,
�47
/ 65
.50
94,8
�6 /
�0
.�0
60,9
95 /
1�
.00
5,50
0 /
1 .�0
640
/ 0 .
10
Tota
l in
Alm
aty
city
:1,
��5,
148
/ 99
.61
1,��
5,14
8 /
99 .6
11,
��5,
148
/ 99
.61
1,�0
7,6�
0 /
97 .4
0�7
,5�8
/ �
.�1
4,85
� /
0 .�9

89
ANNExES
Data on Water Quality and tariffs of Urban Water supply in Almaty oblast
№ Populated Area Quality Grade* Problem Type Cause of Problem Length of
Pipelines (km)Water Tariff
(KZT/m�)Water Tariff
Collection Rate (%)
1 Almaty � �,�90 .00 9 .�� 100 .0
� Kapshagai � secondary pollution ��� .70 11 .0� 75 .0
� Taldykorgan � �55 .10 �1 .16 100 .0
4 Tekeli � 1�1 .00 15 .00 96 .0
5 Talgar, RC* 1 allabsence of water
purification facilities
11� .�0 11 .�1 95 .0
6 Usharal, RC* � �7 .50 4� .65 40 .0
7 Esik, RC* � 1�8 .00 9 .7� 98 .0
8 Kaskelen, RC* � high mineralization shortage of water 77 .60 �� .1� 100 .0
9 Ushtobe, RC* � 84 .50 6� .79 65 .0
10 Zharkent, RC* � 94 .50 9 .51 95 .0
11 Sarkand, RC* � 77 .00 �5 .�1 87 .0
1� Zhansugurov, RC* � 78 .60 44 .�4 47 .0
1� Saryozek, RC* � 1�0 .00 �� .16 67 .0
14 Balpykbi � 5� .�0 �7 .5� 96 .0
15 Karabulak, RC* � �8 .00 �7 .�0 100 .0
16 Matai � 14 .�0 74 .15 40 .5
17 Mulaly � � .10 74 .15 85 .0
18 Dostyk � �1 .10 74 .15 100 .0
19 Ulken � biologicalpurification system
has technical trouble
�4 .60 600 .00 per
person/month for WS&S services
100 .0
�0 Boraldai � 47 .00 17 .�9 95 .0
�1 Pervomaisky � �5 .00 �� .�8 96 .1
�� Pokrovka � 10 .40 18 .�1 96 .0
�� Lepsi
ground – �,
surface – �
biological/metals
absence of water purification
facilities
�00 .00 per person/month for
WS&S services 100 .0
�4 Rudnichny � 15 .00 11 .4� 97 .0
�5 Otegen Batyr � �5 .00 18 .�1 96 .0
�6 Tuyuk � � .10 16 .15 75 .0
Total in Almaty Oblast: 1,808 .60
Total in Almaty city: �,�90 .00
Note: * quality of water ranges from grade 0 to grade 3; very poor water is deemed under grade 0 and water meeting standard refers to grade 3; RC* – Rayon Center

UNDP Project National Plan for Integrated Water Resources Management and Water Efficiency in Kazakhstan
ACCEss to DRINKINg WAtER AND sANItAtIoN IN thE REPUblIC of KAzAKhstAN
90
Data on Access to Urban sewerage system in Almaty oblast
№ Populated Area
Type of Sewerage Supply System (ps ./%) Water Tariff
(KZT/m�)
Availability of Sewerage Treatment*
Length of Sewers (km)centralized
system septic pit outdoor toilet
1 Almaty 995,100 / 80 .�5 �44,900 / 19 .75 5,9� M and B 1,��� .00
� Kapshagai �7,771 / 96 .50 600 / 1 .50 789 / � .00 10,06 M and B 1�9 .90
� Taldykorgan 5�,587 / 50 .�0 5�,160 / 49 .80 15,�� M and B ��7 .60
4 Tekeli 10,8�6 / 45 .60 1�,911 / 54 .40 1�,18 M and B �7 .60
5 Talgar, RC* 16,0�9 / �7 .00 �7,�11 / 6� .00 7,61 0 51 .50
6 Usharal, RC* 18,085 / 100 .00 0,00 0 –
7 Esik, RC* �,078 / 11 .00 �4,74� / 88 .90 6,11 M and B 51 .10
8 Kaskelen, RC* 10,488 / �8 .�0 �6,7�� / 71 .80 ��,79 0 75 .10
9 Ushtobe, RC* 1,158 / 4 .10 �6,84� / 95 .90 4�,00 М �9 .00
10 Zharkent, RC* �,048 / 6 .60 �8,967 / 9� .40 �,�5 0 �1 .00
11 Sarkand, RC* �,176 / 14 .�0 1�,171 / 85 .80 14,71 0 1� .00
1� Zhansugurov, RC* 1,596 / �8 .�0 7,��4 / 71 .80 0 10 .70
1� Saryozek, RC* 1�,000 / 100 .00 0,00 0 –
14 Balpykbi �0� / 1 .40 1�,889 / 98 .60 6,66 0 4 .60
15 Karabulak, RC* 1,710 / 1� .00 1�,547 / 88 .00 18,00 M and B 11 .90
16 Matai �,600 / 100 0,00 0 –
17 Mulaly �50 / 100 .00 0,00 0 –
18 Dostyk 1,096 / 50 .00 1,097 / 50 .00 0 � .80
19 Ulken �,�07 / 100 .00600 .00 per
ps for WS&S services
0 14 .00
�0 Boraldai 5,666 / 57 .60 4,177 / 4� .40 18,44 0 1� .00
�1 Pervomaisky �,040 / �7 .� 5,459 / 7� .80 18,95 M and B 7 .50
�� Pokrovka �,�66 / 100 .00 0,00 0 –
�� Lepsi �,856 / 100 .00 0,00 0 –
�4 Rudnichny �05 / 70 .90 744 / 70 .90 �1,70 М 7 .00
�5 Otegen Batyr 16,�89 / 95 .00 87� / 5 .00 18,89 M and B �7 .50
�6 Tuyuk 1,4�5 / 100 .00 0,00 0 –
Total in Almaty Oblast: 168,�9� / �5 .8 �,�00 / 0 .70 �98,7�7 / 6� .50 76� .80
Total in Almaty city: 995,100 / 80 .�5 �44,900 / 19 .75 1,��� .00
Note*: M – availability of mechanical treatment facilities; B – availability of biological treatment facilities; WS&S – water supply and sewerage; RC* – Rayon Center

91
ANNExES
Dat
a on
Acc
ess
to D
rin
kin
g W
ater
of g
ood
Qua
lity
of U
rban
Pop
ulat
ion
in A
ktob
e o
blas
t
№P
opul
ated
Are
a
Pop
ulat
ion
havi
ng a
cces
s to
wat
er s
uppl
y (p
s ./%
)
Pop
ulat
ion
havi
ng
perm
anen
t (�4
hr
s) a
cces
s to
w
ater
(ps .
/%)
Pop
ulat
ion
havi
ng
inte
rmitt
ent
(lim
ited)
ac
cess
to
wat
er (p
s ./%
)
Pop
ulat
ion
havi
ng
perm
anen
t (�4
hr
s) a
cces
s to
dr
inki
ng w
ater
of
goo
d qu
ality
(p
s ./%
)
Typ
e of
Wat
er S
uppl
y (p
s ./%
)
Leve
l of
Serv
ice
Mai
n R
easo
n fo
r Lo
w
Leve
l of S
ervi
ce
cent
raliz
ed
com
mon
st
and
pipe
w
ell
delivered
othe
r
1A
ktob
e�5
0,61
4 /
100
�50,
614
/ 10
0�5
0,61
4 /
100
��0,
0�9
/ 87
.8�0
,575
/ 1
4 .�
med
ium
high
leve
l of
depr
ecia
tion
in te
rms
of
netw
ork
and
faci
littie
s
�A
lga,
RC
*1�
,418
/ 1
001�
,418
/ 1
001�
,418
/ 1
008,
18�
/ 65
.9�,
659
/ �9
.557
6 /
4 .6
med
ium
80%
of p
ipe
netw
ork
need
s re
plac
emen
t
�K
andy
agas
h, R
C*
�6,9
64 /
100
�6,9
64 /
100
�6,9
64 /
100
�6,9
64 /
100
med
ium
7�%
of p
ipe
netw
ork
need
s re
plac
emen
t
4K
hrom
tau,
RC
*17
,97�
/ 1
0017
,97�
/ 1
0017
,97�
/ 1
0015
,7�6
/ 8
7 .5
�,�4
6 /
1� .5
high
5Sh
alka
r, R
C*
�5,7
00 /
100
�5,7
00 /
100
�5,7
00 /
100
�,5�
6 /
1� .7
��,1
74 /
86 .
�m
ediu
m�5
% o
f pip
e ne
twor
k ne
eds
repl
acem
ent (
71
км)
6Te
mir
�,00
1 /
100
�,00
1 /
100
�,00
1 /
100
�,00
1 /
100
med
ium
100%
of w
ater
net
wor
k ne
eds
repl
acem
ent
7Em
ba1�
,8�9
/ 1
001�
,8�9
/ 1
001�
,8�9
/ 1
005,
00�
/ �9
7,8�
6 /
61lo
w87
% o
f pip
e ne
twor
k ne
eds
repl
acem
ent,
freq
uent
em
erge
ncie
s
8Sh
ubar
kudu
k,
RC
*11
,000
/ 1
0011
,000
/ 1
005,
170
/ 47
5,8�
0 /
5�m
ediu
m67
% o
f pip
e ne
twor
k ne
eds
repl
acem
ent
9Zh
em�,
500
/ 10
0�,
500
/ 10
0�,
500
/ 10
0�,
500
/ 10
0lo
w10
0% o
f wat
er n
etw
ork
need
s re
plac
emen
t, sh
orta
ge o
f wat
er
10K
enki
yak
11,1
67 /
100
11,1
67 /
100
6,89
� /
61 .7
4,�7
4 /
�8 .�
med
ium
6�,5
% o
f pip
e ne
twor
k ne
eds
repl
acem
ent,
inte
rrup
ted
wat
er s
uppl
y
Tota
l in
Obl
ast:
�7�,
590
/ 99
.8�6
�,4�
� /
96 .8
11,1
67 /
��5
1,4�
� /
9� .9
�95,
004
/ 78
.878
,585
/ �
1 .0
576
/ 0 .
�
Not
e*: R
C* –
Ray
on C
ente
r

UNDP Project National Plan for Integrated Water Resources Management and Water Efficiency in Kazakhstan
ACCEss to DRINKINg WAtER AND sANItAtIoN IN thE REPUblIC of KAzAKhstAN
9�
Data on Water Quality and tariffs of Urban Water supply in Aktobe oblast
№ Populated Area Quality Grade*
Problem Type Cause of Problem Length of
Pipelines (km)Water Tariff
(KZT/m�)Water Tariff
Collection Rate (%)
1 Aktobe � metals purification system has technical trouble 545 .70 �� .08 100
� Alga, RC* � 6� .00 �1 .89 9�
� Kandyagash, RC* � �� .00 �7 .70 100
4 Khromtau, RC* � �05 .00 18 .00 100
5 Shalkar, RC* � �84 .10 47 .51 85
6 Temir � other secondary pollution 8 .50 40 .�0 87
7 Emba � other sand penetration in well �� .70 140 .00 5�
8 Shubarkuduk, RC* � metals purification system has
technical trouble �4 .60 �5 .�0 95
9 Zhem � �6 .00 �0 .70
10 Kenkiyak � other absence of water purification facilities �� .50 �9 .00 100
Total in Oblast: 1,�44 .10
Note: * quality of water ranges from grade 0 to grade 3; very poor water is deemed under grade 0 and water meeting standard refers to grade 3; RC* – Rayon Center
Data on Access to Urban sewerage system in Aktobe oblast
№ Populated Area Type of Sewerage Supply System (ps ./%) Water Tariff
(KZT/m�)
Availability of Sewerage Treatment*
Length of Sewers (km)centralized system septic pit outdoor toilet
1 Aktobe 169,415 / 67 .6 751 / 0 .� 80,448 / �� .1 �0 .9� M and B �65 .0
� Alga, RC* 8,18� / 65 .9 4,��5 / �4 .� 19 .9� M �� .0
� Kandyagash, RC* 19,800 / 7� .4 600 / � .� 6,564 / �4 .� �� .�4 B �0 .0
4 Hromtau, RC* 11,741 / 65 .� �,64� / 14 .7 �,590 / �0 .0 19 .11 M and B 67 .1
5 Shalkar, RC* �,461 / 9 .6 ��,��9 / 90 .4 55 .8� M �7 .0
6 temir �,001 / 100 .0 0 .00 0 0 .0
7 Emba �,4�0 / 18 .9 10,410 / 81 .1 0 �� .0
8 Shubarkuduk, RC* �,870 / �5 .0 7,1�0 / 65 .0 �7 .00 M 7 .�
9 Zhem �,500 / 100 .0 0 �9 .0
10 Kenkiyak 5,58� / 50 .0 5,584 / 50 .0 �� .1� 0 15 .5
Total in Aktobe Oblast: ��6,97� / 60 .7 �,99� / 1 .0 14�,�01 / �8 .� 584 .8
Note*: M – availability of mechanical treatment facilities; B – availability of biological treatment facilities; RC* – Rayon Center

9�
ANNExES
Dat
a on
Acc
ess
to D
rin
kin
g W
ater
of g
ood
Qua
lity
of U
rban
Pop
ulat
ion
in A
tyra
u o
blas
t
№P
opul
ated
Are
a
Pop
ulat
ion
havi
ng a
cces
s to
wat
er s
uppl
y (p
s ./%
)
Pop
ulat
ion
havi
ng
perm
anen
t (�4
hr
s) a
cces
s to
w
ater
(ps .
/%)
Pop
ulat
ion
havi
ng
inte
rmitt
ent
(lim
ited)
acc
ess
to w
ater
(ps .
/%)
Pop
ulat
ion
havi
ng
perm
anen
t (�4
hrs
) ac
cess
to d
rink
ing
wat
er o
f goo
d qu
ality
(ps .
/%)
Typ
e of
Wat
er S
uppl
y (p
s ./%
)
Leve
l of
Serv
ice
Mai
n R
easo
n fo
r Lo
w L
evel
of
Serv
ice
cent
raliz
ed
com
mon
sta
nd
pipe
w
ell
deliv
ered
1A
tyra
u14
9,77
6 /
100
149,
776
/ 10
014
9,77
6 /
100
1��,
116
/ 8�
.��6
,660
/ 1
7 .8
high
�K
ulsa
ry, R
C*
�8,9
18 /
58 .
4�8
,918
/ 5
8 .4
�6,6
40 /
5� .
8�,
�78
/ 4 .
6�0
,598
/ 4
1 .7
med
ium
59%
of n
etw
ork
need
s re
plac
emen
t, in
terr
upte
d w
ater
sup
ply
�In
derb
or, R
C*
7,96
4 /
69 .5
7,96
4 /
69 .5
7,54
4 /
65 .8
4�0
/ � .
7�,
504
/ �0
.5m
ediu
m58
% o
f net
wor
k ne
eds
repl
acem
ent,
inte
rrup
ted
wat
er s
uppl
y
4K
arat
onac
coun
ted
in
data
of K
ulsa
ry
tow
n
acco
unte
d in
da
ta o
f Kul
sary
to
wn
acco
unte
d in
dat
a of
K
ulsa
ry to
wn
acco
unte
d in
da
ta o
f Kul
sary
to
wn
med
ium
inte
rrup
ted
wat
er s
uppl
y
5K
osch
agyl
588
/ 16
.558
8 /
16 .5
588
/ 16
.5�,
97�
/ 8�
.5lo
w10
0% o
f net
wor
k ne
eds
repl
acem
ent,
inte
rrup
ted
wat
er s
uppl
y
6B
aish
onas
1,69
5 /
91 .0
1,69
5 /
91 .0
1,69
5 /
9116
8 /
9 .0
med
ium
50%
of n
etw
ork
need
s re
plac
emen
t
7D
osso
r9,
700
/ 10
0 9,
700
/ 10
0 9,
700
/ 10
0 m
ediu
m68
% o
f net
wor
k ne
eds
repl
acem
ent,
inte
rrup
ted
wat
er s
uppl
y
8Is
kene
n45
� /
100
45�
/ 10
045
� /
100
med
ium
50%
of n
etw
ork
need
s re
plac
emen
t
9K
omso
mol
78�
/ 10
078
� /
100
78�
/ 10
0 m
ediu
min
terr
upte
d w
ater
sup
ply
10K
oshk
ar5�
0 /
100
5�0
/ 10
05�
0 /
100
med
ium
inte
rrup
ted
wat
er s
uppl
y
11M
akat
, RC
*1�
,1�0
/ 1
001�
,1�0
/ 1
001�
,1�0
/ 1
00 m
ediu
min
terr
upte
d w
ater
sup
ply
1�B
alyk
shi
14,1
54 /
9� .
414
,154
/ 9
� .4
14,1
54 /
9� .
410
,057
/ 6
6 .4
4,09
7 /
�7 .0
1,00
0 /
6 .6
med
ium
high
leve
l of d
epre
ciat
ion
in
term
s of
wat
er p
ipie
net
wor
k
1�Zh
umys
ker
1,98
1 /
48 .1
1,98
1 /
48 .1
1,98
1 /
48 .1
1,50
8 /
�6 .6
47�
/ 11
.51,
884
/ 45
.7�5
6 /
6 .�
med
ium
high
leve
l of d
epre
ciat
ion
in
term
s of
wat
er p
ipie
net
wor
k
Tota
l in
Aty
rau
Obl
ast:
��9,
661
/ 88
.�16
8,05
8 /
64 .6
61,6
0� /
�� .
716
5,91
1 /
6� .8
195,
7��
/ 75
.���
,9�8
/ 1
�4,
856
/ 1 .
9�5
,5�6
/ 9
.8
Not
e: *R
C* –
Ray
on C
ente
r

UNDP Project National Plan for Integrated Water Resources Management and Water Efficiency in Kazakhstan
ACCEss to DRINKINg WAtER AND sANItAtIoN IN thE REPUblIC of KAzAKhstAN
94
Data on Water Quality and tariffs of Urban Water supply in Atyrau oblast
№ Populated Area Quality Grade* Problem Type Cause of Problem Length of
Pipelines (km)Water Tariff
(KZT/m�)Water Tariff
Collection Rate (%)
1 Atyrau � 176 .80 15 .�9 86 .00
� Kulsary, RC* � 67 .70 46 .95 70 .�0
� Inderbor, RC* � other purification system has technical trouble 55 .00 �� .6� 85 .00
4 Karaton � �� .00 46 .95 70 .00
5 Koschagyl � metals absence of water purification facilities 4 .�0 1� .40 40 .00
6 Baishonas � metals absence of water purification facilities 6 .�0 74 .51 per
person /month 100 .00
7 Dossor � �1 .00 79 .09 �8 .00
8 Iskinen � metals absence of water purification facilities � .00 74 .51 per
person /month 100 .00
9 Komsomol � 5 .�0 74 .09 �0 .00
10 Koshkar � 8 .10 74 .09 �0 .00
11 Makat, RC* � metals purification system has technical trouble 58 .�0 61 .70 70 .�0
1� Balykshi � �5 .00 15 .�9 86 .00
1� Zhumysker � 7 .�0 15 .�9 86 .00
Total in Atyrau Oblast: 459 .90
Note: * quality of water ranges from grade 0 to grade 3; very poor water is deemed under grade 0 and water meeting standard refers to grade 3; RC* – Rayon Center .
Data on Access to Urban sewerage system in Atyrau oblast
№ Populated Area Type of Sewerage Supply System (ps ./%) Water Tariff
(KZT/m�)
Availability of Sewerage Treatment*
Length of Sewers (km)centralized system septic pit outdoor toilet
1 Atyrau 76,5�5 / 51 .1 150 / 1 .0 7�,091 / 48 .8 40 .96 М 180 .�
� Kulsary, RC* �7,184 / 54 .9 891 / 1 .8 �1,440 / 4� .� �� .56 М 70 .8
� Inderbor, RC* �,��1 / �0 .0 �80 / � .� 7,767 / 67 .7 11 .74 M and B �� .0
4 Karaton accounted in data for Kulsary town
accounted in data for Kulsary town
accounted in data for Kulsary
town �� .56 М
accounted in data for
Kulsary town
5 Koschagyl �,560 / 100 0 .00 0 0
6 Baishonas 1,86� / 100 0 .00 0 0
7 Dossor 9,700 / 100 0 .00 0 0
8 Iskinen 45� / 100 0 .00 0 0
9 Komsomol 78� / 100 0 .00 0 0
10 Koshkar 5�0 / 100 0 .00 0 0
11 Makat, RC* 4,�16 / �� .9 914 / 7 .1 7,890 / 59 .9 50 .88 0 �� .7
1� Balykshi 5,00� / �� .0 1,40� / 9 .� 8,749 / 57 .7 17 .00 0 5 .8
1� Zhumysker 9 / 0 .� 4,11� / 99 .8 0 .00 0 0
Total in Atyrau Oblast: 116,�59 / 44 .7 �,746 / 1 .5 1�9,9�7 / 5� .8 �01 .6
Note*: M – availability of mechanical treatment facilities; B – availability of biological treatment facilities; RC* – Rayon Center

95
ANNExES
Dat
a on
Acc
ess
to D
rin
kin
g W
ater
of g
ood
Qua
lity
of U
rban
Pop
ulat
ion
in E
ast-
Kaz
akhs
tan
obl
ast
№P
opul
ated
Are
a
Pop
ulat
ion
havi
ng a
cces
s to
wat
er
supp
ly (p
s ./%
)
Pop
ulat
ion
havi
ng
perm
anen
t (�
4 hr
s)
acce
ss to
w
ater
(ps .
/%)
Pop
ulat
ion
havi
ng
inte
rmitt
ent
(lim
ited)
ac
cess
to
wat
er (p
s ./%
)
Pop
ulat
ion
havi
ng
perm
anen
t (�4
hr
s) a
cces
s to
dr
inki
ng w
ater
of
goo
d qu
ality
(p
s ./%
)
Type
of W
ater
Sup
ply
(ps .
/%)
Leve
l of
Serv
ice
Mai
n R
easo
n fo
r Lo
w L
evel
of
Serv
ice
cent
raliz
ed
com
mon
st
and
pipe
w
ell
delivered
othe
r
1�
�4
56
78
910
111�
1�
1U
st-K
amen
ogor
sk�1
0,00
0 /
100
�10,
000
/ 10
0�1
0,00
0 /
100
�6�,
500
/ 85
46,5
00 /
15
med
ium
depr
ecia
tion
of n
etw
ork
and
faci
litie
s by
85%
�A
yago
z, R
C*
�8,0
97 /
100
�8,0
97 /
100
�8,0
97 /
100
�8,5
7� /
75
9,5�
4 /
�5m
ediu
m56
% o
f net
wor
k ne
eds
repl
acem
ent
�Za
isan
, RC
*9,
��0
/ 10
09,
��0
/ 10
09,
��0
/ 10
0�,
185
/ ��
.77,
045
/ 76
.�m
ediu
m80
% o
f net
wor
k ne
eds
repl
acem
ent
4Zy
ryan
ovsk
, RC
*41
,�00
/ 1
0041
,�00
/ 1
0041
,�00
/ 1
00�9
,507
/ 9
5 .7
1,79
� /
4 .�
med
ium
60%
of n
etw
ork
need
s re
plac
emen
t
5Se
mip
alat
insk
��4,
5�6
/ 89
.4��
4,5�
6 /
89 .4
��4,
5�6
/ 89
.418
9,�6
5 /
75 .4
�5,1
61 /
14
�6,6
�1 /
10
.6m
ediu
m60
% o
f net
wor
k ne
eds
repl
acem
ent,
perm
anen
t pro
blem
s w
ith q
ualit
y of
wat
er
6R
idde
r51
,�50
/ 1
0051
,�50
/ 1
0041
,�86
/ 8
0 .4
10,0
64 /
19 .
6 m
ediu
m84
% o
f net
wor
k ne
eds
repl
acem
ent
7Sh
emon
aiha
, RC
*17
,100
/ 1
0017
,100
/ 1
0017
,100
/ 1
005,
814
/ �4
11,�
86 /
66
high
8Se
rebr
yans
k10
,800
/ 1
0010
,800
/ 1
0010
,800
/ 1
006,
545
/ 60
.64,
�55
/ �9
.4m
ediu
m44
% o
f net
wor
k ne
eds
repl
acem
ent,
prob
lem
s w
ith q
ualit
y of
wat
er
9Sh
ar5,
98�
/ 6�
5,98
� /
6�5,
98�
/ 6�
�40
/ � .
55,
74�
/ 60
.5�,
515
/ �7
high
10K
uhat
ov, R
C*
9,90
0 /
100
9,90
0 /
100
9,90
0 /
100
9,40
0 /
9550
0 /
5m
ediu
m81
% o
f net
wor
k ne
eds
repl
acem
ent
11G
lubo
koe,
RC
*9,
400
/ 10
09,
400
/ 10
09,
400
/ 10
04,
5�5
/ 48
.14,
874
/ 51
.9hi
gh
1�A
ktog
ai1,
904
/ 40
.51,
904
/ 40
.51,
904
/ 40
.5�4
� /
7 .�
1,56
1 /
�� .�
�,79
6 /
59 .5
med
ium
50%
of n
etw
ork
need
s re
plac
emen
t
1�B
elag
ash
996
/ 10
099
6 /
100
188
/ 18
.980
8 /
81 .1
med
ium
inte
rrup
ted
wat
er s
uppl
y
14Zh
ezke
nt10
,500
/ 1
0010
,500
/ 1
0010
,500
/ 1
009,
706
/ 9�
.476
5 /
7 .6
high
50%
of n
etw
ork
need
s re
plac
emen
t
15A
ltai
�,��
0 /
100
�,��
0 /
100
�,��
0 /
100
�,��
0 /
100
high
16B
elou
sovk
a4,
956
/ 51
.6�
4,95
6 /
51 .6
�4,
956
/ 51
.6�
4,�8
0 /
45 .6
�57
6 /
64,
644
/ 5�
.�7
med
ium
high
dep
reci
atio
n of
ele
ctri
cal a
nd
pum
ping
equ
ipm
ent
17Ve
rhne
bere
zov
1,69
� /
60 .5
1,69
� /
60 .5
1,69
� /
60 .5
1,6�
� /
5870
/ �
.51,
107
/ �9
.5hi
gh
18A
uezo
v4,
656
/ 10
04,
656
/ 10
01,
956
/ 4�
�,70
0 /
58 m
ediu
min
terr
upte
d su
pply

UNDP Project National Plan for Integrated Water Resources Management and Water Efficiency in Kazakhstan
ACCEss to DRINKINg WAtER AND sANItAtIoN IN thE REPUblIC of KAzAKhstAN
96
1�
�4
56
78
910
111�
1�
19Zh
angi
stob
e0
/ 0
5,�0
0 /
100
�0Zh
arm
a1,
�79
/ 10
01,
�79
/ 10
01,
�79
/ 10
0 m
ediu
min
terr
upte
d su
pply
�1Su
ykbu
lak
0 /
091
/ 1
00lo
wno
nope
ratio
nal c
ondi
tion
of w
ater
su
pply
sys
tem
��N
ovay
a B
uhta
rma
5,00
0 /
6� .5
5,00
0 /
6� .5
�,97
8 /
49 .7
1,0�
� /
1� .8
�,00
0 /
�7 .5
med
ium
70%
of n
etw
ork
need
s re
plac
emen
t
��O
ktya
brsk
y�,
005
/ 10
0�,
005
/ 10
0�,
005
/ 10
0m
ediu
m10
0% o
f net
wor
k ne
eds
repl
acem
ent
�4P
ribr
ezhn
y1,
100
/ 10
01,
100
/ 10
099
0 /
9011
0 /
10m
ediu
m76
% o
f net
wor
k ne
eds
repl
acem
ent
�5Tu
gyl
7,45
0 /
100
7,45
0 /
100
7,45
0 /
100
1,�0
0 /
16 .1
6,�5
0 /
8� .9
med
ium
�9%
of n
etw
ork
need
s re
plac
emen
t
�6M
olod
ezhn
y, R
C*
�,�0
0 /
100
�,�0
0 /
100
�,�0
0 /
100
�,09
4 /
6� .5
1,�0
6 /
�6 .5
med
ium
60%
of n
etw
ork
need
s re
plac
emen
t
�7A
subu
lak
0 /
00
/ 0
0 /
0�,
780
/ 90
.8�8
0 /
9 .�
�8B
elog
orsk
y0
/ 0
0 /
00
/ 0
554
/ 10
0
�9O
gnye
vka
400
/ 4�
.140
0 /
4� .1
400
/ 4�
.15�
8 /
56 .9
low
57%
of n
etw
ork
need
s re
plac
emen
t, in
terr
upte
d su
pply
– �
hr
s in
a d
ay
�0P
ervo
mai
sky
5,�1
4 /
100
5,�1
4 /
100
5�14
/ 1
005�
14 /
100
med
ium
50%
of n
etw
ork
need
s re
plac
emen
t
�1U
st-T
alov
ka
10,0
00 /
100
10,0
00 /
100
10,0
00 /
100
10,0
00 /
100
high
��Zu
bovk
a1,
800
/ 7�
1,80
0 /
7�1,
800
/ 7�
1�0
/ 5 .
�1,
670
/ 66
.870
0 /
�8 m
ediu
m60
% o
f net
wor
k ne
eds
repl
acem
ent
��M
alee
vsk
0 /
00
/ 0
0 /
0�,
119
/ 10
0
�4U
lba
6,00
0 /
100
6,00
0 /
100
6,00
0 /
100
6,00
0 /
100
high
�5Sh
ulbi
nsk
�,50
0 /
100
�,50
0 /
100
�,50
0 /
100
�,50
0 /
100
high
Tota
l in
East
-K
azak
hsta
n O
blas
t: 80
1,75
8 /
9� .6
794,
4�7
/ 9�
.77,
��1
/ 0 .
97�
4,�1
7 /
85 .7
646,
967
/ 75
.415
4,79
1 /
18 .1
54,6
55 /
6 .4
�80
/ 0 .
1

97
ANNExES
Data on Water Quality and tariffs of Urban Water supply in East-Kazakhstan oblast
№ Populated Area Quality Grade* Problem Type Cause of Problem Length of
Pipelines (km)Water Tariff
(KZT/m�)
Water Tariff Collection Rate (%)
1 Ust-Kamenogorsk � 490 .50 9 .80 100 .00
� Ayagoz, RC* � other purification system has technical trouble 84 .15 18 .45 100 .00
� Zaisan, RC* � other purification system has technical trouble 58 .80 19 .00 95 .00
4 Zyryanovsk, RC* � 15� .40 1� .54 97 .00
5 Semipalatinsk 1 biological / metals secondary pollution �11 .00 8 .9� 84 .70
6 Ridder � metals purification system has technical trouble 1�4 .8� 6 .69 100 .00
7 Shemonaiha, RC* � 8� .50 9 .79 90 .00
8 Serebryansk � metals secondary pollution 54 .00 18 .5� 85 .00
9 Shar � 44 .54 �5 .00 7� .00
10 Kuhatov, RC* � other secondary pollution 99 .00 7 .70 90 .00
11 Glubokoe, RC* � �1 .00 9 .8� 90 .00
1� Aktogai � �5 .00 48 .�4 100 .00
1� Belagash � 194 .�1 97 .00
14 Zhezkent � 58 .80 �9 .66 100 .00
15 Altai � 6 .�0 8 .94 100 .00
16 Belousovka � �8 .70 9 .89 100 .00
17 Verhneberezovsky � �� .10 11 .77 100 .00
18 Auezov � 10 .00 18 .99 100 .00
19 Zhangistobe � - - -
�0 Zharma � - - -
�1 Suykbulak � - -
�� Novaya Buhtarma � mineralization purification system has technical trouble �6 .00 14 .48 78 .00
�� Oktyabrsky � biological / metals purification system has technical trouble 8 .00 14 .48 78 .00
�4 Pribrezhny � biological / other purification system has technical trouble �5 .00 99 .00 90 .00
�5 Tugyl � �4 .50 �5 .00
�6 Molodezhny, RC* � 4� .00 86 .00 per ps; 1� .00 per m� if water meter
installed 75 .00
�7 Asubulak � – – –
�8 Belogorsky � – – –
�9 Ognyevka 1 biological / metals /mineralization
absence of water purification facilities 9 .�0
�0 Pervomaisky � 64 .60 84 .64 70 .00
�1 Ust-Talovka � 8� .50 9 .79 100 .00
�� Zubovka � 14 .�0 11 .�1 100 .00
�� Maleevsk � – – –
�4 Ulba � 7 .50
�5 Shulbinsk � 15 .75 10 .50 89 .00
Total in East-Kazakhstan Oblast: �,0�� .76
Note: * quality of water ranges from grade 0 to grade 3; very poor water is deemed under grade 0 and water meeting standard refers to grade 3; RC* – Rayon Center

UNDP Project National Plan for Integrated Water Resources Management and Water Efficiency in Kazakhstan
ACCEss to DRINKINg WAtER AND sANItAtIoN IN thE REPUblIC of KAzAKhstAN
98
Data on Access to Urban sewerage system in East-Kazakhstan oblast
№ Populated area Type of Sewerage Supply System (ps ./%) Water Tariff
(KZT/m�)
Availability of Sewerage Treatment*
Length of Sewers (km)centralized system septic pit outdoor toilet
1 Ust-Kamenogorsk �6�,500 / 85 .00 46,501 / 15 .0 10 .55 M and B �98 .40
� Ayagoz, RC* 4,95� / 1� .00 1,905 / 5 .0 �1,��9 / 8� .0 � .10 M and B �0 .00
� Zaisan, RC* 9,��0 / 100 .0 0 .00 0 –
4 Zyryanovsk, RC* �7,0�0 / 65 .50 5,540 / 1� .4 8,740 / �1 .1 15 .�0 M and B 97 .50
5 Semipalatinsk 1��,10� / 54 .60 119,044 / 45 .4 7 .67 Мо �1� .�7
6 Ridder �4,559 / 67 .�0 4,�00 / 8 .� 1�,591 / �4 .5 6 .�� M and B 65 .10
7 Shemonaiha, RC* �,�51 / 19 .60 855 / 5 .0 1�,894 / 75 .4 8 .91 M and B 54 .70
8 Serebryansk 4,640 / 4� .00 6,160 / 57 .0 �� .41 M and B �6 .00
9 Shar 9,497 / 100 .0 0 .00 0 –
10 Kuhatov, RS* 9,894 / 99 .90 6 / 0 .1 8 .18 M and B 41 .50
11 Glubokoe, RC* 4,��� / 44 .90 5,178 / 55 .1 11 .48 M and B �6 .00
1� Aktogai 4,700 / 100 .0
1� Belagash 996 / 100 .0 0 .00 0 –
14 Zhezkent 7,065 / 67 .�0 �,4�5 / �� .7 11 .4� M and B �9 .40
15 Altai 1,848 / 79 .66 47� / �0 .�4 8 .60 M and B � .50
16 Belousovka �,654 / �8 .10 5,946 / 61 .9 11 .48 M and B 18 .90
17 Verhneberezovsky �,800 / 100 .0 0 .00 0 –
18 Auezov 1,956 / 4� .00 �,700 / 58 .0 0 8 .10
19 Zhangistobe 5,�00 / 100 .0 0 .00 0 –
�0 Zharma 1,�79 / 100 .0 0 .00 0 –
�1 Suykbulak 91 / 100 .0 0 .00 0 –
�� Novaya Buhtarma �,8�0 / 47 .90 4,170 / 5� .1 11 .75 M and B 18 .90
�� Oktyabrsky ��7 / 11 .� 1,778 / 88 .7 11 .75 0 –
�4 Pribrezhny �00 / �7 .�0 690 / 6� .7 110 / 10 .0 195 .00 Мо 4 .00
�5 Tugyl 500 / 6 .70 6,950 / 9� .� 0 � .00
�6 Molodezhny, RC* �,094 / 6� .50 1,�06 / �6 .5 86 .00/ps M and B 18 .00
�7 Asubulak 4,160 / 100 .0 0 .00 0 –
�8 Belogorsky 554 / 100 .0 0 .00 0 –
�9 Ognyevka 9�8 / 100 .0 0 .00 0 � .1 – do not operate
�0 Pervomaisky 1,460 / �8 1,105 / �1 .� �,649 / 50 .8 66 .�0 0 16 .50
�1 Ust-Talovka 10,000 / 100 8 .91 M and B 54 .70
�� Zubovka �,500 / 100 .0 0 .00 0 –
�� Maleevsk �,119 / 100 .0 0 .00 0 –
�4 Ulba �,777 / 46 .� �,��� / 5� .7 Мо 4 .60
�5 Shulbinsk �,�17 / 6� .�4 �64 / 10 .4 919 / �6 .�� 10 .56 M and B 18 .00
Total in East-Kazakhstan Oblast: 5�1,94� / 60 .9 14,89� / 1 .7 �19,959 / �7 .4 1,141 .�0
Note*: M – availability of mechanical treatment facilities; B – availability of biological treatment facilities; RC* – Rayon Center

99
ANNExES
Dat
a on
Acc
ess
to g
ood
Qua
lity
of D
rin
kin
g W
ater
of U
rban
Pop
ulat
ion
in z
ham
byl o
blas
t
№P
opul
ated
Are
a
Pop
ulat
ion
havi
ng a
cces
s to
wat
er s
uppl
y (p
s ./%
)
Pop
ulat
ion
havi
ng
inte
rmitt
ent
(lim
ited)
acc
ess
to
wat
er (p
s ./%
)
Pop
ulat
ion
havi
ng
perm
anen
t (�4
hrs
) ac
cess
to d
rink
ing
wat
er
of g
ood
qual
ity (p
s ./%
)
Type
of W
ater
Sup
ply
(ps .
/%)
Leve
l of
Serv
ice
Mai
n R
easo
n fo
r Lo
w L
evel
of
Serv
ice
cent
raliz
ed
com
mon
sta
nd
pipe
w
ell
deliv
ered
othe
r
1Ta
raz
��6,
�10
/ 10
0��
6,�1
0 /
100
18�,
�1�
/ 56
14�,
998
/ 44
med
ium
high
leve
l of d
epre
ciat
ion
of
netw
ork
and
faci
litie
s
�Zh
anat
as, R
C*
16,7
66 /
100
16,7
66 /
100
14,8
71 /
88 .
71,
895
/ 11
.� m
ediu
min
terr
upte
d w
ater
sup
ply
�K
arat
au, R
C*
9,�6
8 /
86 .7
9,�6
8 /
86 .7
10,9
96 /
56 .
16,
�7�
/ ��
�,��
� /
11 .9
med
ium
47,5
% o
f wat
er p
ipe
netw
ork
need
s re
plac
emen
t, in
terr
upte
d w
ater
sup
ply
4Sh
u�6
,70�
/ 1
00�6
,70�
/ 1
00�0
,85�
/ 5
6 .8
15,8
50 /
4� .
� m
ediu
m60
% o
f wat
er p
ipe
netw
ork
need
s re
plac
emen
t
5G
vard
eisk
y0
/ 0
0 /
05,
51�
/ 10
0 m
ediu
m n
onop
erat
iona
l con
ditio
n of
w
ater
sup
ply
syst
em
6Lu
govo
i9,
69�
/ 10
09,
69�
/ 10
01,
851
/ 18
.67,
84�
/ 81
.4hi
gh
7G
rano
togo
rsk
1,4�
0 /
100
1,4�
0 /
100
1,4�
0 /
100
high
8O
ital
�,88
0 /
100
�,88
0 /
100
�,88
0 /
100
high
9A
kbak
ai0
/ 0
0 /
01,
�84
/ 10
0lo
ww
ater
impo
rted
by
vehi
cles
10A
ksue
k0
/ 0
0 /
01,
468
/ 10
0lo
ww
ater
impo
rted
by
vehi
cles
11M
irny
0 /
00
/ 0
1,10
0 /
100
low
wat
er im
port
ed b
y ve
hicl
es
1�M
ynar
al71
� /
100
71�
/ 10
071
� /
100
low
inte
rrup
ted
wat
er s
uppl
y
1�H
anta
u98
0 /
100
980
/ 10
098
0 /
100
med
ium
inte
rrup
ted
wat
er s
uppl
y
14Sh
igan
ak�,
5��
/ 10
0�,
5��
/ 10
0�,
5��
/ 10
0lo
w65
% o
f wat
er p
ipe
netw
ork
need
s re
plac
emen
t, in
terr
upte
d w
ater
sup
ply
15Ta
sotk
el0
/ 0
0 /
088
0 /
100
low
nono
pera
tiona
l con
ditio
n of
w
ater
sup
ply
syst
em
16K
okta
l0
/ 0
0 /
01,
��0
/ 10
0lo
wno
nope
ratio
nal c
ondi
tion
of
wat
er s
uppl
y sy
stem
Tota
l in
Zham
byl O
blas
t: 41
6,�6
5 /
96 .8
�0,�
60 /
7�8
6,00
5 /
89 .8
��1,
88�
/ 5�
.918
4,�8
� /
4� .9
7,61
� /
1 .8
6,�8
4 /
1 .5

UNDP Project National Plan for Integrated Water Resources Management and Water Efficiency in Kazakhstan
ACCEss to DRINKINg WAtER AND sANItAtIoN IN thE REPUblIC of KAzAKhstAN
100
Data on Water Quality and tariffs of Urban Water supply in zhambyl oblast
№ Populated Area Quality Grade* Problem Type Cause of Problem Length of
Pipelines (km)Water Tariff
(KZT/m�)Water Tariff
Collection Rate (%)
1 Taraz � 416 .6 8 .�8 81
� Zhanatas, RC* � other secondary pollution of water 141 .1 7� .40 100
� Karatau, RC* � 96 .0 10 .50 75
4 Shu � 1�� .0 17 .80 95
5 Gvardeisky � 0 .0 0 .00 0
6 Lugovoi � �4 .4 �9 .00 68
7 Granotogorsk � 11 .6 74 .68 75
8 Oital � 5 .5 74 .68 75
9 Akbakai � 0 .0
10 Aksuek � 40 .0 1�0 .00 100
11 Mirny � 0 .0
1� Mynaral 1 biological/mineralization/metals
absence of water purification facilities 1 .8
1� Hantau � � .5
14 Shiganak � biological/mineralization/metals
absence of water purification facilities 19 .0
15 Tasotkel � 0 .0 0 .00 0
16 Koktal � 0 .0 0 .00 0
Total in Zhambyl Oblast: 89� .5
Note: * quality of water ranges from grade 0 to grade 3; very poor water is deemed under grade 0 and water meeting standard refers to grade 3; RC* – Rayon Center.
Data on Access to Urban sewerage system in zhambyl oblast
№ Populated areaType of Sewerage Supply System (ps ./%) Water Tariff
(KZT/m�)
Availability of Sewerage Treatment*
Length of Sewers (km)centralized system septic pit outdoor toilet
1 Taraz 99,�88 / �0 .4 ��7,0�� / 69 .6 4 .00 0 �6� .7
� Zhanatas, RC* 14,871 / 88 .7 1,895 / 11 .� 4� .70 M and B 55 .�
� Karatau, RC* 9,878 / 50 .4 �00 / 1 .0 9,5�� / 48 .6 4 .84 M and B 46 .0
4 Shu 19,048 / 51 .9 8,�88 / �� .6 9,�66 / �5 .5 15 .60 M 54 .7
5 Gvardeisky 5,51� / 100 0 .00 0 0 .0
6 Lugovoi 9,69� / 100 0 .00 0 0 .0
7 Granotogorsk 1,4�0 / 100 0 .00 0 0 .0
8 Oital �,880 / 100 0 .00 0 0 .0
9 Akbakai 1,�84 / 100 0 .00 0 0 .0
10 Aksuek 1,468 / 100 0 .00 0 0 .0
11 Mirny 1,100 / 100 0 .00 0 0 .0
1� Mynaral 714 / 100 0 .00 0 0 .0
1� Hantau 980 / 100 0 .00 0 0 .0
14 Shiganak �,5�� / 100 0 .00 0 0 .0
15 Tasotkel 880 / 100 0 .00 0 0 .0
16 Koktal 1,��0 / 100 0 .00 0 0 .0
Total in Zhambyl Oblast: 14�,085 / �� .� 8,488 / � .0 �78,589 / 64 .7 418 .7
Note*: M – availability of mechanical treatment facilities; B – availability of biological treatment facilities; RC* – Rayon Center

101
ANNExES
Dat
a on
Acc
ess
to g
ood
Qua
lity
of D
rin
kin
g W
ater
of U
rban
Pop
ulat
ion
in W
est-
Kaz
akhs
tan
obl
ast
№P
opul
ated
Are
a
Pop
ulat
ion
havi
ng a
cces
s to
wat
er s
uppl
y (p
s ./%
)
Pop
ulat
ion
havi
ng
inte
rmitt
ent
(lim
ited)
acc
ess
to w
ater
(ps .
/%)
Pop
ulat
ion
havi
ng
perm
anen
t (�4
hrs
) ac
cess
to d
rink
ing
wat
er o
f goo
d qu
ality
(ps .
/%)
by T
ype
of W
ater
Sup
ply
(ps .
/%)
Leve
l of
Serv
ice
Mai
n R
easo
n fo
r Lo
w L
evel
of
Ser
vice
ce
ntra
lized
co
mm
on s
tand
pi
pe
wel
lde
liver
edot
her
1U
rals
k19
9,4�
7 /
100
199,
4�7
/ 10
018
4,07
1 /
9� .�
15,�
56 /
7 .7
med
ium
high
leve
l of d
epre
ciat
ion
in te
rms
of n
etw
ork
and
faci
litie
s
�A
ksai
, RC
*�4
,��0
/ 1
00�4
,��0
/ 1
00�1
,48�
/ 9
��,
7�8
/ 8
high
�D
erku
l5,
075
/ 10
05,
075
/ 10
0�,
10�
/ 61
.11,
97�
/ �8
.9 m
ediu
mhi
gh le
vel o
f dep
reci
atio
n in
te
rms
of n
etw
ork
4Za
chag
ansk
1�,7
86 /
100
1�,7
86 /
100
10,8
46 /
78 .
7�,
940
/ �1
.� m
ediu
mhi
gh le
vel o
f dep
reci
atio
n in
te
rms
of n
etw
ork
5K
rugl
ooze
rnoe
�,54
� /
100
�,54
� /
100
�,54
� /
100
low
80%
of w
ater
pip
e ne
twor
k ne
eds
repl
acem
ent,
inte
rrup
ted
wat
er s
uppl
y
6B
urlin
�08
/ 6 .
9�0
8 /
6 .9
�08
/ 6 .
9�,
799
/ 9�
.1lo
w40
% o
f wat
er p
ipe
netw
ork
need
s re
plac
emen
t, in
terr
upte
d w
ater
sup
ply
7Zh
elay
evo
0 /
00
/ 0
1,51
6 /
100
low
non
oper
atio
nal c
ondi
tion
of w
ater
sup
ply
syst
em
Tota
l in
Wes
t-K
azak
hsta
n O
blas
t �5
6,�5
9 /
98 .�
�,75
1 /
1 .4
�5�,
508
/ 96
.9��
9,70
9 /
88 .�
�6,5
50 /
10 .
� 4,
�15
/ 1 .
6
Not
e*: R
C* –
Ray
on C
ente
r

UNDP Project National Plan for Integrated Water Resources Management and Water Efficiency in Kazakhstan
ACCEss to DRINKINg WAtER AND sANItAtIoN IN thE REPUblIC of KAzAKhstAN
10�
Data on Water Quality and tariffs of Urban Water supply in West-Kazakhstan oblast
№ Populated Area Quality Grade*
Problem Type Cause of Problem Length of
Pipelines (km)Water Tariff
(KZT/m�)Water Tariff
Collection Rate (%)
1 Uralsk � �44 .0 14 .0 100 .0
� Aksai, RC* � 11� .7 41 .6 95 .0
� Derkul � �9 .0 14 .0 100 .0
4 Zachagansk � 48 .8 14 .0 100 .0
5 Krugloozernoe � 4 .6 subsidy 100 .0
6 Burlin � � .0 �4 .0 100 .0
7 Zhelayevo � other no agency responsible for water quality monitoring 0 .0 0 .0 0 .0
Total in West-Kazakhstan Oblast: 55� .1
Note: * quality of water ranges from grade 0 to grade 3; very poor water is deemed under grade 0 and water meeting standard refers to grade 3; RC* – Rayon Center .
Data on Access to Urban sewerage system in West-Kazakhstan oblast
№ Populated Area
Type of Sewerage Supply System (ps ./%) Water Tariff
(KZT/m�)
Availability of Sewerage Treatment*
Length of Sewers (km)centralized system septic pit outdoor toilet
1 Uralsk 169,707 / 85 .1 1,�10 / 0 .6 �8,510 / 14 .� 1� .18 M and B �06
� Aksai, RC* 16,4�6 / 48 .0 7,460 / �1 .8 10,��4 / �0 .� �1 .00 M and B �7
� Derkul �,004 / �9 .5 �,071 / 60 .5 1� .18 M and Baccounted in the assets of
State Communal Enterprise “Oral Su Arnasy”
4 Zachagansk 7,41� / 5� .8 6,�7� / 46 .� 1� .18 M and Baccounted in the assets of
State Communal Enterprise “Oral Su Arnasy”
5 Krugloozernoe �,54� / 100 0 .00 0 0
6 Burlin �,007 / 100 0 .00 0 0
7 Zhelayevo 1,516 / 100 0 .00 0 0
Total in West-Kazakhstan Oblast: 195,550 / 75 .0 8,670 / � .� 56,�54 / �1 .7 �4�
Note*: M – availability of mechanical treatment facilities; B – availability of biological treatment facilities; RC* – Rayon Center

10�
ANNExES
Dat
a on
Acc
ess
to D
rin
kin
g W
ater
of g
ood
Qua
lity
of U
rban
Pop
ulat
ion
in K
arag
anda
obl
ast
№P
opul
ated
Are
a
Pop
ulat
ion
havi
ng a
cces
s to
wat
er s
uppl
y (p
s ./%
)
Pop
ulat
ion
havi
ng
perm
anen
t (�4
hr
s) a
cces
s to
w
ater
(ps .
/%)
Pop
ulat
ion
havi
ng
inte
rmitt
ent
(lim
ited)
acc
ess
to w
ater
(ps .
/%)
Pop
ulat
ion
havi
ng
perm
anen
t (�4
hrs
) ac
cess
to d
rink
ing
wat
er o
f goo
d qu
ality
(ps .
/%)
Typ
e of
Wat
er S
uppl
y (p
s ./%
)
Leve
l of
Serv
ice
Mai
n R
easo
n fo
r Lo
w L
evel
of
Serv
ice
cent
raliz
ed
com
mon
sta
nd
pipe
w
ell
delivered
other
1�
�4
56
78
910
111�
1�
1K
arag
anda
4�9,
507
/ 99
.84�
9,50
7 /
99 .8
4�9,
507
/ 99
.84�
9,50
7 /
99 .8
860
/ 0 .
�m
ediu
mhi
gh le
vel o
f dep
reci
atio
n in
te
rms
of n
etw
ork
and
faci
litie
s
�A
bai,
RC
*�4
,�00
/ 1
00 .0
�4,�
01 /
100
.0��
,900
/ 9
8 .8
�00
/ 1 .
�lo
whi
gh le
vel o
f dep
reci
atio
n in
te
rms
of n
etw
ork
and
faci
litie
s,
inte
rrup
ted
wat
er s
uppl
y
�K
arka
ralin
sk, R
C*
10,5
10 /
100
.010
,510
/ 1
00 .0
10,5
10 /
100
.0�,
101
/ �0
8,40
9 /
80hi
gh
4B
alkh
ash
5�,�
04 /
100
.05�
,�04
/ 1
00 .0
5�,�
04 /
100
.050
,749
/ 9
5 .�
�,55
5 /
4 .8
med
ium
15 .4
% o
f wat
er p
ipe
netw
ork
need
s re
plac
emen
t – 6
� km
5Zh
eska
zgan
74,4
70 /
100
.074
,470
/ 1
00 .0
74,4
70 /
100
.070
,1�0
/ 9
4 .�
4,�5
0 /
5 .8
high
6K
araz
hal
9,�0
0 /
87 .6
9,�0
0 /
87 .6
6,50
0 /
61 .9
�,70
0 /
�5 .7
1,�0
0 /
1� .4
med
ium
80%
of w
ater
pip
e ne
twor
k ne
eds
repl
acem
ent,
inte
rrup
ted
wat
er s
uppl
y
7Sa
ran
47,�
00 /
100
.047
,�00
/ 1
00 .0
47,�
00 /
100
.046
,401
/ 9
8 .1
899
/ 1 .
9hi
gh
8Sa
tpae
v67
,�04
/ 1
00 .0
67,�
04 /
100
.067
,�04
/ 1
00 .0
64,8
61 /
96 .
4�,
44�
/ � .
6hi
gh
9Te
mir
tau
170,
000
/ 10
0 .0
170,
000
/ 10
0 .0
170,
000
/ 10
0 .0
14�,
650
/ 84
.5�6
,�50
/ 1
5 .6
med
ium
high
leve
l of d
epre
ciat
ion
in
term
s of
net
wor
k an
d fa
cilit
ies
10Sc
hakh
tinsk
5�,5
61 /
100
.05�
,561
/ 1
00 .0
51,1
94 /
97 .
41,
�67
/ � .
6m
ediu
m�6
.6%
of w
ater
pip
e ne
twor
k ne
eds
repl
acem
ent –
�7 .
7 km
11P
rioz
ersk
19,�
41 /
98 .
919
,�41
/ 9
8 .9
18,6
41 /
95 .
860
0 /
� .1
�10
/ 1 .
1m
ediu
m70
% o
f wat
er p
ipe
netw
ork
need
s re
plac
emen
t
1�A
tasu
, RC
*5,
0��
/ �0
.95,
0��
/ �0
.95,
0��
/ �0
.94,
608
/ �8
.�4�
5 /
� .6
11,�
7�
/ 69
.1m
ediu
m4�
% o
f wat
er p
ipe
netw
ork
need
s re
plac
emen
t
1�K
ievk
a, R
C*
0 /
06,
810
/ 10
0 .0
14O
saka
rovk
a, R
C*
7,98
9 /
100 .
07,
989
/ 10
0 .0
7,98
9 /
100 .
05,
59�
/ 70
�,�9
7 /
�0m
ediu
m77
% o
f wat
er p
ipe
netw
ork
need
s re
plac
emen
t
15Iz
umru
dny
400
/ 10
0 .0
400
/ 10
0 .0
400
/ 10
0 .0
400
/ 10
0 .0
400
/ 10
0 .0
med
ium
inte
rrup
ted
wat
er s
uppl
y
16K
arab
as a
ccou
nted
in
data
of A
bai
tow
n
acc
ount
ed in
da
ta o
f Aba
i to
wn
acc
ount
ed in
da
ta o
f Aba
i to
wn
med
ium
high
leve
l of d
epre
ciat
ion
in
term
s of
net
wor
k

UNDP Project National Plan for Integrated Water Resources Management and Water Efficiency in Kazakhstan
ACCEss to DRINKINg WAtER AND sANItAtIoN IN thE REPUblIC of KAzAKhstAN
104
1�
�4
56
78
910
111�
1�
17Ti
par
9,70
0 /
100 .
09,
700
/ 10
0 .0
9,70
0 /
100 .
0
9,70
0 /
100 .
0 ha
s ac
cess
to
wat
er s
uppl
y sy
stem
18Yu
zhny
�,90
0 /
100 .
0�,
900
/ 10
0 .0
�,90
0 /
100 .
0�,
900
/ 10
0 .0
med
ium
70%
of w
ater
pip
e ne
twor
k ne
eds
repl
acem
ent
19Sa
rysh
agab
5,10
0 .0
/ 10
0 .0
5,10
0 .0
/ 10
0 .0
5,10
0 .0
/ 10
0 .0
med
ium
inte
rrup
ted
wat
er s
uppl
y
�0Sh
ashu
bai
1,96
9 /
100 .
01,
969
/ 10
0 .0
1,96
9 /
100 .
0m
ediu
min
terr
upte
d w
ater
sup
ply
�1K
usho
ky4,
�00
/ 10
0 .0
4,�0
0 /
100 .
04,
�00
/ 10
0 .0
4,07
5 /
971�
5 /
�hi
gh
��G
. Mus
tafin
�,19
8 /
100 .
0�,
198
/ 10
0 .0
�,19
8 /
100 .
0�0
6 /
1� .9
1,89
� /
86 .1
high
��K
yzyl
zhar
�74
/ 18
.��7
4 /
18 .�
�74
/ 18
.��7
4 /
18 .�
1,��
6 /
81 .7
low
70%
of w
ater
pip
e ne
twor
k ne
eds
repl
acem
ent
�4K
arag
aily
5,�0
4 /
100 .
05,
�04
/ 10
0 .0
5,�0
4 /
100 .
041
6 /
84,
788
/ 9�
high
�5Sh
ubar
kol
701
/ 10
0 .0
701
/ 10
0 .0
701
/ 10
0 .0
med
ium
�6M
olod
ezhn
y6,
400
/ 10
0 .0
6,40
0 /
100 .
06,
400
/ 10
0 .0
6,40
0 /
100 .
0m
ediu
m65
% o
f wat
er p
ipe
netw
ork
need
s re
plac
emen
t
�7A
ktas
acc
ount
ed
in d
ata
of
Kar
agan
da c
ity
acc
ount
ed
in d
ata
of
Kar
agan
da c
ity
acc
ount
ed in
dat
a of
Kar
agan
da c
ity
acc
ount
ed
in d
ata
of
Kar
agan
da c
ity
acc
ount
ed
in d
ata
of
Kar
agan
da c
ity
med
ium
inte
rrup
ted
wat
er s
uppl
y
�8Zh
ezdi
4,89
8 /
100 .
04,
898
/ 10
0 .0
4,89
8 /
100 .
01,
76�
/ �6
.0
�,1�
5 /
64 .0
hi
gh
�9K
aras
akpa
i�,
00�
/ 10
0 .0
�,00
� /
100 .
0�,
00�
/ 10
0 .0
�,00
� /
100 .
0m
ediu
m70
% o
f wat
er p
ipe
netw
ork
need
s re
plac
emen
t
�0A
gady
r8,
170
/ 10
0 .0
8,17
0 /
100 .
08,
170
/ 10
0 .0
1,89
5 /
�� .�
6,�7
5 /
76 .8
med
ium
6�%
of w
ater
pip
e ne
twor
k ne
eds
repl
acem
ent
�1A
kzha
l�,
878
/ 10
0 .0
�,87
8 /
100 .
0�,
909
/ 75
969
/ �5
med
ium
40%
of w
ater
pip
e ne
twor
k ne
eds
repl
acem
ent,
inte
rrup
ted
wat
er s
uppl
y
��A
kcha
tau
/
1,4�
�/
100 .
0lo
w n
onop
erat
iona
l con
ditio
n of
w
ater
sup
ply
syst
em
��D
aryi
nsky
865
/ 10
0 .0
865
/ 10
0 .0
865
/ 10
0 .0
med
ium
81%
of w
ater
pip
e ne
twor
k ne
eds
repl
acem
ent,
inte
rrup
ted
wat
er s
uppl
y
�4N
izhn
i Kai
rakt
y91
� /
100 .
091
� /
100 .
091
� /
100 .
0m
ediu
mhi
gh le
vel o
f dep
reci
atio
n in
te
rms
of fa
cilit
ies

105
ANNExES
1�
�4
56
78
910
111�
1�
�5Ve
rhni
Kai
rakt
y60
9 /
100 .
060
9 /
100 .
060
9 /
100 .
060
9 /
100 .
0m
ediu
mhi
gh le
vel o
f dep
reci
atio
n in
te
rms
of fa
cilit
ies
�6M
oiyn
ty�,
180
/ 10
0 .0
�,18
0 /
100 .
0�,
180
/ 10
0 .0
med
ium
70%
of w
ater
pip
e ne
twor
k ne
eds
repl
acem
ent,
inte
rrup
ted
wat
er s
uppl
y
�7S .
Sei
fulli
n0
/ 0
0 /
00
/ 0
1,�0
0 /
100 .
0lo
ww
ater
sup
ply
syst
em h
as n
ot
been
put
into
ope
ratio
n
�8G
ulsh
at70
0 /
100 .
070
0 /
100 .
070
0 /
100 .
070
0 /
100 .
0m
ediu
mhi
gh le
vel o
f dep
reci
atio
n in
te
rms
of n
etw
ork
�9K
onyr
at4,
170
/ 10
0 .0
4,17
0 /
100 .
04,
170
/ 10
0 .0
�,��
6 /
808�
4 /
�0m
ediu
mhi
gh le
vel o
f dep
reci
atio
n in
te
rms
of n
etw
ork
40Sa
yak
�,70
0 /
100 .
0�,
700
/ 10
0 .0
�,70
0 /
100 .
0�,
960
/ 80
740
/ �0
med
ium
high
leve
l of d
epre
ciat
ion
in
term
s of
net
wor
k
41Sh
ugys
Kon
yrat
400
/ 10
0 .0
400
/ 10
0 .0
400
/ 10
0 .0
400
/ 10
0 .0
med
ium
high
leve
l of d
epre
ciat
ion
in
term
s of
net
wor
k
4�Zh
aire
m9,
800
/ 10
0 .0
9,80
0 /
100 .
09,
800
/ 10
0 .0
9,80
0 /
100 .
0hi
gh
4�Zh
amby
l0
/ 0
0 /
00
/ 0
�09
/ 10
0 .0
44A
ktas
�4�
/ 10
0 .0
�4�
/ 10
0 .0
�4�
/ 10
0 .0
med
ium
inte
rrup
ted
wat
er s
uppl
y
45Zh
eska
zgan
acc
ount
ed in
da
ta o
f Sat
paev
to
wn
acc
ount
ed in
da
ta o
f Sat
paev
to
wn
acc
ount
ed in
dat
a of
Sat
paev
tow
n
acc
ount
ed in
da
ta o
f Sat
paev
to
wn
acc
ount
ed in
da
ta o
f Sat
paev
to
wn
high
46A
ktau
5,��
8 /
87 .�
5,��
8 /
87 .�
5,��
8 /
87 .�
4,05
4 /
66 .�
1,�8
4 /
�178
5 /
1� .8
med
ium
7�%
of w
ater
pip
e ne
twor
k ne
eds
repl
acem
ent
47D
olin
sky
0 /
00
/ 0
0 /
04,
050
/ 10
0 .0
low
adeq
uate
wat
er q
ualit
y co
ntro
l is
not
ava
ilabl
e
48N
ovod
olin
sky
�,�9
8 /
�4 .8
�,�9
8 /
�4 .8
�,�9
8 /
�4 .8
4,�0
� /
65 .�
low
100 .
0% o
f wat
er p
ipe
netw
ork
need
s re
plac
emen
t
49B
otak
ara
(Uly
anov
sky)
746
/ 10
0 .0
746
/ 10
0 .0
746
/ 10
0 .0
746
/ 10
0 .0
high
50Sh
akha
n8,
88�
/ 88
.88,
88�
/ 88
.88,
88�
/ 88
.81,
118
/ 11
.�m
ediu
m85
% o
f wat
er p
ipe
netw
ork
need
s re
plac
emen
t, in
terr
upte
d w
ater
sup
ply
Tota
l in
Kar
agan
da
Obl
ast:
1,07
0,55
8 /
96 .8
1,01
�,5�
7 /
91 .�
58,0
18 /
5 .4
997,
�69
/ 90
.�98
7,56
� /
89 .�
8�,9
96 /
7 .5
��,0
��
/ � .
91,
510
/ 0 .
11,
4��
/ 0 .
1

UNDP Project National Plan for Integrated Water Resources Management and Water Efficiency in Kazakhstan
ACCEss to DRINKINg WAtER AND sANItAtIoN IN thE REPUblIC of KAzAKhstAN
106
Data on Water Quality and tariffs of Urban Water supply in Karaganda oblast
№ Populated Area Quality Grade* Problem Type Cause of Problem Length of Pipelines
(km)Water Tariff
(KZT/m�)
Water Tariff Collection Rate (%)
1 � � 4 5 6 7 8
1 Karaganda � 1,0�� .00 �7 .7 98 .�
� Abai, RC* � biological/metals
secondary pollution of water 57 .80 �0 .� 78 .9
� Karkaralinsk, RC* � �9 .10 54 .1 100 .0
4 Balkhash � 165 .00 14 .� 100 .0
5 Zheskazgan � mineralization purification system has technical trouble �97 .�0 1� .5 100 .0
6 Karazhal � 1�8 .00 6� .� 100 .0
7 Saran � ��5 .00 �0 .8 100 .0
8 Satpaev � 511 .00 8 .� 100 .0
9 temirtau � �01 .00 18 .58 -LLP ”Nijni Byef”; �1 .88 – LLP
“Okzhetpes”98 .�
10 Schakhtinsk � 104 .60 �7 .6 98 .7
11 Priozersk � other purification system has technical trouble �0 .60 84 .8 100 .0
1� Atasu, RC* � 57 .70 �4 .7 100 .0
1� Kievka, RC* � �5 .00 0 .0 0 .0
14 Osakarovka, RC* � 79 .00 �5 .0 50 .0
15 Izumrudny � 6 .00 14 .0 9� .0
16 Karabas � biological/metals
secondary pollution of water 10 .00 15 .4 80 .0
17 Tipar � �0 .00 1� .4 100 .0
18 Yuzhny � 19 .00 14 .5 100 .0
19 Saryshagab � 15 .50 11 .4
�0 Shashubai � 16 .50 16 .8
�1 Kushoky � 47 .00 �1 .8 100 .0
�� Gabiden Mustafin � 9 .60 11 .� 100 .0
�� Kyzylzhar � 5 .00 44 .7 100 .0
�4 Karagaily � 1� .80 60 .0 100 .0
�5 Shubarkol �
�6 Molodezhny � �8 .40 �9 .0 95 .0
�7 Aktas � accounted in assets of Karaganda city �7 .7 98 .�
�8 Zhezdi � �� .00 8 .� 100 .0
�9 Karasakpai � 15 .00 �7 .5 90 .0
�0 Agadyr � 60 .00 �0 .5 100 .0
�1 Akzhal � �0 .00 9 .� 100 .0
�� Akchatau � metals absence of water purification facilities – 0 .0 0 .0
�� Daryinsky � 5 .50 48 .� 76 .0

107
ANNExES
1 � � 4 5 6 7 8
�4 Nizhni Kairakty � biological/other
absence of water purific ation facilities � .00 �� .� 100 .0
�5 Verhni Kairakty � 6 .00 48 .� 100 .0
�6 Moiynty � 56 .40 1�6 .6 76 .0
�7 S . Seifullin � – 0 .0 0 .0
�8 Gulshat � �0 .1 100 .0
�9 Konyrat � �1 .00 �0 .1 100 .0
40 Sayak � 18� .00 �0 .1 100 .0
41 Shugys Konyrat � �0 .1 100 .0
4� Zhairem � 170 .�0 �6 .� 100 .0
4� Zhambyl � – 0 .0 0 .0
44 Aktas � � .00 �� .� 100 .0
45 Zheskazgan � accounted in assets of Satpaev city 8 .� 100 .0
46 Aktau � �� .40 4� .� 8� .0
47 Dolinsky � – 0 .0 0 .0
48 Novodolinsky � metals/ other secondary pollution of water �1 .50 �8 .0 90 .0
49 Botakara � 7 .50 �� .0 100 .0
50 Shakhan � metals/ other secondary pollution of water �1 .�0 49 .6 97 .0
Total in Karaganda Oblast: �,819 .60
Note: * quality of water ranges from grade 0 to grade 3; very poor water is deemed under grade 0 and water meeting standard refers to grade 3; RC* – Rayon Center

UNDP Project National Plan for Integrated Water Resources Management and Water Efficiency in Kazakhstan
ACCEss to DRINKINg WAtER AND sANItAtIoN IN thE REPUblIC of KAzAKhstAN
108
Data on Access to Urban sewerage system in Karaganda oblast
№ Populated Area Type of Sewerage Supply System (ps ./%) Water
Tariff (KZT/m�)
Availability of Sewerage Treatment*
Length of Sewers (km)centralized system septic pit outdoor toilet
1 � � 4 5 6 7 8
1 Karaganda �67,965 / 85 .5 1�,771 / � .� 48,6�8 / 11 .� �1 .7� M and B 6�� .00
� Abai, RC* ��,900 / 98 .8 �00 / 1 .� 19 .49 M and B 5� .70
� Karkaralinsk, RC* 1,577 / 15 .0 5�4 / 5 .0 8,409 / 80 .0 5� .60 0 11 .80
4 Balkhash 48,5�4 / 91 .0 �,555 / 4 .8 �,��5 / 4 .� 7 .99 0 157 .00
5 Zheskazgan 6�,517 / 8� .9 11,95� / 16 .1 4 .95 M and B �5� .75
6 Karazhal 5,�50 / 50 .0 �,100 / �0 .0 �,150 / �0 .0 18 .66 0 8� .�0
7 Saran 4�,1�8 / 91 .� 4,16� / 8 .9 �� .�9 M and B 60 .70
8 Satpaev 60,�45 / 89 .5 95� / 1 .4 6,106 / 9 .1 7 .�8 М �69 .00
9 temirtau 1�6,694 / 74 .5 4�,�06 / �5 .6 �1 .7� M and B �88 .70
10 Schakhtinsk 19,55� / �7 .� 1,787 / � .4 �1,��1 / 59 .4 �7 .84 M and B 96 .�0
11 Priozersk 18,641 / 95 .8 810 / 4 .� 101 .44 0 4� .50
1� Atasu, RC* �,609 / 16 .0 1�,697 / 84 .0 40 .7� М 10 .00
1� Kievka, RC* 6,810 / 100 .0 0 .00 0 –
14 Osakarovka, RC* 8� / 1 .0 �,196 / 40 .0 4,711 / 59 .0 0 11 .40
15 Izumrudny 400 / 100 .0 0 .00 0 –
16 Karabas �,400 / 100 .0 0 .00 0 –
17 Tipar / / /
18 Yuzhny �,900 / 100 .0 0 .00 0 –
19 Saryshagab / / /
�0 Shashubai / / /
�1 Kushoky 1,175 / �8 .0 �0,�5 / 7� .0 10 .44 0 7 .00
�� Gabiden Mustafin �06 / 1� .9 1,89� / 86 .1 0 � .�0
�� Kyzylzhar 1,500 / 100 .0 0 .00 0 –
�4 Karagaily �60 / 5 .0 156 / � .0 4,788 / 9� .0 �� .00 0 1� .00
�5 Shubarkol / / /
�6 Molodezhny 5,600 / 87 .5 800 / 1� .5 0 4� .15
�7 Aktas accounted in data of Karaganda city
accounted in data of Karaganda city
accounted in data of Karaganda city �1 .7� M and B accounted in assets
of Karaganda city
�8 Zhezdi accounted in data of Satpaev town
accounted in data of Satpaev town
accounted in data of Satpaev town 7 .�8 M accounted in assets
of Satpaev town
�9 Karasakpai �,00� / 100 .0 0 .00 0 –
�0 Agadyr 1,705 / �0 .8 487 / 6 .0 5,978 / 7� .� 19 .�0 M 17 .50
�1 Akzhal �,909 / 75 .0 969 / �5 .0 11 .�5 0 �5 .00
�� Akchatau 1,4�� / 100 .0 0 .00 0 –
�� Daryinsky 865 / 100 .0 0 .00 0 –
�4 Nizhni Kairakty 91� / 100 .0 0 .00 0 –
�5 Verhni Kairakty 609 / 100 .0 0 .00 0 –
�6 Moiynty �,180 / 100 .0 0 .00 0 –
�7 S . Seifullin 1,�00 / 100 .0 0 .00 0 –

109
ANNExES
1 � � 4 5 6 7 8
�8 Gulshat 700 / 100 .0 0 .00 0 –
�9 Konyrat �,��6 / 80 .0 8�4 / �0 .0 7 .99 B �5 .00
40 Sayak �,960 / 80 .0 740 / �0 .0 8 .99 B 1� .00
41 Shugys Konyrat 400 / 100 .0 0 .00 0 –
4� Zhairem 5,500 / 56 .0 4,�00 / 44 .0 16 .�1 0 �� .80
4� Zhambyl �09 / 100 .0 0 .00 0 –
44 Aktas �4� / 100 .0 0 .00 0 –
45 Zheskazgan accounted in data of Satpaev town
accounted in data of Satpaev town
accounted in data of Satpaev town 7 .�8 M accounted in assets
of Satpaev town
46 Aktau �,515 / 57 .4 1,658 / �7 .1 950 / 15 .5 18 .66 M and B 1� .40
47 Dolinsky 4,050 / 100 .0 0 .00 0 –
48 Novodolinsky 1,88� / �8 .5 �,709 / 41 �,009 / �0 .5 5� .�9 0 9 .�0
49 Botakara (Ulyanovsky) 746 / 100 .0 0 .00 0 –
50 Shakhan 7,650 / 76 .5 �,�50 / �� .5 18 .66 M and B �0 .00
Total in Karaganda Oblast: 817,49� / 7� .9 �7,�87 / � .4 �50,645 / �� .7 � 174 .�0
Note*: M – availability of mechanical treatment facilities; B – availability of biological treatment facilities, RC* – Rayon Center

UNDP Project National Plan for Integrated Water Resources Management and Water Efficiency in Kazakhstan
ACCEss to DRINKINg WAtER AND sANItAtIoN IN thE REPUblIC of KAzAKhstAN
110
Dat
a on
Acc
ess
to D
rin
kin
g W
ater
of g
ood
Qua
lity
of U
rban
Pop
ulat
ion
in K
osta
nai
obl
ast
№P
opul
ated
Are
a
Pop
ulat
ion
havi
ng a
cces
s to
wat
er
supp
ly (p
s ./%
)
Pop
ulat
ion
havi
ng
perm
anen
t (�4
hr
s) a
cces
s to
w
ater
(ps .
/%)
Pop
ulat
ion
havi
ng
inte
rmitt
ent
(lim
ited)
acc
ess
to w
ater
(ps .
/%)
Pop
ulat
ion
havi
ng
perm
anen
t (�4
hrs
) ac
cess
to d
rink
ing
wat
er o
f goo
d qu
ality
(ps .
/%)
Typ
e of
Wat
er S
uppl
y (p
s ./%
)
Leve
l of
Serv
ice
Mai
n R
easo
n fo
r Lo
w L
evel
of
Ser
vice
ce
ntra
lized
co
mm
on
stan
d pi
pe
wel
lde
liver
ed
other
1�
�4
56
78
910
111�
1�
1K
osta
nai
�0�,
559
/ 10
0�0
,�55
9 /
100
�0�,
559
/ 10
016
9,1�
7 /
8� .5
��,4
�� /
16 .
5m
ediu
mhi
gh le
vel o
f dep
reci
atio
n in
term
s of
net
wor
k an
d fa
cilit
ies
�Zh
etik
ara,
RC
*�5
,0�5
/ 7
9 .�
�5,0
�5 /
79 .
��5
,0�5
/ 7
9 .�
��,�
45 /
74
1,68
0 /
5 .�
6,50
0 /
�0 .7
med
ium
60,7
% o
f wat
er
pipe
net
wor
k ne
eds
repl
acem
ent
�A
rkal
yk�7
,859
/ 1
00�7
,859
/ 1
0017
,�08
/ 6
1 .8
10,6
51 /
�8 .
�m
ediu
m70
% o
f wat
er p
ipe
netw
ork
need
s re
plac
emen
t
4Li
sako
vsk
�8,�
54 /
100
�8,�
54 /
100
�8,�
54 /
100
med
ium
60%
of w
ater
pip
e ne
twor
k ne
eds
repl
acem
ent
5R
udny
9�,9
76 /
100
9�,9
76 /
100
9�,9
76 /
100
88,9
57 /
95 .
74,
019
/ 4 .
�m
ediu
m11
% o
f wat
er p
ipe
netw
ork
need
s re
plac
emen
t – �
7 .6
km
6K
arab
alyk
, RC
*11
,768
/ 1
0011
,768
/ 1
0011
,768
/ 1
008,
00�
/ 68
�,76
6 /
��m
ediu
m56
.1%
of w
ater
pi
pe n
etw
ork
need
s re
plac
emen
t
7Za
tobo
lsk,
RC
*�1
,000
/ 1
00�1
,000
/ 1
00�1
,000
/ 1
008,
400
/ 40
1�,6
00 /
60
med
ium
70%
of w
ater
pip
e ne
twor
k ne
eds
repl
acem
ent
8B
orov
sky,
RC
*10
,859
/ 9
0 .5
10,8
59 /
90 .
5�,
159
/ 18
8,70
0 /
7� .5
1,15
0 /
9 .5
med
ium
80%
of w
ater
pip
e ne
twor
k ne
eds
repl
acem
ent,
inte
rrup
ted
wat
er s
uppl
y
9Sa
ryko
l, R
C*
10,�
50 /
100
10,�
50 /
100
10,�
50 /
100
med
ium
inte
rrup
ted
wat
er s
uppl
y vi
a di
stri
butio
n ce
nter
s
10Fe
doro
vka,
RC
*6,
064
/ 99
6,06
4 /
996,
064
/ 99
560
/ 9 .
15,
504
/ 89
.960
/ 1
med
ium
77%
of w
ater
pip
e ne
twor
k ne
eds
repl
acem
ent
11A
man
kara
gai,
RC
*8,
00�
/ 10
08,
00�
/ 10
04,
80�
/ 60
�,�0
1 /
40m
ediu
min
terr
upte
d w
ater
sup
ply
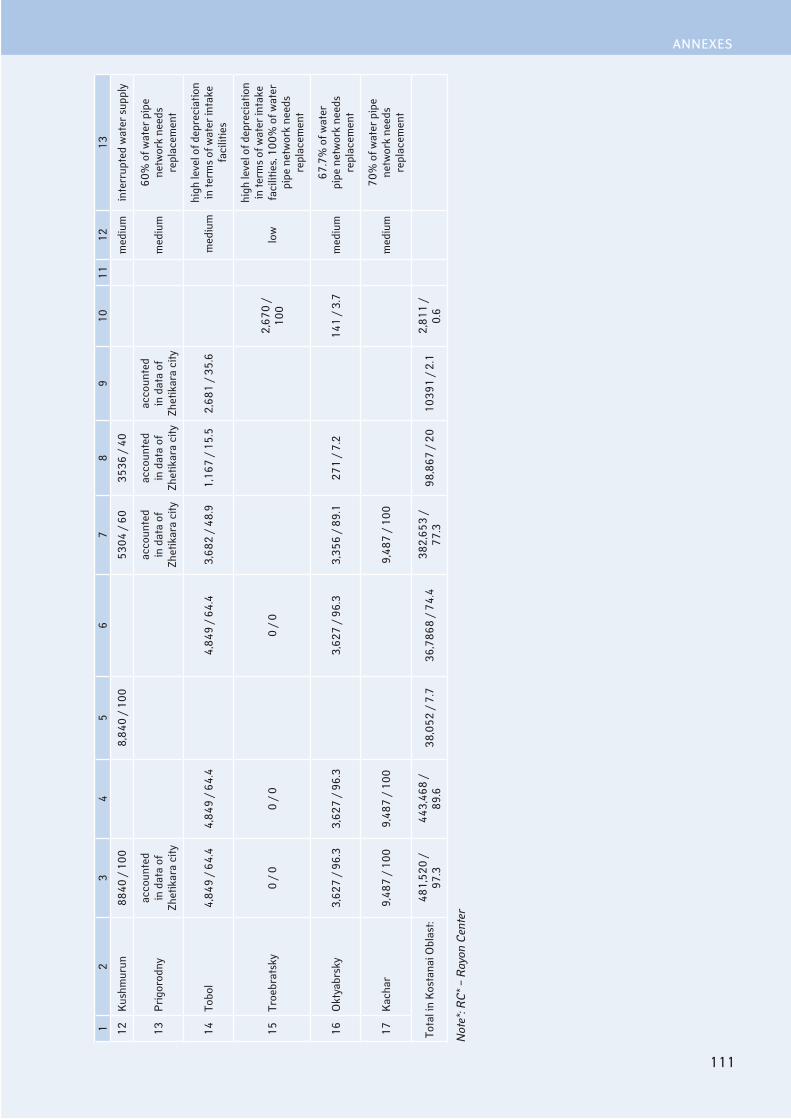
111
ANNExES
1�
�4
56
78
910
111�
1�
1�K
ushm
urun
8840
/ 1
008,
840
/ 10
05�
04 /
60
�5�6
/ 4
0m
ediu
min
terr
upte
d w
ater
sup
ply
1�P
rigo
rodn
yac
coun
ted
in d
ata
of
Zhet
ikar
a ci
ty
acco
unte
d in
dat
a of
Zh
etik
ara
city
acco
unte
d in
dat
a of
Zh
etik
ara
city
acco
unte
d in
dat
a of
Zh
etik
ara
city
med
ium
60%
of w
ater
pip
e ne
twor
k ne
eds
repl
acem
ent
14To
bol
4,84
9 /
64 .4
4,84
9 /
64 .4
4,84
9 /
64 .4
�,68
� /
48 .9
1,16
7 /
15 .5
�,68
1 /
�5 .6
med
ium
high
leve
l of d
epre
ciat
ion
in te
rms
of w
ater
inta
ke
faci
litie
s
15Tr
oebr
atsk
y0
/ 0
0 /
00
/ 0
�,67
0 /
100
low
high
leve
l of d
epre
ciat
ion
in te
rms
of w
ater
inta
ke
faci
litie
s, 1
00%
of w
ater
pi
pe n
etw
ork
need
s re
plac
emen
t
16O
ktya
brsk
y�,
6�7
/ 96
.��,
6�7
/ 96
.��,
6�7
/ 96
.��,
�56
/ 89
.1�7
1 /
7 .�
141
/ � .
7m
ediu
m67
.7%
of w
ater
pi
pe n
etw
ork
need
s re
plac
emen
t
17K
acha
r9,
487
/ 10
09,
487
/ 10
09,
487
/ 10
0m
ediu
m70
% o
f wat
er p
ipe
netw
ork
need
s re
plac
emen
t
Tota
l in
Kos
tana
i Obl
ast:
481,
5�0
/ 97
.�44
�,46
8 /
89 .6
�8,0
5� /
7 .7
�6,7
868
/ 74
.4�8
�,65
� /
77 .�
98,8
67 /
�0
10�9
1 /
� .1
�,81
1 /
0 .6
Not
e*: R
C* –
Ray
on C
ente
r

UNDP Project National Plan for Integrated Water Resources Management and Water Efficiency in Kazakhstan
ACCEss to DRINKINg WAtER AND sANItAtIoN IN thE REPUblIC of KAzAKhstAN
11�
Data on Water Quality and tariffs of Urban Water supply in Kostanai oblast
№ Populated Area Quality Grade*
Problem Type Cause of Problem Length of Pipelines
(km)Water Tariff
(KZT/m�)Water Tariff
Collection Rate (%)
1 Kostanai � 4�0 .60 16 .40 100 .00
� Zhetikara, RC* � 94 .91 19 .16 100 .00
� Arkalyk � biological / metals
purification system has technical trouble �08 .10 �1 .75 100 .00
4 Lisakovsk � other secondary pollution of water 96 .80 19 .55 100 .00
5 Rudny � biological / metals
secondary pollution of water �60 .80 16 .05 100 .00
6 Karabalyk, RC* � 159 .50 107 .00 9� .00
7 Zatobolsk, RC* � �9 .50 45 .10 96 .00
8 Borovsky, RC* � 4� .00 �9 .00 90 .00
9 Sarykol, RC* � 19 .80 �50 .00 100 .00
10 Fedorovka, RC* � 5� .70 66 .00 77 .00
11 Amankaragai, RC* � 11 .00 6� .60 88 .00
1� Kushmurun � 50 .00 6� .60 88 .00
1� Prigorodny � 7 .�0 19 .16 100 .00
14 Tobol � 58 .00 5� .�� 80 .00
15 Troebratsky � biological / metals
�0 .00 do not operate due to emergency
conditions
16 Oktyabrsky � �7 .58 19 .55 100 .00
17 Kachar � biological / other
purification system has technical trouble 9� .00 16 .05 100 .00
Total in Kostanai Oblast 1 781 .50
Note: * quality of water ranges from grade 0 to grade 3; very poor water is deemed under grade 0 and water meeting standard refers to grade 3; RC* – Rayon Center

11�
ANNExES
Data on Access to Urban sewerage system in Kostanai oblast
№ Populated AreaType of Sewerage Supply System (ps ./%) Water Tariff
(KZT/m�)
Availability of Sewerage Treatment*
Length of Sewers (km)centralized system septic pit outdoor toilet
1 Kostanai 14�,007 / 70 .6 10,5�� / 5 .� 49,019 / �4 .� 15 .9� М �00 .9
� Zhetikara, RC* �1,5�0 / 68 .� 1,945 / 6 .� 8,050 / �5 .5 1� .0� M and B 70 .6
� Arkalyk 17,�08 / 61 .8 1,846 / 6 .6 8,805 / �1 .6 1� .19 М 148 .1
4 Lisakovsk �8,�54 / 100 .0 �� .58 M and B 7� .�
5 Rudny 86,�07 / 9� .8 4,�88 / 4 .7 �,�81 / � .5 15 .�5 M and B ��8 .1
6 Karabalyk, RC* 11,768 / 100 .0 0 0 0 .0
7 Zatobolsk, RC* 6,800 / �� .4 14,�00 / 67 .6 55 .�� М �7 .4
8 Borovsky, RC* 1�,009 / 100 .0 0 0 0 .0
9 Sarykol, RC* 10,�50 / 100 .0 0 0 0 .0
10 Fedorovka, RC* 6,1�4 / 100 .0 0 0 0 .0
11 Amankaragai, RC* �,44� / 4� .0 4,56� / 57 .0 45 .�� М �7 .0
1� Kushmurun �,801 / 4� .0 5,0�9 / 57 .0 46 .�� М accounted in assets of Amankarai village
1� Prigorodny accounted in data of Zhetikara town
accounted in data of
Zhetikara town
accounted in data of
Zhetikara town 1� .0� M and B accounted in assets
of Zhetikara town
14 Tobol �,547 / �� .8 1,071 / 14 .� �,91� / 5� .0 �� .49 M and B �6 .5
15 Troebratsky �,670 / 100 .0 0 0 0 .0
16 Oktyabrsky �,169 / 57 .6 780 / �0 .7 819 / �1 .7 �� .58 B 8 .�
17 Kachar 9,449 / 99 .6 9 / 0 .1 �9 / 0 .� 15 .�5 M and B 44 .4
Total in Kostanai Oblast: ��4,515 / 67 .6 �0,57� / 4 .� 1�9,6�7 / �8 .� 95� .5
Note*: M – availability of mechanical treatment facilities; B – availability of biological treatment facilities, RC* – Rayon Center

UNDP Project National Plan for Integrated Water Resources Management and Water Efficiency in Kazakhstan
ACCEss to DRINKINg WAtER AND sANItAtIoN IN thE REPUblIC of KAzAKhstAN
114
Dat
a on
Acc
ess
to D
rin
kin
g W
ater
of g
ood
Qua
lity
of U
rban
Pop
ulat
ion
in K
yzyl
orda
obl
ast
№P
opul
ated
Are
a
Pop
ulat
ion
havi
ng a
cces
s to
wat
er
supp
ly (p
s ./%
)
Pop
ulat
ion
havi
ng
perm
anen
t (�4
hr
s) a
cces
s to
w
ater
(ps .
/%)
Pop
ulat
ion
havi
ng
inte
rmitt
ent
(lim
ited)
acc
ess
to w
ater
(ps .
/%)
Pop
ulat
ion
havi
ng
perm
anen
t (�4
hrs
) ac
cess
to d
rink
ing
wat
er o
f goo
d qu
ality
(ps .
/%)
Typ
e of
Wat
er S
uppl
y (p
s ./%
)
Leve
l of
Serv
ice
Mai
n R
easo
n fo
r Lo
w L
evel
of
Serv
ice
cent
raliz
ed
com
mon
st
and
pipe
w
ell
deliv
ered
other
1K
yzyl
orda
159,
�00
/ 10
015
9,�0
0 /
100
14�,
�84
/ 88
.916
,916
/ 1
1 .1
med
ium
hig
h le
vel o
f dep
reci
atio
n in
te
rms
of n
etw
ork
and
faci
litie
s
�A
rals
k, R
C*
��,�
�8 /
75 .
7��
,��8
/ 7
5 .7
7,76
9 /
�5 .�
15,5
69 /
50 .
57,
491
/ �4
.�m
ediu
mde
prec
iatio
n of
net
wor
k by
80
%; i
nter
rupt
ed w
ater
sup
ply
�K
azal
insk
8,00
0 /
100
8,00
0 /
100
9�4
/ 11
.57,
076
/ 88
.5m
ediu
m40
% o
f wat
er p
ipe
netw
ork
need
s re
plac
emen
t, in
terr
upte
d w
ater
sup
ply
4Zh
laga
sh, R
C*
1�,8
16 /
98 .
71�
,816
/ 9
8 .7
1,0�
5 /
7 .4
1�,7
81 /
91 .
�18
4 /
1 .�
med
ium
inte
rrup
ted
wat
er s
uppl
y
5Zh
anak
orga
n,
RC
*7,
�40
/ ��
.47,
�40
/ ��
.47,
�40
/ ��
.414
,460
/
66 .6
med
ium
�0%
of w
ater
pip
e ne
twor
k ne
eds
repl
acem
ent,
inte
rrup
ted
wat
er s
uppl
y
6A
iteke
bi,
RC
*16
,877
/ 5
6 .1
16,8
77 /
56 .
116
,877
/ 5
6 .1
9,08
7 /
�0 .�
4,11
5 /
1� .7
med
ium
60%
of w
ater
pip
e ne
twor
k ne
eds
repl
acem
ent
7Zh
osal
y, R
C*
15,0
80 /
77 .
515
,080
/ 7
7 .5
15,0
80 /
77 .
515
,080
/ 7
7 .5
4,�6
7 /
�� .5
high
8Te
reno
zek,
RC
*10
,800
/ 1
0010
,800
/ 1
0010
,800
/ 1
0010
,800
/ 1
00 m
ediu
m4�
% o
f wat
er p
ipe
netw
ork
need
s re
plac
emen
t
9Sh
ieli,
RC
*�0
,7�7
/ 1
00�0
,7�7
/ 1
00�0
,7�7
/ 1
0010
,0��
/ �
� .6
�0,7
04 /
67 .
4 m
ediu
m9�
% o
f wat
er p
ipe
netw
ork
need
s re
plac
emen
t
10Zh
aksy
kyly
sh5,
6�0
/ 10
05,
6�0
/ 10
05,
6�0
/ 10
0�,
840
/ 68
.�1,
780
/ �1
.7 m
ediu
m48
% o
f wat
er p
ipe
netw
ork
need
s re
plac
emen
t
11Sa
ksau
l�,
8�9
/ 10
0�,
8�9
/ 10
0�,
8�9
/ 10
0�,
8�9
/ 10
0hi
gh
1�Sh
alki
ya1,
500
/ 10
01,
500
/ 10
01,
500
/ 10
01,
500
/ 10
0hi
gh
1�B
elko
l�,
901
/ 10
0�,
901
/ 10
0�,
901
/ 10
087
1 /
�0�,
0�0
/ 70
med
ium
4 .5
km o
f net
wor
k w
ere
cons
truc
ted
as te
mpo
rary
fa
cilit
ies
how
ever
are
m
aint
aine
d on
per
man
ent b
asis
14Ta
sbug
et1�
,668
/ 7
5 .�
1�,6
68 /
75 .
�1�
,668
/ 7
5 .�
5,84
8 /
�4 .7
6,8�
0 /
40 .5
4,18
8 /
�4 .8
med
ium
100%
of w
ater
pip
e ne
twor
k ne
eds
repl
acem
ent
15To
reta
m7,
578
/ 87
7,57
8 /
877,
578
/ 87
1,1�
� /
1�lo
w81
% o
f wat
er p
ipe
netw
ork
need
s re
plac
emen
t, in
terr
upte
d w
ater
sup
ply
Tota
l in
Kyz
ylor
da
Obl
ast:
�18,
194
/ 87
.6�5
8,��
� /
71 .1
59,9
7� /
16 .
58�
,145
/ �
� .6
�08,
900
/ 57
.510
9,�9
4 /
�0 .1
��,4
18 /
9 .�
11,6
06 /
� .�
Not
e*: R
C* –
Ray
on C
ente
r

115
ANNExES
Data on Water Quality and tariffs of Urban Water supply in Kyzylorda oblast
№ Populated Area Quality Grade*
Problem Type Cause of Problem Length of
Pipelines (km)Water Tariff
(KZT/m�)Water Tariff
Collection Rate (%)
1 Kyzylorda � biological / metals
purification system has technical trouble �56 .� �4 .84 9�
� Aralsk, RC* � biological / other
purification system has technical trouble 79 80 .96 65
� Kazalinsk � �6 .4 7� .4� 70
4 Zhlagash, RC* � 4� .4 �� .5 80
5 Zhanakorgan, RC* � �7 .6 �9 .� 100
6 Aiteke bi, RC* � other secondary pollution of water 180 .� 7� .4� �0
7 Zhosaly, RC* � 55 45 .08 70
8 Terenozek, RC* � 17 .5 �4 .17 80
9 Shieli, RC* � biological secondary pollution of water �5 6� .�6 60
10 Zhaksykylysh � �5 .5 69 .7 98
11 Saksaul � 11 .� 76 .� 8�
1� Shalkiya � 14 �� .8 �0
1� Belkol � 11 .91 �7 .6 60
14 Tasbuget � �4 .5 �0 .�5 56
15 Toretam � �1 .� 5� .88 86
Total in Kyzylorda Oblast: 8�8 .61
Note: * quality of water ranges from grade 0 to grade 3; very poor water is deemed under grade 0 and water meeting standard refers to grade 3; RC* – Rayon Center
Data on Access to Urban sewerage system in Kyzylorda oblast
№ Populated Area Type of Sewerage Supply System (ps ./%) Water Tariff
(KZT/m�)Availability of Sewe-
rage Treatment* Length of
Sewers (km)centralized system septic pit outdoor toilet
1 Kyzylorda 96,894 / 61 .� 6�,�06 / �8 .8 1� .00 0 198 .00
� Aralsk, RC* �0,8�9 / 100 .0 0 .00 0 0 .00
� Kazalinsk 9�4 / 11 .5 7,076 / 88 .5 0 19 .40
4 Zhlagash, RC* 14,000 / 100 .0 0 .00 0 0 .00
5 Zhanakorgan, RC* �1,700 / 100 .0 0 .00 0 0 .00
6 Aiteke bi, RC* �0,079 / 100 .0 0 .00 0 0 .00
7 Zhosaly, RC* 19,447 / 100 .0 0 .00 0 0 .00
8 Terenozek, RC* 10,800 / 100 .0 0 .00 0 0 .00
9 Shieli, RC* 41� / 1 .� �0,��4 / 98 .7 16 .�4 М 11 .06
10 Zhaksykylysh 5,6�0 / 100 .0 0 .00 0 0 .00
11 Saksaul �,8�9 / 100 .0 0 .00 0 0 .00
1� Shalkiya 1,000 / 66 .7 500 / �� .� �5 .�0 М 9 .00
1� Belkol 7�4 / �5 .� 76 / � .6 �,091 / 7� .1 �7 .�0 0 9 .9�
14 Tasbuget 5,848 / �4 .7 �,�08 / 19 .6 7,700 / 45 .7 0 1� .00
15 Toretam 8,710 / 100 .0 0 .00 0 0 .00
Total in Kyzylorda Oblast: 105,81� / �9 .1 �,�84 / 1 .0 �54,0�1 / 69 .9 �59 .�8
Note*: M – availability of mechanical treatment facilities; B – availability of biological treatment facilities, RC* – Rayon Center
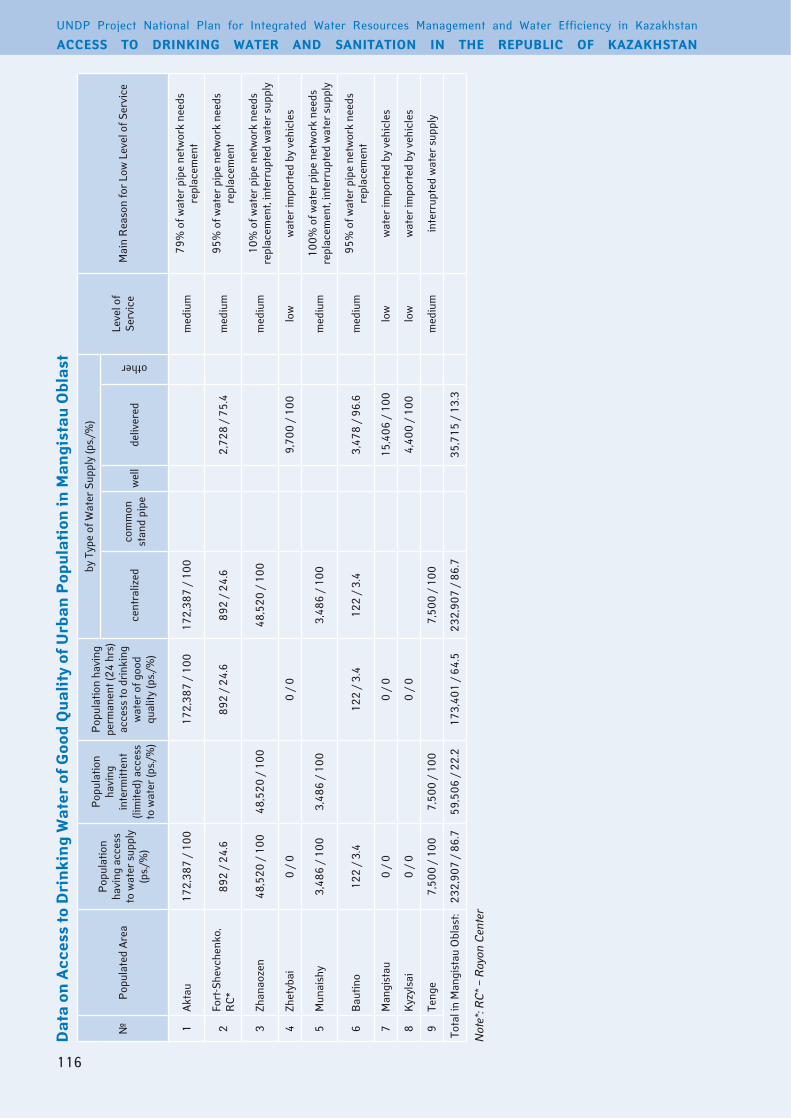
UNDP Project National Plan for Integrated Water Resources Management and Water Efficiency in Kazakhstan
ACCEss to DRINKINg WAtER AND sANItAtIoN IN thE REPUblIC of KAzAKhstAN
116
Dat
a on
Acc
ess
to D
rin
kin
g W
ater
of g
ood
Qua
lity
of U
rban
Pop
ulat
ion
in M
angi
stau
obl
ast
№P
opul
ated
Are
a
Pop
ulat
ion
havi
ng a
cces
s to
wat
er s
uppl
y (p
s ./%
)
Pop
ulat
ion
havi
ng
inte
rmitt
ent
(lim
ited)
acc
ess
to w
ater
(ps .
/%)
Pop
ulat
ion
havi
ng
perm
anen
t (�4
hrs
) ac
cess
to d
rink
ing
wat
er o
f goo
d qu
ality
(ps .
/%)
by T
ype
of W
ater
Sup
ply
(ps .
/%)
Leve
l of
Serv
ice
Mai
n R
easo
n fo
r Lo
w L
evel
of S
ervi
ce
cent
raliz
ed
com
mon
st
and
pipe
w
ell
deliv
ered
other
1A
ktau
17�,
�87
/ 10
017
�,�8
7 /
100
17�,
�87
/ 10
0m
ediu
m79
% o
f wat
er p
ipe
netw
ork
need
s re
plac
emen
t
�Fo
rt-S
hevc
henk
o,
RC
*89
� /
�4 .6
89�
/ �4
.689
� /
�4 .6
�,7�
8 /
75 .4
med
ium
95%
of w
ater
pip
e ne
twor
k ne
eds
repl
acem
ent
�Zh
anao
zen
48,5
�0 /
100
48,5
�0 /
100
48,5
�0 /
100
med
ium
10%
of w
ater
pip
e ne
twor
k ne
eds
repl
acem
ent,
inte
rrup
ted
wat
er s
uppl
y
4Zh
etyb
ai0
/ 0
0 /
09,
700
/ 10
0lo
ww
ater
impo
rted
by
vehi
cles
5M
unai
shy
�,48
6 /
100
�,48
6 /
100
�,48
6 /
100
med
ium
100%
of w
ater
pip
e ne
twor
k ne
eds
repl
acem
ent,
inte
rrup
ted
wat
er s
uppl
y
6B
autin
o1�
� /
� .4
1��
/ � .
41�
� /
� .4
�,47
8 /
96 .6
med
ium
95%
of w
ater
pip
e ne
twor
k ne
eds
repl
acem
ent
7M
angi
stau
0 /
00
/ 0
15,4
06 /
100
low
wat
er im
port
ed b
y ve
hicl
es
8K
yzyl
sai
0 /
00
/ 0
4,40
0 /
100
low
wat
er im
port
ed b
y ve
hicl
es
9Te
nge
7,50
0 /
100
7,50
0 /
100
7,50
0 /
100
med
ium
inte
rrup
ted
wat
er s
uppl
y
Tota
l in
Man
gist
au O
blas
t: ��
�,90
7 /
86 .7
59,5
06 /
�� .
�17
�,40
1 /
64 .5
���,
907
/ 86
.7�5
,715
/ 1
� .�
Not
e*: R
C* –
Ray
on C
ente
r

117
ANNExES
Data on Water Quality and tariffs of Urban Water supply in Mangistau oblast
№ Populated Area Quality Grade*
Problem Type Cause of Problem Length of Pipelines
(km) Water Tariff (KZT/m�)Water Tariff Collection Rate (%)
1 Aktau � �6� .1 �4 .66 100
� Fort-Shevchenko, RC* � �� .0�6 .00 if water meter
installed; 7� .00 per ps if water meter not available
9�
� Zhanaozen � other secondary pollution of water 99 .8 6� .8� 7�
4 Zhetybai � 9 .564 .87 if water distributed from standpipe; 5�7 .07
for imported water 100
5 Munaishy � 4 .4 65 .�� 9�
6 Bautino �accounted in the
assets of Fort-Shevchenko
�6 .00 if water meter installed; 7� .00 per ps . 9�
7 Mangistau � 45 .0 �89 .00 100
8 Kyzylsai � 0 .0 100
9 Tenge � other secondary pollution of water
accounted in the assets of Zhanaozen 6� .8� 7�
Total in Mangistau Oblast: 54� .8
Note: * quality of water ranges from grade 0 to grade 3; very poor water is deemed under grade 0 and water meeting standard refers to grade 3; RC* – Rayon Center
Data on Access to Urban sewerage system in Mangistau oblast
№ Pop[ulated Area Type of Sewerage Supply System (ps ./%) Water Tariff
(KZT/m�)
Availability of Sewerage Treatment*
Length of Sewers (km)centralized system septic pit outdoor toilet
1 Aktau 168,594 / 97 .8 �,79� / � .� �� .0�M and B (80%
of waste water is treated)
�7� .9
� Fort-Shevchenko, RC* �76 / 10 .4 �,�44 / 89 .6 М 11 .1
� Zhanaozen 48,5�0 / 100 .0 16 .90 M and B 67 .7
4 Zhetybai 9,700 / 100 .0 0 .00 0 0 .0
5 Munaishy �,486 / 100 .0 0 .00 0 0 .0
6 Bautino �,600 / 100 .0 0 .00 0 0 .0
7 Mangistau �,406 / �� .1 1�,000 / 77 .9 0 9 .5
8 Kyzylsai 4,400 / 100 .0 0 .00 0 0 .0
9 Tenge 7,500 / 100 .0 16 .90 M and Baccounted in assets of
Zhanaozen town
Total in Mangistau Oblast: ��8,�96 / 85 .0 �,79� / 1 .4 �6,4�0 / 1� .6 �61 .�
Note*: M – availability of mechanical treatment facilities; B – availability of biological treatment facilities; RC* – Rayon Center

UNDP Project National Plan for Integrated Water Resources Management and Water Efficiency in Kazakhstan
ACCEss to DRINKINg WAtER AND sANItAtIoN IN thE REPUblIC of KAzAKhstAN
118
Dat
a on
Acc
ess
to D
rin
kin
g W
ater
of g
ood
Qua
lity
for
Urb
an P
opul
atio
n in
Pav
loda
r o
blas
t
№P
opul
ated
A
rea
Pop
ulat
ion
havi
ng a
cces
s to
wat
er
supp
ly (p
s ./%
)
Pop
ulat
ion
havi
ng
perm
anen
t (�4
hr
s) a
cces
s to
w
ater
(ps .
/%)
Pop
ulat
ion
havi
ng
inte
rmitt
ent
(lim
ited)
ac
cess
to
wat
er (p
s ./%
)
Pop
ulat
ion
havi
ng
perm
anen
t (�4
hr
s) a
cces
s to
goo
d qu
ality
dri
nkin
g w
ater
(ps .
/%)
Type
of W
ater
Sup
ply
(ps .
/%)
Leve
l of
Serv
ice
Mai
n re
ason
of l
ow le
vel o
f se
rvic
e ce
ntra
lized
co
mm
on
stan
d pi
pe
wel
lde
liver
ed
other
1P
avlo
dar,
RC
*�9
6,40
0 /
100 .
0�9
6,40
0 /
100 .
0�9
6,40
0 /
100 .
0�7
�,57
7 /
9� .�
��,8
�� /
7 .7
high
�A
ksu
�7,9
8� /
97 .
7�7
,98�
/ 9
7 .7
�7,9
8� /
97 .
7�5
,798
/ 9
� .1
�,18
5 /
5 .6
906
/ � .
�hi
gh
�Ek
ibas
tuz
111,
965
/ 99
.911
1,96
5 /
99 .9
10�,
06�
/ 91
.98,
90�
/ 8
��5
/ 0 .
1
m
ediu
m49
% o
f wat
er p
ipe
netw
ork
need
s re
plac
emen
t – �
0� k
m
4M
aika
in8,
980
/ 99
.�8,
980
/ 99
.�5,
180
/ 57
.��,
800
/ 4�
.067
/ 0
.8m
ediu
m80
% o
f wat
er p
ipe
netw
ork
need
s re
plac
emen
t
5Sh
opty
kol
0 /
060
0 /
100 .
0m
ediu
mw
ater
impo
rted
by
vehi
cles
, �4
hrs
acce
ss to
wat
er s
tand
pip
e
6Le
nins
ky0
/ 0
7,�5
� /
90 .0
780
/ 10
.0m
ediu
mw
ater
impo
rted
by
vehi
cles
7A
ksu
acco
unte
d in
da
ta o
f Aks
u to
wn
acco
unte
d in
da
ta o
f Aks
u to
wn
acco
unte
d in
dat
a of
Aks
u to
wn
acco
unte
d in
da
ta o
f Aks
u to
wn
acco
unte
d in
da
ta o
f Aks
u to
wn
acco
unte
d in
da
ta o
f Aks
u to
wn
high
8K
alka
man
619
/ 19
.561
9 /
19 .5
619
/ 19
.561
9 /
19 .5
�,56
1 /
80 .5
med
ium
19%
of w
ater
pip
e ne
twor
k ne
eds
repl
acem
ent
9To
rtku
duk
701
/ 89
.�70
1 /
89 .�
�65
/ 46
.5��
6 /
4� .8
84 /
10 .
7lo
w10
0% o
f wat
er p
ipe
netw
ork
need
s re
plac
emen
t,int
erru
pted
w
ater
sup
ply
10So
lnec
hny
8,�5
8 /
99 .9
8,�5
8 /
99 .9
8,�5
8 /
99 .9
8,�5
8 /
99 .9
5 /
0 .1
high
11Sh
ider
ty�,
40�
/ 10
0 .0
�,40
� /
100 .
0�,
40�
/ 10
0 .0
�,��
� /
9� .5
181
/ 7 .
5m
ediu
m�0
% o
f wat
er p
ipe
netw
ork
need
s re
plac
emen
t
Tota
l in
Pav
loda
r O
blas
t: 46
7,�0
9 /
97 .4
466,
608
/ 97
.�70
1 /
0 .1
�45,
66�
/ 7�
.14�
9,08
� /
89 .4
�8,�
�7 /
8 .0
11,1
16 /
� .�
1,46
4 /
0 .�
Not
e*: R
C* –
Ray
on C
ente
r

119
ANNExES
Data on Water Quality and tariffs of Urban Water supply in Pavlodar oblast
№ Populated Area Quality Grade* Problem Type Cause of Problem Length of
Pipelines (km)Water Tariff
(KZT/m�)Water Tariff
Collection Rate (%)
1 Pavlodar, RC* � 441 .10 11 .8� 100
� Aksu � 90 .40 �0 .56 9�
� Ekibastuz � other purification system has technical trouble 44� .�0 �6 .0� 9�
4 Maikain � other purification system has technical trouble 55 .50 54 .65 9�
5 Leninsky � – 100
6 Aksu � �� .00 �0 .56 9�
7 Kalkaman � 4� .00 44 .18 100
8 Tortkuduk � 4 .40
9 Solnechny � other purification system has technical trouble 8 .50 16 .80 71
10 Shiderty � �1 .40 15 .84 7�
Total in Pavlodar Oblast: 1 1�7 .50
Note: * quality of water ranges from grade 0 to grade 3; very poor water is deemed under grade 0 and water meeting standard refers to grade 3; RC* – Rayon Center
Data on Access to Urban sewerage system in Pavlodar oblast
№ Populated Area Type of Sewerage Supply System (ps ./%) Water
Tariff (KZT/m�)
Availability of Sewerage Treatment*
Length of Sewers (km)centralized system septic pit outdoor toilet
1 Pavlodar, RC* �61,4�5 / 88 .� �4,975 / 11 .8 9 .54 M and B �71 .0
� Aksu �5,808 / 9� .1 810 / � .1 �,�71 / 5 .8 15 .6� M and B 160 .4
� Ekibastuz 98,1�9 / 88 .1 9� / 0 .1 1�,�48 / 11 .8 1� .61 M and B �67 .�
4 Maikain �,840 / 4� .4 196 / � .� 5,011 / 55 .4 1� .00 0 1� .0
6 Leninsky 8,1�� / 100 .0 0 .00 0 0 .0
7 Aksu accounted in data of Aksu town
accounted in data of Aksu town
accounted in data of Aksu town 15 .6� M and B accounted in assets
of Aksu town
8 Kalkaman �54 / 8 .0 �,9�6 / 9� .0 0 11 .�
9 Tortkuduk �0� / �5 .7 58� / 74 .� 0 � .1
10 Solnechny 8,�58 / 99 .9 5 / 0 .1 16 .90 6 .�
11 Shiderty �,079 / 86 .5 �05 / 1� .7 19 / 0 .8 1� .50 0 14 .8
Total in Pavlodar Oblast: 410,776 / 85 .7 1,409 / 0 .� 67,165 / 14 .0 846 .0
Note*: M – availability of mechanical treatment facilities; B – availability of biological treatment facilities, RC* – Rayon Center

UNDP Project National Plan for Integrated Water Resources Management and Water Efficiency in Kazakhstan
ACCEss to DRINKINg WAtER AND sANItAtIoN IN thE REPUblIC of KAzAKhstAN
1�0
Dat
a on
Acc
ess
to D
rin
kin
g W
ater
of g
ood
Qua
lity
of U
rban
Pop
ulat
ion
in N
orth
-Kaz
akhs
tan
obl
ast
№P
opul
ated
Are
a P
opul
atio
n ha
ving
ac
cess
to w
ater
su
pply
(ps .
/%)
Pop
ulat
ion
havi
ng
inte
rmitt
ent
(lim
ited)
acc
ess
to
wat
er (p
s ./%
)
Pop
ulat
ion
havi
ng
perm
anen
t (�4
hrs
) ac
cess
to d
rink
ing
wat
er o
f goo
d qu
ality
(ps .
/%)
by T
ype
of W
ater
Sup
ply
(ps .
/%)
Leve
l of
Serv
ice
Mai
n R
easo
n fo
r Lo
w L
evel
of
Ser
vice
ce
ntra
lized
co
mm
on s
tand
pi
pe
wel
lde
liver
edot
her
1P
etro
pavl
ovsk
190,
589
/ 98
,619
0,58
9 /
98 .6
149,
764
/ 77
.540
,8�5
/ �
1 .1
1,61
1 /
0 .8
med
ium
50%
of w
ater
pip
e ne
twor
k ne
eds
repl
acem
ent –
109
km
�B
ulay
evo,
RC
*1�
,000
/ 1
00 .0
1�,0
00 /
100
.057
0 /
5 .0
11,4
�0 /
95 .
0lo
w�0
km
out
of 4
0 km
do
not
oper
ate
due
to e
mer
genc
y co
nditi
ons
�M
amly
utka
, RC
*7,
850
/ 10
0 .0
7,85
0 /
100 .
07,
850
/ 10
0 .0
low
wat
er im
port
ed b
y ve
hicl
es
4Se
rgee
vka,
RC
*7,
850
/ 10
0 .0
7,85
0 /
100 .
078
5 /
10 .0
7,06
5 /
90lo
w70
% o
f wat
er p
ipe
netw
ork
need
s re
plac
emen
t, по
дача
in
terr
upte
d w
ater
sup
ply
5Ta
iyns
ha, R
C*
8,�0
0 /
6� .0
8,�0
0 /
6� .0
1,�0
0 /
9 .�
7,00
0 /
5� .8
4,80
0 /
�6 .9
med
ium
100%
of w
ater
pip
e ne
twor
k ne
eds
repl
acem
ent,
inte
rrup
ted
wat
er s
uppl
y
Tota
l in
Nor
th-
Kaz
akhs
tan
Obl
ast:
��6,
489
/ 96
.84�
,�11
/ 1
5 .4
190,
589
/ 81
.415
�,�1
9 /
65 .1
74,1
70 /
�1 .
76,
411
/ � .
7
Not
e*: R
C* –
Ray
on C
ente
r

1�1
ANNExES
Data on Water Quality and tariffs of Urban Water supply in North-Kazakhstan oblast
№ Populated Area Quality Grade* Problem Type Cause of
Problem Length of
Pipelines (km)Water Tariff (KZT/
m�)Water Tariff
Collection Rate (%)
1 Petropavlovsk � �0� .8 16 .15 100
� Bulayevo, RC* ��0 km of pipe
operate out of 45 km
1�5 .00 98
� Mamlyutka, RC* � �5 .0�50-500 (depending
on distance to standpipe)
100
4 Sergeevka, RC* � 4� .0 1�5 .00 100
5 Taiynsha, RC* � � .0 1�5 .00 100
Total in North-Kazakhstan Oblast: 417 .8
Note: * quality of water ranges from grade 0 to grade 3; very poor water is deemed under grade 0 and water meeting standard refers to grade 3; RC* – Rayon Center
Data on Access to Urban sewerage system in North-Kazakhstan oblast
№ Populated area
Type of Sewerage Supply System (ps ./%) Water Tariff
(KZT/m�)
Availability of Sewerage Treatment*
Length of Sewers (km)centralized
system septic pit outdoor toilet
1 Petropavlovsk 145,519 / 75 .� �,567 / 1 .� 45,114 / �� .4 1�,9� M and B ��5
� Bulayevo, RC* 1�,000 / 100 .0 0 0 0
� Mamlyutka, RC* 7,850 / 100 .0 0 0 0
4 Sergeevka, RC* 785 / 10 .0 7,065 / 90 .0 0 �0
5 Taiynsha, RC* 1�,000 / 100 .0 0 0 0
Total in North-Kazakhstan Oblast: 146,�04 / 6� .5 �,567 / 1 .1 85,0�9 / �6 .4 �45
Note*: M – availability of mechanical treatment facilities; B – availability of biological treatment facilities, RC* – Rayon Center

UNDP Project National Plan for Integrated Water Resources Management and Water Efficiency in Kazakhstan
ACCEss to DRINKINg WAtER AND sANItAtIoN IN thE REPUblIC of KAzAKhstAN
1��
Dat
a on
Acc
ess
to D
rin
kin
g W
ater
of g
ood
Qua
lity
of U
rban
Pop
ulat
ion
in s
outh
-Kaz
akhs
tan
obl
ast
№P
opul
ated
A
rea
Pop
ulat
ion
havi
ng a
cces
s to
wat
er
supp
ly (p
s ./%
)
Pop
ulat
ion
havi
ng
perm
anen
t (�4
hr
s) a
cces
s to
w
ater
(ps .
/%)
Pop
ulat
ion
havi
ng
inte
rmitt
ent
(lim
ited)
acc
ess
to w
ater
(ps .
/%)
Pop
ulat
ion
havi
ng
perm
anen
t (�4
hr
s) a
cces
s to
goo
d qu
ality
dri
nkin
g w
ater
(ps .
/%)
Type
of W
ater
Sup
ply
(ps .
/%)
Leve
l of
Serv
ice
Mai
n re
ason
of l
ow le
vel o
f ser
vice
ce
ntra
lized
co
mm
on
stan
d pi
pe
wel
lde
liver
ed
other
1Sh
ymke
nt�1
7,�1
8 /
75 .7
4�1
7,�1
8 /
75 .7
4�1
7,�1
8 /
75 .7
4�6
8,67
� /
77 .6
�1,0
18 /
4 .4
84,9
�6 /
17
.9�8
4 /
0 .06
high
�A
rys,
RC
*�7
,850
/ 1
00�7
,850
/ 1
00��
,410
/ 8
0 .5
5,44
0 /
19 .5
med
ium
45 .5
% o
f wat
er p
ipe
netw
ork
need
s re
plac
emen
t, in
terr
upte
d w
ater
sup
ply
�Zh
etys
ai, R
C*
�0,9
05 /
74 .
��0
,905
/ 7
4 .�
�0,9
05 /
74 .
�10
,7�8
/
�5 .8
med
ium
7�%
of w
ater
pip
e ne
twor
k ne
eds
repl
acem
ent,
inte
rrup
ted
wat
er s
uppl
y
4Sa
ryag
ash,
R
C*
5,96
1 /
�� .8
5,96
1 /
�� .8
5,96
1 /
�� .8
11,6
76 /
66
.� m
ediu
m10
0% o
f wat
er p
ipe
netw
ork
need
s re
plac
emen
t, in
terr
upte
d w
ater
sup
ply
5Le
nger
, RC
*��
,000
/ 1
00��
,000
/ 1
00��
,000
/ 1
00��
,000
/ 1
00 m
ediu
m80
% o
f wat
er p
ipe
netw
ork
need
s re
plac
emen
t
6Sh
arda
ra,
RC
*19
,150
/ 6
819
,150
/ 6
815
,06�
/ 5
� .5
4,08
8 /
14 .5
8,99
0 /
�� m
ediu
m66
.�%
of w
ater
pip
e ne
twor
k ne
eds
repl
acem
ent
7K
enta
u47
,�16
/ 8
4 .1
47,�
16 /
84 .
147
,�16
/ 8
4 .1
4�,1
66 /
76 .
64,
050
/ 7 .
57,
000
/ 1�
.9 m
ediu
m79
.4%
of w
ater
pip
e ne
twor
k ne
eds
repl
acem
ent
8Tu
rkes
tan
79,4
75 /
89 .
679
,475
/ 8
9 .6
79,4
75 /
89 .
6�6
,7��
/ 4
1 .4
4�,7
4� /
48 .
�9,
��5
/ 10
.6 m
ediu
m�0
% o
f wat
er p
ipe
netw
ork
need
s re
plac
emen
t, in
terr
upte
d w
ater
sup
ply
9A
syka
ta�,
700
/ ��
.6�,
700
/ ��
.6�,
500
/ ��
.71,
�00
/ 10
.97,
150
/ 65
150
/ 1 .
4 m
ediu
min
terr
upte
d w
ater
sup
ply
10A
take
nt�,
07�
/ �4
.5�,
07�
/ �4
.51,
5�7
/ 18
.�5�
5 /
6 .�
6,�5
4 /
75 .5
med
ium
inte
rrup
ted
wat
er s
uppl
y
11M
yrza
kent
�,65
5 /
�5�,
655
/ �5
1,59
� /
151,
06�
/ 10
6,�7
� /
601,
594
/ 15
med
ium
50%
of w
ater
pip
e ne
twor
k ne
eds
repl
acem
ent,
inte
rrup
ted
wat
er s
uppl
y1�
Kok
tere
k6�
7 /
100
6�7
/ 10
06�
7 /
100
6�7
/ 10
0hi
gh
1�Sa
stob
e5,
57�
/ 10
05,
57�
/ 10
05,
015
/ 90
557
/ 10
med
ium
50%
of w
ater
pip
e ne
twor
k ne
eds
repl
acem
ent,
inte
rrup
ted
wat
er s
uppl
y
14Ty
ulku
bas,
R
C*
10,�
88 /
100
10,�
88 /
100
10,�
88 /
100
high
15N
aury
z /
/
16K
yzym
shek
�,�9
8 /
100
�,�9
8 /
100
�,�6
6 /
96 .1
1��
/ � .
9m
ediu
m40
% o
f wat
er p
ipe
netw
ork
need
s re
plac
emen
t, in
terr
upte
d w
ater
sup
ply
17A
chis
ai�,
100
/ 10
0�1
00 /
100
�100
/ 1
00�,
100
/ 10
0
18B
ayal
dyr
acco
unte
d in
dat
a of
K
enta
u to
wn
acco
unte
d in
da
ta o
f Ken
tau
tow
n
acco
unte
d in
dat
a of
Ken
tau
tow
n
acco
unte
d in
dat
a of
K
enta
u to
wn
acco
unte
d in
dat
a of
K
enta
u to
wn
acco
unte
d in
dat
a of
K
enta
u to
wn
med
ium
79 .4
% o
f wat
er p
ipe
netw
ork
need
s re
plac
emen
t
19H
anta
gyac
coun
ted
in d
ata
of
Ken
tau
tow
n
acco
unte
d in
da
ta o
f Ken
tau
tow
n
acco
unte
d in
dat
a of
Ken
tau
tow
n
acco
unte
d in
dat
a of
K
enta
u to
wn
acco
unte
d in
dat
a of
K
enta
u to
wn
acco
unte
d in
dat
a of
K
enta
u to
wn
med
ium
79 .4
% o
f wat
er p
ipe
netw
ork
need
s re
plac
emen
t
Tota
l in
Sout
h-K
azak
hsta
n O
blas
t: 66
�,66
9 /
81 .1
571,
�68
/ 69
.89�
,401
/ 1
1 .�
55�,
118
/ 67
.558
1,08
8 /
71 .1
8�,5
81 /
10 .
11�
9,96
8 /
15 .8
�4,4
�� /
� .
0
Not
e*: R
C* –
Ray
on C
ente
r

1��
ANNExES
Data on Water Quality and tariffs of Urban Water supply in south-Kazakhstan oblast
№ Populated Area Quality Grade* Problem Type Cause of Problem Length of Pipelines
(km)Water Tariff
(KZT/m�)Water Tariff
Collection Rate (%)
1 Shymkent � 1,5�6 .�0 �� .75 99 .48
� Arys, RC* � biological, mineralization
purification system has technical trouble 107 .40 �� .45 80
� Zhetysai, RC* � 1,18� .00 15 .08 8� .7
4 Saryagash, RC* � mineralization purification system has technical trouble �4 .�0 �� .49 �0
5 Lenger, RC* � biological, metals
purification system has technical trouble 14� .00 �1 .0� 9�
6 Shardara, RC* � biological, metals
purification system has technical trouble 79 .00 �8 .87 80
7 Kentau � �86 .00 15 .8� 90
8 Turkestan � mineralizationapproved by SES**,
secondary pollution of water
14� .70 15 .4� 90
9 Asykata � 40 .00 1� .9� 100
10 Atakent � 65 .40 15 .16 85
11 Myrzakent � biological, other
secondary pollution of water 66 .50 �4 .18 50
1� Kokterek � �5 .00 11 .40 100
1� Sastobe � �� .00 1� .00 100
14 Tyulkubas, RC* � accounted in assets of Tyulkubas village 11 .40 100
15 Nauryz
16 Kyzymshek � 7� .00 19 .90 90
17 Achisai � 5 .40 11 .4� 90
18 Bayaldyr � 1 .50 15 .8� 90
19 Hantagy � 8 .70 15 .8� 90
Total in South-Kazakhstan Oblast: �,819 .�0
Note: * quality of water ranges from grade 0 to grade 3; very poor water is deemed under grade 0 and water meeting standard refers to grade 3; ** SES – Sanitary and Epidemiological Service

UNDP Project National Plan for Integrated Water Resources Management and Water Efficiency in Kazakhstan
ACCEss to DRINKINg WAtER AND sANItAtIoN IN thE REPUblIC of KAzAKhstAN
1�4
Data on Access to Urban sewerage system in south-Kazakhstan oblast
№ Populated Area
Type of Sewerage Supply System (ps ./%) Water Tariff (KZT/m�)
Availability of Sewerage Treatment*
Length of Sewers (km)centralized system septic pit outdoor toilet
1 Shymkent �1�,�7� / 44 .9� �61,5�7 / 55 .0� 11 .75 M and B 498 .�
� Arys, RC* �,65� / 7 .� �4,197 / 9� .9 �4 .80 M 17 .9
� Zhetysai, RC* 41,6�� / 100 0 .00 0 0 .0
4 Saryagash, RC* 17,6�7 / 100 0 .00 0 0 .0
5 Lenger, RC* 6,�40 / �7 .� 16,760 / 7� .7 5 .41 M �7 .0
6 Shardara, RC* 4,468 / 15 .9 ��,67� / 84 .1 �� .5� Sewerage Pland does not operate �0 .0
7 Kentau ��,641 / 41 .8 16,�94 / �6 .9 15,��1 / �1 .� 8 .46 M and B 97 .0
8 Turkestan 17,940 / �0 .� 70,760 / 79 .8 �4 .�0 0 5� .�
9 Asykata 11,000 / 100 0 .00 0 0 .0
10 Atakent �,799 / �� .� 5,6�7 / 66 .8 �0 .1� M 9 .5
11 Myrzakent 10,6�� / 100 0 .00 0 0 .0
1� Kokterek 6�7 / 100 0 .00 0 0 .0
1� Sastobe 5,57� / 100 0 .00 0 0 .0
14 Tyulkubas, RC* 10,�88 / 100 0 .00 0 0 .0
15 Nauryz
16 Kyzymshek 99� / �� �,108 / 68 0 .00 0 0 .0
17 Achisai �,�66 / 96 .1 1�� / � .9 19 .90 M 17 .0
18 Bayaldyr accounted in data of Kentau town
accounted in data of Kentau
town
accounted in data of Kentau town 8 .46 M and B
accounted in assets of
Kentau town
19 Hantagy accounted in data of Kentau town
accounted in data of Kentau
town
accounted in data of Kentau town 8 .46 M and B
accounted in assets of
Kentau town
Total in South-Kazakhstan Oblast: �74,�7� / �� .1 16,�94 / � 5�7,40� / 64 .9 748 .9
Note*: M – availability of mechanical treatment facilities; B – availability of biological treatment facilities, RC* – Rayon Center

1�5
ANNEX IІ
Access to Water and Sanitation in rural Areas of Kazakhstan; results of Technical Survey
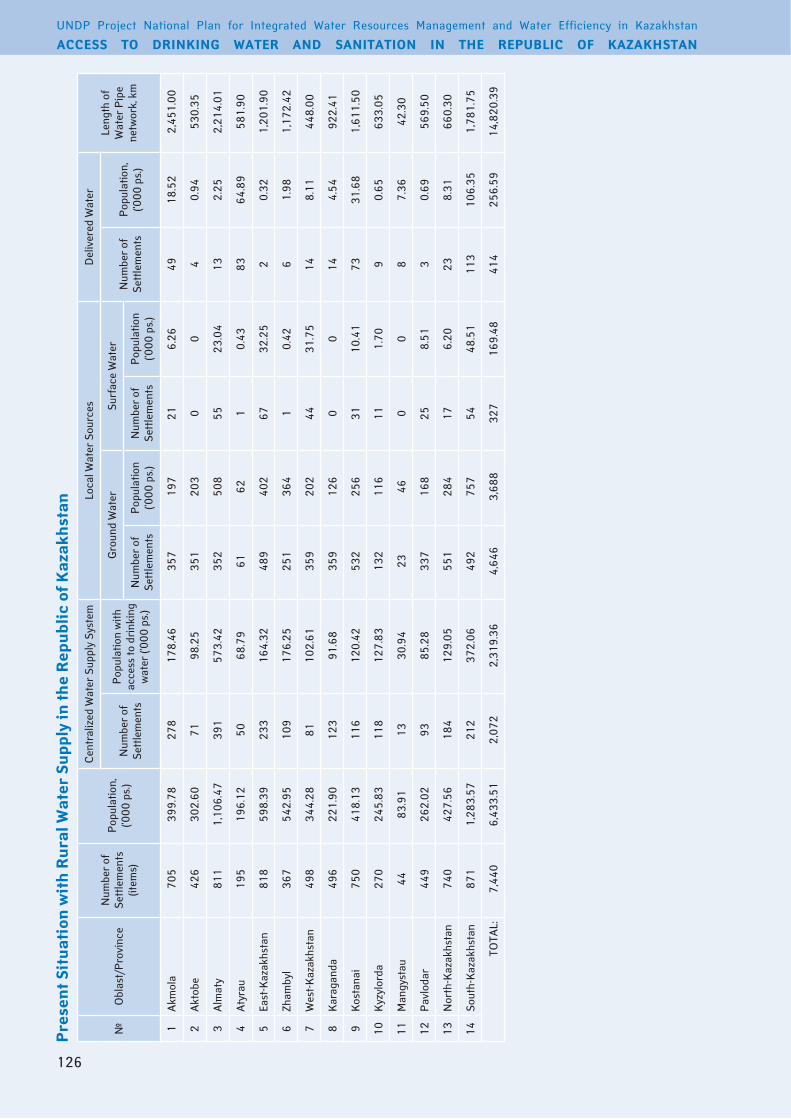
UNDP Project National Plan for Integrated Water Resources Management and Water Efficiency in Kazakhstan
ACCEss to DRINKINg WAtER AND sANItAtIoN IN thE REPUblIC of KAzAKhstAN
1�6
Pre
sen
t sit
uati
on w
ith
Rur
al W
ater
sup
ply
in th
e R
epub
lic
of K
azak
hsta
n
№O
blas
t/P
rovi
nce
Num
ber
of
Sett
lem
ents
(it
ems)
Pop
ulat
ion,
(‘0
00 p
s .)
Cen
tral
ized
Wat
er S
uppl
y Sy
stem
Lo
cal W
ater
Sou
rces
D
eliv
ered
Wat
er
Leng
th o
f W
ater
Pip
e ne
twor
k, k
m
Num
ber
of
Sett
lem
ents
Pop
ulat
ion
with
ac
cess
to d
rink
ing
wat
er (‘
000
ps .)
Gro
und
Wat
er
Surf
ace
Wat
er
Num
ber
of
Sett
lem
ents
P
opul
atio
n,
(‘000
ps .
)N
umbe
r of
Se
ttle
men
ts
Pop
ulat
ion
(‘000
ps .
)N
umbe
r of
Se
ttle
men
ts
Pop
ulat
ion
(‘000
ps .
)
1A
kmol
a 7
05
�99
.78
�78
1
78 .4
6 �
57
197
�1
6 .�6
4918
.5�
�,4
51 .0
0
�A
ktob
e 4
�6
�0�
.60
71
98 .
�5
�51
�
0�
00
40 .
94 5
�0 .�
5
�A
lmat
y 8
11
1,1
06 .4
7 �
91
57�
.4�
�5�
5
08
55��
.04
1�� .
�5 �
,�14
.01
4A
tyra
u 1
95
196
.1�
50
68 .
79
61
6�
10 .
4�8�
64 .8
9 5
81 .9
0
5Ea
st-K
azak
hsta
n 8
18
598
.�9
���
1
64 .�
� 4
89
40�
67
�� .�
5�
0 .��
1,�
01 .9
0
6Zh
amby
l �
67
54�
.95
109
1
76 .�
5 �
51
�64
1
0 .4�
61 .
98 1
,17�
.4�
7W
est-K
azak
hsta
n 4
98
�44
.�8
81
10�
.61
�59
�
0�
44�1
.75
148 .
11 4
48 .0
0
8K
arag
anda
496
�
�1 .9
0 1
��
91 .
68
�59
1
�6
00
144 .
54 9
�� .4
1
9K
osta
nai
750
4
18 .1
� 1
16
1�0
.4�
5��
�
56
�110
.41
7��1
.68
1,6
11 .5
0
10K
yzyl
orda
�70
�
45 .8
� 1
18
1�7
.8�
1��
1
16
111 .
709
0 .65
6��
.05
11M
angy
stau
44
8� .
91
1�
�0 .
94
��
46
00
87 .
�6 4
� .�0
1�P
avlo
dar
449
�
6� .0
� 9
� 8
5 .�8
�
�7
168
�5
8 .51
�0 .
69 5
69 .5
0
1�N
orth
-Kaz
akhs
tan
740
4
�7 .5
6 1
84
1�9
.05
551
�
84
176 .
�0��
8 .�1
660
.�0
14So
uth-
Kaz
akhs
tan
871
1
,�8�
.57
�1�
�
7� .0
6 4
9�
757
54
48 .5
111
�10
6 .�5
1,7
81 .7
5
TOTA
L: 7
,440
6
,4��
.51
�,0
7�
�,�
19 .�
6 4
,646
�
,688
��
716
9 .48
414
�56 .
59 1
4,8�
0 .�9

1�7
ANNExES
Acc
ess
to D
rin
kin
g W
ater
in A
kmol
a o
blas
t: P
rese
nt a
nd
futu
re C
ondi
tion
s
№N
ame
of R
ayon
Pop
ulat
ion
as o
f 1 .
01 .�
004
(ps .
)
Pop
ulat
ion
with
acc
ess
to d
rink
ing
wat
er a
s of
1 .
01 .�
005
(ps .
)
Acc
ess
of P
opul
atio
n to
Dri
nkin
g W
ater
(in
% o
f tot
al p
opul
atio
n)
as o
f 1 .
01 .�
005
incr
emen
t fo
r �0
05
(ps .
)
as o
f 1 .
01 .�
006
incr
emen
t fo
r �0
06
(ps .
)
as o
f 1 .
01 .�
007
incr
emen
t fo
r �0
07(p
s .)
as o
f 1 .
01 .�
008
incr
emen
t fo
r �0
08
(ps .
)
as o
f 1 .
01 .�
009
incr
emen
t fo
r �0
09
and
�010
(p
s .)
as o
f 1 .
01 .�
011
1A
kkol
16,
96�
1,7
7�
10,
45
500
1
� .�9
7
,50�
5
7 .6�
�
4�
59 .
05
� 4
18
7� .
�0
�50
7
5 .�6
�A
rsha
ly �
0,04
4 1
1,87
� 5
9,��
�
50
60 .
98
1,1
47
66 .
70
�,6
11
79 .
7�
915
8
4 .�9
�
50
85 .
54
�A
stra
han
�9,
489
16,
619
56,
�6
–
56 .
�6
�,�
49
64 .
��
1,5
�1
69 .
48
� 7
68
78 .
87
950
8
� .09
4A
tbas
ar �
6,16
7 1
1,�4
6 4
�,98
1
,450
4
8 .5�
�
,7��
5
8 .9�
6
�6
61 .
�6
48�
6
� .�0
�
�50
7
� .18
5B
ulan
dy �
0,�5
7 8
,499
4
1,75
–
4
1 .75
4
,9��
6
5 .9�
1
,0�6
7
1 .0�
1
09�
7
6 .�8
6
50
79 .
57
6Eg
indi
kol
7,9
�9
4,1
8�
5�,
74
56�
5
9 .8�
6
�7
67 .
86
660
7
6 .19
–
7
6 .19
7
50
85 .
65
7En
beks
hind
el 1
4,97
1 5
16
�,4
5 �
50
5 .7
8 5
,180
4
0 .�8
1
,���
4
9 .�8
4
�0
5� .
09
950
5
8 .4�
8Er
eim
enta
u �
�,67
4 5
,��7
�
�,08
�
,540
�
7 .0�
5
,844
6
1 .7�
�
,46�
7
6 .�4
6
�0
79 .
00
��0
8
0 .�5
9Es
il 1
9,71
� 1
�,87
8 7
0,40
1
,�6�
7
6 .80
–
7
6 .80
–
7
6 .80
–
7
6 .80
1
50
77 .
56
10Zh
aksy
n �
6,65
� 1
�,94
4 4
8,56
5
40
50 .
59
1,4
99
56 .
��
1,8
4�
6� .
1�
1 8
89
70 .
��
1 �
00
75 .
09
11Zh
arka
in 1
�,5�
4 4
,15�
�
0,70
1
,1�9
�
9 .05
9
86
46 .
�4
1,7
90
59 .
58
1 6
�6
71 .
60
1 �
00
80 .
47
1�Ze
rend
y 4
1,�7
6 1
1,80
0 �
8,59
1
,1��
�
1 .�1
�
,915
�
8 .�7
�
,476
4
4 .�7
�
�68
4
9 .86
5
500
6
� .19
1�K
orga
lzhy
1�,
999
8,9
94
69,
19
–
69 .
19
688
7
4 .48
5
15
78 .
44
9�0
8
5 .5�
5
�0
89 .
5�
14Sa
ndyk
tau
�5,
���
17,
�69
68,
84
1,4
50
74 .
58
797
7
7 .74
1
,1�4
8
� .�0
4
70
84 .
06
7��
8
6 .96
15Ts
elin
ogra
d 4
0,87
1 1
7,68
6 4
�,�7
�
,948
5
0 .49
5
,��4
6
� .54
7
,046
8
0 .78
�
�18
8
6 .�0
8
59
88 .
�0
16Sh
orta
ndy
18,
��0
1�,
�71
67,
90
–
67 .
90
1,4
85
76 .
05
1,6
81
85 .
�7
711
8
9 .18
�
50
90 .
55
17Sc
huch
insk
y �
0,��
8 1
�,97
6 4
�,91
4
99
44 .
56
1,5
09
49 .
55
1,8
44
55 .
65
1 1
�9
59 .
�9
� 5
60
67 .
85
18K
oksh
etau
(u .a
)*
9,�
�5
6,0
19
64,
48
–
64 .
48
–
64 .
48
–
64 .
48
–
64 .
48
1 9
00
84 .
8�
19St
epno
gors
k (u
.a)*
� 1
��
�40
1
6,0�
–
1
6 .0�
6
79
48 .
0�
6�8
7
8 .09
–
7
8 .09
1
50
85 .
16
Tota
l in
Obl
ast
�99
,777
1
78,4
6�
44,
64
15,
70�
48 .
57
46,
196
60 .
1�
�0,
457
67 .
74
19
956
7� .
7�
�1
691
78 .
16
Not
e*: R
C* –
Ray
on C
ente
r

UNDP Project National Plan for Integrated Water Resources Management and Water Efficiency in Kazakhstan
ACCEss to DRINKINg WAtER AND sANItAtIoN IN thE REPUblIC of KAzAKhstAN
1�8
Pre
sen
t sit
uati
on w
ith
Rur
al W
ater
sup
ply
in A
kmol
a o
blas
t
№N
ame
of R
ayon
Num
ber
of
Sett
lem
ents
(it
ems)
Pop
ulat
ion
(ps .
)
Ava
ilabi
lity
of W
ater
Sup
ply
from
:
cent
raliz
ed w
ater
sup
ply
syst
emlo
cal w
ater
sou
rces
Del
iver
ed w
ater
Num
ber
of
Sett
lem
ents
Pop
ulat
ion
Leng
th o
f W
ater
Pip
e N
etw
ork
(km
)
%
grou
nd w
ater
surf
ace
wat
erN
umbe
r of
Se
ttle
men
tsP
opul
atio
n%
Num
ber
of
Sett
lem
ents
Pop
ulat
ion
%N
umbe
r of
Se
ttle
men
tsP
opul
atio
n%
1A
kkol
�416
,96�
41,
77�
1410
.4�7
1�,�
1778
.5�
80�
4 .7
11,
07�
6 .�
�A
rsha
ly�5
�0,0
44�4
11,8
7��4
059
.�5
6,86
5�4
.��
9�9
4 .6
4�7
81 .
9
�A
stra
han
40�9
,489
1416
,619
1��
56 .4
199,
818
�� .�
51,
985
6 .7
�1,
067
� .6
4A
tbas
ar4�
�6,1
6716
11,�
4611
74�
.0�1
1�,0
4849
.90
-0 .
05
1,87
�7 .
�
5B
ulan
dy�8
�0,�
5718
8,49
9��
741
.718
10,6
4�5�
.�0
-0 .
0�
1,�1
66 .
0
6Eg
indi
kol
147,
9�9
104,
18�
��5�
.7�
�,�0
141
.60
-0 .
0�
446
5 .6
7En
beks
hind
el47
14,9
711
516
�� .
446
14,4
5596
.60
-0 .
00
-0 .
0
8Er
eim
enta
u�7
��,6
741�
5,��
716
0��
.1�5
18,4
4777
.90
-0 .
00
-0 .
0
9Es
il�1
19,7
1��0
1�,8
78�1
770
.41
5,8�
5�9
.60
-0 .
00
-0 .
0
10Zh
aksy
n4�
�6,6
5�18
1�,9
4417
�48
.6�1
1�,9
�948
.5�
�90
1 .5
��8
01 .
4
11Zh
arka
in��
1�,5
�410
4,15
�86
�0 .7
95,
��1
�9 .�
71,
655
1� .�
6�,
�96
17 .7
1�Ze
rend
y81
41,�
7617
11,8
001�
7�8
.661
�8,�
1768
.40
-0 .
0�
1,�5
9� .
1
1�K
orga
lzhy
�61�
,999
1�8,
994
9669
.�7
�,�9
4�5
.��
499
� .8
��1
�1 .
6
14Sa
ndyk
tau
47�5
,���
�817
,�69
160
68 .8
177,
�89
�8 .9
0-
0 .0
�57
4� .
�
15Ts
elin
ogra
d57
40,8
71�0
17,6
86�1
54�
.��5
18,1
4444
.40
-0 .
01�
5,04
11�
.�
16Sh
orta
ndy
��18
,��0
��1�
,�71
�19
67 .9
84,
600
�5 .�
0-
0 .0
�1,
�49
6 .9
17Sc
huch
insk
y60
�0,�
�818
1�,9
7619
04�
.94�
17,�
6�57
.10
-0 .
00
-0 .
0
18K
oksh
etau
(u .a
)*
�9,
��5
�6,
019
1964
.50
�,��
5�4
.70
-0 .
01
810 .
9
19St
epno
gors
k (u
.a)*
5�,
1��
1�4
0�5
16 .0
�50
5��
.80
-0 .
01
1,�7
760
.�
Tota
l in
Obl
ast
705
�99,
777
�78
178,
46�
�,45
144
.6�5
719
6,5�
449
.��1
6,�6
01 .
649
18,5
�14 .
6
Not
e*: R
C* –
Ray
on C
ente
r

1�9
ANNExES
Expe
cted
Inve
stm
ents
to W
ater
sup
ply
Impr
ovem
ent i
n R
ural
Are
as o
f Akm
ola
obl
ast (
Un
it: K
zt m
ln)
№N
ame
of R
ayon
�005
�006
�007
�008
�009
-�01
0
Grand Total
Total in �005
Sour
ces
of F
inan
cing
Total in �006
Sour
ces
of F
inan
cing
Total in �007
Sour
ces
of F
inan
cing
Total in �008
Sour
ces
of F
inan
cing
Total in �009-�011
Sour
ces
of
Fina
ncin
g
cental state budget
local budget
legal entity
foreign grants and loans
cental state budget
local budget
legal entity
foreign grants and loans
cental state budget
local budget
legal entity
foreign grants and loans
cental state budget
local budget
legal entity
foreign grants and loans
cental state budget
local budget
legal entity
foreign grants and loans
1A
kkol
�0 .0
�057
�5�
1 .6�
41 .7
1041
.7�1
.70
�0�1
�19
� .00
�0�1
�187
8
�A
rsha
ly18
.08 .
0010
�15
�1� .
661 .
7016
� .�
15� .
�010
96�6
.00
60�7
�75�
0
�A
stra
han
10 .0
10�1
517
5 .00
4047
9 .5
479 .
505�
65�
6 .00
5555
1,�9
5
4A
tbas
sar
1� .0
� .95
1095
64 .6
5�0
90 .0
60 .0
0�0
9555
.00
4048
48�4
1
5B
ulan
dy10
.010
445
445 .
101�
0 .0
100 .
00�0
1�0
100 .
00�0
�8�8
7��
6El
indy
kol
5 .0
590
60 .0
0�0
100 .
080
.00
�01
�010
0 .00
�015
15��
0
7En
beks
hild
er�4
.611
.000
� .64
1019
61�
6 .�0
6090
.040
.00
5095
�5 .0
070
�8�8
4�4
8Er
eim
enta
u70
.070
454
4�� .
99�0
.7�
10�0
8 .0
�98 .
0010
1�8
88 .0
050
4444
1,01
4
9Es
il14
.09 .
0�5
551
11 .0
4060
.060
5050
�6�6
�1�
10Zh
aksy
15 .8
8 .59
0� .
�05
111
7� .7
04 .
9� .
00�0
144 .
510
4 .50
4089
69 .0
0�0
4949
409
11Zh
arka
in71
.560
6 .50
05
1�5
70 .5
014
.050
4�5 .
0�8
5 .00
50�1
0�1
0 .00
�5�5
876
1�Ze
rend
insk
y47
.7�7
.670
10�6
8��
8 .�7
40��
9 .5
199 .
5040
1�0
70 .0
050
7676
75�
1�K
orga
lzhy
�0 .0
�076
�6 .0
040
�05 .
017
5 .00
�01�
989
.00
50�4
�446
4
14Sa
ndyk
tau
19 .0
� .00
017
.00
�16
176 .
60� .
017
.00
�015
� .0
11� .
0040
107
107 .
�647
4754
1
15Ts
elin
ogra
d��
.817
.000
5 .80
�78
�60 .
�06 .
0� .
0010
459 .
�45
9 .�0
16�
16� .
4076
761,
099
16Sh
orta
ndy
10 .0
10�1
�19
1 .68
-0 .
�0�0
��1 .
0�1
1 .00
�017
717
7 .�6
�4�4
664
17Sc
huch
insk
y1�
.�1 .
�00
1 .00
1017
814
� .70
� .�
1 .40
�016
8 .0
1�8 .
00�0
119
98 .8
0�0
5656
5��
18K
oksh
etau
(u .a
.)5 .
05
�0�0
�0 .0
�0�0
�017
178�
19St
epno
gors
k (u
.a .)
5 .0
5�0
�076
.056
.00
�010
104
411
5
�0N
urin
sky
Gro
up
Pip
elin
e1�
0 .0
1�0
��0
��0 .
0018
5 .0
185 .
0018
018
0 .00
705
�1Se
letin
sky
Gro
up P
ipel
ine
50 .0
5096
95 .7
417
0 .0
170 .
0018
018
0 .00
496
Tota
l in
Obl
ast:
58� .
7�0
09�
.085
40 .5
915
04�
64�,
6�4 .
818�
.946
.0�
500
�,9�
7 .7
�,4�
7 .70
00
510
�977
�,47
6 .7�
00
500
740
00
074
01�
,50�
Not
e: *
u.a.
– u
rban
agg
lom
erat
e
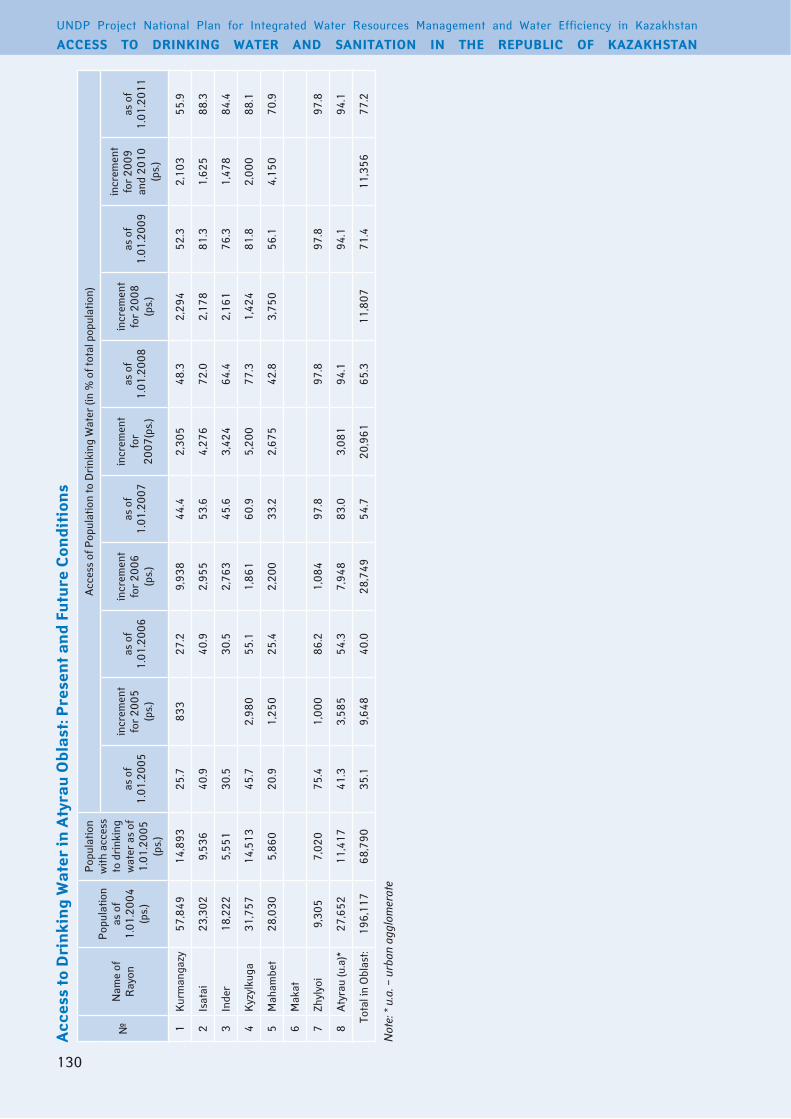
UNDP Project National Plan for Integrated Water Resources Management and Water Efficiency in Kazakhstan
ACCEss to DRINKINg WAtER AND sANItAtIoN IN thE REPUblIC of KAzAKhstAN
1�0
Acc
ess
to D
rin
kin
g W
ater
in A
tyra
u o
blas
t: P
rese
nt a
nd
futu
re C
ondi
tion
s
№N
ame
of
Ray
on
Pop
ulat
ion
as o
f 1 .
01 .�
004
(ps .
)
Pop
ulat
ion
with
acc
ess
to d
rink
ing
wat
er a
s of
1 .
01 .�
005
(ps .
)
Acc
ess
of P
opul
atio
n to
Dri
nkin
g W
ater
(in
% o
f tot
al p
opul
atio
n)
as o
f 1 .
01 .�
005
incr
emen
t fo
r �0
05
(ps .
)
as o
f 1 .
01 .�
006
incr
emen
t fo
r �0
06
(ps .
)
as o
f 1 .
01 .�
007
incr
emen
t fo
r �0
07(p
s .)
as o
f 1 .
01 .�
008
incr
emen
t fo
r �0
08
(ps .
)
as o
f 1 .
01 .�
009
incr
emen
t fo
r �0
09
and
�010
(p
s .)
as o
f 1 .
01 .�
011
1K
urm
anga
zy57
,849
14,8
9��5
.78�
��7
.�9,
9�8
44 .4
�,�0
548
.��,
�94
5� .�
�,10
�55
.9
�Is
atai
��,�
0�9,
5�6
40 .9
40 .9
�,95
55�
.64,
�76
7� .0
�,17
881
.�1,
6�5
88 .�
�In
der
18,�
��5,
551
�0 .5
�0 .5
�,76
�45
.6�,
4�4
64 .4
�,16
176
.�1,
478
84 .4
4K
yzyl
kuga
�1,7
5714
,51�
45 .7
�,98
055
.11,
861
60 .9
5,�0
077
.�1,
4�4
81 .8
�,00
088
.1
5M
aham
bet
�8,0
�05,
860
�0 .9
1,�5
0�5
.4�,
�00
�� .�
�,67
54�
.8�,
750
56 .1
4,15
070
.9
6M
akat
7Zh
ylyo
i9,
�05
7,0�
075
.41,
000
86 .�
1,08
497
.897
.897
.897
.8
8A
tyra
u (u
.a)*
�7,6
5�11
,417
41 .�
�,58
554
.�7,
948
8� .0
�,08
194
.194
.194
.1
Tota
l in
Obl
ast:
196,
117
68,7
90�5
.19,
648
40 .0
�8,7
4954
.7�0
,961
65 .�
11,8
0771
.411
,�56
77 .�
Not
e: *
u.a.
– u
rban
agg
lom
erat
e

1�1
ANNExES
Pre
sen
t sit
uati
on w
ith
Rur
al W
ater
sup
ply
in A
tyra
u o
blas
t
№N
ame
of
Ray
on
Num
ber
of
Sett
lem
ents
(it
ems)
Pop
ulat
ion
(ps .
)
Ava
ilabi
lity
of W
ater
Sup
ply
from
:
cent
raliz
ed w
ater
sup
ply
syst
emlo
cal w
ater
sou
rces
deliv
ered
wat
er
Num
ber
of
Sett
lem
ents
Pop
ulat
ion
Leng
th o
f W
ater
Pip
e N
etw
ork
(km
)
%
grou
nd w
ater
surf
ace
wat
erN
umbe
r of
Se
ttle
men
tsP
opul
atio
n%
Num
ber
of
Sett
lem
ents
Pop
ulat
ion
%N
umbe
r of
Se
ttle
men
tsP
opul
atio
n%
1K
urm
anga
zy57
57
849
8 1
4 89
� 11
�,8
�5,7
�6 �
8 99
7 67
,41
4�1
0,7
1� �
5�8
6,
1
�Is
atai
�1 �
� �0
� 5
9 5
�6
�0,6
40,9
4 7
7�
�,�
00
0,0
1� 1
� 99
4 55
,8
�In
der
16 1
8 ��
� 8
5 5
51
40,8
�0,5
0 –
0,
00
00,
08
1�
671
69,5
4K
yzyl
kuga
�1 �
1 75
7 9
14
51�
195,
745
,71�
10
54�
��,�
00
0,0
10 6
70�
�1
,1
5M
aham
bet
�6 �
8 0�
0 �
5 8
60
�9,�
�0,9
0 –
0,
00
00,
0�4
��
170
79,1
6M
akat
–
–
0 –
7Zh
ylyo
i15
9 �
05
5 7
0�0
81
75,4
0 –
0,
00
00,
010
� �
85
�4,6
8A
tyra
u (u
.a)*
�9 �
7 65
� 1�
11
417
91,8
41,�
9 1
1 69
9 4�
,�0
0,0
7 4
5�6
16
,4
Tota
l in
Obl
ast:
195
196
117
50
68
790
581,
9�5
,161
6�
010
�1,6
14�
10,
�8�
64
886
��,1
Not
e: *
u.a.
- urb
an a
gglo
mer
ate

UNDP Project National Plan for Integrated Water Resources Management and Water Efficiency in Kazakhstan
ACCEss to DRINKINg WAtER AND sANItAtIoN IN thE REPUblIC of KAzAKhstAN
1��
Expe
cted
Inve
stm
ents
to W
ater
sup
ply
Impr
ovem
ent i
n R
ural
Are
as o
f Aty
rau
obl
ast (
Un
it: K
zt m
ln)
№N
ame
of
Ray
on
�005
�006
�007
�008
�009
– �
010
Total in �005
Sour
ces
of F
inan
cing
Total in �006
Sour
ces
of F
inan
cing
Total in �007
Sour
ces
of F
inan
cing
Total in �008
Sour
ces
of F
inan
cing
Total in �009-�011
Sour
ces
of F
inan
cing
cental state budget
local budget
legal entity
foreign grants and loans
cental state budget
local budget
legal entity
foreign grants and loans
cental state budget
local budget
legal entity
foreign grants and loans
cental state budget
local budget
legal entity
foreign grants and loans
cental state budget
local budget
legal entity
foreign grants and loans
1K
urm
anga
zy 1
00 .0
0 1
00 .0
00
759 .
784
759 .
784
400
400
441
441
150
150
�Is
atai
69 .
�0
69 .
�00
60�
60�
��9
��9
�68
�68
0
�In
der
–
�� .1
�� .1
1��
1��
110 .
711
0 .7
40 .9
40 .9
4K
yzyl
kuga
��0
.79
��0
.786
11
4 .48
114 .
4854
054
085
585
575
075
0
5M
aham
bet
–
1�1 .
71�
1 .7
�7�
�7�
�00
�00
�9� .
8�9
� .8
6M
akat
–
00
00
7Zh
ylyo
i 1
08 .6
0 1
08 .6
00
00
00
8A
tyra
u (u
.a)*
181
.00
181
7�6 .
587
460 .
587
�76
1�4
1�4
00
Tota
l in
Obl
ast:
779
.59
598
.586
–
1
81 .0
0 –
�,
�57 .
65�,
081 .
65–
�76 .
00–
1,80
81,
808
––
–1,
975
1,97
5–
––
1,��
41,
��4
––
–
Not
e: *
u.a.
– u
rban
agg
lom
erat
e

1��
ANNExES
Acc
ess
to D
rin
kin
g W
ater
in A
lmat
y o
blas
t: P
rese
nt a
nd
futu
re C
ondi
tion
s
№N
ame
of R
ayon
Pop
ulat
ion
as o
f 1 .
01 .�
004
(ps .
)
Pop
ulat
ion
with
acc
ess
to d
rink
ing
wat
er a
s of
1 .
01 .�
005
(ps .
)
Acc
ess
of P
opul
atio
n to
Dri
nkin
g W
ater
(in
% o
f tot
al p
opul
atio
n)
as o
f 1 .
01 .�
005
incr
emen
t fo
r �0
05
(ps .
)
as o
f 1 .
01 .�
006
incr
emen
t fo
r �0
06
(ps .
)
as o
f 1 .
01 .�
007
incr
emen
t fo
r �0
07(p
s .)
as o
f 1 .
01 .�
008
incr
emen
t fo
r �0
08
(ps .
)
as o
f 1 .
01 .�
009
incr
emen
t fo
r �0
09
and
�010
(p
s .)
as o
f 1 .
01 .�
011
1A
ksu
�8,�
0�6,
01�
�1 .�
�,9�
8�1
.6�1
.61,
858
�8 .�
�,0�
148
.9�,
500
61 .�
�A
lako
l59
,�68
17,4
���9
.41,
048
�1 .�
�1 .�
5,19
��9
.9�,
968
46 .6
6,�5
057
.�
�B
alkh
ash
�0,5
015,
904
19 .4
4,0�
4��
.57,
718
57 .9
1,70
76�
.51,
051
66 .9
1,�0
070
.8
4En
beks
hika
zakh
17�,
19�
107,
965
6� .�
11,�
�768
.84,
469
71 .4
5,�5
974
.49�
975
.075
.0
5Es
keld
y�1
,775
�5,�
7979
.679
.679
.6�5
480
.71,
755
86 .�
86 .�
6Zh
amby
l10
6,�4
�49
,180
46 .�
1,65
447
.81,
601
49 .�
8,0�
656
.910
,�85
66 .6
4,50
070
.9
7Ili
80,5
894�
,794
5� .1
�,54
056
.�14
,��9
74 .0
74 .0
�,14
076
.7�,
1�0
80 .6
8K
aras
ai1�
�,49
484
,1�8
68 .1
1,51
169
.�8,
�50
76 .0
6,50
�81
.�10
,105
89 .5
89 .5
9K
arat
al��
,�55
6,�1
7�7
.0�7
.0�7
.01,
500
�� .5
�,98
050
.55,
500
74 .1
10K
erbu
lak
40,1
57��
,1�1
57 .6
57 .6
�,56
764
.01,
7�9
68 .�
160
68 .7
�,�0
074
.�
11K
oksu
�7,�
4114
,�00
51 .9
51 .9
51 .9
1,5�
�57
.5�,
500
66 .7
�,64
076
.�
1�P
anfil
ov8�
,85�
40,0
9548
.448
.41,
�11
49 .9
1,��
�51
.55,
0�8
57 .5
4,50
06�
.0
1�R
aiym
bek
80,�
985�
,950
67 .1
1,15
868
.585
669
.6�,
414
7� .9
5,09
180
.�55
080
.9
14Sa
rkan
d�7
,0��
5,40
9�0
.0�0
.0�0
.01,
419
�5 .�
�,47
1�8
.15,
900
59 .9
15Ta
lgar
9�,�
194�
,�99
45 .5
6,4�
85�
.41�
,��5
66 .6
1�,9
9780
.54,
875
85 .7
�50
86 .1
16U
igur
6�,8
67�8
,�65
59 .9
�00
60 .�
4,��
066
.88,
071
79 .5
�,�7
78�
.�55
084
.1
17K
apsh
agai
(u .a
)*1�
,��0
5,0�
��8
.0�8
.06,
600
87 .9
450
91 .�
�50
94 .0
500
97 .7
18Ta
ldyk
orga
n (u
.a .)*
�1,5
5�5,
944
�7 .6
�7 .6
�7 .6
�,�0
0�7
.8�,
150
5� .4
�,90
070
.5
Tota
l in
Obl
ast:
1,10
6,46
857
�,41
751
.8��
,7�8
54 .8
65,0
5660
.76�
,554
66 .4
64,�
567�
.�45
,160
76 .�
Not
e: *
u.a.
- urb
an a
gglo
mer
ate

UNDP Project National Plan for Integrated Water Resources Management and Water Efficiency in Kazakhstan
ACCEss to DRINKINg WAtER AND sANItAtIoN IN thE REPUblIC of KAzAKhstAN
1�4
Pre
sen
t sit
uati
on w
ith
Rur
al W
ater
sup
ply
in A
lmat
y o
blas
t
№N
ame
of R
ayon
Num
ber
of
Sett
lem
ents
(it
ems)
Pop
ulat
ion
(ps .
)
Ava
ilabi
lity
of W
ater
Sup
ply
from
:
cent
raliz
ed w
ater
sup
ply
syst
emlo
cal w
ater
sou
rces
deliv
ered
wat
er
Num
ber
of
Sett
lem
ents
Pop
ulat
ion
Leng
th o
f W
ater
Pip
e N
etw
ork
(km
)
%
grou
nd w
ater
surf
ace
wat
erN
umbe
r of
Se
ttle
men
tsP
opul
atio
n%
Num
ber
of
Sett
lem
ents
Pop
ulat
ion
%N
umbe
r of
Se
ttle
men
tsP
opul
atio
n%
1A
ksu
5��8
,�0�
86,
01�
�9 .�
0�1
.�41
�1,1
1074
.6�
1,18
04 .
�0
–0 .
0
�A
lako
l58
59,�
681�
17,4
��11
5 .80
�9 .4
�6�7
,9�7
64 .0
6�,
57�
4 .�
�1�
�6� .
�
�B
alkh
ash
�4�0
,501
65,
904
� .00
19 .4
�7�4
,5��
80 .4
164
0 .�
0–
0 .0
4En
beks
hika
zakh
7917
�,19
�54
107,
965
556 .
406�
.���
65,0
91�7
.6�
1�7
0 .1
0–
0 .0
5Es
keld
y�7
�1,7
75��
�5,�
7945
.10
79 .6
146,
496
�0 .4
0–
0 .0
0–
0 .0
6Zh
amby
l61
106,
�4�
�649
,180
9� .1
646
.��8
56,0
415�
.74
67�
0 .6
�44
80 .
4
7Ili
�080
,589
�54�
,794
�70 .
605�
.14
�7,5
8146
.60
–0 .
01
�14
0 .�
8K
aras
ai66
1��,
494
6084
,1�8
184 .
1068
.16
�9,�
66�1
.90
–0 .
00
–0 .
0
9K
arat
al49
��,�
556
6,�1
744
.90
�7 .0
4�16
,�01
69 .4
18�
7� .
60
–0 .
0
10K
erbu
lak
6540
,157
�6��
,1�1
166 .
9057
.6�5
14,7
78�6
.84
��58
5 .6
0–
0 .0
11K
oksu
�8�7
,�41
1814
,�00
90 .0
551
.9�0
1�,1
4148
.10
–0 .
00
–0 .
0
1�P
anfil
ov44
8�,8
5���
40,0
9511
� .50
48 .4
114�
,758
51 .6
0–
0 .0
0–
0 .0
1�R
aiym
bek
5680
,�98
�95�
,950
164 .
4067
.11�
�1,�
�7�6
.515
5,11
16 .
40
–0 .
0
14Sa
rkan
d�6
�7,0
���
5,40
91�
.00
�0 .0
1�1�
,98�
51 .7
157,
�85
�7 .�
6�5
50 .
9
15Ta
lgar
609�
,�19
4�4�
,�99
144 .
7045
.517
50,8
�054
.50
–0 .
00
–0 .
0
16U
igur
�66�
,867
1��8
,�65
1�5 .
6059
.99
��,7
80�5
.74
�,8�
�4 .
40
–0 .
0
17K
apsh
agai
(u .a
)*11
1�,�
�0�
5,0�
�19
.60
�8 .0
88,
198
6� .0
0–
0 .0
0–
0 .0
18Ta
ldyk
orga
n (u
.a .)*
9�1
,55�
�5,
944
�5 .0
0�7
.67
15,6
087�
.40
–0 .
00
–0 .
0
Tota
l in
Obl
ast:
811
1,10
6,46
8�9
157
�,41
7��
14 .0
151
.8�5
�50
7,75
945
.955
��,0
�9� .
11�
��5�
0 .�
Not
e: *
u.a.
– u
rban
agg
lom
erat
e

1�5
ANNExES
Expe
cted
Inve
stm
ents
to W
ater
sup
ply
Impr
ovem
ent i
n R
ural
Are
as o
f Alm
aty
obl
ast (
Un
it: K
zt m
ln)
№N
ame
of R
ayon
�005
�006
�007
�008
Total in �005
Sour
ces
of F
inan
cing
Total in �006
Sour
ces
of F
inan
cing
Total in �007
Sour
ces
of F
inan
cing
Total in �008
Sour
ces
of F
inan
cing
cental state budget
local budget
legal entity
foreign grants and loans
cental state budget
local budget
legal entity
foreign grants and loans
cental state budget
local budget
legal entity
foreign grants and loans
cental state budget
local budget
legal entity
foreign grants and loans
1A
ksu
15 .8
�15
.8�
–�0
.00
10 .0
010
.00
87 .0
017
.070
.00
�A
lako
l46
.��
46 .�
�–
4� .0
0��
.00
�0 .0
01�
9 .00
40 .0
019
.080
.00
�B
alkh
ash
8� .6
4�9
.01
4� .6
�1�
� .�0
1�� .
�056
.85
�� .�
5�4
.50
67 .0
017
.050
.00
4En
beks
hika
zakh
169 .
175
115 .
�75
5� .9
140 .
0014
0 .00
117 .
0090
.00
�7 .0
018
.00
18 .0
5Es
keld
y0
–15
.50
15 .5
0�6
.00
16 .0
10 .0
0
6Zh
amby
l1�
.�4
1� .�
419
.70
19 .7
085
.16
65 .0
0�0
.16
169 .
0010
5 .00
14 .0
50 .0
0
7Ili
45 .�
6�6
.46
8 .9
1�4 .
60�6
.8�
97 .7
70 .
00�8
.00
18 .0
10 .0
0
8K
aras
ai5�
.65
5� .6
514
0 .79
109 .
99�0
.80
61 .5
061
.50
150 .
5050
.00
10 .5
0
9K
arat
al0
–��
.69
�� .6
91�
0 .00
1�0 .
00
10K
erbu
lak
050
.66
45 .1
15 .
55�6
.00
16 .0
0�0
.00
17 .0
017
.0
11K
oksu
0–
16 .8
016
.80
46 .0
016
.0�0
.00
1�P
anfil
ov0
1� .0
01�
.00
14 .0
014
.00
61 .6
740
.0�1
.67
1�R
aiym
bek
66 .7
566
.75
�� .5
7��
.57
�0 .0
0�0
.00
88 .0
050
.00
18 .0
�0 .0
0
14Sa
rkan
d0
–41
.00
�1 .0
0�0
.00
86 .5
016
.570
.00
15Ta
lgar
46 .�
�46
.��
8� .0
�54
.90
�7 .1
�17
� .50
1�9 .
5044
.00
65 .5
065
.5
16U
igur
1010
�� .1
4��
.14
68 .�
068
.�0
16 .0
016
.0
17K
apsh
agai
(u .a
)*0
��9 .
40�0
9 .�7
�0 .0
�10
.00
10 .0
0�0
.00
�0 .0
0
18Ta
ldyk
orga
n (u
.a .)*
0–
�0 .0
0�0
.00
45 .0
045
.00
Tota
l in
Obl
ast:
547 .
�85
��7 .
065
�10 .
��0
01,
108 .
1969
6 .�0
411 .
990
085
1 .�
�16 .
85�9
1 .66
014
� .69
1,�6
0 .�
�45
408 .
5–
606 .
67
Not
e: *
u.a.
– u
rban
agg
lom
erat
e

UNDP Project National Plan for Integrated Water Resources Management and Water Efficiency in Kazakhstan
ACCEss to DRINKINg WAtER AND sANItAtIoN IN thE REPUblIC of KAzAKhstAN
1�6
Expe
cted
Inve
stm
ents
to W
ater
sup
ply
Impr
ovem
ent i
n R
ural
Are
as o
f Alm
aty
obl
ast (
Un
it: K
zt m
ln)
№N
ame
of R
ayon
�009
-�01
0
Gra
nd
Tota
lTo
tal i
n
�009
-�0
10
Sour
ces
of F
inan
cing
cent
al
stat
e bu
dget
loca
l bu
dget
le
gal
entit
y
fore
ign
gran
ts
and
loan
s
1A
ksu
140 .
00�0
.00
110 .
00�6
� .8�
0
�A
lako
l14
0 .00
40 .0
010
0 .00
�68 .
��0
�B
alkh
ash
40 .0
010
.00
�0 .0
0�6
9 .79
0
4En
beks
hika
zakh
–44
4 .17
5
5Es
keld
y�0
.00
�0 .0
071
.500
6Zh
amby
l60
.00
10 .0
050
.00
�46 .
100
7Ili
�0 .0
0�0
.00
��7 .
960
8K
aras
ai–
405 .
440
9K
arat
al16
0 .00
�0 .0
01�
0 .00
�1� .
690
10K
erbu
lak
70 .0
0�0
.00
50 .0
017
� .66
0
11K
oksu
75 .0
0�0
.00
55 .0
01�
7 .80
0
1�P
anfil
ov80
.00
�0 .0
050
.00
167 .
670
1�R
aiym
bek
40 .0
010
.00
�0 .0
0�5
7 .��
0
14Sa
rkan
d84
.67
�0 .0
054
.67
�1� .
170
15Ta
lgar
10 .0
010
.00
�77 .
�60
16U
igur
10 .0
010
.00
1�7 .
�40
17K
apsh
agai
(u .a
)10
.00
10 .0
0�8
9 .40
0
18Ta
ldyk
orga
n (u
.a .)
70 .0
0�0
.00
40 .0
014
5 .00
0
Tota
l in
Obl
ast:
1,0�
9 .67
––
�90 .
0074
9 .67
4,80
6 .51
5
Not
e: *
u.a.
– u
rban
agg
lom
erat
e

1�7
ANNExES
Acc
ess
to D
rin
kin
g W
ater
in E
ast –
Kaz
akhs
tan
obl
ast:
Pre
sen
t an
d fu
ture
Con
diti
ons
№N
ame
of R
ayon
Population as of 01 .01 .�004 (ps .)
Population with access to drinking
water as of 01 .01 .�005 (ps .)
Acc
ess
of p
opul
atio
n to
dri
nkin
g w
ater
(in
% o
f tot
al p
opul
atio
n)
as o
f 1 .
01 .�
005
incr
emen
t fo
r �0
05
(ps .
)
as o
f 1 .
01 .�
006
incr
emen
t fo
r �0
06
(ps .
)
as o
f 1 .
01 .�
007
incr
emen
t fo
r �0
07(p
s .)
as o
f 1 .
01 .�
008
incr
emen
t fo
r �0
08
(ps .
)
as o
f 1 .
01 .�
009
incr
emen
t fo
r �0
09
(ps .
)
as o
f 1 .
01 .�
010
incr
emen
t fo
r �0
10
(ps .
)
as o
f 1 .
01 .�
011
1U
st-
Kam
enog
orsk
(u
.a .)*
10,5
46�,
11�
�9 .5
1,�7
541
.61,
048
51 .5
–51
.5–
51 .5
�00
54 .4
1,00
06�
.9
�R
idde
r (u
.a .)*
�,4�
850
�14
.6�6
5��
.��0
0�1
.0–
�1 .0
�00
�9 .8
500
54 .�
�00
6� .0
�Se
mip
alat
insk
(u
.a .)*
��,8
077,
961
�� .4
1,9�
541
.6–
41 .6
�,0�
850
.1��
176�
.61,
774
71 .1
–71
.1
4A
bai
16,8
704,
775
�8 .�
–�8
.�–
�8 .�
5,19
�59
.1�0
060
.950
06�
.81,
�00
70 .9
5A
yago
z�5
,4�4
148
0 .4
–0 .
4–
0 .4
�,77
98 .
�6,
9�7
�7 .8
�,58
8�8
.05,
000
5� .1
6B
eska
raga
i �5
,851
�,84
614
.94�
�16
.61,
485
�� .�
400
�� .8
4,01
��9
.41,
000
4� .�
�,50
05�
.9
7B
orod
ulih
insk
y��
,177
1�,6
�741
.15,
500
57 .7
1,60
06�
.5�,
99�
74 .5
�00
75 .1
�00
75 .7
500
77 .�
8G
lubo
kovs
ky40
,759
1�,0
�6��
.0�,
550
40 .7
1,��
04�
.94,
94�
56 .1
5,51
669
.6�0
070
.1�0
070
.8
9Zh
arm
in�5
,985
11,8
06��
.81,
5��
�7 .1
5,6�
15�
.75,
010
66 .6
1,00
069
.4�,
795
80 .0
–80
.0
10Za
isan
��,9
7�10
,�78
45 .�
1,16
�50
.�1,
500
56 .8
�,1�
166
.0�,
141
75 .4
1,�1
481
.1–
81 .1
11Zy
ryan
ovsk
y�4
,446
6,66
5�7
.�16
9�8
.0–
�8 .0
–�8
.04,
589
46 .7
1,�0
051
.61,
500
57 .8
1�K
aton
-Kar
agai
41,8
6�1�
,811
�� .0
�,4�
��8
.8�,
�87
46 .9
�48
47 .5
6,06
�61
.91,
000
64 .�
1,80
068
.6
1�K
okpe
kty
41,0
5710
,580
�5 .8
�,60
7��
.1�0
0��
.85,
�19
45 .6
���
46 .1
800
48 .1
�,50
054
.�
14K
urch
um40
,8�4
11,5
70�8
.��,
�00
�6 .4
8,56
157
.4�,
197
6� .8
1,06
565
.4�0
065
.9�0
066
.6
15Ta
rbag
atai
55,0
8411
,405
�0 .7
�00
�1 .1
46�
�1 .9
8,��
8�6
.9�,
507
4� .�
�,77
750
.1�,
000
5� .7
16U
lan
�4,�
109,
�7�
�7 .�
575
�9 .0
–�9
.04,
147
41 .1
4,17
55�
.�80
055
.6�,
500
6� .9
17U
rdja
r88
,994
��,8
8��6
.8�,
000
�0 .�
�,89
5�4
.6�8
,091
66 .1
11,1
8�78
.71,
798
80 .7
�00
81 .0
18Sh
emon
aihi
nsky
��,9
7�7,
851
�4 .�
1,00
0�8
.5–
�8 .5
500
40 .7
1,00
045
.11,
500
51 .6
1,5�
058
.�
Tota
l in
Obl
ast:
598,
�89
164,
��0
�7 .5
�8,9
�7��
.��9
,499
�7 .�
75,1
�649
.855
,4�6
59 .0
�4,�
466�
.1��
,1�0
67 .0
Not
e: *
u.a.
– u
rban
agg
lom
erat
e

UNDP Project National Plan for Integrated Water Resources Management and Water Efficiency in Kazakhstan
ACCEss to DRINKINg WAtER AND sANItAtIoN IN thE REPUblIC of KAzAKhstAN
1�8
Pre
sen
t sit
uati
on w
ith
Rur
al W
ater
sup
ply
in E
ast-
Kaz
akhs
tan
obl
ast
№N
umbe
r of
Set
tlem
ents
(it
ems)
Pop
ulat
ion
(ps .
)P
opul
atio
n (p
s .)
Ava
ilabi
lity
of W
ater
Sup
ply
from
:
cent
raliz
ed w
ater
sup
ply
syst
emlo
cal w
ater
sou
rces
deliv
ered
wat
ergr
ound
wat
ersu
rfac
e w
ater
Num
ber
of
Sett
lem
ents
Pop
ulat
ion
Leng
th o
f W
ater
Pip
e N
etw
ork
(km
)
Num
ber
of
sett
lem
ents
Pop
ulat
ion
Num
ber
of
sett
lem
ents
Pop
ulat
ion
Num
ber
of
sett
lem
ents
Pop
ulat
ion
1U
st-K
amen
ogor
sk (u
.a .)*
710
,546
5�,
11�
�4 .0
0�
7,4�
�0
–0
0
�R
idde
r (u
.a .)*
18�,
4�8
150
�–
17�,
9�6
0–
00
�Se
mip
alat
insk
(u .a
.)*�7
��,8
0717
7,96
15 .
8��0
15,8
460
–0
0
4A
bai
1016
,870
64,
775
59 .6
74
1�,0
950
–0
0
5A
yago
z64
�5,4
�4�
148
5 .00
6��5
,�86
0–
00
6B
eska
raga
i �0
�5,8
515
�,84
6��
.00
59,
�40
�01�
,765
00
7B
orod
ulih
insk
y65
��,1
77�1
1�,6
�759
.00
4�19
,550
0–
00
8G
lubo
kovs
ky40
40,7
59�1
1�,0
�615
6 .00
19�7
,7��
0–
00
9Zh
arm
in77
�5,9
851�
11,8
0650
.50
65�4
,179
0–
00
10Za
isan
4���
,97�
1�10
,�78
77 .7
0�9
1�,0
��7
50�
169
11Zy
ryan
ovsk
y47
�4,4
46�4
6,66
55�
.90
��17
,65�
11�
90
0
1�K
aton
-Kar
agai
6441
,057
810
,580
85 .0
056
�1,�
8�0
–0
0
1�K
okpe
kty
6140
,8�4
611
,570
1�4 .
10�5
15,6
81�0
1�,8
060
0
14K
urch
um54
41,8
6��5
1�,8
119�
.90
17�6
,548
1�1
71
�48
15Ta
rbag
atai
6855
,084
1111
,405
�6 .9
05�
4�,6
790
–0
0
16U
lan
44�4
,�10
��9,
�7�
�8 .0
0��
�4,9
�70
–0
0
17U
rdja
r50
88,9
9417
��,8
8�18
8 .00
1961
,681
4�,
4�0
00
18Sh
emon
aihi
nsky
40��
,97�
�77,
851
111 .
409
1�,7
�04
1,40
10
0
Tota
l in
Obl
ast
818
598,
�89
���
164,
��0
1,�0
1 .89
489
401,
50�
67��
,�50
��1
7
Not
e: *
u.a.
– u
rban
agg
lom
erat
e

1�9
ANNExES
Expe
cted
Inve
stm
ents
to W
ater
sup
ply
Impr
ovem
ent i
n R
ural
Are
as o
f Eas
t-K
azak
hsta
n o
blas
t (U
nit
: Kzt
mln
)
№N
ame
of R
ayon
�005
�006
�007
�008
Total in �005
Sour
ces
of F
inan
cing
Total in �006
Sour
ces
of F
inan
cing
Total in �007
Sour
ces
of F
inan
cing
Total in �008
Sour
ces
of F
inan
cing
cental state budget
local budget
legal entity
foreign grants and loans
cental state budget
local budget
legal entity
foreign grants and loans
cental state budget
local budget
legal entity
foreign grants and loans
cental state budget
local budget
legal entity
foreign grants and loans
1U
st-K
amen
ogor
sk (u
.a .)*
�� .6
50
�� .6
50
0-
00
00
5� .5
00
50 .0
00
� .50
10 .0
00
00
10 .0
0
�R
idde
r (u
.a .)*
� .89
0� .
890
09 .
600
9 .60
00
1 .00
00
01 .
00� .
000
00
� .00
�Se
mip
alat
insk
(u .a
.)*19
.51
019
.51
00
-0
00
0�9
.50
0��
.00
07 .
508�
.00
057
.00
0�5
.00
4A
bai
00
00
0-
00
00
4� .5
0�5
.00
00
7 .50
17 .0
00
00
17 .0
0
5A
yago
z0
00
00
-0
00
070
.50
50 .0
010
.00
010
.50
�74 .
00�0
0 .00
�9 .0
00
�5 .0
0
6B
eska
raga
i 7 .
960
7 .96
00
19 .6
00
19 .6
00
07 .
500
00
7 .50
48 .6
00
�1 .6
00
�7 .0
0
7B
orod
ulih
insk
y50
.00
50 .0
00
00
4�9 .
704�
9 .70
00
044
� .00
44� .
000
00 .
005 .
000
00
5 .00
8G
lubo
kovs
ky��
.49
0��
.49
00
4 .�0
04 .
�00
055
.50
04�
.00
01�
.50
70 .0
00
�0 .0
00
40 .0
0
9Zh
arm
in87
.46
70 .0
017
.46
00
�04 .
80�5
0 .00
54 .8
00
01�
0 .00
1�0 .
000
00
50 .0
00
45 .0
00
5 .00
10Za
isan
1� .4
50
1� .4
50
044
.�0
044
.�0
00
�0 .5
00
�� .0
00
7 .50
65 .0
00
4� .0
00
�� .0
0
11Zy
ryan
ovsk
y6 .
000
6 .00
00
-0
00
07 .
500
00
7 .50
45 .0
00
�0 .0
00
�5 .0
0
1�K
aton
-Kar
agai
9 .50
09 .
500
09 .
560
9 .56
00
�4 .5
00
1� .0
00
1� .5
07�
.00
0�8
.00
045
.00
1�K
okpe
kty
�8 .0
�0
�8 .0
�0
0-
00
00
4� .5
00
�0 .0
00
1� .5
057
.00
01�
.00
045
.00
14K
urch
um18
.00
018
.00
00
51 .1
00
51 .1
00
047
.50
0�5
.00
01�
.50
59 .4
00
17 .4
00
4� .0
0
15Ta
rbag
atai
5 .��
05 .
��0
09 .
400
9 .40
00
161 .
5010
0 .00
45 .0
00
16 .5
015
7 .00
47 .0
055
.00
055
.00
16U
lan
9 .85
09 .
850
0-
00
00
5� .5
04�
.00
00
10 .5
01�
5 .00
090
.00
0�5
.00
17U
rdja
r40
.7�
40 .7
�0
00
16� .
5016
� .50
00
0�1
� .00
160 .
001�
0 .00
0��
.00
5�1 .
1��6
� .1�
85 .0
00
84 .0
0
18Sh
emon
aihi
nsky
99 .�
�8�
.��
17 .0
00
0-
00
00
7 .50
00
07 .
50��
.00
00
0��
.00
Tota
l in
Obl
ast:
456 .
05�4
� .04
�1� .
010
010
44 .6
684
� .�0
�0� .
460
015
�0 .0
096
0 .00
400 .
000
160 .
0016
95 .1
�60
9 .1�
54� .
000
544 .
00
Not
e: *
u.a.
– u
rban
agg
lom
erat
e

UNDP Project National Plan for Integrated Water Resources Management and Water Efficiency in Kazakhstan
ACCEss to DRINKINg WAtER AND sANItAtIoN IN thE REPUblIC of KAzAKhstAN
140
Expe
cted
Inve
stm
ents
to W
ater
sup
ply
Impr
ovem
ent i
n R
ural
Are
as o
f Eas
t-K
azak
hsta
n o
blas
t (U
nit
: Kzt
mln
)
№N
ame
of R
ayon
�009
-�01
0
Total in �009-�010
Sour
ces
of F
inan
cing
cental state budget
local budget
legal entity
foreign grants and loans
1U
st-K
amen
ogor
sk (u
.a .)*
88 .0
0�0
.00
5 .00
10 .0
04�
.00
�R
idde
r (u
.a .)*
�� .0
09 .
007 .
00� .
001�
.00
�Se
mip
alat
insk
(u .a
.)*��
7 .50
70 .0
055
.00
�� .5
090
.00
4A
bai
171 .
0050
.00
�5 .0
016
.00
70 .0
0
5A
yago
z�8
� .00
65 .0
040
.00
�� .0
014
5 .00
6B
eska
raga
i �4
9 .50
140 .
0080
.00
�4 .5
010
5 .00
7B
orod
ulih
insk
y6 .
40-
-0
6 .40
8G
lubo
kovs
ky44
8 .50
140 .
0010
0 .00
�8 .5
017
0 .00
9Zh
arm
in18
5 .00
-18
0 .00
05 .
00
10Za
isan
��7 .
0060
.00
50 .0
0��
.00
95 .0
0
11Zy
ryan
ovsk
y�0
8 .00
110 .
0080
.00
�� .0
095
.00
1�K
aton
-Kar
agai
484 .
5017
0 .00
105 .
00�9
.50
170 .
00
1�K
okpe
kty
47� .
0016
5 .00
100 .
00�9
.00
168 .
00
14K
urch
um45
� .50
160 .
0090
.00
�8 .5
016
5 .00
15Ta
rbag
atai
500 .
001�
8 .00
90 .0
05�
.00
��0 .
00
16U
lan
��4 .
5010
7 .00
60 .0
0��
.50
1�5 .
00
17U
rdja
r49
4 .00
�0 .0
0�0
.00
84 .0
0�6
0 .00
18Sh
emon
aihi
nsky
��8 .
0066
.00
55 .0
0��
.00
95 .0
0
Tota
l in
Obl
ast:
5,�1
� .40
1500
.00
1,16
� .00
500 .
00�,
150 .
40
Not
e: *
u.a.
– u
rban
agg
lom
erat
e

141
ANNExES
Acc
ess
to D
rin
kin
g W
ater
in W
est-
Kaz
akhs
tan
obl
ast:
Pre
sen
t an
d fu
ture
Con
diti
ons
№N
ame
of
Ray
on
Pop
ulat
ion
as o
f 01
.01 .
�004
(p
s .)
Pop
ulat
ion
with
acc
ess
to d
rink
ing
wat
er a
s of
01
.01 .
�005
(p
s .)
Acc
ess
of p
opul
atio
n to
dri
nkin
g w
ater
(in
% o
f tot
al p
opul
atio
n)
as o
f 1 .
01 .�
005
incr
emen
t fo
r �0
05
(ps .
)
as o
f 1 .
01 .�
006
incr
emen
t fo
r �0
06
(ps .
)
as o
f 1 .
01 .�
007
incr
emen
t fo
r �0
07(p
s .)
as o
f 1 .
01 .�
008
incr
emen
t fo
r �0
08
(ps .
)
as o
f 1 .
01 .�
009
and
�010
incr
emen
t fo
r �0
09
and
�010
(p
s .)
as o
f 1 .
01 .�
011
1U
ral (
u .a .
)*1,
979
�94
14 .8
1,61
196
.�–
96 .�
–96
.�–
96 .�
–96
.�
�A
kzha
ik46
,01�
1�,4
80�7
.1�,
�69
�� .1
4,57
64�
.09,
7��
6� .1
–6�
.1�,
550
70 .8
�B
urlin
sky
17,7
995,
645
�1 .7
477
�4 .4
791
�8 .8
–�8
.8��
8�57
.��,
500
76 .9
4D
zhan
galy
��,5
�05,
744
�4 .4
�,47
5�9
.�5,
644
6� .�
–6�
.�1�
0068
.�1,
680
75 .4
5Zh
anib
ek18
,��8
8,76
447
.864
�51
.�65
954
.9–
54 .9
191�
65 .4
�,�5
08�
.1
6Ze
leno
vsky
5�,5
8916
,005
�9 .9
�,�7
0�4
.�4,
957
4� .5
4,51
65�
.055
�06�
.�5,
8�8
7� .1
7K
azta
lovs
ky�6
,565
7,�7
919
.9�,
�7�
�8 .9
�,87
4�6
.74,
99�
50 .4
469�
6� .�
�,84
971
.0
8K
arab
ota
19,6
9�6,
709
�4 .1
7�5
�7 .8
1,11
04�
.4�,
�40
54 .8
�405
67 .0
�,�4
979
.0
9B
okei
orda
18,4
�84,
�18
�� .9
4,0�
�44
.7–
44 .7
–44
.7–
44 .7
4,70
070
.�
10Sy
rym
�6,9
117,
��4
�7 .�
1,71
0��
.64,
408
50 .0
–50
.0�4
5�6�
.84,
�9�
78 .7
11Ta
skal
y19
,197
1�,1
956�
.51,
�78
70 .�
1,��
676
.677
580
.7�4
181
.9–
81 .9
1�Te
rekt
y4�
,767
9,99
8��
.41,
91�
�7 .9
�,80
1�6
.75,
080
48 .6
–48
.65,
�79
61 .0
1�Sh
ingy
rlau
19,4
955,
95�
�0 .5
�,98
845
.9�,
�00
57 .1
–57
.1�6
8870
.91,
�8�
77 .5
Tota
l in
Obl
ast:
�44,
�8�
10�,
606
�9 .8
�6,7
6��7
.6��
,�56
46 .9
�7,�
�554
.9�5
�94
6� .�
�8,5
607�
.5
Not
e: *
u.a.
– u
rban
agg
lom
erat
e

UNDP Project National Plan for Integrated Water Resources Management and Water Efficiency in Kazakhstan
ACCEss to DRINKINg WAtER AND sANItAtIoN IN thE REPUblIC of KAzAKhstAN
14�
Pre
sen
t sit
uati
on w
ith
Rur
al W
ater
sup
ply
in W
est-
Kaz
akhs
tan
obl
ast
№N
ame
of R
ayon
Number of Settlements (items)
Population (ps .)
Ava
ilabi
lity
of W
ater
Sup
ply
from
:
cent
raliz
ed w
ater
sup
ply
syst
emlo
cal w
ater
sou
rces
deliv
ered
wat
ergr
ound
wat
ersu
rfac
e w
ater
Num
ber
of
Sett
lem
ents
Pop
ulat
ion
Leng
th o
f W
ater
Pip
e N
etw
ork
(km
)%
Num
ber
of
Sett
lem
ents
Pop
ulat
ion
%N
umbe
r of
Se
ttle
men
tsP
opul
atio
n%
Num
ber
of
Sett
lem
ents
Pop
ulat
ion
%
1U
ral (
u .a .
)5
1,97
91
�94
�14
.84
41,
685
85 .�
0–
00
–0 .
0
�A
kzha
ik57
46,0
1�5
1�,4
80�6
.8�7
.1�
�417
,195
�7 .4
1816
,��8
�5 .5
10
–0 .
0
�B
urlin
sky
�417
,799
85,
645
�4�1
.7�
�410
,645
59 .8
0–
0 .00
�1,
509
8 .5
4D
zhan
galy
�8��
,5�0
45,
744
1� .9
�4 .4
��
5,��
���
.��1
11,0
9847
.19
11,
445
6 .1
5Zh
anib
ek�0
18,�
�8�
8,76
47
47 .8
�17
9,56
45�
.�0
–0 .
000
–0 .
0
6Ze
leno
vsky
785�
,589
1716
,005
71�9
.87
56�5
,8�0
66 .8
0–
0 .00
51,
764
� .�
7K
azta
lovs
ky59
�6,5
65�
7,�7
9�1
19 .9
154
�6,�
5�71
.8�
�,0�
�8 .
�00
–0 .
0
8K
arab
ota
�519
,69�
66,
709
17 .5
�4 .0
716
11,�
��57
.00
–0 .
00�
1,76
08 .
9
9B
okei
orda
�518
,4�8
�4,
�18
47��
.89
191�
,581
68 .�
0–
0 .00
�1,
6�9
8 .8
10Sy
rym
�9�6
,911
67,
��4
�� .4
�7 .�
���
19,5
877�
.80
–0 .
000
–0 .
0
11Ta
skal
y�5
19,1
978
1�,1
9574
.56�
.5�
�77,
00�
�6 .5
0–
0 .00
0–
0 .0
1�Te
rekt
y60
4�,7
6711
9,99
857
.9��
.�8
48��
,54�
76 .1
1��
60 .
5�0
–0 .
0
1�Sh
ingy
rlau
��19
,495
65,
95�
���0
.5�
�51�
,489
64 .1
�1,
054
5 .41
0–
0 .0
Tota
l in
Obl
ast:
498
�44,
�8�
8110
�,60
644
8�9
.80
�59
�01,
8�0
58 .6
44�1
,749
9 .��
148,
107
� .4
Not
e: *
u.a.
– u
rban
agg
lom
erat
e

14�
ANNExES
Expe
cted
Inve
stm
ents
to W
ater
sup
ply
Impr
ovem
ent i
n R
ural
Are
as o
f Wes
t-K
azak
hsta
n o
blas
t (U
nit
: Kzt
mln
)
№N
ame
of
Ray
on
�005
�006
�007
�008
�009
-�01
0
Grand Total
Total in �005
Sour
ces
of F
inan
cing
Total in �006
Sour
ces
of F
inan
cing
Total in �007
Sour
ces
of F
inan
cing
Total in �008
Sour
ces
of F
inan
cing
Total in �009-�011
Sour
ces
of
Fina
ncin
g
cental state budget
local budget
legal entity
foreign grants and loans
cental state budget
local budget
legal entity
foreign grants and loans
cental state budget
local budget
legal entity
foreign grants and loans
cental state budget
local budget
legal entity
foreign grants and loans
cental state budget
local budget
legal entity
foreign grants and loans
1U
ral (
u .a .
)*0
00
16 .9
516
.95
00
00
00
00
00
16 .9
5
�A
kzha
ik56
.95
50 .�
56 .
71�
4 .76
5�6
.565
98 .�
1�9 .
068
1�9 .
068
00
00
600
60�9
0 .78
�
�B
urlin
sky
�6 .8
�51 .
84�
.877
�7 .0
7716
.80
00
100 .
40
100 .
470
070
�51 .
077
4D
zhan
galy
151 .
756
151 .
756
084
.19�
84 .1
9�0
00
0�9
�90
800
80�5
4 .94
8
5Zh
anib
ek9 .
80
9 .8
17 .8
017
.80
00
100 .
�0
100 .
�70
070
197 .
9
6Ze
leno
vsky
��9 .
18�
��4 .
18�
5�1
� .4�
5�9
4 .6�
518
.811
� .49
58�
.595
�8 .9
115 .
10
115 .
16�
.50
6� .5
84� .
71�
7K
azta
lovs
ky10
8 .�9
910
8 .�9
90
1�4 .
078
1�4 .
078
016
0 .56
1�1 .
86�8
.718
7 .95
168 .
1519
.8�5
0�5
605 .
987
8K
arab
ota
44 .0
8�9
.68
4 .4
54 .8
���0
.7��
�4 .1
97 .4
4771
.747
�5 .7
106 .
670
.5�6
.1��
.60
�� .6
��6 .
55
9B
okei
orda
11� .
9611
� .96
00
00
00
00
00
800
8019
� .96
10Sy
rym
5 .9
05 .
9��
7 .17
��7 .
170
00
019
8 .1
1�7 .
570
.699
.10
99 .1
6�0 .
�7
11Ta
skal
y4�
.14�
.10
�0 .�
�5�0
.��5
07�
.10
7� .1
86 .9
686
.96
00
00
��� .
485
1�Te
rekt
y�8
.4��
.75 .
7��
9 .4
0��
9 .4
�� .9
0��
.90
011
00
110
411 .
7
1�Sh
ingy
rlau
118 .
10
118 .
110
7 .1
010
7 .1
00
056
.�0
56 .�
5� .�
05�
.���
4 .6
Tota
l in
Obl
ast:
955 .
4�7
798 .
0�7
157 .
40
01,
49� .
915
961 .
715
5�� .
�0
061
6 .57
416 .
�7�0
0 .�
00
990 .
6149
� .11
498 .
50
07�
� .4
0�6
� .4
470
04,
789 .
9��
Not
e: *
u.a.
– u
rban
agg
lom
erat
e

UNDP Project National Plan for Integrated Water Resources Management and Water Efficiency in Kazakhstan
ACCEss to DRINKINg WAtER AND sANItAtIoN IN thE REPUblIC of KAzAKhstAN
144
Acc
ess
to D
rin
kin
g W
ater
in K
yzyl
orda
obl
ast:
Pre
sen
t an
d fu
ture
Con
diti
ons
№N
ame
of R
ayon
Pop
ulat
ion
as o
f 1 .
01 .�
004
(ps .
)
Pop
ulat
ion
with
acc
ess
to d
rink
ing
wat
er a
s of
1 .
01 .�
005
(ps .
)
Acc
ess
of p
opul
atio
n to
dri
nkin
g w
ater
(in
% o
f tot
al p
opul
atio
n)
as o
f 1 .
01 .�
005
incr
emen
t fo
r �0
05
(ps .
)
as o
f 1 .
01 .�
006
incr
emen
t fo
r �0
06
(ps .
)
as o
f 1 .
01 .�
007
incr
emen
t fo
r �0
07(p
s .)
as o
f 1 .
01 .�
008
incr
emen
t fo
r �0
08
(ps .
)
as o
f 1 .
01 .�
009
and
�010
incr
emen
t fo
r �0
09 a
nd
�010
(ps .
)
as o
f 1 .
01 .�
011
1K
yzyl
orda
(u .a
)*16
,9�5
6,97
041
.�4�
44�
.74�
.74�
.74�
.74,
��4
69 .�
�A
ral
�6,5
5510
,675
40 .�
�,46
049
.549
.549
.549
.54,
5�8
66 .6
�Zh
alag
ash
�6,0
�917
,680
67 .9
1,65
474
.�74
.�74
.�74
.�95
077
.9
4Zh
anak
orga
n 47
,759
�0,6
9864
.��,
654
69 .8
69 .8
69 .8
69 .8
500
70 .9
5K
azal
y�9
,6�4
4,81
516
.�4,
�15
�0 .5
5,00
047
.44,
076
61 .1
4,�0
775
.�1,
�15
79 .4
6K
arm
aksh
y�1
,�15
1�,6
6�64
.11,
761
7� .4
1�0
7� .0
156
7� .7
�50
74 .9
1,08
780
.0
7Sy
rdar
ya�0
,4�5
19,7
6465
.01,
08�
68 .5
110�
7� .1
750
74 .6
5�4
76 .4
645
78 .5
8Sh
yili
47,1
86��
,566
49 .9
�,4�
�55
.157
6467
.��,
569
7� .7
�,84
�80
.9�,
��0
87 .7
Tota
l in
Obl
ast:
�45,
8�8
1�7,
8�1
5� .0
16,6
8�58
.811
,997
6� .7
7,55
166
.78,
8��
70 .�
16,4
7977
.0
Not
e: *
u.a.
– u
rban
agg
lom
erat
e

145
ANNExES
Pre
sen
t sit
uati
on w
ith
Rur
al W
ater
sup
ply
in K
yzyl
orda
obl
ast
№N
ame
of R
ayon
Number of Settlements (items)
Population (ps .)
Ava
ilabi
lity
of W
ater
Sup
ply
from
:
cent
raliz
ed w
ater
sup
ply
syst
emlo
cal w
ater
sou
rces
deliv
ered
wat
ergr
ound
wat
ersu
rfac
e w
ater
Num
ber
of
Sett
lem
ents
Pop
ulat
ion
Leng
th o
f W
ater
Pip
e N
etw
ork
(km
)%
Num
ber
of
Sett
lem
ents
Pop
ulat
ion
%N
umbe
r of
Se
ttle
men
tsP
opul
atio
n%
Num
ber
of
Sett
lem
ents
Pop
ulat
ion
%
1K
yzyl
orda
(u .a
)*18
16,9
�58
6,97
0�6
.541
.�10
9,96
558
.80
–0 .
00
–0 .
0
�A
ral
58�6
,555
1910
,675
48 .8
540
.��0
1�,6
7�51
.5�
1575
5 .9
66�
�� .
4
�Zh
alag
ash
17�6
,0�9
1517
,681
67 .5
67 .9
�8,
�48
�� .1
0–
0 .0
0–
0 .0
4Zh
anak
orga
n �7
47,7
59�5
�0,6
98�0
8 .6
64 .�
1�17
,061
�5 .7
0–
0 .0
0–
0 .0
5K
azal
y57
�9,6
�44
4,81
547
.�16
.�44
�4,6
968�
.46
9�0 .
��
�10 .
1
6K
arm
aksh
y�8
�1,�
1510
1�,6
6�57
.�64
.116
7,6�
5�5
.8�
�70 .
10
–0 .
0
7Sy
rdar
ya16
�0,4
�514
19,7
645�
65 .0
�10
,661
�5 .0
0–
0 .0
0–
0 .0
8Sh
yili
�947
,186
����
,566
115
49 .9
16��
,6�0
50 .1
0–
0 .0
0–
0 .0
Tota
l in
Obl
ast:
�70
�45,
8�8
118
1�7,
8��
6�� .
055�
.01�
�11
5,64
847
.011
1695
0 .7
965
�0 .
�
Not
e: *
u.a.
- urb
an a
gglo
mer
ate

UNDP Project National Plan for Integrated Water Resources Management and Water Efficiency in Kazakhstan
ACCEss to DRINKINg WAtER AND sANItAtIoN IN thE REPUblIC of KAzAKhstAN
146
Expe
cted
Inve
stm
ents
to W
ater
sup
ply
Impr
ovem
ent i
n R
ural
Are
as o
f Kyz
ylor
da o
blas
t (U
nit
: Kzt
mln
)
№N
ame
of R
ayon
�005
�006
�007
�008
�009
– �
010
Total in �005
Sour
ces
of F
inan
cing
Total in �006
Sour
ces
of F
inan
cing
Total in �007
Sour
ces
of F
inan
cing
Total in �008
Sour
ces
of F
inan
cing
Total in �009-�011
Sour
ces
of F
inan
cing
cental state budget
local budget
legal entity
foreign grants and loans
cental state budget
local budget
legal entity
foreign grants and loans
cental state budget
local budget
legal entity
foreign grants and loans
cental state budget
local budget
legal entity
foreign grants and loans
cental state budget
local budget
legal entity
foreign grants and loans
1K
yzyl
orda
(u .a
)*7 .
197 .
190
00
7070
�A
ral
18 .8
618
.86
00
070
70
�Zh
alag
ash
�� .�
���
.��
00
0�5
�5
4Zh
anak
orga
n �6
.�7
�6 .�
70
00
�0�0
5K
azal
y44
0 .55
40�
�7 .5
588
488
450
050
01,
799 .
501,
799 .
50�0
�0
6K
arm
aksh
y�5
.�17
.�18
�50
�50
�00
�00
�97 .
�0�9
7 .�0
�0�0
7Sy
rdar
ya�8
.9�8
.994
.�7
94 .�
70
–�0
�0
8Sh
yili
�1� .
9418
6 .�
�6 .6
465
5 .74
6�� .
�8��
.�6
1,0�
7 .��
1,01
0 .�0
�7 .0
�1,
050 .
001,
011 .
00�9
�,00
1 .0
1,9�
5 .�
75 .8
Tota
l in
Obl
ast:
80� .
��60
6 .6
195 .
7�0
01,
884 .
011,
850 .
65��
.�6
00
1,8�
7 .��
1,81
0 .�0
�7 .0
�0
0�,
146 .
80�,
107 .
80�9
00
�,�8
6 .0
1,9�
5 .�
�60 .
80
0
Not
e: *
u.a.
– u
rban
agg
lom
erat
e

147
ANNExES
Acc
ess
to D
rin
kin
g W
ater
in N
orth
-Kaz
akhs
tan
obl
ast:
Pre
sen
t an
d fu
ture
Con
diti
ons
№N
ame
of R
ayon
Pop
ulat
ion
with
acc
ess
to d
rink
ing
wat
er a
s of
1 .
01 .�
005
(ps .
)
Acc
ess
of p
opul
atio
n to
dri
nkin
g w
ater
(in
% o
f tot
al p
opul
atio
n)
as o
f 1 .
01 .�
005
incr
emen
t fo
r �0
05
(ps .
)
as o
f 1 .
01 .�
006
incr
emen
t fo
r �0
06
(ps .
)
as o
f 1 .
01 .�
007
incr
emen
t fo
r �0
07(p
s .)
as o
f 1 .
01 .�
008
incr
emen
t fo
r �0
08
(ps .
)
as o
f 1 .
01 .�
009
incr
emen
t fo
r �0
09
(ps .
)
as o
f 1 .
01 .�
010
incr
emen
t fo
r �0
10
(ps .
)
as o
f 1 .
01 .�
011
1P
etro
pavl
ovsk
(u
.a .)*
–0
–0
–0
00
600
69 .4
�64
100 .
00
100 .
0
�A
iyrt
au�9
�0 .
6�,
000
6 .�
4,00
01�
.94,
54�
�� .6
7,86
0�7
.75,
000
47 .�
8,80
064
.0
�A
kzha
r1�
,9�6
59 .�
�,11
�68
.�80
071
.7�,
500
8� .4
800
85 .8
1,00
090
.080
09�
.4
4Zh
umab
aev
1�,7
6�61
.180
064
.6–
64 .6
1,�0
070
.01,
800
77 .9
�,00
086
.8�,
400
97 .5
5Es
il 11
,589
�� .4
�,18
0�8
.5�,
��8
44 .7
�,19
05�
.64,
6�0
66 .5
1,50
070
.7�,
500
77 .7
6Zh
amby
l9,
�14
�6 .9
1,15
0�0
.��,
160
�6 .4
�,50
046
.55,
500
6� .4
�,10
068
.4�,
000
77 .1
7K
yzyl
zhar
�8,�
4876
.1�,
100
81 .8
�,00
087
.1�,
�50
9� .�
1,10
096
.1�0
096
.780
098
.8
8M
amly
u�4
,469
50 .0
�,49
055
.15,
�69
65 .8
5,66
077
.4�,
160
81 .8
1,�0
084
.51,
700
87 .9
9Sh
al A
kyn
4,40
1��
.��7
1�5
.��,
800
40 .0
�,77
054
.61,
000
59 .9
1,00
065
.�90
069
.9
10A
kkai
yn�,
156
5 .�
4,00
014
.98,
000
�4 .4
�,00
041
.74,
600
5� .8
1,�0
055
.7�,
500
61 .8
11Ta
iyns
hy�,
809
7 .9
6,50
0�1
.41,
876
�5 .�
5,00
0�5
.66,
540
49 .�
7,00
06�
.76,
700
77 .6
1�Ti
mir
yaze
vsky
10,7
1658
.9�,
��0
71 .7
500
74 .4
800
78 .8
1,00
084
.�1,
�00
90 .9
1,40
098
.6
1�U
alik
han
�,�1
11�
.4�,
9�0
�5 .6
1,�7
6�1
.�6,
500
58 .5
1,00
06�
.6�,
000
71 .0
�,00
08�
.5
14M
usre
pov
�,04
814
.41,
8�6
�� .0
1,�4
8�8
.9�,
500
40 .7
�,�0
055
.81,
500
6� .9
1,50
070
.0
Tota
l in
Obl
ast:
1�9,
051
�0 .�
�1,7
90�7
.6��
,�57
45 .�
4�,4
1�55
.�41
,780
65 .1
�7,�
6471
.5�6
,000
79 .9
Not
e: *
u.a.
– u
rban
agg
lom
erat
e

UNDP Project National Plan for Integrated Water Resources Management and Water Efficiency in Kazakhstan
ACCEss to DRINKINg WAtER AND sANItAtIoN IN thE REPUblIC of KAzAKhstAN
148
Pre
sen
t sit
uati
on w
ith
Rur
al W
ater
sup
ply
in N
orth
-Kaz
akhs
tan
obl
ast
№N
ame
of R
ayon
Num
ber
of
Sett
lem
ents
(it
ems)
Pop
ulat
ion
(ps .
)
Ava
ilabi
lity
of W
ater
Sup
ply
from
:
cent
raliz
ed w
ater
sup
ply
syst
em
from
loca
l sou
rces
deliv
ered
wat
erW
ater
Tar
iff,
KZT
/m�
grou
nd w
ater
su
rfac
e w
ater
Num
ber
of
Sett
lem
ents
P
opul
atio
n %
N
umbe
r of
Se
ttle
men
ts
Pop
ulat
ion
Num
ber
of
Sett
lem
ents
P
opul
atio
n N
umbe
r of
Se
ttle
men
ts
Pop
ulat
ion
1P
etro
pavl
ovsk
(u .a
.)*5
864
00
05
864
00
00
�A
iyrt
au88
5�,�
07�
�9�
0 .6
865�
,015
00
00
up to
75
�A
kzha
r�9
��,4
8814
1�,9
�659
.��0
9,55
�0
00
075
-150
4Zh
umab
aev
�5��
,5��
�81�
,76�
61 .1
�48,
770
00
00
>150
5Es
il 60
�5,8
0�8
11,5
89��
.455
�4,�
1�0
00
0
6Zh
amby
l6�
�4,6
7411
9�14
�6 .9
5��5
,�60
00
00
7K
yzyl
zhar
71�7
,��5
50�8
,�48
76 .1
�08,
�06
00
168
1>1
50
8M
amly
u7�
48,9
5��9
�4,4
6950
.041
��,8
690
0�
615
up to
75
9Sh
al A
kyn
4�18
,9�8
644
01��
.�18
7,��
�16
5,88
4�
1,4�
1
10A
kkai
yn7�
41,1
88�
�,15
65 .
�65
�6,7
��0
05
�,�9
975
-150
11Ta
iyns
hy98
48,�
�88
�,80
97 .
98�
4�,0
9�1
�16
61,
011
up to
75
1�Ti
mir
yaze
vsky
�718
,196
1510
,716
58 .9
97,
19�
00
��8
7up
to 7
5
1�U
alik
han
����
,978
5�,
�11
1� .4
�618
,777
00
�1,
990
14M
usre
pov
4��1
,178
6�,
048
14 .4
�718
,1�0
00
00
up to
75
Tota
l in
Obl
ast:
740
4�7,
561
184
1�9,
051
�0 .�
551
�8�,
996
176,
�00
��8,
�14
Not
e: *
u.a.
– u
rban
agg
lom
erat
e

149
ANNExESEx
pect
ed In
vest
men
ts to
Wat
er s
uppl
y Im
prov
emen
t in
Rur
al A
reas
of N
orth
-Kaz
akhs
tan
obl
ast (
Un
it: K
zt m
ln)
№N
ame
of R
ayon
Population
�005
�006
�007
Total in �005
Sour
ces
of F
inan
cing
Total in �006
Sour
ces
of F
inan
cing
Total in �007
Sour
ces
of F
inan
cing
cental state budget
local budget
legal entity
foreign grants and loans
cental state budget
local budget
legal entity
foreign grants and loans
cental state budget
local budget
legal entity
foreign grants and loans
1P
etro
pavl
ovsk
(u .a
.)*86
40
00
00
00
00
00
00
00
�A
iyrt
au5�
,�07
�4 .9
90
14 .9
90
�0 .0
0�6
0 .40
018
5 .40
017
5 .00
146 .
100
�6 .1
00
1�0 .
00
�A
kzha
r��
,488
57 .�
0�4
.47�
1� .7
�0
10 .0
0�4
.00
00
0�4
.00
1�� .
9410
1 .94
�� .0
00
0
4Zh
umab
aev
�7,�
�5�8
.00
0�8
.00
00
00
00
69 .0
00
51 .0
00
18 .0
0
5Es
il �5
,80�
148 .
�59�
.00
41 .�
50
15 .0
016
1 .57
70 .0
0�0
.��
071
.�4
181 .
6567
.00
�4 .0
00
90 .6
5
6Zh
amby
l�4
,674
11� .
4480
.00
14 .4
40
18 .0
0�6
7 .6�
176 .
6�0
091
.00
�40 .
671�
5 .67
�5 .0
00
80 .0
0
7K
yzyl
zhar
48,9
5���
0 .00
��0 .
000
00
��1 .
5915
0 .00
�1 .5
90
60 .0
0�0
0 .00
�00 .
000
00
8M
amly
u18
,9�8
�06 .
0718
� .60
160
6 .00
�0� .
601�
0 .00
47 .6
00
�5 .0
0�4
� .00
�8� .
000
060
.00
9Sh
al A
kyn
�1,1
78�1
.00
016
.00
5 .00
�00 .
00�0
0 .00
00
0�1
0 .00
�00 .
000
010
.00
10A
kkai
yn��
,5��
�80 .
00�8
0 .00
00
0�9
6 .�0
�00 .
0096
.�0
00
�4 .1
00
�4 .1
00
0
11Ta
iyns
hy48
,��8
144 .
�077
.�0
�7 .0
0�0
.00
1�8 .
490
�� .4
90
105 .
0016
6 .00
066
.00
010
0 .00
1�Ti
mir
yaze
vsky
18,1
96�5
7 .70
�55 .
�40
0� .
�6�7
.00
0��
.00
04 .
00��
.00
0��
.00
00
1�U
alik
han
��,9
7875
.14
47 .1
418
.00
10 .0
0�7
1 .�1
��9 .
06��
.15
0�0
.00
195 .
9418
0 .94
00
15 .0
0
14M
usre
pov
41,1
8874
.4�
0�1
.4�
04�
.00
16� .
590
64 .5
90
98 .0
011
6 .�0
0�4
.�0
08�
.00
Tota
l in
Obl
ast:
4�7,
561
1,75
9 .5�
1,�6
9 .75
��0 .
410
159 .
�6�,
458 .
�71,
�55 .
685�
9 .�5
067
� .�4
�,�6
0 .60
1,�7
0 .55
�14 .
400
575 .
65
N
ote:
* u
.a . –
urb
an a
gglo
mer
ate

UNDP Project National Plan for Integrated Water Resources Management and Water Efficiency in Kazakhstan
ACCEss to DRINKINg WAtER AND sANItAtIoN IN thE REPUblIC of KAzAKhstAN
150
Expe
cted
Inve
stm
ents
to W
ater
sup
ply
Impr
ovem
ent i
n R
ural
Are
as o
f Nor
th-K
azak
hsta
n o
blas
t (U
nit
: Kzt
mln
)
№N
ame
of R
ayon
�008
�009
– �
010
Total in �008
Sour
ces
of F
inan
cing
Total in �009-�011
Sour
ces
of F
inan
cing
cental state budget
local budget
legal entity
foreign grants and loans
cental state budget
local budget
legal entity
fore
ign
gran
ts
and
loan
s
1P
etro
pavl
ovsk
(u .a
.)*5 .
000
5 .00
00
7 .00
07 .
000
0
�A
iyrt
au�1
0 .00
050
.00
016
0 .00
�1� .
000
�0 .0
00
18� .
00
�A
kzha
r��
.00
0��
.00
00
90 .0
00
90 .0
00
0
4Zh
umab
aev
51 .0
00
51 .0
00
067
4 .50
674 .
500
00
5Es
il 18
8 .41
70 .0
0�4
.10
084
.�1
77 .7
�0
50 .0
00
�7 .7
�
6Zh
amby
l��
� .�0
�18 .
�0�5
.00
090
.00
�14 .
90�6
5 .90
00
49 .0
0
7K
yzyl
zhar
�10 .
0015
0 .00
00
60 .0
067
1 .50
6�5 .
500
046
.00
8M
amly
u14
0 .00
1�0 .
000
010
.00
561 .
0055
0 .00
00
11 .0
0
9Sh
al A
kyn
�0 .0
00
00
�0 .0
066
.40
61 .4
00
05 .
00
10A
kkai
yn�7
4 .10
�40 .
00�4
.10
00
60 .0
00
60 .0
00
0
11Ta
iyns
hy��
6 .00
60 .0
066
.00
010
0 .00
14� .
000
80 .0
00
6� .0
0
1�Ti
mir
yaze
vsky
�8 .0
00
�8 .0
00
01�
� .70
1�� .
700
00
1�U
alik
han
1� .0
00
00
1� .0
015
.00
015
.00
00
14M
usre
pov
�75 .
0015
0 .00
4� .0
00
8� .0
08�
.00
0�0
.00
05�
.00
Tota
l in
Obl
ast:
�,14
4 .81
11,5
8 .�0
�68 .
�00
618 .
�1�,
098 .
7��,
�00 .
00�6
� .00
04�
6 .7�

151
ANNExES
Acc
ess
to D
rin
kin
g W
ater
in A
ktob
e o
blas
t: P
rese
nt a
nd
futu
re C
ondi
tion
s
№N
ame
of
Ray
on
Pop
ulat
ion
as o
f 1 .
01 .�
004
(ps .
)
Pop
ulat
ion
with
acc
ess
to d
rink
ing
wat
er a
s of
1 .
01 .�
005
(ps .
)
Acc
ess
of p
opul
atio
n to
dri
nkin
g w
ater
(in
% o
f tot
al p
opul
atio
n)
as o
f 1 .
01 .�
005
incr
emen
t fo
r �0
05
(ps .
)
as o
f 1 .
01 .�
006
incr
emen
t fo
r �0
06
(ps .
)
as o
f 1 .
01 .�
007
incr
emen
t fo
r �0
07(p
s .)
as o
f 1 .
01 .�
008
incr
emen
t fo
r �0
08
(ps .
)
as o
f 1 .
01 .�
009
incr
emen
t fo
r �0
09
(ps .
)
as o
f 1 .
01 .�
010
incr
emen
t fo
r �0
10
(ps .
)
as o
f 1 .
01 .�
011
1A
ktob
e (u
.a .)*
�0,5
�118
,95�
6� .1
–6�
.15,
�55
79 .�
1,00
08�
.64�
984
.080
086
.680
089
.�
�A
iteke
bi�1
,615
10,�
6848
.098
95�
.51,
500
59 .5
–59
.51,
500
66 .4
�,50
078
.0�,
000
87 .�
�A
lgyn
sky
��,7
�44,
555
1� .9
–1�
.9�0
014
.5–
14 .5
4,00
0�6
.74,
000
�9 .0
6,00
057
.�
4B
aiga
ny�4
,097
9,95
141
.�–
41 .�
1,66
�48
.�–
48 .�
1,50
054
.4�,
000
6� .7
�,00
071
.0
5Ir
giz
15,5
085,
10�
�� .9
–��
.971
5�7
.5�,
���
51 .9
�,40
467
.41,
100
74 .5
1,�0
08�
.9
6K
arga
ly18
,��0
7,98
74�
.6–
4� .6
81�
48 .0
�,0�
�64
.550
067
.�1,
�00
7� .8
1,40
081
.4
7K
obdy
�4,9
��5,
�56
�1 .1
1,5�
��7
.��0
0�8
.01,
066
�� .�
1,50
0�8
.��,
500
48 .4
�,�0
061
.�
8M
artu
k�0
,144
5,9�
119
.71,
000
�� .0
�,00
0��
.95,
�88
50 .5
800
5� .1
1,��
�57
.��,
500
65 .5
Mug
alzh
ar��
,748
7,�6
6�0
.6–
�0 .6
–�0
.6–
�0 .6
1,00
0�4
.8�1
9�6
.��,
800
5� .�
10Te
mir
�0,1
9�6,
847
�� .9
800
�7 .9
�,10
65�
.��,
968
67 .9
�,57
�80
.740
08�
.760
085
.6
11U
il19
,10�
1,67
�8 .
8–
8 .8
–8 .
8–
8 .8
8,18
751
.6�,
000
6� .1
1,50
069
.9
1�K
hrom
tau
�1,�
�15,
�97
�5 .4
–�5
.4–
�5 .4
�,�7
��6
.11,
500
4� .�
481
45 .5
�,00
054
.9
1�Sh
alka
r�0
,4�7
8,96
74�
.9–
4� .9
–4�
.9–
4� .9
1,50
051
.��,
500
6� .4
�,00
078
.1
Tota
l in
Obl
ast:
�0�,
60�
98,�
5���
.54,
���
�� .9
16,4
51�9
.�17
,849
45 .�
�7,�
9�54
.��1
,0��
61 .�
�0,1
0071
.�
Not
e: *
u.a.
- urb
an a
gglo
mer
ate

UNDP Project National Plan for Integrated Water Resources Management and Water Efficiency in Kazakhstan
ACCEss to DRINKINg WAtER AND sANItAtIoN IN thE REPUblIC of KAzAKhstAN
15�
Pre
sen
t sit
uati
on w
ith
Rur
al W
ater
sup
ply
in A
ktob
e o
blas
t
№N
ame
of
Ray
on
Num
ber
of
Sett
lem
ents
(it
ems)
Pop
ulat
ion
(ps .
)
cent
raliz
ed w
atre
r su
pply
sys
tem
: lo
cal s
ourc
es:
deliv
ered
wat
er
Leng
th o
f w
ater
pip
e ne
twor
k (k
m)
Num
ber
of
Sett
lem
ents
P
opul
atio
n (p
s .)
%
grou
nd w
ater
surf
ace
wat
er
Num
ber
of
Sett
lem
ents
P
opul
atio
n (p
s .)
Num
ber
of
Sett
lem
ents
(it
ems)
Pop
ulat
ion
(ps .
)N
umbe
r of
Se
ttle
men
tsP
opul
atio
n (p
s .)
1A
ktob
e (u
.a .)*
���0
,5�1
7�4
,041
18,9
5�15
11,5
780
00
070
.9
�A
iteke
bi�7
��,7
�48
14,�
1�10
,�68
�7��
,119
00
��4
750
.0
�A
lgyn
sky
���1
,615
44,
9�4
4,55
5�9
17,0
600
00
0��
.6
4B
aiga
ny�8
�4,0
97�
1�,0
179,
951
��1�
,450
00
�69
6�9
.�
5Ir
giz
�015
,508
�6,
�06
5,10
�18
10,4
060
00
0��
.0
6K
arga
ly��
18,�
�09
11,6
067,
987
1410
,�4�
00
00
9� .7
7K
obdy
40�4
,9��
�7,
086
5,�5
6�7
19,6
760
00
0�5
.0
8M
artu
k48
�0,1
448
7,�6
05,
9�1
40�4
,�1�
00
00
4� .8
9M
ugal
zhar
4���
,748
67,
744
7,�6
6�6
16,4
8�0
00
0��
.0
10Te
mir
�619
,10�
�7,
8�7
6,84
7��
1�,�
560
00
054
.0
11U
il��
�0,1
9�1
5,57
91,
67�
��18
,5�0
00
00
10 .0
1�K
hrom
tau
40�1
,��1
87,
669
5,�9
7��
15,8
�40
00
0�5
.9
1�Sh
alka
r44
�0,4
�79
9,74
�8,
967
�511
,470
00
00
49 .�
Tota
l in
Obl
ast:
4�6
�0�,
60�
711�
5,91
498
,�5�
�51
�0�,
407
00
494
��4
4 .5
Not
e: *
u.a.
– u
rban
agg
lom
erat
e

15�
ANNExESEx
pect
ed In
vest
men
ts to
Wat
er s
uppl
y Im
prov
emen
t in
Rur
al A
reas
of A
ktob
e o
blas
t (U
nit
: Kzt
mln
)
№N
ame
of
Ray
on
Population
�005
�006
�007
Total in �005
Sour
ces
of F
inan
cing
Total in �006
Sour
ces
of F
inan
cing
Total in �007
Sour
ces
of F
inan
cing
cental state budget
local budget
legal entity
foreign grants and loans
cental state budget
local budget
legal entity
foreign grants and loans
cental gvmt state
local budget
legal entity
foreign grants and loans
1A
ktob
e (u
.a .)*
�0,5
�10
00
00
1�9 .
0070
.00
59 .0
00
010
0 .00
100 .
000
00
�A
iteke
bi�1
,615
00
00
05 .
000
5 .00
00
00
00
0
�A
lgyn
sky
��,7
�499
.7�
99 .7
�0
00
70 .0
070
.00
00
070
.00
70 .0
00
00
4B
aiga
ny�4
,097
00
00
051
.90
51 .9
00
00
00
00
0
5Ir
giz
15,5
080
00
00
�4 .8
00
�4 .8
00
0�4
0 .00
�00 .
0040
.00
00
6K
arga
ly18
,��0
00
00
070
.00
70 .0
00
00
116 .
8010
6 .80
10 .0
00
0
7K
obdy
�4,9
��11
� .78
11� .
780
00
100 .
000
100 .
000
017
� .00
017
� .00
00
8M
artu
k�0
,144
�0 .0
0�0
.00
00
011
1 .85
111 .
850
00
��� .
0018
0 .00
5� .0
00
0
9M
ugal
zhar
��,7
480
00
00
0 .00
00
00
0 .00
00
00
10Te
mir
�0,1
9�68
.00
50 .0
018
.00
00
185 .
6�18
5 .6�
00
019
5 .60
019
5 .60
00
11U
il19
,10�
00
00
00 .
000
00
00 .
000
00
0
1�K
hrom
tau
�1,�
�10
00
00
0 .00
00
00
�1 .8
00
�1 .8
00
0
1�Sh
alka
r�0
,4�7
00
00
00 .
000
00
00 .
000
00
0
Tota
l in
Obl
ast:
�0�,
60�
�11 .
51�9
� .51
18 .0
00
076
4 .48
559 .
�8�0
5 .10
00
1,16
0 .�0
656 .
8050
� .40
00
Not
e: *
u.a.
– u
rban
agg
lom
erat
e

UNDP Project National Plan for Integrated Water Resources Management and Water Efficiency in Kazakhstan
ACCEss to DRINKINg WAtER AND sANItAtIoN IN thE REPUblIC of KAzAKhstAN
154
Expe
cted
Inve
stm
ents
to W
ater
sup
ply
Impr
ovem
ent i
n R
ural
Are
as o
f Akt
obe
obl
ast (
Un
it: K
zt m
ln)
№N
ame
of
Ray
on
�008
�009
– �
010
Total in �008
Sour
ces
of F
inan
cing
Total in �009-�011
Sour
ces
of F
inan
cing
cental state budget
local budget
legal entity
foreign grants and loans
cental state budget
local budget
legal entity
foreign grants and loans
1A
ktob
e (u
.a .)*
64 .7
054
.70
010
.00
018
0,00
100,
0080
,00
-0
�A
iteke
bi�0
.00
00
�0 .0
00
�00,
0010
0,00
100,
00-
0
�A
lgyn
sky
108 .
0010
8 .00
00
015
0,00
-1�
0,00
�0,0
00
4B
aiga
ny45
.00
00
45 .0
00
�10,
001�
0,00
80,0
0-
0
5Ir
giz
�40 .
00�0
0 .00
40 .0
00
01�
0,00
-10
0,00
�0,0
00
6K
arga
ly10
.00
00
10 .0
00
1�5,
0090
,00
40,0
05,
000
7K
obdy
10 .0
00
010
.00
018
0,00
1�0,
0050
,00
-0
8M
artu
k10
.00
00
10 .0
00
110,
00-
100,
0010
,00
0
9M
ugal
zhar
50 .0
00
10 .0
040
.00
011
0,00
80,0
0�0
,00
10,0
00
10Te
mir
158 .
000
158 .
000
01�
5,00
-1�
0,00
5,00
0
11U
il16
6 .00
110 .
0056
.00
00
1�5,
00�0
,00
100,
005,
000
1�K
hrom
tau
40 .0
00
040
.00
01�
0,00
100,
0010
,00
10,0
00
1�Sh
alka
r1�
1 .00
01�
1 .00
00
175,
0050
,00
1�0,
005,
000
F/S
00
-0
Tota
l in
Obl
ast:
1,06
� .70
47� .
70�9
5 .00
195 .
000
1,95
0,00
810,
001,
040,
0010
0,00
0
Not
e: *
u.a.
– u
rban
agg
lom
erat
e

155
ANNExES
Acc
ess
to D
rin
kin
g W
ater
in z
ham
byl o
blas
t: P
rese
nt a
nd
futu
re C
ondi
tion
s
№N
ame
of
Ray
on
Pop
ulat
ion
as o
f 1 .
01 .�
004
(ps .
)
Pop
ulat
ion
with
ac
cess
to
drin
king
w
ater
as
of
1 .01
.�00
5 (p
s .)
Acc
ess
of p
opul
atio
n to
dri
nkin
g w
ater
(in
% o
f tot
al p
opul
atio
n)
as o
f 1 .
01 .�
005
incr
emen
t fo
r �0
05
(ps .
)
as o
f 1 .
01 .�
006
incr
emen
t fo
r �0
06
(ps .
)
as o
f 1 .
01 .�
007
incr
emen
t fo
r �0
07
(ps .
)
as o
f 1 .
01 .�
008
incr
emen
t fo
r �0
08
(ps .
)
as o
f 1 .
01 .�
009
incr
emen
t fo
r �0
09
(ps .
)
as o
f 1 .
01 .�
010
incr
emen
t fo
r �0
10
(ps .
)
as o
f 1 .
01 .�
011
1B
aiza
k7�
,�78
14,8
94�0
.�50
0�1
.0�,
601
�5 .9
5,09
���
.87,
961
4� .7
6,89
05�
.11�
,000
69 .4
�Zh
amby
l *7�
,481
17,�
860 .
0�,
779
�7 .�
600
�8 .1
6,81
0�7
.48,
979
49 .6
4,50
055
.71�
,000
7� .4
�Zh
ualy
n50
,��8
11,0
81��
.1-
�� .1
1,85
6�5
.85,
614
�6 .9
7,47
�51
.84,
47�
60 .7
6,17
�7�
.0
4K
orda
i10
1,89
�5�
,0�9
51 .1
-51
.1�,
8�4
54 .8
5,�1
860
.07,
9�8
67 .8
6,9�
874
.69,
9�8
84 .4
5Tu
rar
Rys
kulo
v51
,�56
�7,�
415�
.�1,
�94
56 .0
�,45
060
.7�,
461
65 .5
�,94
871
.��,
948
77 .0
4,94
886
.6
6M
erke
66,7
�4�4
,571
51 .8
-51
.8�,
545
55 .6
1,75
558
.�5,
185
66 .0
4,18
57�
.�7,
185
8� .1
7M
oiyn
kum
�5,1
�78,
7�8
�4 .7
1,5�
�40
.81,
�41
46 .�
1,55
15�
.��,
4�6
6� .0
1,�5
067
.4�,
010
75 .4
8Sa
rysu
�1,�
89�,
�68
11 .1
1,�0
916
.8�,
�0�
�7 .6
�,00
941
.7�,
0�7
56 .0
1,�0
061
.61,
750
69 .8
9Ta
las
��,8
191,
490
6 .5
1,8�
914
.61,
900
�� .9
�,4�
���
.61,
941
4� .1
1,75
049
.8�,
500
60 .7
10Sh
u56
,649
6,46
�11
.41,
9�4
14 .8
�,69
��1
.�5,
�81
�0 .8
9,14
947
.0�,
500
51 .4
5,65
061
.4
Tota
l in
Obl
ast
54�,
954
176,
�50
�� .5
11,1
77�4
.5�4
,11�
�9 .0
�9,4
�546
.�57
,0�7
56 .7
�6,7
�46�
.565
,144
75 .5
Not
e: *
u.a.
– u
rban
agg
lom
erat
e

UNDP Project National Plan for Integrated Water Resources Management and Water Efficiency in Kazakhstan
ACCEss to DRINKINg WAtER AND sANItAtIoN IN thE REPUblIC of KAzAKhstAN
156
Pre
sen
t sit
uati
on w
ith
Rur
al W
ater
sup
ply
in z
ham
byl o
blas
t
№ .
Nam
e of
R
ayon
Num
ber
of
Sett
lem
ents
(it
ems)
Pop
ulat
ion
(ps .
)
Ava
ilabi
lity
of W
ater
Sup
ply
from
:
cent
raliz
ed w
ater
sup
ply
syst
emlo
cal w
ater
sou
rces
deliv
erad
wat
ergr
ound
wat
ersu
rfac
e w
ater
Num
ber
of
Sett
lem
ents
Pop
ulat
ion
Leng
th
of W
ater
P
ipe
Net
wor
k (k
m)
%N
umbe
r of
Se
ttle
men
tsP
opul
atio
n%
Num
ber
of
Sett
lem
ents
Pop
ulat
ion
%N
umbe
r of
Se
ttle
men
tsP
opul
atio
n%
1B
aiza
k4�
7�,�
784
14,8
9440
.86
�0 .�
0�8
58,4
8479
.70
00
00
-0
�Zh
amby
l *46
7�,4
8114
17,�
8665
.15
�� .5
���
56,1
9576
.48
00
00
-0
�Zh
ualy
n5�
50,�
�814
11,0
8170
.�4
�� .0
6�8
�9,1
4777
.94
00
00
-0
4K
orda
i40
101,
89�
�15�
,0�9
4�0 .
951
.06
1949
,864
48 .9
40
00
0-
0
5Tu
rar
Rys
kulo
v4�
51,�
56�1
�7,�
41�1
1 .8
5� .�
4�1
�4,0
1546
.76
00
00
-0
6M
erke
4�66
,7�4
19�4
,571
169 .
4751
.80
���1
,740
47 .5
61
4�4
0 .6
0-
0
7M
oiyn
kum
���5
,1�7
�8,
7�8
76 .5
�4 .7
�16
14,6
��58
.�0
00
05
1,77
67 .
06
8Sa
rysu
�5�1
,�89
4�,
�68
�511
.1�
�018
,7�1
87 .9
40
00
1�0
00 .
94
9Ta
las
����
,819
11,
490
18 .�
6 .5�
�1�1
,��9
9� .4
70
00
0-
0
10Sh
u��
56,6
499
6,46
�54
.�11
.41
�450
,187
88 .5
90
00
-0
Tota
l in
Obl
ast
�67
54�,
954
109
176,
�50
1,17
� .4�
�� .4
6�5
1�6
4,�0
567
.10
14�
40 .
086
1,97
60 .
�6
Not
e: *
u.a.
– u
rban
agg
lom
erat
e

157
ANNExES
Expe
cted
Inve
stm
ents
to W
ater
sup
ply
Impr
ovem
ent i
n R
ural
Are
as o
f zha
mby
l obl
ast (
Un
it: K
zt m
ln)
№N
ame
of
Ray
on
�005
�006
�007
�008
�009
-�01
0
Total in �005
Sour
ces
of F
inan
cing
Total in �006
Sour
ces
of F
inan
cing
Total in �007
Sour
ces
of F
inan
cing
Total in �008
Sour
ces
of F
inan
cing
Total in �009-�011
Sour
ces
of F
inan
cing
cental state budget
local budget
legal entity
foreign grants and loans
cental state budget
local budget
legal entity
foreign grants and loans
cental state budget
local budget
legal entity
foreign grants and loans
cental state budget
local budget
legal entity
foreign grants and loans
cental state budget
local budget
legal entity
foreign grants and loans
1B
aiza
k55
550
00
�60 .
0�9
�56 .
981
� .05
80
068
.65�
068
.65�
00
116 .
�85
54 .�
�66�
.149
00
�50
180
170
�Zh
amby
l *51
.8�9
051
.8�9
00
4 .56
80
4 .56
80
0��
9 .78
157 .
157�
.6�
00
�14 .
9�1
�09 .
909
105 .
0��
00
�55
1�5
1�0
�Zh
ualy
n0
00
00
550
550
090
090
00
107 .
�84
010
7 .�8
40
041
018
0��
0
4K
orda
i0
00
00
101 .
175
010
1 .17
50
01�
� .88
�0
1�� .
88�
00
�08 .
677
71 .7
�81�
6 .9�
90
047
5��
5�5
0
5Tu
rar
Rys
kulo
v5�
.5�7
05�
.5�7
00
59 .�
450
59 .�
450
0�4
� .17
�17
6 .19
166
.981
00
1�5 .
194
�7 .9
�787
.�57
00
��0
1�0
110
6M
erke
00
00
098
.49
098
.49
00
89 .9
1�0
89 .9
1�0
015
4 .7�
�64
.�19
90 .4
0�0
0�7
018
019
0
7M
oiyn
kum
68 .6
10
68 .6
10
0�7
.7�4
0�7
.7�4
00
175 .
9��
1�9 .
�99
�6 .6
�40
011
5 .88
8� .1
47��
.7��
00
8545
40
8Sa
rysu
64 .4
650
64 .4
650
061
.051
�5 .0
�1�6
.0�
00
79 .5
1859
.��8
�0 .�
90
07�
.�08
�8 .�
68��
.94
00
1�5
7560
9Ta
las
�17 .
6818
� .45
��5
.��8
00
1�9 .
508
1�� .
4�6
6 .07
�0
01�
7 .95
458
.0�
79 .9
�40
01�
7 .64
��5
.�58
11� .
�84
00
7545
�0
10Sh
u4�
.��
04�
.��
00
1�7 .
�79
6� .1
5965
.��
00
1�5 .
5��
46 .5
5878
.974
00
��5 .
�47
74 .7
68�5
0 .47
90
0�1
510
511
0
Tota
l in
Obl
ast
55� .
��1
��7 .
45�
�15 .
879
00
9�4 .
189
477 .
597
446 .
59�
00
1�64
6�6 .
456
7�7 .
870
01,
678 .
�765
9 .68
1,01
8 .59
00
�,60
01,
�90
1,�1
0
Not
e: *
u.a.
– u
rban
agg
lom
erat
e

UNDP Project National Plan for Integrated Water Resources Management and Water Efficiency in Kazakhstan
ACCEss to DRINKINg WAtER AND sANItAtIoN IN thE REPUblIC of KAzAKhstAN
158
Acc
ess
to D
rin
kin
g W
ater
in K
arag
anda
obl
ast:
Pre
sen
t an
d fu
ture
Con
diti
ons
№N
ame
of R
ayon
Pop
ulat
ion
as o
f 1 .
01 .�
004
(ps .
)
Pop
ulat
ion
with
acc
ess
to d
rink
ing
wat
er a
s of
1 .
01 .�
005
(ps .
)
Acc
ess
of p
opul
atio
n to
dri
nkin
g w
ater
(in
% o
f tot
al p
opul
atio
n)
as of 1 .01 .�005
increment for �005
(ps .)
as of 1 .01 .�006
increment for �006
(ps .)
as of 1 .01 .�007
increment for �007
(ps .)
as of 1 .01 .�008
increment for �008
(ps .)
as of 1 .01 .�009
increment for �009
(ps .)
as of 1 .01 .�010
increment for �010
(ps .)
as of 1 .01 .�011
1K
arag
anda
(u .a
.)*16
0-
0-
0-
0-
016
010
0 .0
-10
0 .0
-10
0 .0
�Zh
ezka
zgan
(u .a
.)*4,
80�
�,�9
747
.8�0
054
.1�0
058
.�10
060
.���
565
.�50
075
.680
09�
.�
�Sa
tpae
v (u
.a .)*
�7�
�7�
100 .
0-
100 .
0-
100 .
0-
100 .
0-
100 .
0-
100 .
0-
100 .
0
4A
bai
14,4
486,
7�8
46 .6
500
50 .1
1,��
459
.�-
59 .�
-59
.�1,
�00
68 .�
1500
78 .7
5A
ktog
ai14
,740
4,��
5�9
.41,
000
�6 .�
1,46
�46
.11,
000
5� .9
-5�
.91,
500
6� .1
1�00
71 .�
6B
ukha
r Zh
yrau
49,7
96�4
,519
49 .�
1,50
05�
.�1,
840
55 .9
4,98
�66
.0�,
591
71 .�
-71
.�-
71 .�
7Zh
anaa
rka
14,�
�5-
0�,
018
14 .1
1,00
0�1
.1-
�1 .1
-�1
.1�,
000
�5 .0
�000
55 .9
8K
arka
raly
�4,7
704,
916
14 .1
1,�1
�17
.667
019
.6�,
17�
�5 .8
1,50
0�0
.1�,
000
�8 .7
6000
56 .0
9N
ura
�6,6
451�
,���
45 .9
�,00
05�
.4�4
�066
.�1,
�69
71 .1
�,69
�81
.�-
81 .�
-81
.�
10O
saka
rovs
ky�5
,�46
17,0
��67
.41,
101
71 .8
990
75 .7
66�
78 .�
�,00
090
.�-
90 .�
-90
.�
11U
lyta
u11
,1�8
5,50
149
.450
05�
.9�0
056
.654
561
.5-
61 .5
1,00
070
.41�
0081
.�
1�Sh
etsk
y�5
,548
1�,8
4554
.�90
157
.719
�565
.�1,
59�
71 .5
1,07
975
.71,
500
81 .6
�000
89 .4
Tota
l in
Obl
ast
��1,
901
91,6
7841
.�11
,0��
46 .�
1�,1
615�
.�1�
,���
57 .8
11,�
576�
.810
,800
67 .7
1570
074
.8
Not
e: *
u.a.
– u
rban
agg
lom
erat
e

159
ANNExES
Pre
sen
t sit
uati
on w
ith
Rur
al W
ater
sup
ply
in K
arag
anda
obl
ast
№N
ame
of R
ayon
Num
ber
of
Sett
lem
ents
(it
ems)
Pop
ulat
ion
(ps .
)
Ava
ilabi
lity
of W
ater
Sup
ply
from
:
cent
raliz
ed w
ater
sup
ply
syst
emlo
cal w
ater
sou
rces
deliv
erad
wat
er
Wat
er
Tari
ff .
KZT
/m�
grou
nd w
ater
surf
ace
wat
er
Num
ber
of
sett
lem
ents
Pop
ulat
ion
%Le
ngth
of
wat
er p
ipe
netw
ork .
km
Num
ber
of
sett
lem
ents
Pop
ulat
ion
Num
ber
of
sett
lem
ents
Pop
ulat
ion
Num
ber
of
sett
lem
ents
Pop
ulat
ion
1K
arag
anda
(u .a
.)*1
160
0-
0-
116
00
00
-up
to 7
5
�Zh
ezka
zgan
(u .a
.)*18
4,80
��
�,�9
747
.8-
16�,
506
00
0-
up to
75
�Sa
tpae
v (u
.a .)*
1�7
�1
�7�
100 .
0-
0-
00
0-
up to
75
4A
bai
�914
,448
1�6,
7�8
46 .6
40 .9
1�6
7,71
00
00
-up
to 7
5
5A
ktog
ai44
14,7
404
4,��
5�9
.4�8
,764
.00
4010
,405
00
0-
6B
ukha
r Zh
yrau
7449
,796
�4�4
,519
49 .�
�81 .
0046
�4,6
610
04
616
up to
75
7Zh
anaa
rka
4�14
,��5
0-
0-
4�14
,��5
00
0-
up to
75
8K
arka
raly
71�4
,770
�4,
916
14 .1
�8,7
8� .0
069
�9,8
540
00
-up
to 7
5
9N
ura
50�6
,645
181�
,���
45 .9
1�5 .
00�9
1�,5
840
0�
1,8�
8up
to 7
5
10O
saka
rovs
ky55
�5,�
46�5
17,0
��67
.4�6
0 .00
146,
67�
00
61,
551
up to
75
11U
lyta
u41
11,1
�87
5,50
149
.490
.00
��5,
09�
00
154
5up
to 7
5
1�Sh
etsk
y59
�5,5
4817
1�,8
4554
.�9�
.00
4�11
,70�
00
0-
up to
75
Tota
l in
Obl
ast:
496
��1,
901
1��
91,6
7841
.�78
,405
.00
�59
1�5,
68�
00
144,
540
Not
e: *
u.a.
- urb
an a
gglo
mer
ate
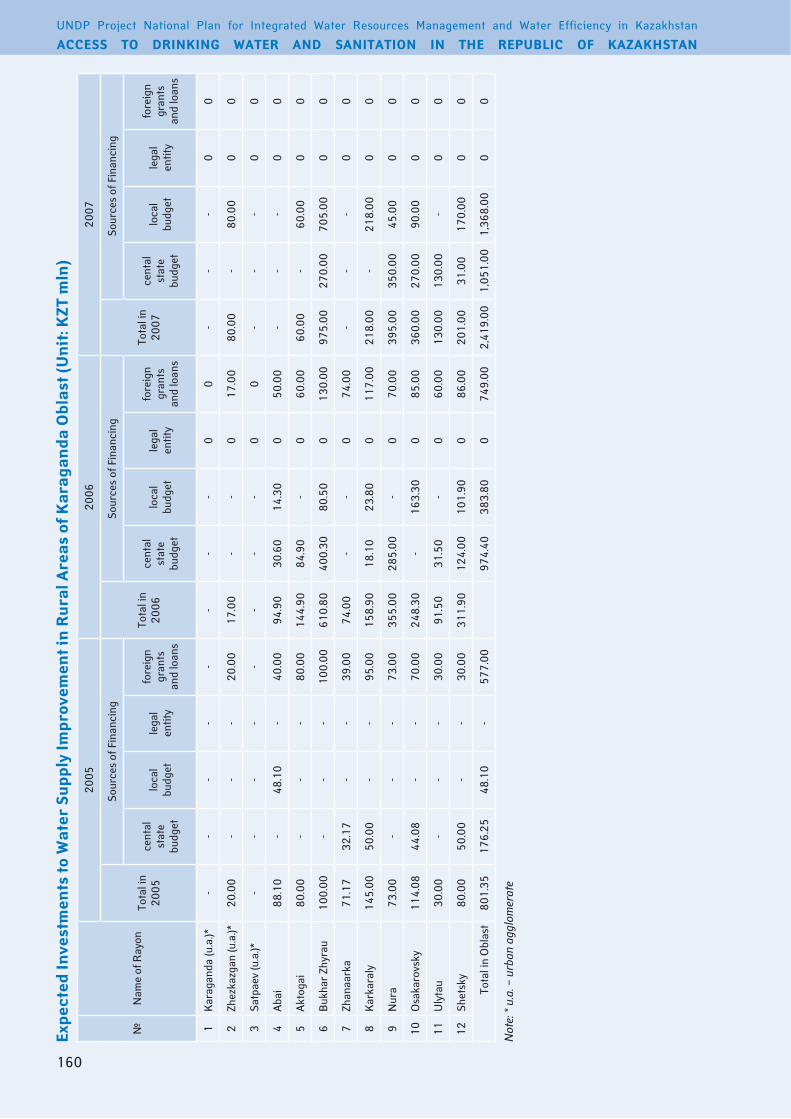
UNDP Project National Plan for Integrated Water Resources Management and Water Efficiency in Kazakhstan
ACCEss to DRINKINg WAtER AND sANItAtIoN IN thE REPUblIC of KAzAKhstAN
160
Expe
cted
Inve
stm
ents
to W
ater
sup
ply
Impr
ovem
ent i
n R
ural
Are
as o
f Kar
agan
da o
blas
t (U
nit
: Kzt
mln
)
№N
ame
of R
ayon
�005
�006
�007
Tota
l in
�005
Sour
ces
of F
inan
cing
Tota
l in
�006
Sour
ces
of F
inan
cing
Tota
l in
�007
Sour
ces
of F
inan
cing
cent
al
stat
e bu
dget
loca
l bu
dget
le
gal
entit
y
fore
ign
gran
ts
and
loan
s
cent
al
stat
e bu
dget
loca
l bu
dget
le
gal
entit
y
fore
ign
gran
ts
and
loan
s
cent
al
stat
e bu
dget
loca
l bu
dget
le
gal
entit
y
fore
ign
gran
ts
and
loan
s
1K
arag
anda
(u .a
.)*-
--
--
--
-0
0-
--
00
�Zh
ezka
zgan
(u .a
.)*�0
.00
--
-�0
.00
17 .0
0-
-0
17 .0
080
.00
-80
.00
00
�Sa
tpae
v (u
.a .)*
--
--
--
--
00
--
-0
0
4A
bai
88 .1
0-
48 .1
0-
40 .0
094
.90
�0 .6
014
.�0
050
.00
--
-0
0
5A
ktog
ai80
.00
--
-80
.00
144 .
9084
.90
-0
60 .0
060
.00
-60
.00
00
6B
ukha
r Zh
yrau
100 .
00-
--
100 .
0061
0 .80
400 .
�080
.50
01�
0 .00
975 .
00�7
0 .00
705 .
000
0
7Zh
anaa
rka
71 .1
7��
.17
--
�9 .0
074
.00
--
074
.00
--
-0
0
8K
arka
raly
145 .
0050
.00
--
95 .0
015
8 .90
18 .1
0��
.80
011
7 .00
�18 .
00-
�18 .
000
0
9N
ura
7� .0
0-
--
7� .0
0�5
5 .00
�85 .
00-
070
.00
�95 .
00�5
0 .00
45 .0
00
0
10O
saka
rovs
ky11
4 .08
44 .0
8-
-70
.00
�48 .
�0-
16� .
�00
85 .0
0�6
0 .00
�70 .
0090
.00
00
11U
lyta
u�0
.00
--
-�0
.00
91 .5
0�1
.50
-0
60 .0
01�
0 .00
1�0 .
00-
00
1�Sh
etsk
y80
.00
50 .0
0-
-�0
.00
�11 .
901�
4 .00
101 .
900
86 .0
0�0
1 .00
�1 .0
017
0 .00
00
Tota
l in
Obl
ast
801 .
�517
6 .�5
48 .1
0-
577 .
0097
4 .40
�8� .
800
749 .
00�,
419 .
001,
051 .
001,
�68 .
000
0
Not
e: *
u.a.
– u
rban
agg
lom
erat
e

161
ANNExES
Expe
cted
Inve
stm
ents
to W
ater
sup
ply
Impr
ovem
ent i
n R
ural
Are
as o
f Kar
agan
da o
blas
t (U
nit
: Kzt
mln
)
№N
ame
of R
ayon
�008
�009
-�01
0
Tota
l in
�008
Sour
ces
of F
inan
cing
Tota
l in
�00
9-�0
11
Sour
ces
of F
inan
cing
cent
al
stat
e bu
dget
loca
l bu
dget
le
gal
entit
y
fore
ign
gran
ts
and
loan
s
cent
al
stat
e bu
dget
loca
l bu
dget
le
gal
entit
y
fore
ign
gran
ts
and
loan
s
1K
arag
anda
(u .a
.)*5 .
00-
5 .00
00
--
--
0
�Zh
ezka
zgan
(u .a
.)*80
.00
-80
.00
00
�5 .0
0-
�0 .0
05 .
000
�Sa
tpae
v (u
.a .)*
--
-0
0-
--
-0
4A
bai
--
-0
0�9
0 .00
1�0 .
001�
0 .00
40 .0
00
5A
ktog
ai-
--
00
��0 .
0011
0 .00
100 .
00�0
.00
0
6B
ukha
r Zh
yrau
415 .
0040
.00
�75 .
000
0-
--
-0
7Zh
anaa
rka
--
-0
0��
0 .00
160 .
001�
0 .00
40 .0
00
8K
arka
raly
446 .
00-
446 .
000
0�4
0 .00
1�0 .
0010
0 .00
10 .0
00
9N
ura
60� .
00�5
0 .00
�5� .
000
0-
--
-0
10O
saka
rovs
ky49
0 .00
180 .
00�1
0 .00
00
--
--
0
11U
lyta
u-
--
00
1�0 .
0060
.00
50 .0
010
.00
0
1�Sh
etsk
y50
.00
-50
.00
00
��5 .
0010
5 .00
90 .0
0�0
.00
0
Tota
l in
Obl
ast
�,08
9 .00
470 .
001,
619 .
000
01,
460 .
0069
5 .00
610 .
0015
5 .00
0
Not
e: *
u.a.
– u
rban
agg
lom
erat
e

UNDP Project National Plan for Integrated Water Resources Management and Water Efficiency in Kazakhstan
ACCEss to DRINKINg WAtER AND sANItAtIoN IN thE REPUblIC of KAzAKhstAN
16�
Acc
ess
to D
rin
kin
g W
ater
in K
osta
nai
obl
ast:
Pre
sen
t an
d fu
ture
Con
diti
ons
№N
ame
of R
ayon
Pop
ulat
ion
as o
f 1 .
01 .�
004
(ps .
)
Pop
ulat
ion
with
acc
ess
to d
rink
ing
wat
er a
s of
1 .
01 .�
005
(ps .
)
Acc
ess
of p
opul
atio
n to
dri
nkin
g w
ater
(in
% o
f tot
al p
opul
atio
n)
as o
f 1 .
01 .�
005
incr
emen
t fo
r �0
05
(ps .
)
as o
f 1 .
01 .�
006
incr
emen
t fo
r �0
06
(ps .
)
as o
f 1 .
01 .�
007
incr
emen
t fo
r �0
07(p
s .)
as o
f 1 .
01 .�
008
incr
emen
t fo
r �0
08
(ps .
)
as o
f 1 .
01 .�
009
and
�010
incr
emen
t fo
r �
009
and
�010
(p
s .)
as o
f 1 .
01 .�
011
1A
ltyns
arin
17,1
765,
149
�0 .0
-�0
.0�,
00�
47 .5
-47
.51,
086
5� .8
1,70
16�
.7
�A
man
geld
y�0
,44�
6,46
4�1
.6-
�1 .6
1,10
0�7
.0-
�7 .0
-�7
.05,
647
64 .6
�A
ulie
kol
�6,1
4816
,859
46 .6
-46
.696
�49
.��,
�75
55 .6
-55
.64,
15�
67 .1
4D
enis
ovsk
y�5
,008
14,6
6658
.6-
58 .6
�,57
168
.91,
495
74 .9
1,49
480
.96�
48�
.4
5D
zhan
geld
y18
,�8�
�,69
8�0
.1-
�0 .1
�,57
0�4
.1�,
�60
46 .4
-46
.4�,
558
60 .�
6Zh
etik
ar16
,465
11,5
�570
.176
074
.790
080
.150
08�
.��0
085
.045
087
.7
7K
amys
18,7
486,
064
�� .�
-��
.�1,
511
40 .4
�,76
460
.5-
60 .5
1,10
066
.�
8K
arab
alyk
�9,�
0��,
004
10 .�
-10
.�-
10 .�
-10
.�-
10 .�
10,4
0045
.9
9K
aras
u��
,68�
19,5
6759
.9-
59 .9
815
6� .4
1,�5
566
.��,
�06
7� .�
�,00
08�
.4
10K
osta
nai
45,7
574,
8�7
10 .6
-10
.65,
775
�� .�
�,77
1�1
.44,
95�
4� .�
7,74
�59
.�
11M
endy
kar
�7,7
0�1,
055
� .8
-� .
81,
948
10 .8
-10
.8-
10 .8
10,�
4848
.�
1�N
aurz
um15
,�19
-0 .
0-
0 .0
-0 .
0-
0 .0
-0 .
07,
700
50 .6
1�Sa
ryko
l19
,16�
7,00
1�6
.5-
�6 .5
-�6
.580
140
.71,
500
48 .5
�,45
066
.5
14Ta
rano
vsky
��,7
7510
,�1�
4� .4
-4�
.4-
4� .4
-4�
.4-
4� .4
5,9�
068
.�
15U
zunk
ol�9
,01�
�,�8
911
.�1,
700
17 .�
�,50
0�9
.�5,
�64
47 .4
-47
.46,
067
68 .�
16Fe
doro
vsky
�6,7
77�,
��9
8 .7
-8 .
7�,
494
18 .0
-18
.0-
18 .0
9,5�
55�
.6
17A
rkal
yk (u
.a .)*
14,5
98�,
858
�6 .4
965
�� .0
1,58
74�
.9�,
075
58 .1
1,47
�68
.�1,
750
80 .�
18Li
sako
vsk
(u .a
.)*1,
1�6
-0 .
0-
0 .0
-0 .
0-
0 .0
-0 .
089
078
.�
19R
udny
(u .a
.)*7�
�7�
�10
0 .0
-10
0 .0
-10
0 .0
-10
0 .0
-10
0 .0
-10
0 .0
Tota
l in
Obl
ast
418,
1�9
1�0,
4��
�8 .8
�,4�
5�9
.6�8
,7�6
�6 .5
��,4
604�
.11�
,110
45 .�
8�,0
4665
.1
Not
e: *
u.a.
– u
rban
agg
lom
erat
e

16�
ANNExES
Pre
sen
t sit
uati
on w
ith
Rur
al W
ater
sup
ply
in K
osta
nai
obl
ast
№N
ame
of R
ayon
Number of Settlements (items)
Pop
ulat
ion
(ps .
)
Ava
ilabi
lity
of W
ater
Sup
ply
from
:
cent
raliz
ed w
ater
sup
ply
syst
emlo
cal w
ater
sou
rces
deliv
ered
wat
ergr
ound
wat
ersu
rfac
e w
ater
Num
ber
of
Sett
lem
ents
Pop
ulat
ion
Leng
th o
f W
ater
Pip
e N
etw
ork
(km
)%
Num
ber
of
Sett
lem
ents
Pop
ulat
ion
%N
umbe
r of
Se
ttle
men
tsP
opul
atio
n%
Num
ber
of
Sett
lem
ents
Pop
ulat
ion
%
1A
ltyns
arin
�717
,176
85,
149
1� .5
�0 .0
�11�
,0�7
70 .0
0-
00
-0 .
0
�A
man
geld
y46
�0,4
4�8
6,46
459
.4�1
.6�0
11,8
8058
.14
1,47
77 .
�14
6�1
� .0
�A
ulie
kol
45�6
,148
916
,859
��4 .
�46
.6�6
19,�
895�
.40
-0
0-
0 .0
4D
enis
ovsk
y45
�5,0
0817
14,6
66�1
8 .8
58 .6
�810
,�4�
41 .4
0-
00
-0 .
0
5D
zhan
geld
y�5
18,�
8�1
�,69
8�0
�0 .1
75,
0�7
�7 .4
�58,
179
44 .5
�1,
468
8 .0
6Zh
etik
ar��
16,4
651�
11,5
�5�0
570
.18
4,0�
4�4
.50
-0
�89
65 .
4
7K
amys
��18
,748
�6,
064
50��
.��8
1�,6
�967
.40
-0
�44
0 .�
8K
arab
alyk
59�9
,�0�
6�,
004
�7 .�
710
.�50
�6,0
1789
.10
-0
�18
�0 .
6
9K
aras
u57
��,6
8��0
19,5
67�8
�59
.917
6,7�
0�0
.60
-0
�06,
�87
19 .5
10K
osta
nai
6045
,757
�4,
8�7
55 .1
10 .6
5��7
,�6�
81 .4
0-
04
�,65
78 .
0
11M
endy
kar
58�7
,70�
11,
055
� .5
� .8
56�5
,�01
91 .�
0-
01
1,�4
64 .
9
1�N
aurz
um�5
15,�
190
-0
0 .0
��1�
,�48
87 .0
0-
0�
1,97
11�
.0
1�Sa
ryko
l41
19,1
6�7
7,00
114
� .�
�6 .5
�87,
914
41 .�
0-
06
4,�4
8��
.�
14Ta
rano
vsky
5���
,775
1�10
,�1�
116 .
44�
.4�9
1�,4
6�56
.60
-0
0-
0 .0
15U
zunk
ol56
�9,0
1��
�,�8
9�4
.511
.�50
�1,0
097�
.40
-0
44,
715
16 .�
16Fe
doro
vsky
70�6
,777
��,
��9
158 .
758
�0,7
�177
.40
-0
10�,
717
1� .9
17A
rkal
yk (u
.a .)*
1714
,598
4�,
858
�5 .5
�6 .4
87,
560
51 .8
�75
45 .
��
�,4�
716
.6
18Li
sako
vsk
(u .a
.)*�
1,1�
60
-0
0 .0
�1,
1�6
100 .
00
-0
0-
0 .0
19R
udny
(u .a
.)*1
7��
17�
�10
100 .
00
-0 .
00
-0
0-
0 .0
Tota
l in
Obl
ast:
750
418,
1�9
116
1�0,
4��
1,61
1 .5
�8 .8
5��
�55,
617
61 .1
�110
,410
� .5
7��1
,680
7 .6
Not
e: *
u.a.
- urb
an a
gglo
mer
ate

UNDP Project National Plan for Integrated Water Resources Management and Water Efficiency in Kazakhstan
ACCEss to DRINKINg WAtER AND sANItAtIoN IN thE REPUblIC of KAzAKhstAN
164
Expe
cted
Inve
stm
ents
to W
ater
sup
ply
Impr
ovem
ent i
n R
ural
Are
as o
f Kos
tan
ai o
blas
t (U
nit
: Kzt
mln
)
№N
ame
of R
ayon
�005
�006
�007
Tota
l in
�005
Sour
ces
of F
inan
cing
Tota
l in
�006
Sour
ces
of F
inan
cing
Tota
l in
�007
Sour
ces
of F
inan
cing
cent
al
stat
e bu
dget
loca
l bu
dget
le
gal
entit
y
fore
ign
gran
ts
and
loan
s
cent
al
stat
e bu
dget
loca
l bu
dget
le
gal
entit
y
fore
ign
gran
ts
and
loan
s
cent
al
stat
e bu
dget
loca
l bu
dget
le
gal
entit
y
fore
ign
gran
ts
and
loan
s
1A
ltyns
arin
00
48 .7
980
48 .7
980
00
�A
man
geld
y0
01 .
690
1 .69
00
0
�A
ulie
kol
00
5� .7
960
5� .7
96�9
.819
0�9
.819
4D
enis
ovsk
y0
0�9
.79
�6 .�
9� .
580
080
5D
zhan
geld
y0
095
.409
94 .4
��0 .
977
6060
0
6Zh
etik
ar18
018
0��
5 .80
1�7
5 .80
150
500
50
7K
amys
00
�� .6
0��
.61�
7 .1
01�
7 .1
8K
arab
alyk
00
00
00
00
9K
aras
u0
061
.�66
061
.�66
�67 .
55�5
017
.55
10K
osta
nai
00
�10 .
�11
148 .
8��
61 .�
8886
.55
086
.55
11M
endy
kar
00
�0 .7
640
�0 .7
640
00
1�N
aurz
um0
00
00
00
0
1�Sa
ryko
l0
00 .
50
0 .5
��4 .
5�0
0�4
.5
14Ta
rano
vsky
00
00
00
00
15U
zunk
ol50
50�4
��0
04�
�4� .
697
�7� .
697
70
16Fe
doro
vsky
00
0 .80
40
0 .80
40
00
17A
rkal
yk (u
.a .)*
150
150
464 .
��6
454
10 .�
�6�8
8 .78
�80
8 .78
18Li
sako
vsk
(u .a
.)*0
00
00
00
0
19R
udny
(u .a
.)*0
00
00
00
0
Tota
l in
Obl
ast:
�80
�80
00
01,
587 .
761,
�09 .
�46
�78 .
409
00
1,66
7 .99
61,
16� .
697
504 .
�99
00
Not
e: *
u.a.
– u
rban
agg
lom
erat
e

165
ANNExES
Expe
cted
Inve
stm
ents
to W
ater
sup
ply
Impr
ovem
ent i
n R
ural
Are
as o
f Kos
tan
ai o
blas
t (U
nit
: Kzt
mln
)
№N
ame
of R
ayon
�008
�009
-�01
0
Tota
l in
�008
Sour
ces
of F
inan
cing
Tota
l in
�00
9-�0
11
Sour
ces
of F
inan
cing
cent
al
stat
e bu
dget
loca
l bu
dget
le
gal
entit
y
fore
ign
gran
ts
and
loan
s
cent
al
stat
e bu
dget
loca
l bu
dget
le
gal
entit
y
fore
ign
gran
ts
and
loan
s
1A
ltyns
arin
�8�8
050
050
�A
man
geld
y0
00
100
080
�0
�A
ulie
kol
00
050
050
4D
enis
ovsk
y7�
.404
07�
.404
�00
�0
5D
zhan
geld
y0
00
400
40
6Zh
etik
ar60
060
1�� .
840 .
001�
� .84
7K
amys
00
0�0
0�0
8K
arab
alyk
00
0�0
00
1�0
70
9K
aras
u56
441
514
959
757
7�0
10K
osta
nai
11�
�885
80 .5
060
.5�0
11M
endy
kar
00
0�6
00
180
80
1�N
aurz
um0
00
180
8070
�0
1�Sa
ryko
l�5
0�5
00
817
787
�0
14Ta
rano
vsky
00
090
090
15U
zunk
ol0
00
1�0
01�
0
16Fe
doro
vsky
00
015
00
1�0
�0
17A
rkal
yk (u
.a .)*
�08 .
14�0
08 .
14�0
0�0
18Li
sako
vsk
(u .a
.)*0
00
�00
�0
19R
udny
(u .a
.)*0
00
00
0
Tota
l in
Obl
ast:
1,�9
5 .54
410
�1�7
4 .54
40
0�,
967 .
�44
1444
1,�8
� .�4
�40
0
Not
e: *
u.a.
– u
rban
agg
lom
erat
e

UNDP Project National Plan for Integrated Water Resources Management and Water Efficiency in Kazakhstan
ACCEss to DRINKINg WAtER AND sANItAtIoN IN thE REPUblIC of KAzAKhstAN
166
Pre
sen
t sit
uati
on w
ith
Rur
al W
ater
sup
ply
in M
angi
stau
obl
ast
№N
ame
of R
ayon
Number of Settlements (items)
Population (ps .)
Ava
ilabi
lity
of W
ater
Sup
ply
from
:
cent
raliz
ed w
ater
sup
ply
syst
emlo
cal w
ater
sou
rces
deliv
ered
wat
ergr
ound
wat
ersu
rfac
e w
ater
Num
ber
of
Sett
lem
ents
Pop
ulat
ion
Leng
th o
f W
ater
Pip
e N
etw
ork
(km
)%
Num
ber
of
Sett
lem
ents
Pop
ulat
ion
%N
umbe
r of
Se
ttle
men
tsP
opul
atio
n%
Num
ber
of
Sett
lem
ents
Pop
ulat
ion
%
1A
ktau
(u .a
.)*1
5�9
15�
90 .
010
0 .0
0-
0 .0
00
0 .00
0-
0 .0
�Zh
anao
zen
(u .a
.)*1
�,8�
41
�,06
70 .
080
.00
-0 .
00
00 .
0076
7�0
.0
�B
eine
u10
��,�
095
17,1
65�7
.�5�
.15
15,1
4446
.90
00 .
000
-0 .
0
4K
arak
iyan
811
,494
1�,
015
0 .0
17 .5
�6,
465
56 .�
00
0 .00
4�,
014
�6 .�
5M
angi
stau
�0�8
,46�
45,
900
1� .0
�0 .7
1�18
,986
66 .7
00
0 .00
4�,
576
1� .6
6Tu
pkar
agan
47,
�69
1�,
�57
� .0
�1 .0
�5,
01�
69 .0
00
0 .00
0-
0 .0
Tota
l in
Obl
ast:
448�
,907
1��0
,94�
4� .�
�6 .9
��45
,607
54 .4
00
0 .00
87,
�57
8 .8
Not
e: *
u.a.
– u
rban
agg
lom
erat
e
Acc
ess
to D
rin
kin
g W
ater
in M
angi
stau
obl
ast:
Pre
sen
t an
d fu
ture
Con
diti
ons
№N
ame
of R
ayon
Pop
ulat
ion
as o
f 1 .
01 .�
004
(ps .
)
Pop
ulat
ion
with
acc
ess
to d
rink
ing
wat
er a
s of
1 .
01 .�
005
(ps .
)
Acc
ess
of p
opul
atio
n to
dri
nkin
g w
ater
(in
% o
f tot
al p
opul
atio
n)
as o
f 1 .
01 .�
005
incr
emen
t fo
r �0
05
(ps .
)
as o
f 1 .
01 .�
006
incr
emen
t fo
r �0
06
(ps .
)
as o
f 1 .
01 .�
007
incr
emen
t fo
r �0
07(p
s .)
as o
f 1 .
01 .�
008
incr
emen
t fo
r �0
08
(ps .
)
as o
f 1 .
01 .�
009
and
�010
incr
emen
t fo
r �
009
and
�010
(p
s .)
as o
f 1 .
01 .�
011
1A
ktau
(u .a
.)*5�
95�
910
0 .0
-10
0 .0
-10
0 .0
-10
0 .0
-10
0 .0
-10
0 .0
�Zh
anao
zen
(u .a
.)*�,
8�4
�,06
780
.0-
80 .0
-80
.0-
80 .0
-80
.0-
80 .0
�B
eine
u��
,�09
17,1
655�
.1�,
�51
6� .5
5,�4
�79
.7�,
000
85 .9
��4
86 .6
�,08
99�
.1
4K
arak
iyan
11,4
94�,
015
17 .5
874
�5 .1
�,94
759
.566
565
.�1,
500
78 .�
1,��
689
.8
5M
angi
stau
�8,4
6�5,
900
�0 .7
�,4�
9�9
.��,
8�5
4� .7
5,80
�6�
.15,
8�0
8� .6
149
84 .1
6Tu
pkar
agan
7,�6
9�,
�57
�1 .0
1,57
85�
.8-
5� .8
565
60 .5
�,51
595
.1-
95 .1
Tota
l in
Obl
ast:
8�,9
07�0
,94�
�6 .9
8,��
�46
.71�
,014
6� .�
9,0�
�7�
.010
,079
85 .0
�,56
489
.�

167
ANNExES
Pre
sen
t sit
uati
on w
ith
Rur
al W
ater
sup
ply
in M
angi
stau
obl
ast
№N
ame
of R
ayon
Number of Settlements (items)
Population (ps .)
Ava
ilabi
lity
of W
ater
Sup
ply
from
:
cent
raliz
ed w
ater
sup
ply
syst
emlo
cal w
ater
sou
rces
deliv
ered
wat
ergr
ound
wat
ersu
rfac
e w
ater
Num
ber
of
Sett
lem
ents
Pop
ulat
ion
Leng
th o
f W
ater
Pip
e N
etw
ork
(km
)%
Num
ber
of
Sett
lem
ents
Pop
ulat
ion
%N
umbe
r of
Se
ttle
men
tsP
opul
atio
n%
Num
ber
of
Sett
lem
ents
Pop
ulat
ion
%
1A
ktau
(u .a
.)*1
5�9
15�
90 .
010
0 .0
0-
0 .0
00
0 .00
0-
0 .0
�Zh
anao
zen
(u .a
.)*1
�,8�
41
�,06
70 .
080
.00
-0 .
00
00 .
0076
7�0
.0
�B
eine
u10
��,�
095
17,1
65�7
.�5�
.15
15,1
4446
.90
00 .
000
-0 .
0
4K
arak
iyan
811
,494
1�,
015
0 .0
17 .5
�6,
465
56 .�
00
0 .00
4�,
014
�6 .�
5M
angi
stau
�0�8
,46�
45,
900
1� .0
�0 .7
1�18
,986
66 .7
00
0 .00
4�,
576
1� .6
6Tu
pkar
agan
47,
�69
1�,
�57
� .0
�1 .0
�5,
01�
69 .0
00
0 .00
0-
0 .0
Tota
l in
Obl
ast:
448�
,907
1��0
,94�
4� .�
�6 .9
��45
,607
54 .4
00
0 .00
87,
�57
8 .8
Not
e: *
u.a.
– u
rban
agg
lom
erat
e
Expe
cted
Inve
stm
ents
to W
ater
sup
ply
Impr
ovem
ent i
n R
ural
Are
as o
f Man
gist
au o
blas
t (U
nit
: Kzt
mln
)
№N
ame
of R
ayon
�005
�006
�007
Tota
l in
�005
Sour
ces
of F
inan
cing
Tota
l in
�006
Sour
ces
of F
inan
cing
Tota
l in
�007
Sour
ces
of F
inan
cing
cent
al
stat
e bu
dget
loca
l bu
dget
le
gal
entit
y
fore
ign
gran
ts
and
loan
s
cent
al
stat
e bu
dget
loca
l bu
dget
le
gal
entit
y
fore
ign
gran
ts
and
loan
s
cent
al
stat
e bu
dget
loca
l bu
dget
le
gal
entit
y
fore
ign
gran
ts
and
loan
s
1A
ktau
(u .a
.)*0 .
00 –
–
�Zh
anao
zen
(u .a
.)*
�B
eine
u8�
.�1
51 .
51
�0 .
80
1��
.50
100
.00
�� .
50
�4 .
60
�4 .
60
4K
arak
iyan
�1 .0
0 �
1 .00
5
4 .80
5
4 .80
�
.50
� .5
0
5M
angi
stau
59 .5
0 4
9 .50
1
0 .00
9
� .��
�
� .00
6
0 .��
8
0 .8�
7
� .50
7
.��
6Tu
pkar
agan
�� .5
0 �
� .50
–
1
0 .00
1
0 .00
Tot
al in
Obl
ast:
19
5 .�1
0 .00
154
.51
40 .
80
–
�70
.6�
100
.00
110
.�0
60 .
��
–
1�7
.9�
–
86 .
00
41 .
9�
–
№N
ame
of R
ayon
�008
�009
-�01
0
Gra
nd
Tota
lTo
tal i
n �0
08
Sour
ces
of F
inan
cing
Tota
l in
�00
9-�0
11
Sour
ces
of F
inan
cing
cent
al
stat
e bu
dget
loca
l bu
dget
le
gal
entit
y
fore
ign
gran
ts
and
loan
s
cent
al
stat
e bu
dget
loca
l bu
dget
le
gal
entit
y
fore
ign
gran
ts
and
loan
s
1A
ktau
(u .a
.)* –
–
–
�Zh
anao
zen
(u .a
.)* –
�B
eine
u 5
.00
5 .0
0 �
0 .00
�
0 .00
�
74 .4
1
4K
arak
iyan
�4 .
00
�4 .
00
17 .
00
17 .
00
119
.�0
5M
angi
stau
�7 .
6�
17 .
80
9 .8
� �
.50
� .5
0 �
6� .7
9
6Tu
pkar
agan
10 .
00
10 .
00
–
5� .
50
Tot
al in
Obl
ast:
6
6 .6�
–
5
6 .80
9
.8�
–
49 .
50
–
47 .
00
� .5
0 –
7
10 .0
0
Not
e: *
u.a.
– u
rban
agg
lom
erat
e

UNDP Project National Plan for Integrated Water Resources Management and Water Efficiency in Kazakhstan
ACCEss to DRINKINg WAtER AND sANItAtIoN IN thE REPUblIC of KAzAKhstAN
168
Acc
ess
to D
rin
kin
g W
ater
in P
avlo
dar
obl
ast:
Pre
sen
t an
d fu
ture
Con
diti
ons
№N
ame
of R
ayon
Population as of 01 .01 .�004 (ps .)
Population with access to drinking water as of
01 .01 .�005 (ps .)
Acc
ess
of p
opul
atio
n to
dri
nkin
g w
ater
(in
% o
f tot
al p
opul
atio
n)
as o
f 1 .
01 .�
005
incr
emen
t fo
r �0
05
(ps .
)
as o
f 1 .
01 .�
006
incr
emen
t fo
r �0
06
(ps .
)
as o
f 1 .
01 .�
007
incr
emen
t fo
r �0
07(p
s .)
as o
f 1 .
01 .�
008
incr
emen
t fo
r �0
08
(ps .
)
as o
f 1 .
01 .�
009
incr
emen
t fo
r �0
09
(ps .
)
as o
f 1 .
01 .�
010
incr
emen
t fo
r �0
10
(ps .
)
as o
f 1 .
01 .�
011
1P
avlo
dar
(u .a
.)*9,
�90
4,�0
046
.�77
454
.67�
66�
.4-
6� .4
�,5�
489
.6-
89 .6
486
94 .8
�A
ksu
(u .a
.)*�0
,�77
5,1�
7�5
.�74
0�9
.01,
711
�7 .4
1,�5
54�
.6�,
686
61 .8
�,60
074
.6�,
586
87 .4
�Ek
ibas
tuz
(u .a
.)*8,
588
8�1
9 .6
-9 .
6-
9 .6
-9 .
6-
9 .6
�,�0
048
.0�,
�54
87 .0
4A
ktog
ai18
,910
4,56
0�4
.1-
�4 .1
1,60
9��
.6�,
464
45 .7
�,05
556
.5�,
�00
68 .�
�,�1
079
.8
5B
ayan
aul
��,0
806,
600
�9 .9
�98
�1 .7
-�1
.71,
690
�9 .�
�,71
�56
.��,
500
7� .0
�,65
588
.6
6Zh
elez
insk
y��
,995
8,6�
9�7
.6-
�7 .6
�,50
05�
.8�,
846
69 .5
866
7� .�
1,�9
079
.�1,
�99
85 .4
7Ir
tysh
�8,7
�911
,5�6
40 .1
1,68
046
.01,
94�
5� .7
1,59
�58
.�5,
650
77 .9
1,50
08�
.11,
�98
88 .0
8K
achi
rsky
�6,5
7�14
,8�1
55 .8
1,07
859
.81,
000
6� .6
1,75
170
.�1,
010
74 .0
�,�0
08�
.��,
800
9� .8
9le
byaz
hins
ky17
,680
5,78
4��
.7-
�� .7
95�
�8 .1
1,65
�47
.4�,
0�1
58 .9
�,80
074
.7�,
799
90 .5
10M
aisk
y14
,55�
600
4 .1
-4 .
11,
811
16 .6
�,9�
1�6
.6�,
888
6� .4
�,00
077
.1�,
100
91 .5
11P
avlo
dars
ky�9
,940
11,7
�5�9
.�-
�9 .�
�,41
847
.�1,
56�
5� .5
�,��
159
.94,
100
7� .6
5,�0
091
.0
1�U
spen
sky
16,7
767,
�6�
4� .9
-4�
.91,
90�
55 .�
1,09
461
.71,
071
68 .1
1,50
077
.11,
654
86 .9
1�Sc
herb
aktin
sky
�5,6
18�,
�99
1� .�
-1�
.��,
000
�1 .1
�,�8
4�0
.0�,
740
44 .6
4,80
06�
.�4,
8��
8� .1
Tota
l in
Obl
ast:
�6�,
018
85,�
84��
.54,
670
�4 .�
19,5
7441
.8��
,11�
50 .�
��,4
546�
.6�1
,890
74 .8
�4,4
6�88
.0
Not
e: *
u.a.
– u
rban
agg
lom
erat
e

169
ANNExES
Pre
sen
t sit
uati
on w
ith
Rur
al W
ater
sup
ply
in P
avlo
dar
obl
ast
№N
ame
of R
ayon
Num
ber
of
Sett
lem
ents
(it
ems)
Pop
ulat
ion
(ps .
)
Ava
ilabi
lity
of W
ater
Sup
ply
from
:
cent
raliz
ed w
ater
sup
ply
syst
emlo
cal w
ater
sou
rces
deliv
ered
wat
er
Num
ber
of
Sett
lem
ents
Num
ber
of
sett
lem
ents
w
here
sys
tem
do
es n
ot o
pera
te
Pop
ulat
ion
of w
hich
do
not h
ave
acce
ss to
dr
inki
ng w
ater
grou
nd w
ater
surf
ace
wat
er
Num
ber
of
Sett
lem
ents
Pop
ulat
ion
Num
ber
of
Sett
lem
ents
Pop
ulat
ion
Num
ber
of
Sett
lem
ents
Pop
ulat
ion
1P
avlo
dar
(u .a
.)*6
10,1
���
18,
�00
4,�0
04
5,8�
�
�A
ksu
(u .a
.)*��
�1,0
1�7
�9,
84�
5,1�
7�6
15,8
76
�Ek
ibas
tuz
(u .a
.)*�5
8,44
61
08�
18�
1��
7,41
7�
�08
4A
ktog
ai�7
18,�
085
06,
560
4,56
0��
1�,7
48
5B
ayan
aul
7���
,080
8�
9,4�
06,
600
558,
968
18 6
51�
6Zh
elez
insk
y4�
�1,8
6014
�1�
,779
8,6�
9�9
1�,�
�1
7Ir
tysh
�5�7
,156
80
15,4
7811
,5�6
�01�
,6�0
7 �
000
8K
achi
rsky
4��6
,416
101
17,�
5014
,8�1
��11
,595
9le
byaz
hins
ky�8
18,�
�65
08,
716
5,78
4��
1�,5
4�
10M
aisk
y�4
15,�
797
67,
�14
600
1714
,679
11P
avlo
dars
ky41
�1,�
4114
0�0
,�54
11,7
�5�7
19,5
06
1�U
spen
sky
��16
,�8�
60
9,1�
97,
�6�
168,
4�6
148
5
1�Sc
herb
aktin
sky
40�5
,489
61
11,8
9��,
�99
�4��
,090
Tota
l in
Obl
ast:
449
�6�,
018
9�15
1�8,
865
85,�
84��
716
7,5�
9�5
8 5
1�
�69
�
Not
e: *
u.a.
– u
rban
agg
lom
erat
e

UNDP Project National Plan for Integrated Water Resources Management and Water Efficiency in Kazakhstan
ACCEss to DRINKINg WAtER AND sANItAtIoN IN thE REPUblIC of KAzAKhstAN
170
Expe
cted
Inve
stm
ents
to W
ater
sup
ply
Impr
ovem
ent i
n R
ural
Are
as o
f Pav
loda
r o
blas
t (U
nit
: Kzt
mln
)
№N
ame
of R
ayon
�005
�006
�007
Tota
l in
�005
Sour
ces
of F
inan
cing
Tota
l in
�006
Sour
ces
of F
inan
cing
Tota
l in
�007
Sour
ces
of F
inan
cing
cent
al
stat
e bu
dget
loca
l bu
dget
le
gal e
ntity
fo
reig
n gr
ants
an
d lo
ans
cent
al
stat
e bu
dget
loca
l bu
dget
le
gal
entit
y
fore
ign
gran
ts
and
loan
s
cent
al
stat
e bu
dget
loca
l bu
dget
le
gal
entit
y
fore
ign
gran
ts
and
loan
s
1P
avlo
dar
(u .a
.)*1�
.0�
8 .��
4 .80
00
� .40
0� .
400
0�0
.00
00
0�0
.00
�A
ksu
(u .a
.)*10
.16
10 .1
60
00
50 .0
�19
.�5
�0 .7
80
089
.47
79 .4
70
010
.00
�Ek
ibas
tuz
(u .a
.)*0
00
00
00
00
0�0
.00
00
0�0
.00
4A
ktog
ai1 .
500
1 .50
00
1�� .
601�
� .60
00
016
8 .90
100 .
0068
.90
00
5B
ayan
aul
00
00
054
.�7
17 .5
7�6
.70
0 .00
0 .00
189 .
851�
0 .�9
59 .5
60
0
6Zh
elez
insk
y�4
.00
0�4
.00
00
156 .
511�
� .�7
�4 .1
40
018
6 .6�
1�0 .
4556
.18
00
7Ir
tysh
105 .
0�80
.95
�4 .0
70
014
1 .17
80 .0
061
.17
00
�14 .
7117
� .1
41 .6
10
0
8K
achi
rsky
16� .
��1�
� .0�
�0 .1
90
0�7
� .18
�55 .
1�17
.05
00
�48 .
0��1
5 .0�
�� .0
00
0
9le
byaz
hins
ky0
00
00
14� .
6110
8 .�6
�4 .�
50
010
8 .�7
108 .
�70
00
10M
aisk
y0
00
00
�5 .1
��5
.1�
00
01�
0 .00
100 .
000
0�0
.00
11P
avlo
dars
ky��
.40
0��
.40
00
1�5 .
9511
9 .�5
16 .6
00
01�
6 .19
55 .8
950
.�0
0�0
.00
1�U
spen
sky
85 .7
085
.70
00
07�
.87
40 .0
0��
.87
00
11� .
�140
.00
5� .�
10
�0 .0
0
1�Sc
herb
aktin
sky
1� .6
10
1� .6
10
010
0 .00
80 .0
0�0
.00
00
160 .
0010
0 .00
�0 .0
00
40 .0
0
F/S
�4 .0
00
�4 .0
00
0�0
.00
�0 .0
00
0�0
.00
�0 .0
00
Tota
l in
Obl
ast:
47� .
64�1
8 .07
154 .
570
01,
�16 .
711,
009 .
75�0
6 .96
00
1,89
5 .45
1,��
� .59
40� .
860 .
0016
0 .00
Not
e: *
u.a.
– u
rban
agg
lom
erat
e
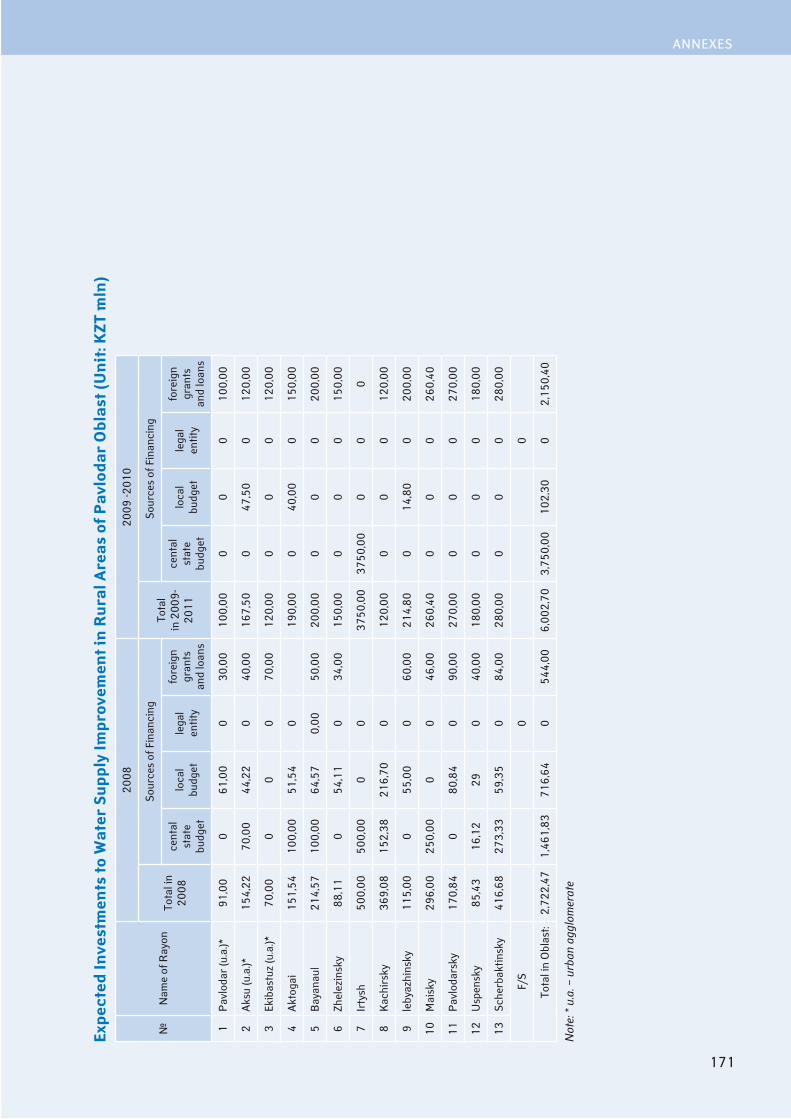
171
ANNExES
Expe
cted
Inve
stm
ents
to W
ater
sup
ply
Impr
ovem
ent i
n R
ural
Are
as o
f Pav
loda
r o
blas
t (U
nit
: Kzt
mln
)
№N
ame
of R
ayon
�008
�009
-�01
0
Tota
l in
�008
Sour
ces
of F
inan
cing
Tota
l in
�00
9-�0
11
Sour
ces
of F
inan
cing
cent
al
stat
e bu
dget
loca
l bu
dget
le
gal
entit
y
fore
ign
gran
ts
and
loan
s
cent
al
stat
e bu
dget
loca
l bu
dget
le
gal
entit
y
fore
ign
gran
ts
and
loan
s
1P
avlo
dar
(u .a
.)*91
,00
061
,00
0�0
,00
100,
000
00
100,
00
�A
ksu
(u .a
.)*15
4,��
70,0
044
,��
040
,00
167,
500
47,5
00
1�0,
00
�Ek
ibas
tuz
(u .a
.)*70
,00
00
070
,00
1�0,
000
00
1�0,
00
4A
ktog
ai15
1,54
100,
0051
,54
019
0,00
040
,00
015
0,00
5B
ayan
aul
�14,
5710
0,00
64,5
70,
0050
,00
�00,
000
00
�00,
00
6Zh
elez
insk
y88
,11
054
,11
0�4
,00
150,
000
00
150,
00
7Ir
tysh
500,
0050
0,00
00
�750
,00
�750
,00
00
0
8K
achi
rsky
�69,
0815
�,�8
�16,
700
1�0,
000
00
1�0,
00
9le
byaz
hins
ky11
5,00
055
,00
060
,00
�14,
800
14,8
00
�00,
00
10M
aisk
y�9
6,00
�50,
000
046
,00
�60,
400
00
�60,
40
11P
avlo
dars
ky17
0,84
080
,84
090
,00
�70,
000
00
�70,
00
1�U
spen
sky
85,4
�16
,1�
�90
40,0
018
0,00
00
018
0,00
1�Sc
herb
aktin
sky
416,
68�7
�,��
59,�
50
84,0
0�8
0,00
00
0�8
0,00
F/S
00
Tota
l in
Obl
ast:
�,7�
�,47
1,46
1,8�
716,
640
544,
006,
00�,
70�,
750,
0010
�,�0
0�,
150,
40
Not
e: *
u.a.
– u
rban
agg
lom
erat
e
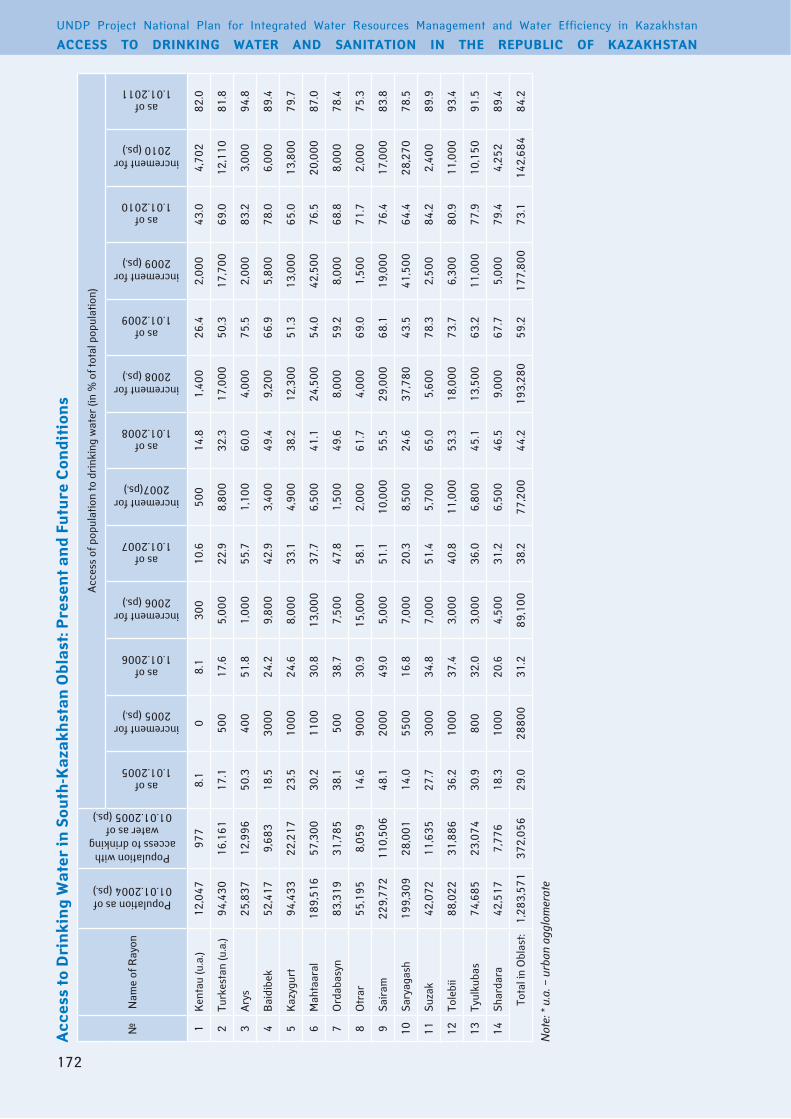
UNDP Project National Plan for Integrated Water Resources Management and Water Efficiency in Kazakhstan
ACCEss to DRINKINg WAtER AND sANItAtIoN IN thE REPUblIC of KAzAKhstAN
17�
Acc
ess
to D
rin
kin
g W
ater
in s
outh
-Kaz
akhs
tan
obl
ast:
Pre
sen
t an
d fu
ture
Con
diti
ons
№N
ame
of R
ayon
Population as of 01 .01 .�004 (ps .)
Population with access to drinking
water as of 01 .01 .�005 (ps .)
Acc
ess
of p
opul
atio
n to
dri
nkin
g w
ater
(in
% o
f tot
al p
opul
atio
n)
as of 1 .01 .�005
increment for �005 (ps .)
as of 1 .01 .�006
increment for �006 (ps .)
as of 1 .01 .�007
increment for �007(ps .)
as of 1 .01 .�008
increment for �008 (ps .)
as of 1 .01 .�009
increment for �009 (ps .)
as of 1 .01 .�010
increment for �010 (ps .)
as of 1 .01 .�011
1K
enta
u (u
.a .)
1�,0
4797
78 .
10
8 .1
�00
10 .6
500
14 .8
1,40
0�6
.4�,
000
4� .0
4,70
�8�
.0
�Tu
rkes
tan
(u .a
.)94
,4�0
16,1
6117
.150
017
.65,
000
�� .9
8,80
0��
.�17
,000
50 .�
17,7
0069
.01�
,110
81 .8
�A
rys
�5,8
�71�
,996
50 .�
400
51 .8
1,00
055
.71,
100
60 .0
4,00
075
.5�,
000
8� .�
�,00
094
.8
4B
aidi
bek
5�,4
179,
68�
18 .5
�000
�4 .�
9,80
04�
.9�,
400
49 .4
9,�0
066
.95,
800
78 .0
6,00
089
.4
5K
azyg
urt
94,4
����
,�17
�� .5
1000
�4 .6
8,00
0��
.14,
900
�8 .�
1�,�
0051
.�1�
,000
65 .0
1�,8
0079
.7
6M
ahta
aral
189,
516
57,�
00�0
.�11
00�0
.81�
,000
�7 .7
6,50
041
.1�4
,500
54 .0
4�,5
0076
.5�0
,000
87 .0
7O
rdab
asyn
8�,�
19�1
,785
�8 .1
500
�8 .7
7,50
047
.81,
500
49 .6
8,00
059
.�8,
000
68 .8
8,00
078
.4
8O
trar
55,1
958,
059
14 .6
9000
�0 .9
15,0
0058
.1�,
000
61 .7
4,00
069
.01,
500
71 .7
�,00
075
.�
9Sa
iram
��9,
77�
110,
506
48 .1
�000
49 .0
5,00
051
.110
,000
55 .5
�9,0
0068
.119
,000
76 .4
17,0
008�
.8
10Sa
ryag
ash
199,
�09
�8,0
0114
.055
0016
.87,
000
�0 .�
8,50
0�4
.6�7
,780
4� .5
41,5
0064
.4�8
,�70
78 .5
11Su
zak
4�,0
7�11
,6�5
�7 .7
�000
�4 .8
7,00
051
.45,
700
65 .0
5,60
078
.��,
500
84 .�
�,40
089
.9
1�To
lebi
i88
,0��
�1,8
86�6
.�10
00�7
.4�,
000
40 .8
11,0
005�
.�18
,000
7� .7
6,�0
080
.911
,000
9� .4
1�Ty
ulku
bas
74,6
85��
,074
�0 .9
800
�� .0
�,00
0�6
.06,
800
45 .1
1�,5
006�
.�11
,000
77 .9
10,1
5091
.5
14Sh
arda
ra4�
,517
7,77
618
.�10
00�0
.64,
500
�1 .�
6,50
046
.59,
000
67 .7
5,00
079
.44,
�5�
89 .4
Tota
l in
Obl
ast:
1,�8
�,57
1�7
�,05
6�9
.0�8
800
�1 .�
89,1
00�8
.�77
,�00
44 .�
19�,
�80
59 .�
177,
800
7� .1
14�,
684
84 .�
Not
e: *
u.a.
– u
rban
agg
lom
erat
e

17�
ANNExES
Pre
sen
t sit
uati
on w
ith
Rur
al W
ater
sup
ply
in s
outh
-Kaz
akhs
tan
obl
ast
№N
ame
of R
ayon
Num
ber
of
Sett
lem
ents
(it
ems)
Pop
ulat
ion
(ps .
)
Ava
ilabi
lity
of W
ater
Sup
ply
from
:
cent
raliz
ed w
ater
sup
ply
syst
emlo
cal w
ater
sou
rces
deliv
ered
wat
erW
ater
Tar
iff,
KZT
/m�
grou
nd w
ater
surf
ace
wat
er
Num
ber
of
Sett
lem
ents
Pop
ulat
ion
Leng
th o
f wat
er
pipe
net
wor
k (k
m)
Num
ber
of
Sett
lem
ents
Pop
ulat
ion
Num
ber
of
Sett
lem
ents
Pop
ulat
ion
Num
ber
of
Sett
lem
ents
Pop
ulat
ion
1K
enta
u (u
.a .)*
41�
,047
�97
70
110
,0�0
11,
040
0-
up to
75
�Tu
rkes
tan
(u .a
.)*�9
94,4
�07
16,1
6186
.5�1
77,5
�80
-1
7�1
up to
75
�A
rys
�5�5
,8�7
1�1�
,996
61 .6
1�1�
,��4
151
70
-up
to 7
5
4B
aidi
bek
5�5�
,417
89,
68�
118 .
�4�
4�,�
�41
500
0-
up to
75
5K
azyg
urt
6094
,4��
19��
,�17
177 .
00�9
56,�
0010
9,��
4�
6,79
�up
to 7
5
6M
ahta
aral
177
189,
516
�757
,�00
1�4 .
81�
111
7,�8
70
-�9
14,9
�9up
to 7
5
7O
rdab
asyn
598�
,�19
17�1
,785
11� .
�4�
51,5
�40
-0
-up
to 7
5
8O
trar
4�55
,195
108,
059
78 .1
���7
,�7�
1�,
074
1016
,790
up to
75
9Sa
iram
7���
9,77
���
110,
506
4�5 .
640
117,
7�8
0-
11,
5�8
up to
75
10Sa
ryag
ash
151
199,
�09
15�8
,001
�7� .
5�7
71,6
48�9
�4,0
8670
65,5
74up
to 7
5
11Su
zak
�54�
,07�
1111
,6�5
74 .�
�4�0
,4�7
0-
0-
up to
75
1�To
lebi
i70
88,0
���0
�1,8
8615
7 .�
4056
,1�6
0-
0-
up to
75
1�Ty
ulku
bas
5974
,685
19��
,074
65 .6
5�9
51,5
461
650
-up
to 7
5
14Sh
arda
ra�4
4�,5
17�
7,77
6�6
.00
�1�4
,741
0-
0-
up to
75
Tota
l in
Obl
ast:
871
1,�8
�,57
1�1
��7
�,05
61,
781 .
7549
�75
6,65
554
48,5
0611
�10
6,�5
4up
to 7
5
Not
e: *
u.a.
– u
rban
agg
lom
erat
e
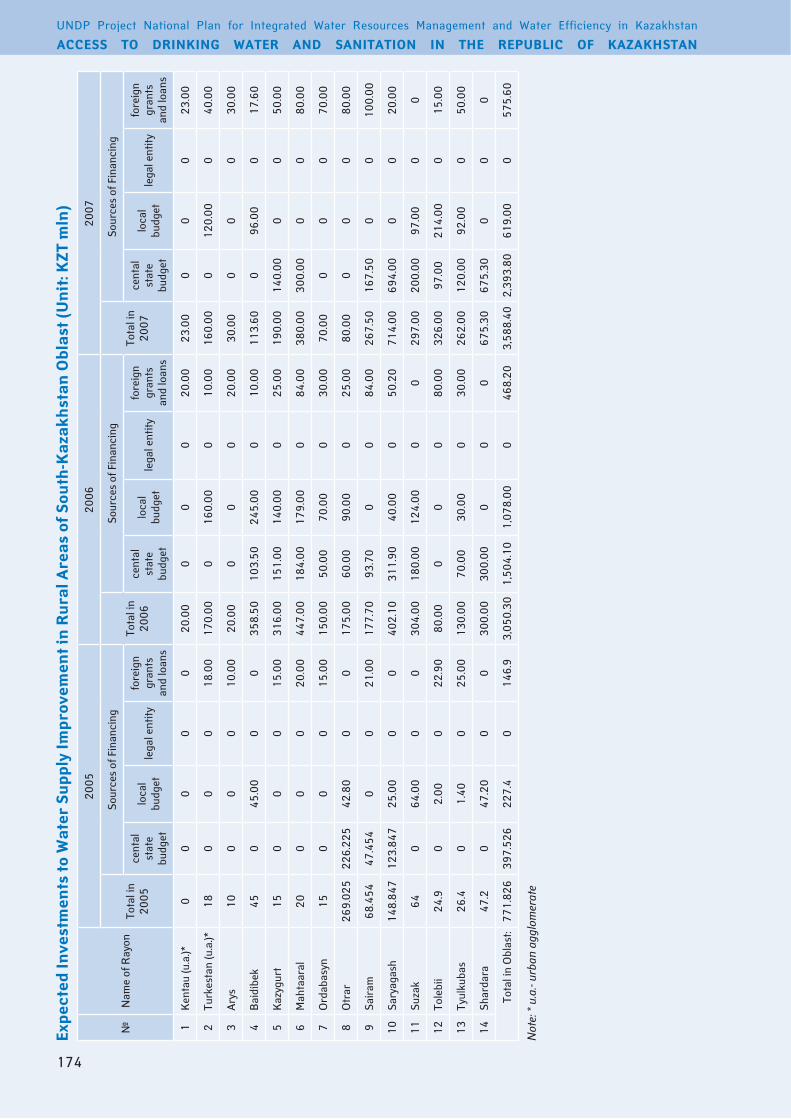
UNDP Project National Plan for Integrated Water Resources Management and Water Efficiency in Kazakhstan
ACCEss to DRINKINg WAtER AND sANItAtIoN IN thE REPUblIC of KAzAKhstAN
174
Expe
cted
Inve
stm
ents
to W
ater
sup
ply
Impr
ovem
ent i
n R
ural
Are
as o
f sou
th-K
azak
hsta
n o
blas
t (U
nit
: Kzt
mln
)
№N
ame
of R
ayon
�005
�006
�007
Tota
l in
�005
Sour
ces
of F
inan
cing
Tota
l in
�006
Sour
ces
of F
inan
cing
Tota
l in
�007
Sour
ces
of F
inan
cing
cent
al
stat
e bu
dget
loca
l bu
dget
le
gal e
ntity
fo
reig
n gr
ants
an
d lo
ans
cent
al
stat
e bu
dget
loca
l bu
dget
le
gal e
ntity
fo
reig
n gr
ants
an
d lo
ans
cent
al
stat
e bu
dget
loca
l bu
dget
le
gal e
ntity
fo
reig
n gr
ants
an
d lo
ans
1K
enta
u (u
.a .)*
00
00
0�0
.00
00
0�0
.00
�� .0
00
00
�� .0
0
�Tu
rkes
tan
(u .a
.)*18
00
018
.00
170 .
000
160 .
000
10 .0
016
0 .00
01�
0 .00
040
.00
�A
rys
100
00
10 .0
0�0
.00
00
0�0
.00
�0 .0
00
00
�0 .0
0
4B
aidi
bek
450
45 .0
00
0�5
8 .50
10� .
50�4
5 .00
010
.00
11� .
600
96 .0
00
17 .6
0
5K
azyg
urt
150
00
15 .0
0�1
6 .00
151 .
0014
0 .00
0�5
.00
190 .
0014
0 .00
00
50 .0
0
6M
ahta
aral
�00
00
�0 .0
044
7 .00
184 .
0017
9 .00
084
.00
�80 .
00�0
0 .00
00
80 .0
0
7O
rdab
asyn
150
00
15 .0
015
0 .00
50 .0
070
.00
0�0
.00
70 .0
00
00
70 .0
0
8O
trar
�69 .
0�5
��6 .
��5
4� .8
00
017
5 .00
60 .0
090
.00
0�5
.00
80 .0
00
00
80 .0
0
9Sa
iram
68 .4
5447
.454
00
�1 .0
017
7 .70
9� .7
00
084
.00
�67 .
5016
7 .50
00
100 .
00
10Sa
ryag
ash
148 .
847
1�� .
847
�5 .0
00
040
� .10
�11 .
9040
.00
050
.�0
714 .
0069
4 .00
00
�0 .0
0
11Su
zak
640
64 .0
00
0�0
4 .00
180 .
001�
4 .00
00
�97 .
00�0
0 .00
97 .0
00
0
1�To
lebi
i�4
.90
� .00
0��
.90
80 .0
00
00
80 .0
0��
6 .00
97 .0
0�1
4 .00
015
.00
1�Ty
ulku
bas
�6 .4
01 .
400
�5 .0
01�
0 .00
70 .0
0�0
.00
0�0
.00
�6� .
001�
0 .00
9� .0
00
50 .0
0
14Sh
arda
ra47
.�0
47 .�
00
0�0
0 .00
�00 .
000
00
675 .
�067
5 .�0
00
0
Tota
l in
Obl
ast:
771 .
8�6
�97 .
5�6
��7 .
40
146 .
9�,
050 .
�01,
504 .
101,
078 .
000
468 .
�0�,
588 .
40�,
�9� .
8061
9 .00
057
5 .60
Not
e: *
u.a.
- urb
an a
gglo
mer
ate

175
ANNExES
Expe
cted
Inve
stm
ents
to W
ater
sup
ply
Impr
ovem
ent i
n R
ural
Are
as o
f sou
th-K
azak
hsta
n o
blas
t (U
nit
: Kzt
mln
)
№N
ame
of R
ayon
�008
�009
-�01
0
Tota
l in
�008
Sour
ces
of F
inan
cing
Tota
l in
�00
9-�0
11
Sour
ces
of F
inan
cing
cent
al
stat
e bu
dget
loca
l bu
dget
le
gal e
ntity
fo
reig
n gr
ants
an
d lo
ans
cent
al
stat
e bu
dget
loca
l bu
dget
le
gal e
ntity
fo
reig
n gr
ants
an
d lo
ans
1K
enta
u (u
.a .)*
�6 .�
00
5 .50
0�0
.70
50 .0
00
00
50 .0
0
�Tu
rkes
tan
(u .a
.)*��
8 .00
019
5 .00
0��
.00
��7 .
700
��7 .
700
0
�A
rys
�50 .
007�
.00
164 .
000
14 .0
0�4
9 .70
6� .0
018
6 .70
00
4B
aidi
bek
��1 .
000
�11 .
000
10 .0
0�6
0 .00
0�5
0 .00
010
.00
5K
azyg
urt
�87 .
1011
6 .00
�48 .
100
�� .0
066
4 .�0
�0� .
504�
4 .70
0�7
.00
6M
ahta
aral
1,19
0 .00
�64 .
007�
6 .00
0�0
0 .00
��67
.00
607 .
001,
709 .
000
51 .0
0
7O
rdab
asyn
��5 .
000
�08 .
000
17 .0
06�
4 .00
85 .0
054
9 .00
00
8O
trar
160 .
000
59 .4
00
100 .
6010
0 .70
00
010
0 .70
9Sa
iram
1,09
� .50
607 .
5044
5 .00
040
.00
�,0�
8 .50
980 .
0099
6 .50
05�
.00
10Sa
ryag
ash
1,08
� .00
�50 .
0065
� .00
080
.00
1,�0
7 .10
01,
��� .
100
75 .0
0
11Su
zak
�99 .
001�
5 .00
164 .
000
0�1
� .00
60 .0
0�5
� .00
00
1�To
lebi
i51
0 .40
1�4 .
00�4
6 .40
040
.00
71� .
80�9
6 .00
�56 .
800
61 .0
0
1�Ty
ulku
bas
461 .
�016
� .00
�69 .
�00
�0 .0
060
� .10
�44 .
00�5
9 .10
00
14Sh
arda
ra75
5 .10
6�5 .
�01�
9 .80
00
�99 .
500
�99 .
50
0
Tota
l in
Obl
ast:
7,09
7 .60
�,45
5 .80
4,0�
� .50
061
8 .�0
9,8�
7 .�0
�,6�
7 .50
6,75
� .10
0 .00
4�6 .
70
Not
e: *
u.a.
– u
rban
agg
lom
erat
e

UNDP Project National Plan for Integrated Water Resources Management and Water Efficiency in Kazakhstan
ACCEss to DRINKINg WAtER AND sANItAtIoN IN thE REPUblIC of KAzAKhstAN
176