committed to sustainable productivity€¦ · generators with quick payback for the customer....
TRANSCRIPT

COMMITTED TO
SUSTAINABLE
PRODUCTIVITY
Q3 2015 results
October 20, 2015

Q3 IN BRIEF
Mixed demand development
– Growth in service
– Low order volumes for equipment
Stable industrial business
Weak mining and oil & gas
Order growth in Europe – declines in China, Brazil and the Middle East
Record profit and strong operating cash flow
October 20, 2015
Atlas Copco - Q3 results 2015
2

INNOVATION HIGHLIGHTS
iXM dry pump
For semiconductor manufacturing
Patented technology and design
Increased energy efficiency and longer lifetime
GHS VSD+
For general manufacturing
Energy savings of 50% on average
Vacuum solutions
3
October 20, 2015
Atlas Copco - Q3 results 2015
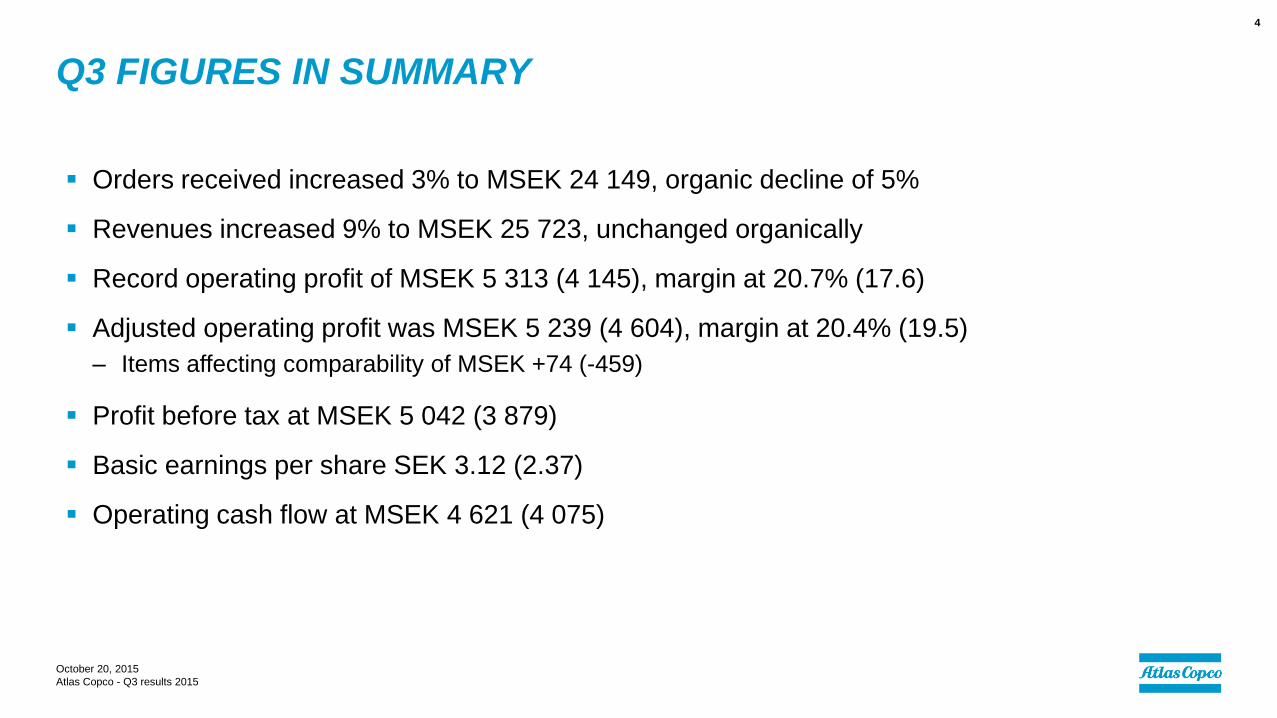
Q3 FIGURES IN SUMMARY
Orders received increased 3% to MSEK 24 149, organic decline of 5%
Revenues increased 9% to MSEK 25 723, unchanged organically
Record operating profit of MSEK 5 313 (4 145), margin at 20.7% (17.6)
Adjusted operating profit was MSEK 5 239 (4 604), margin at 20.4% (19.5)
– Items affecting comparability of MSEK +74 (-459)
Profit before tax at MSEK 5 042 (3 879)
Basic earnings per share SEK 3.12 (2.37)
Operating cash flow at MSEK 4 621 (4 075)
October 20, 2015
Atlas Copco - Q3 results 2015
4

ORDERS RECEIVED - LOCAL CURRENCY
October 20, 2015
Atlas Copco - Q3 results 2015
5
September 2015
100 -1 -3
A = Share of orders received, year-to-date, %
B = Year-to-date vs. previous year, %
C = Last 3 months vs. previous year, %
A B C
24 -3 -7
8 -13 -17
30 +5 +7
10 -3 -18
25 -1 +2
3 -13 -20
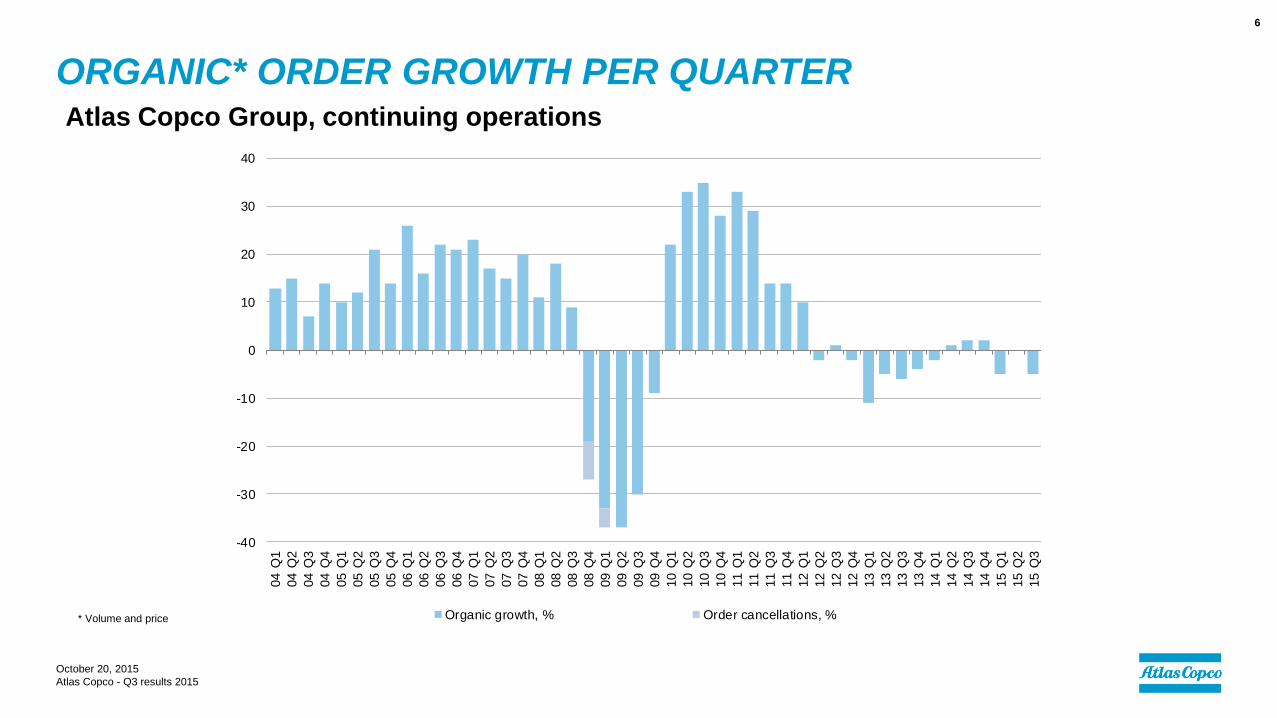
ORGANIC* ORDER GROWTH PER QUARTERAtlas Copco Group, continuing operations
October 20, 2015
Atlas Copco - Q3 results 2015
6
* Volume and price
-40
-30
-20
-10
0
10
20
30
40
04
Q1
04
Q2
04
Q3
04
Q4
05
Q1
05
Q2
05
Q3
05
Q4
06
Q1
06
Q2
06
Q3
06
Q4
07
Q1
07
Q2
07
Q3
07
Q4
08
Q1
08
Q2
08
Q3
08
Q4
09
Q1
09
Q2
09
Q3
09
Q4
10
Q1
10
Q2
10
Q3
10
Q4
11
Q1
11
Q2
11
Q3
11
Q4
12
Q1
12
Q2
12
Q3
12
Q4
13
Q1
13
Q2
13
Q3
13
Q4
14
Q1
14
Q2
14
Q3
14
Q4
15
Q1
15
Q2
15
Q3
Organic growth, % Order cancellations, %

ATLAS COPCO GROUP – SALES BRIDGE
October 20, 2015
Atlas Copco - Q3 results 2015
7
Orders Orders
MSEK received Revenues received Revenues
2014 23 395 23 590 69 498 68 361
Structural change, % +1 +1 +2 +2
Currency, % +7 +8 +11 +12
Price, % +0 +1 +0 +0
Volume, % -5 -1 -3 -2
Total, % +3 +9 +10 +12
2015 24 149 25 723 76 394 76 579
July - September January - September

ATLAS COPCO GROUP
Compressor Technique
Industrial Technique
Mining and Rock Excavation Technique
Construction Technique
Revenues by business area
October 20, 2015
Atlas Copco - Q3 results 2015
8
14%
26%
15%
45%
12 months until September 2015

COMPRESSOR TECHNIQUE
Growth in service
Weak order intake for equipment
– Positive in Europe, negative in China and Brazil
– United States affected by weak oil & gas and low
vacuum orders
– Low orders for gas and process compressors
Record revenues and operating profit
– Operating margin at 22.8% (22.1)
0%
5%
10%
15%
20%
25%
30%
0
2 500
5 000
7 500
10 000
12 500
15 000
Q12013
Q22013
Q32013
Q42013
Q12014
Q22014
Q32014
Q42014
Q12015
Q22015
Q32015
Orders received, MSEK Revenues, MSEK
Operating margin, % Adjusted operating margin, %
October 20, 2015
Atlas Copco - Q3 results 2015
9
Extended and upgraded range of nitrogen
generators with quick payback for the customer

INDUSTRIAL TECHNIQUE
Increased order intake
– Strong demand from motor vehicle industry,
aerospace and electronics
Growth in service
Acquisition of process control systems specialist
Record operating profit
– Operating margin at 23.6% (22.5)
0%
5%
10%
15%
20%
25%
0
1 000
2 000
3 000
4 000
5 000
Q12013
Q22013
Q32013
Q42013
Q12014
Q22014
Q32014
Q42014
Q12015
Q22015
Q32015
Orders received, MSEK Revenues, MSEK Operating margin, %
October 20, 2015
Atlas Copco - Q3 results 2015
10
High torque electric assembly tool for high productivity

MINING AND ROCK EXCAVATION TECHNIQUE
Growth in service and parts
Lower order intake for equipment
– Cancellations of MSEK 300, mainly in Australia
– Further efficiency measures
Operating margin at 20.0% (18.5 adjusted)
0%
5%
10%
15%
20%
25%
0
1 000
2 000
3 000
4 000
5 000
6 000
7 000
8 000
9 000
10 000
Q12013
Q22013
Q32013
Q42013
Q12014
Q22014
Q32014
Q42014
Q12015
Q22015
Q32015
Orders received, MSEK Revenues, MSEK
Operating margin, % Adjusted operating margin, %
October 20, 2015
Atlas Copco - Q3 results 2015
11
Reliable low-pressure rock drill for surface
applications

CONSTRUCTION TECHNIQUE
Positive development for specialty rental and
stable service business
– Acquisition of specialty dryer rental business
Lower order intake for equipment
– Significant decrease in Brazil and China
– Growth in Europe, India and the United States
Operating margin at 14.0% (11.4)
0%
2%
4%
6%
8%
10%
12%
14%
16%
18%
20%
0
500
1 000
1 500
2 000
2 500
3 000
3 500
4 000
4 500
5 000
Q12013
Q22013
Q32013
Q42013
Q12014
Q22014
Q32014
Q42014
Q12015
Q22015
Q32015
Orders received, MSEK Revenues, MSEK
Operating margin, % Adjusted operating margin, %
October 20, 2015
Atlas Copco - Q3 results 2015
12
High pressure portable compressor with improved
fuel efficiency

GROUP TOTALJuly – September 2015 vs. 2014
October 20, 2015
Atlas Copco - Q3 results 2015
13
MSEK 2015 2014 %
Orders received 24 149 23 395 3%
Revenues 25 723 23 590 9%
Operating profit 5 313 4 145 28%
– as a percentage of revenues 20.7 17.6
Profit before tax 5 042 3 879 30%
– as a percentage of revenues 19.6 16.4
Profit for the period 3 806 2 878 32%
Basic earnings per share, SEK 3.12 2.37
Return on capital employed, % 27 25
July - September
0%
5%
10%
15%
20%
25%
30%
0
5 000
10 000
15 000
20 000
25 000
30 000
Q12013
Q22013
Q32013
Q42013
Q12014
Q22014
Q32014
Q42014
Q12015
Q22015
Q32015
Orders received, MSEK Revenues, MSEK
Operating margin, % Adjusted operating margin, %

23 59025 723
3201 945
132
0
5 000
10 000
15 000
20 000
25 000
30 000
Q3 2014 One-time +acquisitions
Currency Volume, price,mix and other
Q3 2015
Revenues
4 145
5 313
133
450
670
85
0
1 000
2 000
3 000
4 000
5 000
6 000
Q3 2014 LTI (options) One-time +acquisitions
Currency Volume, price,mix and other
Q3 2015
Operating profit
PROFIT BRIDGEJuly – September 2015 vs. 2014
October 20, 2015
Atlas Copco - Q3 results 2015
14
Volume, price, One-time items Share based
MSEK Q3 2015 mix and other Currency Acquisitions LTI programs Q3 2014
Atlas Copco Group
Revenues 25 723 -132 1 945 320 23 590
Operating profit 5 313 -85 670 450 133 4 145
% 20.7% 64.4% 17.6%
Volume, price, One-time items
MSEK Q3 2015 mix and other Currency Acquisitions Q3 2014
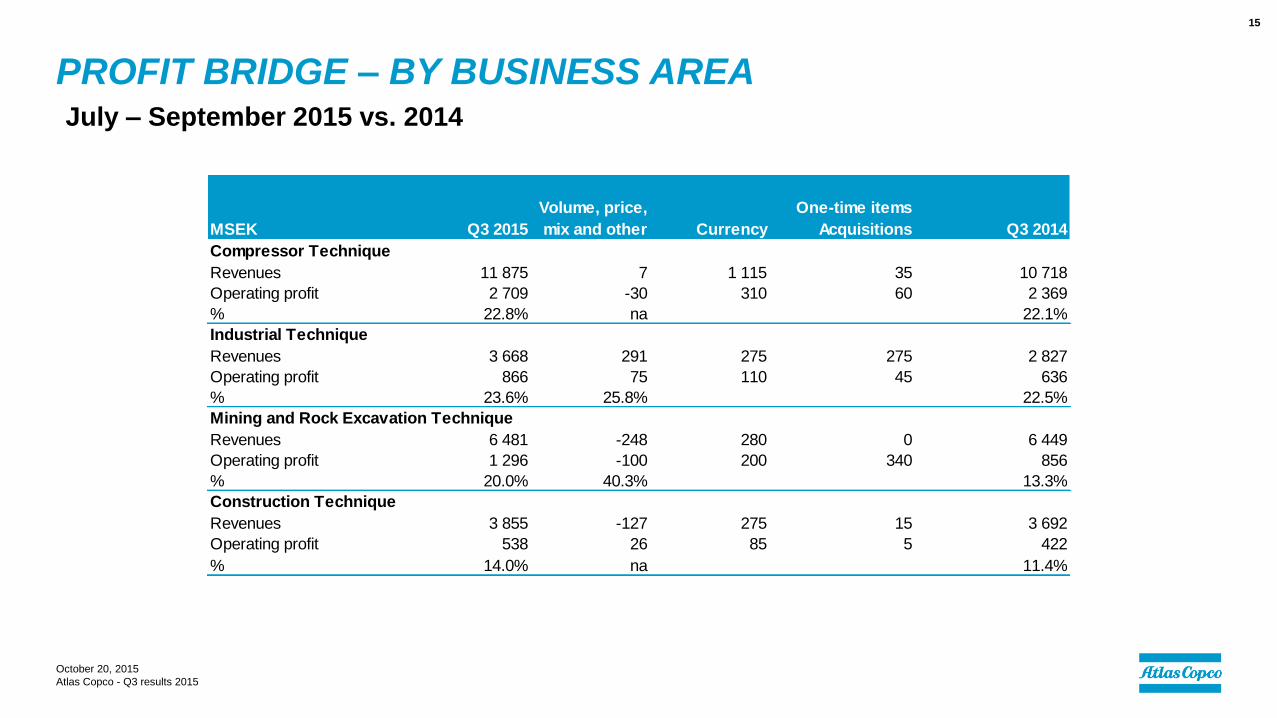
Compressor Technique
Revenues 11 875 7 1 115 35 10 718
Operating profit 2 709 -30 310 60 2 369
% 22.8% na 22.1%
Industrial Technique
Revenues 3 668 291 275 275 2 827
Operating profit 866 75 110 45 636
% 23.6% 25.8% 22.5%
Mining and Rock Excavation Technique
Revenues 6 481 -248 280 0 6 449
Operating profit 1 296 -100 200 340 856
% 20.0% 40.3% 13.3%
Construction Technique
Revenues 3 855 -127 275 15 3 692
Operating profit 538 26 85 5 422
% 14.0% na 11.4%
PROFIT BRIDGE – BY BUSINESS AREAJuly – September 2015 vs. 2014
October 20, 2015
Atlas Copco - Q3 results 2015
15
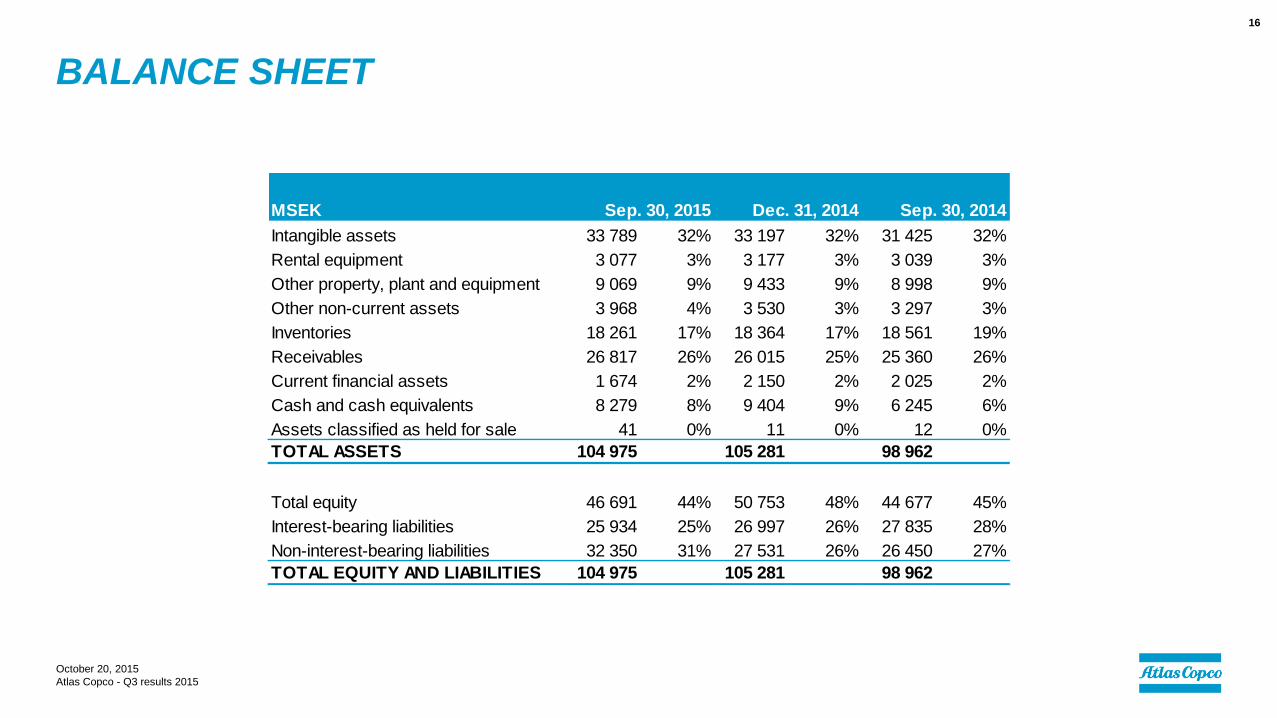
BALANCE SHEET
October 20, 2015
Atlas Copco - Q3 results 2015
16
MSEK
Intangible assets 33 789 32% 33 197 32% 31 425 32%
Rental equipment 3 077 3% 3 177 3% 3 039 3%
Other property, plant and equipment 9 069 9% 9 433 9% 8 998 9%
Other non-current assets 3 968 4% 3 530 3% 3 297 3%
Inventories 18 261 17% 18 364 17% 18 561 19%
Receivables 26 817 26% 26 015 25% 25 360 26%
Current financial assets 1 674 2% 2 150 2% 2 025 2%
Cash and cash equivalents 8 279 8% 9 404 9% 6 245 6%
Assets classified as held for sale 41 0% 11 0% 12 0%
TOTAL ASSETS 104 975 105 281 98 962
Total equity 46 691 44% 50 753 48% 44 677 45%
Interest-bearing liabilities 25 934 25% 26 997 26% 27 835 28%
Non-interest-bearing liabilities 32 350 31% 27 531 26% 26 450 27%
TOTAL EQUITY AND LIABILITIES 104 975 105 281 98 962
Sep. 30, 2015 Dec. 31, 2014 Sep. 30, 2014

MSEK 2015 2014
Operating cash surplus 6 168 5 205
of which depreciation added back 1 148 1 033
Net financial items 130 -288
Taxes paid -1 266 -1 136
Pension funding 7 3
Change in working capital 558 986
Increase in rental equipment, net -181 -408
Cash flows from operating activities 5 416 4 362
Investments of property, plant & eq., net -331 -297
Other investments, net -253 -150
Cash flow from investments -584 -447
Adjustment, currency hedges of loans -211 160
Operating cash flow 4 621 4 075
Company acquisitions/ divestments -115 -1 081
July - September
CASH FLOW
October 20, 2015
Atlas Copco - Q3 results 2015
17

CAPITAL MARKETS DAY 2015
Stockholm, Sweden
November 17, 2015
www.atlascopco.com/CMD2015
October 20, 2015
Atlas Copco - Q3 results 2015
18

NEAR-TERM OUTLOOK
The overall demand for the Group is expected to remain at current level.
October 20, 2015
Atlas Copco - Q3 results 2015
19

COMMITTED TO
SUSTAINABLE PRODUCTIVITY.
October 20, 2015
Atlas Copco - Q3 results 2015
20


CAUTIONARY STATEMENT
“Some statements herein are forward-looking and the actual outcome could be materially
different. In addition to the factors explicitly commented upon, the actual outcome could be
materially and adversely affected by other factors such as the effect of economic conditions,
exchange-rate and interest-rate movements, political risks, the impact of competing products
and their pricing, product development, commercialization and technological difficulties, supply
disturbances, and major customer credit losses.”
October 20, 2015
Atlas Copco - Q3 results 2015
22