commercialization of crab and lobster waste into value ... · commercialization of crab and lobster...
TRANSCRIPT
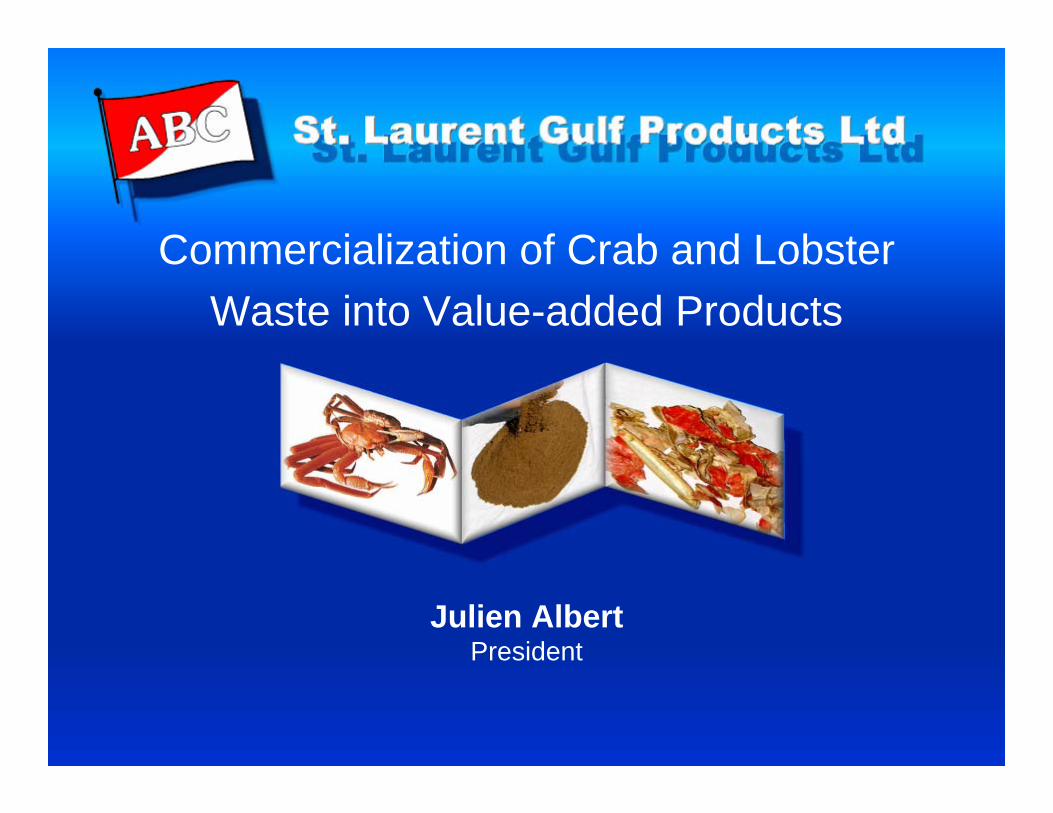
Commercialization of Crab and Lobster Waste into Value-added Products
Julien AlbertPresident
A New Reality
Because of declining natural fishery resources and increasing consumer demand for fishery and aquacultural products, it is no longer practical to discard wastes from crab, lobster and shrimp processing plants, especially when a significant amount of valuable raw materials can be recovered and used to produce value-added new products and functional ingredients.
Presentation
• Introduction• SLGP: Crustacean Waste Processor• Crab Waste Processing
– Benefits– Pitfalls
• Conclusions

Presentation
• Introduction
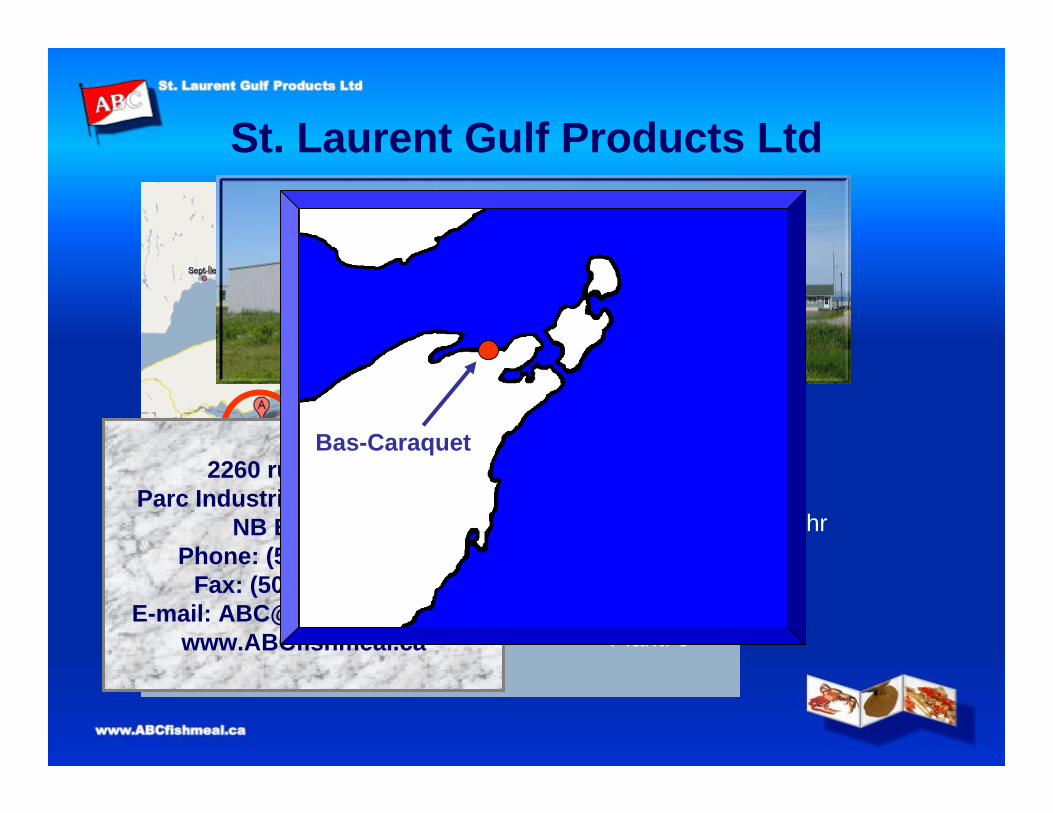
St. Laurent Gulf Products Ltd
•Plant built in 1965•Operating capacity
Herring: 23 MT/hrCrustacean: 7 MT/hr
•Employees: 13Administration: 3Research: 1Plant: 9
2260 rue du QuaiParc Industriel, Bas Caraquet
NB E1W 5Y3Phone: (506) 727-5465
Fax: (506) 727-4255E-mail: [email protected]
www.ABCfishmeal.ca
Bas-Caraquet
Snow Crab (Chionoecetes opilio)
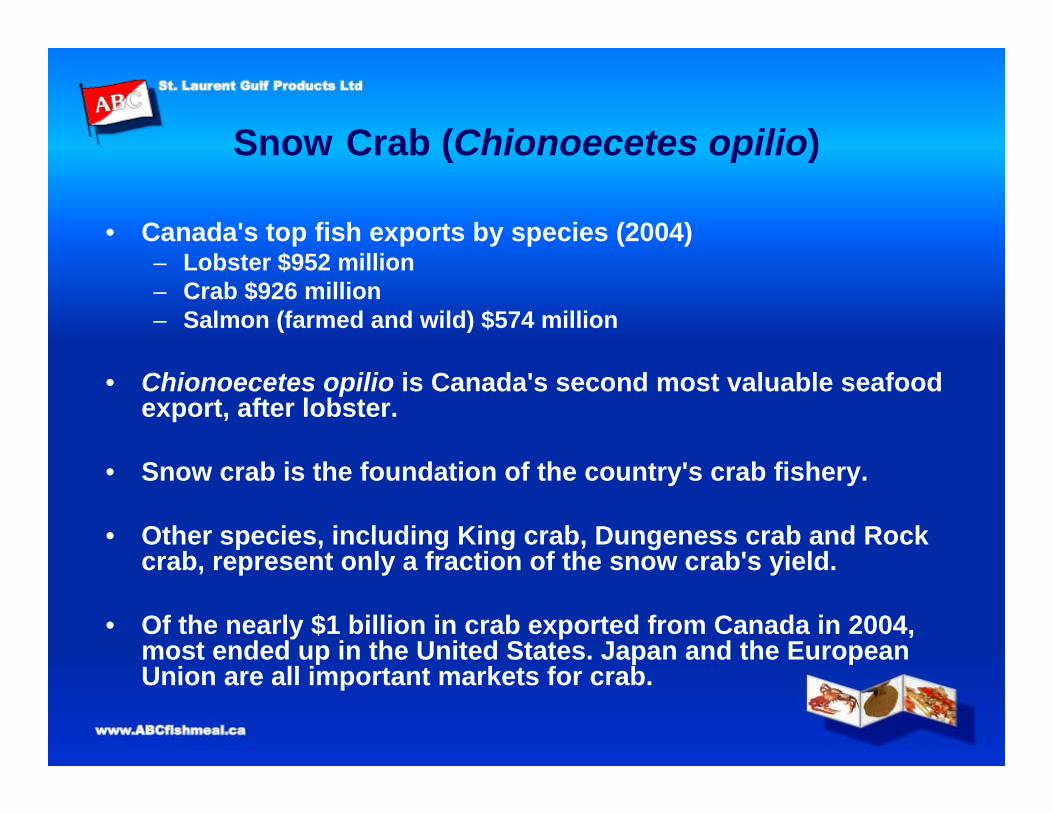
• Canada's top fish exports by species (2004)– Lobster $952 million– Crab $926 million– Salmon (farmed and wild) $574 million
• Chionoecetes opilio is Canada's second most valuable seafood export, after lobster.
• Snow crab is the foundation of the country's crab fishery.
• Other species, including King crab, Dungeness crab and Rock crab, represent only a fraction of the snow crab's yield.
• Of the nearly $1 billion in crab exported from Canada in 2004, most ended up in the United States. Japan and the European Union are all important markets for crab.

Presentation
• Introduction
Presentation
• Introduction
• SLGP: Crustacean Waste Processor
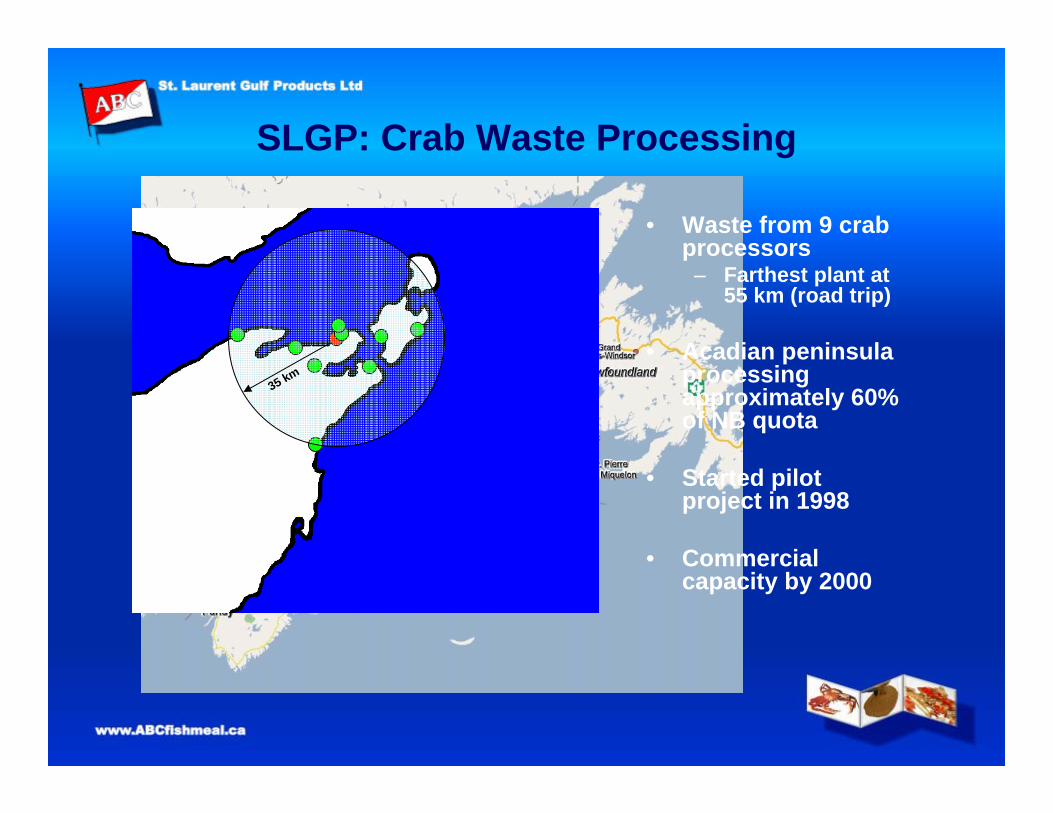
SLGP: Crab Waste Processing
• Waste from 9 crab processors
– Farthest plant at 55 km (road trip)
• Acadian peninsula processing approximately 60% of NB quota
• Started pilot project in 1998
• Commercial capacity by 2000
35 km
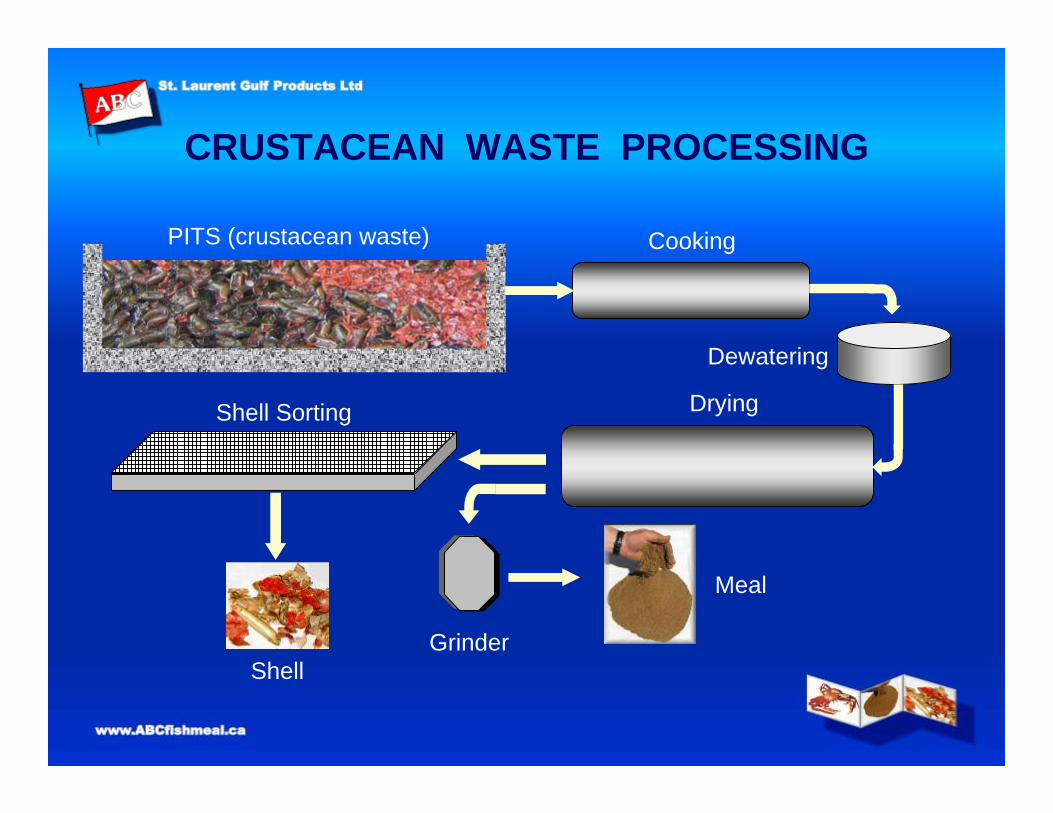
CRUSTACEAN WASTE PROCESSING
PITS (crustacean waste) Cooking
Dewatering
DryingShell Sorting
ShellGrinder
Meal
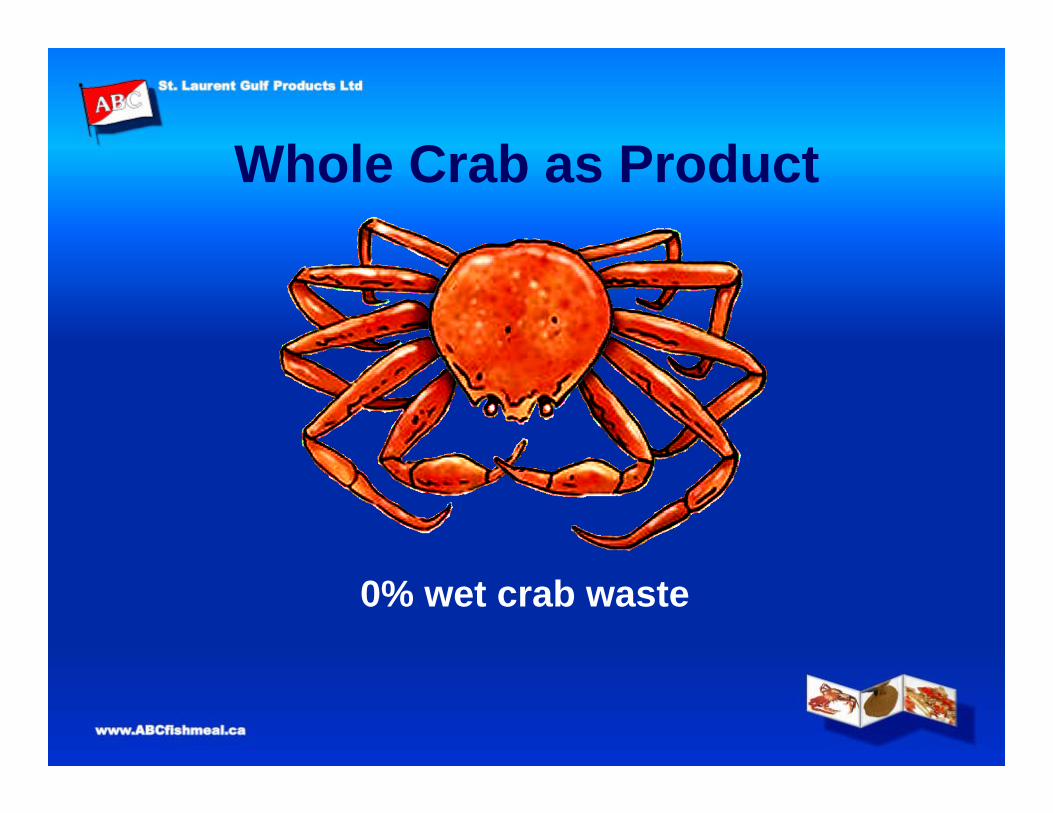
Whole Crab as Product
0% wet crab waste
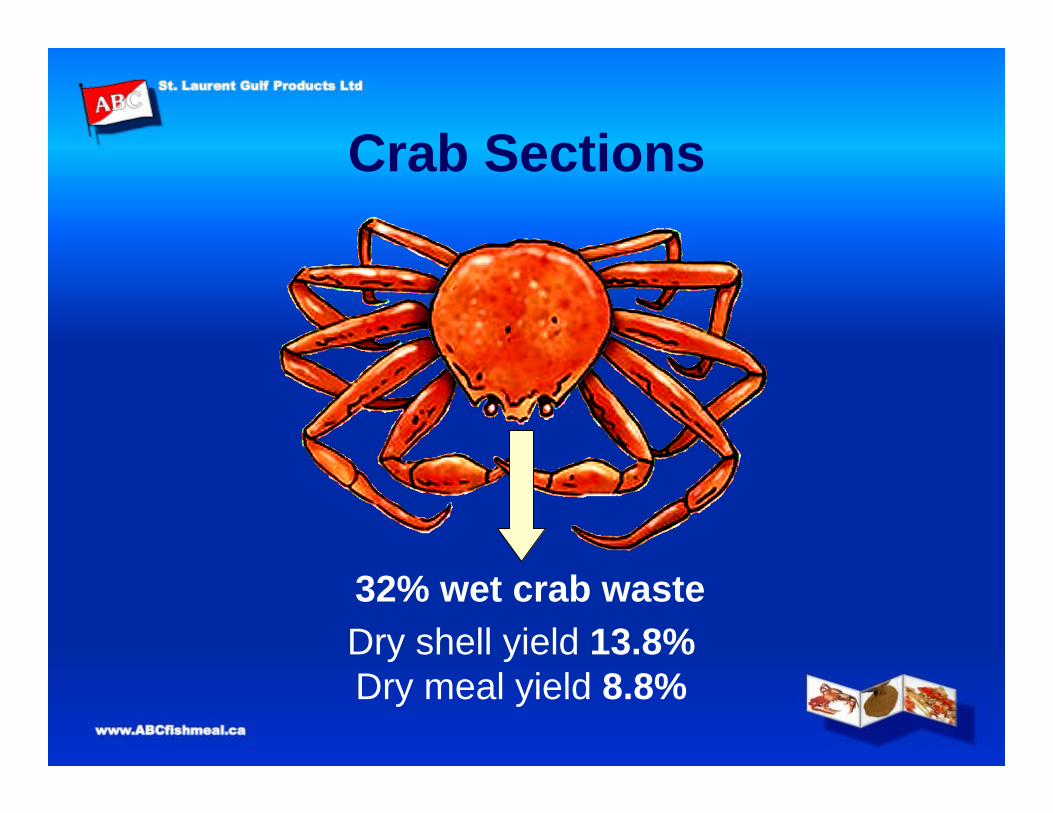
Crab Sections
32% wet crab wasteDry shell yield 13.8%Dry meal yield 8.8%
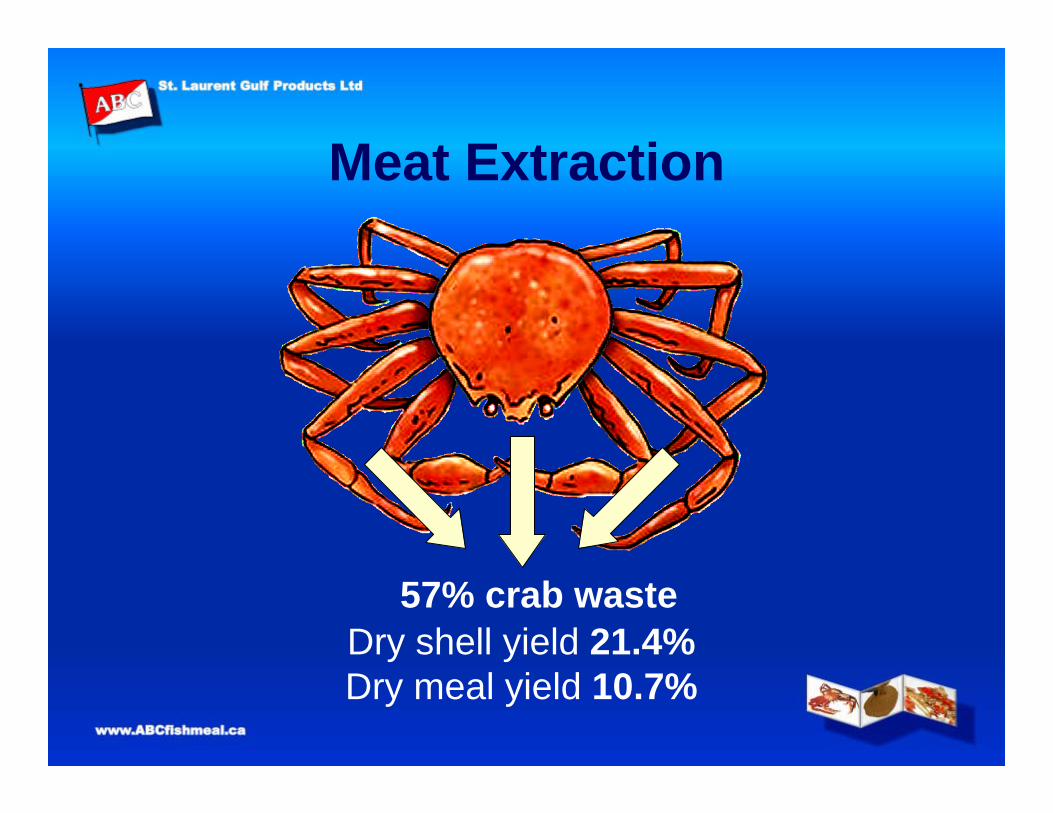
Meat Extraction
57% crab wasteDry shell yield 21.4%Dry meal yield 10.7%
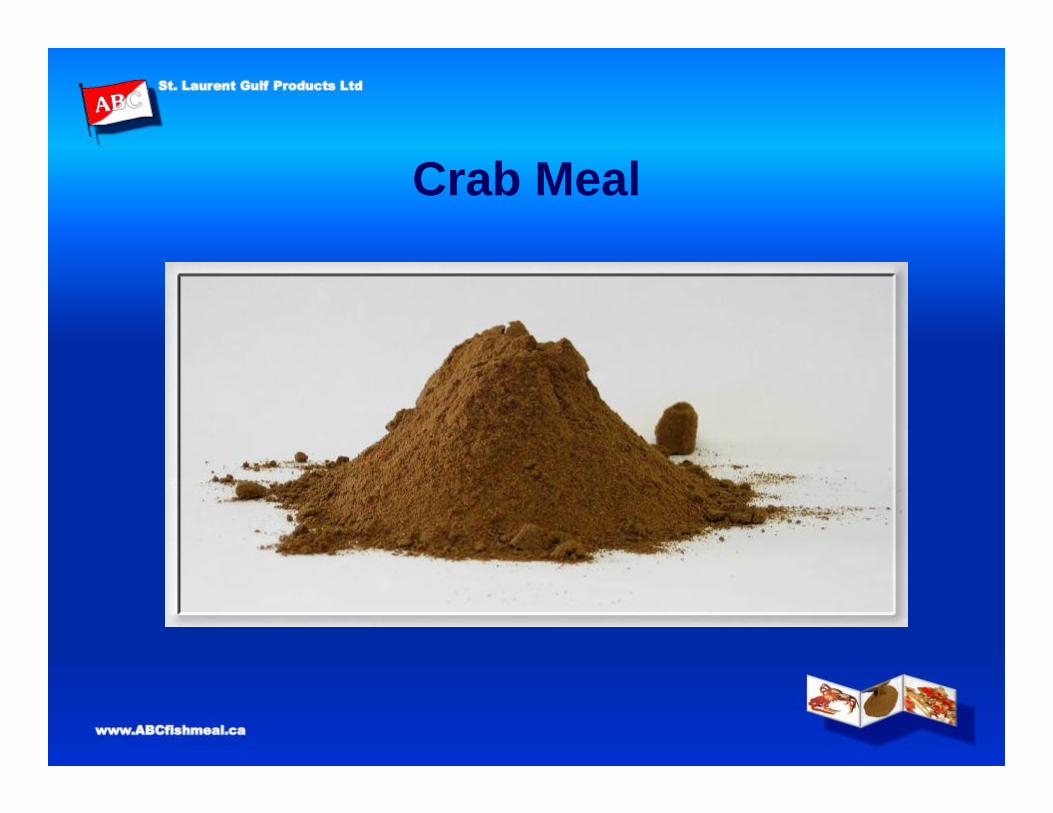
Crab Meal
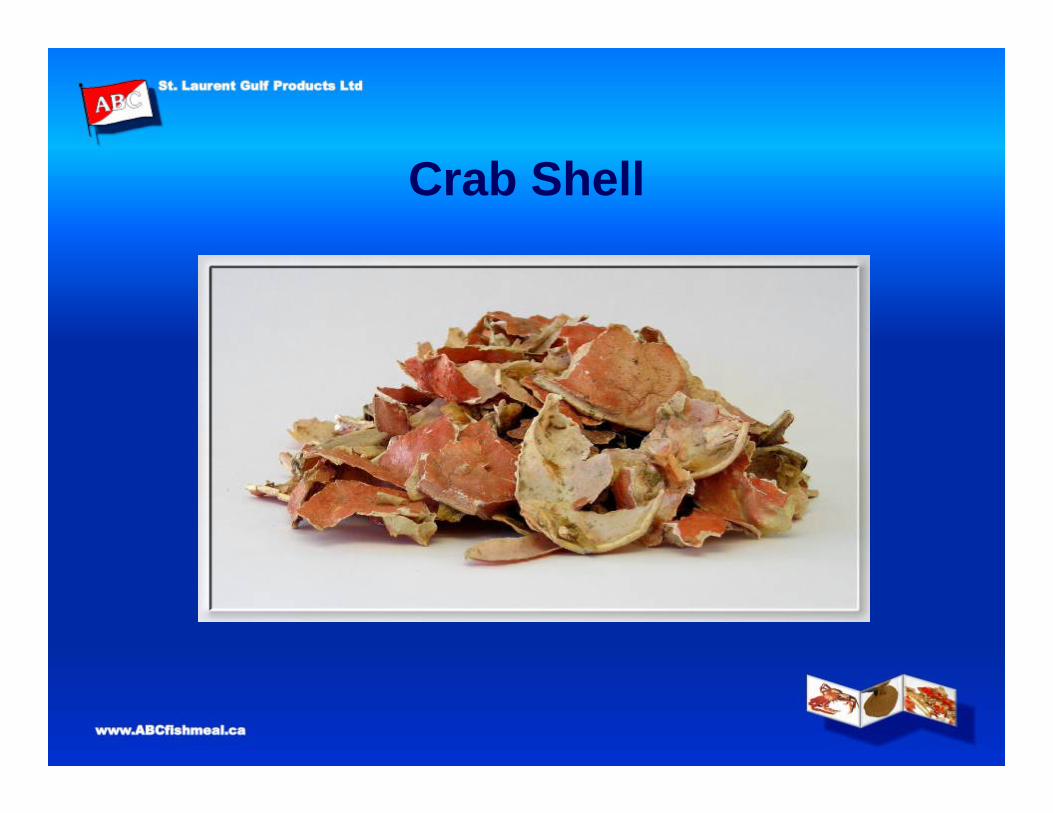
Crab Shell
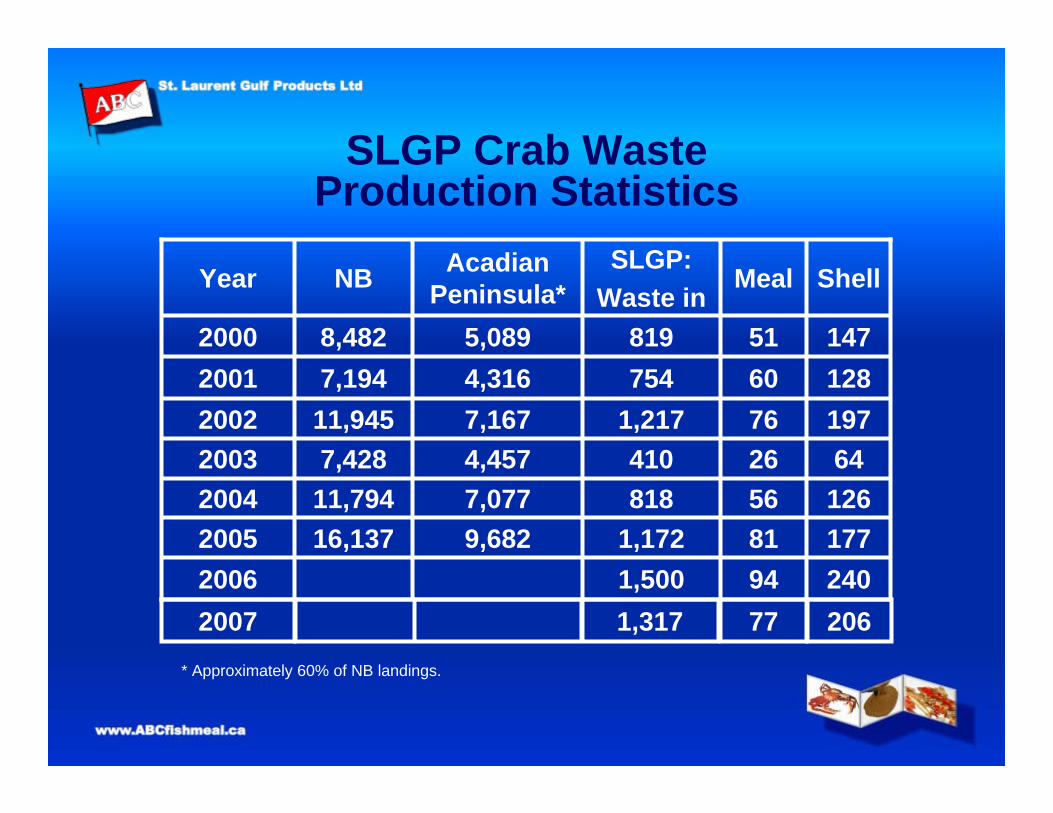
SLGP Crab WasteProduction Statistics
* Approximately 60% of NB landings.
240941,5002006177811,1729,68216,1372005126568187,07711,794200464264104,4577,4282003197761,2177,16711,9452002128607544,3167,1942001147518195,0898,4822000
ShellMealSLGP:
Waste inAcadian
Peninsula*NBYear
2007 1,317 77 206
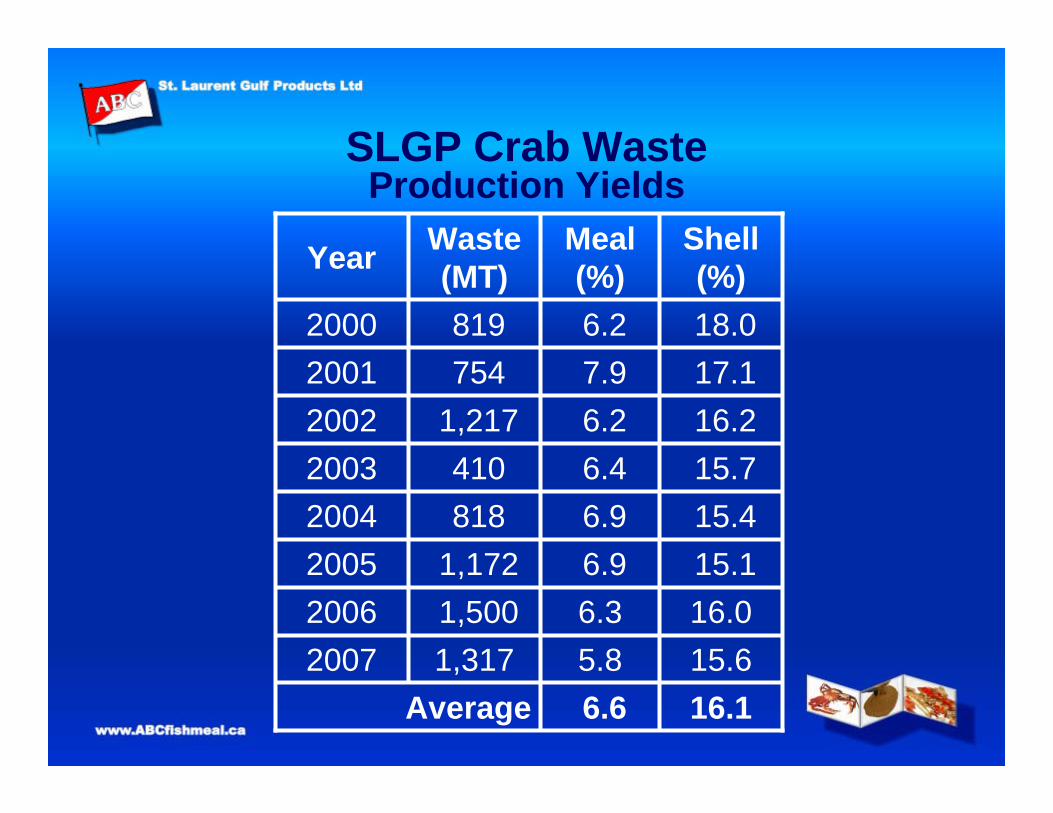
SLGP Crab WasteProduction Yields
16.06.31,500 2006
16.16.6 Average15.6 5.81,317 2007
15.1 6.9 1,172 200515.4 6.9 818 200415.7 6.4 410 2003
6.2 7.9 6.2
Meal (%)
Shell (%)
Waste (MT)Year
200220012000
16.2 1,217 17.1 754 18.0 819
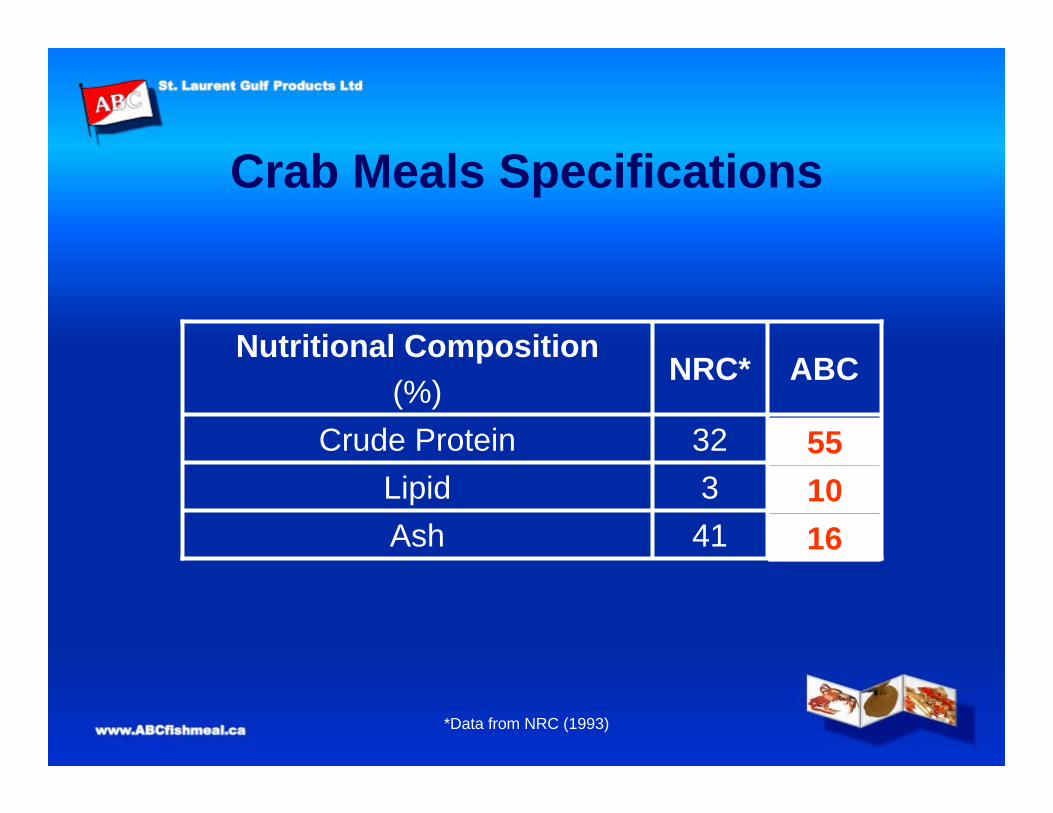
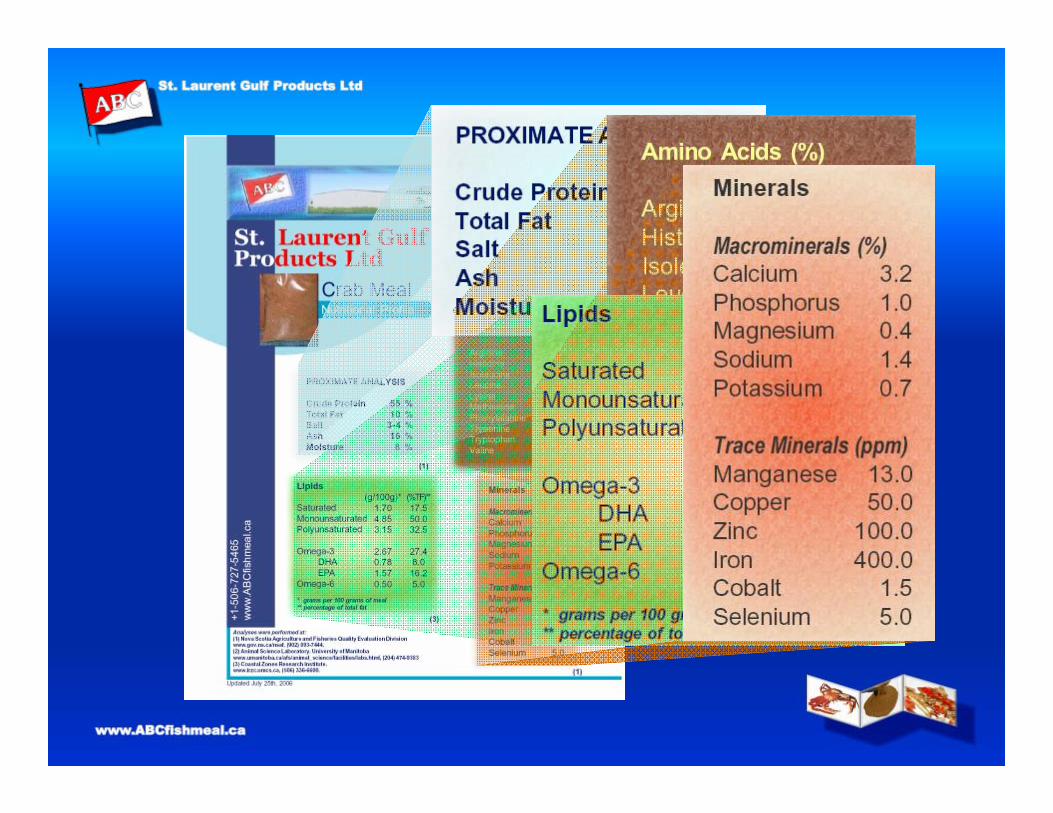
Crab Meals Specifications
ABCNRC*Nutritional Composition
(%)
AshLipid
Crude Protein
16411035532
*Data from NRC (1993)
551016
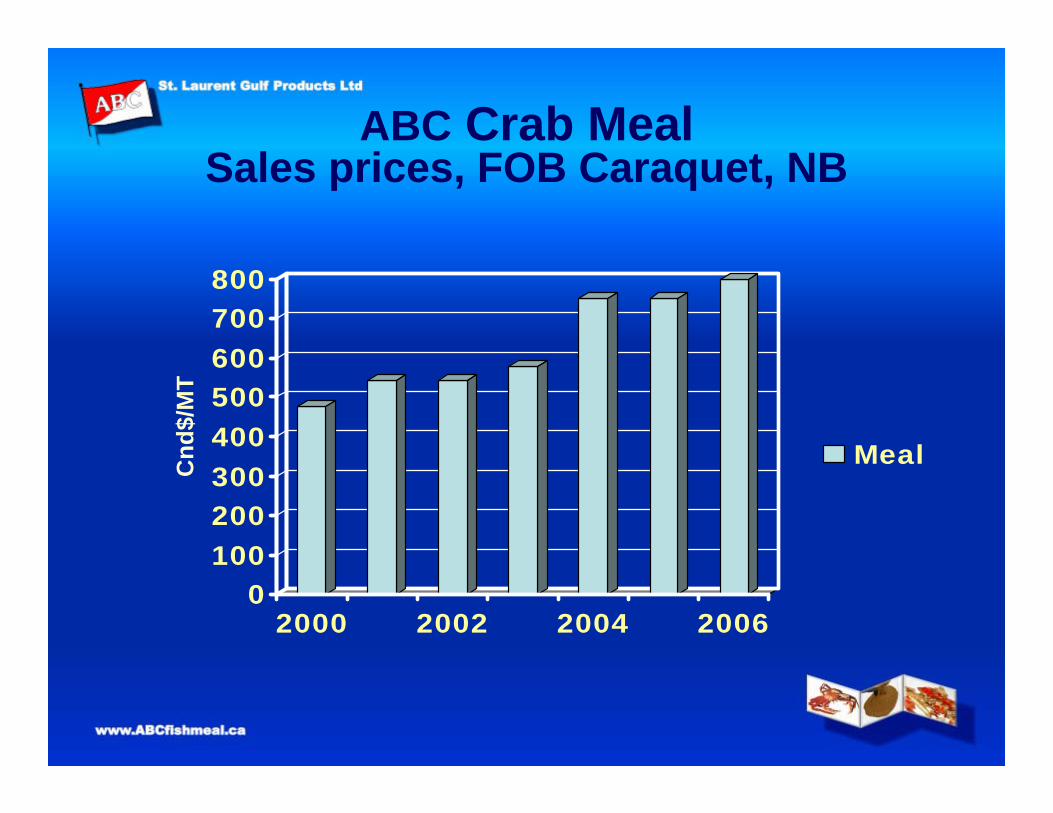
ABC Crab MealSales prices, FOB Caraquet, NB
0100200300400500600700800
2000 2002 2004 2006
MealCnd
$/M
T
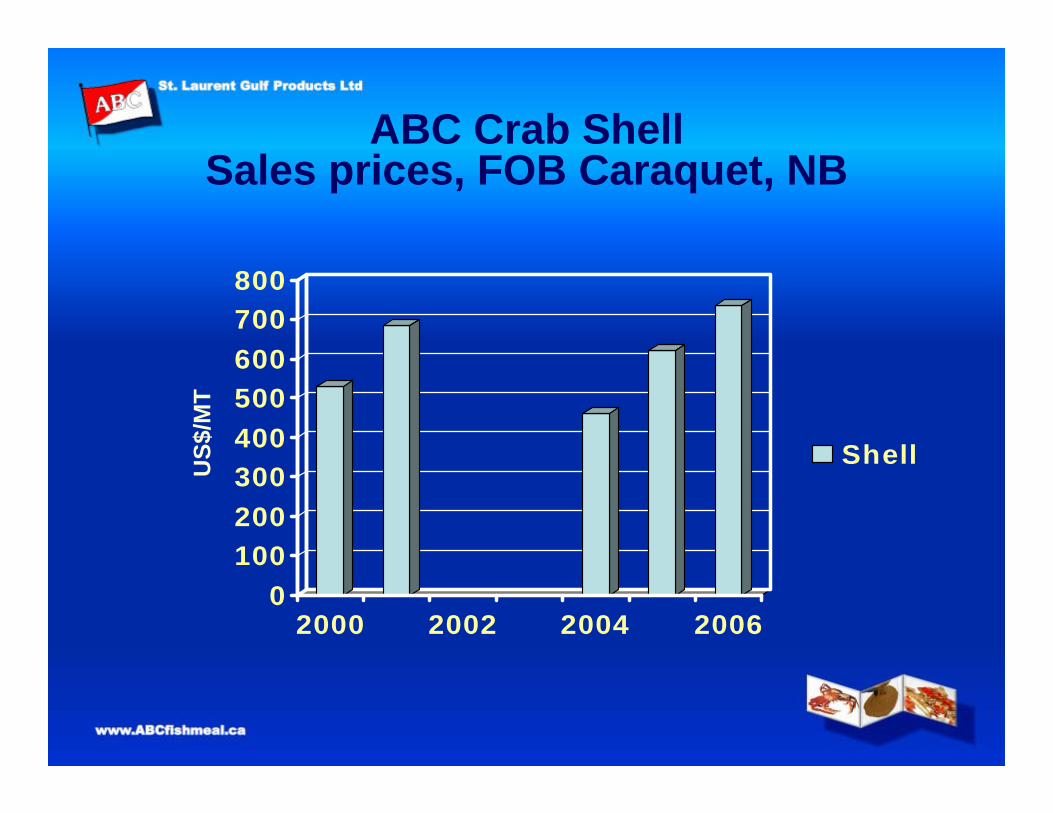
ABC Crab ShellSales prices, FOB Caraquet, NB
0100200300400500600700800
2000 2002 2004 2006
ShellUS$
/MT
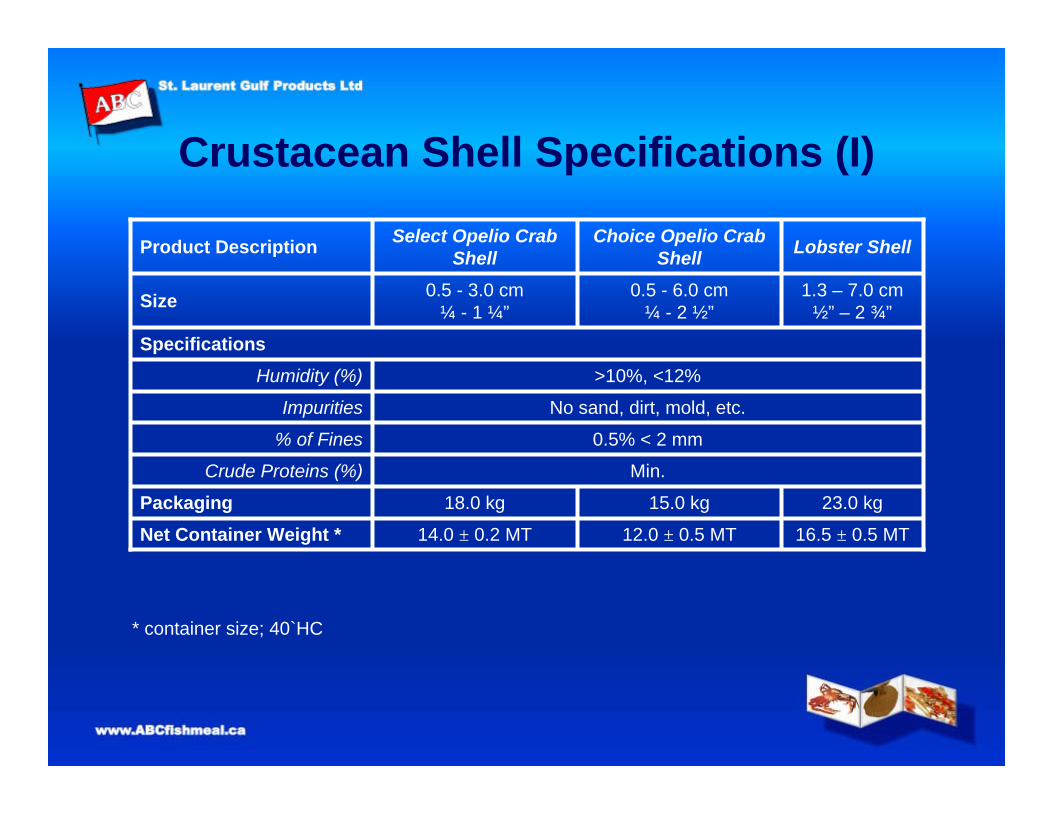
Crustacean Shell Specifications (I)
16.5 ± 0.5 MT12.0 ± 0.5 MT14.0 ± 0.2 MTNet Container Weight *23.0 kg15.0 kg18.0 kgPackaging
Min.Crude Proteins (%)
0.5% < 2 mm% of Fines
No sand, dirt, mold, etc.Impurities
>10%, <12%Humidity (%)
Specifications
1.3 – 7.0 cm½” – 2 ¾”
0.5 - 6.0 cm¼ - 2 ½”
0.5 - 3.0 cm¼ - 1 ¼”Size
Lobster ShellChoice Opelio Crab Shell
Select Opelio Crab ShellProduct Description
* container size; 40`HC
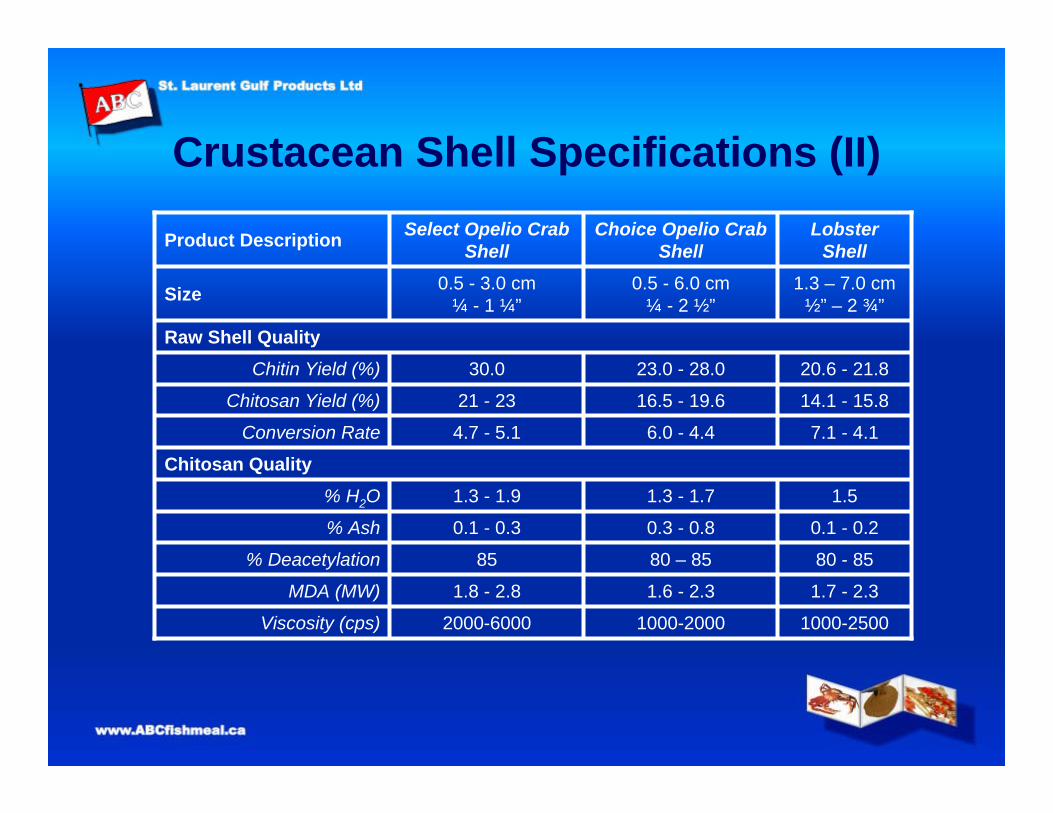
Crustacean Shell Specifications (II)
1000-25001000-20002000-6000Viscosity (cps)
1.7 - 2.31.6 - 2.31.8 - 2.8MDA (MW)
80 - 8580 – 8585% Deacetylation
0.1 - 0.20.3 - 0.80.1 - 0.3% Ash
1.51.3 - 1.71.3 - 1.9% H2O
Chitosan Quality7.1 - 4.16.0 - 4.44.7 - 5.1Conversion Rate
14.1 - 15.816.5 - 19.621 - 23Chitosan Yield (%)
20.6 - 21.823.0 - 28.030.0Chitin Yield (%)
Raw Shell Quality
1.3 – 7.0 cm½” – 2 ¾”
0.5 - 6.0 cm¼ - 2 ½”
0.5 - 3.0 cm¼ - 1 ¼”Size
Lobster Shell
Choice Opelio Crab Shell
Select Opelio Crab ShellProduct Description
Presentation
• Crab Waste Processing– Benefits– Pitfalls
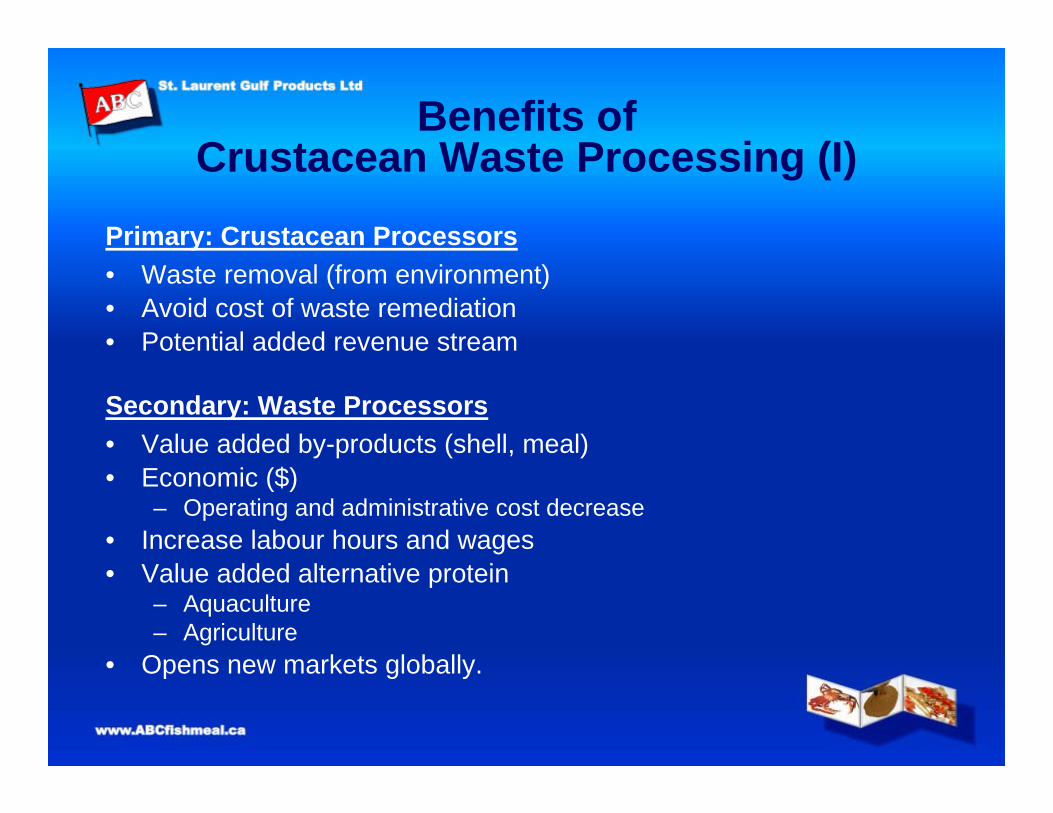
Benefits ofCrustacean Waste Processing (I)
Primary: Crustacean Processors• Waste removal (from environment)• Avoid cost of waste remediation• Potential added revenue stream
Secondary: Waste Processors• Value added by-products (shell, meal)• Economic ($)
– Operating and administrative cost decrease• Increase labour hours and wages• Value added alternative protein
– Aquaculture– Agriculture
• Opens new markets globally.
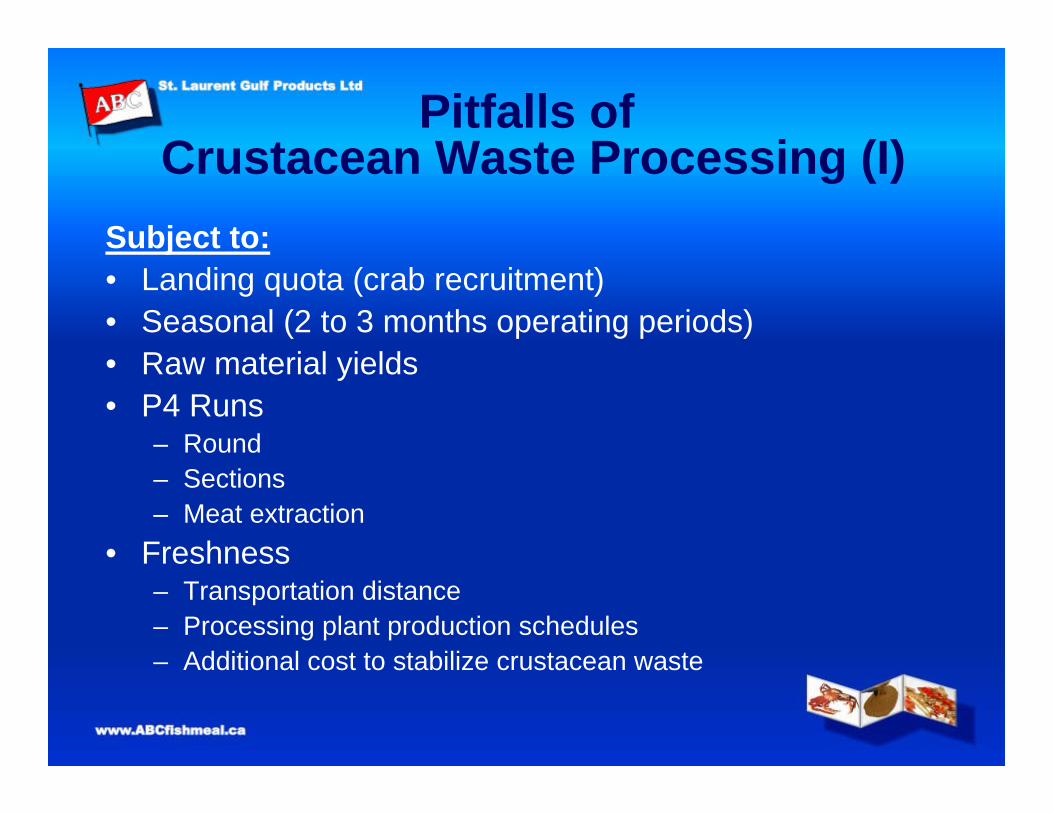
Pitfalls ofCrustacean Waste Processing (I)
Subject to:• Landing quota (crab recruitment)• Seasonal (2 to 3 months operating periods)• Raw material yields• P4 Runs
– Round– Sections– Meat extraction
• Freshness– Transportation distance– Processing plant production schedules– Additional cost to stabilize crustacean waste
Pitfalls ofCrustacean Waste Processing (II)
Subject to:• Global market pricing
– China & Japan biggest buyers– Competitive global shell suppliers– Shell derivatives (chitin, chitosan, glucosamine)– Customs, shell specifications, health certificates– Honouring contracts– High Canadian dollar
Pitfalls ofCrustacean Waste Processing (III)
Subject to:• Transportation costs
– Distance– Fuel costs– Fluctuating international container charges
• Other– Requires minimum volumes per day to operate– Fluctuating fuel prices (60% of operating costs)– Initial high capital costs
Conclusions (I)
Risk INCREASES:• If drastic cuts in crab quotas (biomass
management)• If primary processor sell only round crab• If shell derivatives (chitin, chitosan,
glucosamine) market crashes• If energy cost spike (drying, transportation,
containers)
• If global market flooded with sub-standard shell
Conclusions (II)Risk DECREASES:
• For environmental pollution
• If everyday crustacean processing line added to primary production line
• If Provincial governments regulates primary crab processing to meat extraction versus round or whole.
• If Atlantic Canada crustacean waste processors work together to develop production growth, produce high quality shell and meal, stabilize market price and develop a regional commercial processing and marketing of shell derivatives…we will all succeed!
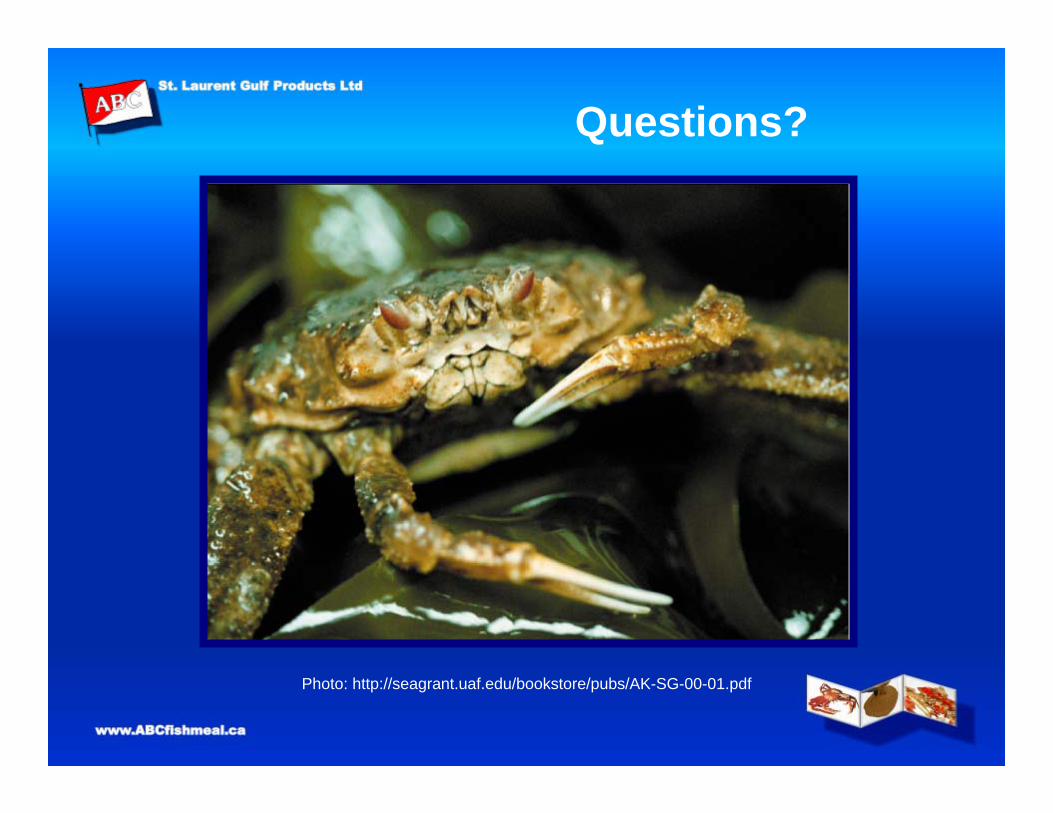
Questions?
Photo: http://seagrant.uaf.edu/bookstore/pubs/AK-SG-00-01.pdf
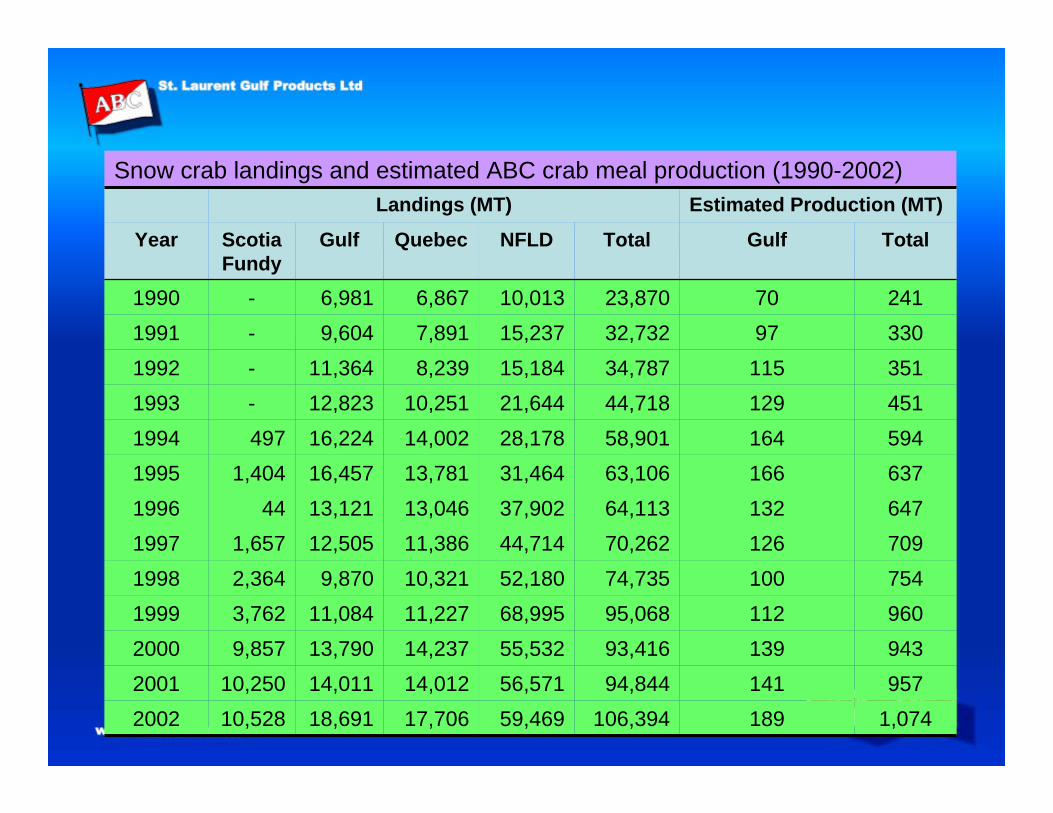
Snow crab landings and estimated ABC crab meal production (1990-2002)Estimated Production (MT)Landings (MT)
1,074189106,39459,46917,70618,69110,528200295714194,84456,57114,01214,01110,250200194313993,41655,53214,23713,7909,857200096011295,06868,99511,22711,0843,762199975410074,73552,18010,3219,8702,364199870912670,26244,71411,38612,5051,657199764713264,11337,90213,04613,12144199663716663,10631,46413,78116,4571,404199559416458,90128,17814,00216,224497199445112944,71821,64410,25112,823-199335111534,78715,1848,23911,364-19923309732,73215,2377,8919,604-19912417023,87010,0136,8676,981-1990
Total Gulf TotalNFLDQuebecGulfScotia Fundy
Year