commercial aircraft market forecast - speednewsspeednews.com/documentaccess/587561785.pdf · 05...
TRANSCRIPT
Bombardier AerospaceCommercial Aircraft Market Forecast 2007-2026
Forward Looking StatementThis presentation includes forward-looking statements. Forward-looking statements generally can be identified by the use of forward-looking terminology such as“may”, “will”, “expect”, “intend”, “estimate”, “anticipate”, “plan”, “foresee”, “believe” or “continue” or the negatives of these terms or variations of them orsimilar terminology. By their nature, forward-looking statements require Bombardier Inc. (the “Corporation”) to make assumptions and are subject to importantknown and unknown risks and uncertainties, which may cause the Corporation’s actual results in future periods to differ materially from forecasted results. Whilethe Corporation considers its assumptions to be reasonable and appropriate based on current information available, there is a risk that they may not be accurate.For additional information with respect to the assumptions underlying the forward-looking statements made in this presentation, please refer to the respectivesections of the Corporation’s aerospace segment (“Aerospace”) and the Corporation’s transportation segment (“Transportation”) in the F06 MD&A.
Certain factors that could cause actual results to differ materially from those anticipated in the forward-looking statements, include risks associated with generaleconomic conditions, risks associated with the Corporation’s business environment (such as the financial condition of the airline industry, government policiesand priorities and competition from other businesses), operational risks (such as regulatory risks and dependence on key personnel, risks associated with doingbusiness with partners, risks involved with developing new products and services, warranty and casualty claim losses, legal risks from legal proceedings, risksrelating to the Corporation’s dependence on certain key customers and key suppliers, risks resulting from fixed-term commitments, human resource risk, andenvironmental risk), financing risks (such as risks resulting from reliance on government support, risks relating to financing support provided on behalf of certaincustomers, risks relating to liquidity and access to capital markets, risks relating to the terms of certain restrictive debt covenants and market risks (includingcurrency, interest rate and commodity pricing risk). - see the Risks and Uncertainties section in the F06 MD&A. Readers are cautioned that the foregoing list offactors that may affect future growth, results and performance is not exhaustive and undue reliance should not be placed on forward-looking statements. Theforward-looking statements set forth herein reflect the Corporation’s expectations as at the date of the F06 MD&A and are subject to change after such date.Unless otherwise required by applicable securities laws, the Corporation expressly disclaims any intention, and assumes no obligation to update or revise anyforward-looking statements, whether as a result of new information, future events or otherwise.
All monetary amounts are expressed in 2007 US dollars unless otherwise stated.
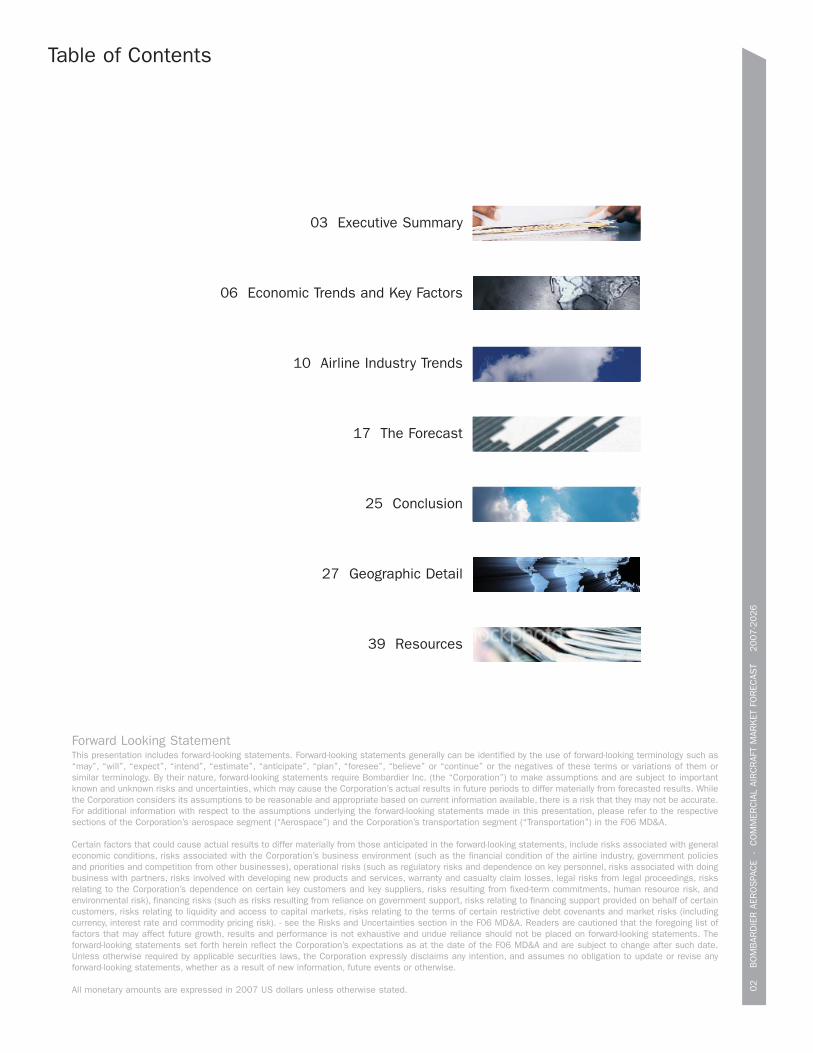
03 Executive Summary
06 Economic Trends and Key Factors
10 Airline Industry Trends
17 The Forecast
25 Conclusion
27 Geographic Detail
39 Resources
Table of Contents
02
B
OM
BAR
DIE
R A
ERO
SPA
CE
- C
OM
MER
CIA
L AI
RC
RAF
T M
ARK
ET F
OR
ECAS
T
2007-2
026

Executive Summary
Bombardier AerospaceCommercial Aircraft Market Forecast
2007-2026
Executive Summary
Welcome to the Bombardier Aerospace, Commercial Aircraft Market Forecast, our viewof the market for the 20 to 149-seat aircraft from 2007 to 2026.
Airline Industry Evolution Continues
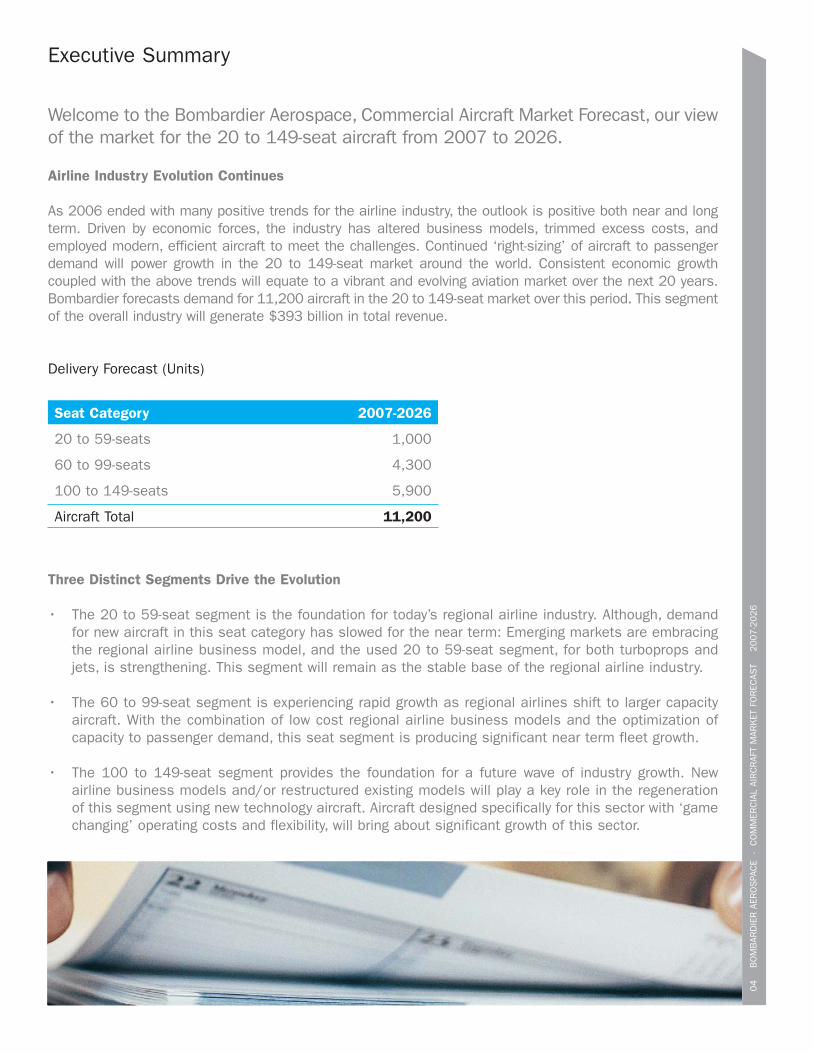
As 2006 ended with many positive trends for the airline industry, the outlook is positive both near and longterm. Driven by economic forces, the industry has altered business models, trimmed excess costs, andemployed modern, efficient aircraft to meet the challenges. Continued ‘right-sizing’ of aircraft to passengerdemand will power growth in the 20 to 149-seat market around the world. Consistent economic growthcoupled with the above trends will equate to a vibrant and evolving aviation market over the next 20 years.Bombardier forecasts demand for 11,200 aircraft in the 20 to 149-seat market over this period. This segmentof the overall industry will generate $393 billion in total revenue.
Delivery Forecast (Units)
Three Distinct Segments Drive the Evolution
• The 20 to 59-seat segment is the foundation for today’s regional airline industry. Although, demandfor new aircraft in this seat category has slowed for the near term: Emerging markets are embracingthe regional airline business model, and the used 20 to 59-seat segment, for both turboprops andjets, is strengthening. This segment will remain as the stable base of the regional airline industry.
• The 60 to 99-seat segment is experiencing rapid growth as regional airlines shift to larger capacityaircraft. With the combination of low cost regional airline business models and the optimization ofcapacity to passenger demand, this seat segment is producing significant near term fleet growth.
• The 100 to 149-seat segment provides the foundation for a future wave of industry growth. Newairline business models and/or restructured existing models will play a key role in the regenerationof this segment using new technology aircraft. Aircraft designed specifically for this sector with ‘gamechanging’ operating costs and flexibility, will bring about significant growth of this sector.
04
B
OM
BAR
DIE
R A
ERO
SPA
CE
- C
OM
MER
CIA
L AI
RC
RAF
T M
ARK
ET F
OR
ECAS
T
2007-2
026
Seat Category 2007-2026
20 to 59-seats 1,000
60 to 99-seats 4,300
100 to 149-seats 5,900
Aircraft Total 11,200
Executive Summary
05
B
OM
BAR
DIE
R A
ERO
SPA
CE
- C
OM
MER
CIA
L AI
RC
RAF
T M
ARK
ET F
OR
ECAS
T
2007-2
026
0
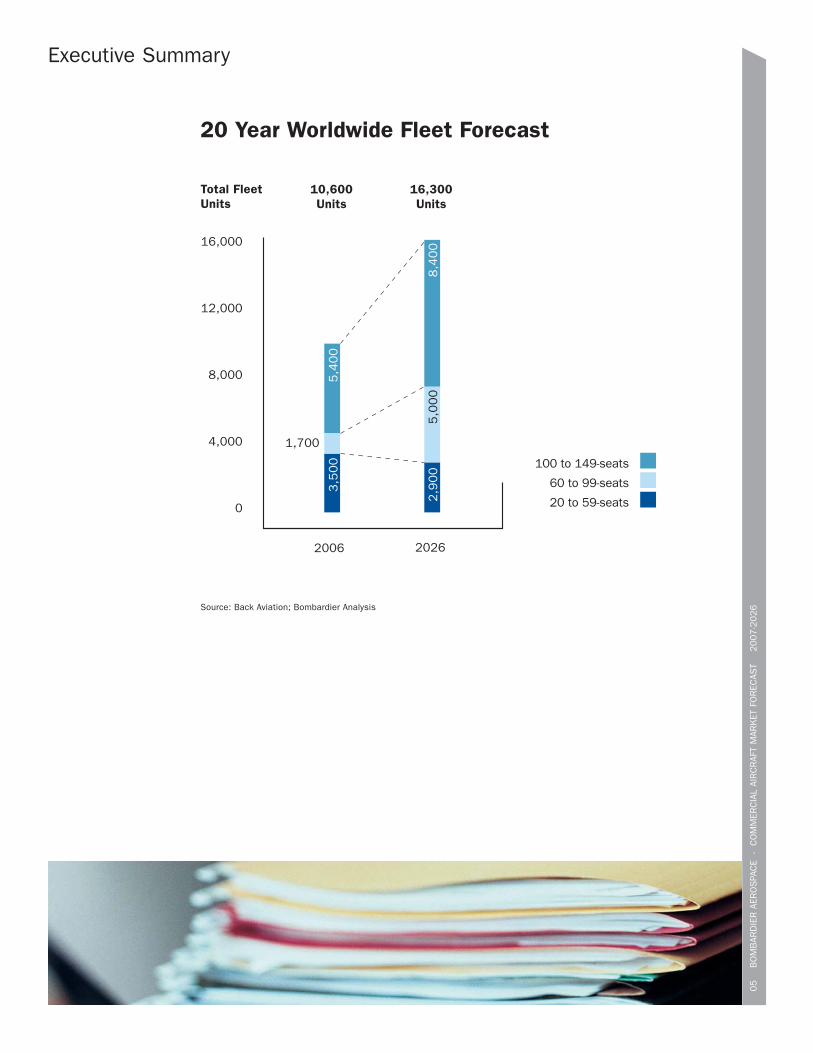
20 Year Worldwide Fleet Forecast
60 to 99-seats
10,600Units
16,300Units
4,000
8,000
12,000
16,000
2006 2026
5,4
00
8,4
00
1,700
3,5
00
5,0
00
2,9
00
Source: Back Aviation; Bombardier Analysis
Total FleetUnits
100 to 149-seats
20 to 59-seats

Economic Trends and Key Factors
Bombardier AerospaceCommercial Aircraft Market Forecast
2007-2026
Economic Trends and Key Factors
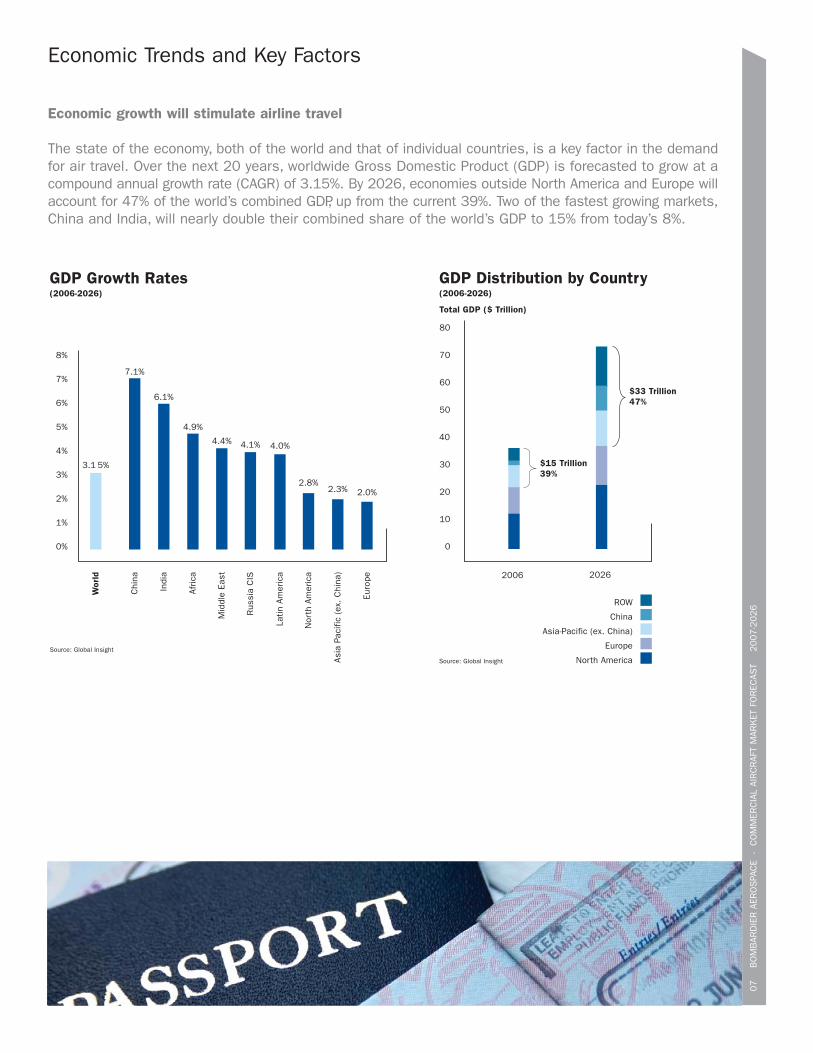
Economic growth will stimulate airline travel
The state of the economy, both of the world and that of individual countries, is a key factor in the demandfor air travel. Over the next 20 years, worldwide Gross Domestic Product (GDP) is forecasted to grow at acompound annual growth rate (CAGR) of 3.15%. By 2026, economies outside North America and Europe willaccount for 47% of the world’s combined GDP, up from the current 39%. Two of the fastest growing markets,China and India, will nearly double their combined share of the world’s GDP to 15% from today’s 8%.
07
B
OM
BAR
DIE
R A
ERO
SPA
CE
- C
OM
MER
CIA
L AI
RC
RAF
T M
ARK
ET F
OR
ECAS
T
2007-2
026
Source: Global Insight
0
GDP Distribution by Country(2006-2026)
Asia-Pacific (ex. China)
China
Europe
ROW
North America
Total GDP ($ Trillion)
$33 Trillion47%
$15 Trillion39%
10
20
30
50
40
60
70
80
2006 2026
GDP Growth Rates (2006-2026)
Source: Global Insight
1%
0%
2%
3%
4%
8%
5%
6%
7%
Wor
ld
Latin
Am
eric
a
3.1 5%
Afric
a
4.9%
Asia
Pac
ific
(ex.
Chi
na)
2.3%
Indi
a
6.1%
Chi
na
7.1%
4.0%
Mid
dle
East
4.4%
Nor
th A
mer
ica
2.8%
Euro
pe
2.0%
Rus
sia
CIS
4.1%
08
B
OM
BAR
DIE
R A
ERO
SPA
CE
- C
OM
MER
CIA
L AI
RC
RAF
T M
ARK
ET F
OR
ECAS
T
2007-2
026
Economic Trends and Key Factors
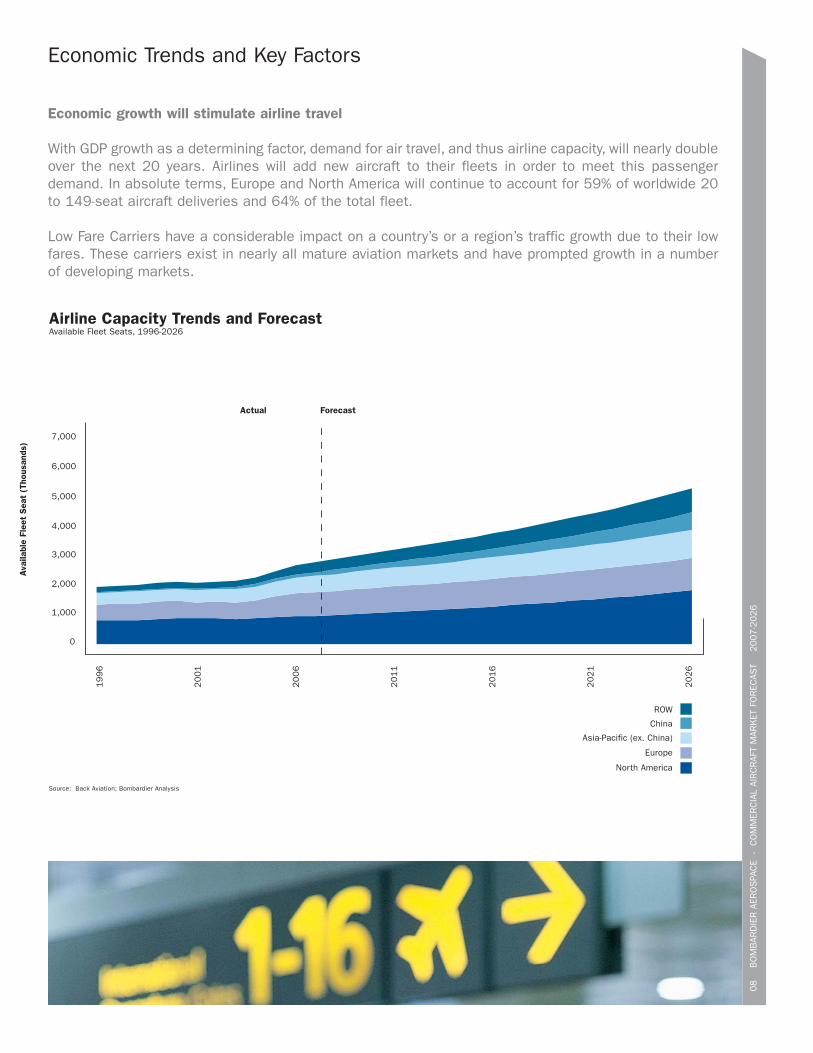
Economic growth will stimulate airline travel
With GDP growth as a determining factor, demand for air travel, and thus airline capacity, will nearly doubleover the next 20 years. Airlines will add new aircraft to their fleets in order to meet this passengerdemand. In absolute terms, Europe and North America will continue to account for 59% of worldwide 20to 149-seat aircraft deliveries and 64% of the total fleet.
Low Fare Carriers have a considerable impact on a country’s or a region’s traffic growth due to their lowfares. These carriers exist in nearly all mature aviation markets and have prompted growth in a numberof developing markets.
Ava
ilabl
e Fl
eet
Sea
t (T
hous
ands
)
0
2,000
3,000
1,000
4,000
5,000
6,000
7,000
19
96
20
01
20
06
20
11
20
16
20
21
20
26
Actual Forecast
Europe
Asia-Pacific (ex. China)
North America
ROW
China
Airline Capacity Trends and ForecastAvailable Fleet Seats, 1996-2026
Source: Back Aviation; Bombardier Analysis
09
B
OM
BAR
DIE
R A
ERO
SPA
CE
- C
OM
MER
CIA
L AI
RC
RAF
T M
ARK
ET F
OR
ECAS
T
2007-2
026
Economic Trends and Key Factors
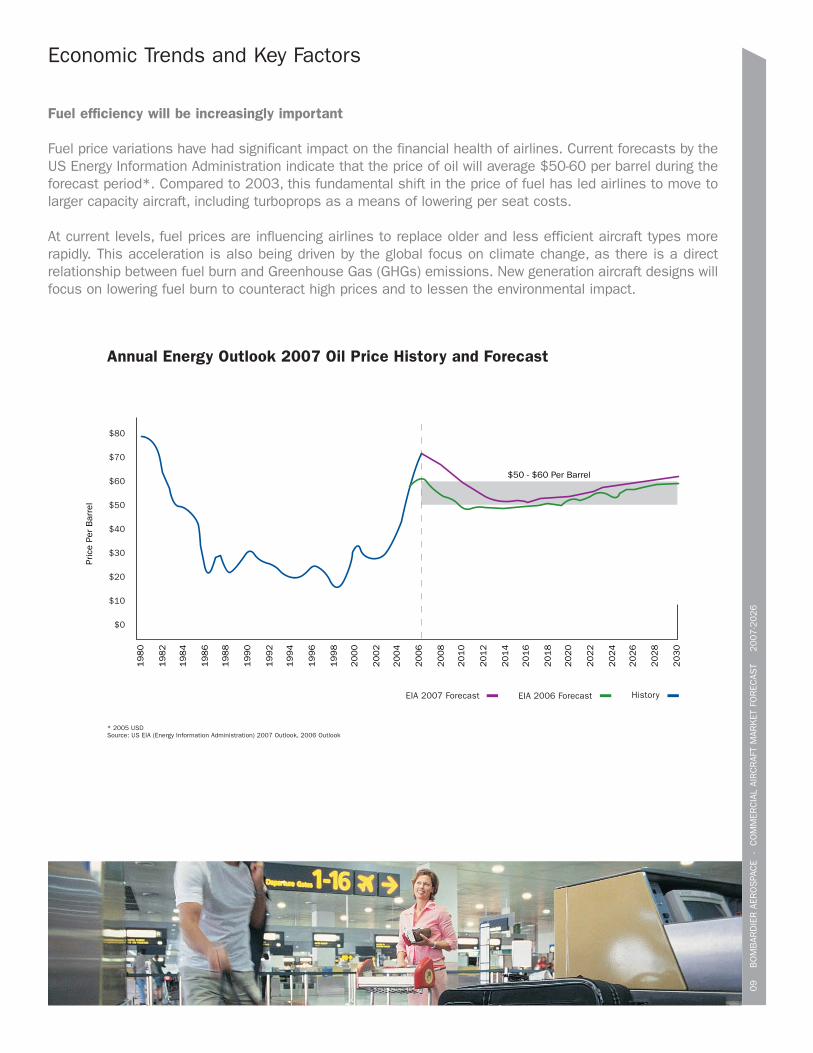
Fuel efficiency will be increasingly important
Fuel price variations have had significant impact on the financial health of airlines. Current forecasts by theUS Energy Information Administration indicate that the price of oil will average $50-60 per barrel during theforecast period*. Compared to 2003, this fundamental shift in the price of fuel has led airlines to move tolarger capacity aircraft, including turboprops as a means of lowering per seat costs.
At current levels, fuel prices are influencing airlines to replace older and less efficient aircraft types morerapidly. This acceleration is also being driven by the global focus on climate change, as there is a directrelationship between fuel burn and Greenhouse Gas (GHGs) emissions. New generation aircraft designs willfocus on lowering fuel burn to counteract high prices and to lessen the environmental impact.
Annual Energy Outlook 2007 Oil Price History and Forecast
* 2005 USDSource: US EIA (Energy Information Administration) 2007 Outlook, 2006 Outlook
$10
$0
$20
$30
$40
$80
$50
$60
$70
1980
Pric
e Pe
r B
arre
l
$50 - $60 Per Barrel
1982
1984
1986
1988
1990
1992
1994
1996
1998
2000
2002
2004
2006
2008
2010
2012
2014
2016
2018
2020
2022
2024
2026
2028
2030
HistoryEIA 2006 ForecastEIA 2007 Forecast
Airline Industry Trends
Bombardier AerospaceCommercial Aircraft Market Forecast
2007-2026
11
B
OM
BAR
DIE
R A
ERO
SPA
CE
- C
OM
MER
CIA
L AI
RC
RAF
T M
ARK
ET F
OR
ECAS
T
2007-2
026
Airline Industry Trends
Airline Economics
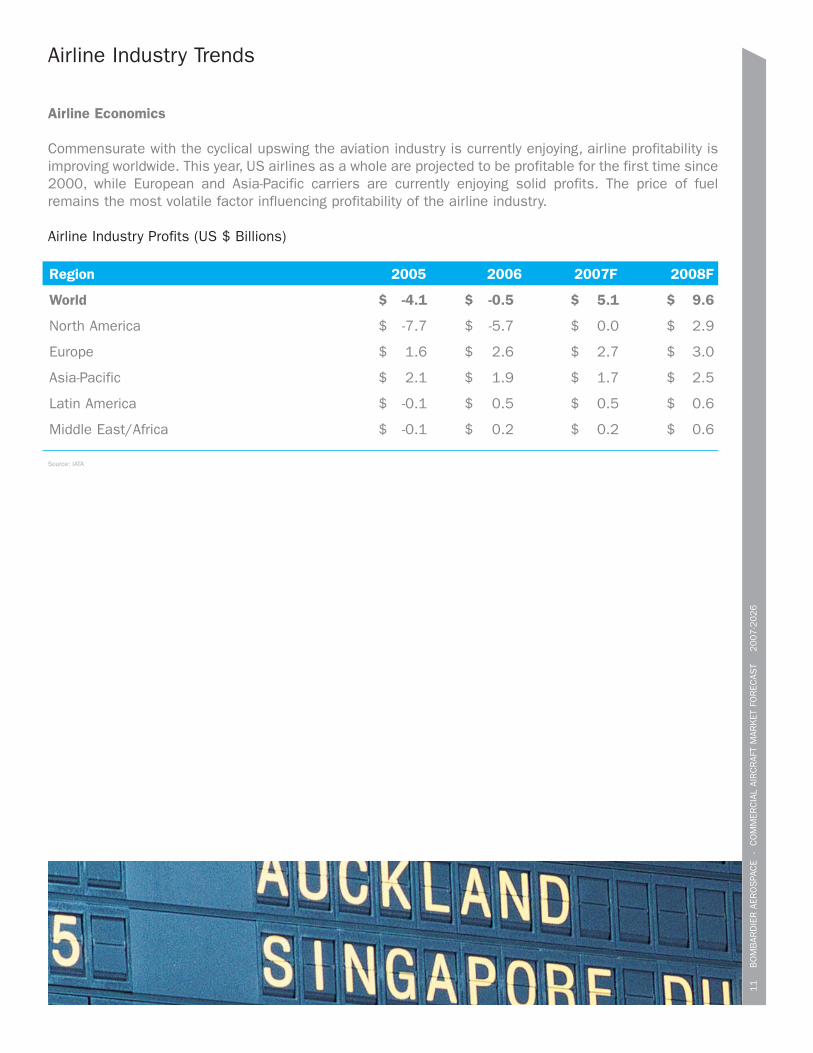
Commensurate with the cyclical upswing the aviation industry is currently enjoying, airline profitability isimproving worldwide. This year, US airlines as a whole are projected to be profitable for the first time since2000, while European and Asia-Pacific carriers are currently enjoying solid profits. The price of fuelremains the most volatile factor influencing profitability of the airline industry.
Airline Industry Profits (US $ Billions)
Region 2005 2006 2007F 2008F
World $ -4.1 $ -0.5 $ 5.1 $ 9.6
North America $ -7.7 $ -5.7 $ 0.0 $ 2.9
Europe $ 1.6 $ 2.6 $ 2.7 $ 3.0
Asia-Pacific $ 2.1 $ 1.9 $ 1.7 $ 2.5
Latin America $ -0.1 $ 0.5 $ 0.5 $ 0.6
Middle East/Africa $ -0.1 $ 0.2 $ 0.2 $ 0.6
Source: IATA
12
B
OM
BAR
DIE
R A
ERO
SPA
CE
- C
OM
MER
CIA
L AI
RC
RAF
T M
ARK
ET F
OR
ECAS
T
2007-2
026
Airline Industry Trends
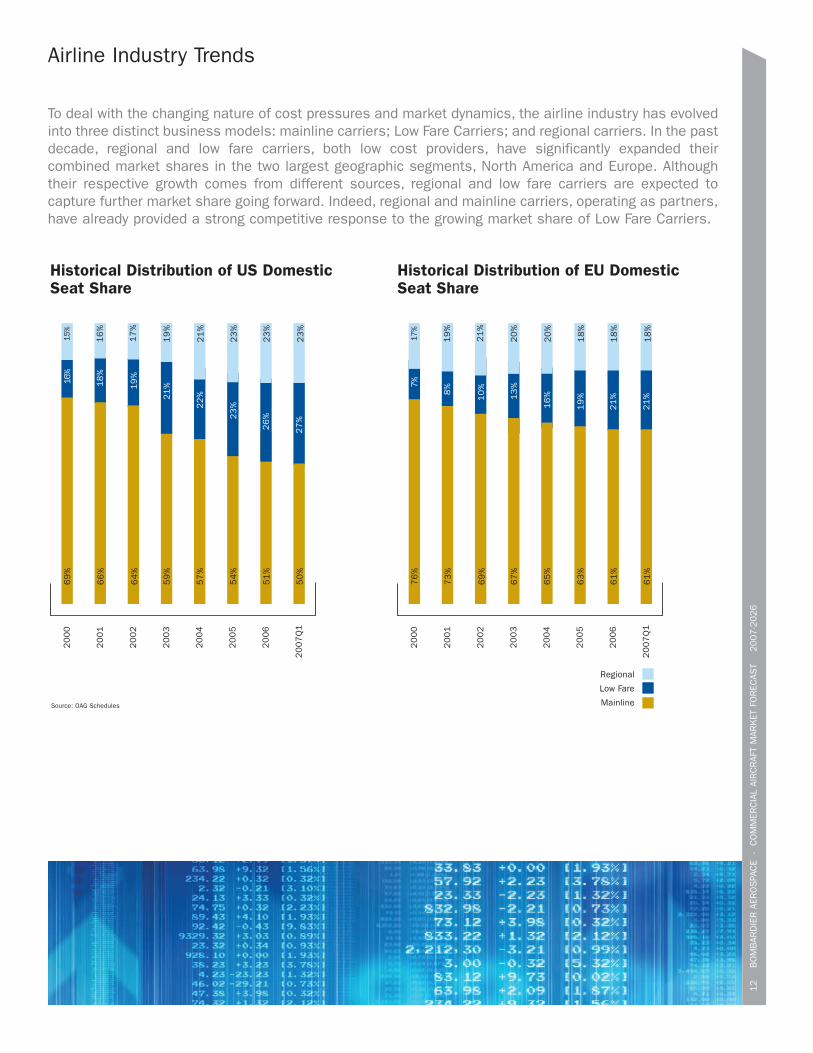
To deal with the changing nature of cost pressures and market dynamics, the airline industry has evolvedinto three distinct business models: mainline carriers; Low Fare Carriers; and regional carriers. In the pastdecade, regional and low fare carriers, both low cost providers, have significantly expanded theircombined market shares in the two largest geographic segments, North America and Europe. Althoughtheir respective growth comes from different sources, regional and low fare carriers are expected tocapture further market share going forward. Indeed, regional and mainline carriers, operating as partners,have already provided a strong competitive response to the growing market share of Low Fare Carriers.
Historical Distribution of US Domestic Seat Share
20
00
20
01
20
02
20
03
20
04
20
05
20
06
20
07
Q1
16%
18
%
19
%
21
%
22
%
23
%
26
%
27
% 21
%
69
%
66
%
64
%
59
%
57
%
54
%
51
%
50
%
15%
16
%
17
%
19
%
21
%
23
%
23
%
23
%
Source: OAG Schedules
Historical Distribution of EU Domestic Seat Share
Mainline
Low Fare
Regional
20
00
20
01
20
02
20
03
20
04
20
05
20
06
20
07
Q1
7%
8%
10
%
13
%
16
%
19
%
21
%
21
%
21
%
76
%
73
%
69
%
67
%
65
%
63
%
61
%
61
%
19
%
21
%
20
%
20
%
18
%
18
%
18
%
17%
13
B
OM
BAR
DIE
R A
ERO
SPA
CE
- C
OM
MER
CIA
L AI
RC
RAF
T M
ARK
ET F
OR
ECAS
T
2007-2
026
Airline Industry Trends
Labour Trends
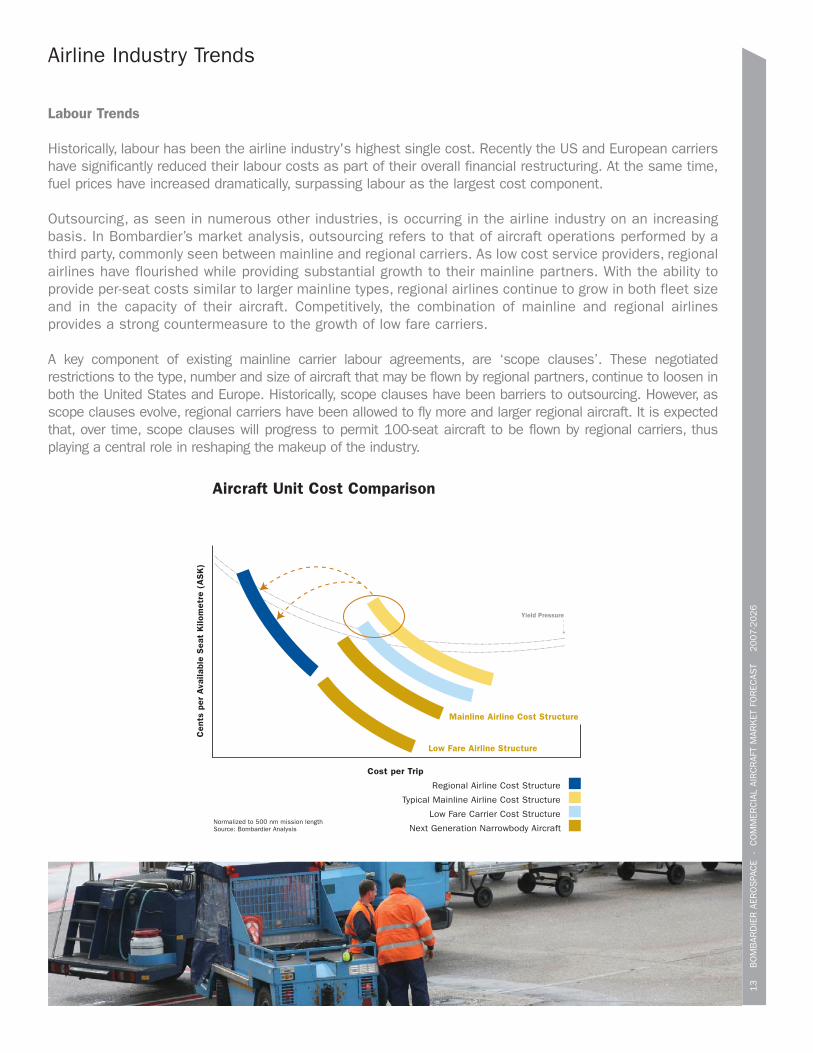
Historically, labour has been the airline industry's highest single cost. Recently the US and European carriershave significantly reduced their labour costs as part of their overall financial restructuring. At the same time,fuel prices have increased dramatically, surpassing labour as the largest cost component.
Outsourcing, as seen in numerous other industries, is occurring in the airline industry on an increasingbasis. In Bombardier’s market analysis, outsourcing refers to that of aircraft operations performed by athird party, commonly seen between mainline and regional carriers. As low cost service providers, regionalairlines have flourished while providing substantial growth to their mainline partners. With the ability toprovide per-seat costs similar to larger mainline types, regional airlines continue to grow in both fleet sizeand in the capacity of their aircraft. Competitively, the combination of mainline and regional airlinesprovides a strong countermeasure to the growth of low fare carriers.
A key component of existing mainline carrier labour agreements, are ‘scope clauses’. These negotiatedrestrictions to the type, number and size of aircraft that may be flown by regional partners, continue to loosen inboth the United States and Europe. Historically, scope clauses have been barriers to outsourcing. However, asscope clauses evolve, regional carriers have been allowed to fly more and larger regional aircraft. It is expectedthat, over time, scope clauses will progress to permit 100-seat aircraft to be flown by regional carriers, thusplaying a central role in reshaping the makeup of the industry.
Regional Airline Cost Structure
Low Fare Carrier Cost Structure
Typical Mainline Airline Cost Structure
Yield Pressure
Cost per Trip
Normalized to 500 nm mission lengthSource: Bombardier Analysis
Cen
ts p
er A
vaila
ble
Sea
t K
ilom
etre
(A
SK
)
Mainline Airline Cost Structure
Low Fare Airline Structure
Next Generation Narrowbody Aircraft
Aircraft Unit Cost Comparison

14
B
OM
BAR
DIE
R A
ERO
SPA
CE
- C
OM
MER
CIA
L AI
RC
RAF
T M
ARK
ET F
OR
ECAS
T
2007-2
026
Airline Industry Trends
Turboprops and Jets
Increasingly focused on cost-optimization, airlines have re-embraced turboprops as the most cost-effectivemethod of serving short haul markets. 2006 was another year of strong turboprop orders, including the re-incorporation of turboprops into the fleet of at least one US mainline airline. New generation turboprops haveintegrated advanced technologies that improve the cabin experience for passengers as well as improve flightoperations for airlines. Turboprops, with fundamentally lower fuel burn than jets, can also play a substantialrole in reducing emissions on short haul routes. Regions that emphasize environmental responsibility arerealizing the advantages turboprops provide. The combination of improved passenger comfort, superior shorthaul economics, and low emissions will keep the market for turboprops strong over the foreseeable future.
Fuel Prices and Turboprop Orders
Source: EIA Outlook, Manufacturer Reports
0
50
Net
Ord
ers
for
Turb
opro
ps
Fuel
Pric
es (
Cen
ts p
er U
SG
)
100
200
150
25
75
125
225
175
2004 200620052001
Turboprop Orders Jet Fuel Price
20032002
20-Year Forecast of 20 to 99-seat AircraftDeliveries by Engine TypeTurboprop: 1,900 Units. Jet: 3,400 Units.
36%
64%
Jet
Turboprop
Source: Bombardier Analysis
15
B
OM
BAR
DIE
R A
ERO
SPA
CE
- C
OM
MER
CIA
L AI
RC
RAF
T M
ARK
ET F
OR
ECAS
T
2007-2
026
Airline Industry Trends
Aviation and the Environment
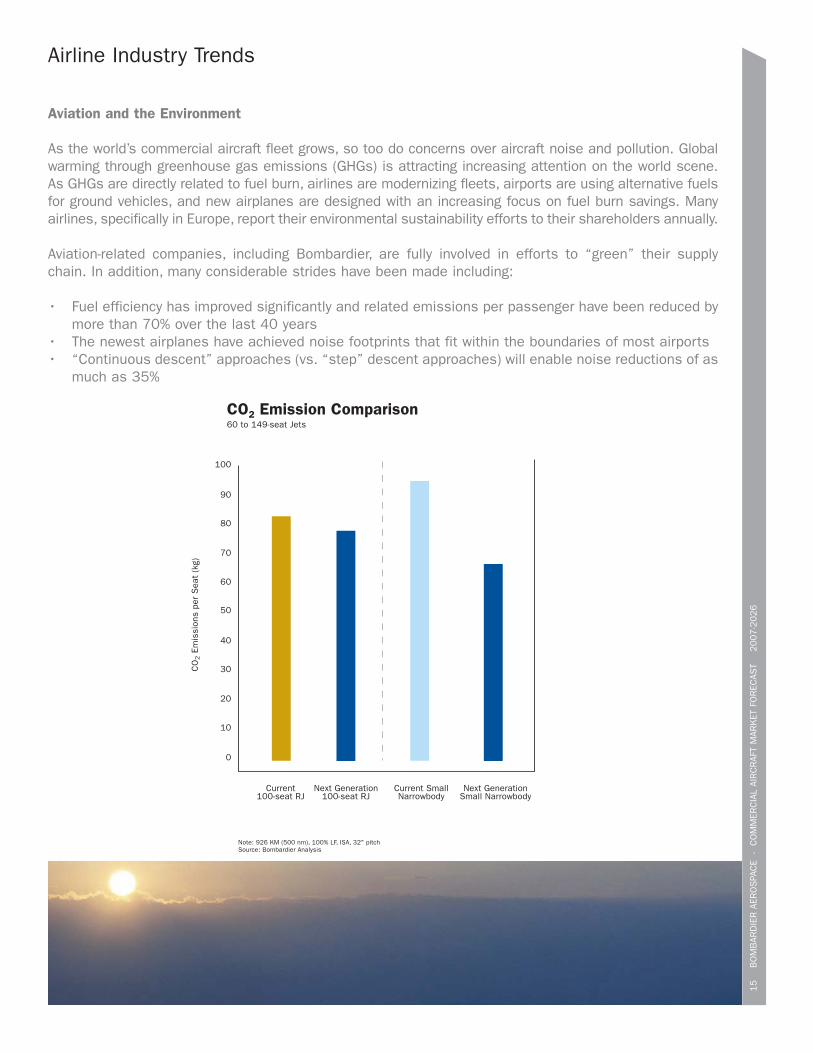
As the world’s commercial aircraft fleet grows, so too do concerns over aircraft noise and pollution. Globalwarming through greenhouse gas emissions (GHGs) is attracting increasing attention on the world scene.As GHGs are directly related to fuel burn, airlines are modernizing fleets, airports are using alternative fuelsfor ground vehicles, and new airplanes are designed with an increasing focus on fuel burn savings. Manyairlines, specifically in Europe, report their environmental sustainability efforts to their shareholders annually.
Aviation-related companies, including Bombardier, are fully involved in efforts to “green” their supplychain. In addition, many considerable strides have been made including:
• Fuel efficiency has improved significantly and related emissions per passenger have been reduced bymore than 70% over the last 40 years
• The newest airplanes have achieved noise footprints that fit within the boundaries of most airports • “Continuous descent” approaches (vs. “step” descent approaches) will enable noise reductions of as
much as 35%
CO2 Emission Comparison60 to 149-seat Jets
Note: 926 KM (500 nm), 100% LF, ISA, 32" pitchSource: Bombardier Analysis
Current100-seat RJ
Next Generation100-seat RJ
Current SmallNarrowbody
Next GenerationSmall Narrowbody
CO
2 E
mis
sion
s pe
r S
eat
(kg)
0
10
30
20
40
50
60
80
70
90
100
16
B
OM
BAR
DIE
R A
ERO
SPA
CE
- C
OM
MER
CIA
L AI
RC
RAF
T M
ARK
ET F
OR
ECAS
T
2007-2
026
Airline Industry Trends
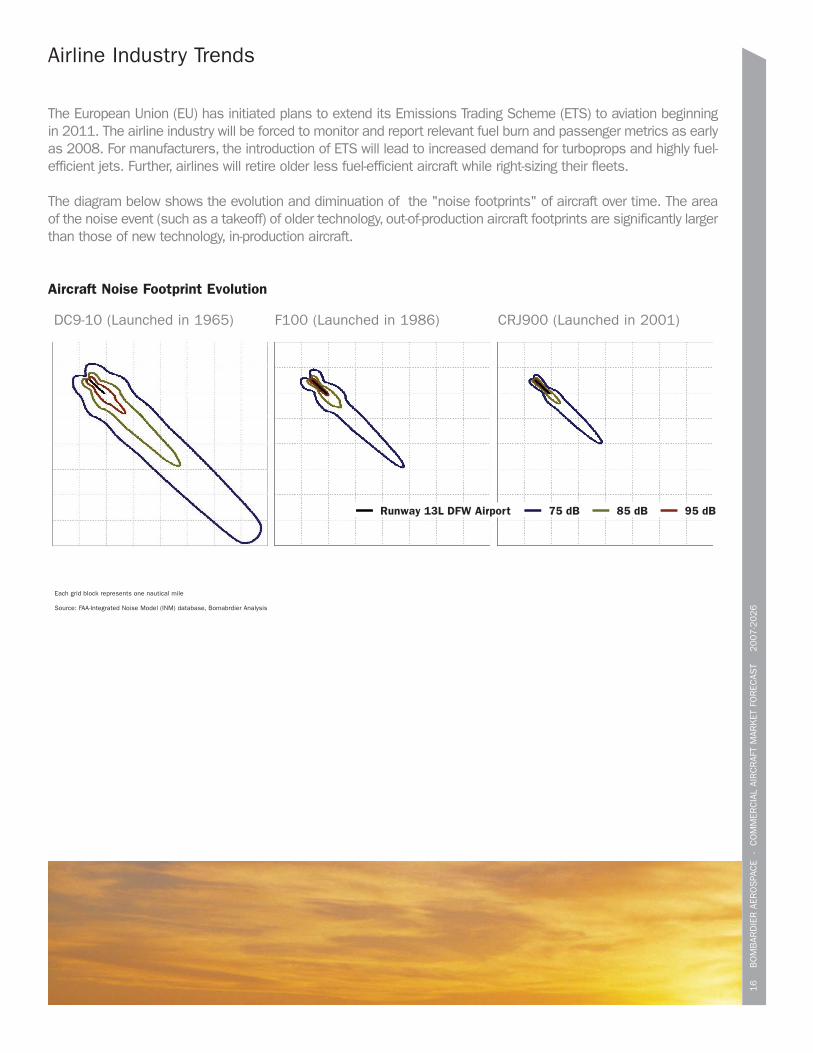
The European Union (EU) has initiated plans to extend its Emissions Trading Scheme (ETS) to aviation beginningin 2011. The airline industry will be forced to monitor and report relevant fuel burn and passenger metrics as earlyas 2008. For manufacturers, the introduction of ETS will lead to increased demand for turboprops and highly fuel-efficient jets. Further, airlines will retire older less fuel-efficient aircraft while right-sizing their fleets.
The diagram below shows the evolution and diminuation of the "noise footprints" of aircraft over time. The areaof the noise event (such as a takeoff) of older technology, out-of-production aircraft footprints are significantly largerthan those of new technology, in-production aircraft.
Aircraft Noise Footprint Evolution
75 dBRunway 13L DFW Airport 85 dB 95 dB
DC9-10 (Launched in 1965) F100 (Launched in 1986) CRJ900 (Launched in 2001)
Each grid block represents one nautical mile
Source: FAA-Integrated Noise Model (INM) database, Bomabrdier Analysis

The Forecast
Bombardier AerospaceCommercial Aircraft Market Forecast
2007-2026
18
B
OM
BAR
DIE
R A
ERO
SPA
CE
- C
OM
MER
CIA
L AI
RC
RAF
T M
ARK
ET F
OR
ECAS
T
2007-2
026
The Forecast
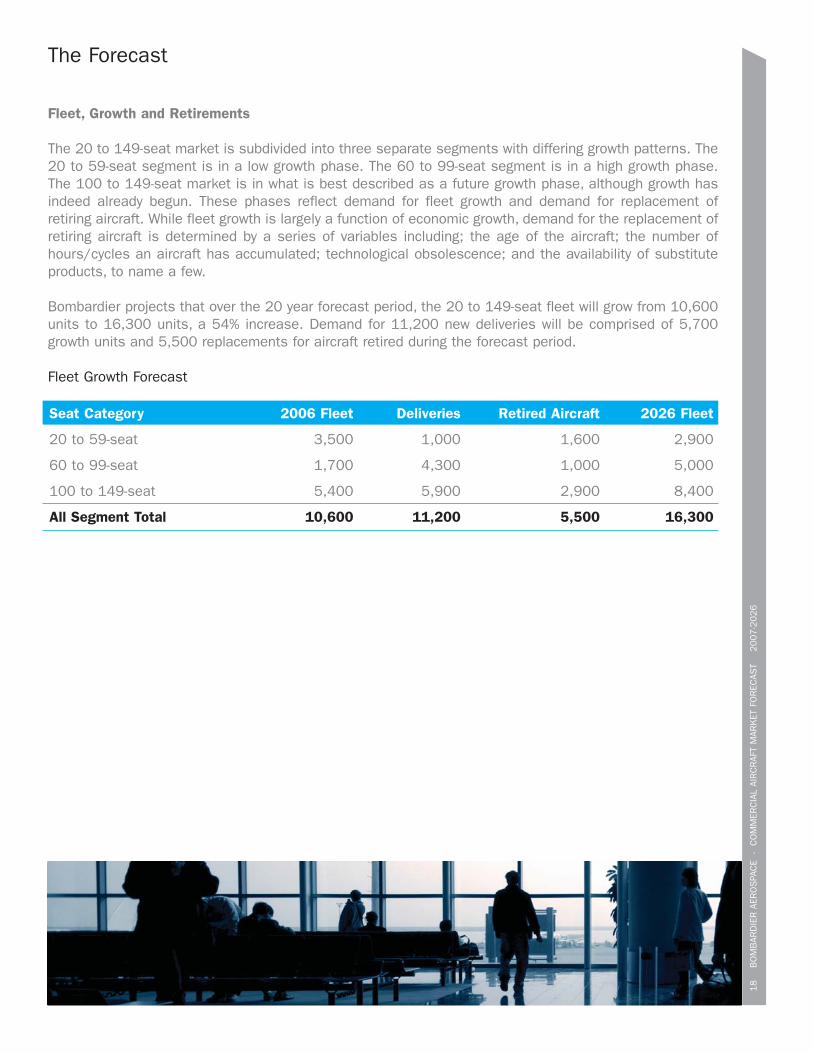
Fleet, Growth and Retirements
The 20 to 149-seat market is subdivided into three separate segments with differing growth patterns. The20 to 59-seat segment is in a low growth phase. The 60 to 99-seat segment is in a high growth phase.The 100 to 149-seat market is in what is best described as a future growth phase, although growth hasindeed already begun. These phases reflect demand for fleet growth and demand for replacement ofretiring aircraft. While fleet growth is largely a function of economic growth, demand for the replacement ofretiring aircraft is determined by a series of variables including; the age of the aircraft; the number ofhours/cycles an aircraft has accumulated; technological obsolescence; and the availability of substituteproducts, to name a few.
Bombardier projects that over the 20 year forecast period, the 20 to 149-seat fleet will grow from 10,600units to 16,300 units, a 54% increase. Demand for 11,200 new deliveries will be comprised of 5,700growth units and 5,500 replacements for aircraft retired during the forecast period.
Fleet Growth Forecast
Seat Category 2006 Fleet Deliveries Retired Aircraft 2026 Fleet
20 to 59-seat 3,500 1,000 1,600 2,900
60 to 99-seat 1,700 4,300 1,000 5,000
100 to 149-seat 5,400 5,900 2,900 8,400
All Segment Total 10,600 11,200 5,500 16,300
19
B
OM
BAR
DIE
R A
ERO
SPA
CE
- C
OM
MER
CIA
L AI
RC
RAF
T M
ARK
ET F
OR
ECAS
T
2007-2
026
The Forecast
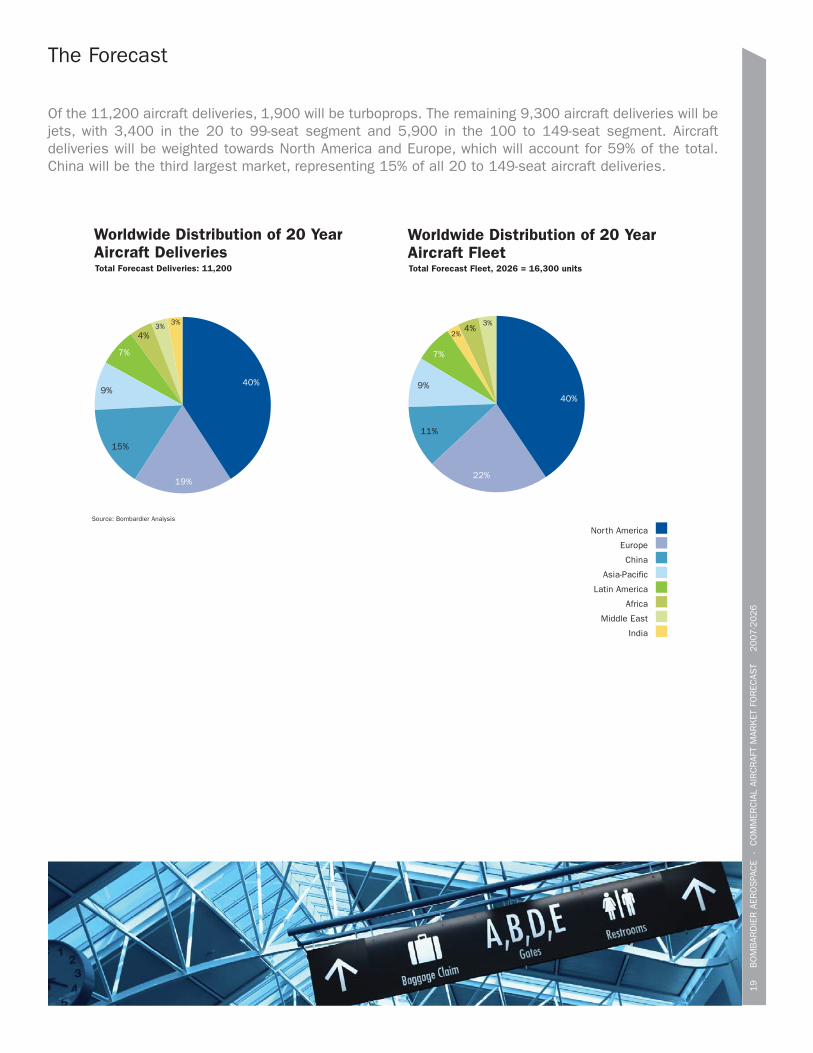
Of the 11,200 aircraft deliveries, 1,900 will be turboprops. The remaining 9,300 aircraft deliveries will bejets, with 3,400 in the 20 to 99-seat segment and 5,900 in the 100 to 149-seat segment. Aircraftdeliveries will be weighted towards North America and Europe, which will account for 59% of the total.China will be the third largest market, representing 15% of all 20 to 149-seat aircraft deliveries.
Worldwide Distribution of 20 Year Aircraft FleetTotal Forecast Fleet, 2026 = 16,300 units
Source: Bombardier Analysis
North America
Africa
Asia-Pacific
China
Europe
Latin America
Middle East
India
4%
9%
2%
11%
22%
7%
3%
40%
Worldwide Distribution of 20 Year Aircraft Deliveries
4%
9%
3%
15%
19%
7%
3%
40%
North
Asia
Latin
Midd
Total Forecast Deliveries: 11,200
Source: Bombardier Analysis
North America
Africa
Asia-Pacific
China
Europe
Latin America
Middle East
India
20
B
OM
BAR
DIE
R A
ERO
SPA
CE
- C
OM
MER
CIA
L AI
RC
RAF
T M
ARK
ET F
OR
ECAS
T
2007-2
026
The Forecast
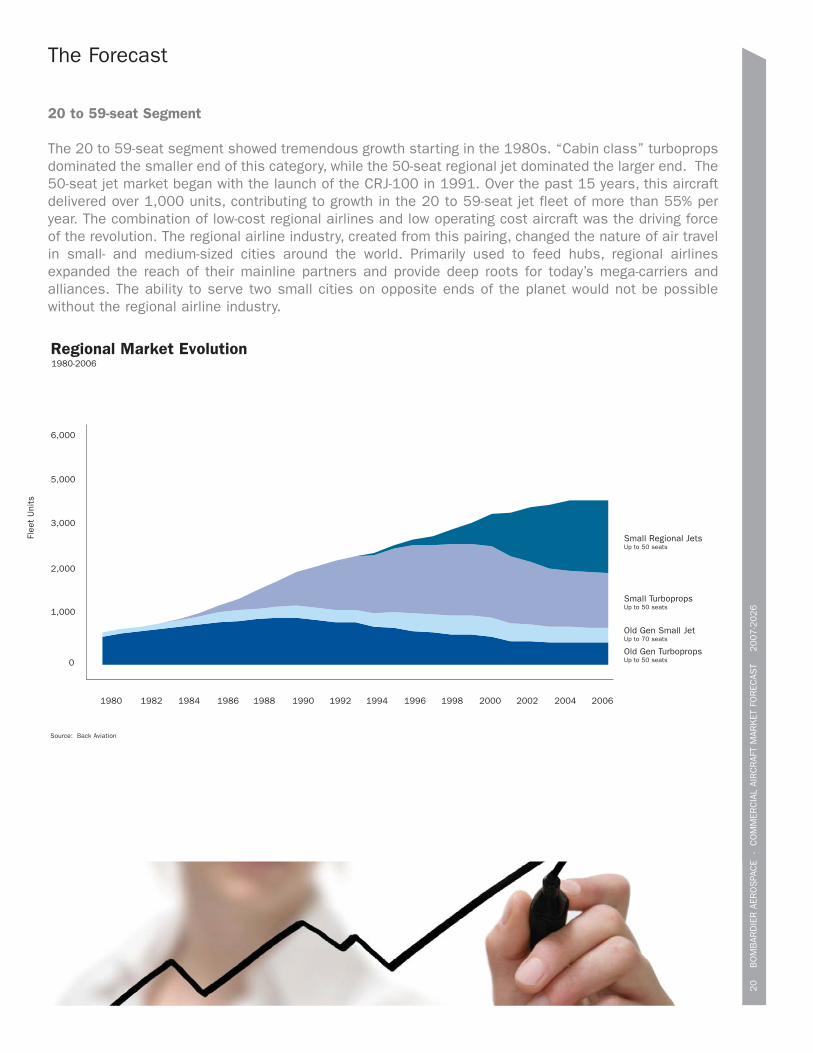
20 to 59-seat Segment
The 20 to 59-seat segment showed tremendous growth starting in the 1980s. “Cabin class” turbopropsdominated the smaller end of this category, while the 50-seat regional jet dominated the larger end. The50-seat jet market began with the launch of the CRJ-100 in 1991. Over the past 15 years, this aircraftdelivered over 1,000 units, contributing to growth in the 20 to 59-seat jet fleet of more than 55% peryear. The combination of low-cost regional airlines and low operating cost aircraft was the driving forceof the revolution. The regional airline industry, created from this pairing, changed the nature of air travelin small- and medium-sized cities around the world. Primarily used to feed hubs, regional airlinesexpanded the reach of their mainline partners and provide deep roots for today’s mega-carriers andalliances. The ability to serve two small cities on opposite ends of the planet would not be possiblewithout the regional airline industry.
1980-2006
0
1,000
2,000
3,000
1980 1982 1984 1986 1988 1990 1992 1994 1996 1998 2000 2002 2004 2006
5,000
6,000
Old Gen TurbopropsUp to 50 seats
Old Gen Small JetUp to 70 seats
Small TurbopropsUp to 50 seats
Flee
t U
nits
Small Regional JetsUp to 50 seats
Regional Market Evolution
Source: Back Aviation
The Forecast
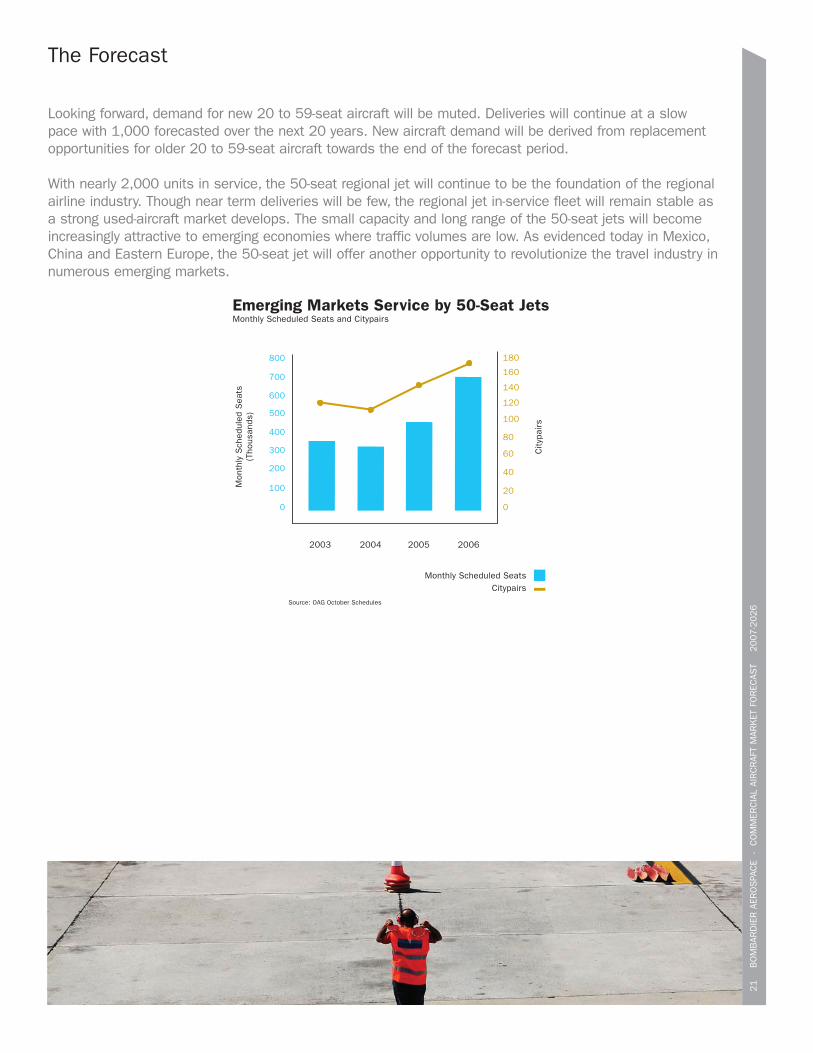
Looking forward, demand for new 20 to 59-seat aircraft will be muted. Deliveries will continue at a slowpace with 1,000 forecasted over the next 20 years. New aircraft demand will be derived from replacementopportunities for older 20 to 59-seat aircraft towards the end of the forecast period.
With nearly 2,000 units in service, the 50-seat regional jet will continue to be the foundation of the regionalairline industry. Though near term deliveries will be few, the regional jet in-service fleet will remain stable asa strong used-aircraft market develops. The small capacity and long range of the 50-seat jets will becomeincreasingly attractive to emerging economies where traffic volumes are low. As evidenced today in Mexico,China and Eastern Europe, the 50-seat jet will offer another opportunity to revolutionize the travel industry innumerous emerging markets.
Monthly Scheduled SeatsCitypairs
Emerging Markets Service by 50-Seat JetsMonthly Scheduled Seats and Citypairs
Source: OAG October Schedules
Mon
thly
Sch
edul
ed S
eats
(Tho
usan
ds)
City
pairs
2003 2004 2005 2006
0
100
300
200
400
500
600
700
800
0
40
20
80
60
100
120
140
160
180
21
B
OM
BAR
DIE
R A
ERO
SPA
CE
- C
OM
MER
CIA
L AI
RC
RAF
T M
ARK
ET F
OR
ECAS
T
2007-2
026

The Forecast
60 to 99-seat Segment
The 60 to 99-seat segment is beginning a high growth cycle. As a strong worldwide economy helps toboost airline profitability, the demand for 60 to 99-seat aircraft will grow. Like the 50-seat regional jetmarket, the 60 to 99-seat segment benefits from a pairing of low cost regional airlines and low operatingcost aircraft. With the latest jet and turboprop offerings, this segment is projected to surpass the 20 to59-seat segment in total fleet size over the next 20 years. In the past 5 years alone, the number ofscheduled seats for new 60 to 99-seat aircraft in the US has grown by over 20% per year.
The 60 to 99-seat category will demand 4,300 new aircraft over the next 20 years. The complexities of thissegment, such as scope clause evolution, suggest a less explosive, more consistent delivery stream whencompared to the growth history of the 50-seat jet market. Due to a small in-service fleet of 1,700 units, the 60to 99-seat segment will experience a proportionately high fleet growth, with 4.3 deliveries for every one aircraftretired. With a fleet projection of 5,000 units by 2026, growth in this segment will approach 200%.
22
B
OM
BAR
DIE
R A
ERO
SPA
CE
- C
OM
MER
CIA
L AI
RC
RAF
T M
ARK
ET F
OR
ECAS
T
2007-2
026
1980-2006
0
1,000
2,000
3,000
1980 1982 1984 1986 1988 1990 1992 1994 1996 1998 2000 2002 2004 2006
5,000
6,000
Old Gen TurbopropsUp to 50 seats
Old Gen Small JetsUp to 70 seats
Small TurbopropsUp to 50 seats
Flee
t U
nits
Small Regional JetsUp to 50 seats
Large TurbopropsUp to 80 seats
Large Regional JetsUp to 99 seats
Regional Market Evolution
Source: Back Aviation
The Forecast
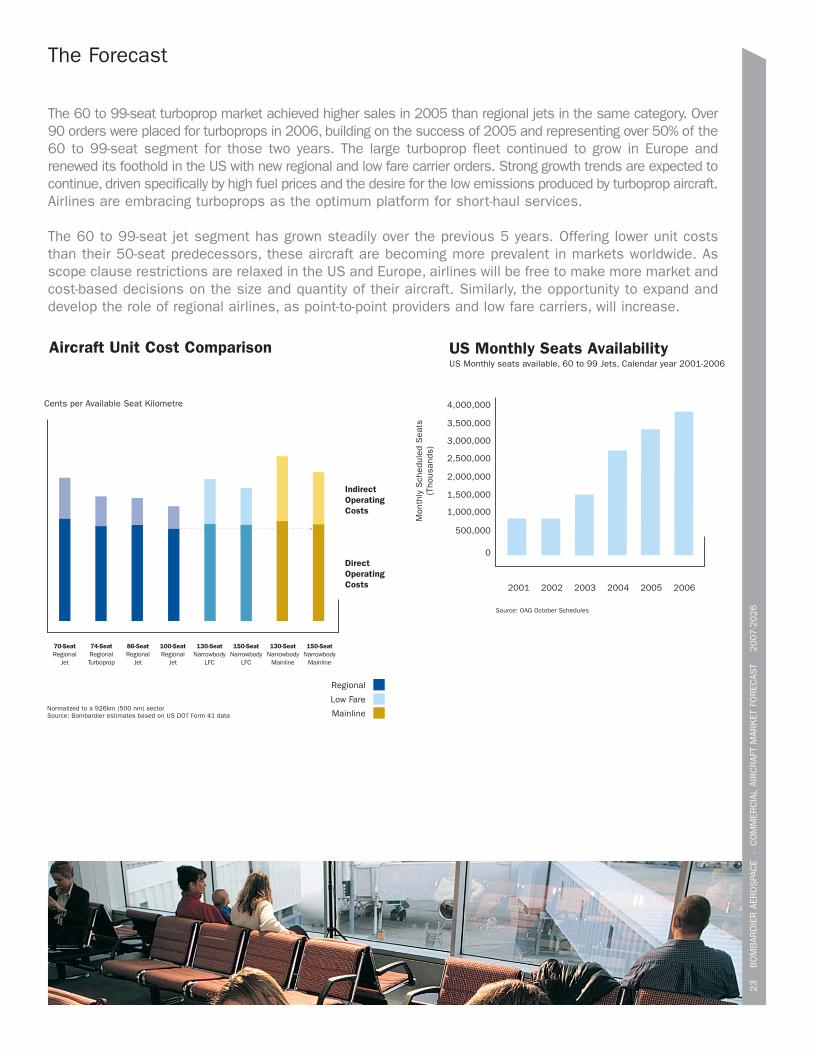
The 60 to 99-seat turboprop market achieved higher sales in 2005 than regional jets in the same category. Over90 orders were placed for turboprops in 2006, building on the success of 2005 and representing over 50% of the60 to 99-seat segment for those two years. The large turboprop fleet continued to grow in Europe andrenewed its foothold in the US with new regional and low fare carrier orders. Strong growth trends are expected tocontinue, driven specifically by high fuel prices and the desire for the low emissions produced by turboprop aircraft.Airlines are embracing turboprops as the optimum platform for short-haul services.
The 60 to 99-seat jet segment has grown steadily over the previous 5 years. Offering lower unit coststhan their 50-seat predecessors, these aircraft are becoming more prevalent in markets worldwide. Asscope clause restrictions are relaxed in the US and Europe, airlines will be free to make more market andcost-based decisions on the size and quantity of their aircraft. Similarly, the opportunity to expand anddevelop the role of regional airlines, as point-to-point providers and low fare carriers, will increase.
Aircraft Unit Cost Comparison
Normalized to a 926km (500 nm) sectorSource: Bombardier estimates based on US DOT Form 41 data
70-SeatRegional
Jet
74-SeatRegionalTurboprop
86-SeatRegional
Jet
100-SeatRegional
Jet
130-SeatNarrowbody
Mainline
150-SeatNarrowbody
Mainline
130-SeatNarrowbody
LFC
150-SeatNarrowbody
LFC
Cents per Available Seat Kilometre
Low Fare
Mainline
Regional
IndirectOperatingCosts
DirectOperatingCosts
US Monthly Seats AvailabilityUS Monthly seats available, 60 to 99 Jets, Calendar year 2001-2006
Source: OAG October Schedules
2001
0
500,000
1,000,000
1,500,000
2,000,000
2,500,000
3,000,000
3,500,000
4,000,000
2002 2003 2004 2005 2006
Mon
thly
Sch
edul
ed S
eats
(Tho
usan
ds)
23
B
OM
BAR
DIE
R A
ERO
SPA
CE
- C
OM
MER
CIA
L AI
RC
RAF
T M
ARK
ET F
OR
ECAS
T
2007-2
026
The Forecast
100 to 149-seat Segment
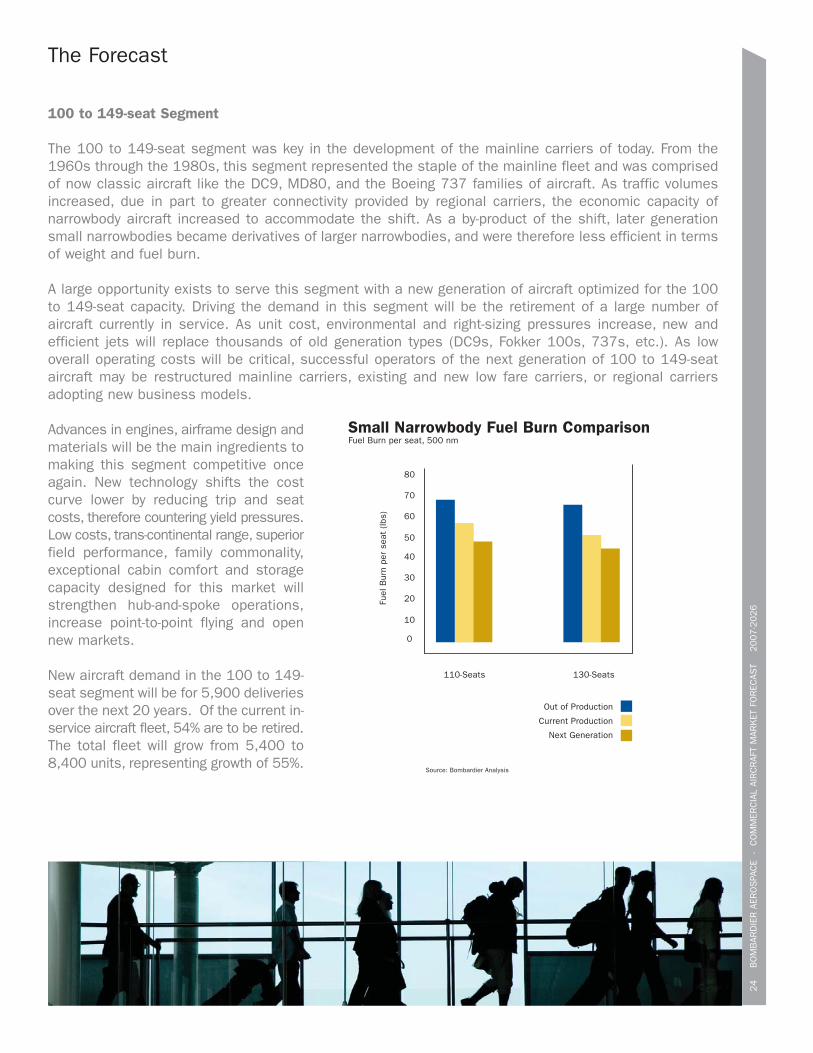
The 100 to 149-seat segment was key in the development of the mainline carriers of today. From the1960s through the 1980s, this segment represented the staple of the mainline fleet and was comprisedof now classic aircraft like the DC9, MD80, and the Boeing 737 families of aircraft. As traffic volumesincreased, due in part to greater connectivity provided by regional carriers, the economic capacity ofnarrowbody aircraft increased to accommodate the shift. As a by-product of the shift, later generationsmall narrowbodies became derivatives of larger narrowbodies, and were therefore less efficient in termsof weight and fuel burn.
A large opportunity exists to serve this segment with a new generation of aircraft optimized for the 100to 149-seat capacity. Driving the demand in this segment will be the retirement of a large number ofaircraft currently in service. As unit cost, environmental and right-sizing pressures increase, new andefficient jets will replace thousands of old generation types (DC9s, Fokker 100s, 737s, etc.). As lowoverall operating costs will be critical, successful operators of the next generation of 100 to 149-seataircraft may be restructured mainline carriers, existing and new low fare carriers, or regional carriersadopting new business models.
Advances in engines, airframe design andmaterials will be the main ingredients tomaking this segment competitive onceagain. New technology shifts the costcurve lower by reducing trip and seatcosts, therefore countering yield pressures.Low costs, trans-continental range, superiorfield performance, family commonality,exceptional cabin comfort and storagecapacity designed for this market willstrengthen hub-and-spoke operations,increase point-to-point flying and opennew markets.
New aircraft demand in the 100 to 149-seat segment will be for 5,900 deliveriesover the next 20 years. Of the current in-service aircraft fleet, 54% are to be retired.The total fleet will grow from 5,400 to8,400 units, representing growth of 55%.
24
B
OM
BAR
DIE
R A
ERO
SPA
CE
- C
OM
MER
CIA
L AI
RC
RAF
T M
ARK
ET F
OR
ECAS
T
2007-2
026
Source: Bombardier Analysis
Small Narrowbody Fuel Burn ComparisonFuel Burn per seat, 500 nm
Next Generation
Current Production
Out of Production
110-Seats
Fuel
Bur
n pe
r se
at (
lbs)
130-Seats
0
10
20
30
40
50
60
70
80

Conclusion
Bombardier AerospaceCommercial Aircraft Market Forecast
2007-2026
26
B
OM
BAR
DIE
R A
ERO
SPA
CE
- C
OM
MER
CIA
L AI
RC
RAF
T M
ARK
ET F
OR
ECAS
T
2007-2
026
Conclusion
Bombardier’s view of the worldwide aviation industryremains positive. The airline industry continues toreinvent itself through new business models,outsourcing and restructuring. The combination ofhighly efficient aircraft and cost-effective operators willcontinue to create new growth opportunities.
The 20 to 149-seat market will continue its stronggrowth with deliveries of 11,200 aircraft, representinga revenue stream valued at $393 billion over the next20 years. Regional airlines are building a firm newbaseline at 60 to 99-seats on top of a solidlyestablished 3,500 strong 20 to 59-seat segment. Newaircraft technology and low cost operators willreinvigorate the 100 to 149-seat segment leading tosubstantial growth opportunities for manufacturersof aircraft of this size.
Winning aircraft designs in tandem with superiorlow cost operators will keep the 20 to 149-seatmarket at the forefront of aviation innovation.Success resulting from this partnership will rewardindividuals worldwide with low cost travel, airlineswith maximized returns, and society in general witha more sustainable environment.

Geographic Detail
Bombardier AerospaceCommercial Aircraft Market Forecast
2007-2026
28
B
OM
BAR
DIE
R A
ERO
SPA
CE
- C
OM
MER
CIA
L AI
RC
RAF
T M
ARK
ET F
OR
ECAS
T
2007-2
026
Geographic Detail
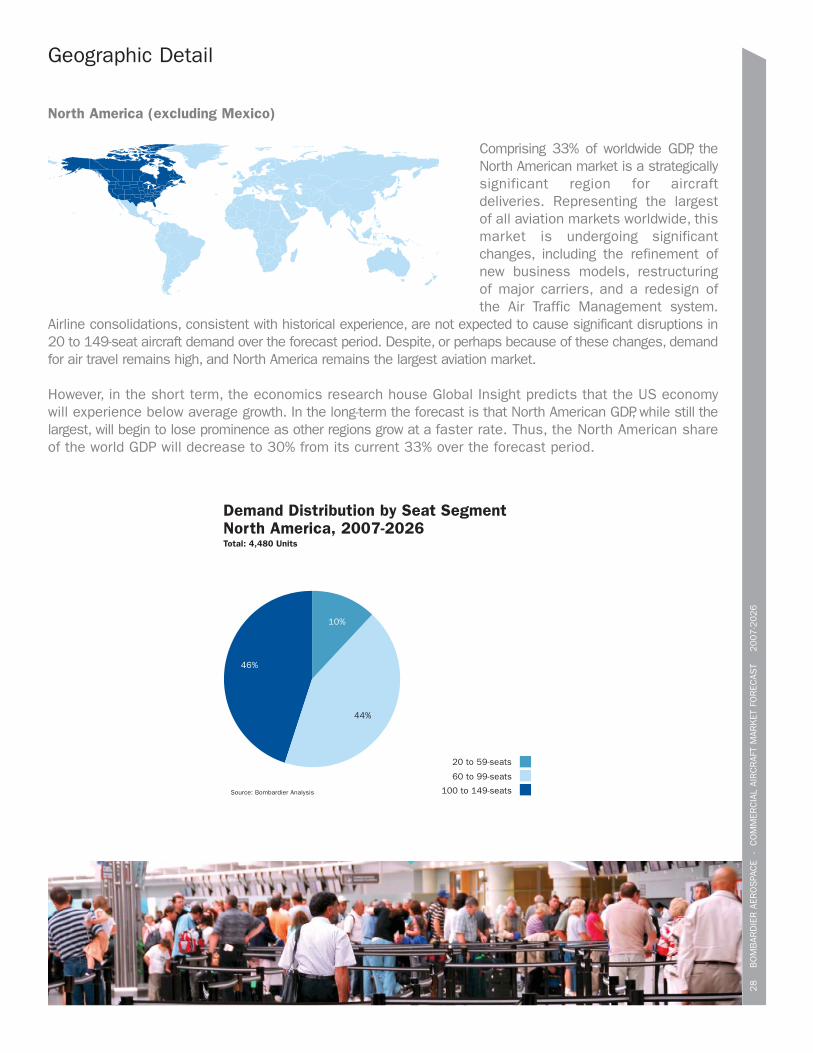
North America (excluding Mexico)
Comprising 33% of worldwide GDP, theNorth American market is a strategicallysignificant region for aircraftdeliveries. Representing the largestof all aviation markets worldwide, thismarket is undergoing significantchanges, including the refinement ofnew business models, restructuringof major carriers, and a redesign ofthe Air Traffic Management system.
Airline consolidations, consistent with historical experience, are not expected to cause significant disruptions in20 to 149-seat aircraft demand over the forecast period. Despite, or perhaps because of these changes, demandfor air travel remains high, and North America remains the largest aviation market.
However, in the short term, the economics research house Global Insight predicts that the US economywill experience below average growth. In the long-term the forecast is that North American GDP, while still thelargest, will begin to lose prominence as other regions grow at a faster rate. Thus, the North American shareof the world GDP will decrease to 30% from its current 33% over the forecast period.
Demand Distribution by Seat SegmentNorth America, 2007-2026Total: 4,480 Units
10%
44%
46%
20 to 59-seats
60 to 99-seats
100 to 149-seatsSource: Bombardier Analysis
Geographic Detail
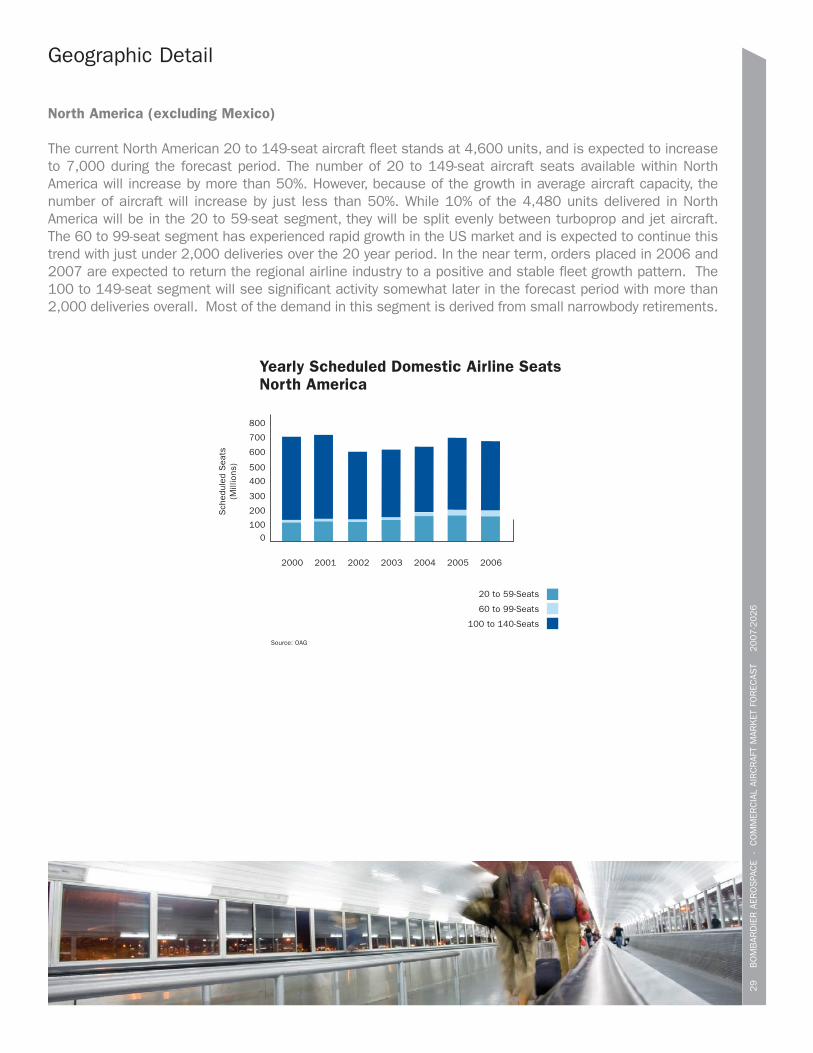
North America (excluding Mexico)
The current North American 20 to 149-seat aircraft fleet stands at 4,600 units, and is expected to increaseto 7,000 during the forecast period. The number of 20 to 149-seat aircraft seats available within NorthAmerica will increase by more than 50%. However, because of the growth in average aircraft capacity, thenumber of aircraft will increase by just less than 50%. While 10% of the 4,480 units delivered in NorthAmerica will be in the 20 to 59-seat segment, they will be split evenly between turboprop and jet aircraft.The 60 to 99-seat segment has experienced rapid growth in the US market and is expected to continue thistrend with just under 2,000 deliveries over the 20 year period. In the near term, orders placed in 2006 and2007 are expected to return the regional airline industry to a positive and stable fleet growth pattern. The100 to 149-seat segment will see significant activity somewhat later in the forecast period with more than2,000 deliveries overall. Most of the demand in this segment is derived from small narrowbody retirements.
29
B
OM
BAR
DIE
R A
ERO
SPA
CE
- C
OM
MER
CIA
L AI
RC
RAF
T M
ARK
ET F
OR
ECAS
T
2007-2
026
Yearly Scheduled Domestic Airline SeatsNorth America
20 to 59-Seats
60 to 99-Seats
100 to 140-Seats
Source: OAG
2000 2001 2002 2003 2004 2005 2006
0
200
100
400
300
Sch
edul
ed S
eats
(Mill
ions
)
600
500
800
700

Geographic Detail
Europe (including Russia/CIS)
Europe is the second largest 20 to 149-seat market after North America. It isforecasted that European deliveries willaccount for 19% of the worldwide total.
Like North America, Europe is projectedto grow at a slower rate than the worldaverage, negatively affecting its GDPshare. It will, however, remain thesecond largest aviation market. Europe
has taken a lead role in the implementation of environmental responsibility initiatives, which it will soon applyto its aviation industry. Changes brought about by these initiatives will have an impact on the European fleetwith a particular focus on low emission aircraft. Less efficient aircraft will rapidly be retired in return for newgeneration jets and turboprops as a countermeasure for expected expenses related to the proposed EmissionsTrading Scheme planned for 2011.
During the next 20 years, 2,090 aircraft are expected to be delivered into the European and Russia/CISmarkets. Half of the deliveries will be for aircraft in the 100 to 149-seat segment. The total fleet is predictedto grow from 2,930 currently, to 3,240 in 2026.
30
B
OM
BAR
DIE
R A
ERO
SPA
CE
- C
OM
MER
CIA
L AI
RC
RAF
T M
ARK
ET F
OR
ECAS
T
2007-2
026
Demand Distribution by Seat SegmentEurope, 2007-2026Total: 2,090 Units
11%
39%
50%
20 to 59-seats
60 to 99-seats
100 to 149-seatsSource: Bombardier Analysis
31
B
OM
BAR
DIE
R A
ERO
SPA
CE
- C
OM
MER
CIA
L AI
RC
RAF
T M
ARK
ET F
OR
ECAS
T
2007-2
026
Geographic Detail
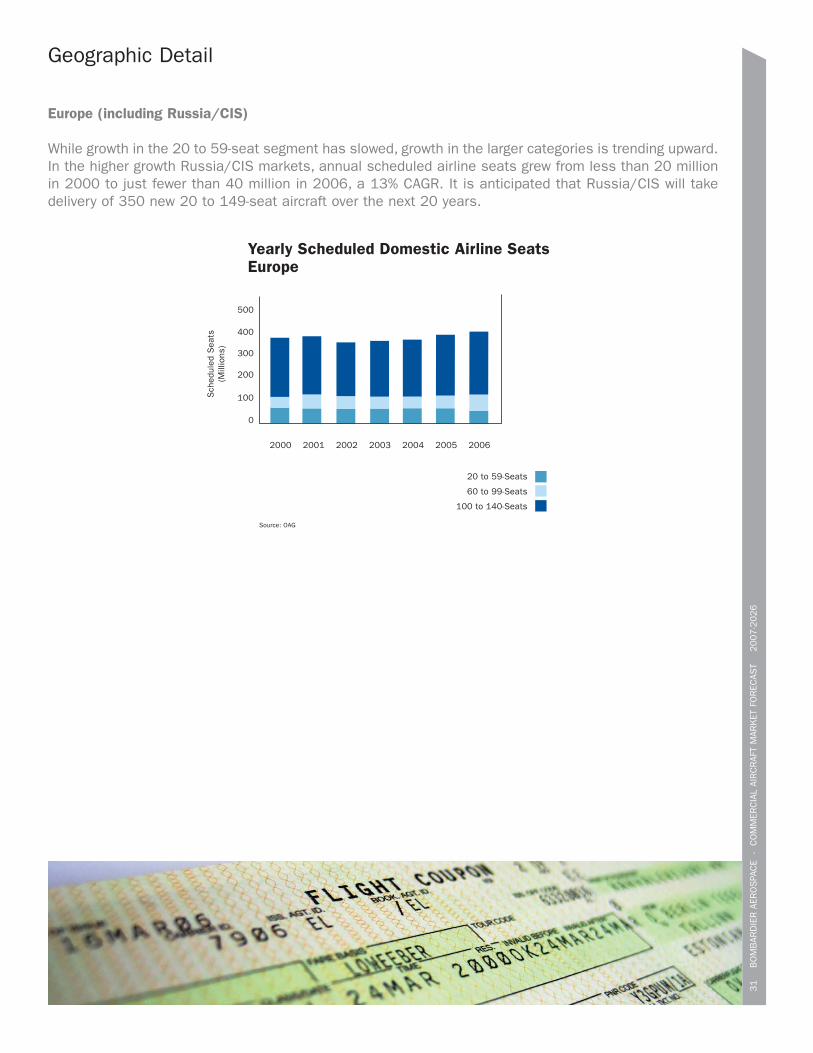
Europe (including Russia/CIS)
While growth in the 20 to 59-seat segment has slowed, growth in the larger categories is trending upward.In the higher growth Russia/CIS markets, annual scheduled airline seats grew from less than 20 millionin 2000 to just fewer than 40 million in 2006, a 13% CAGR. It is anticipated that Russia/CIS will takedelivery of 350 new 20 to 149-seat aircraft over the next 20 years.
Yearly Scheduled Domestic Airline SeatsEurope
20 to 59-Seats
60 to 99-Seats
100 to 140-Seats
Source: OAG
2000 2001 2002 2003 2004 2005 2006
0
100
300
200
Sch
edul
ed S
eats
(Mill
ions
)
400
500
32
B
OM
BAR
DIE
R A
ERO
SPA
CE
- C
OM
MER
CIA
L AI
RC
RAF
T M
ARK
ET F
OR
ECAS
T
2007-2
026
Geographic Detail
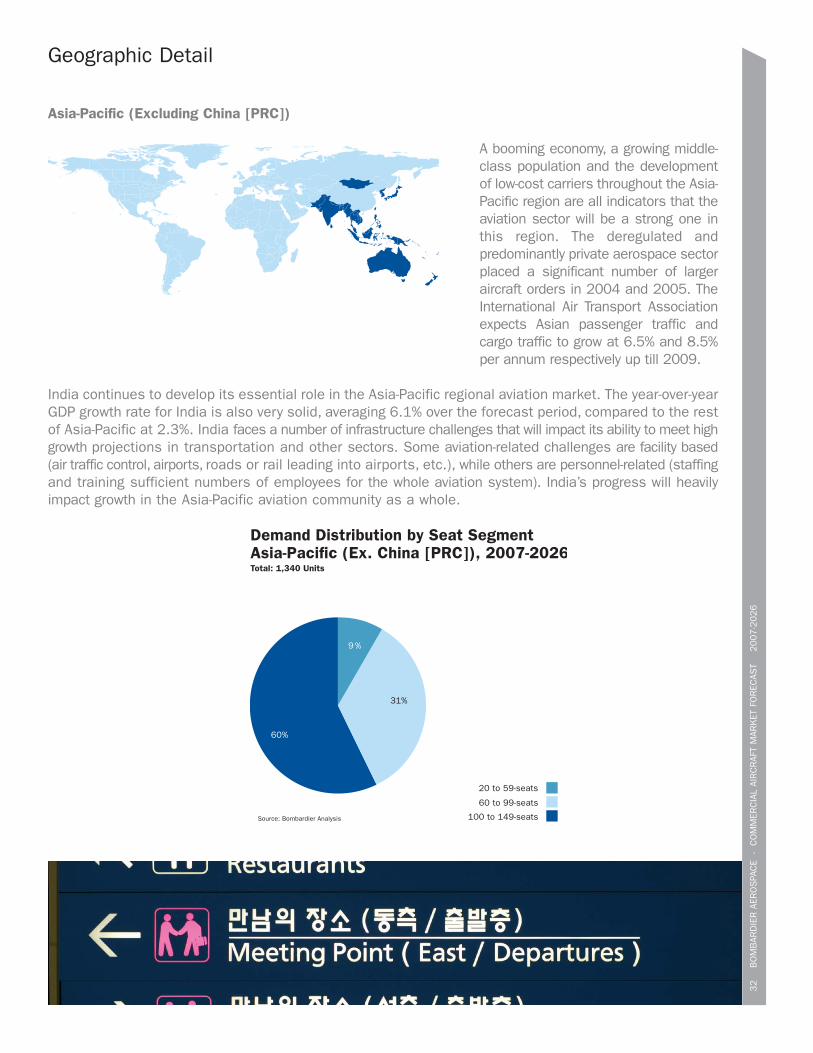
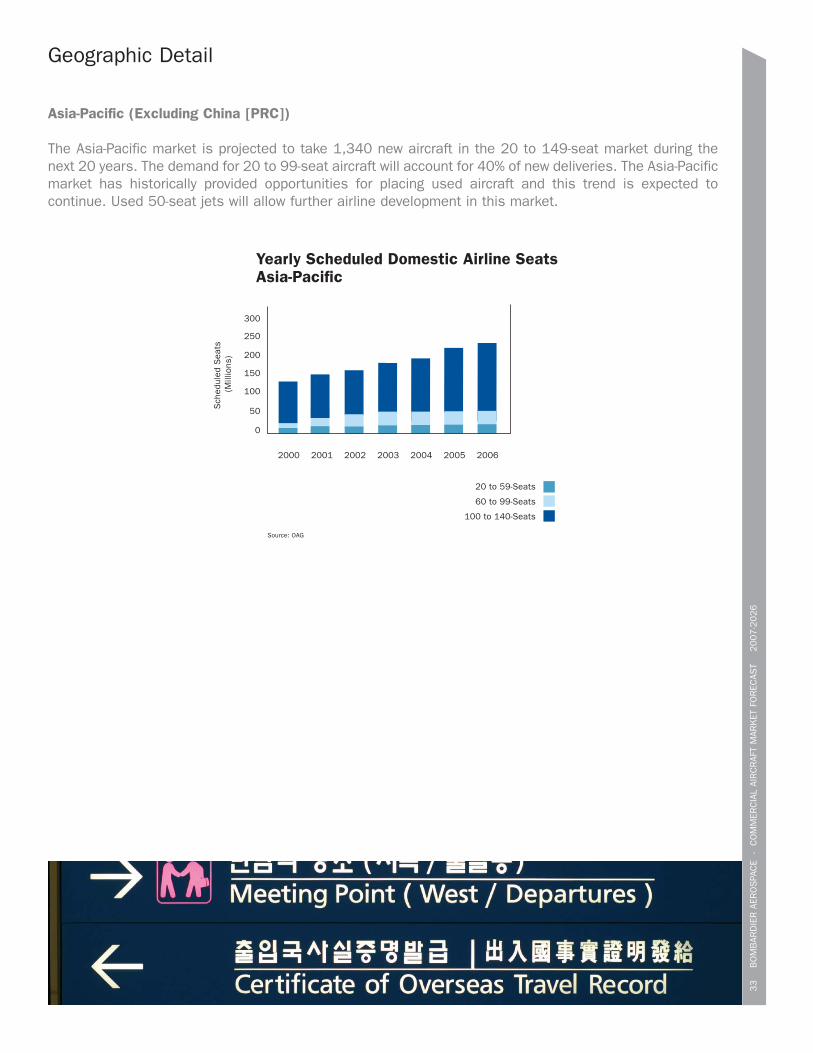
Asia-Pacific (Excluding China [PRC])
A booming economy, a growing middle-class population and the developmentof low-cost carriers throughout the Asia-Pacific region are all indicators that theaviation sector will be a strong one inthis region. The deregulated andpredominantly private aerospace sectorplaced a significant number of largeraircraft orders in 2004 and 2005. TheInternational Air Transport Associationexpects Asian passenger traffic andcargo traffic to grow at 6.5% and 8.5%per annum respectively up till 2009.
India continues to develop its essential role in the Asia-Pacific regional aviation market. The year-over-yearGDP growth rate for India is also very solid, averaging 6.1% over the forecast period, compared to the restof Asia-Pacific at 2.3%. India faces a number of infrastructure challenges that will impact its ability to meet highgrowth projections in transportation and other sectors. Some aviation-related challenges are facility based(air traffic control, airports, roads or rail leading into airports, etc.), while others are personnel-related (staffingand training sufficient numbers of employees for the whole aviation system). India’s progress will heavilyimpact growth in the Asia-Pacific aviation community as a whole.
Demand Distribution by Seat SegmentAsia-Pacific (Ex. China [PRC]), 2007-2026Total: 1,340 Units
9 %
31%
60%
20 to 59-seats
60 to 99-seats
100 to 149-seatsSource: Bombardier Analysis
Geographic Detail
Asia-Pacific (Excluding China [PRC])
The Asia-Pacific market is projected to take 1,340 new aircraft in the 20 to 149-seat market during thenext 20 years. The demand for 20 to 99-seat aircraft will account for 40% of new deliveries. The Asia-Pacificmarket has historically provided opportunities for placing used aircraft and this trend is expected tocontinue. Used 50-seat jets will allow further airline development in this market.
33
B
OM
BAR
DIE
R A
ERO
SPA
CE
- C
OM
MER
CIA
L AI
RC
RAF
T M
ARK
ET F
OR
ECAS
T
2007-2
026
Yearly Scheduled Domestic Airline SeatsAsia-Pacific
20 to 59-Seats
60 to 99-Seats
100 to 140-Seats
Source: OAG
2000 2001 2002 2003 2004 2005 2006
0
50
150
100
Sch
edul
ed S
eats
(M
illio
ns) 200
250
300

Geographic Detail
China (PRC)
China is projected to double itsproportion of the worldwide GDP,moving to almost 12% from its current6%. With year-over-year GDP growthaveraging 7.1% over the forecastperiod, China will take 1,660 deliveriesin the 20 to 149-seat market.
Aviation growth in China continues toprogress in concert with the
refinement and restructuring of its aviation infrastructure. Last year, China announced plans to expandsome 55 airports across the country and to build 42 new ones by 2011. This year, the Civil AviationAdministration of China (CAAC) stated that in 2010 it would transition to a civilian controlled air trafficmanagement system from the current military controlled system. It is suggested that the implications ofthis transition are positive for commercial aviation and will likely provide improved access to Chineseairspace and airports for both commercial and private aircraft.
34
B
OM
BAR
DIE
R A
ERO
SPA
CE
- C
OM
MER
CIA
L AI
RC
RAF
T M
ARK
ET F
OR
ECAS
T
2007-2
026
Demand Distribution by Seat SegmentChina (PRC), 2007-2026Total: 1,660 Units
4%
34%
62%
20 to 59-seats
60 to 99-seats
100 to 149-seatsSource: Bombardier Analysis
Total Domestic Citypairs served by 20 to 149-seat AircraftChina (PRC)
Source: OAG
600
500
700
800
900
1,000
2000
Tota
l City
pairs
2001
2002
20
03
20
04
20
05
20
06
20
07

35
B
OM
BAR
DIE
R A
ERO
SPA
CE
- C
OM
MER
CIA
L AI
RC
RAF
T M
ARK
ET F
OR
ECAS
T
2007-2
026
Geographic Detail
Latin America (including Caribbean)
The Latin American region accountsfor 6% of the worldwide GDP and isexpected to achieve growth rates higherthan the worldwide average over thenext 20 years. In the short-term, Braziland Chile are expected to experiencesignificant economic growth, whileMexico, Argentina, and Venezuela areexpected to slow down in tandem withlower growth in the United States.
In Latin America, 20 to 149-seat scheduled airline seats are beginning to grow again reaching just under140 million annually in 2006. While Latin America’s aircraft market remains relatively small, the 20 to149-seat segment grew to 8% of the world’s total aircraft units in 2006 from less than 5% in 2005.
A market transformation can be seen in Latin America through the spread of the low fare carrier business model,successful in Brazil, growing in Mexico, and spreading throughout the region. Additionally, a market for used 50-seat regional jets has been established in a number of countries and is expected to grow.
20 to 59-seats
60 to 99-seats
100 to 149-seatsSource: Bombardier Analysis
Demand Distribution by Seat SegmentLatin America, 2007-2026Total: 810 Units
8%
31%
61%
36
B
OM
BAR
DIE
R A
ERO
SPA
CE
- C
OM
MER
CIA
L AI
RC
RAF
T M
ARK
ET F
OR
ECAS
T
2007-2
026
Geographic Detail
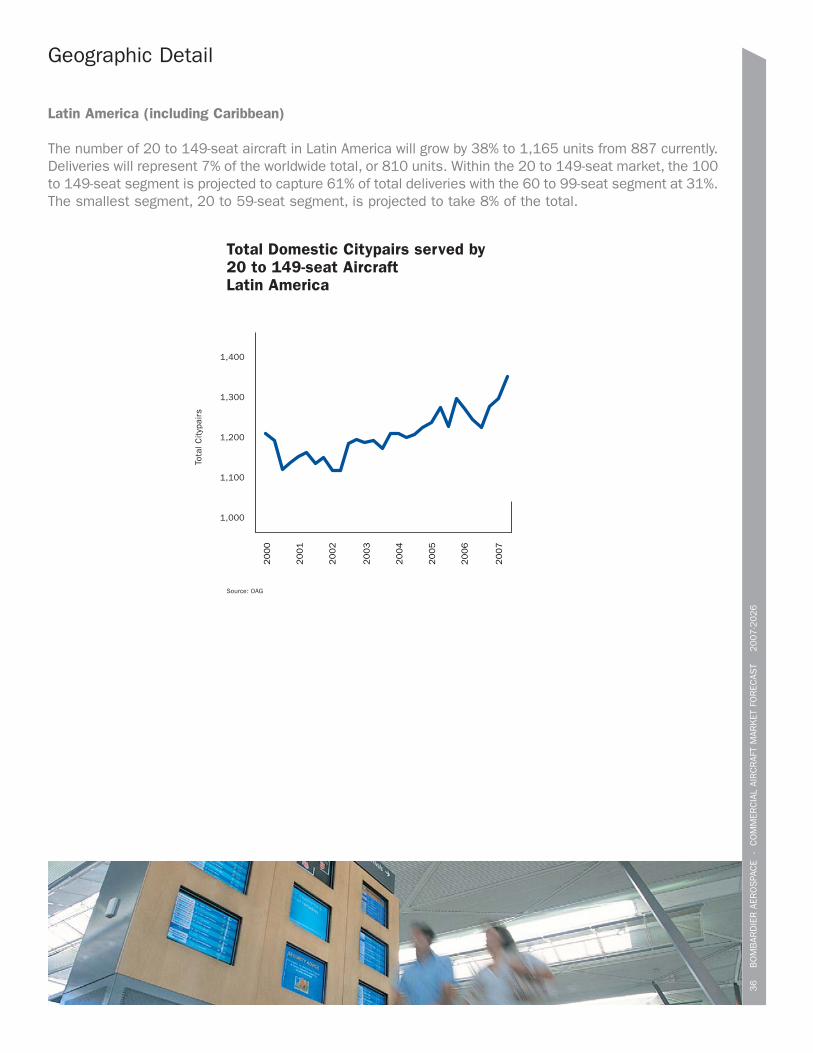
Latin America (including Caribbean)
The number of 20 to 149-seat aircraft in Latin America will grow by 38% to 1,165 units from 887 currently.Deliveries will represent 7% of the worldwide total, or 810 units. Within the 20 to 149-seat market, the 100to 149-seat segment is projected to capture 61% of total deliveries with the 60 to 99-seat segment at 31%.The smallest segment, 20 to 59-seat segment, is projected to take 8% of the total.
Total Domestic Citypairs served by 20 to 149-seat AircraftLatin America
Source: OAG
1,100
1,000
1,200
Tota
l City
pairs
1,300
1,400
2000
2001
2002
20
03
20
04
20
05
20
06
20
07
37
B
OM
BAR
DIE
R A
ERO
SPA
CE
- C
OM
MER
CIA
L AI
RC
RAF
T M
ARK
ET F
OR
ECAS
T
2007-2
026
Geographic Detail
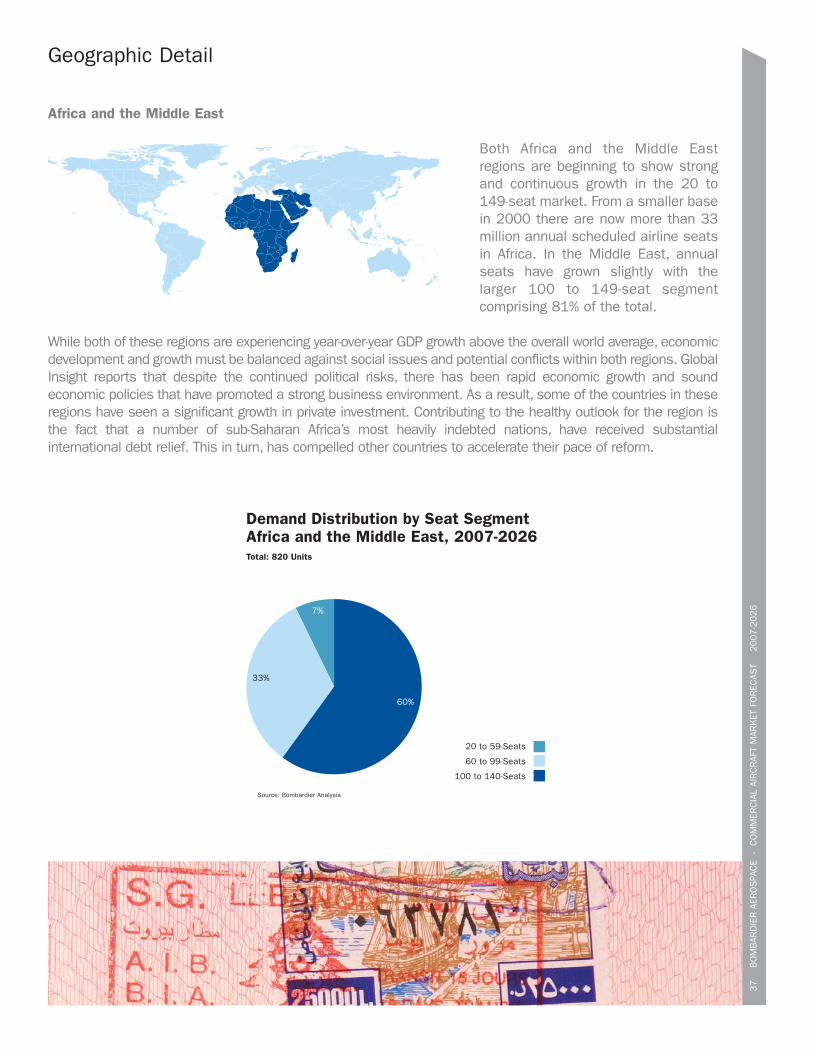
Africa and the Middle East
Both Africa and the Middle Eastregions are beginning to show strongand continuous growth in the 20 to149-seat market. From a smaller basein 2000 there are now more than 33million annual scheduled airline seatsin Africa. In the Middle East, annualseats have grown slightly with thelarger 100 to 149-seat segmentcomprising 81% of the total.
While both of these regions are experiencing year-over-year GDP growth above the overall world average, economicdevelopment and growth must be balanced against social issues and potential conflicts within both regions. GlobalInsight reports that despite the continued political risks, there has been rapid economic growth and soundeconomic policies that have promoted a strong business environment. As a result, some of the countries in theseregions have seen a significant growth in private investment. Contributing to the healthy outlook for the region isthe fact that a number of sub-Saharan Africa’s most heavily indebted nations, have received substantialinternational debt relief. This in turn, has compelled other countries to accelerate their pace of reform.
60%
7%
33%
Demand Distribution by Seat SegmentAfrica and the Middle East, 2007-2026Total: 820 Units
20 to 59-Seats
60 to 99-Seats
100 to 140-Seats
Source: Bombardier Analysis
38
B
OM
BAR
DIE
R A
ERO
SPA
CE
- C
OM
MER
CIA
L AI
RC
RAF
T M
ARK
ET F
OR
ECAS
T
2007-2
026
Geographic Detail
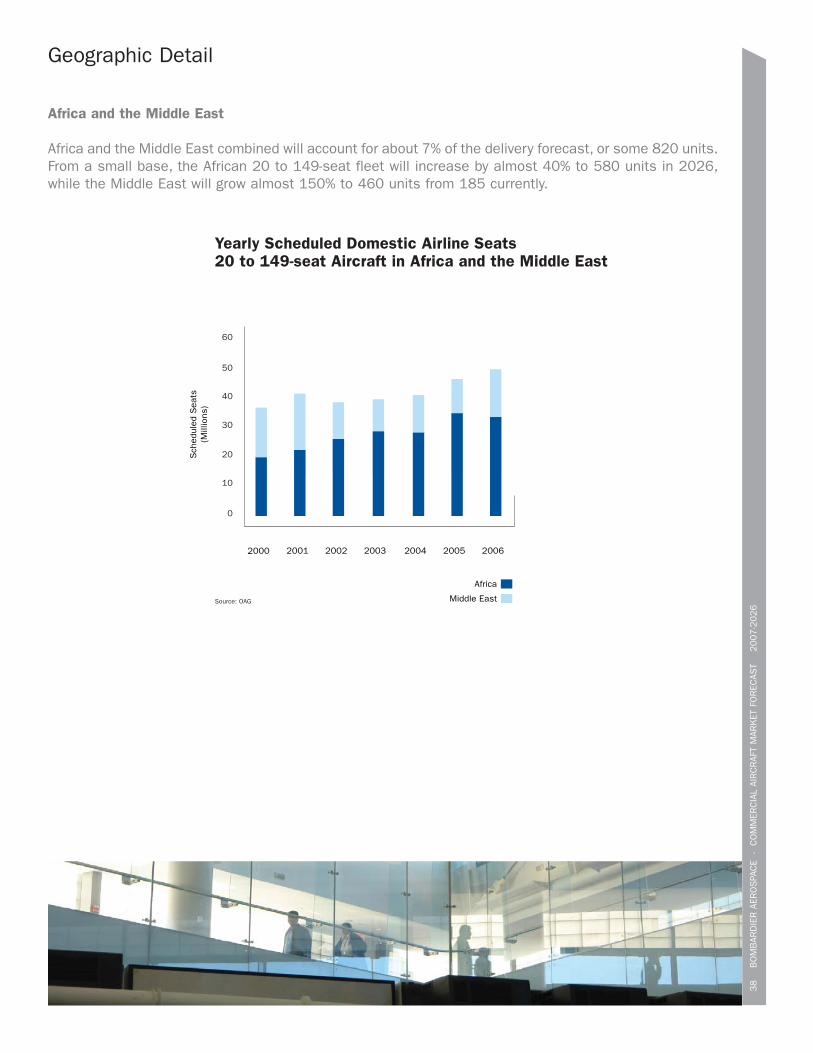
Africa and the Middle East
Africa and the Middle East combined will account for about 7% of the delivery forecast, or some 820 units.From a small base, the African 20 to 149-seat fleet will increase by almost 40% to 580 units in 2026,while the Middle East will grow almost 150% to 460 units from 185 currently.
Yearly Scheduled Domestic Airline Seats20 to 149-seat Aircraft in Africa and the Middle East
Source: OAG
20
30
0
10
40
50
60
2000
Sch
edul
ed S
eats
(Mill
ions
)
2001 2002 2003 2004 2005
Africa
Middle East
2006

Resources
Bombardier AerospaceCommercial Aircraft Market Forecast
2007-2026
40
B
OM
BAR
DIE
R A
ERO
SPA
CE
- C
OM
MER
CIA
L AI
RC
RAF
T M
ARK
ET F
OR
ECAS
T
2007-2
026
Resources
Resources used in the Bombardier Aerospace, Commercial Aircraft Market Forecast
Association of Asia-Pacific Airlines (AAPA)AirCraft Analytic System database (ACAS)Airline MonitorAir Transport Association (ATA) Aviation DailyBACK AviationUS Bureau of Transportation Statistics (BTS)US Department of Transportation (DOT)US Energy Information Administration (EIA)European Regional Airline Association (ERAA)Global InsightInternational Air Transport Association (IATA)International Civil Aviation Organisation (ICAO)Official Airline Guide (OAG)Regional Airline Association (RAA)Velocity Group
For electronic copies of the Bombardier Aerospace Commercial Aircraft Market Forecast, 2007-2026,please visit our website at: www.bombardier.com
Boeing, Fokker, McDonnell Douglas are trademarks of third parties.

Bombardier Aerospace
123 Garratt BoulevardToronto, Ontario
Canada M3K 1Y5Tel: 416-375-4027 Fax: 416-375-4540
www.bombardier.com