comments on homework lots of “index of hydrogen deficiency” math errors matching arrows with hr...
TRANSCRIPT
Comments on homework
•Lots of “Index of Hydrogen Deficiency” Math errors•Matching arrows with HR MS data & Molecular formulas•Following instructions: -typed & chemdraw work
-Not applying rules for fragmentation-Not providing mechanisms
•Poor mechanism presentations (Review arrow pushing)•Some organizational problems in “presentation” of homework
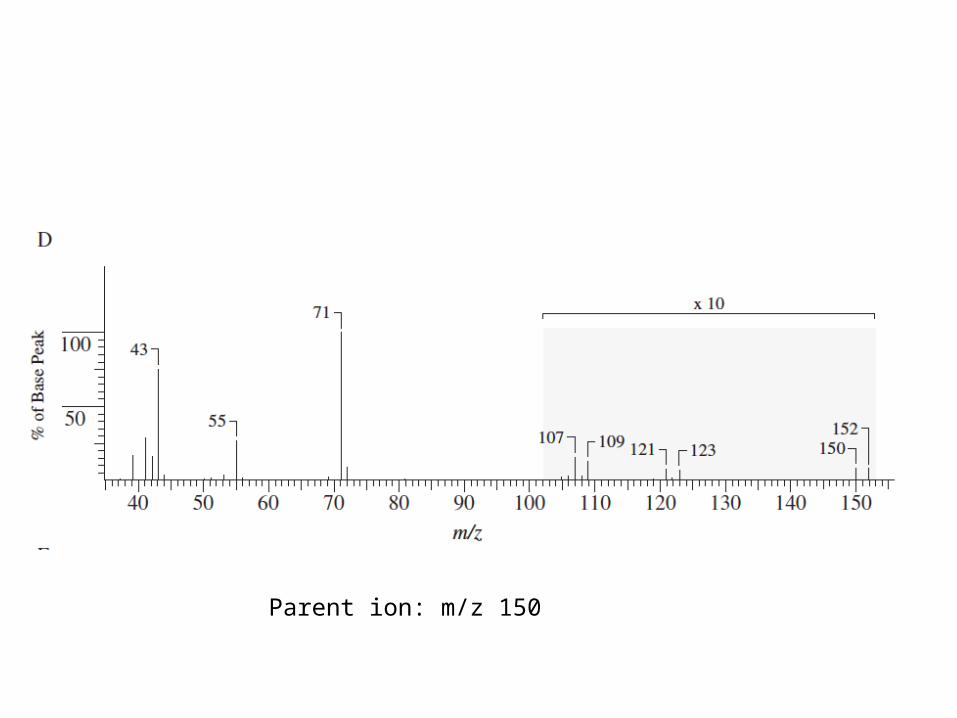
Parent ion: m/z 150
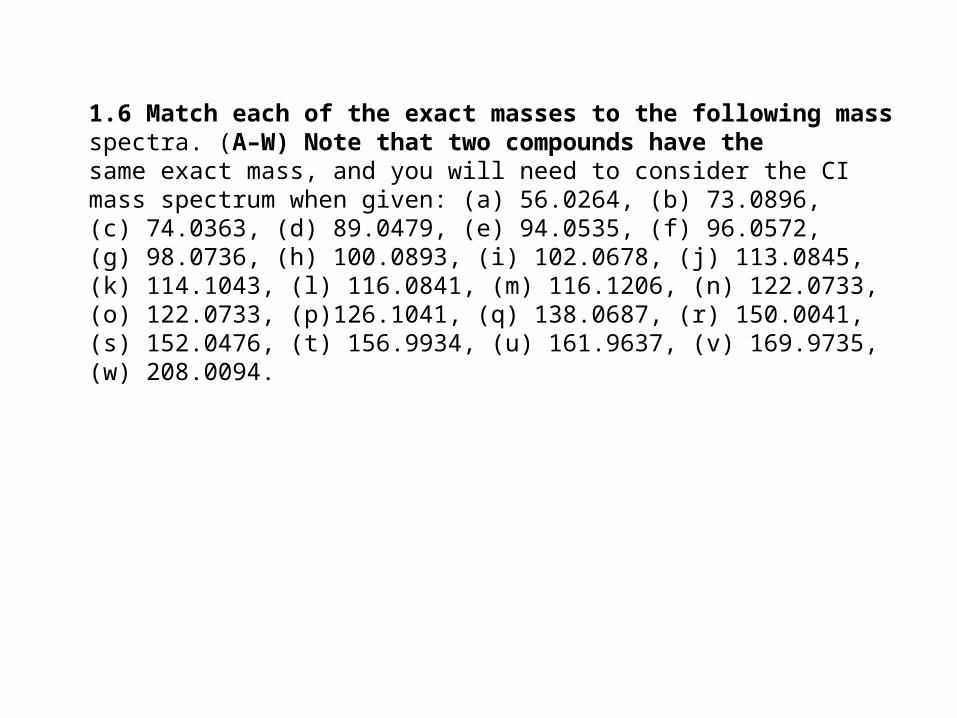
1.6 Match each of the exact masses to the following massspectra. (A–W) Note that two compounds have thesame exact mass, and you will need to consider the CImass spectrum when given: (a) 56.0264, (b) 73.0896,(c) 74.0363, (d) 89.0479, (e) 94.0535, (f) 96.0572,(g) 98.0736, (h) 100.0893, (i) 102.0678, (j) 113.0845,(k) 114.1043, (l) 116.0841, (m) 116.1206, (n) 122.0733,(o) 122.0733, (p)126.1041, (q) 138.0687, (r) 150.0041,(s) 152.0476, (t) 156.9934, (u) 161.9637, (v) 169.9735,(w) 208.0094.
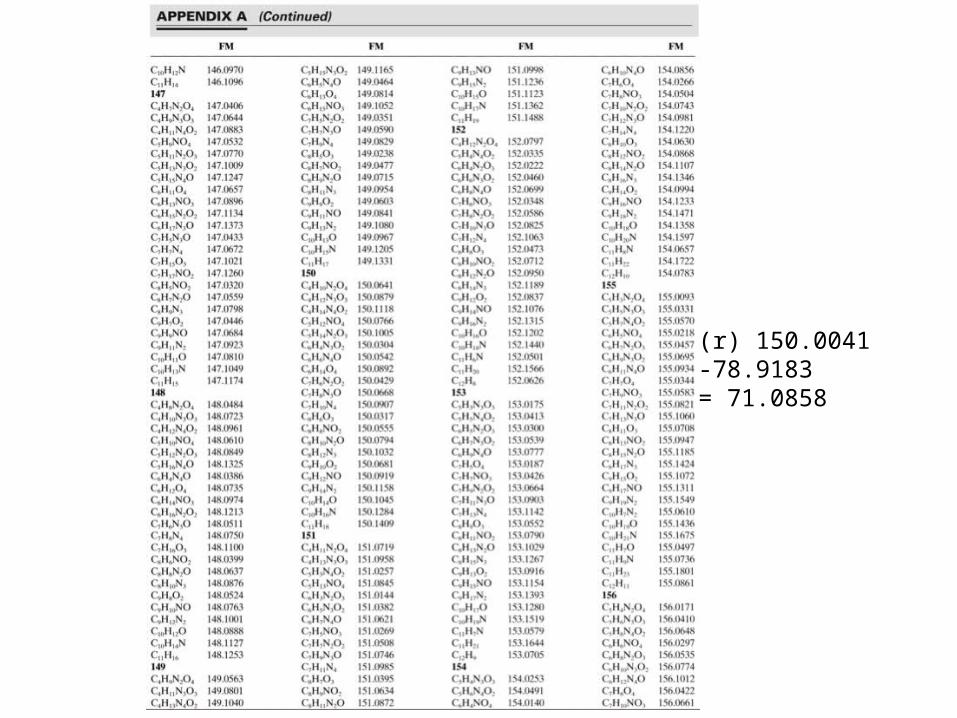
(r) 150.0041-78.9183= 71.0858
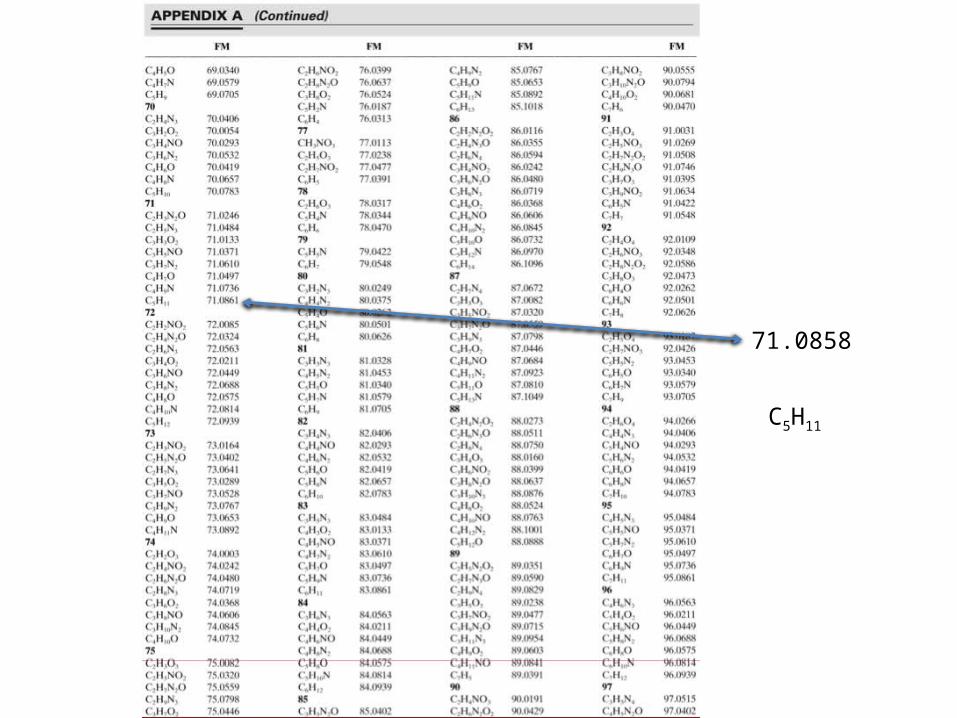
71.0858
C5H11
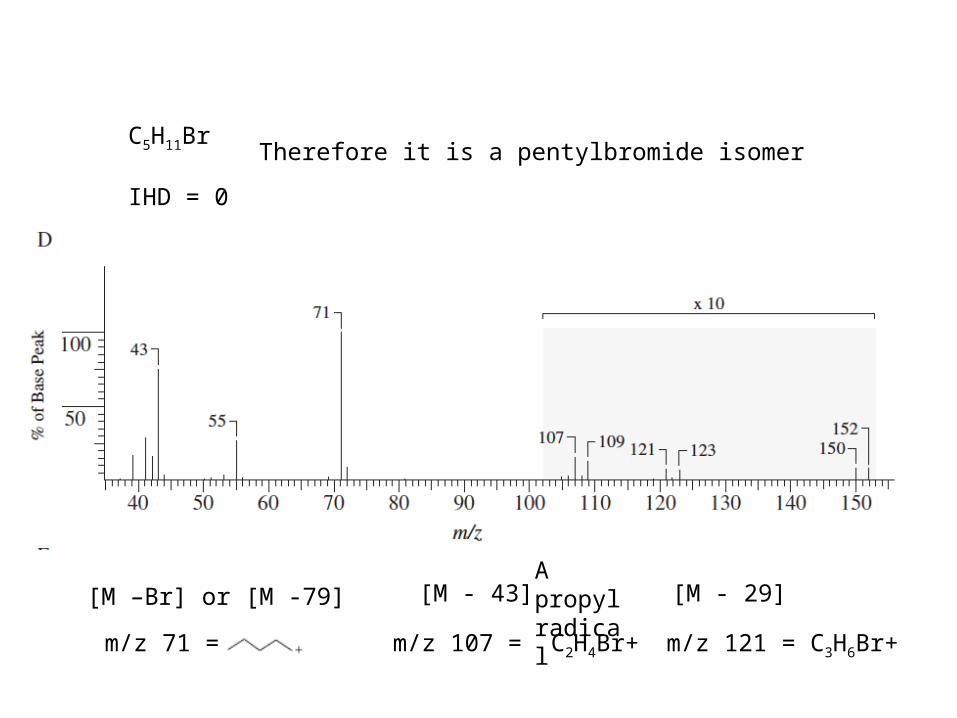
C5H11Br
IHD = 0
Therefore it is a pentylbromide isomer
m/z 107 = C2H4Br+
[M –Br] or [M -79] [M - 43]
m/z 71 =
A propyl radical [M - 29]
m/z 121 = C3H6Br+
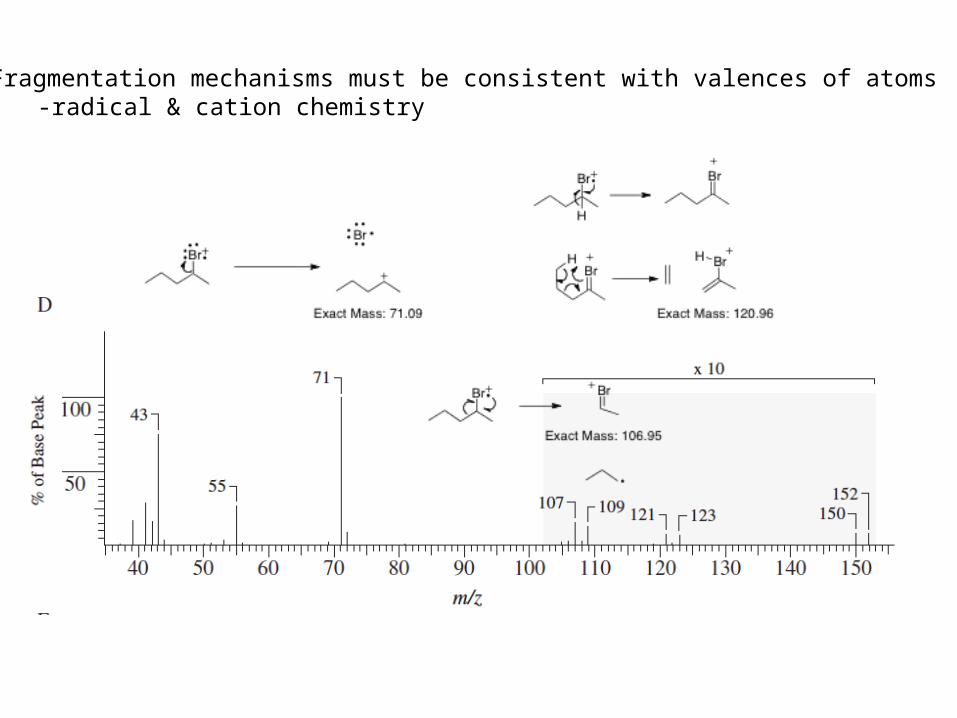
Fragmentation mechanisms must be consistent with valences of atoms-radical & cation chemistry
Some helpful hints:
• Draw hydrogens in.• Use proper arrow pushing –exactly like in
mechanisms.• Gas phase radical cations have plenty of
energy to rearrange and fragment.
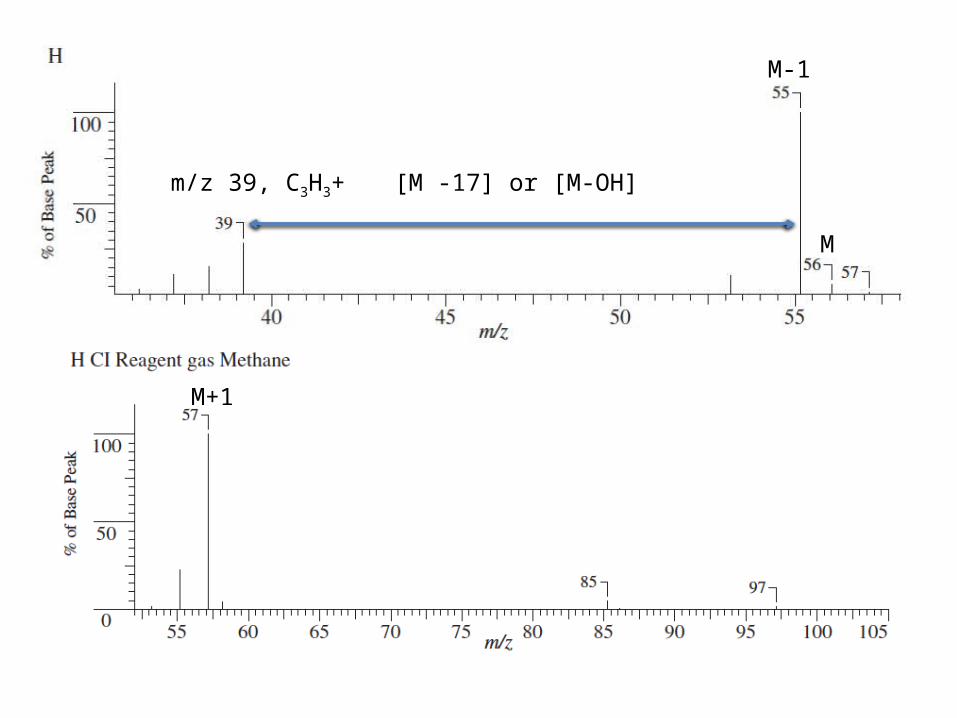
M-1
M+1
M
[M -17] or [M-OH]m/z 39, C3H3+

M-1
M
[M -17] or [M-OH]m/z 39, C3H3+
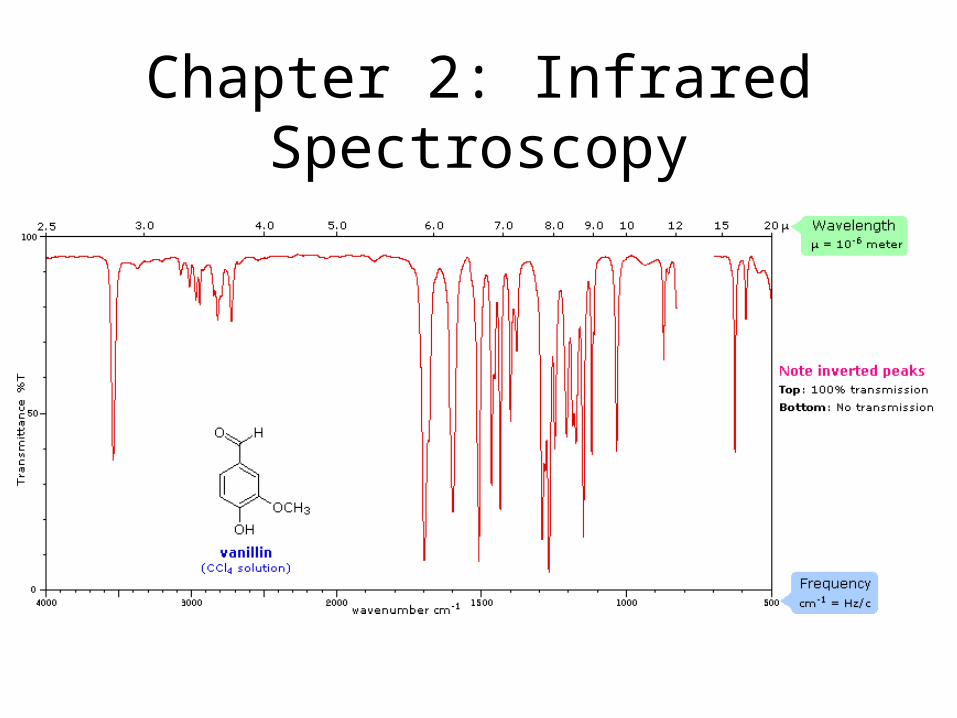
Chapter 2: Infrared Spectroscopy
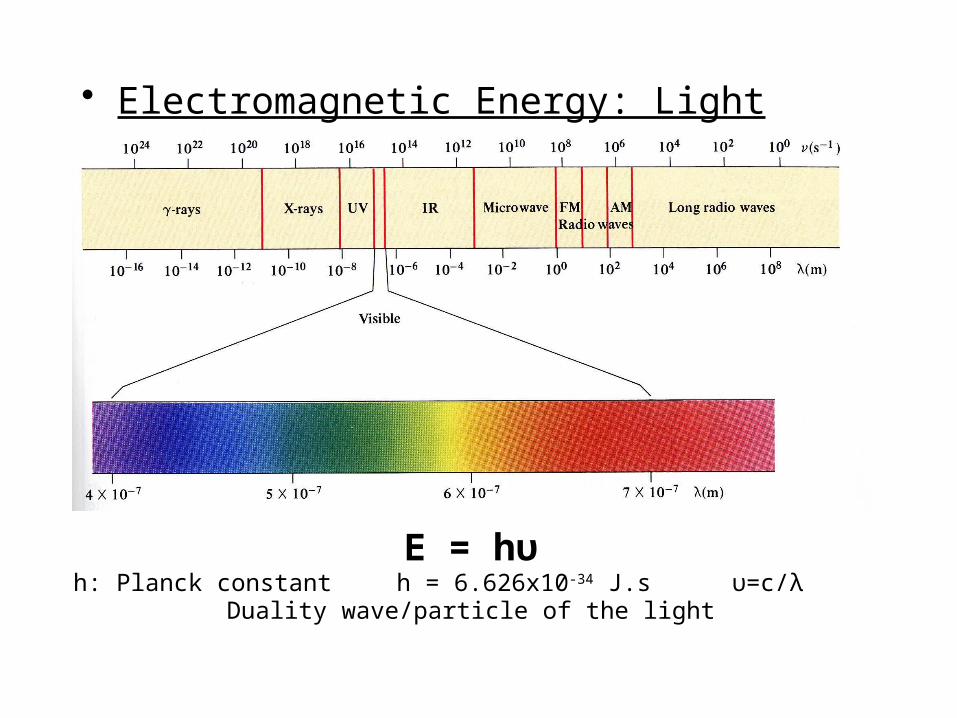
• Electromagnetic Energy: Light
E = hυh: Planck constant h = 6.626x10⁻³⁴ J.s υ=c/λ
Duality wave/particle of the light
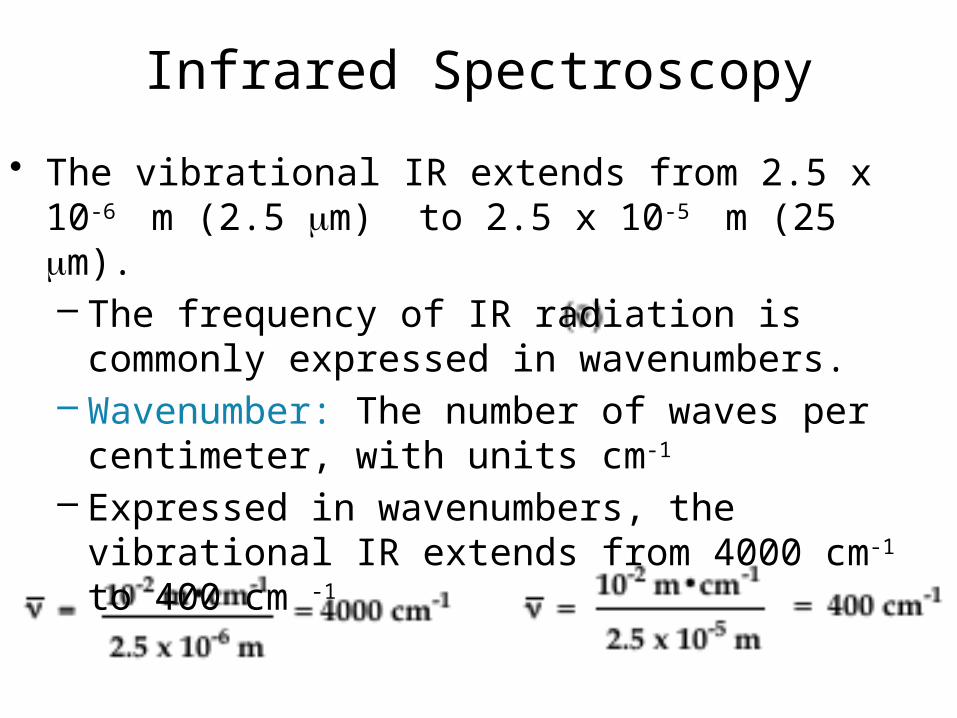
Infrared Spectroscopy
• The vibrational IR extends from 2.5 x 10⁻⁶ m (2.5 m) to 2.5 x 10⁻⁵ m (25 m).– The frequency of IR radiation is commonly expressed in
wavenumbers.– Wavenumber: The number of waves per centimeter,
with units cm-1
– Expressed in wavenumbers, the vibrational IR extends from 4000 cm-1 to 400 cm -1
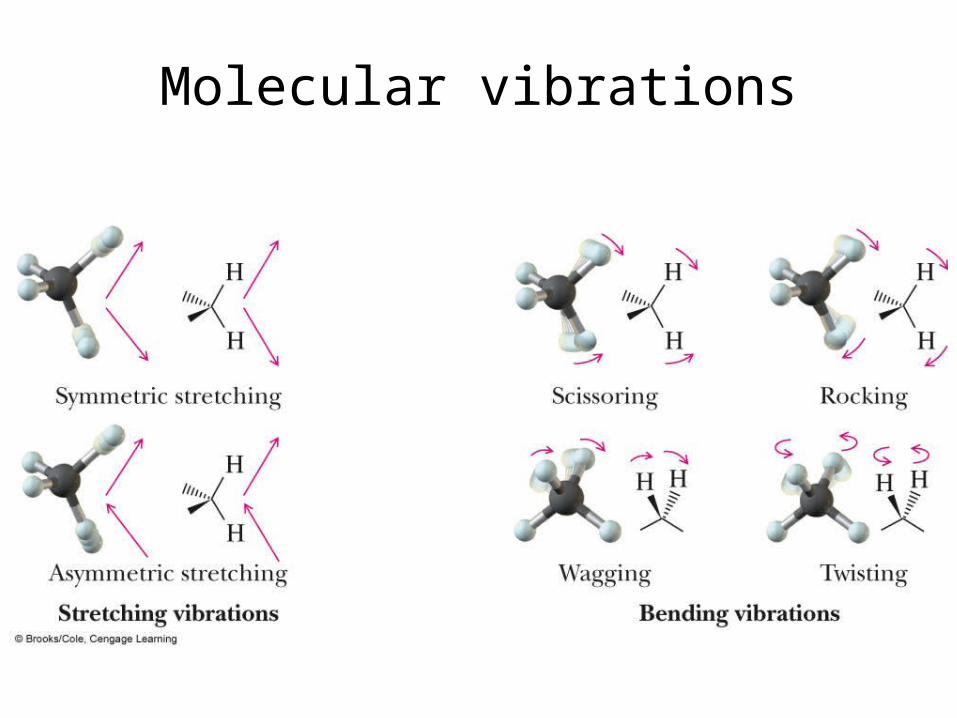
Molecular vibrations
• Fundamental stretching and bending vibrations for a methylene group.
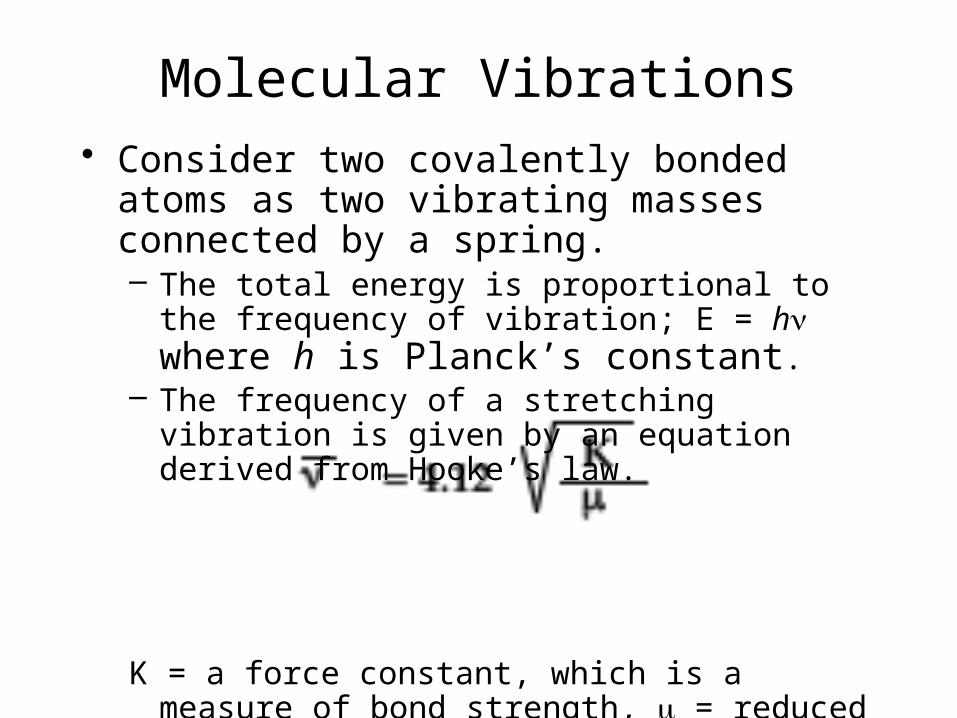
Molecular Vibrations• Consider two covalently bonded atoms as two
vibrating masses connected by a spring.– The total energy is proportional to the frequency of
vibration; E = hn where h is Planck’s constant.
– The frequency of a stretching vibration is given by an equation derived from Hooke’s law.
K = a force constant, which is a measure of bond strength, m = reduced mass of the two atoms, (m1m2)/(m1 + m2), where m is the mass of the atoms in amu.
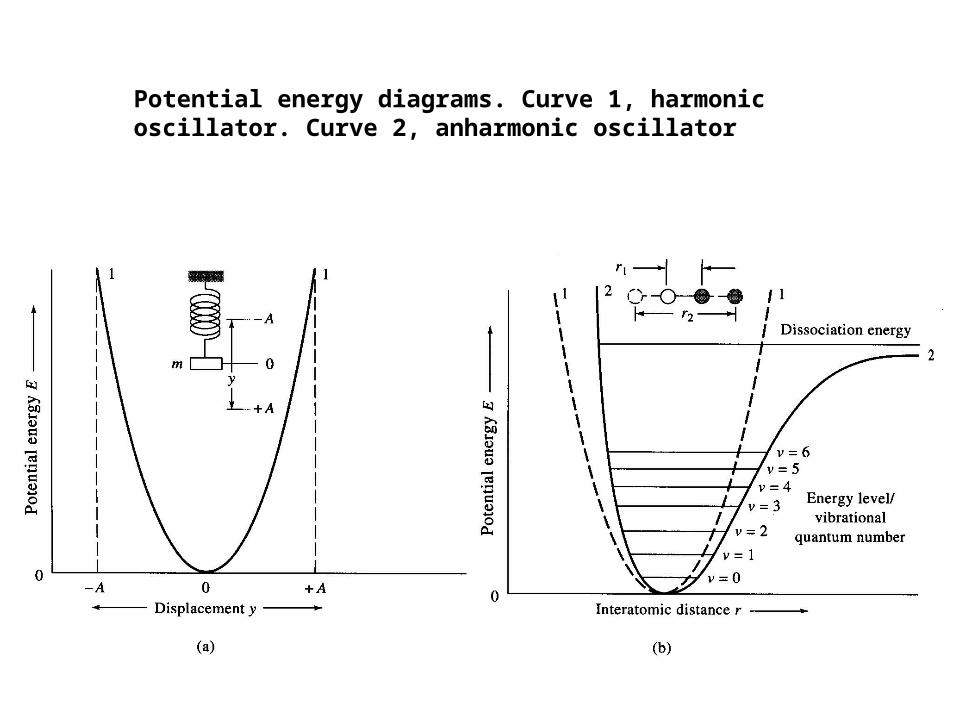
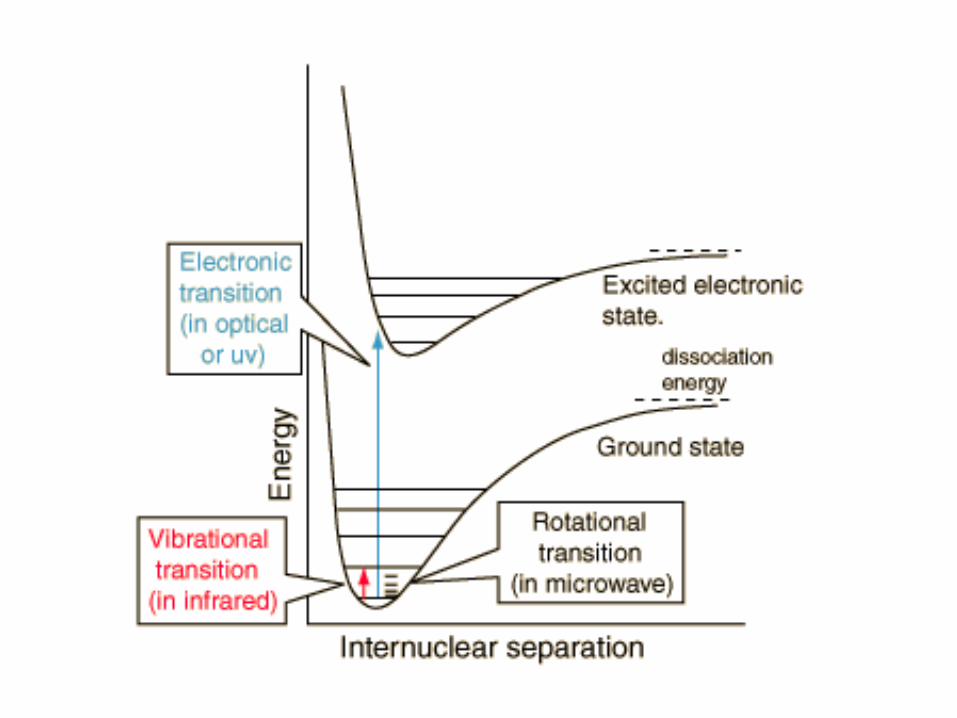
Potential energy diagrams. Curve 1, harmonic oscillator. Curve 2, anharmonic oscillator
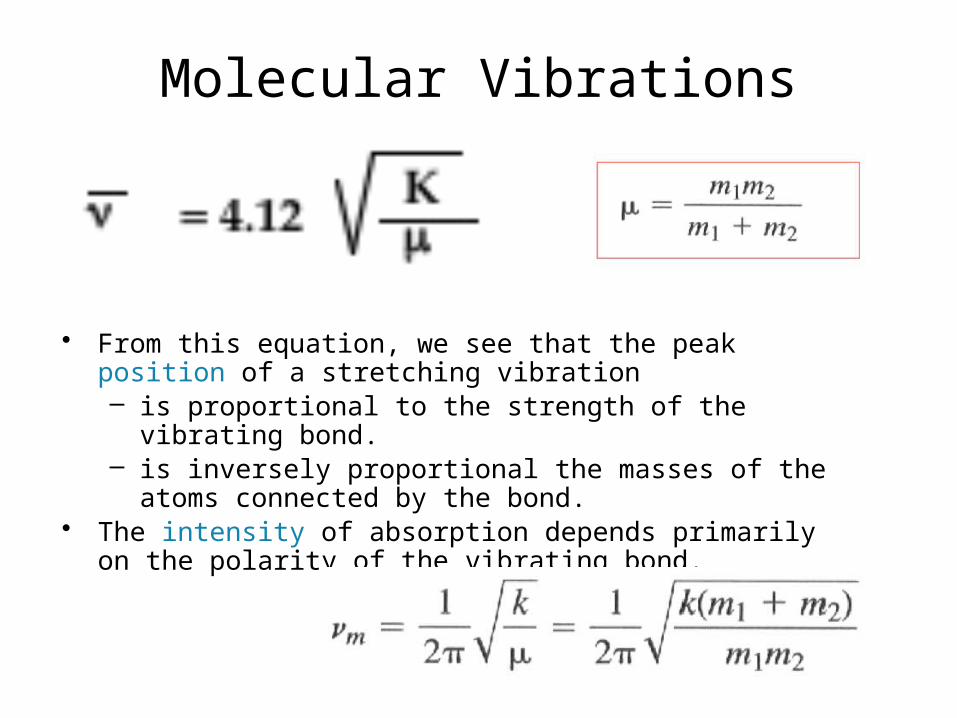
Molecular Vibrations
• From this equation, we see that the peak position of a stretching vibration– is proportional to the strength of the vibrating bond.– is inversely proportional the masses of the atoms connected by
the bond.• The intensity of absorption depends primarily on the polarity of the
vibrating bond.
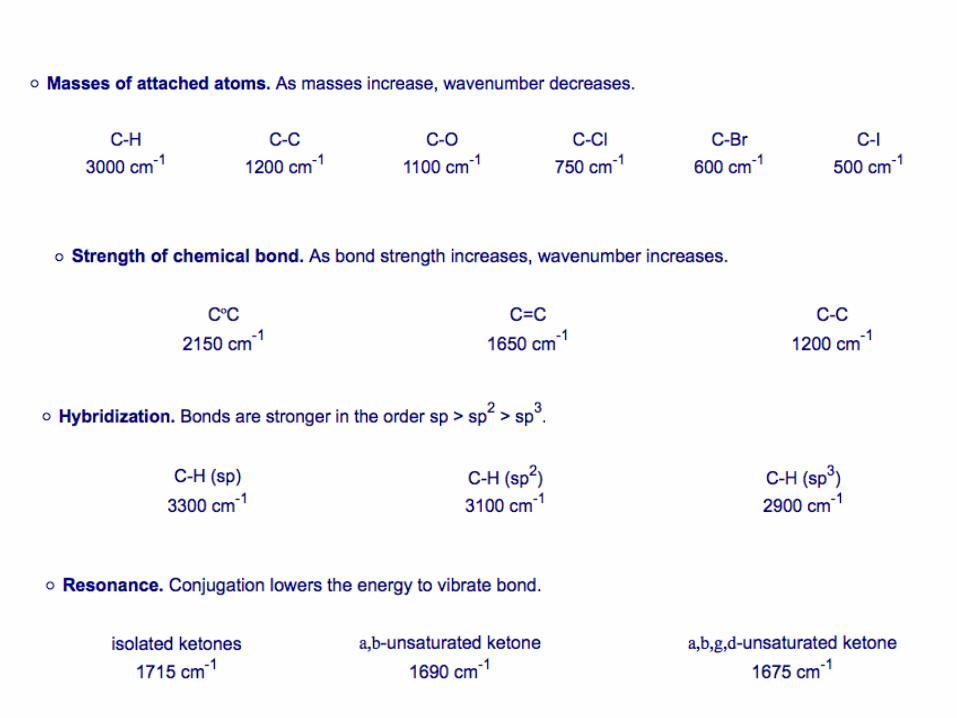
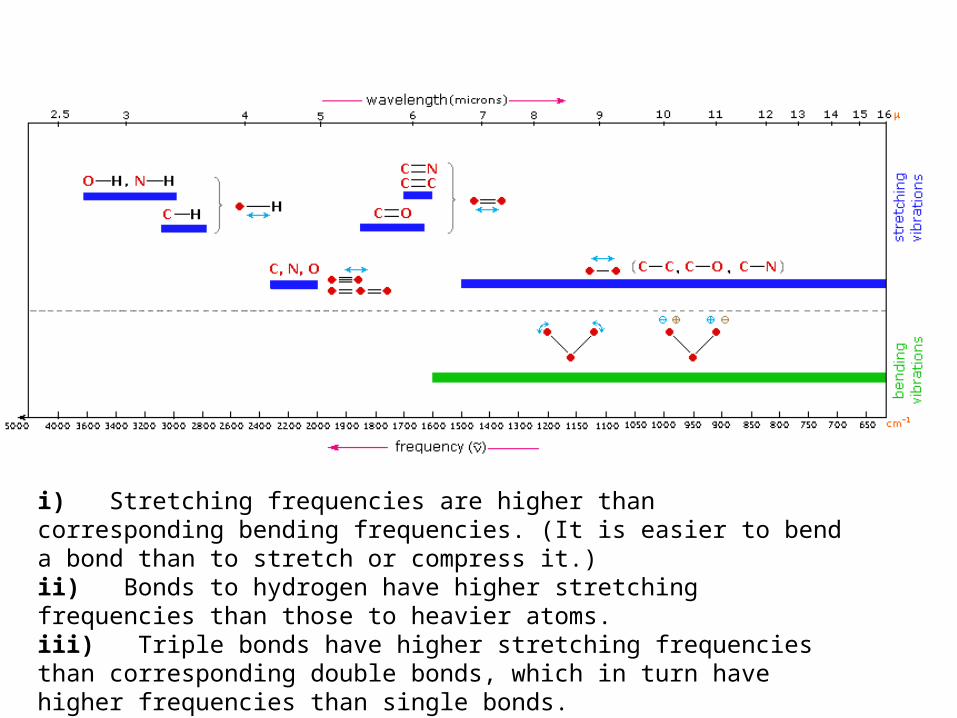
i) Stretching frequencies are higher than corresponding bending frequencies. (It is easier to bend a bond than to stretch or compress it.)ii) Bonds to hydrogen have higher stretching frequencies than those to heavier atoms.iii) Triple bonds have higher stretching frequencies than corresponding double bonds, which in turn have higher frequencies than single bonds.
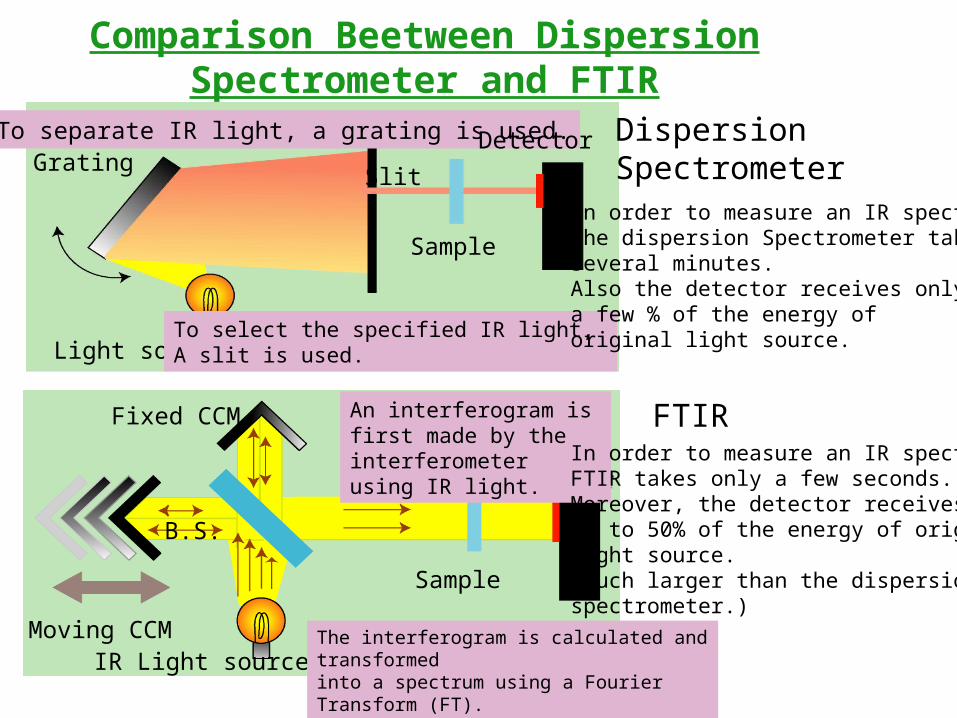
To separate IR light, a grating is used.Grating
Light source
Detector
Sample
Slit
To select the specified IR light, A slit is used.
Dispersion SpectrometerIn order to measure an IR spectrum,the dispersion Spectrometer takesseveral minutes.Also the detector receives onlya few % of the energy oforiginal light source.
Fixed CCM
B.S.
Moving CCMIR Light source
Sample
Detector
An interferogram is first made by the interferometer using IR light.
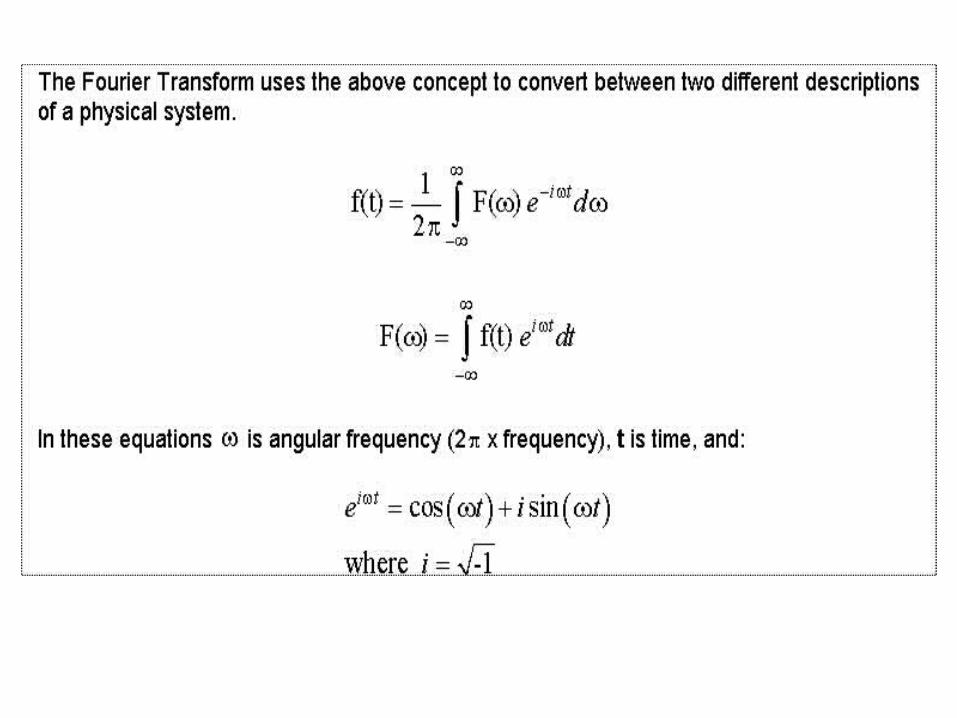
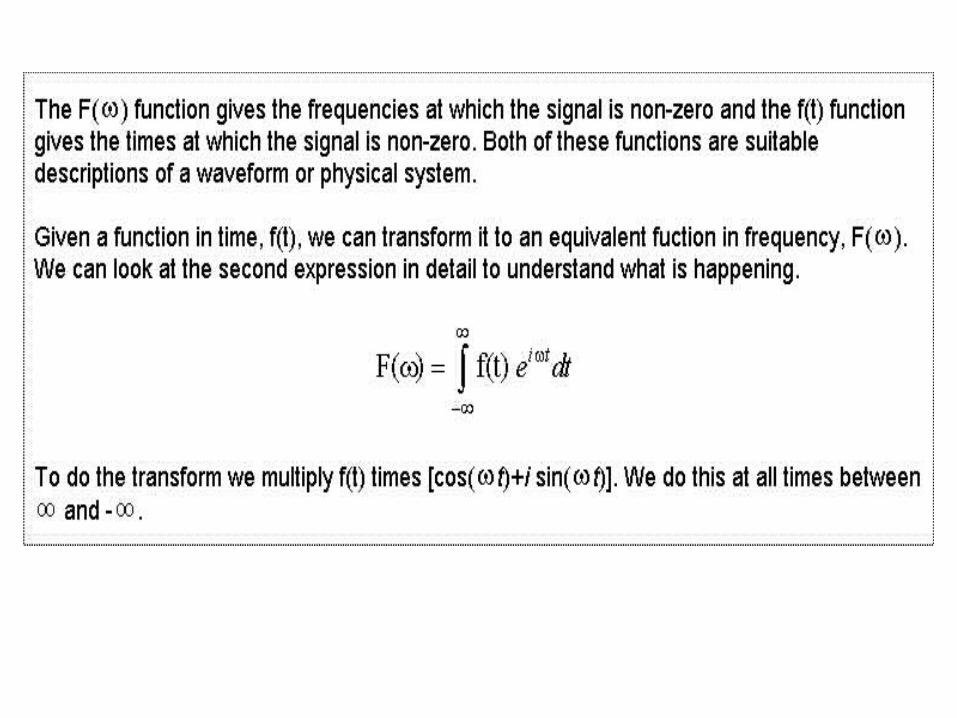
The interferogram is calculated and transformedinto a spectrum using a Fourier Transform (FT).
FTIRIn order to measure an IR spectrum,FTIR takes only a few seconds.Moreover, the detector receivesup to 50% of the energy of originallight source.(much larger than the dispersionspectrometer.)
Comparison Beetween Dispersion Spectrometer and FTIR
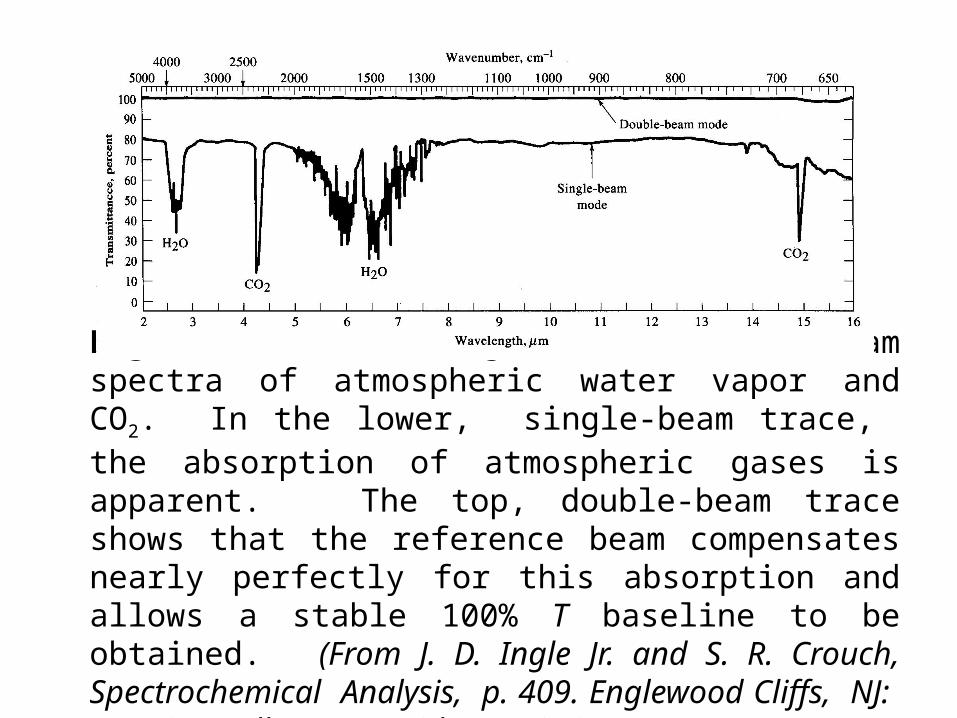
Figure 16-9 Single- and double-beam spectra of atmospheric water vapor and CO2. In the lower, single-beam trace, the absorption of atmospheric gases is apparent. The top, double-beam trace shows that the reference beam compensates nearly perfectly for this absorption and allows a stable 100% T baseline to be obtained. (From J. D. Ingle Jr. and S. R. Crouch, Spectrochemical Analysis, p. 409. Englewood Cliffs, NJ: Prentice-Hall, 1988. With permission.)
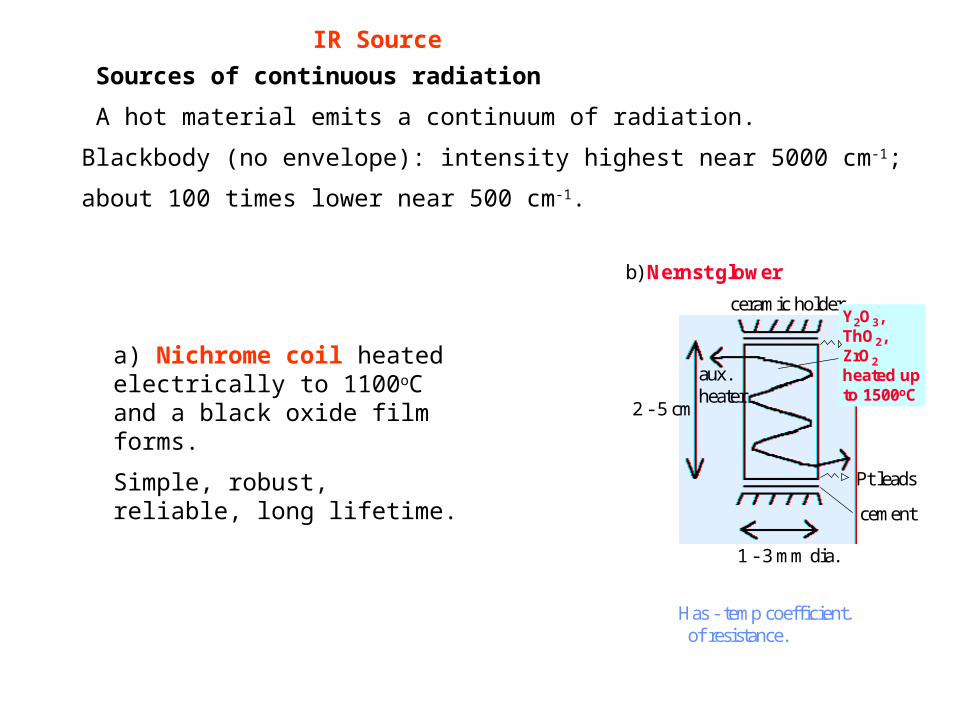
Sources of continuous radiation
A hot material emits a continuum of radiation.
Blackbody (no envelope): intensity highest near 5000 cm-1;
about 100 times lower near 500 cm-1.
IR Source
a) Nichrome coil heated electrically to 1100oC and a black oxide film forms.
Simple, robust, reliable, long lifetime.
b) Nernst glower
aux.heater
2 - 5 cm
Has - temp coefficient.of resistance.
1 - 3 mm dia.
ceramic holderY2O3, ThO2, ZrO2heated up to 1500oC
Pt leads
cement
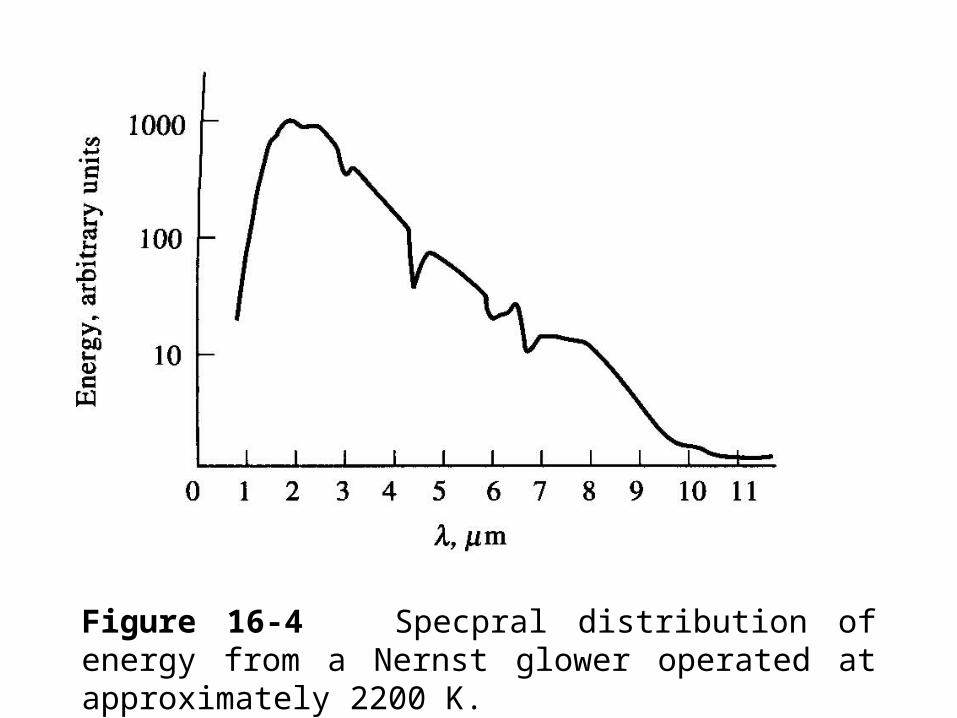
Figure 16-4 Specpral distribution of energy from a Nernst glower operated at approximately 2200 K.
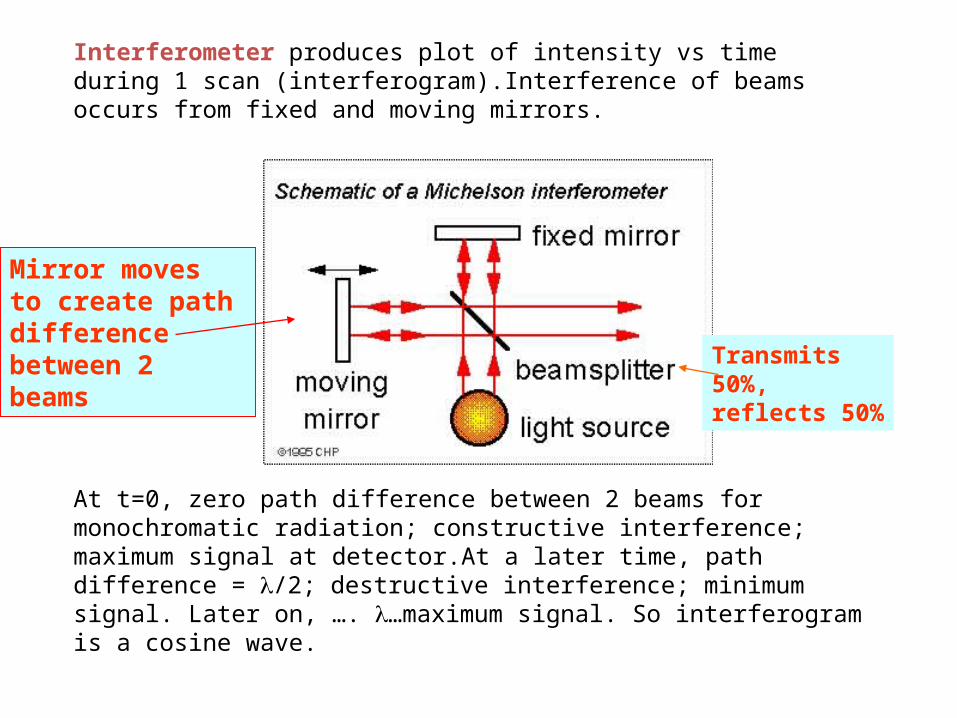
Interferometer produces plot of intensity vs time during 1 scan (interferogram).Interference of beams occurs from fixed and moving mirrors.
At t=0, zero path difference between 2 beams for monochromatic radiation; constructive interference; maximum signal at detector.At a later time, path difference = /2; destructive interference; minimum signal. Later on, …. …maximum signal. So interferogram is a cosine wave.
Mirror moves to create path difference between 2 beams Transmits 50%,
reflects 50%
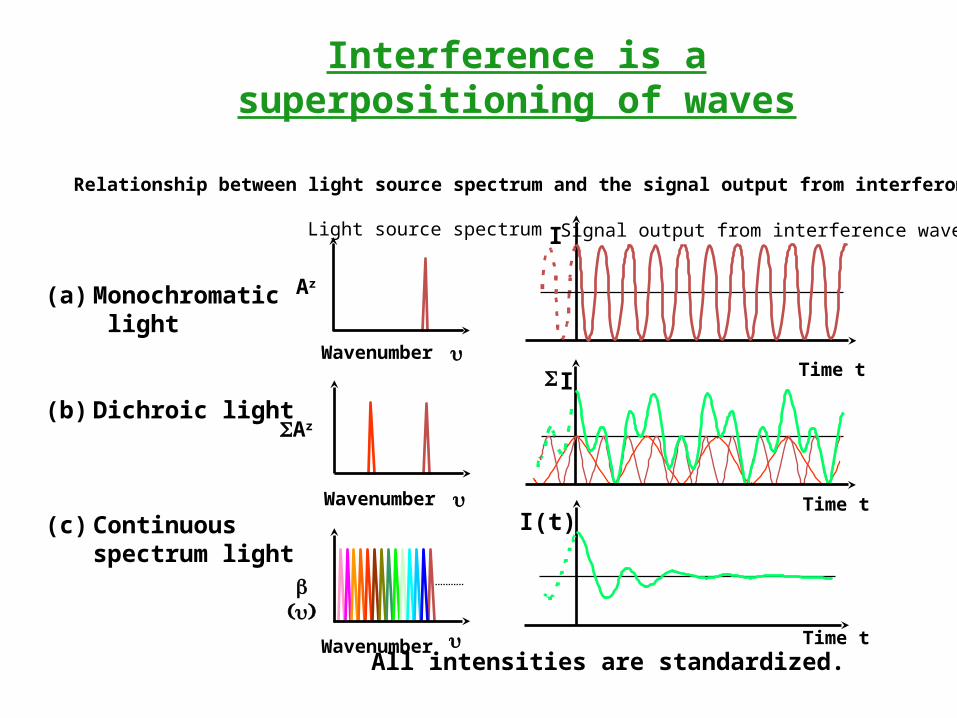
Relationship between light source spectrum and the signal output from interferometer
(a) Monochromatic light
(b) Dichroic light
(c) Continuous spectrum light
All intensities are standardized.
Light source spectrum Signal output from interference wave
Time t
Time t
Time tI(t)
I
b( )u
Wavenumber u
Wavenumber u
Wavenumber u
S I
SAz
Az
FTIR seminar
Interference is a superpositioning of waves
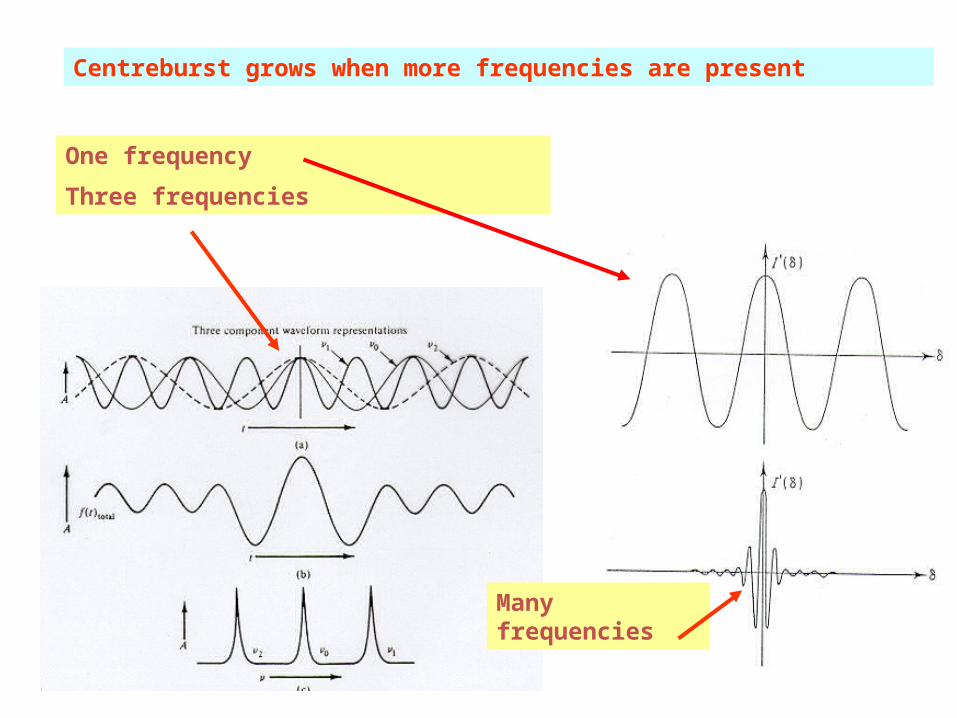
Centreburst grows when more frequencies are present
One frequency
Three frequencies
Many frequencies
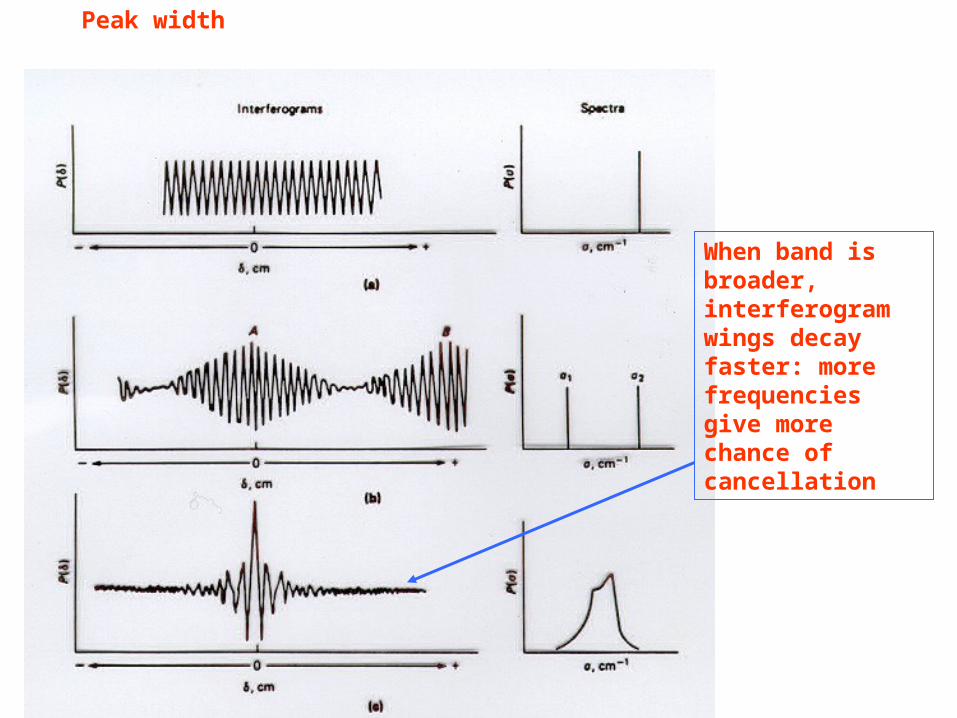
When band is broader, interferogram wings decay faster: more frequencies give more chance of cancellation
Peak width
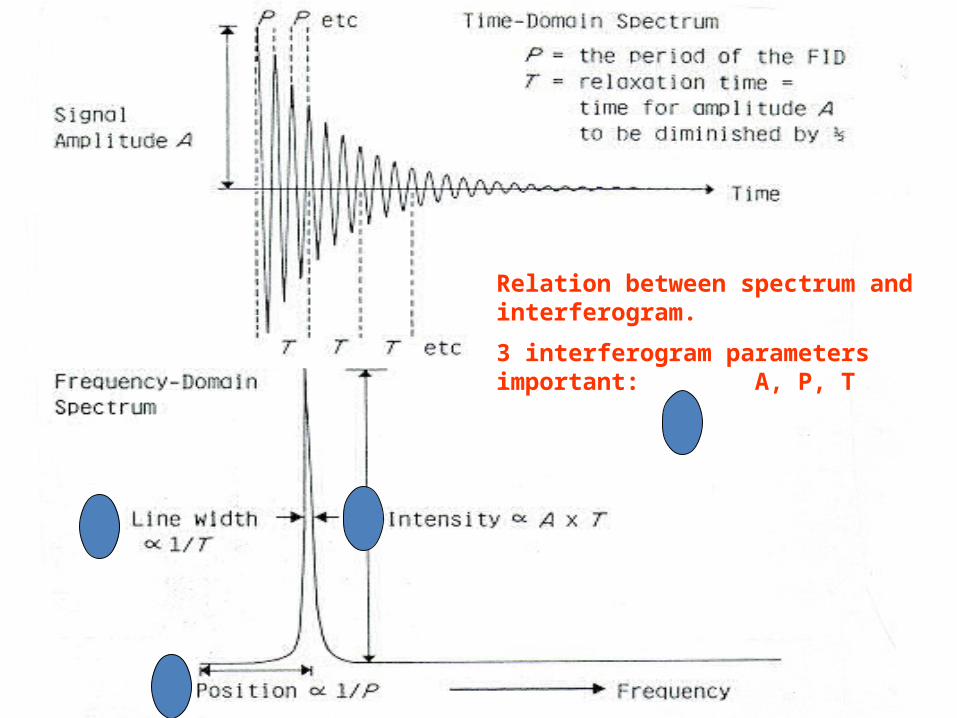
Relation between spectrum and interferogram.
3 interferogram parameters important: A, P, T
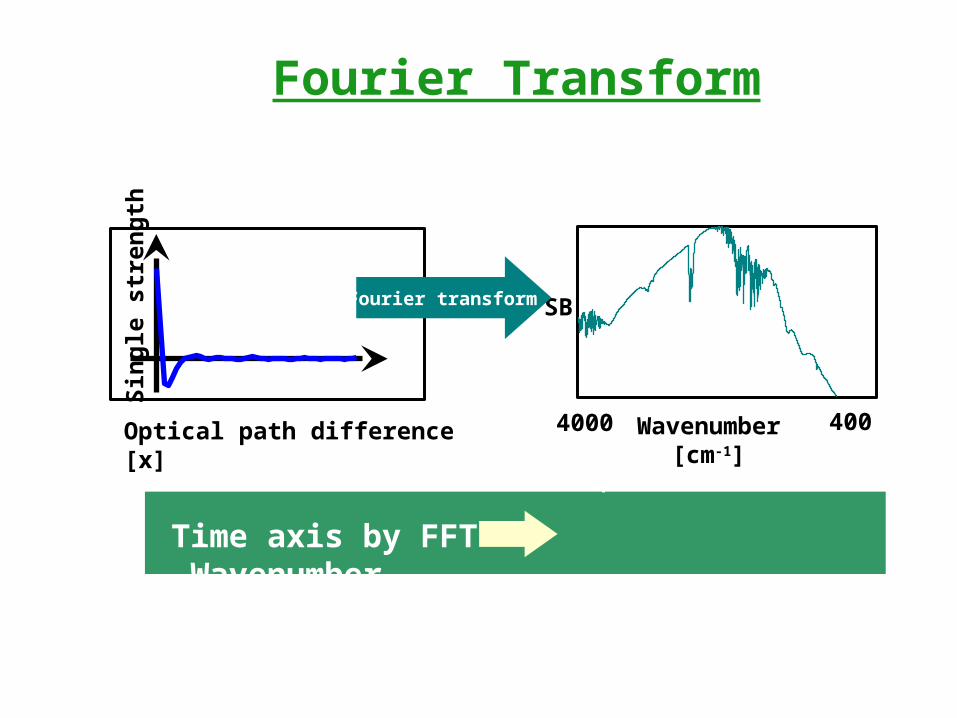
4000 400
SBFourier transform
Optical path difference [x](Interferogram) (Single beam spectrum)
Wavenumber[cm-1]
Sin
gle
str
eng
th
Time axis by FFT Wavenumber
Fourier Transform
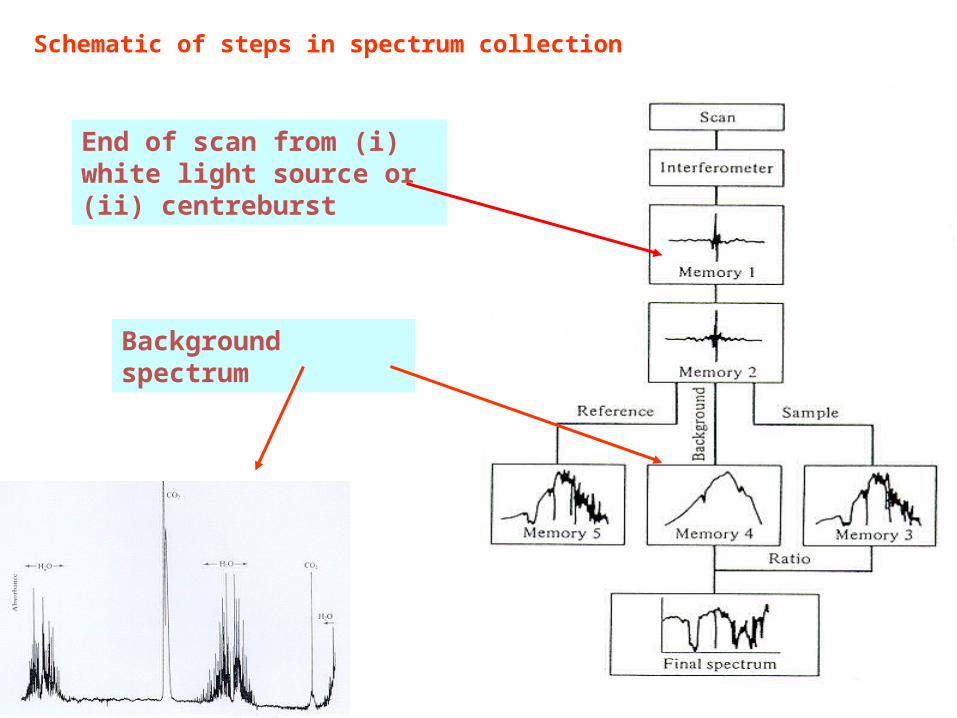
Schematic of steps in spectrum collection
Background spectrum
End of scan from (i) white light source or (ii) centreburst

Advantages of FT-instrument over dispersive one
1. Fellgett advantage
All frequencies are measured simultaneously. Typical scan times are only a few seconds.
2. Jacquinot advantage
The energy throughput is higher for any resolution, giving a higher signal:noise ratio.
3. Connes advantage
The laser wavelength is used as a reference for the calculation of band positions, and is precise.
4. Stray light
This only comes from aliasing and can be prevented.
5. Resolution
This is constant for the whole spectral range
6. Robustness
FT instruments only have 1 moving part
Instrument scanning
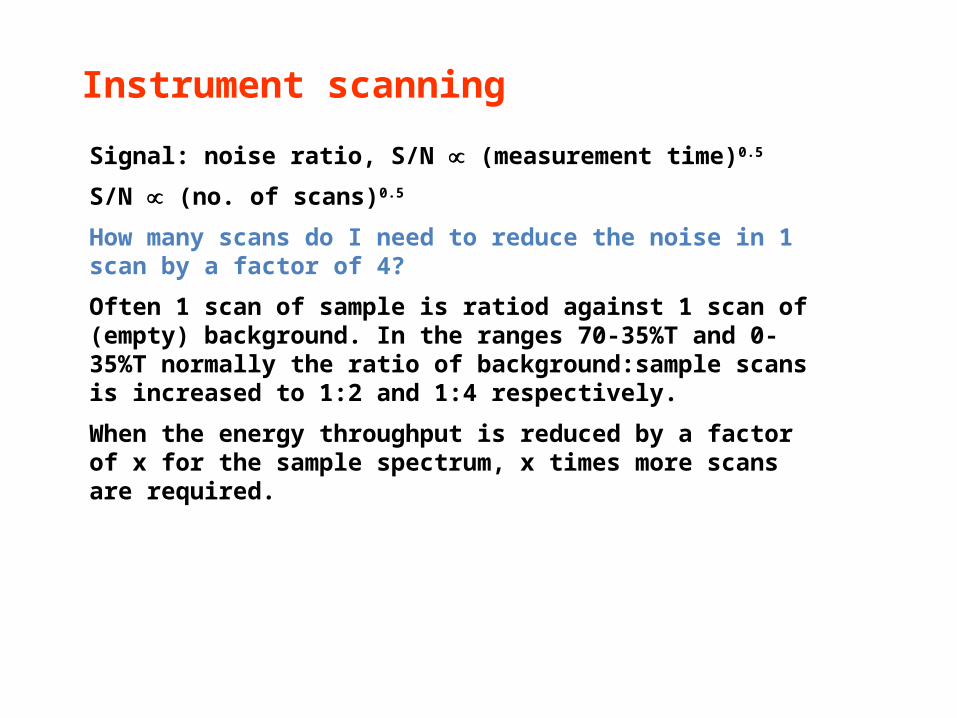
Signal: noise ratio, S/N (measurement time)0.5
S/N (no. of scans)0.5
How many scans do I need to reduce the noise in 1 scan by a factor of 4?
Often 1 scan of sample is ratiod against 1 scan of (empty) background. In the ranges 70-35%T and 0-35%T normally the ratio of background:sample scans is increased to 1:2 and 1:4 respectively.
When the energy throughput is reduced by a factor of x for the sample spectrum, x times more scans are required.
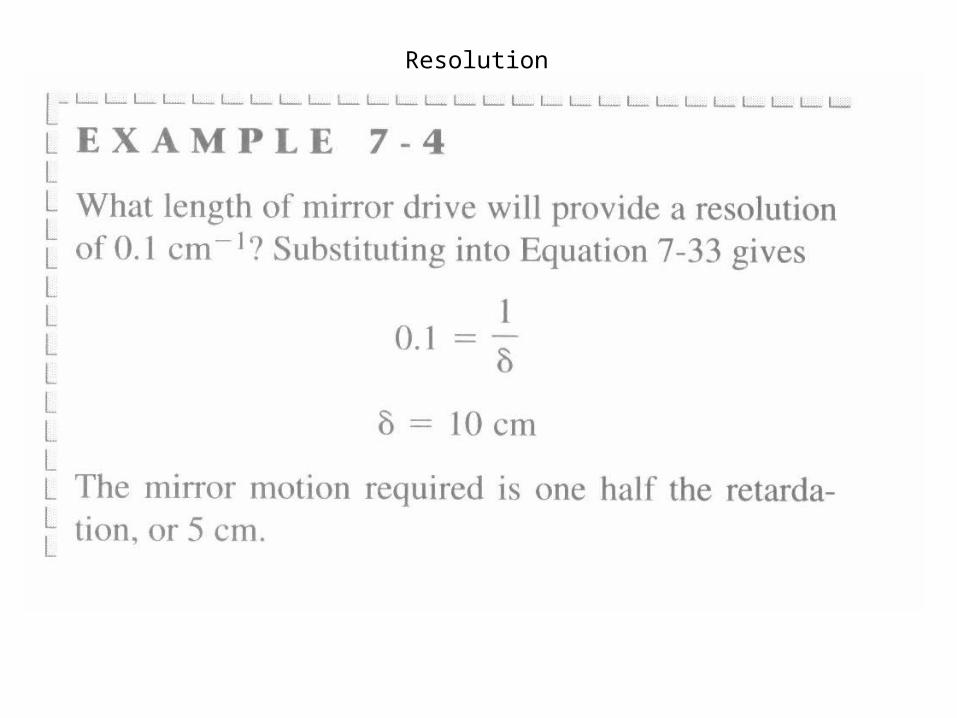
Resolution

Sample preparation Methods
Transmission– Solids: KBr Pellet– Liquids: NaCl Plates
Quick press KBr pellet press
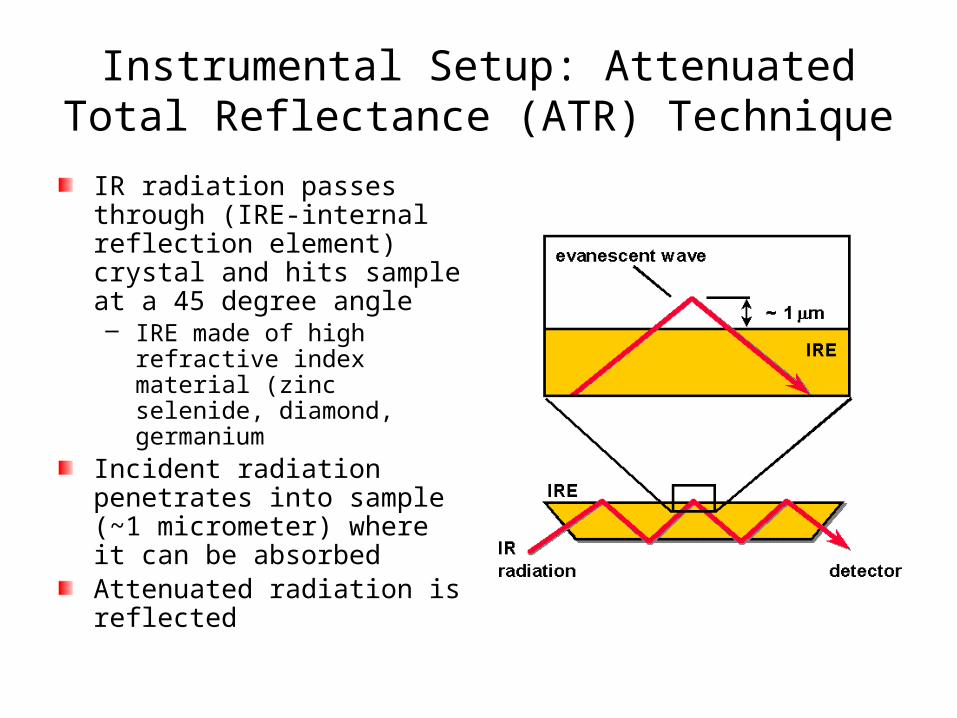
Instrumental Setup: Attenuated Total Reflectance (ATR) Technique
IR radiation passes through (IRE-internal reflection element) crystal and hits sample at a 45 degree angle– IRE made of high refractive index
material (zinc selenide, diamond, germanium
Incident radiation penetrates into sample (~1 micrometer) where it can be absorbedAttenuated radiation is reflected
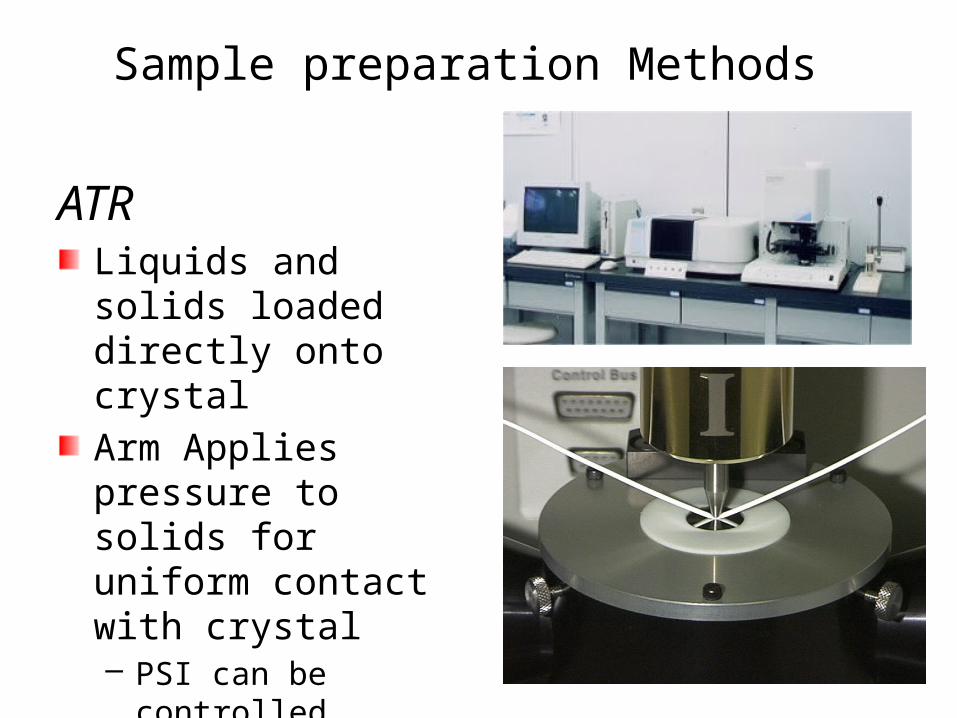
Sample preparation Methods
ATRLiquids and solids loaded directly onto crystalArm Applies pressure to solids for uniform contact with crystal– PSI can be controlled
Transmission vs. ATR
ATRAdvantagesHigh Quality Spectrum for qualitative analysisMinimal sample preparation
– Non destructive– Time efficient
Spectra not affected by sample thickness– Radiation penetrates only a few micrometers
Highly reproducible resultsWide variety of sample types
– Threads, yarns, fabrics, fibers, pastes, powders, suspensions, polymers, rubbers
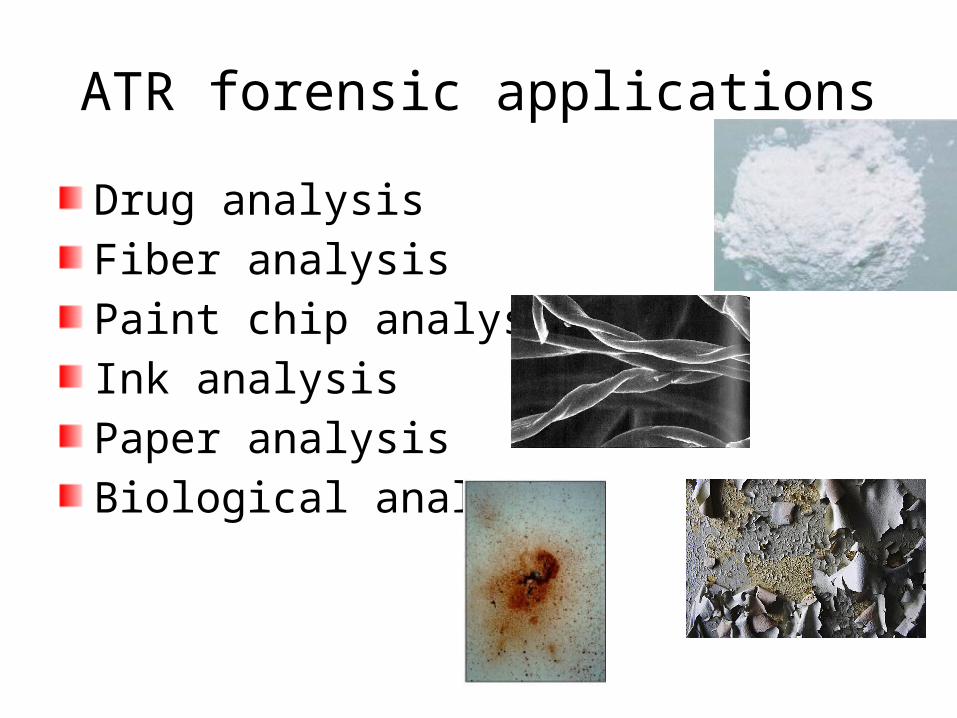
ATR forensic applications
Drug analysisFiber analysisPaint chip analysisInk analysisPaper analysisBiological analysis
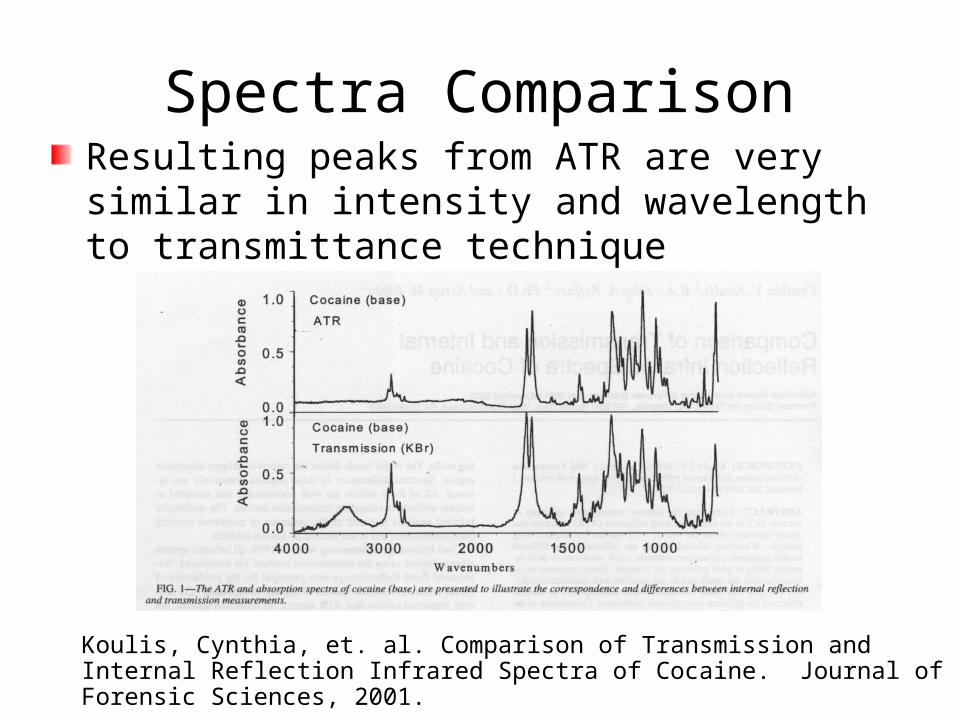
Spectra ComparisonResulting peaks from ATR are very similar in intensity and wavelength to transmittance technique
Koulis, Cynthia, et. al. Comparison of Transmission and Internal Reflection Infrared Spectra of Cocaine. Journal of Forensic Sciences, 2001.
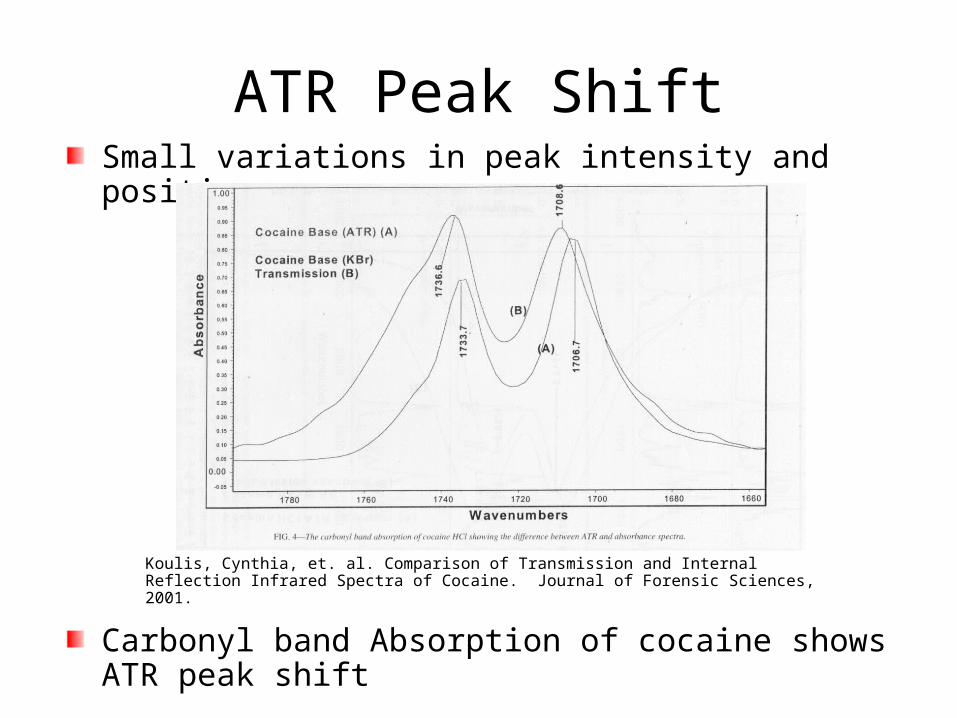
ATR Peak ShiftSmall variations in peak intensity and position occur:
Carbonyl band Absorption of cocaine shows ATR peak shiftKoulis, Cynthia, et. al. Comparison of Transmission and Internal Reflection Infrared Spectra of Cocaine. Journal of Forensic Sciences, 2001.
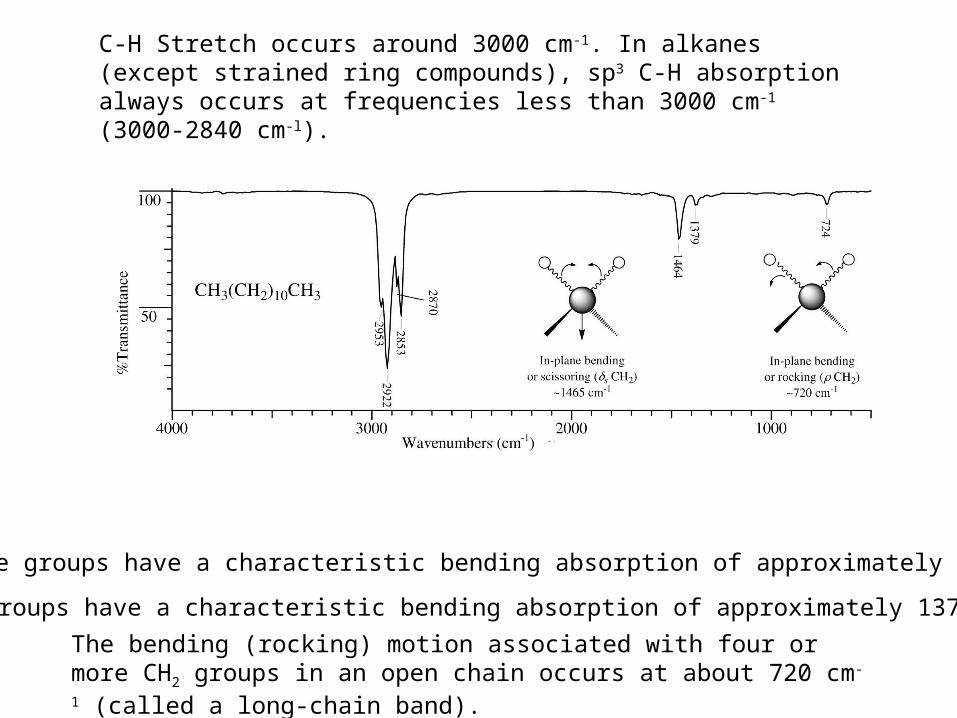
C-H Stretch occurs around 3000 cm-1. In alkanes (except strained ring compounds), sp3 C-H absorption always occurs at frequencies less than 3000 cm-1 (3000-2840 cm-l).
Methylene groups have a characteristic bending absorption of approximately 1465 cm-1.
Methyl groups have a characteristic bending absorption of approximately 1375 cm-1.
The bending (rocking) motion associated with four or more CH2 groups in an open chain occurs at about 720 cm-1 (called a long-chain band).
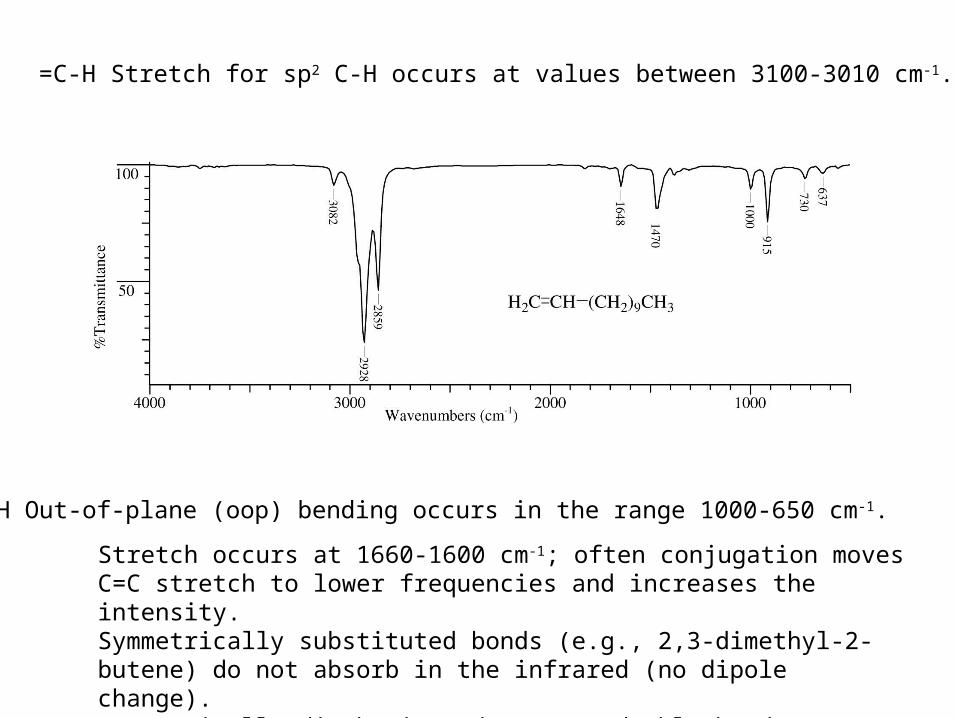
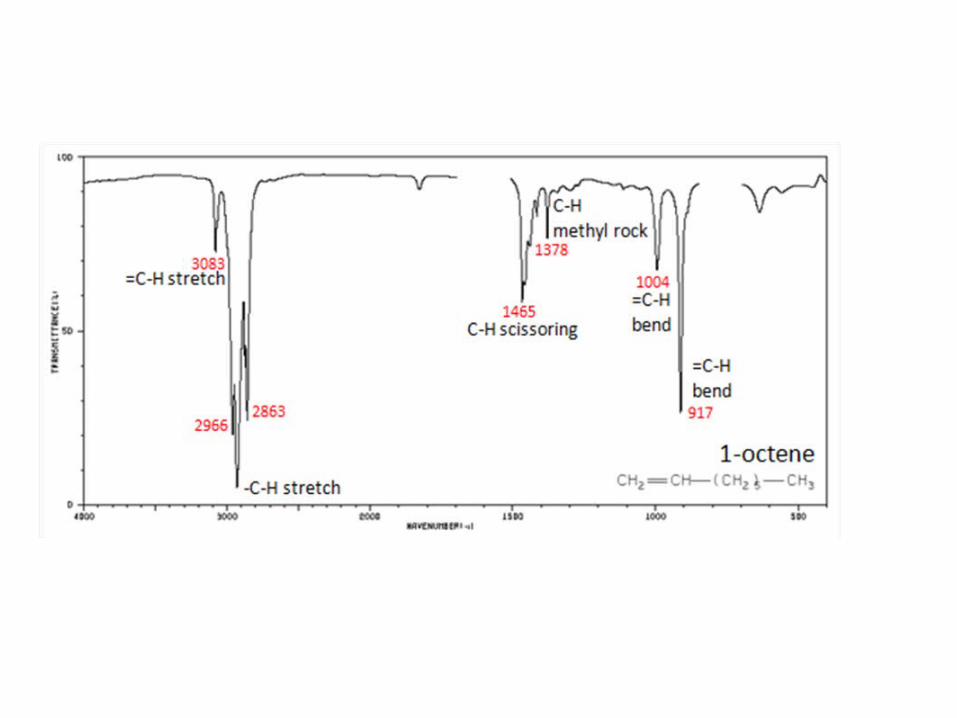
=C-H Stretch for sp2 C-H occurs at values between 3100-3010 cm-1.
=C-H Out-of-plane (oop) bending occurs in the range 1000-650 cm-1.
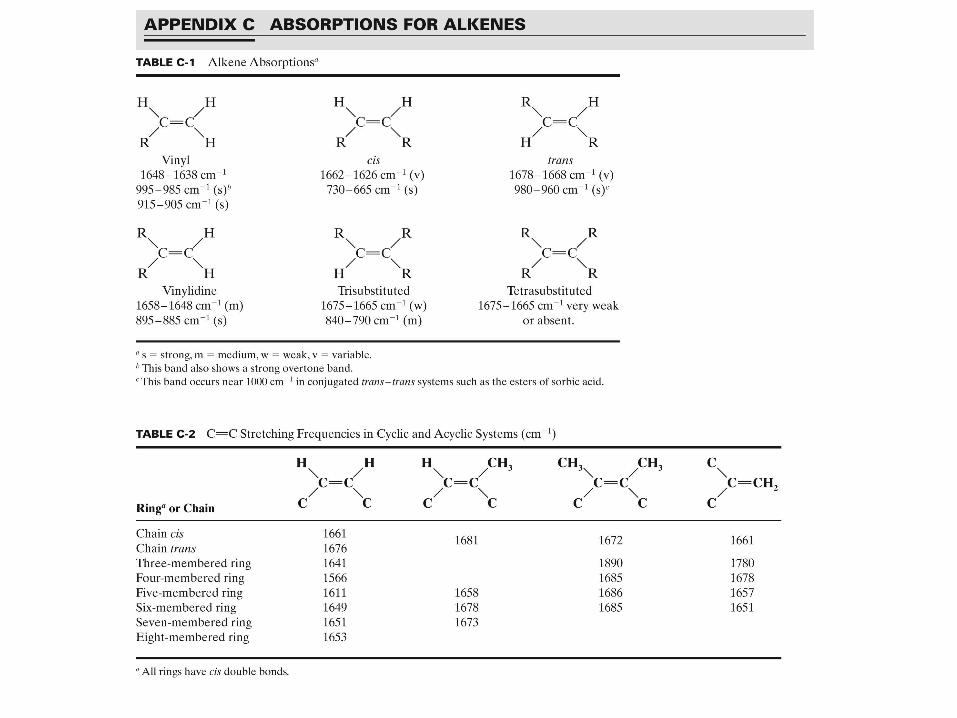
Stretch occurs at 1660-1600 cm-1; often conjugation moves C=C stretch to lower frequencies and increases the intensity.Symmetrically substituted bonds (e.g., 2,3-dimethyl-2-butene) do not absorb in the infrared (no dipole change).Symmetrically disubstituted (trans) double bonds are often vanishingly weak in absorption; cis are stronger.
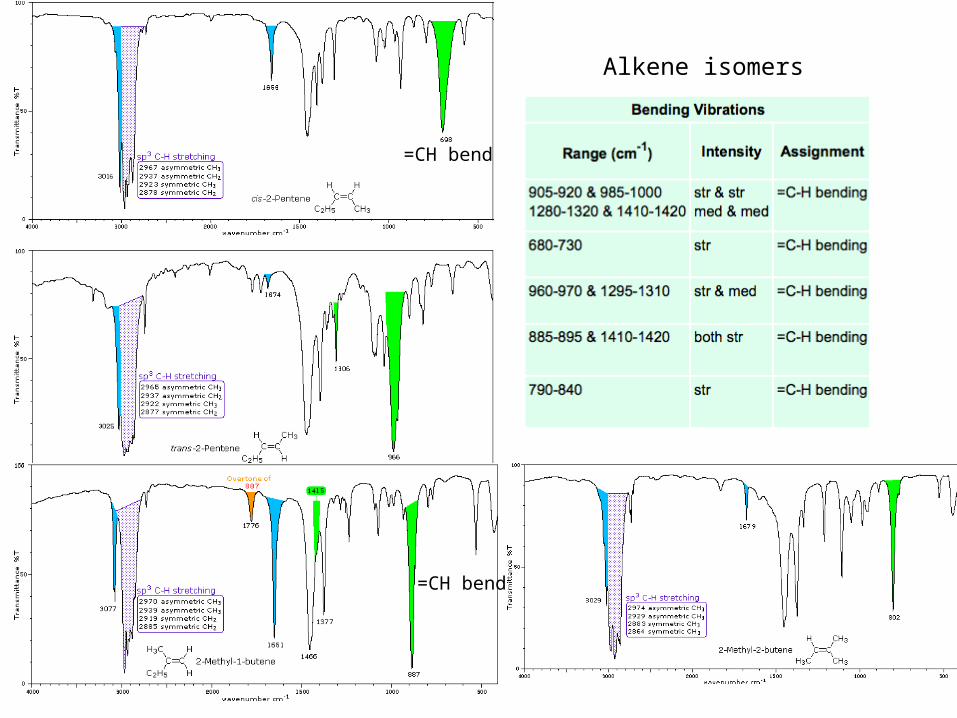
=CH bend
=CH bend
Alkene isomers
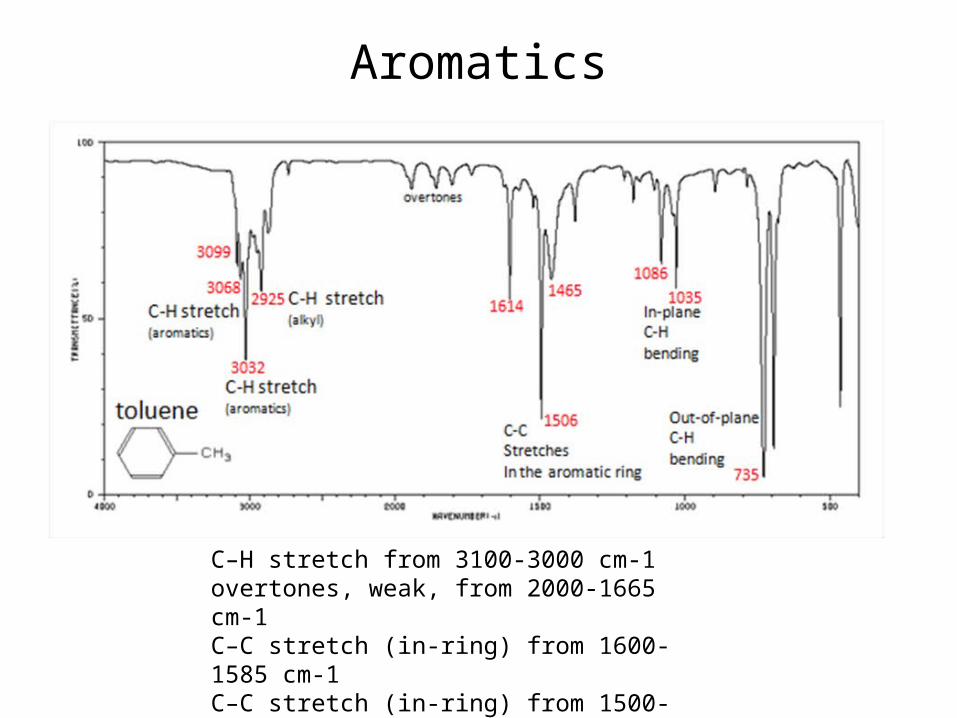
Aromatics
C–H stretch from 3100-3000 cm-1overtones, weak, from 2000-1665 cm-1C–C stretch (in-ring) from 1600-1585 cm-1C–C stretch (in-ring) from 1500-1400 cm-1C–H "oop" from 900-675 cm-1
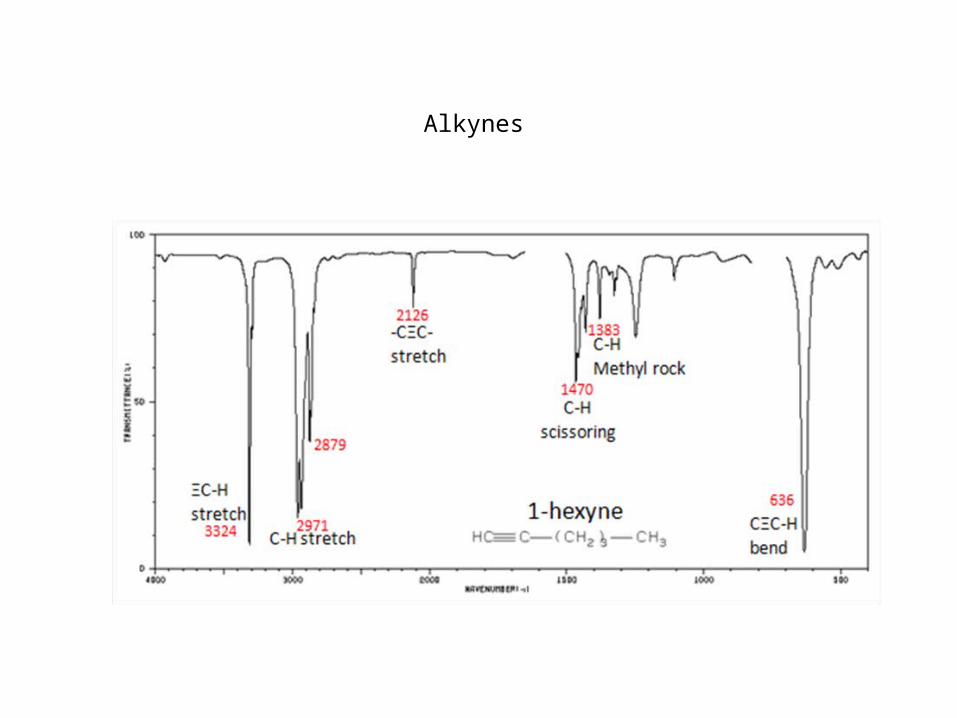
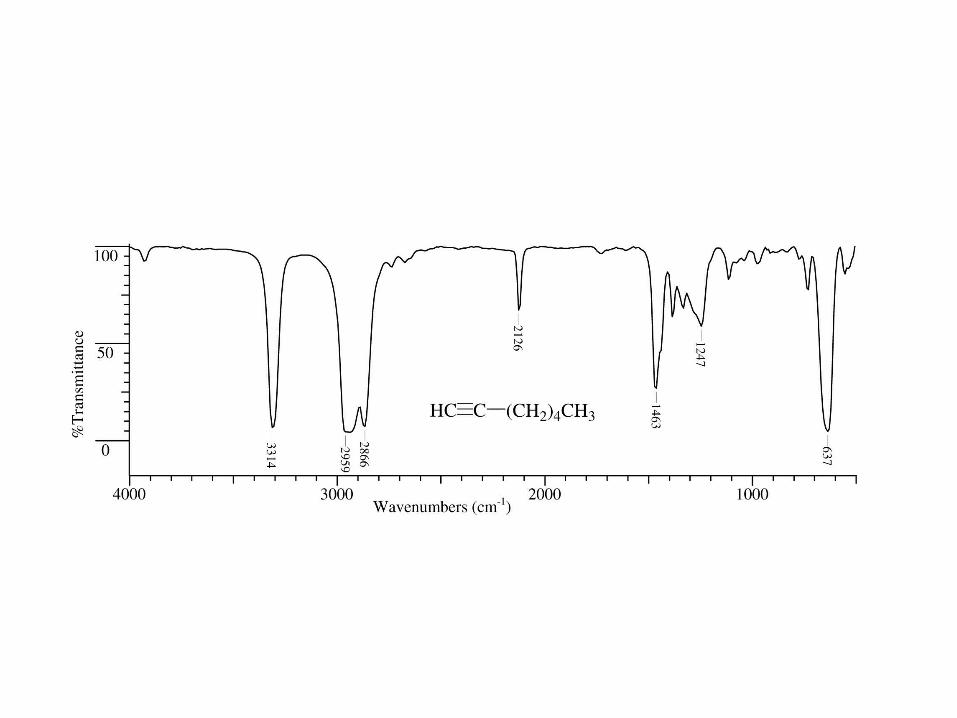
Alkynes
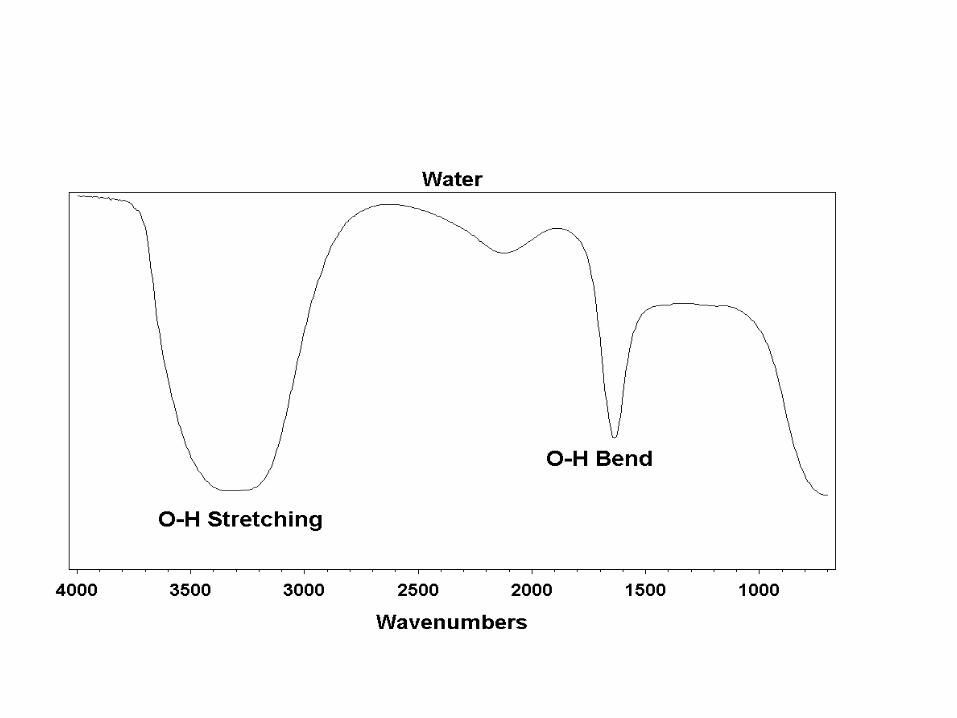
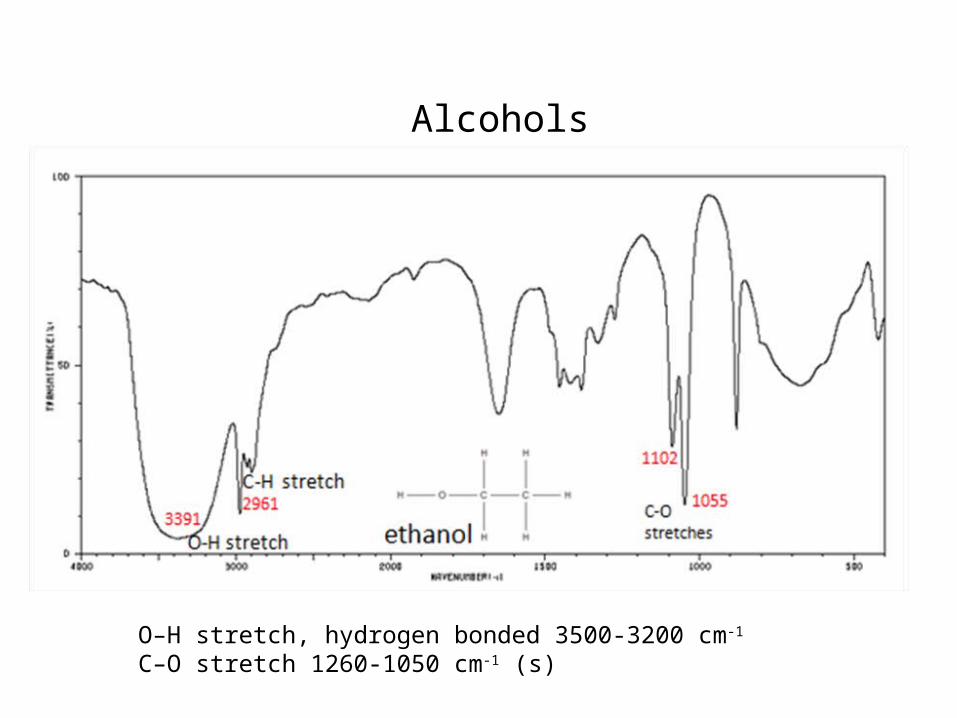
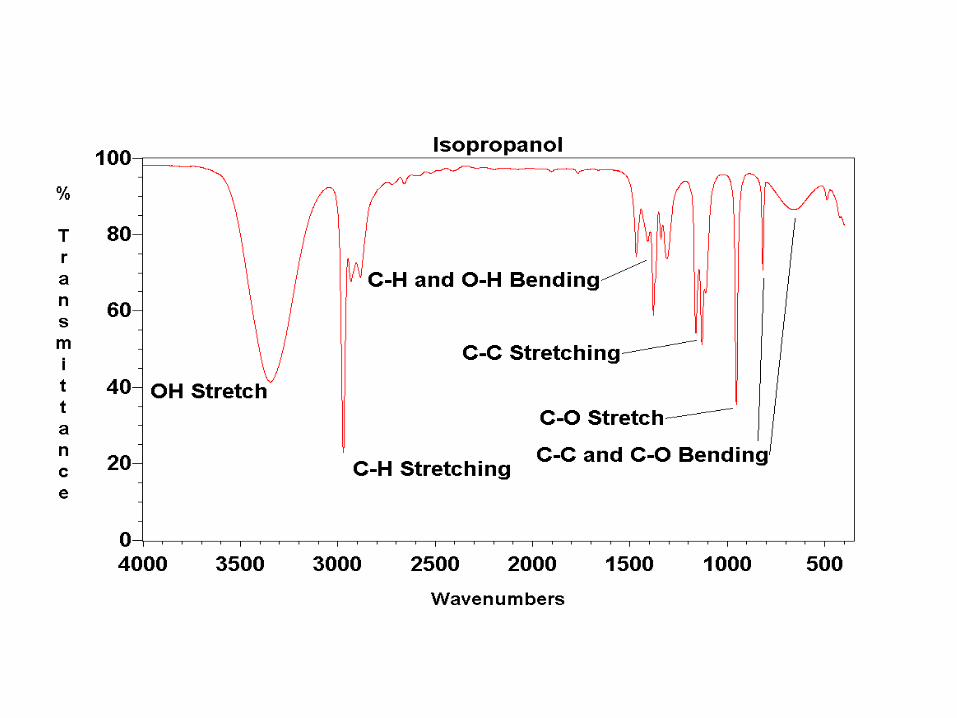
O–H stretch, hydrogen bonded 3500-3200 cm-1
C–O stretch 1260-1050 cm-1 (s)
Alcohols
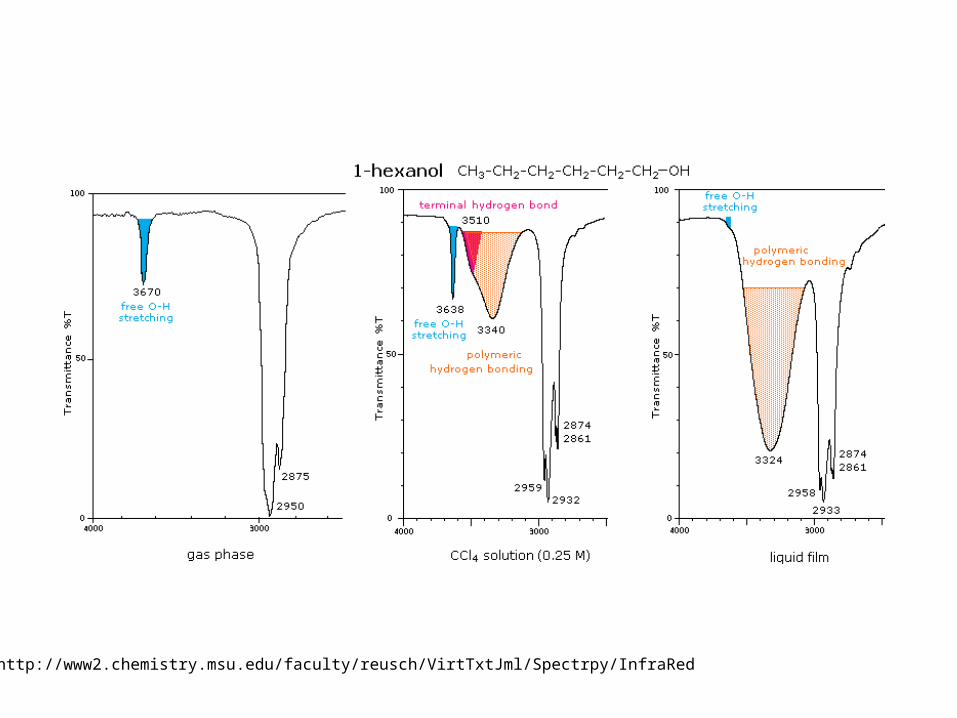
http://www2.chemistry.msu.edu/faculty/reusch/VirtTxtJml/Spectrpy/InfraRed
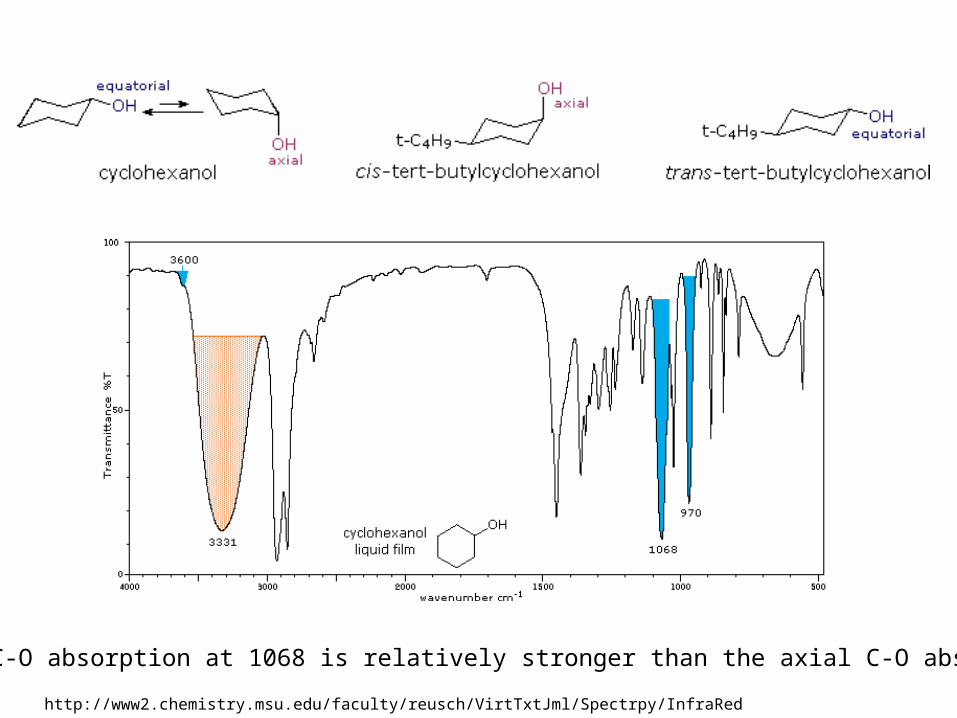
equatorial C-O absorption at 1068 is relatively stronger than the axial C-O absorption at 970
http://www2.chemistry.msu.edu/faculty/reusch/VirtTxtJml/Spectrpy/InfraRed
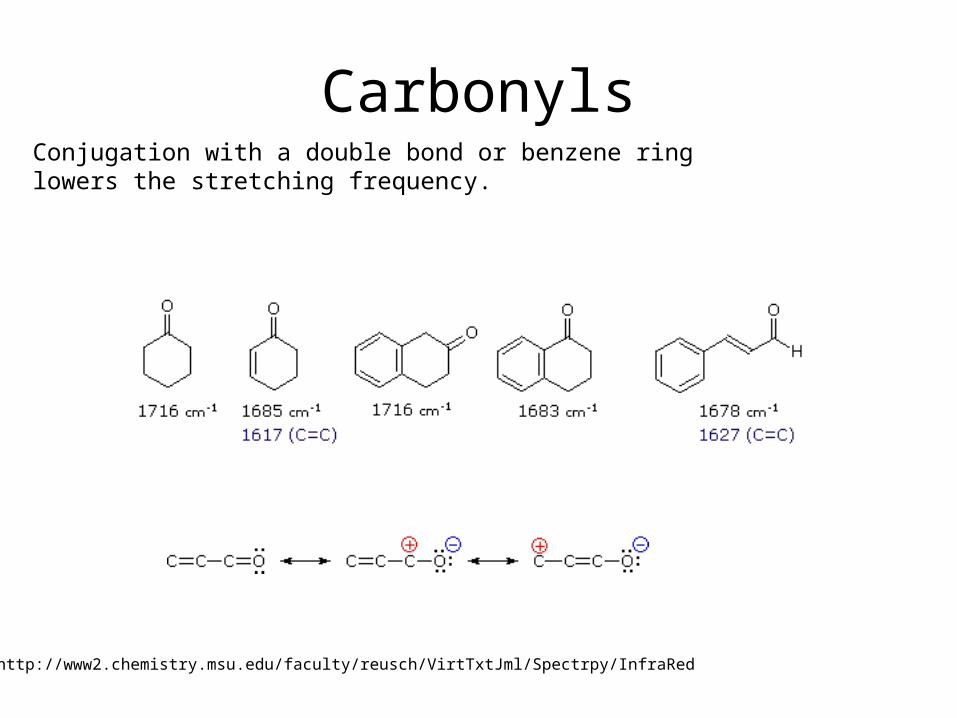
CarbonylsConjugation with a double bond or benzene ring lowers the stretching frequency.
http://www2.chemistry.msu.edu/faculty/reusch/VirtTxtJml/Spectrpy/InfraRed
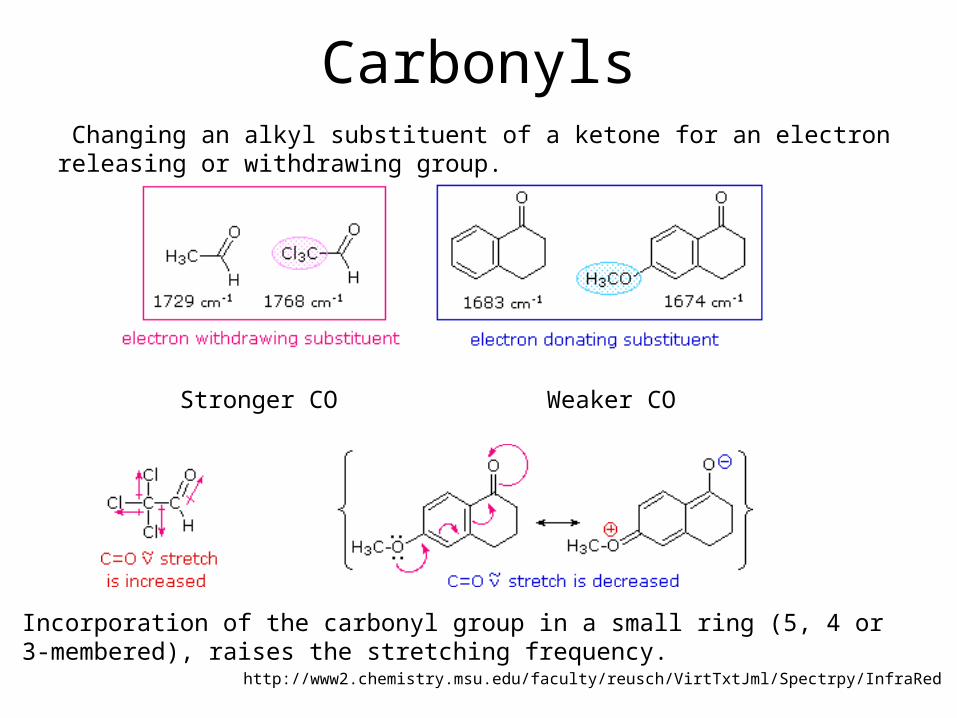
Carbonyls
Incorporation of the carbonyl group in a small ring (5, 4 or 3-membered), raises the stretching frequency.
Changing an alkyl substituent of a ketone for an electron releasing or withdrawing group.
Weaker COStronger CO
http://www2.chemistry.msu.edu/faculty/reusch/VirtTxtJml/Spectrpy/InfraRed
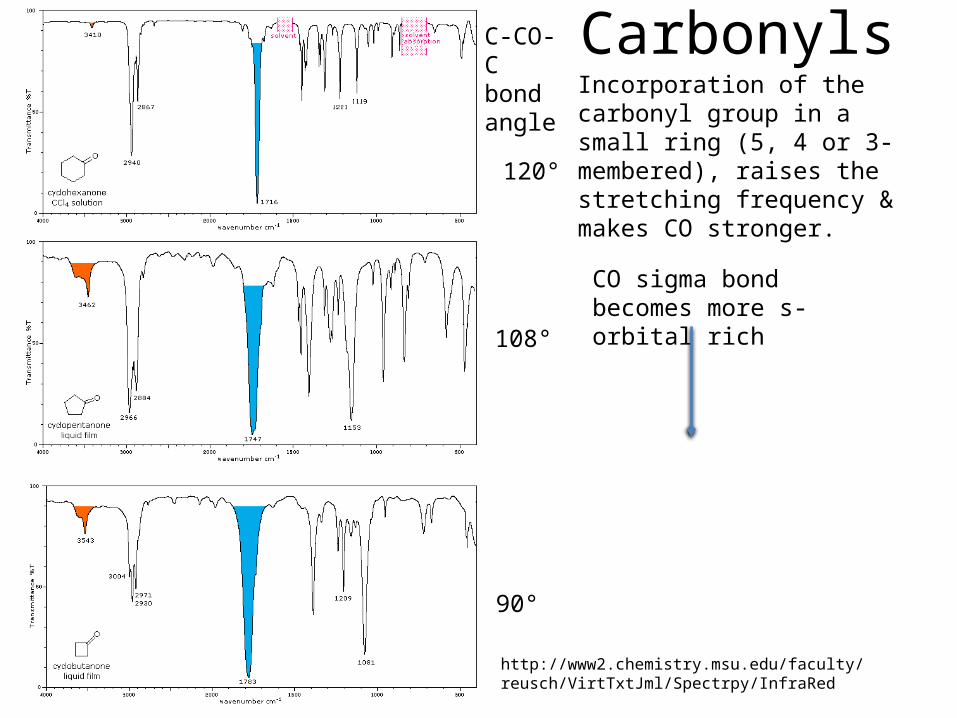
CarbonylsIncorporation of the carbonyl group in a small ring (5, 4 or 3-membered), raises the stretching frequency & makes CO stronger.
C-CO-C bond angle
120°
108°
90°
CO sigma bond becomes more s-orbital rich
http://www2.chemistry.msu.edu/faculty/reusch/VirtTxtJml/Spectrpy/InfraRed
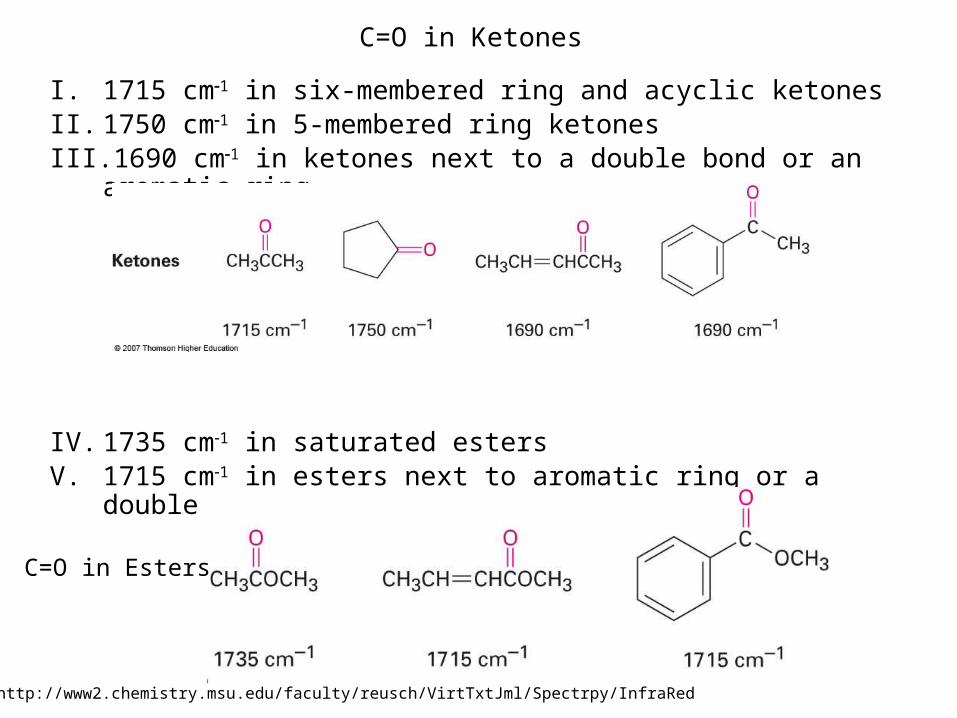
C=O in Ketones
I. 1715 cm1 in six-membered ring and acyclic ketonesII. 1750 cm1 in 5-membered ring ketonesIII. 1690 cm1 in ketones next to a double bond or an aromatic ring
IV. 1735 cm1 in saturated estersV. 1715 cm1 in esters next to aromatic ring or a double bond
C=O in Esters
http://www2.chemistry.msu.edu/faculty/reusch/VirtTxtJml/Spectrpy/InfraRed
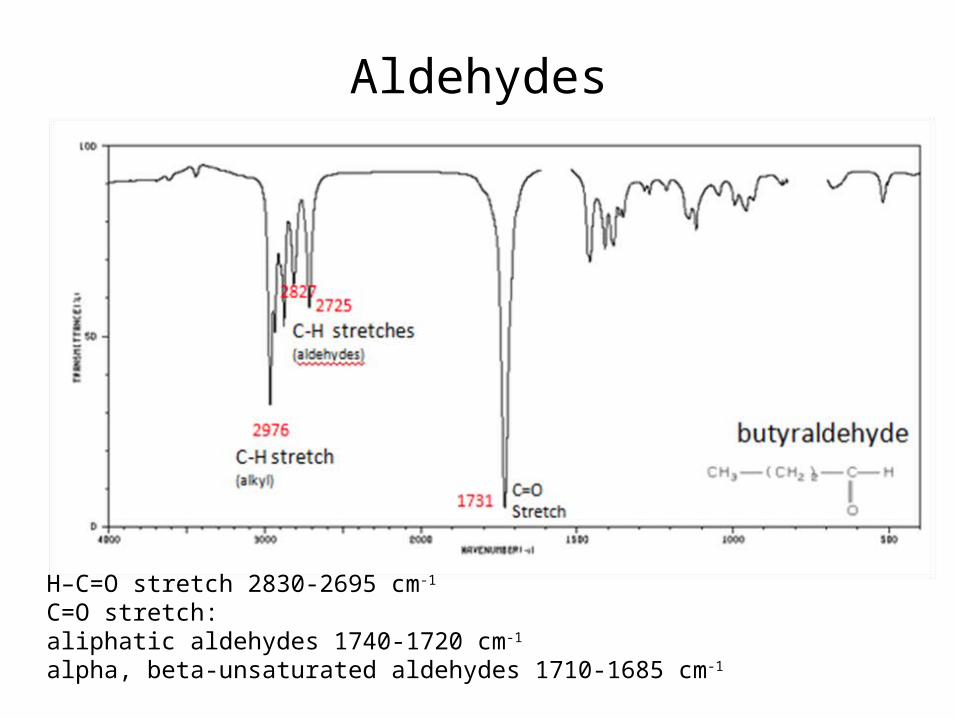
Aldehydes
H–C=O stretch 2830-2695 cm-1 C=O stretch: aliphatic aldehydes 1740-1720 cm-1
alpha, beta-unsaturated aldehydes 1710-1685 cm-1
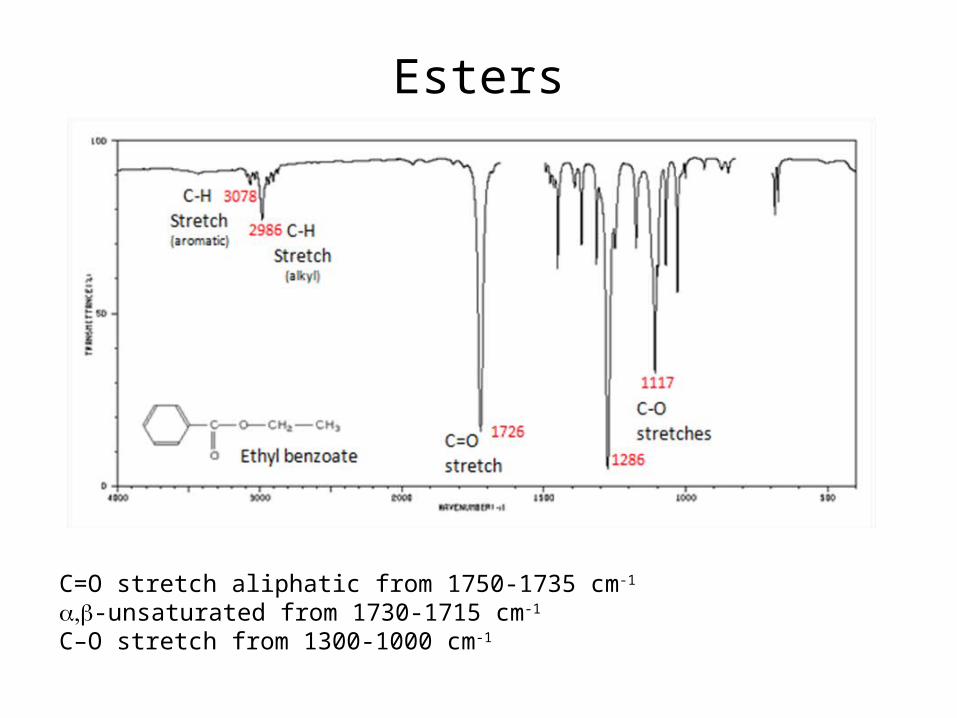
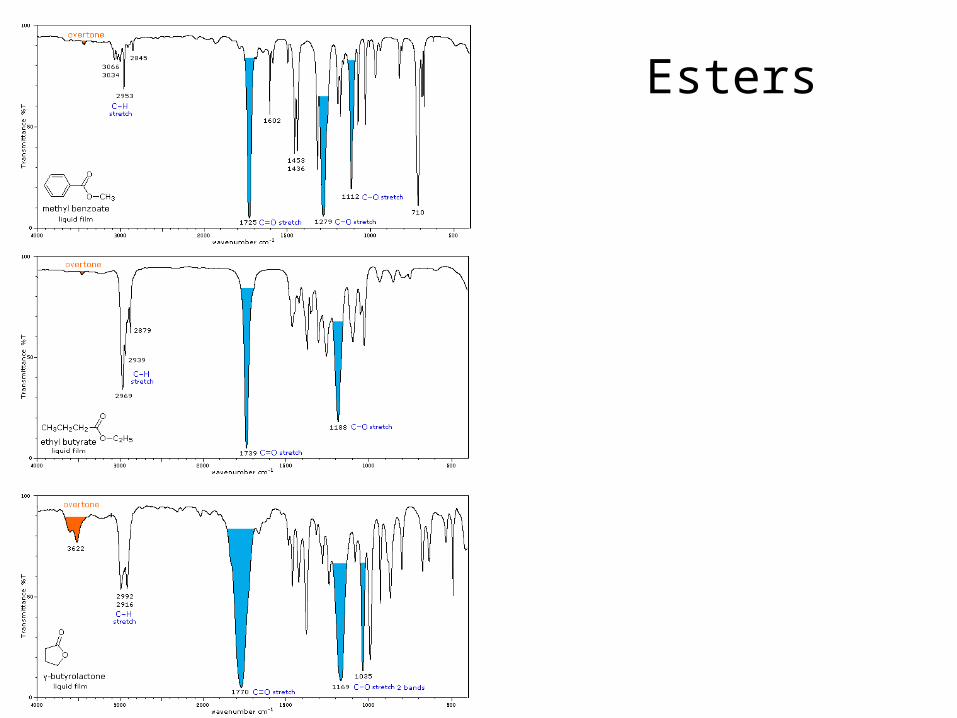
Esters
C=O stretch aliphatic from 1750-1735 cm-1
,a b-unsaturated from 1730-1715 cm-1
C–O stretch from 1300-1000 cm-1
Esters
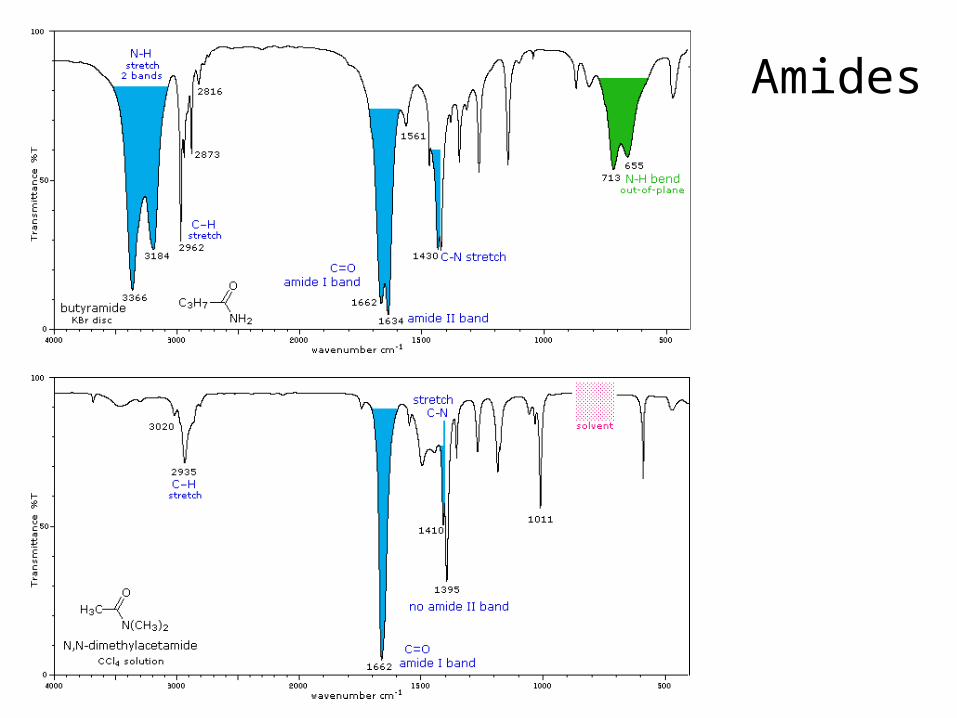
Amides
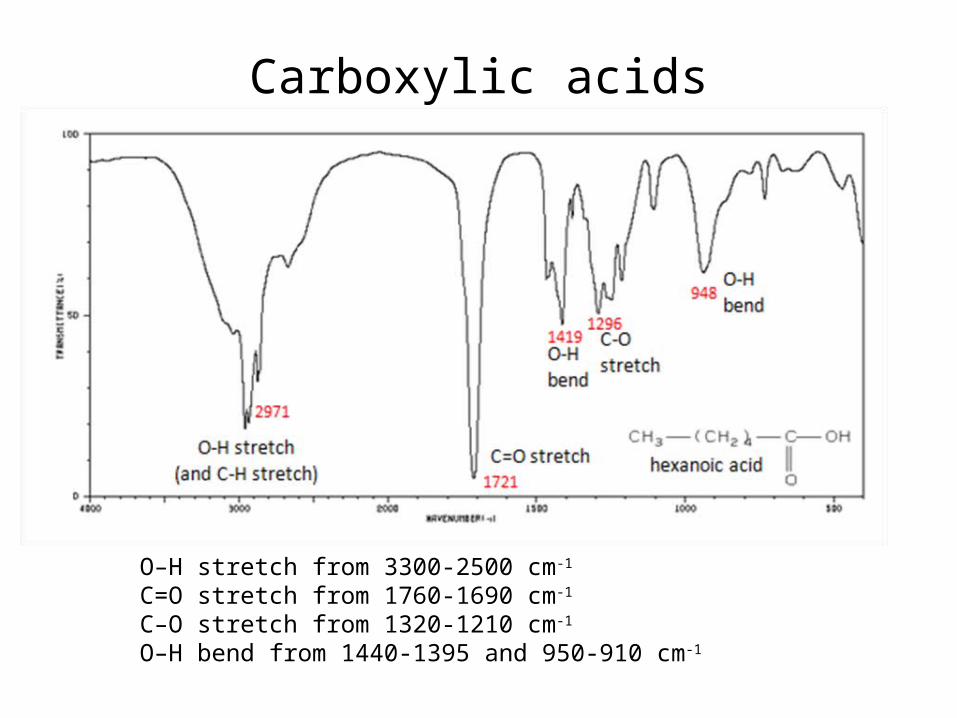
Carboxylic acids
O–H stretch from 3300-2500 cm-1 C=O stretch from 1760-1690 cm-1 C–O stretch from 1320-1210 cm-1 O–H bend from 1440-1395 and 950-910 cm-1
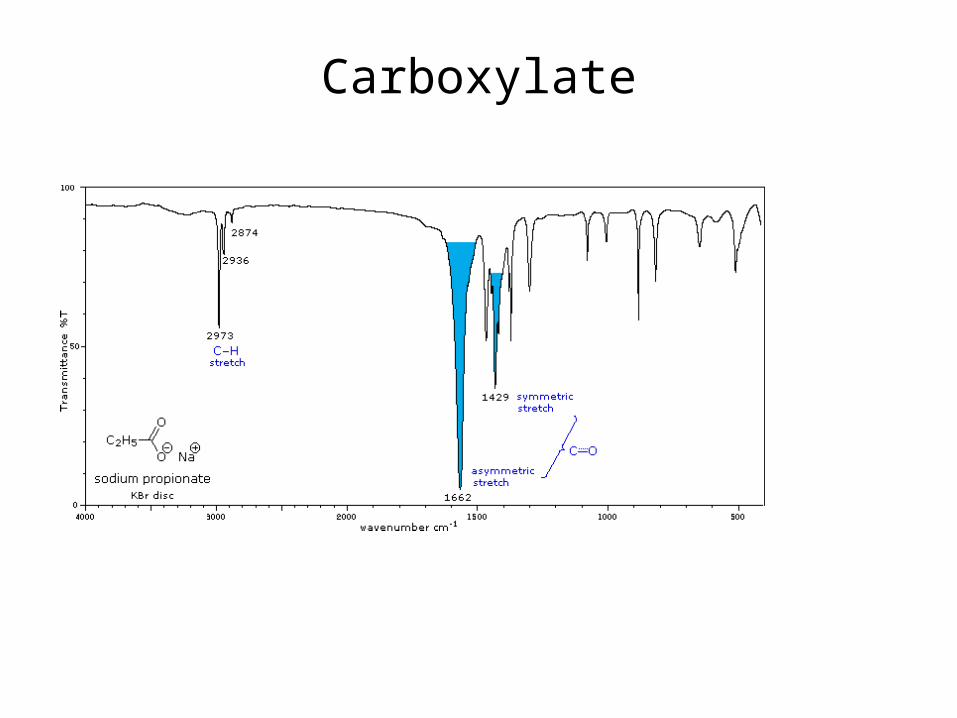
Carboxylate
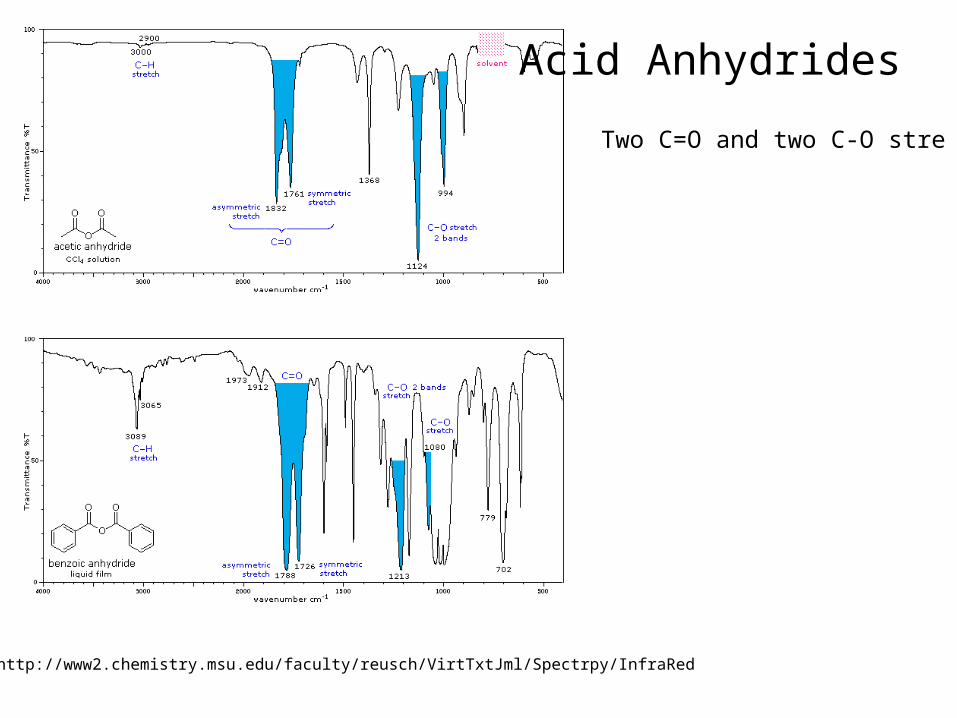
Acid Anhydrides
Two C=O and two C-O stre
http://www2.chemistry.msu.edu/faculty/reusch/VirtTxtJml/Spectrpy/InfraRed

Acid Anhydrides
Two C=O and two C-O stre
http://www2.chemistry.msu.edu/faculty/reusch/VirtTxtJml/Spectrpy/InfraRed
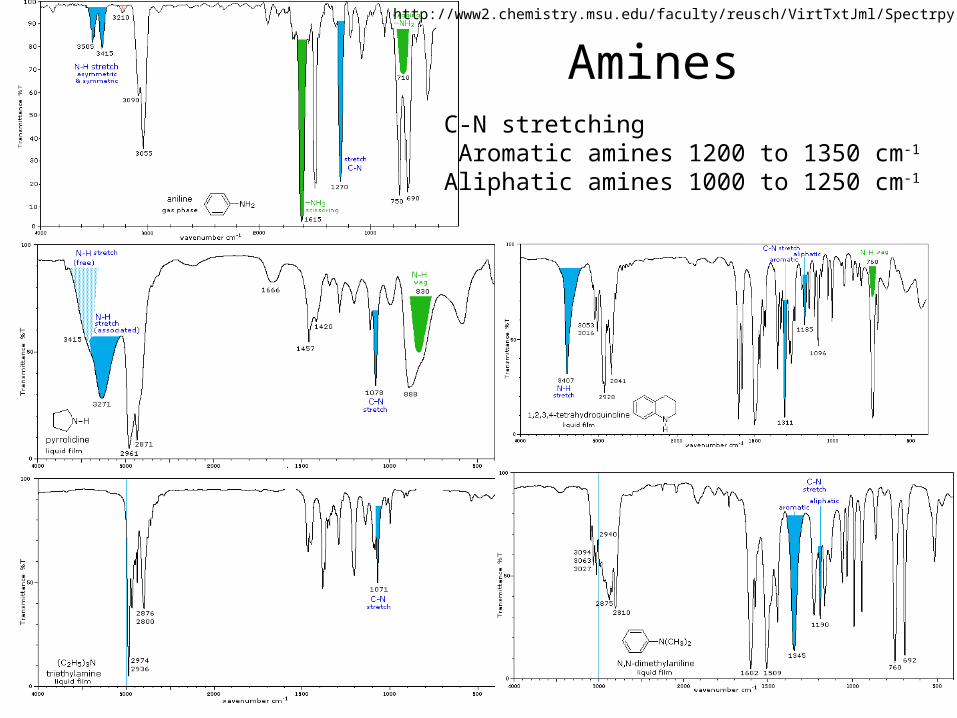
AminesC-N stretching Aromatic amines 1200 to 1350 cm-1
Aliphatic amines 1000 to 1250 cm-1
http://www2.chemistry.msu.edu/faculty/reusch/VirtTxtJml/Spectrpy/InfraRed
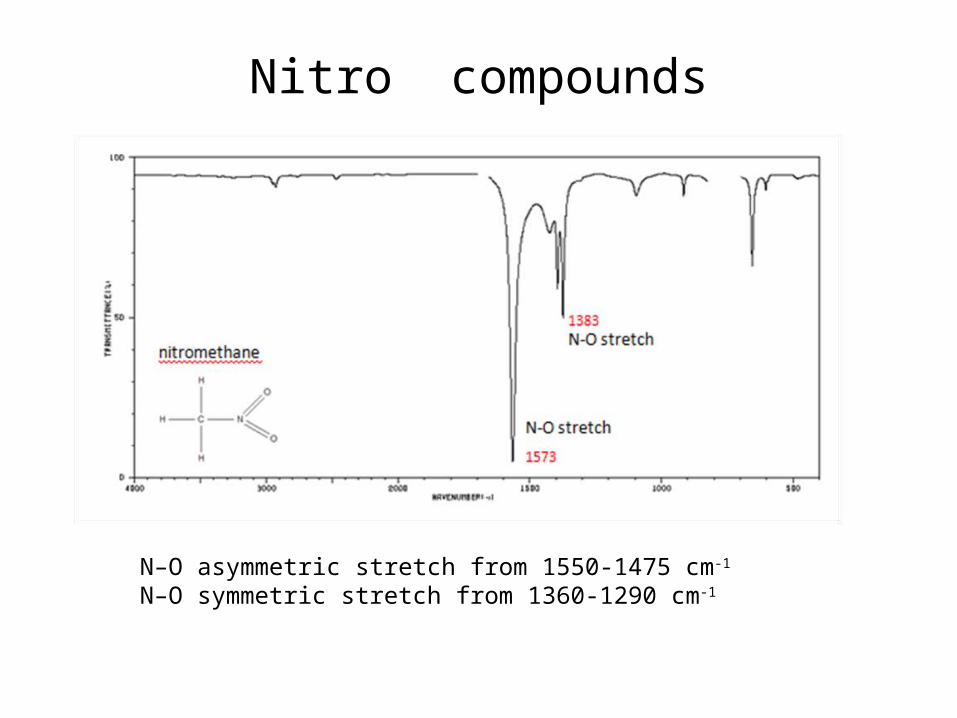
Nitro compounds
N–O asymmetric stretch from 1550-1475 cm-1 N–O symmetric stretch from 1360-1290 cm-1
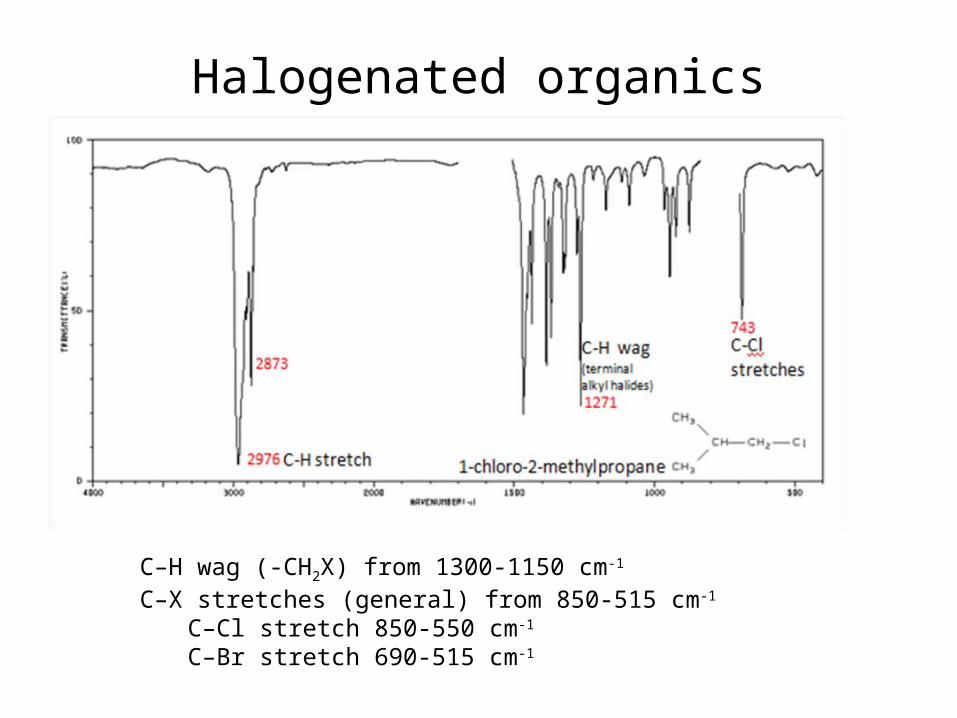
Halogenated organics
C–H wag (-CH2X) from 1300-1150 cm-1
C–X stretches (general) from 850-515 cm-1 C–Cl stretch 850-550 cm-1
C–Br stretch 690-515 cm-1
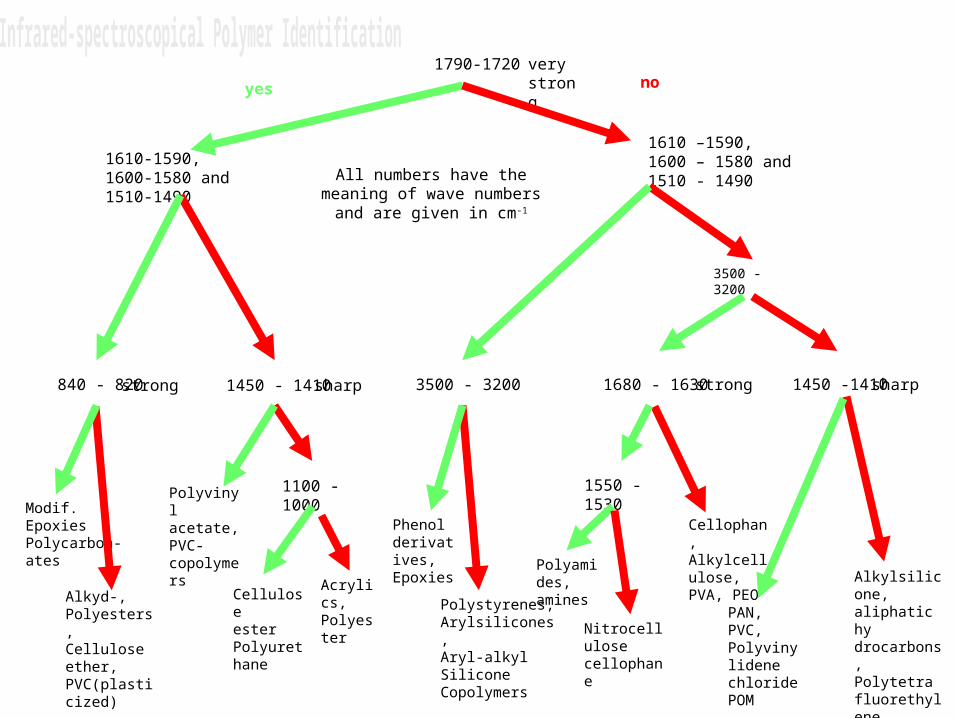
1790-1720 very strong
1610-1590,1600-1580 and1510-1490
Modif.EpoxiesPolycarbon-ates
Alkyd-,Polyesters,Cellulose ether,PVC(plasticized)
Polyvinylacetate,PVC-copolymers
CelluloseesterPolyurethane
Acrylics,Polyester
Phenol derivatives,Epoxies
Polystyrenes,Arylsilicones,Aryl-alkyl Silicone Copolymers
Polyamides,amines
Nitrocellulosecellophane
Cellophan, Alkylcellulose,PVA, PEO
PAN, PVC,Polyvinylidene chloridePOM
Alkylsilicone,aliphatic hydrocarbons,PolytetrafluorethyleneThiokol
1450 -1410 sharp1680 - 1630 strong
1550 - 1530
1610 –1590,1600 – 1580 and1510 - 1490
3500 - 3200
1100 - 1000
1450 - 1410 sharp840 - 820
3500 - 3200
strong
All numbers have the meaning of wave numbers
and are given in cm-1
yes no

1790-1720 cm-1
modified epoxides, polycarbonate, Alkyd resins, polyester, cellulose ester, cellulose ether, PVC (plast), PVAc, PVC-copolym., PU, acrylics
1610-1590 1600-1580 cm-1
1510-1490
modified epoxides, polycarbonate, Alkyd resins, polyester, cellulose ester, cellulose ether, PVC (plast)
820-840 cm-1
modified epoxies, polycarbonate polycarbonate
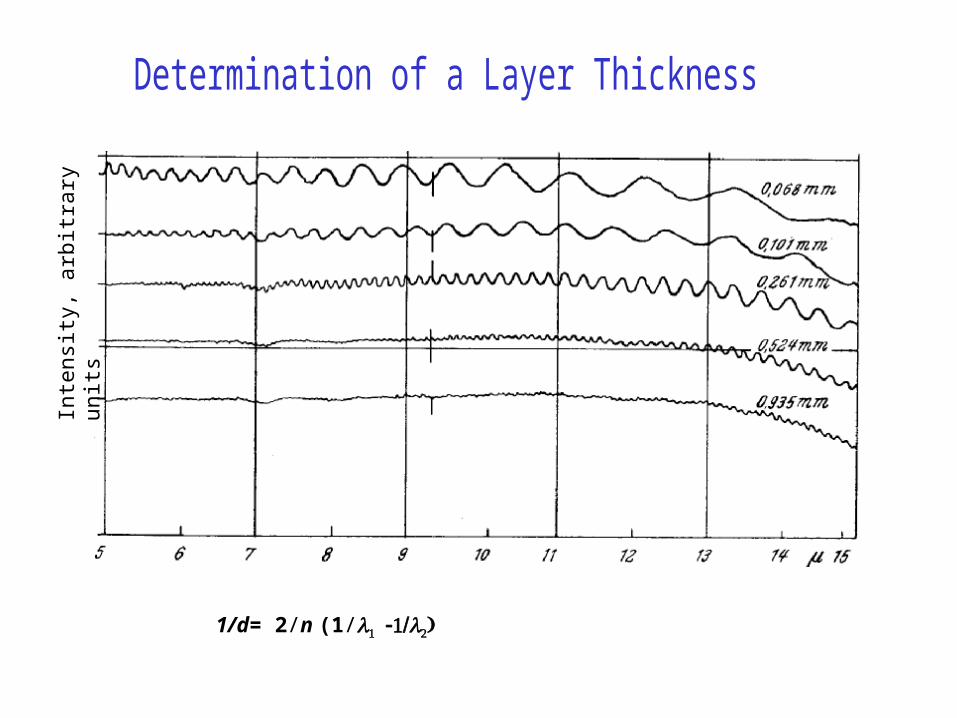
Inte
nsity
, arb
itrar
y un
its
1/d= 2/n (1/l1 -1/l2) n = number of minima between two maxima l1 and l2
wave length
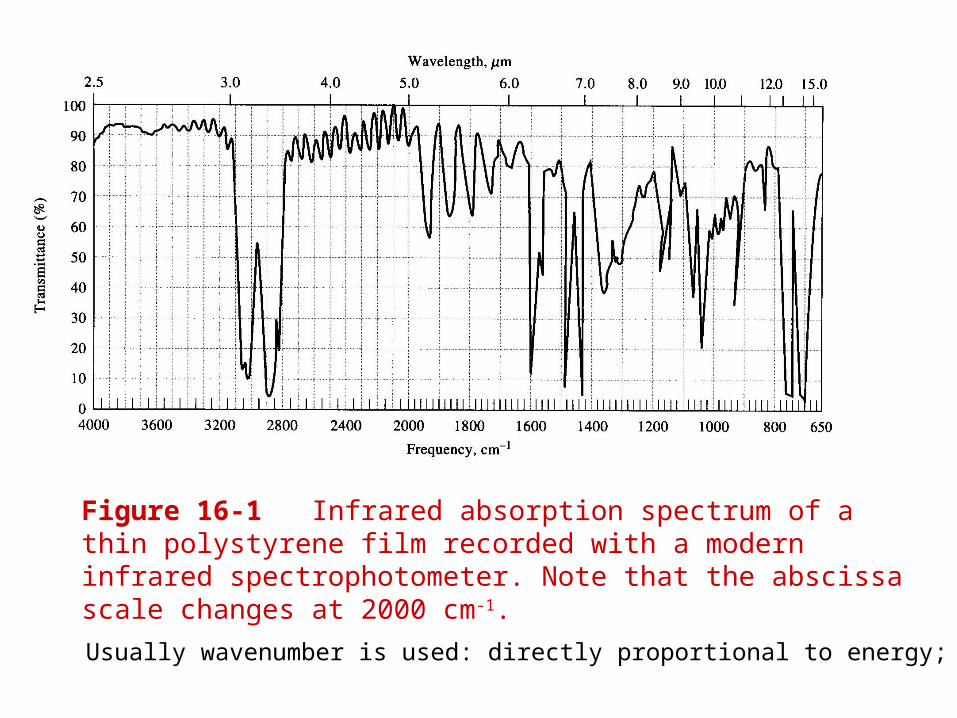
Figure 16-1 Infrared absorption spectrum of a thin polystyrene film recorded with a modern infrared spectrophotometer. Note that the abscissa scale changes at 2000 cm-1.
Usually wavenumber is used: directly proportional to energy;