coming up with cash in a pinch: emergency savings and its ... · emergency savings and its...
TRANSCRIPT
Center for Financial Security 0
Coming Up with Cash in a Pinch:
Emergency Savings and Its Alternatives
June 2011
Stephanie Chase
University of Wisconsin-Madison
Leah Gjertson
University of Wisconsin-Madison
J. Michael Collins
University of Wisconsin-Madison
Center for Financial Security
Sterling Hall Mailroom B605
475 North Charter Street
Madison, WI 53706
(608) 262-6766
http://cfs.wisc.edu/
This research was supported by MDRC. The authors are grateful for feedback from Caroline Schultz,
MDRC and Pamela Chan, New America Foundation who so generously shared their time and insights.
The authors would also like to acknowledge both the Charles Stewart Mott Foundation and the
Rockefeller Foundation for their support of the AutoSave Program. The opinions and conclusions
expressed are solely those of the authors and do not represent the views of the New America Foundation,
MDRC, or the Center for Financial Security at the University of Wisconsin-Madison.
Center for Financial Security 1
Coming Up with Cash in a Pinch:
Emergency Savings and Its Alternatives
Much of the current discussion over the low personal savings rates of people in the U.S. is
related to savings for retirement. While the concerns of how households will manage their
finances in retirement remains a policy and research issue worthy of further attention, the debate
over savings in that context may overshadow the important issue of the savings that people use in
response to the unexpected expense. This savings, which we refer to as emergency savings,
serves as a form of insurance against non-routine expenditures such as a car repair or unforeseen
medical expense. Failing to adequately save is a common occurrence, especially for low and
moderate income households. Without easy access to liquid savings, people to turn to other
alternatives; including short-term credit, friends and family and potentially even public subsidy
programs. People may fail to save for an emergency because they lack financial knowledge, fail
to adequately assess the risk of an emergency or simply because they procrastinate. Other
barriers to saving include asset tests in public benefit programs as well as a lack of access to
useful savings account products. Ultimately people without emergency savings will turn to
alternatives when they need immediate liquid financial resources.
This paper reviews over 80 articles addressing the issue of savings and alternative
mechanisms of liquidity for households. A number of articles address savings models or general
theories of savings; far fewer focus on emergency savings and expenditure shocks, indicating an
opportunity for future research. There is also a great deal of research about payday lending and
other alternative credit mechanisms for consumers. A number of these studies address the need
for low cost alternative credit for consumers without available emergency savings.
The studies that included race, income or education as explanatory variables generally
found that savings levels are lower for lower-income, minority and less-educated households.
The incidence of expenditure shocks is not well studied, but at least two studies concluded that
lower-income households are not as well prepared to manage a short-term demand for cash as
higher-income households.
Many studies do not favor the use of alternative credit and liquidity mechanisms, such as
payday loans or pawnshop loans. The costs of these types of financial products may appear to be
high compared to more traditional savings or checking accounts. Yet the continued demand for
these products suggests an underlying need for liquidity that consumers of these products are
trying to meet. Behavioral economists and psychologists suggest a variety of reasons that cause
households to inadequately save for future liquidity shortfalls, including the inability to forecast
future earnings or economic circumstances accurately. Additionally, households may
underestimate the probability of a future expense coming in the near term, or even procrastinate
and defer the act of saving repeatedly to the future. Given these behaviors, the need for liquidity,
and the costs of potentially not being able to come up with funds to meet short-term emergency
needs, future research could take a more holistic view of the costs and benefits of various forms
of liquidity—ranging from cash, savings, credit and informal mechanisms.
Center for Financial Security 2
The Need for Cash: Liquidity
When the family car needs a repair, the head of the household loses his or her job, or an
individual has an unexpected medical expense, the family budget must respond to this income or
expenditure shock. Ideally, families should set aside some precautionary savings in anticipation
of job loss or other income shocks and emergency savings for unexpected expenditures such as a
medical expense or a car break down. If households are living beyond their means there may be
nothing left to set aside. For example, in 2003 a family at the 10th
percentile of income had an
income of $425 per month, just over $5,000 per year, and an annual expenditure of $6,600
(Meyer & Sullivan, 2003). Low-income households perceive their typical emergency savings as
about $1,500 annually, but report usually spending $2,000 every year on these needs (Brobeck,
2008). When a family faces an emergency that requires immediate resources, they might dip into
available savings, but in many cases, families do not have accessible liquid assets. If a family
does not have access to accessible liquid assets, they might delay paying a bill, sell possessions,
or seek a formal or informal loan.
Emergency savings is different from
precautionary savings although the mechanisms
for saving (or not saving) are probably quite
similar. This paper focuses on emergency
savings as an area in need of research that can
be informed by what is already known about
precautionary savings. Precautionary savings
refers to a form of savings undertaken by
people who expect some probability of having an income shortfall in the future. This might be
due to predicted job losses or just variability in income. These income shocks are widely studied
and important to understand (Wang, 2009). Expenditure shocks that require emergency savings
in the form of liquid assets are less well studied. These shocks may be smaller in magnitude and
in many cases predictable. Examples of predictable ―lumpy‖ expenditures include car repairs,
seasonal heating bills, school supplies or clothing for children, or home/appliance maintenance.
These are costs that most households will incur, although the exact timing may not be predicted.
Other expenditure shocks are less predictable, such as medical expenses not covered by
insurance, changes in family size/status, and support for relatives or moving. Depending on the
household’s economic status any of these could be considered an emergency situation. Some
expenses shocks are covered by property or causality insurance, but the types of expenses
described above are not typically covered by insurance products available in the current market.
Another way to describe this situation is that low and moderate income families often have a lack
of financial slack (Mullainathan & Shafir, 2009). If a wealthier person and a poorer person face
equal value financial shocks and cut back the same amount on consumption, the wealthier person
is cutting back on their lower marginal utility consumption. In other words, in a financially
difficult situation, a wealthier person can cut back on extra expenses, but a poor person must cut
back on essential expenses.
Emergency Savings & Precautionary Savings
Neither of these topics has been clearly defined in
the existing literature. In this paper, we use the
terms for distinct purposes.
Emergency savings is used in response to expenditure shocks such as a car repair or medical expense
Precautionary savings is used in response to income shocks such as a pay cut or job loss
Center for Financial Security 3
The demand for alternative financial products has grown in the last several decades due
in part to the decline in the U.S. savings rate and recent financial crisis. Alternative credit
products provide a source of liquidity for those without sufficient liquid resources. The growth of
so called ―fringe‖ financial products in is part due to demand for liquidity. The savings rate in the
U.S. has declined for a number of reasons (Maki & Palumbo, 2001).Younger generations are
increasingly marked by low savings rates and higher levels of consumption relative to prior
cohorts (Parker, 2000). Native born U.S. citizens have greater liquidity than immigrant
populations in the U.S. (Amuedo-Dorantes & Pozo, 2002). In general low-income people have
low savings rates (Browning & Lusardi, 1996). Low-wealth households expend proportionally
more of their budget than higher-wealth households to maintain basic consumption of food,
shelter and necessities, leaving little for savings (Scholz, Seshadri, & Khitatrakun, 2006). The
lack of savings means that individuals must turn to other mechanisms to get money in times of
emergency.
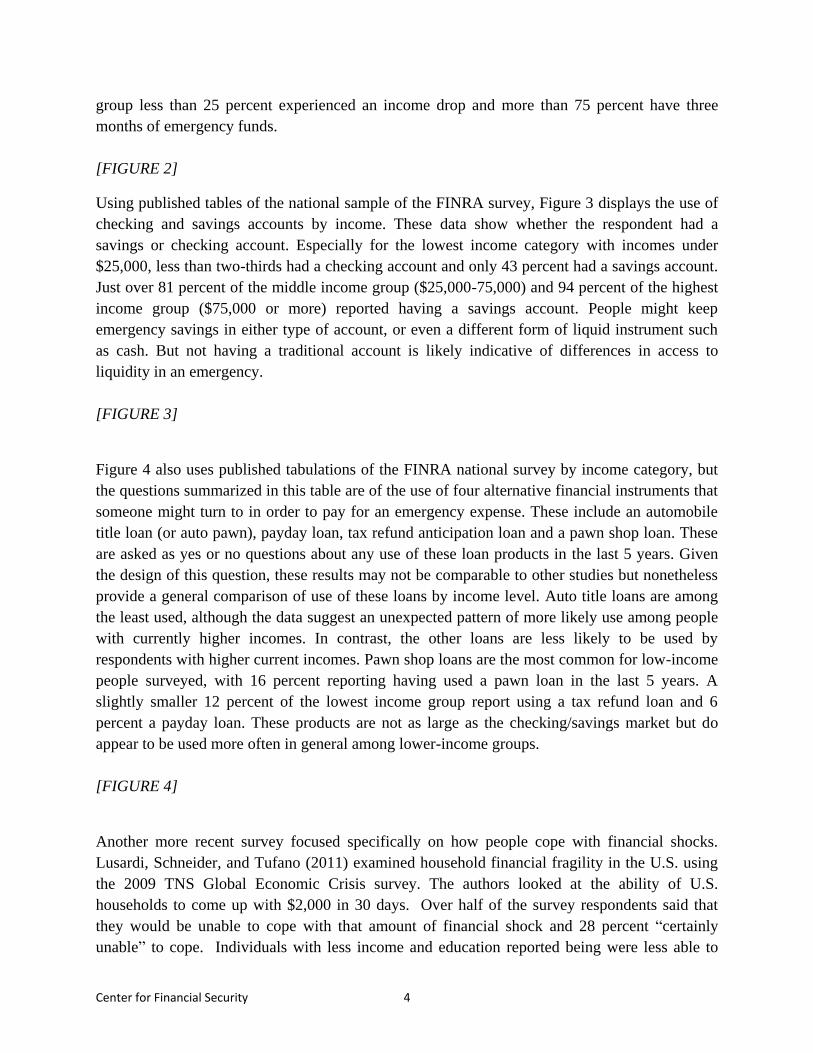
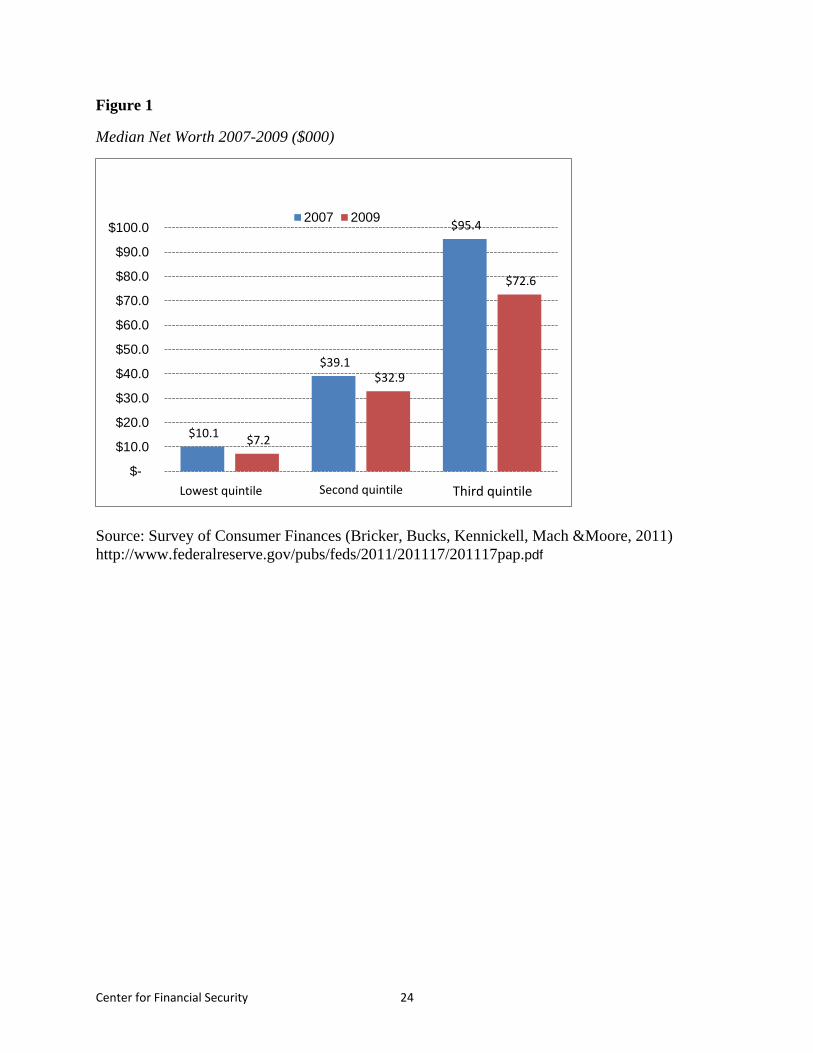
The Great Recession of 2008-2010 was hard on balance sheets of U.S. households. In a
survey of responses to the recession, 70 percent of families used money from savings that was
set aside for retirement or education to pay current obligations and meet basic needs (Borie-
Holtz, Horn, & Zukin, 2010). Figure 1 shows data on net worth by household income level.
Households in the lowest income quintile had $10,100 in net worth in 2007 and then only $7,200
by 2009. While all income groups experienced a drop during this period, the net worth of the
lowest income households was already so low that a modest drop, relative to where they started,
has significant implications for those households.
[FIGURE 1]
Given the relatively low levels of net worth, it is important to understand the composition of this
wealth. Table 1 shows that transaction accounts (i.e. checking and savings accounts with a bank
or credit union) are widely held. Although researchers and practitioners tend to think of checking
accounts as transaction accounts, and traditional savings accounts as tools for short-term and
accessible saving, many consumers may not use the accounts in this way. For example, some
consumers may keep a small buffer of extra funds in their checking account instead of a
traditional savings account.
[TABLE 1]
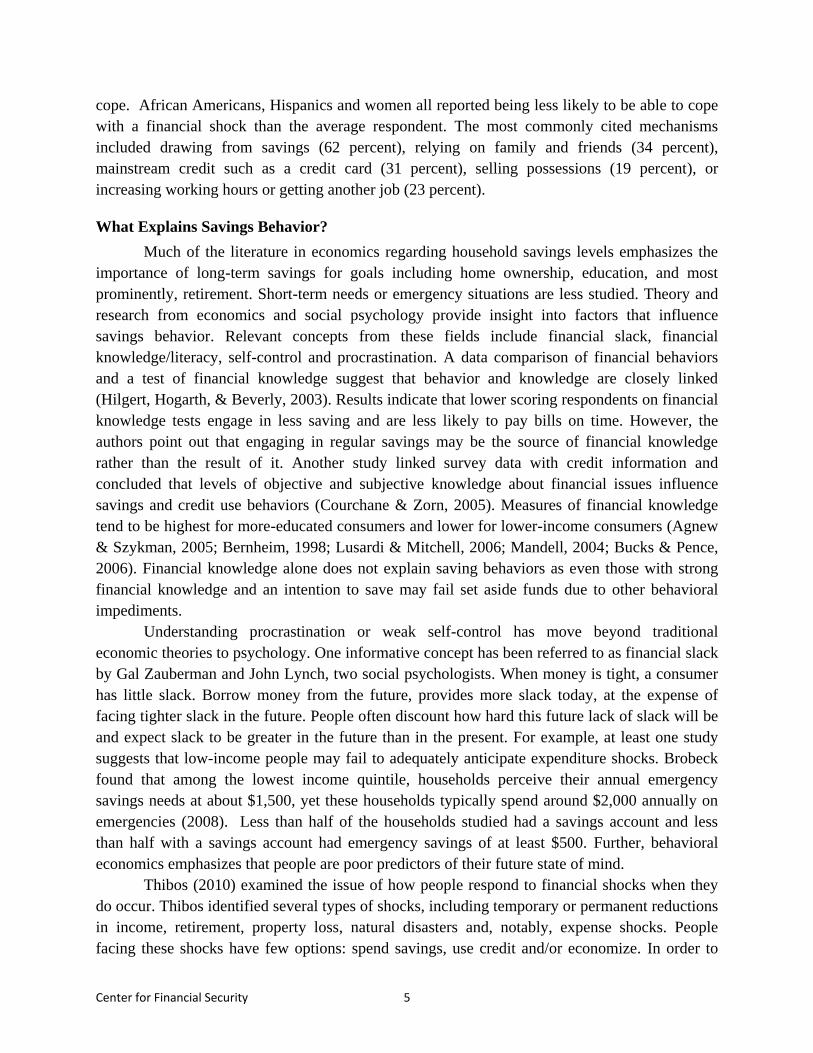
Figure 2 shows data from the FINRA Financial Capability survey using the state samples
weighted for the U.S. population. The survey examines unexpected income drops and the
frequency households have emergency savings but does not explore emergency expenditure
shocks. The data show that more than half of families with incomes under $15,000 experienced a
drop in income in the last 12 months and that only 20 percent of these families have three months
emergency funds. Lower income families are also asset poor, meaning that they have little ability
to weather economic, income, or expenditure shocks. Conversely, among the highest income
Center for Financial Security 4
group less than 25 percent experienced an income drop and more than 75 percent have three
months of emergency funds.
[FIGURE 2]
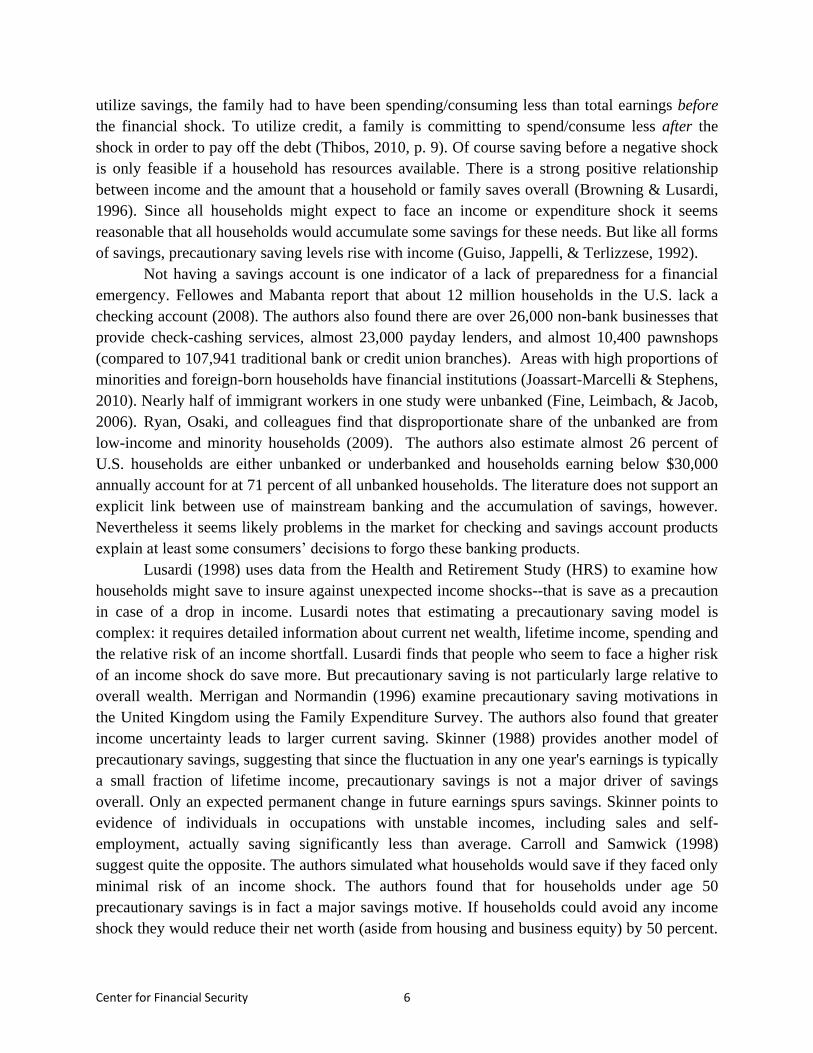
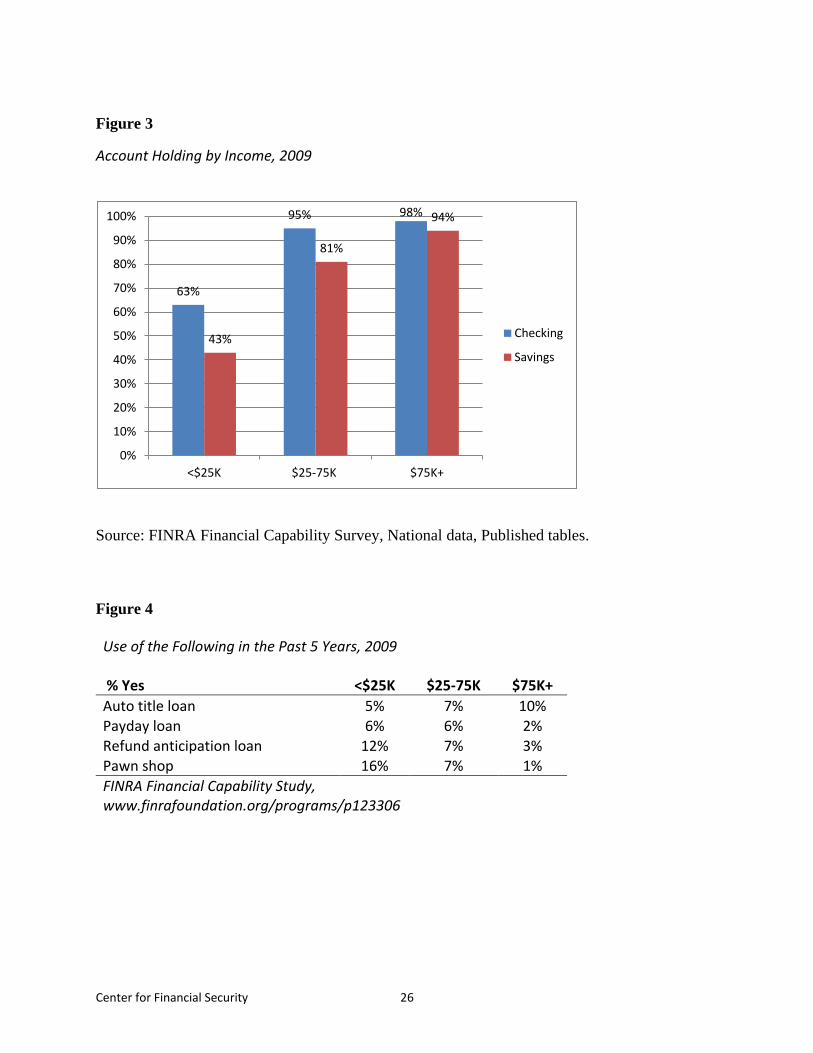
Using published tables of the national sample of the FINRA survey, Figure 3 displays the use of
checking and savings accounts by income. These data show whether the respondent had a
savings or checking account. Especially for the lowest income category with incomes under
$25,000, less than two-thirds had a checking account and only 43 percent had a savings account.
Just over 81 percent of the middle income group ($25,000-75,000) and 94 percent of the highest
income group ($75,000 or more) reported having a savings account. People might keep
emergency savings in either type of account, or even a different form of liquid instrument such
as cash. But not having a traditional account is likely indicative of differences in access to
liquidity in an emergency.
[FIGURE 3]
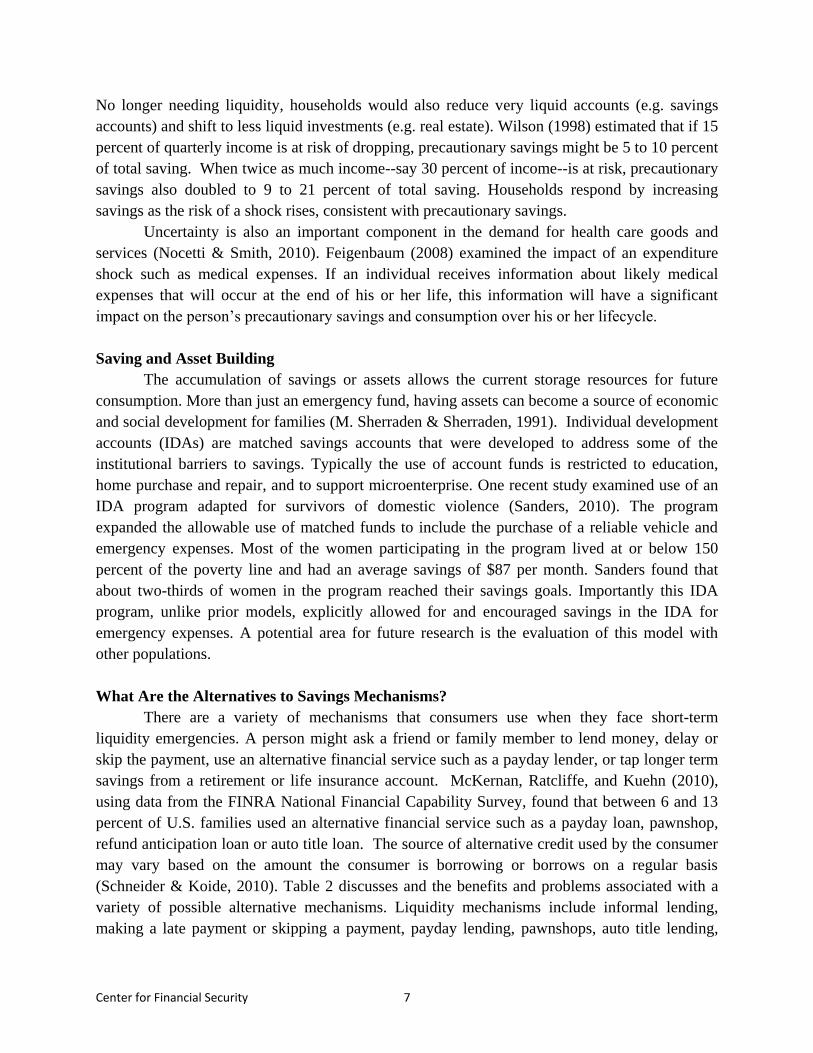
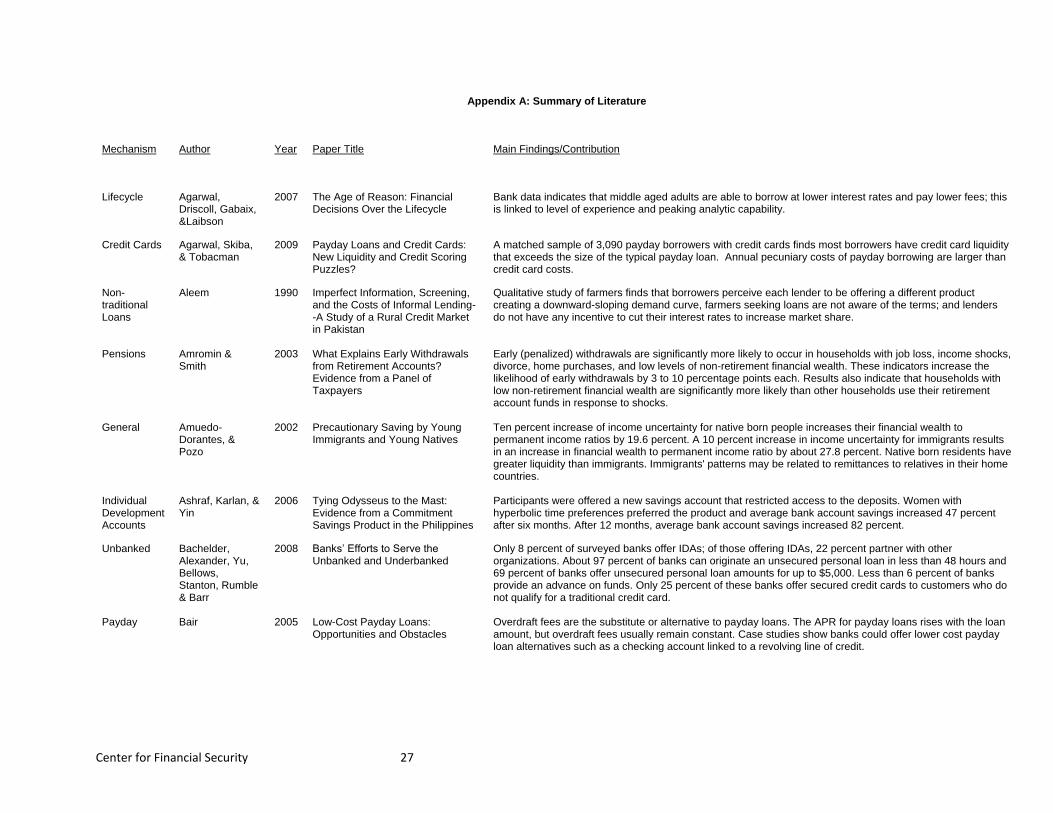
Figure 4 also uses published tabulations of the FINRA national survey by income category, but
the questions summarized in this table are of the use of four alternative financial instruments that
someone might turn to in order to pay for an emergency expense. These include an automobile
title loan (or auto pawn), payday loan, tax refund anticipation loan and a pawn shop loan. These
are asked as yes or no questions about any use of these loan products in the last 5 years. Given
the design of this question, these results may not be comparable to other studies but nonetheless
provide a general comparison of use of these loans by income level. Auto title loans are among
the least used, although the data suggest an unexpected pattern of more likely use among people
with currently higher incomes. In contrast, the other loans are less likely to be used by
respondents with higher current incomes. Pawn shop loans are the most common for low-income
people surveyed, with 16 percent reporting having used a pawn loan in the last 5 years. A
slightly smaller 12 percent of the lowest income group report using a tax refund loan and 6
percent a payday loan. These products are not as large as the checking/savings market but do
appear to be used more often in general among lower-income groups.
[FIGURE 4]
Another more recent survey focused specifically on how people cope with financial shocks.
Lusardi, Schneider, and Tufano (2011) examined household financial fragility in the U.S. using
the 2009 TNS Global Economic Crisis survey. The authors looked at the ability of U.S.
households to come up with $2,000 in 30 days. Over half of the survey respondents said that
they would be unable to cope with that amount of financial shock and 28 percent ―certainly
unable‖ to cope. Individuals with less income and education reported being were less able to
Center for Financial Security 5
cope. African Americans, Hispanics and women all reported being less likely to be able to cope
with a financial shock than the average respondent. The most commonly cited mechanisms
included drawing from savings (62 percent), relying on family and friends (34 percent),
mainstream credit such as a credit card (31 percent), selling possessions (19 percent), or
increasing working hours or getting another job (23 percent).
What Explains Savings Behavior?
Much of the literature in economics regarding household savings levels emphasizes the
importance of long-term savings for goals including home ownership, education, and most
prominently, retirement. Short-term needs or emergency situations are less studied. Theory and
research from economics and social psychology provide insight into factors that influence
savings behavior. Relevant concepts from these fields include financial slack, financial
knowledge/literacy, self-control and procrastination. A data comparison of financial behaviors
and a test of financial knowledge suggest that behavior and knowledge are closely linked
(Hilgert, Hogarth, & Beverly, 2003). Results indicate that lower scoring respondents on financial
knowledge tests engage in less saving and are less likely to pay bills on time. However, the
authors point out that engaging in regular savings may be the source of financial knowledge
rather than the result of it. Another study linked survey data with credit information and
concluded that levels of objective and subjective knowledge about financial issues influence
savings and credit use behaviors (Courchane & Zorn, 2005). Measures of financial knowledge
tend to be highest for more-educated consumers and lower for lower-income consumers (Agnew
& Szykman, 2005; Bernheim, 1998; Lusardi & Mitchell, 2006; Mandell, 2004; Bucks & Pence,
2006). Financial knowledge alone does not explain saving behaviors as even those with strong
financial knowledge and an intention to save may fail set aside funds due to other behavioral
impediments.
Understanding procrastination or weak self-control has move beyond traditional
economic theories to psychology. One informative concept has been referred to as financial slack
by Gal Zauberman and John Lynch, two social psychologists. When money is tight, a consumer
has little slack. Borrow money from the future, provides more slack today, at the expense of
facing tighter slack in the future. People often discount how hard this future lack of slack will be
and expect slack to be greater in the future than in the present. For example, at least one study
suggests that low-income people may fail to adequately anticipate expenditure shocks. Brobeck
found that among the lowest income quintile, households perceive their annual emergency
savings needs at about $1,500, yet these households typically spend around $2,000 annually on
emergencies (2008). Less than half of the households studied had a savings account and less
than half with a savings account had emergency savings of at least $500. Further, behavioral
economics emphasizes that people are poor predictors of their future state of mind.
Thibos (2010) examined the issue of how people respond to financial shocks when they
do occur. Thibos identified several types of shocks, including temporary or permanent reductions
in income, retirement, property loss, natural disasters and, notably, expense shocks. People
facing these shocks have few options: spend savings, use credit and/or economize. In order to
Center for Financial Security 6
utilize savings, the family had to have been spending/consuming less than total earnings before
the financial shock. To utilize credit, a family is committing to spend/consume less after the
shock in order to pay off the debt (Thibos, 2010, p. 9). Of course saving before a negative shock
is only feasible if a household has resources available. There is a strong positive relationship
between income and the amount that a household or family saves overall (Browning & Lusardi,
1996). Since all households might expect to face an income or expenditure shock it seems
reasonable that all households would accumulate some savings for these needs. But like all forms
of savings, precautionary saving levels rise with income (Guiso, Jappelli, & Terlizzese, 1992).
Not having a savings account is one indicator of a lack of preparedness for a financial
emergency. Fellowes and Mabanta report that about 12 million households in the U.S. lack a
checking account (2008). The authors also found there are over 26,000 non-bank businesses that
provide check-cashing services, almost 23,000 payday lenders, and almost 10,400 pawnshops
(compared to 107,941 traditional bank or credit union branches). Areas with high proportions of
minorities and foreign-born households have financial institutions (Joassart-Marcelli & Stephens,
2010). Nearly half of immigrant workers in one study were unbanked (Fine, Leimbach, & Jacob,
2006). Ryan, Osaki, and colleagues find that disproportionate share of the unbanked are from
low-income and minority households (2009). The authors also estimate almost 26 percent of
U.S. households are either unbanked or underbanked and households earning below $30,000
annually account for at 71 percent of all unbanked households. The literature does not support an
explicit link between use of mainstream banking and the accumulation of savings, however.
Nevertheless it seems likely problems in the market for checking and savings account products
explain at least some consumers’ decisions to forgo these banking products.
Lusardi (1998) uses data from the Health and Retirement Study (HRS) to examine how
households might save to insure against unexpected income shocks--that is save as a precaution
in case of a drop in income. Lusardi notes that estimating a precautionary saving model is
complex: it requires detailed information about current net wealth, lifetime income, spending and
the relative risk of an income shortfall. Lusardi finds that people who seem to face a higher risk
of an income shock do save more. But precautionary saving is not particularly large relative to
overall wealth. Merrigan and Normandin (1996) examine precautionary saving motivations in
the United Kingdom using the Family Expenditure Survey. The authors also found that greater
income uncertainty leads to larger current saving. Skinner (1988) provides another model of
precautionary savings, suggesting that since the fluctuation in any one year's earnings is typically
a small fraction of lifetime income, precautionary savings is not a major driver of savings
overall. Only an expected permanent change in future earnings spurs savings. Skinner points to
evidence of individuals in occupations with unstable incomes, including sales and self-
employment, actually saving significantly less than average. Carroll and Samwick (1998)
suggest quite the opposite. The authors simulated what households would save if they faced only
minimal risk of an income shock. The authors found that for households under age 50
precautionary savings is in fact a major savings motive. If households could avoid any income
shock they would reduce their net worth (aside from housing and business equity) by 50 percent.
Center for Financial Security 7
No longer needing liquidity, households would also reduce very liquid accounts (e.g. savings
accounts) and shift to less liquid investments (e.g. real estate). Wilson (1998) estimated that if 15
percent of quarterly income is at risk of dropping, precautionary savings might be 5 to 10 percent
of total saving. When twice as much income--say 30 percent of income--is at risk, precautionary
savings also doubled to 9 to 21 percent of total saving. Households respond by increasing
savings as the risk of a shock rises, consistent with precautionary savings.
Uncertainty is also an important component in the demand for health care goods and
services (Nocetti & Smith, 2010). Feigenbaum (2008) examined the impact of an expenditure
shock such as medical expenses. If an individual receives information about likely medical
expenses that will occur at the end of his or her life, this information will have a significant
impact on the person’s precautionary savings and consumption over his or her lifecycle.
Saving and Asset Building
The accumulation of savings or assets allows the current storage resources for future
consumption. More than just an emergency fund, having assets can become a source of economic
and social development for families (M. Sherraden & Sherraden, 1991). Individual development
accounts (IDAs) are matched savings accounts that were developed to address some of the
institutional barriers to savings. Typically the use of account funds is restricted to education,
home purchase and repair, and to support microenterprise. One recent study examined use of an
IDA program adapted for survivors of domestic violence (Sanders, 2010). The program
expanded the allowable use of matched funds to include the purchase of a reliable vehicle and
emergency expenses. Most of the women participating in the program lived at or below 150
percent of the poverty line and had an average savings of $87 per month. Sanders found that
about two-thirds of women in the program reached their savings goals. Importantly this IDA
program, unlike prior models, explicitly allowed for and encouraged savings in the IDA for
emergency expenses. A potential area for future research is the evaluation of this model with
other populations.
What Are the Alternatives to Savings Mechanisms?
There are a variety of mechanisms that consumers use when they face short-term
liquidity emergencies. A person might ask a friend or family member to lend money, delay or
skip the payment, use an alternative financial service such as a payday lender, or tap longer term
savings from a retirement or life insurance account. McKernan, Ratcliffe, and Kuehn (2010),
using data from the FINRA National Financial Capability Survey, found that between 6 and 13
percent of U.S. families used an alternative financial service such as a payday loan, pawnshop,
refund anticipation loan or auto title loan. The source of alternative credit used by the consumer
may vary based on the amount the consumer is borrowing or borrows on a regular basis
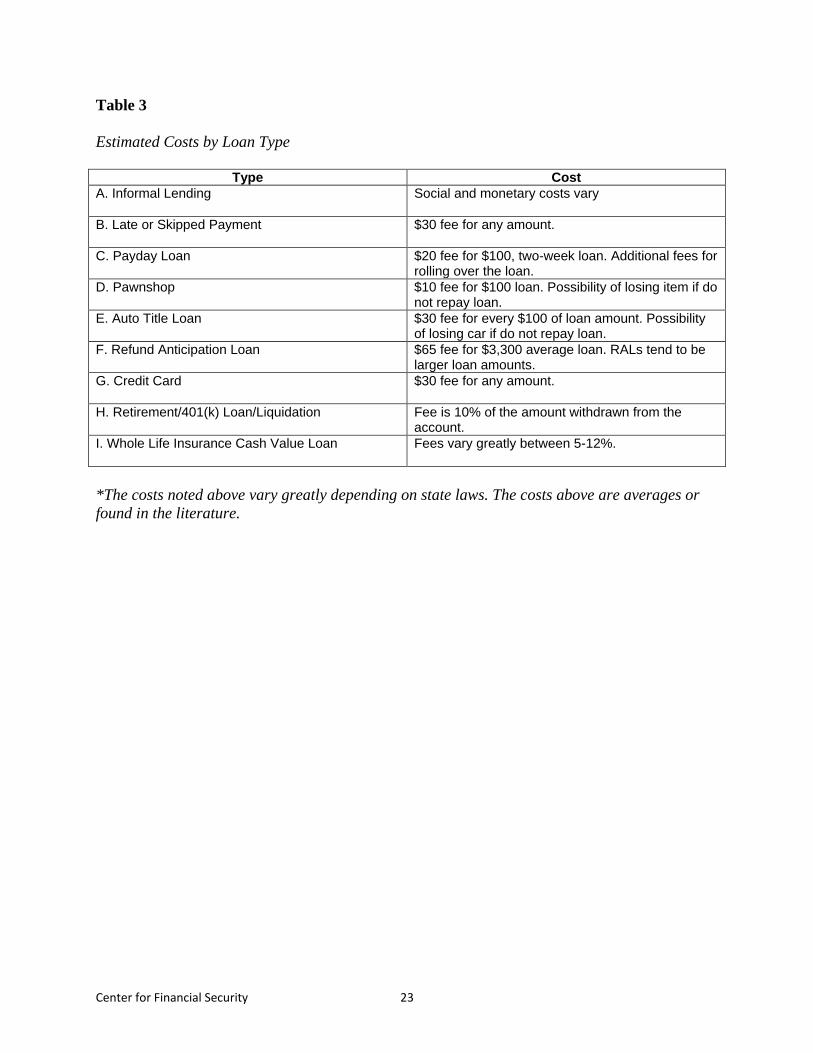
(Schneider & Koide, 2010). Table 2 discusses and the benefits and problems associated with a
variety of possible alternative mechanisms. Liquidity mechanisms include informal lending,
making a late payment or skipping a payment, payday lending, pawnshops, auto title lending,
Center for Financial Security 8
obtaining a refund anticipation loan, using a credit card, drawing from a retirement account, and
drawing from life insurance. Each is described in more detail below.
[TABLE 2]
Informal Lending. Informal lenders can be a community connection or a family member. This
lending is most commonly used for bigger transactions such as purchasing a home or starting a
business. It is less often used in an emergency. Most of the literature related to informal lenders
involves lending systems in developing nations (Aleem, 1990). Mansuri examined informal
lending models and found that informal lenders have an information or enforcement advantage in
dealing with borrowers (2007). Formal lenders have access to capital on preferential terms but
cannot observe borrower output without undertaking a costly audit.
Conlin examined peer to peer micro-lending programs in the U.S. and Canada (1999). He
concluded that when groups of friends and family members participated in the program together,
overhead costs could be reduced and people were more likely to stick with the program and
repay the loan. Peer pressure had a positive effect in most situations. Another study examined a
micro-lending model on Pine Ridge Indian Reservation in South Dakota (Pickering &
Mushinski, 2001). The lending model was not particularly successful because of social and
cultural factors and experienced low repayment rates. Pickering and Mushinski found that the
micro-credit group structure put too much pressure on individuals, and they argued that including
family units could have a positive impact.
Skipping Another Payment. One simple way for an individual to deal with an unexpected
expense is to skip a payment or a bill for another item. This behavior often results in additional
fees, may result in service or utility shut-offs, and will undermine an individual’s credit history.
Of U.S. consumers, about 32 percent pay fees every month related to poor management of credit
cards and other bills (Thibos, 2010).
Payday Lenders. Payday loans are small single-payment loans, often for a short time period such
as two weeks (Elliehausen & Lawrence, 2001). To initiate a loan, a customer writes a personal
check for the loan amount plus a finance charge and the payday lender defers cashing the check
until the customer’s next payday. On or before the next payday, the customer can either pay the
loan amount plus the finance charge or the lender cashes the check. Additionally, a customer can
extend the loan by paying the finance charge and then writing a new check. Loans are typically
between $100 and $500. Finance charges usually range from $15 to $20 per every $100 of the
loan. This translates into APRs of over 300 percent (Flannery & Samolyk, 2005). Currently,
payday lending is prohibited in 13 states and 33 states have some cap on the APR charged for the
loans (Pindus, Kuehn, & Brash, 2010).
Payday customers tend to have lower incomes, less wealth, fewer assets and less debt
than non payday users based on one study (Logan & Weller, 2009). About 29 percent of
Center for Financial Security 9
borrowers reported that the reason they borrowed was for an emergency and 21 percent cited a
basic consumption need such as paying for gas or a car repair. Consumers who use payday
lenders often obtain multiple loans in a given year. (J. P. Caskey, 2005). Chessin (2005) found
the higher the initial loan amount, the more likely the loan is to be either renewed or rolled over.
Studies on the impact of payday loans report mixed results. Carrell and Zinman (2008)
examined the impact of these loans on service members in the U.S. Air Force, finding a
association with being ineligible to reenlist and the presence of an unfavorable information file in
the individual’s personnel file. Skiba and Tobacman (2008) found using payday loans increases
the chance of filing for Chapter 13 bankruptcy. Wilson, Findlay and colleagues (2010) found that
payday loans could improve financial outcomes, based on lab experiments with students
designed to mimic a scenario that consumers who use payday lenders might encounter. Having
payday loans as an available option increases the probability of being able to pay bills; but most
participants were benefited by their existence.
Efforts to develop payday lending alternatives in North Carolina are important to
highlight because the state outlawed payday lending in 2006. Manturuk and Quercia (Manturuk
& Quercia, 2007) surveyed lower income individuals that had previously used payday lending,
finding 68 percent said that the elimination of payday lending had no impact on their household.
The authors also surveyed former payday loan users about what those families did during their
most recent financial crisis. Survey respondents said that they paid late or did not pay, relied on
family or friends, or used savings or a credit card.
Pawnshops. The existence of pawnshops dates back to the fifteenth century, when Franciscan
priests offered low-cost collateralized loans (J. Caskey, 1994). Pawnshops have existed in
America since colonization and their use grew until the 1930s. Pawnshop loans declined from
the 1930s through the early 1970s, but began to grow again starting in the 1970s. Industry
growth has been stagnant since the 1990s and some pawnshops began to expand into other
alternative financial products including payday loans in the last 10 years (J. P. Caskey, 2005).
There are around 11,600 pawnshops nationally. In terms of regulation, 40 states have a monthly
interest rate cap for pawnshops and 10 states have a return requirement (Pindus, et al., 2010).
Pawnshop customers receive a loan when they bring in a personal property item, such as
a watch. When the customer returns to a pawnshop, they must pay the loan amount, plus a
finance charge. For example, if an individual were to receive a $50 loan in return for a pawned
item and repay with a finance charge of $9, their APR would be 219 percent (Johnson &
Johnson, 1998). About two-thirds of items were redeemed by customers, and this is what
pawnshop owners often prefer because it means that the customer is likely to return for
additional loans. Johnson and Johnson note that consumers from any economic status are
unlikely to obtain small loans, averaging $75, from any financial institution. Pawnbrokers offer a
service that would be expensive and time consuming for more traditional institutions.
Customers of pawnshops come from a variety of socioeconomic groups but the majority
of customers come from low or moderate income homes, and have a high school education or
less (J. Caskey, 1994). Johnson and Johnson report that pawnshop customers are less likely to
Center for Financial Security 10
own a home (1998). Among users of alternative financial services, pawnshop users tend to have
the lowest incomes (McKernan, et al., 2010). Only about 57.6 percent of pawnshop customers
have a checking account (Johnson & Johnson, 1998). Customers borrowing from a pawnshop
cited various reasons for borrowing: 32 percent said they had pressing bills, 32 percent said they
had personal reasons for borrowing, and 13.5 percent said they had car expenses. Of individuals
who were active borrowers from pawnshops, 45 percent said that they had borrowed once or
twice in the last 12 months.
Auto Title Loans. Studies about the auto title lending industry have focused on individual states
that allow the practice. Auto title loans are prohibited in 27 states and 13 states have an APR cap
(Pindus, et al., 2010). A survey by the Consumer Federation of America found that the average
APR charged by auto title lenders with physical locations in 11 states was 300 percent (Fox &
Guy, 2005). This study also surveyed 17 online title lenders and found some charging APRs as
high as 650 percent. A study by McKernan, Ratcliffe and Kuehn found that 17 percent of auto
title lending users had incomes of $75,000 or above and are more likely than users of other
alternative financial products to have a bank account (2010).
More in depth studies of title lending have been completed in Illinois and Tennessee. In
Illinois in 2005, there were 63 auto title lending companies operating through 260 locations
across the state (Feltner, 2007). Feltner found that the median loan principle was $1,500, with an
average finance charge of just over $1,500. The average term for an auto title loan in Illinois is
209 days and the average APR is 256 percent. On average, cars used as collateral for auto title
loans were about 11 years old with odometers reading above 90,000 miles. In Tennessee, the
state Department of Financial Institutions complies an annual report on auto title lending (2010).
In 2008, over 161,000 new consumer title agreements were transacted and generated over
$103,000 in loan volume. Of new agreements, 60 percent were for $500 or less, 86 percent were
for $1000 or less. The maximum loan amount in Tennessee is $2,500 and the maximum APR is
264 percent. The Department found a 16 percent decrease in new title loans from 2006 to 2008.
Auto title loans are more likely to be made to male customers living in moderate to
middle income communities (Feltner, 2007). Approximately 77 percent of borrowers live in
middle or moderate income communities. About 66 percent of individuals obtaining title loans
live in minority communities. Feltner also found that 18 percent of auto title loans in default
resulted in the borrower losing their vehicle, which may be the borrower’s transportation to
work.
Refund Anticipation Loans. Refund anticipation loans (RALs) are short-term loans based on a
taxpayer’s expected income tax refund (Treasury Inspector General for Tax Administration,
2008). The use of RALs has declined recently in part due to legislation at the state level and a
change in IRS practice. Bank lenders issue RALs, but tax preparers facilitate the transactions
between banks and users of RALs. In 2008, almost 10 million taxpayers borrowed against part or
all of their tax refund to obtain a RAL. One study of the Detroit area found that RALs were the

Center for Financial Security 11
most common form of short term credit used (Barr, Dokko, & Keys, 2009). Consumers paid
about $833 million in RAL fees in 2007 for almost 10 million loans (Wu & Fox, 2009). One
Midwest study found that user paid an average of $177 which equaled about 8 percent of their
refund (Barr & Dokko, 2008). The APRs associated with RALs frequently range from 50 percent
to 500 percent. Federal legislation prohibits offering RALs to active military personnel and their
spouses or dependents with an APR of greater than 36 percent (Treasury Inspector General for
Tax Administration, 2008). Aside from the federal cap for military personnel, 3 states have APR
caps for RALs, 17 states have disclosure requirements and two states have right to rescind
provisions (Pindus, et al., 2010).
Research indicates the most important characteristics influencing whether or not
individuals used a RAL include lower income, young adulthood, single head of household filing
status, receipt of the EITC, and use of a paid preparer (Theodos, Brash et al., 2010; McKernan, et
al., 2010). Other surveys support the idea that tax preparers can have an important impact on the
products that consumers use (Duflo, Gale, Liebman, Orszag, & Saez, 2006). A study conducted
in the Detroit metro area found that almost 40 percent of low and moderate income households
that used a paid tax preparer took out an RAL (Barr & Dokko, 2008). RALs are used at higher
rates in the southern U.S. and on Indian reservations in the Midwest and Great Plains than in
other parts of the country. The First Nations Development Institute studied the use of RALs
among EITC filers and found a positive correlation between an increase in the number of Native
Americans in a county and the use of RALs among EITC tax filers (2009). They also found that
on average, an EITC filer pays $250 for tax preparation services and a RAL.
Industry representatives report that the most frequently cited reasons for getting an RAL
included needing money to alleviate post-holiday financial strain, general financial strain and
unexpected expenses, lack of funds for tax preparation costs, lack of a bank account, mistrust of
conventional financial institutions and being a military family. Common uses of RAL funds
include paying regular bills, car repairs or home expenses, or paying off debt; a small minority
report putting the money into savings (Bertrand & Morse, 2009; Barr & Dokko, 2008; Treasury
Inspector General for Tax Administration, 2008). A survey of RAL users suggests that there may
be a limited understanding of the product at the time the loan is taken out. The survey found that
while 85 percent of RAL users said that their tax preparer made it clear that the product was a
loan and 88 percent said that the preparer explained the fees, only 34 percent had the loan
interest rates explained to them (Treasury Inspector General for Tax Administration, 2008).
The use of RALs has climbed in the mid-2000s but has been declining in recent years
(Berube & Kornblatt, 2005). In April 2010, J.P. Morgan Chase pulled out of the lending market
for RALs (Douglas, 2011). Then in August 2010 the IRS announced that it would no longer
provide a credit check on taxpayers for banks or tax preparers. Additionally, HSBC terminated
its lending agreement with H&R Block, which caused H&R Block exit the RAL market. In 2011,
only three community banks still originate RALs, Republic Bank & Trust and River City Bank in
Louisville, Kentucky, and Ohio Valley Bank in Gallipolis, Ohio; two of which announced in
February 2011 that they will leave the RAL market at the end of this tax season.

Center for Financial Security 12
Credit Cards. Soman and Cheema examine the impact of credit on spending decisions (2002).
The authors conducted five separate studies. In the first study, the authors manipulate credit limit
and quality and pose subjects with a hypothetical purchase opportunity. They found that credit
limit impacted the propensity to spend, but only when the credibility was high. In the second
experimental study, they replicated the above findings even when subjects were given
information about expected future salaries. The authors also show that the credit limit influences
the subjects' expectation of future earnings potential. In the third study, the authors show that the
mere availability (and increase) of current liquidity cannot explain their findings. In the fourth
study, they survey consumers, measure a number of demographic characteristics and also ask
them for their propensity to spend in a given purchase situation. In the fifth study the authors use
the Survey of Consumer Finances (SCF) dataset. Results from both studies four and five provide
further support for the proposed framework that credit limits influence spending to a greater
extent for consumers with lower credibility: younger consumers and less-educated consumers.
About two-thirds of Americans in one survey reported having a credit card (Gross &
Souleles, 2002). Gross and Souleles found that of households that have a credit card, 56 percent
are liquidity constrained. Further, the authors found that increasing those individuals credit limits
generates an immediate and significant rise in debt and that the marginal propensity to consume
is much larger for people who begin near their credit limit. Agarwal, Skiba and Tobacman used a
matched sample of payday lending customers that also had credit cards from a particular lender
(2009). They found that most people in the sample had credit card liquidity that exceeds the size
of a typical payday loan.
Another study found that many people prefer to become delinquent on mortgages, rather
than delinquent on credit card payments (Cohen-Cole & Morse, 2010). The authors found an
increase of 127 percent of this behavior between June 2006 and December 2007. The decision to
pay a credit card bill rather than a mortgage bill has the negative externality of higher
foreclosures.
Retirement/Pension Loans or Liquidation. Early withdrawals from retirement or pension plans
are another way that individuals respond to income shocks. Looking at 10 years of tax returns,
Amromin and Smith find that early withdrawals are significantly more likely to occur in
households with job loss, income shocks, divorce, home purchases and low levels of non-
retirement financial wealth (2003). These indicators increase the likelihood of early withdrawals
by 3 to 10 percentage points each. They also find that households with low non-retirement
financial wealth are significantly more likely than other households use their retirement account
funds in response to such shocks. They conclude that a significant portion of early withdrawals
from retirement accounts reflects consumption-smoothing behavior by liquidity-constrained
households who experience financial shocks.
A 2009 GAO Report examines hardship withdraws from retirement accounts (U.S.
Government Accountability Office). The study reports that simulations of the long-run effects of
withdraws have the greatest impact younger participants since these savers will miss out on

Center for Financial Security 13
compounded earnings, as well as lower-income earners. Larger withdrawal amounts taken earlier
have the most negative proportional impact.
Life Insurance Draws. Life insurance policy loans can be another source of emergency funds. At
the end of 2007, there were $113.9 billion in outstanding life insurance policy loans in the U.S.
(Liebenberg, Carson, & Hoyt, 2010). When a person draws a loan against their life insurance
policy, that loan accrues interest like any other loan, but also reduces the amount of the death
benefit available through the insurance policy. Gutter and Hatcher (2008) examine racial
differences in life insurance demand. They use Survey of Consumer Finances data from 2004 to
look at the proportion of households with life insurance policies and how much insurance is
purchased. The authors found that whites had higher levels of net worth, more homeownership
and greater usage of life insurance. There was not a significant difference between whites and
blacks in terms of having whole life policies, but whites have more term insurance. Whites had a
greater proportion of ―human capital‖ insured—40 percent compared to 18 percent for blacks.
Low and moderate income families are also less likely to have access to group life insurance
through their workplace (Thibos, 2010).
Bernheim, Carman, Gokhale, and Kotilkoff (2001) found that having life insurance is not
correlated with financial vulnerability over an individual’s lifecycle. They also found the impact
of having life insurance among at-risk households is modest, and there are widely spread
vulnerabilities when families do not have life insurance, particularly among younger couples or
families. The authors reported that about two-thirds of poverty among surviving women and
more than one-third of poverty among surviving men results from a failure to adequately insure
for survivors. For any level of financial vulnerability, couples provide significantly more
protection for wives than for husbands.
Use of life insurance policy loans was more prevalent in the 1970s. Carson and Hoyt
(1992) found that a 1980 model act proposed by the National Association of Insurance
Commissioners to address interest rates for policy loans had some impact on the use of policy
loans. A version of this bill was adopted in all 50 states by the early 1990s allowing variable
policy loan interest rates, and use of policy loans has declined. However, the authors noted that
there were a number of other variables that also related to the demand for life insurance
including market interest rates, personal income, the rate of unemployment, and the costs of
alternative sources of credit.
Recently Liebenberg, Carson and Hoyt (2010) used data from the Survey of Consumer
Finances (SCF) to examine life insurance policy loan demand. They found a significantly
positive relationship between loan demand and recent expense or income shocks. Life insurance
policy loans dramatically increased in the late 1960s when market interest rates were greater than
policy loan rates. The authors used SCF panel data from 1983-1989, including around 720
households that were able to take loans against their life insurance policies. The authors found
that when households needed emergency funds they are more likely consider alternative sources
like policy loans. The authors found there was an increase in the use of policy loans after
Center for Financial Security 14
households experienced expense or income shocks. They also find that credit scores may be
helpful in predicting loan demand.
[TABLE 3]
Synthesis of the Literature
The Appendix table summarizes the key articles discussed in this paper. Over 80 papers
address the issue of precautionary or emergency savings or an alternative mechanism of liquidity
for households. Outside of the approximately 30 articles that discuss savings models or
precautionary savings in general, only about five focus specifically on emergency savings for
unexpected expenditure shocks. Almost 20 articles discuss payday lending, and nearly as many
discuss other forms of alternative credit that households may use for short-term cash needs.
Several of these studies link the need for alternative credit to lack of short-term savings. Most of
the studies that included race, income or education as explanatory variables conclude that
savings levels are lower for lower-income, minority and less-educated households. Other studies
suggest income shocks are at least as likely if not more likely for these same populations. While
the incidence of expenditure shocks is not well studied, it appears from at least two studies that
lower-income households are less well prepared to manage a short-term demand for cash than
higher income households. Many studies take a dim view of alternative means for households to
raise liquidity in the short run, such as payday loans or pawnshop loans. The costs of such
products appear to be high on an absolute level. Yet continued household demand for these
products suggest an underlying need for liquidity that these markets are trying to access.
Behavioral economics and psychology suggest that households may fail to adequately save for a
rainy day due to forecasting errors, even beyond lacking financial resources. Households may
underestimate the probability of a future expense coming in the near term, or even procrastinate
and defer the act savings repeatedly to the future. Given these behaviors in the social and
economic environment, there will continue to be a demand for liquidity to meet short-term
emergency needs. There is a need for future research to take a more holistic view of household
current and expected income and expenses and a fuller detailing of the costs and benefits
associated with various forms of liquidity.
Conclusion Emergency savings and precautionary savings are important areas for further study. All
people face some probability of having an income shortfall in the future, yet preparedness for
this is uneven by demographic, racial and economic sub-groups. These income shocks are widely
studied and perhaps better understood than expenditure shocks, especially for low-income
populations. Households might need liquidity for a variety of reasons, precipitate tapping a
savings account or an alternative mechanism such as a pay day loan. These expenditures might
be ordinary, relatively fixed costs that the consumer simply failed to budget for correctly,
perhaps overspending on some other aspects of the monthly budget. These expenditures might
Center for Financial Security 15
also have been somewhat predictable yet ―lumpy‖ costs such as car repairs, seasonal heating
bills, or home/appliance maintenance. These are costs that most households will incur, although
the exact timing may not be well predicted. Regardless if the cause was financial
mismanagement or bad luck the household faces the same cash crunch and financial product
alternatives.
There are a variety of costs and benefits to the mechanisms that serve as alternatives to
short term savings. People who do not have short term savings have little choice but to use
alternatives when they face a liquidity emergency. Having a rainy day fund potentially extended
the time a household can weather a negative financial shock, and perhaps also improved
expenditures financial security and well being. Not having such support to backstop the
household budget could mean people are more likely to turn to public programs or charity such
as food support (SNAP) or a charitable food pantry. In the U.S. many workers are covered by
unemployment insurance as a way to partially (and temporarily) insure against a drop in income
due to job loss. While health insurance protects some from major health spending, a significant
portion of the population is not well covered by insurance. Car or appliance repairs are not
widely insured and extended warranties often are criticized for being overpriced. It seems that
credible insurance products could be developed to insure against expenditure shocks. Of course
public programs may actually inhibit lower-income households from building up an emergency
savings account. Programs such as SNAP (depending on the state), SSI, Medicaid and TANF all
contain forms of asset tests. Asset tests at initial application or for continued eligibility may
signal to households that saving should be avoided. Even among people not in public programs,
basic savings accounts can be costly. Minimum balances and other features might actually result
in fees that rival some credit products. Moreover, traditional savings accounts may be both too
easy to access and too hard. Too easy in the sense that people often realize their own self-control
problems and favor accounts with limited access. Accessing the funds take some extra steps and
will be noticed by someone external to the account holder. But beyond constraints to enhance
self-control people also need to have accounts that can be accessed in a few days (or hours) when
an emergency does occur. The product challenge is to develop a product or account that meets
these needs at a low cost and that is accessible for people most in need.
Center for Financial Security 16
References
Agarwal, S., Driscoll, J. C., Gabaix, X., & Laibson, D. (2007). The age of reason: Financial decisions
over the lifecycle: The Berkeley Electronic Press.
Agarwal, S., Skiba, P. M., & Tobacman, J. (2009). Payday Loans and Credit Cards: New Liquidity and
Credit Scoring Puzzles? American Economic Review: Papers & Proceedings, 99(2), 412-417.
Agnew, J., & Szykman, L. R. (2005). Asset Allocation and Information Overload: The Influence of
Information Display, Asset Choice and Investor Experience. Journal of Behavioral Finance, 6(2),
57-70.
Aleem, I. (1990). Imperfect Information, Screening, and the Costs of Informal Lending - A Study of a
Rural Credit Market in Pakistan. [Proceedings Paper]. World Bank Economic Review, 4(3), 329-
349.
Amromin, G., & Smith, P. (2003). What explains early withdrawals from retirement accounts? Evidence
from a panel of taxpayers. [Article]. National Tax Journal, 56(3), 595-612.
Amuedo-Dorantes, C., & Pozo, S. (2002). Precautionary saving by young immigrants and young natives.
[Article]. Southern Economic Journal, 69(1), 48-71.
Ashraf, N., Karlan, D. S., & Yin, W. (2006). Tying Odysseus to the Mast: Evidence from a Commitment
Savings Product in the Philippines. Quarterly Journal of Economics, 121(2), 635-672.
Bachelder, E., Alexander, E. K., Yu, L., Bellows, C., Stanton, J., Rumble, J., et al. (2008). Banks’ Efforts
to Serve the Unbanked and Underbanked. Boston: Dove Consulting
Bair, S. (2005). Low-Cost Payday Loans: Opportunities and Obstacles. Baltimore: The Annie E. Casey
Foundation.
Barr, M. S., & Dokko, J. K. (2008). Third-Party Tax Administration: The Case of Low-and Moderate-
Income Households. Journal of Empirical Legal Studies, 5(4), 963-981.
Barr, M. S., Dokko, J. K., & Keys, B. J. (2009). And Banking for All? Washington, D.C.: Federal Reserve
Board.
Bernheim, B. D. (1998). Financial Illiteracy, Education, and Retirement Saving, Wharton School Pension
Research Council, University of Pennsylvania Pension Research Council Working Papers #96-7
(pp. 38-68).
Bernheim, B. D., Carman, K. G., Gokhale, J., & Kotlikoff, L. J. (2001). The mismatch between life
insurance holdings and financial vulnerabilities: evidence from the Survey of Consumer
Finances: National Bureau of Economic Research Cambridge, Mass., USA.
Bertrand, M., Karlan, D. S., Mullainathan, S., Shafir, E., & Zinman, J. (2005). What's psychology worth?
A field experiment in the consumer credit market.
Bertrand, M., & Morse, A. (2009). What Do High-Interest Borrowers Do with Their Tax Rebate?
Berube, A., & Kornblatt, T. (2005). Step in the Right Direction: Recent Declines in Refund Loan Usage
Among Low-Income Taxpayers.
Beverly, S., Sherraden, M., Cramer, R., Shanks, T. R. W., Nam, Y., & Zhan, M. (2008). Determinants of
asset holdings Asset building and low-income families (pp. 89-151): Urban Inst Pr.
Borie-Holtz, D., Horn, C. V., & Zukin, C. (2010). No End in Sight: The Agony of Prolonged
Unemployment: John J. Heldrich Center for Workforce Development, Edward J. Bloustein School
of Planning and Public Policy, Rutgers University.
Brobeck, S. (2008). The Essential Role of Banks and Credit Unions in Facilitating Lower-Income
Household Saving for Emergencies. Washington: Consumer Federation of America.
Browning, M., & Lusardi, A. (1996). Household saving: Micro theories and micro facts. [Review].
Journal of Economic Literature, 34(4), 1797-1855.
Center for Financial Security 17
Bucks, B. K., Kennickell, A. B., Mach, T. L., & Moore, K. B. (2009). Changes in US family finances
from 2004 to 2007: Evidence from the Survey of Consumer Finances. Federal Reserve Bulletin,
95(1).
Bucks, B., & Pence, K. (2006). Do Homeowners Know Their House Values and Mortgage Terms?
Finance and Economics Discussion Paper Series, Board of Governors of the Federal Reserve
System.
Caballero, R. J. (1990). Consumption Puzzles and Precautionary Savings. [Article]. Journal of Monetary
Economics, 25(1), 113-136.
Carrell, S., & Zinman, J. (2008). In Harm's Way? Payday Loan Access and Military Personnel
Performance. Philadelphia: Research Department, Federal Reserve Bank of Philadelphia,.
Carroll, C. D., & Samwick, A. A. (1998). How important is precautionary saving? [Article]. Review of
Economics and Statistics, 80(3), 410-419.
Carson, J. M., & Hoyt, R. E. (1992). An econometric analysis of the demand for life insurance policy
loans. The Journal of Risk and Insurance, 59(2), 239-251.
Caskey, J. (1994). Fringe banking: Check-cashing outlets, pawnshops, and the poor: Russell Sage
Foundation Publications.
Caskey, J. P. (2005). Fringe Banking and the Rise of Payday Lending. In P. Bolton & H. Rosenthal
(Eds.), Credit Markets for the Poor (pp. 17–45): New York: Russell Sage Foundation.
Chessin, P. (2005). Borrowing from Peter to Pay Paul: A Statistical Analysis of Colorado's Deferred
Deposit Loan Act. Denver University Law Review, 83(2), 387-423.
Chin, P. (2004). Payday Loans: The Case for Federal Legislation. U. Ill. L. Rev., 2004, 723.
Cohen-Cole, E., & Morse, J. (2010). Your House or Your Credit Card, Which Would You Choose?
Personal Delinquency Tradeoffs and Precautionary Liquidity Motives.
Conlin, M. (1999). Peer group micro-lending programs in Canada and the United States. Journal of
Development Economics, 60(1), 249-269.
Courchane, M., & Zorn, P. (2005). Consumer Literacy and Creditworthiness. Allied Social Sciences
Association, Hoyer Hoyt Institute, Washington, DC. January. Also presented at the Federal
Reserve System Conference, Washington, DC. April.
Douglas, D. (2011, March 27, 2010). End of the RALs? The Washington Post.
Duflo, E., Gale, W., Liebman, J., Orszag, P., & Saez, E. (2006). Saving incentives for low-and middle-
income families: evidence from a field experiment with H&R Block. The Quarterly Journal of
Economics, 121(4), 1311-1346.
Elliehausen, G., & Lawrence, E. C. (2001). Payday advance credit in America: An analysis of customer
demand. Washington, D.C.: Credit Research Center, McDonough School of Business,
Georgetown University.
Feigenbaum, J. (2008). Information shocks and precautionary saving. [Article]. Journal of Economic
Dynamics & Control, 32(12), 3917-3938.
Fellowes, M., & Mabanta, M. (2008). Banking on Wealth: America's New Retail Banking Infrastructure
and Its Wealth-building Potential: Brookings Institution.
Feltner, T. (2007). Debt Detour: The Automobile Title Lending Industry in Illinois. Chicago, IL:
Woodstock Institute and the Public Action Foundation.
Femminis, G. (2001). Risk-sharing and growth: The role of precautionary savings in the "education"
model. [Article]. Scandinavian Journal of Economics, 103(1), 63-77.
Center for Financial Security 18
Fine, J., Leimbach, L., & Jacob, K. (2006). Distributing Prepaid Cards through Worker Centers: A
Gateway to Asset Building for Low-Income Households: Center for Financial Services
Innovation,.
First Nations Development Institute. (2009). Borrowed Time: Use of Refund Anticipation Loans Among
EITC Filers in Native American Communities.
Flannery, M. J., & Samolyk, K. (2005). Payday lending: Do the costs justify the price?
Fox, J. A., & Guy, E. (2005). Driven into debt: CFA car title loan store and online survey.
Grant, C. (2007). Estimating credit constraints among US households. [Article]. Oxford Economic
Papers-New Series, 59(4), 583-605.
Graves, S. M. (2003). Landscapes of predation, landscapes of neglect: A location analysis of payday
lenders and banks. [Article]. Professional Geographer, 55(3), 303-317.
Gross, D. B., & Souleles, N. S. (2002). Do liquidity constraints and interest rates matter for consumer
behavior? Evidence from credit card data. [Article]. Quarterly Journal of Economics, 117(1),
149-185.
Guiso, L., Jappelli, T., & Terlizzese, D. (1992). Earning Uncertainty and Precautionary Saving. [Article].
Journal of Monetary Economics, 30(2), 307-337.
Gutter, M. S., & Hatcher, C. B. (2008). Racial Differences in the Demand for Life Insurance. Journal of
Risk and Insurance, 75(3), 677-689.
Hilgert, M. A., Hogarth, J. M., & Beverly, S. G. (2003). Household financial management: The
connection between knowledge and behavior. Federal Reserve Bulletin, 89(7), 309-322.
Institutions, T. D. o. F. (2010). The 2010 Report on the Title Pledge Industry.
Joassart-Marcelli, P., & Stephens, P. (2010). Immigrant banking and financial exclusion in Greater
Boston. [Article]. Journal of Economic Geography, 10(6), 883-912.
Johnson, R. W., & Johnson, D. P. (1998). Pawnbroking in the US: A Profile of Customers. Washington,
D.C.: Credit Research Center, School of Business, Georgetown University.
Karlan, D., McConnell, M., Mullainathan, S., & Zinman, J. (2010). Getting to the Top of Mind: How
Reminders Increase Saving: National Bureau of Economic Research.
Kimball, M. S. (1989). Precautionary Saving in the Small and in the Large: National Bureau of
Economic Research Cambridge, Mass., USA.
Laitner, J. (2004). Precautionary Saving Over the Lifecycle.
LeBoeuf, R. A., & Shafir, E. (2009). Anchoring on the" here" and" now" in time and distance judgments.
Journal of Experimental Psychology: Learning, Memory, and Cognition, 35(1), 81.
Liebenberg, A. P., Carson, J. M., & Hoyt, R. E. (2010). The demand for life insurance policy loans.
Journal of Risk and Insurance, 77(3), 651-666.
Logan, A., & Weller, C. E. (2009). Who Borrows From Payday Lenders? An Analysis of Newly Available
Data: Center for American Progress,.
Lusardi, A. (1998). On the importance of the precautionary saving motive. [Proceedings Paper]. American
Economic Review, 88(2), 449-453.
Lusardi, A., & Mitchell, O. S. (2006). Financial Literacy and Retirement Planning: Implications for
Retirement Wellbeing: Pension Research Council Working Paper.
Lusardi, A., Schneider, D., & Tufano, P. (2011). Financially Fragile Households: Evidence and
Implications.
Lyons, A. C. (2003). How credit access has changed over time for US households. [Article]. Journal of
Consumer Affairs, 37(2), 231-255.
Center for Financial Security 19
Maki, D. M., & Palumbo, M. G. (2001). Disentangling the wealth effect: a cohort analysis of household
saving in the 1990s: FEDS Working Paper No. 2001-21.
Mandell, L. (2004). Financial Literacy: Are We Improving? Washington, DC:: Jump $tart Coalition for
Personal Financial Literacy.
Mansuri, G. (2007). Credit layering in informal financial markets. [Article]. Journal of Development
Economics, 84(2), 715-730.
Manturuk, K., & Quercia, R. (2007). North Carolina Consumers after Payday Lending: Attitudes and
Experiences with Credit Options. Chapel Hill: Center for Community Capital.
Masken, K., Mazur, M., Meikle, J., & Nord, R. (2009). Do Products Offering Expedited Refunds Increase
Income Tax Non-Compliance? : Office of Research, Analysis, and Statistics, Internal Revenue
Service,.
McKernan, S.-M., Ratcliffe, C., & Kuehn, D. (2010). Prohibitions, Price Caps, and Disclosures: A Look
at State Policies and Alternative Financial Product Use.
Merrigan, P., & Normandin, M. (1996). Precautionary saving motives: An assessment from UK time
series of cross-sections. [Article]. Economic Journal, 106(438), 1193-1208.
Meyer, B. D., & Sullivan, J. X. (2003). Measuring the well-being of the poor using income and
consumption. [Proceedings Paper]. Journal of Human Resources, 38, 1180-1220.
Mullainathan, S., & Shafir, E. (2009). Savings Policy and Decisionmaking in Low-Income Households.
In R. M. Blank & M. S. Barr (Eds.), Insufficient Funds: Savings, Assets, Credit, and Banking
among Low-Income Households: Russell Sage Foundation.
Nocetti, D., & Smith, W. T. (2010). Uncertainty, the Demand for Health Care, and Precautionary Saving.
[Article]. B E Journal of Economic Analysis & Policy, 10(1).
Parker, J. A. (2000). Spendthrift in America? On two decades of decline in the US saving rate. In B. S.
Bernanke & J. J. Rotemberg (Eds.), Nber Macroeconomics Annual 1999 (Vol. 14, pp. 317-+).
Cambridge: M I T Press.
Pickering, K., & Mushinski, D. W. (2001). Cultural aspects of credit institutions: Transplanting the
Grameen Bank credit group structure to the Pine Ridge Indian reservation. Journal of economic
issues, 459-467.
Pindus, N., Kuehn, D., & Brash, R. (2010). State Restrictions on Small-Dollar Loans and Financial
Services, 2005-2009: Summary, Documentation, and Appendix.
Prager, R. A. (2009). Determinants of the locations of payday lenders, pawnshops and check-cashing
outlets: Div. of Research & Statistics and Monetary Affairs, Federal Reserve Board.
Ryan, B., Osaki, Y., Burhouse, S., Chapman, D., Critchfield, T., Goodstein, R., et al. (2009). National
Survey of Unbanked and Underbanked Households. Retrieved from
http://www.fdic.gov/householdsurvey/full_report.pdf.
Sanders, C. K. (2010). Savings Outcomes of an IDA Program for Survivors of Domestic Violence: Center
for Social Development at George Warren Brown School of Social Work, Washington University
in St. Louis.
Schneider, R., & Koide, M. (2010). How Should We Serve the Short-Term Credit Needs of Low-Income
Consumers? Paper presented at the Harvard Joint Center on Housing Symposium.
Sherraden, M., Schreiner, M., & Beverly, S. (2003). Income, institutions, and saving performance in
individual development accounts. [Article]. Economic Development Quarterly, 17(1), 95-112.
Center for Financial Security 20
Sherraden, M., & Sherraden, M. W. (1991). Assets and the poor: A new American welfare policy: ME
Sharpe Inc.
Sherraden, M. S., McBride, A. M., & Beverly, S. G. (2010). Striving to save: Creating policies for
financial security of low-income families: Univ of Michigan Pr.
Skiba, P. M., & Tobacman, J. (2008). Do Payday Loans Cause Bankruptcy?
Skinner, J. (1988). Risky Income, Life-Cycle Consumption, and Precautionary Savings. [Article]. Journal
of Monetary Economics, 22(2), 237-255.
Soman, D., & Cheema, A. (2002). The effect of credit on spending decisions: The role of the credit limit
and credibility. [Article]. Marketing Science, 21(1), 32-53.
Theodos, B., Brash, R., Compton, J. F., Masken, K., Pindus, N., & Steuerle, C. E. (2010). Characteristics
of Users of Refund Anticipation Loans and Refund Anticipation Checks.
Thibos, M. (2010). Risky Business: Risk Management Tools & Products for Low-to-Moderate Income
Families. Boston: Doorways to Dreams.
Treasury Inspector General for Tax Administration. (2008). Many Taxpayers Who Obtain Refund
Anticipation Loans Could Benefit From Free Tax Preparation Services. Washington, DC.
United States Government Accountability Office (GAO). Report to the Chairman, Special Committee on
Aging, U.S. Senate. 401(k) Plans: Policy Changes Could Reduce the Long-term Effects of
Leakage on Workers' Retirement Savings. (GAO-090715). Retrieved from
http://www.gao.gov/new.items/d09715.pdf
Van Veldhoven, G. M., & Groenland, E. A. G. (1993). Exploring saving behaviour: A framework and a
research agenda. Journal of Economic Psychology, 14(3), 507-522.
Wang, N. (2009). Optimal consumption and asset allocation with unknown income growth. [Article].
Journal of Monetary Economics, 56(4), 524-534.
Wilson, B. J., Findlay, D. W., Meehan, J. W., Wellford, C., & Schurter, K. (2010). An Experimental
Analysis of the Demand for Payday Loans. [Article]. B E Journal of Economic Analysis & Policy,
10(1).
Wilson, B. K. (1998). The aggregate existence of precautionary saving: Time-series evidence from
expenditures on nondurable and durable goods. [Article]. Journal of Macroeconomics, 20(2),
309-323.
Wu, C. C., & Fox, J. A. (2009). Big Business, Big Bucks: Quickie Tax Loans Generate Profits for Banks
and Tax Preparers While Putting Low-Income Taxpayers At Risk. Washington, DC: Consumer
Federation of America & National Consumer Law Center.
Zeldes, S. P. (1989). Optimal consumption with stochastic income: Deviations from certainty
equivalence. The Quarterly Journal of Economics, 104(2), 275.
Zhan, M., & Sherraden, M. (2003). Assets, expectations, and children's educational achievement in
female-headed households. [Article]. Social Service Review, 77(2), 191-211.

Center for Financial Security 21
Table 1
Percent of Households by Income with Financial Asset or Debt, 2009
Any Financial
Asset
Transaction accounts
Certificates of deposit
Savings bonds
Cash value life insurance
Any debt
Credit card
balances
Installment loans
Less than 20 83% 77% 9% 4% 15% 56% 28% 33%
20–39.9 94% 91% 14% 10% 22% 73% 38% 51%
40–59.9 97% 95% 14% 12% 22% 84% 51% 57%
60–79.9 100% 100% 19% 21% 26% 88% 57% 58%
80–89.9 100% 99% 21% 25% 32% 89% 52% 56%
90–100 100% 100% 26% 24% 41% 84% 32% 41%
Source: Survey of Consumer Finances (Bricker, Bucks, Kennickell, Mach &Moore, 2011)
http://www.federalreserve.gov/pubs/feds/2011/201117/201117pap.pdf

Center for Financial Security 22
Table 2
Summary of Liquidity Mechanisms
Type Pro (+) Con (-)
Checking Account Convenient Overdraft fees costly if withdraw more than account balance
Savings Account Convenient Minimum balance required; limits on withdrawals
A. Informal Lending Convenient; Underwriting and Collections efficiencies
Relationship based
B. Late or Skipped Payment
Convenient Undermines credit history; may lose other accounts
C. Payday Loan Convenient advance of short run income
Requires bank account; costly if used repeatedly
D. Pawnshop Can liquidate durable goods or personal property
May be costly; may lose property
E. Auto Title Loan Convert equity in auto to current consumption; Collateralized
May be costly; may lose vehicle
F. Refund Anticipation Loan
Can convert tax refund to consumption
Short term loan once per year; May be costly
G. Credit Card Convenient; Terms vary; Qualifications standards vary
H. Retirement/401(k) Loan/ Liquidation
Low cost loan; May be significant assets
Access varies; nonpayment carries tax penalty; Loss of retirement security
I. Whole Life Insurance Cash Value Loan
Low cost loan Access varies
Center for Financial Security 23
Table 3
Estimated Costs by Loan Type
Type Cost
A. Informal Lending Social and monetary costs vary
B. Late or Skipped Payment $30 fee for any amount.
C. Payday Loan $20 fee for $100, two-week loan. Additional fees for rolling over the loan.
D. Pawnshop $10 fee for $100 loan. Possibility of losing item if do not repay loan.
E. Auto Title Loan $30 fee for every $100 of loan amount. Possibility of losing car if do not repay loan.
F. Refund Anticipation Loan $65 fee for $3,300 average loan. RALs tend to be larger loan amounts.
G. Credit Card $30 fee for any amount.
H. Retirement/401(k) Loan/Liquidation Fee is 10% of the amount withdrawn from the account.
I. Whole Life Insurance Cash Value Loan Fees vary greatly between 5-12%.
*The costs noted above vary greatly depending on state laws. The costs above are averages or
found in the literature.
Center for Financial Security 24
Figure 1
Median Net Worth 2007-2009 ($000)
Source: Survey of Consumer Finances (Bricker, Bucks, Kennickell, Mach &Moore, 2011)
http://www.federalreserve.gov/pubs/feds/2011/201117/201117pap.pdf
$10.1
$39.1
$95.4
$7.2
$32.9
$72.6
$-
$10.0
$20.0
$30.0
$40.0
$50.0
$60.0
$70.0
$80.0
$90.0
$100.02007 2009
Third quintile Lowest quintile Second quintile

Center for Financial Security 25
Figure 2
Emergency Funds and Drop in Income
Source: FINRA Financial Capability Survey, State Sample, National weights. Authors’
tabulations.
Center for Financial Security 26
Figure 3
Account Holding by Income, 2009
Source: FINRA Financial Capability Survey, National data, Published tables.
Figure 4
Use of the Following in the Past 5 Years, 2009 % Yes <$25K $25-75K $75K+
Auto title loan 5% 7% 10% Payday loan 6% 6% 2% Refund anticipation loan 12% 7% 3% Pawn shop 16% 7% 1%
FINRA Financial Capability Study, www.finrafoundation.org/programs/p123306
63%
95% 98%
43%
81%
94%
0%
10%
20%
30%
40%
50%
60%
70%
80%
90%
100%
<$25K $25-75K $75K+
Checking
Savings
Center for Financial Security 27
Appendix A: Summary of Literature
Mechanism Author Year Paper Title Main Findings/Contribution
Lifecycle Agarwal, Driscoll, Gabaix, &Laibson
2007 The Age of Reason: Financial Decisions Over the Lifecycle
Bank data indicates that middle aged adults are able to borrow at lower interest rates and pay lower fees; this is linked to level of experience and peaking analytic capability.
Credit Cards Agarwal, Skiba, & Tobacman
2009 Payday Loans and Credit Cards: New Liquidity and Credit Scoring Puzzles?
A matched sample of 3,090 payday borrowers with credit cards finds most borrowers have credit card liquidity that exceeds the size of the typical payday loan. Annual pecuniary costs of payday borrowing are larger than credit card costs.
Non-traditional Loans
Aleem 1990 Imperfect Information, Screening, and the Costs of Informal Lending--A Study of a Rural Credit Market in Pakistan
Qualitative study of farmers finds that borrowers perceive each lender to be offering a different product creating a downward-sloping demand curve, farmers seeking loans are not aware of the terms; and lenders do not have any incentive to cut their interest rates to increase market share.
Pensions Amromin & Smith
2003 What Explains Early Withdrawals from Retirement Accounts? Evidence from a Panel of Taxpayers
Early (penalized) withdrawals are significantly more likely to occur in households with job loss, income shocks, divorce, home purchases, and low levels of non-retirement financial wealth. These indicators increase the likelihood of early withdrawals by 3 to 10 percentage points each. Results also indicate that households with low non-retirement financial wealth are significantly more likely than other households use their retirement account funds in response to shocks.
General Amuedo-Dorantes, & Pozo
2002 Precautionary Saving by Young Immigrants and Young Natives
Ten percent increase of income uncertainty for native born people increases their financial wealth to permanent income ratios by 19.6 percent. A 10 percent increase in income uncertainty for immigrants results in an increase in financial wealth to permanent income ratio by about 27.8 percent. Native born residents have greater liquidity than immigrants. Immigrants' patterns may be related to remittances to relatives in their home countries.
Individual Development Accounts
Ashraf, Karlan, & Yin
2006 Tying Odysseus to the Mast: Evidence from a Commitment Savings Product in the Philippines
Participants were offered a new savings account that restricted access to the deposits. Women with hyperbolic time preferences preferred the product and average bank account savings increased 47 percent after six months. After 12 months, average bank account savings increased 82 percent.
Unbanked Bachelder, Alexander, Yu, Bellows, Stanton, Rumble & Barr
2008 Banks’ Efforts to Serve the Unbanked and Underbanked
Only 8 percent of surveyed banks offer IDAs; of those offering IDAs, 22 percent partner with other organizations. About 97 percent of banks can originate an unsecured personal loan in less than 48 hours and 69 percent of banks offer unsecured personal loan amounts for up to $5,000. Less than 6 percent of banks provide an advance on funds. Only 25 percent of these banks offer secured credit cards to customers who do not qualify for a traditional credit card.
Payday Bair 2005 Low-Cost Payday Loans: Opportunities and Obstacles
Overdraft fees are the substitute or alternative to payday loans. The APR for payday loans rises with the loan amount, but overdraft fees usually remain constant. Case studies show banks could offer lower cost payday loan alternatives such as a checking account linked to a revolving line of credit.
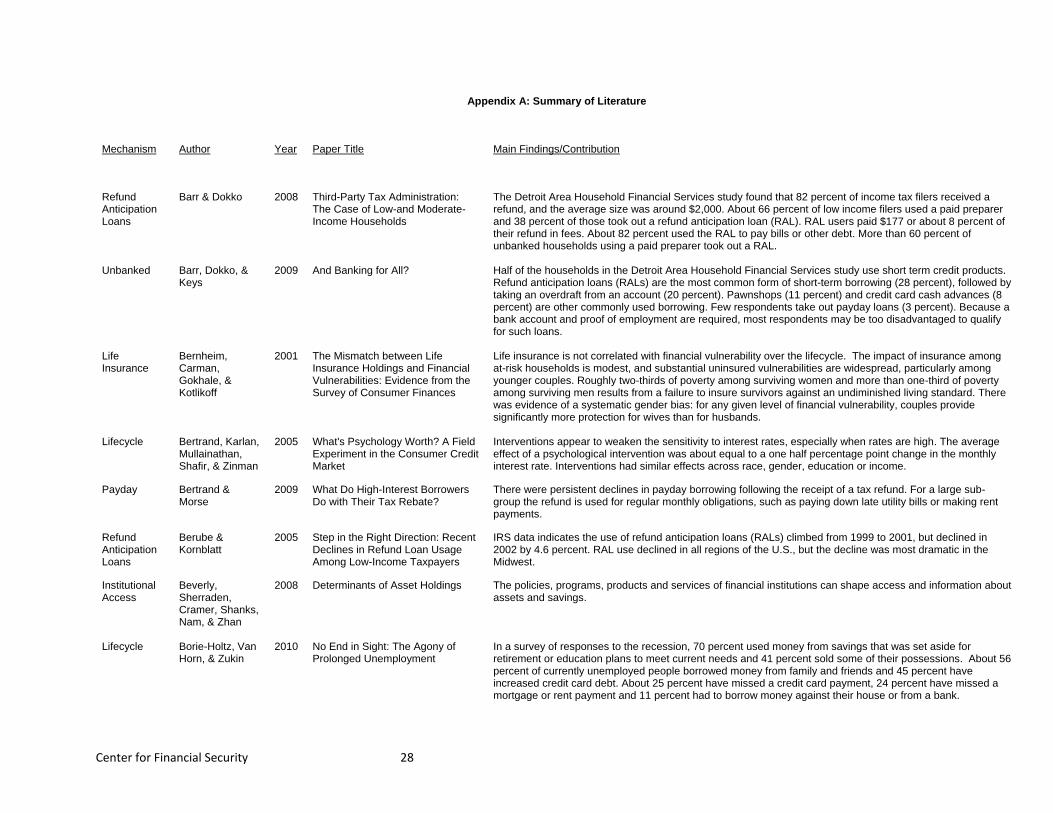
Center for Financial Security 28
Appendix A: Summary of Literature
Mechanism Author Year Paper Title Main Findings/Contribution
Refund Anticipation Loans
Barr & Dokko 2008 Third-Party Tax Administration: The Case of Low-and Moderate-Income Households
The Detroit Area Household Financial Services study found that 82 percent of income tax filers received a refund, and the average size was around $2,000. About 66 percent of low income filers used a paid preparer and 38 percent of those took out a refund anticipation loan (RAL). RAL users paid $177 or about 8 percent of their refund in fees. About 82 percent used the RAL to pay bills or other debt. More than 60 percent of unbanked households using a paid preparer took out a RAL.
Unbanked Barr, Dokko, & Keys
2009 And Banking for All? Half of the households in the Detroit Area Household Financial Services study use short term credit products. Refund anticipation loans (RALs) are the most common form of short-term borrowing (28 percent), followed by taking an overdraft from an account (20 percent). Pawnshops (11 percent) and credit card cash advances (8 percent) are other commonly used borrowing. Few respondents take out payday loans (3 percent). Because a bank account and proof of employment are required, most respondents may be too disadvantaged to qualify for such loans.
Life Insurance
Bernheim, Carman, Gokhale, & Kotlikoff
2001 The Mismatch between Life Insurance Holdings and Financial Vulnerabilities: Evidence from the Survey of Consumer Finances
Life insurance is not correlated with financial vulnerability over the lifecycle. The impact of insurance among at-risk households is modest, and substantial uninsured vulnerabilities are widespread, particularly among younger couples. Roughly two-thirds of poverty among surviving women and more than one-third of poverty among surviving men results from a failure to insure survivors against an undiminished living standard. There was evidence of a systematic gender bias: for any given level of financial vulnerability, couples provide significantly more protection for wives than for husbands.
Lifecycle Bertrand, Karlan, Mullainathan, Shafir, & Zinman
2005 What's Psychology Worth? A Field Experiment in the Consumer Credit Market
Interventions appear to weaken the sensitivity to interest rates, especially when rates are high. The average effect of a psychological intervention was about equal to a one half percentage point change in the monthly interest rate. Interventions had similar effects across race, gender, education or income.
Payday Bertrand & Morse
2009 What Do High-Interest Borrowers Do with Their Tax Rebate?
There were persistent declines in payday borrowing following the receipt of a tax refund. For a large sub-group the refund is used for regular monthly obligations, such as paying down late utility bills or making rent payments.
Refund Anticipation Loans
Berube & Kornblatt
2005 Step in the Right Direction: Recent Declines in Refund Loan Usage Among Low-Income Taxpayers
IRS data indicates the use of refund anticipation loans (RALs) climbed from 1999 to 2001, but declined in 2002 by 4.6 percent. RAL use declined in all regions of the U.S., but the decline was most dramatic in the Midwest.
Institutional Access
Beverly, Sherraden, Cramer, Shanks, Nam, & Zhan
2008 Determinants of Asset Holdings
The policies, programs, products and services of financial institutions can shape access and information about assets and savings.
Lifecycle Borie-Holtz, Van Horn, & Zukin
2010 No End in Sight: The Agony of Prolonged Unemployment
In a survey of responses to the recession, 70 percent used money from savings that was set aside for retirement or education plans to meet current needs and 41 percent sold some of their possessions. About 56 percent of currently unemployed people borrowed money from family and friends and 45 percent have increased credit card debt. About 25 percent have missed a credit card payment, 24 percent have missed a mortgage or rent payment and 11 percent had to borrow money against their house or from a bank.
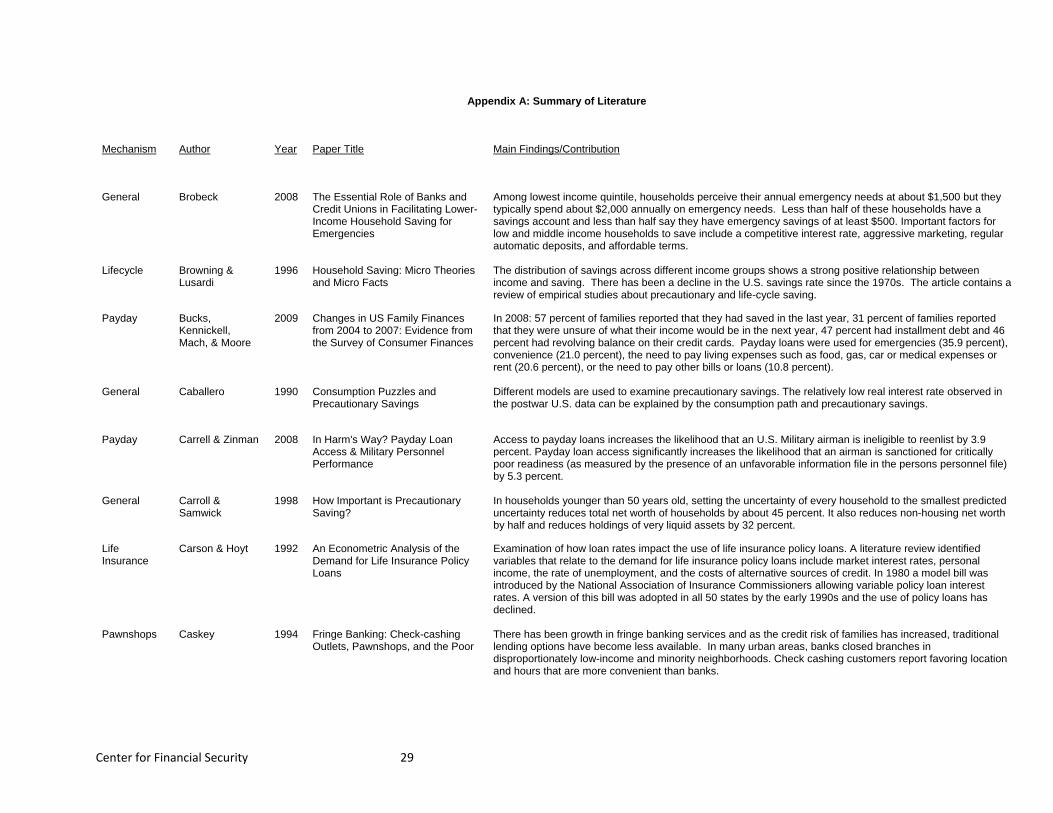
Center for Financial Security 29
Appendix A: Summary of Literature
Mechanism Author Year Paper Title Main Findings/Contribution
General Brobeck 2008 The Essential Role of Banks and Credit Unions in Facilitating Lower-Income Household Saving for Emergencies
Among lowest income quintile, households perceive their annual emergency needs at about $1,500 but they typically spend about $2,000 annually on emergency needs. Less than half of these households have a savings account and less than half say they have emergency savings of at least $500. Important factors for low and middle income households to save include a competitive interest rate, aggressive marketing, regular automatic deposits, and affordable terms.
Lifecycle Browning & Lusardi
1996 Household Saving: Micro Theories and Micro Facts
The distribution of savings across different income groups shows a strong positive relationship between income and saving. There has been a decline in the U.S. savings rate since the 1970s. The article contains a review of empirical studies about precautionary and life-cycle saving.
Payday Bucks, Kennickell, Mach, & Moore
2009 Changes in US Family Finances from 2004 to 2007: Evidence from the Survey of Consumer Finances
In 2008: 57 percent of families reported that they had saved in the last year, 31 percent of families reported that they were unsure of what their income would be in the next year, 47 percent had installment debt and 46 percent had revolving balance on their credit cards. Payday loans were used for emergencies (35.9 percent), convenience (21.0 percent), the need to pay living expenses such as food, gas, car or medical expenses or rent (20.6 percent), or the need to pay other bills or loans (10.8 percent).
General Caballero 1990 Consumption Puzzles and Precautionary Savings
Different models are used to examine precautionary savings. The relatively low real interest rate observed in the postwar U.S. data can be explained by the consumption path and precautionary savings.
Payday Carrell & Zinman 2008 In Harm's Way? Payday Loan Access & Military Personnel Performance
Access to payday loans increases the likelihood that an U.S. Military airman is ineligible to reenlist by 3.9 percent. Payday loan access significantly increases the likelihood that an airman is sanctioned for critically poor readiness (as measured by the presence of an unfavorable information file in the persons personnel file) by 5.3 percent.
General Carroll & Samwick
1998 How Important is Precautionary Saving?
In households younger than 50 years old, setting the uncertainty of every household to the smallest predicted uncertainty reduces total net worth of households by about 45 percent. It also reduces non-housing net worth by half and reduces holdings of very liquid assets by 32 percent.
Life Insurance
Carson & Hoyt 1992 An Econometric Analysis of the Demand for Life Insurance Policy Loans
Examination of how loan rates impact the use of life insurance policy loans. A literature review identified variables that relate to the demand for life insurance policy loans include market interest rates, personal income, the rate of unemployment, and the costs of alternative sources of credit. In 1980 a model bill was introduced by the National Association of Insurance Commissioners allowing variable policy loan interest rates. A version of this bill was adopted in all 50 states by the early 1990s and the use of policy loans has declined.
Pawnshops Caskey 1994 Fringe Banking: Check-cashing Outlets, Pawnshops, and the Poor
There has been growth in fringe banking services and as the credit risk of families has increased, traditional lending options have become less available. In many urban areas, banks closed branches in disproportionately low-income and minority neighborhoods. Check cashing customers report favoring location and hours that are more convenient than banks.
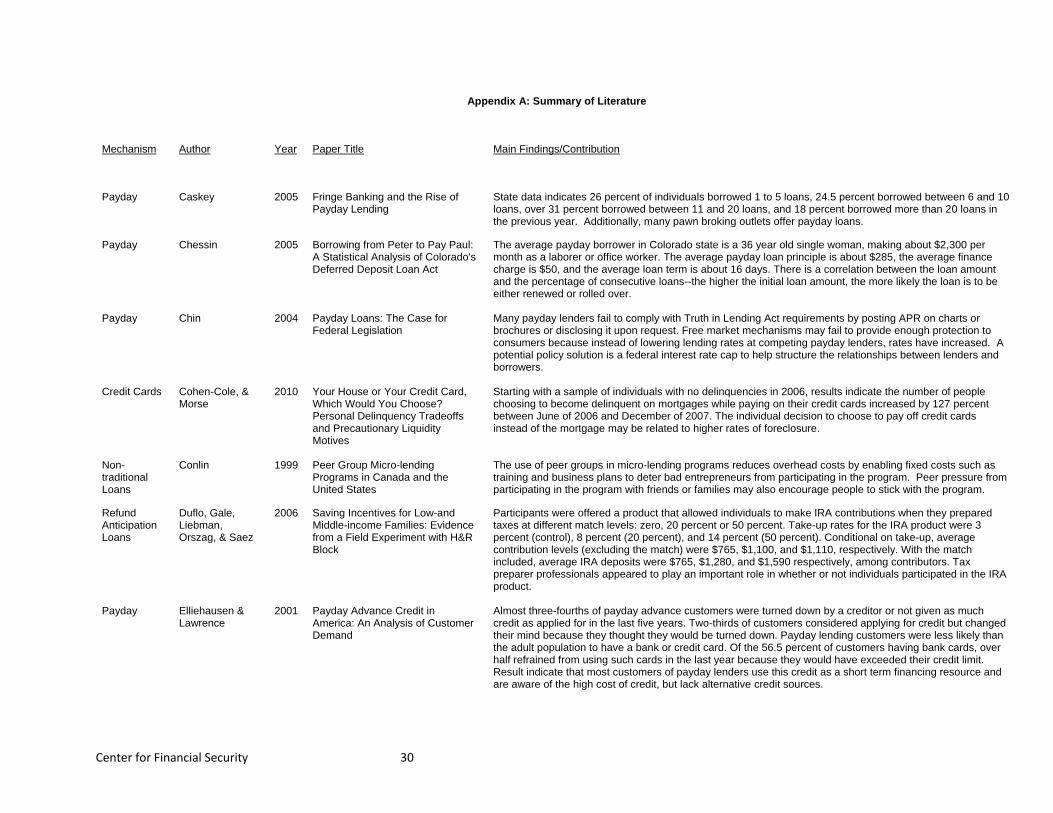
Center for Financial Security 30
Appendix A: Summary of Literature
Mechanism Author Year Paper Title Main Findings/Contribution
Payday Caskey 2005 Fringe Banking and the Rise of Payday Lending
State data indicates 26 percent of individuals borrowed 1 to 5 loans, 24.5 percent borrowed between 6 and 10 loans, over 31 percent borrowed between 11 and 20 loans, and 18 percent borrowed more than 20 loans in the previous year. Additionally, many pawn broking outlets offer payday loans.
Payday Chessin 2005 Borrowing from Peter to Pay Paul: A Statistical Analysis of Colorado's Deferred Deposit Loan Act
The average payday borrower in Colorado state is a 36 year old single woman, making about $2,300 per month as a laborer or office worker. The average payday loan principle is about $285, the average finance charge is $50, and the average loan term is about 16 days. There is a correlation between the loan amount and the percentage of consecutive loans--the higher the initial loan amount, the more likely the loan is to be either renewed or rolled over.
Payday Chin 2004 Payday Loans: The Case for Federal Legislation
Many payday lenders fail to comply with Truth in Lending Act requirements by posting APR on charts or brochures or disclosing it upon request. Free market mechanisms may fail to provide enough protection to consumers because instead of lowering lending rates at competing payday lenders, rates have increased. A potential policy solution is a federal interest rate cap to help structure the relationships between lenders and borrowers.
Credit Cards Cohen-Cole, & Morse
2010 Your House or Your Credit Card, Which Would You Choose? Personal Delinquency Tradeoffs and Precautionary Liquidity Motives
Starting with a sample of individuals with no delinquencies in 2006, results indicate the number of people choosing to become delinquent on mortgages while paying on their credit cards increased by 127 percent between June of 2006 and December of 2007. The individual decision to choose to pay off credit cards instead of the mortgage may be related to higher rates of foreclosure.
Non-traditional Loans
Conlin 1999 Peer Group Micro-lending Programs in Canada and the United States
The use of peer groups in micro-lending programs reduces overhead costs by enabling fixed costs such as training and business plans to deter bad entrepreneurs from participating in the program. Peer pressure from participating in the program with friends or families may also encourage people to stick with the program.
Refund Anticipation Loans
Duflo, Gale, Liebman, Orszag, & Saez
2006 Saving Incentives for Low-and Middle-income Families: Evidence from a Field Experiment with H&R Block
Participants were offered a product that allowed individuals to make IRA contributions when they prepared taxes at different match levels: zero, 20 percent or 50 percent. Take-up rates for the IRA product were 3 percent (control), 8 percent (20 percent), and 14 percent (50 percent). Conditional on take-up, average contribution levels (excluding the match) were $765, $1,100, and $1,110, respectively. With the match included, average IRA deposits were $765, $1,280, and $1,590 respectively, among contributors. Tax preparer professionals appeared to play an important role in whether or not individuals participated in the IRA product.
Payday Elliehausen & Lawrence
2001 Payday Advance Credit in America: An Analysis of Customer Demand
Almost three-fourths of payday advance customers were turned down by a creditor or not given as much credit as applied for in the last five years. Two-thirds of customers considered applying for credit but changed their mind because they thought they would be turned down. Payday lending customers were less likely than the adult population to have a bank or credit card. Of the 56.5 percent of customers having bank cards, over half refrained from using such cards in the last year because they would have exceeded their credit limit. Result indicate that most customers of payday lenders use this credit as a short term financing resource and are aware of the high cost of credit, but lack alternative credit sources.

Center for Financial Security 31
Appendix A: Summary of Literature
Mechanism Author Year Paper Title Main Findings/Contribution
General Feigenbaum 2008 Information Shocks and Precautionary Saving
When shocks like medical expenses are placed closer to the end of life, it can magnify the effect of those medical expenses. If an individual receives information about likely medical expenses that will occur at the end of his or her life, this information will have a significant impact on precautionary savings and consumption over the lifecycle.
Lifecycle Fellowes & Mabanta
2008 Banking on Wealth: America's New Retail Banking Infrastructure and Its Wealth-building Potential
About 12 million U.S. households lack a checking account. There are over 26,000 non-bank businesses that provide check-cashing services, almost 23,000 payday lenders, and almost 10,400 pawnshops. About 90 percent of high-cost financial service providers are located within one mile of a bank or credit union branch and 78 percent of these providers do business in the same neighborhood or census tract as a bank or credit union. The paper considers a number of possible scenarios if a non-bank financial services customer were to invest fees in the stock market or savings bonds.
Auto Title Loans
Feltner 2007 Debt Detour: The Automobile Title Lending Industry in Illinois
In 2005, 63 auto title loan companies with 260 locations were operating throughout Illinois state. The median loan principal was $1500, with an average finance charge of just over $1500. The average term for the loan is 209 days and average APR is 256 percent. Typically, cars used as collateral for auto title loans were about 11 years old with an average odometer reading of above 90,000 miles.
General Femminis 2001 Risk-sharing and Growth: The Role of Precautionary Savings in the "Education" Model
An increase in precautionary savings makes labor more productive in the goods sector. But in education, an increase in precautionary savings draws resources away from investment in human capital.
Prepaid Debit
Fine, Leimbach, & Jacob
2006 Distributing Prepaid Cards through Worker Centers: A Gateway to Asset Building for Low-income Households
A survey of 480 immigrant workers by the Center for Community Change and Community Financial Resources found the median annual income of workers to be about $15,600, but the monthly saving to be about $289 per month. Close to half of respondents were unbanked, though many possessed requisite identification to open a standard bank account. About 82 percent of the unbanked expressed interest in obtaining a savings account. Additionally, 31 percent said they were interested in getting a credit card, 26 percent wanted a checking account, and 26 percent said they were interested in obtaining a home loan. Prepaid debit cards maybe a financial product to assist the immigrant worker community.
Refund Anticipation Loans
First Nations Development Institute
2009 Borrowed Time: Use of Refund Anticipation Loans Among EITC Filers in Native American Communities
Native population counties are compared with non-native population counties in 10 states to review the use of refund anticipation loans among Earned Income Tax Credit (EITC) recipients. There is a moderate to strong positive correlation between an increase in the share of Native Americans in a county and the use of RALs among EITC tax filers. EITC recipients pay an average of $250 for tax preparation and a RAL.
Payday Flannery & Samolyk
2005 Payday Lending: Do the Costs Justify the Price?
Loan renewals or loans from frequent borrowers are not more profitable than other loans per se, although they certainly contribute to a store’s loan volume. Controlling for loan volume, results indicate that economic and demographic conditions in the neighborhoods where stores are located do not have much of an effect on profitability, although they do slightly influence default losses.
Auto Title Loans
Fox & Guy 2005 Driven into Debt: CFA Car Title Loan Store and Online Survey
Fox and Guy examine title lending practices across the U.S. They use data from a survey collected by the Consumer Federation of America. The survey collected in 11 states from 81 car title lenders and also surveyed 17 online title lenders. They found that the average APR charged was 300 percent in stores and could be as high as 650 percent for online lenders.
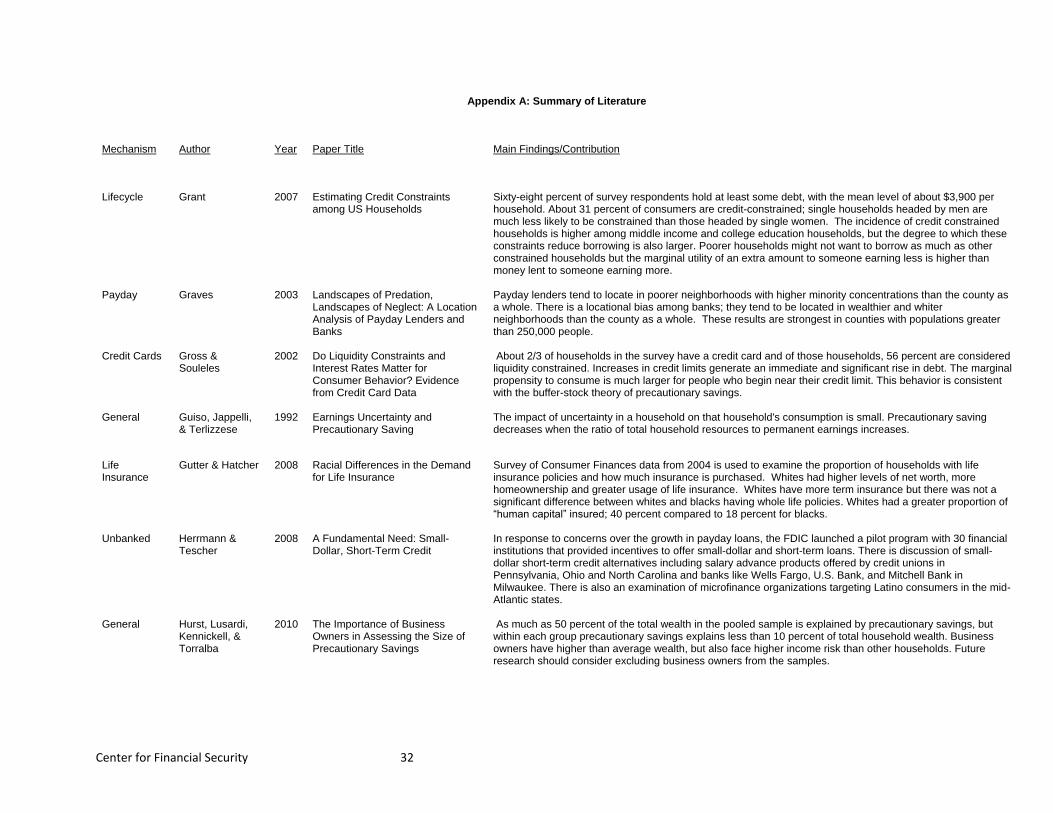
Center for Financial Security 32
Appendix A: Summary of Literature
Mechanism Author Year Paper Title Main Findings/Contribution
Lifecycle Grant 2007 Estimating Credit Constraints among US Households
Sixty-eight percent of survey respondents hold at least some debt, with the mean level of about $3,900 per household. About 31 percent of consumers are credit-constrained; single households headed by men are much less likely to be constrained than those headed by single women. The incidence of credit constrained households is higher among middle income and college education households, but the degree to which these constraints reduce borrowing is also larger. Poorer households might not want to borrow as much as other constrained households but the marginal utility of an extra amount to someone earning less is higher than money lent to someone earning more.
Payday Graves 2003 Landscapes of Predation, Landscapes of Neglect: A Location Analysis of Payday Lenders and Banks
Payday lenders tend to locate in poorer neighborhoods with higher minority concentrations than the county as a whole. There is a locational bias among banks; they tend to be located in wealthier and whiter neighborhoods than the county as a whole. These results are strongest in counties with populations greater than 250,000 people.
Credit Cards Gross & Souleles
2002 Do Liquidity Constraints and Interest Rates Matter for Consumer Behavior? Evidence from Credit Card Data
About 2/3 of households in the survey have a credit card and of those households, 56 percent are considered liquidity constrained. Increases in credit limits generate an immediate and significant rise in debt. The marginal propensity to consume is much larger for people who begin near their credit limit. This behavior is consistent with the buffer-stock theory of precautionary savings.
General Guiso, Jappelli, & Terlizzese
1992 Earnings Uncertainty and Precautionary Saving
The impact of uncertainty in a household on that household's consumption is small. Precautionary saving decreases when the ratio of total household resources to permanent earnings increases.
Life Insurance
Gutter & Hatcher 2008 Racial Differences in the Demand for Life Insurance
Survey of Consumer Finances data from 2004 is used to examine the proportion of households with life insurance policies and how much insurance is purchased. Whites had higher levels of net worth, more homeownership and greater usage of life insurance. Whites have more term insurance but there was not a significant difference between whites and blacks having whole life policies. Whites had a greater proportion of “human capital” insured; 40 percent compared to 18 percent for blacks.
Unbanked Herrmann &
Tescher 2008 A Fundamental Need: Small-
Dollar, Short-Term Credit In response to concerns over the growth in payday loans, the FDIC launched a pilot program with 30 financial institutions that provided incentives to offer small-dollar and short-term loans. There is discussion of small-dollar short-term credit alternatives including salary advance products offered by credit unions in Pennsylvania, Ohio and North Carolina and banks like Wells Fargo, U.S. Bank, and Mitchell Bank in Milwaukee. There is also an examination of microfinance organizations targeting Latino consumers in the mid-Atlantic states.
General Hurst, Lusardi, Kennickell, & Torralba
2010 The Importance of Business Owners in Assessing the Size of Precautionary Savings
As much as 50 percent of the total wealth in the pooled sample is explained by precautionary savings, but within each group precautionary savings explains less than 10 percent of total household wealth. Business owners have higher than average wealth, but also face higher income risk than other households. Future research should consider excluding business owners from the samples.
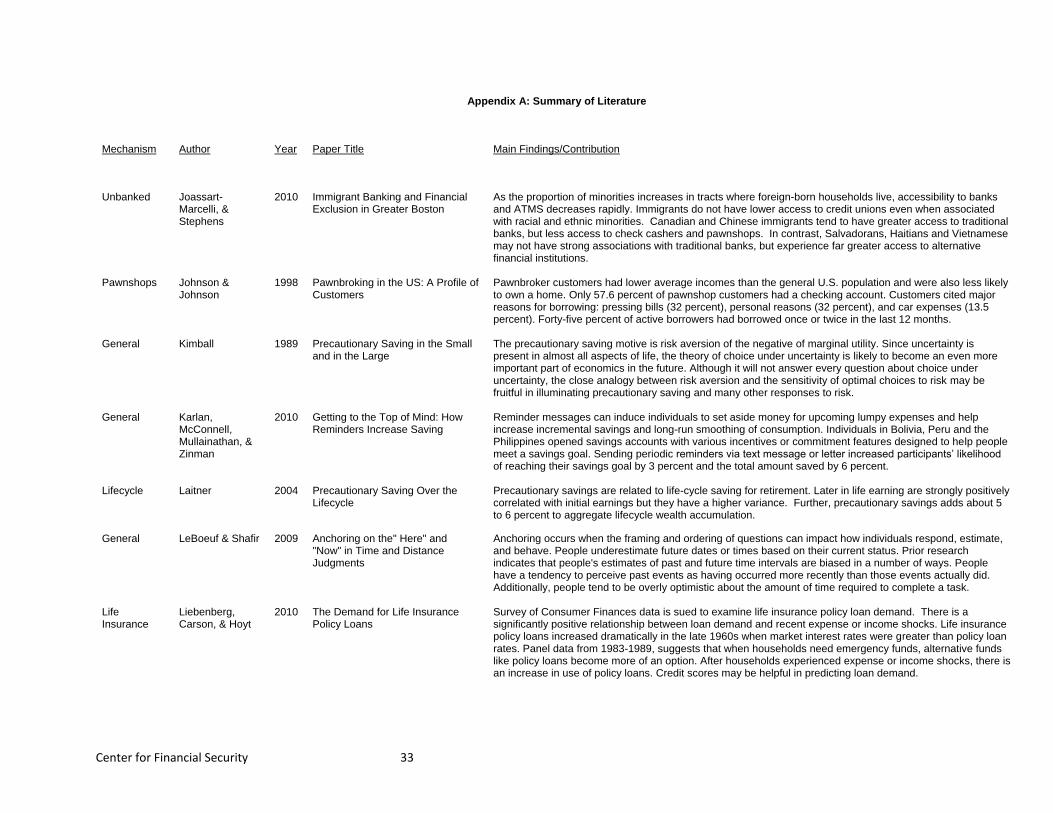
Center for Financial Security 33
Appendix A: Summary of Literature
Mechanism Author Year Paper Title Main Findings/Contribution
Unbanked Joassart-Marcelli, & Stephens
2010 Immigrant Banking and Financial Exclusion in Greater Boston
As the proportion of minorities increases in tracts where foreign-born households live, accessibility to banks and ATMS decreases rapidly. Immigrants do not have lower access to credit unions even when associated with racial and ethnic minorities. Canadian and Chinese immigrants tend to have greater access to traditional banks, but less access to check cashers and pawnshops. In contrast, Salvadorans, Haitians and Vietnamese may not have strong associations with traditional banks, but experience far greater access to alternative financial institutions.
Pawnshops Johnson & Johnson
1998 Pawnbroking in the US: A Profile of Customers
Pawnbroker customers had lower average incomes than the general U.S. population and were also less likely to own a home. Only 57.6 percent of pawnshop customers had a checking account. Customers cited major reasons for borrowing: pressing bills (32 percent), personal reasons (32 percent), and car expenses (13.5 percent). Forty-five percent of active borrowers had borrowed once or twice in the last 12 months.
General Kimball 1989 Precautionary Saving in the Small and in the Large
The precautionary saving motive is risk aversion of the negative of marginal utility. Since uncertainty is present in almost all aspects of life, the theory of choice under uncertainty is likely to become an even more important part of economics in the future. Although it will not answer every question about choice under uncertainty, the close analogy between risk aversion and the sensitivity of optimal choices to risk may be fruitful in illuminating precautionary saving and many other responses to risk.
General Karlan, McConnell, Mullainathan, & Zinman
2010 Getting to the Top of Mind: How Reminders Increase Saving
Reminder messages can induce individuals to set aside money for upcoming lumpy expenses and help increase incremental savings and long-run smoothing of consumption. Individuals in Bolivia, Peru and the Philippines opened savings accounts with various incentives or commitment features designed to help people meet a savings goal. Sending periodic reminders via text message or letter increased participants’ likelihood of reaching their savings goal by 3 percent and the total amount saved by 6 percent.
Lifecycle Laitner 2004 Precautionary Saving Over the Lifecycle
Precautionary savings are related to life-cycle saving for retirement. Later in life earning are strongly positively correlated with initial earnings but they have a higher variance. Further, precautionary savings adds about 5 to 6 percent to aggregate lifecycle wealth accumulation.
General LeBoeuf & Shafir 2009 Anchoring on the" Here" and "Now" in Time and Distance Judgments
Anchoring occurs when the framing and ordering of questions can impact how individuals respond, estimate, and behave. People underestimate future dates or times based on their current status. Prior research indicates that people's estimates of past and future time intervals are biased in a number of ways. People have a tendency to perceive past events as having occurred more recently than those events actually did. Additionally, people tend to be overly optimistic about the amount of time required to complete a task.
Life Insurance
Liebenberg, Carson, & Hoyt
2010 The Demand for Life Insurance Policy Loans
Survey of Consumer Finances data is sued to examine life insurance policy loan demand. There is a significantly positive relationship between loan demand and recent expense or income shocks. Life insurance policy loans increased dramatically in the late 1960s when market interest rates were greater than policy loan rates. Panel data from 1983-1989, suggests that when households need emergency funds, alternative funds like policy loans become more of an option. After households experienced expense or income shocks, there is an increase in use of policy loans. Credit scores may be helpful in predicting loan demand.
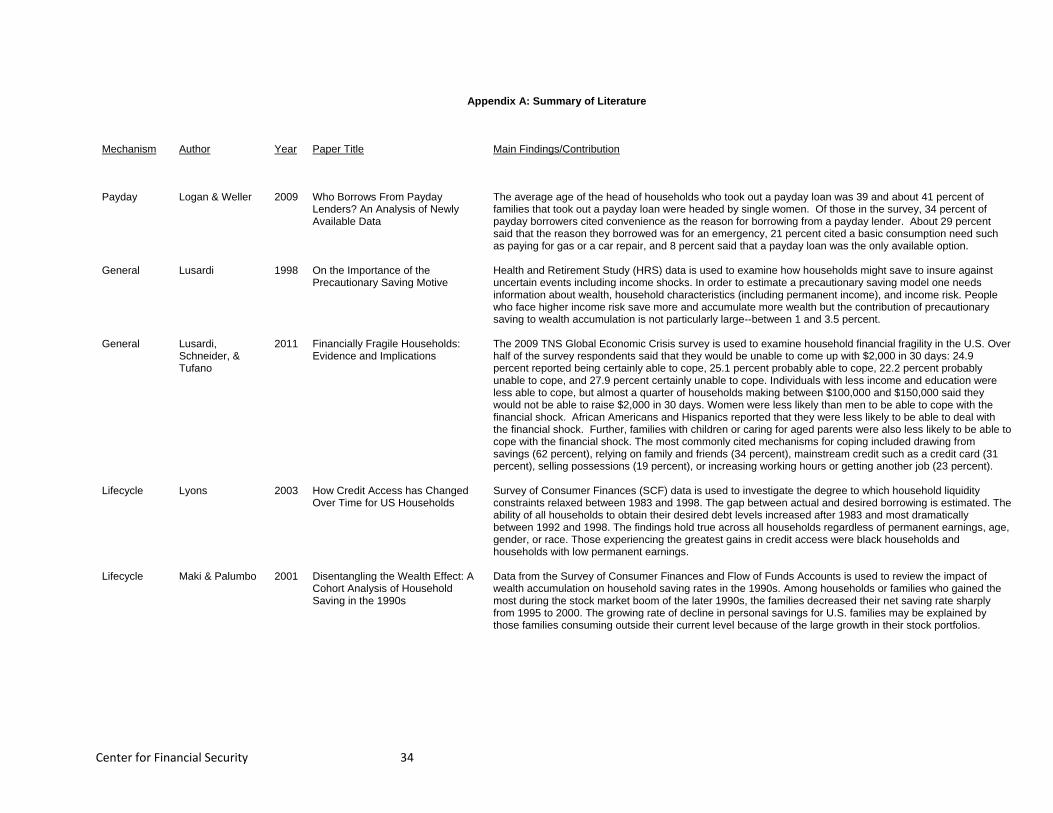
Center for Financial Security 34
Appendix A: Summary of Literature
Mechanism Author Year Paper Title Main Findings/Contribution
Payday Logan & Weller 2009 Who Borrows From Payday Lenders? An Analysis of Newly Available Data
The average age of the head of households who took out a payday loan was 39 and about 41 percent of families that took out a payday loan were headed by single women. Of those in the survey, 34 percent of payday borrowers cited convenience as the reason for borrowing from a payday lender. About 29 percent said that the reason they borrowed was for an emergency, 21 percent cited a basic consumption need such as paying for gas or a car repair, and 8 percent said that a payday loan was the only available option.
General Lusardi 1998 On the Importance of the Precautionary Saving Motive
Health and Retirement Study (HRS) data is used to examine how households might save to insure against uncertain events including income shocks. In order to estimate a precautionary saving model one needs information about wealth, household characteristics (including permanent income), and income risk. People who face higher income risk save more and accumulate more wealth but the contribution of precautionary saving to wealth accumulation is not particularly large--between 1 and 3.5 percent.
General Lusardi, Schneider, & Tufano
2011 Financially Fragile Households: Evidence and Implications
The 2009 TNS Global Economic Crisis survey is used to examine household financial fragility in the U.S. Over half of the survey respondents said that they would be unable to come up with $2,000 in 30 days: 24.9 percent reported being certainly able to cope, 25.1 percent probably able to cope, 22.2 percent probably unable to cope, and 27.9 percent certainly unable to cope. Individuals with less income and education were less able to cope, but almost a quarter of households making between $100,000 and $150,000 said they would not be able to raise $2,000 in 30 days. Women were less likely than men to be able to cope with the financial shock. African Americans and Hispanics reported that they were less likely to be able to deal with the financial shock. Further, families with children or caring for aged parents were also less likely to be able to cope with the financial shock. The most commonly cited mechanisms for coping included drawing from savings (62 percent), relying on family and friends (34 percent), mainstream credit such as a credit card (31 percent), selling possessions (19 percent), or increasing working hours or getting another job (23 percent).
Lifecycle Lyons 2003 How Credit Access has Changed Over Time for US Households
Survey of Consumer Finances (SCF) data is used to investigate the degree to which household liquidity constraints relaxed between 1983 and 1998. The gap between actual and desired borrowing is estimated. The ability of all households to obtain their desired debt levels increased after 1983 and most dramatically between 1992 and 1998. The findings hold true across all households regardless of permanent earnings, age, gender, or race. Those experiencing the greatest gains in credit access were black households and households with low permanent earnings.
Lifecycle Maki & Palumbo 2001 Disentangling the Wealth Effect: A Cohort Analysis of Household Saving in the 1990s
Data from the Survey of Consumer Finances and Flow of Funds Accounts is used to review the impact of wealth accumulation on household saving rates in the 1990s. Among households or families who gained the most during the stock market boom of the later 1990s, the families decreased their net saving rate sharply from 1995 to 2000. The growing rate of decline in personal savings for U.S. families may be explained by those families consuming outside their current level because of the large growth in their stock portfolios.
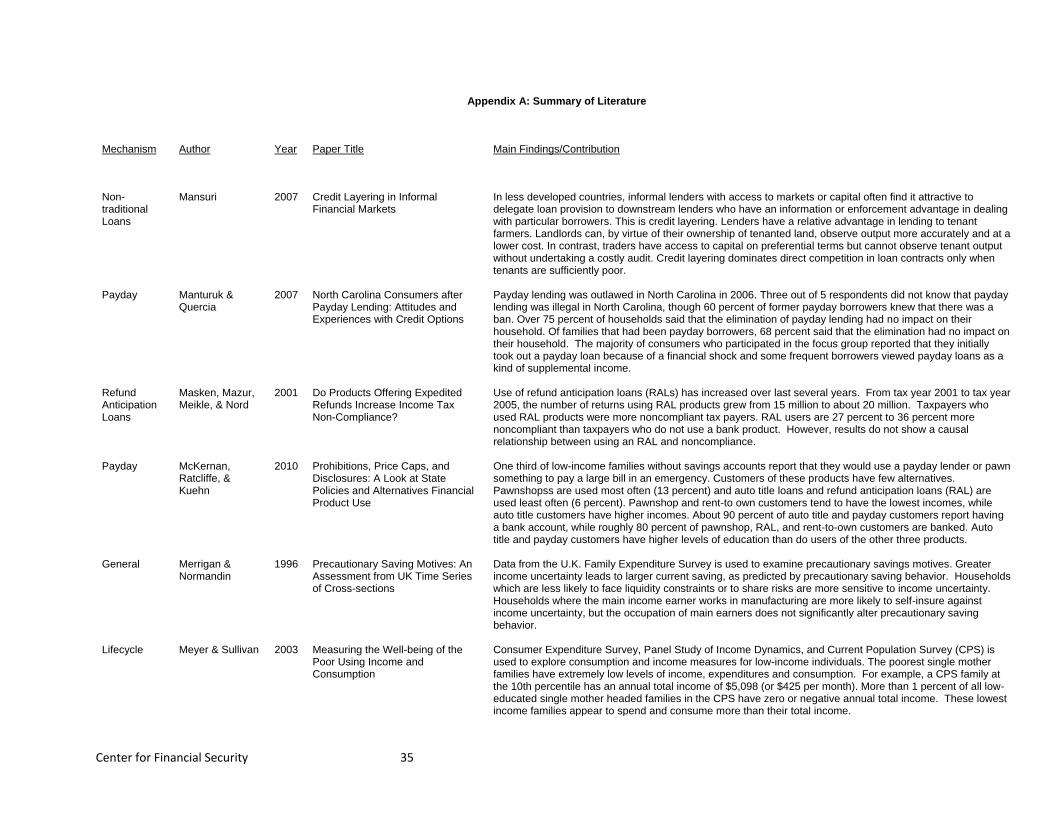
Center for Financial Security 35
Appendix A: Summary of Literature
Mechanism Author Year Paper Title Main Findings/Contribution
Non-traditional Loans
Mansuri 2007 Credit Layering in Informal Financial Markets
In less developed countries, informal lenders with access to markets or capital often find it attractive to delegate loan provision to downstream lenders who have an information or enforcement advantage in dealing with particular borrowers. This is credit layering. Lenders have a relative advantage in lending to tenant farmers. Landlords can, by virtue of their ownership of tenanted land, observe output more accurately and at a lower cost. In contrast, traders have access to capital on preferential terms but cannot observe tenant output without undertaking a costly audit. Credit layering dominates direct competition in loan contracts only when tenants are sufficiently poor.
Payday Manturuk & Quercia
2007 North Carolina Consumers after Payday Lending: Attitudes and Experiences with Credit Options
Payday lending was outlawed in North Carolina in 2006. Three out of 5 respondents did not know that payday lending was illegal in North Carolina, though 60 percent of former payday borrowers knew that there was a ban. Over 75 percent of households said that the elimination of payday lending had no impact on their household. Of families that had been payday borrowers, 68 percent said that the elimination had no impact on their household. The majority of consumers who participated in the focus group reported that they initially took out a payday loan because of a financial shock and some frequent borrowers viewed payday loans as a kind of supplemental income.
Refund Anticipation Loans
Masken, Mazur, Meikle, & Nord
2001 Do Products Offering Expedited Refunds Increase Income Tax Non-Compliance?
Use of refund anticipation loans (RALs) has increased over last several years. From tax year 2001 to tax year 2005, the number of returns using RAL products grew from 15 million to about 20 million. Taxpayers who used RAL products were more noncompliant tax payers. RAL users are 27 percent to 36 percent more noncompliant than taxpayers who do not use a bank product. However, results do not show a causal relationship between using an RAL and noncompliance.
Payday McKernan, Ratcliffe, & Kuehn
2010 Prohibitions, Price Caps, and Disclosures: A Look at State Policies and Alternatives Financial Product Use
One third of low-income families without savings accounts report that they would use a payday lender or pawn something to pay a large bill in an emergency. Customers of these products have few alternatives. Pawnshopss are used most often (13 percent) and auto title loans and refund anticipation loans (RAL) are used least often (6 percent). Pawnshop and rent-to own customers tend to have the lowest incomes, while auto title customers have higher incomes. About 90 percent of auto title and payday customers report having a bank account, while roughly 80 percent of pawnshop, RAL, and rent-to-own customers are banked. Auto title and payday customers have higher levels of education than do users of the other three products.
General Merrigan & Normandin
1996 Precautionary Saving Motives: An Assessment from UK Time Series of Cross-sections
Data from the U.K. Family Expenditure Survey is used to examine precautionary savings motives. Greater income uncertainty leads to larger current saving, as predicted by precautionary saving behavior. Households which are less likely to face liquidity constraints or to share risks are more sensitive to income uncertainty. Households where the main income earner works in manufacturing are more likely to self-insure against income uncertainty, but the occupation of main earners does not significantly alter precautionary saving behavior.
Lifecycle Meyer & Sullivan 2003 Measuring the Well-being of the Poor Using Income and Consumption
Consumer Expenditure Survey, Panel Study of Income Dynamics, and Current Population Survey (CPS) is used to explore consumption and income measures for low-income individuals. The poorest single mother families have extremely low levels of income, expenditures and consumption. For example, a CPS family at the 10th percentile has an annual total income of $5,098 (or $425 per month). More than 1 percent of all low-educated single mother headed families in the CPS have zero or negative annual total income. These lowest income families appear to spend and consume more than their total income.
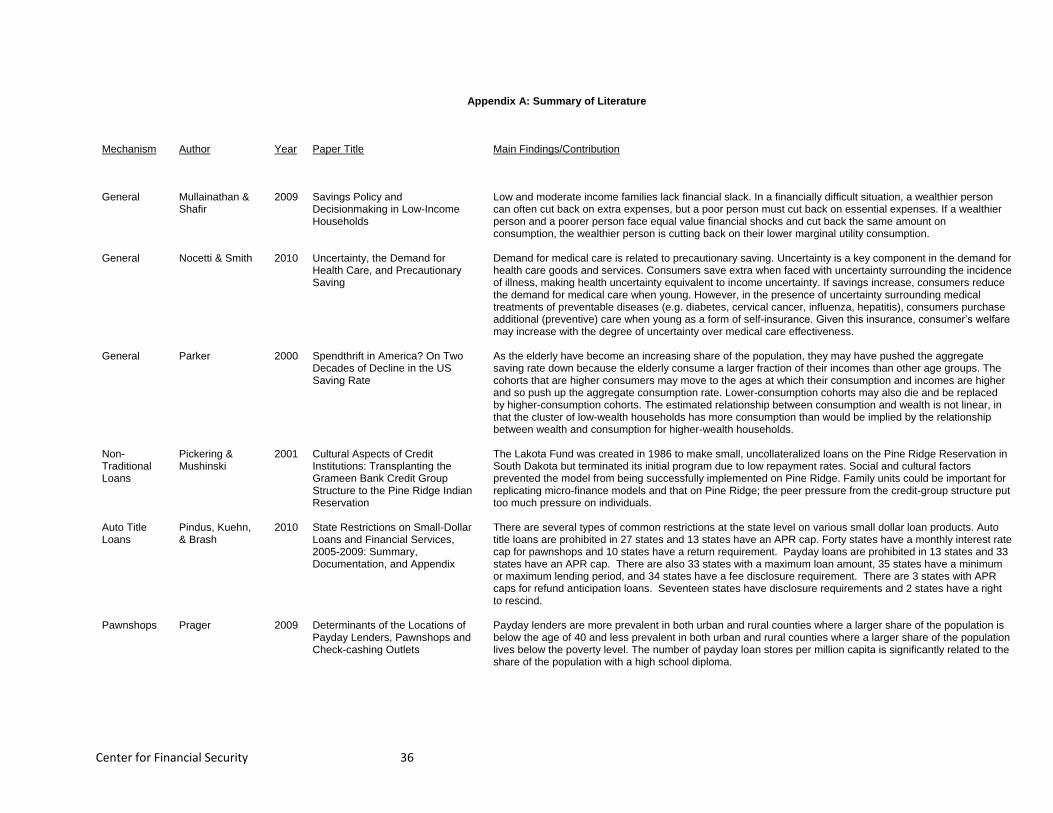
Center for Financial Security 36
Appendix A: Summary of Literature
Mechanism Author Year Paper Title Main Findings/Contribution
General Mullainathan & Shafir
2009 Savings Policy and Decisionmaking in Low-Income Households
Low and moderate income families lack financial slack. In a financially difficult situation, a wealthier person can often cut back on extra expenses, but a poor person must cut back on essential expenses. If a wealthier person and a poorer person face equal value financial shocks and cut back the same amount on consumption, the wealthier person is cutting back on their lower marginal utility consumption.
General Nocetti & Smith 2010 Uncertainty, the Demand for Health Care, and Precautionary Saving
Demand for medical care is related to precautionary saving. Uncertainty is a key component in the demand for health care goods and services. Consumers save extra when faced with uncertainty surrounding the incidence of illness, making health uncertainty equivalent to income uncertainty. If savings increase, consumers reduce the demand for medical care when young. However, in the presence of uncertainty surrounding medical treatments of preventable diseases (e.g. diabetes, cervical cancer, influenza, hepatitis), consumers purchase additional (preventive) care when young as a form of self-insurance. Given this insurance, consumer’s welfare may increase with the degree of uncertainty over medical care effectiveness.
General Parker 2000 Spendthrift in America? On Two Decades of Decline in the US Saving Rate
As the elderly have become an increasing share of the population, they may have pushed the aggregate saving rate down because the elderly consume a larger fraction of their incomes than other age groups. The cohorts that are higher consumers may move to the ages at which their consumption and incomes are higher and so push up the aggregate consumption rate. Lower-consumption cohorts may also die and be replaced by higher-consumption cohorts. The estimated relationship between consumption and wealth is not linear, in that the cluster of low-wealth households has more consumption than would be implied by the relationship between wealth and consumption for higher-wealth households.
Non-Traditional Loans
Pickering & Mushinski
2001 Cultural Aspects of Credit Institutions: Transplanting the Grameen Bank Credit Group Structure to the Pine Ridge Indian Reservation
The Lakota Fund was created in 1986 to make small, uncollateralized loans on the Pine Ridge Reservation in South Dakota but terminated its initial program due to low repayment rates. Social and cultural factors prevented the model from being successfully implemented on Pine Ridge. Family units could be important for replicating micro-finance models and that on Pine Ridge; the peer pressure from the credit-group structure put too much pressure on individuals.
Auto Title Loans
Pindus, Kuehn, & Brash
2010 State Restrictions on Small-Dollar Loans and Financial Services, 2005-2009: Summary, Documentation, and Appendix
There are several types of common restrictions at the state level on various small dollar loan products. Auto title loans are prohibited in 27 states and 13 states have an APR cap. Forty states have a monthly interest rate cap for pawnshops and 10 states have a return requirement. Payday loans are prohibited in 13 states and 33 states have an APR cap. There are also 33 states with a maximum loan amount, 35 states have a minimum or maximum lending period, and 34 states have a fee disclosure requirement. There are 3 states with APR caps for refund anticipation loans. Seventeen states have disclosure requirements and 2 states have a right to rescind.
Pawnshops Prager 2009 Determinants of the Locations of Payday Lenders, Pawnshops and Check-cashing Outlets
Payday lenders are more prevalent in both urban and rural counties where a larger share of the population is below the age of 40 and less prevalent in both urban and rural counties where a larger share of the population lives below the poverty level. The number of payday loan stores per million capita is significantly related to the share of the population with a high school diploma.
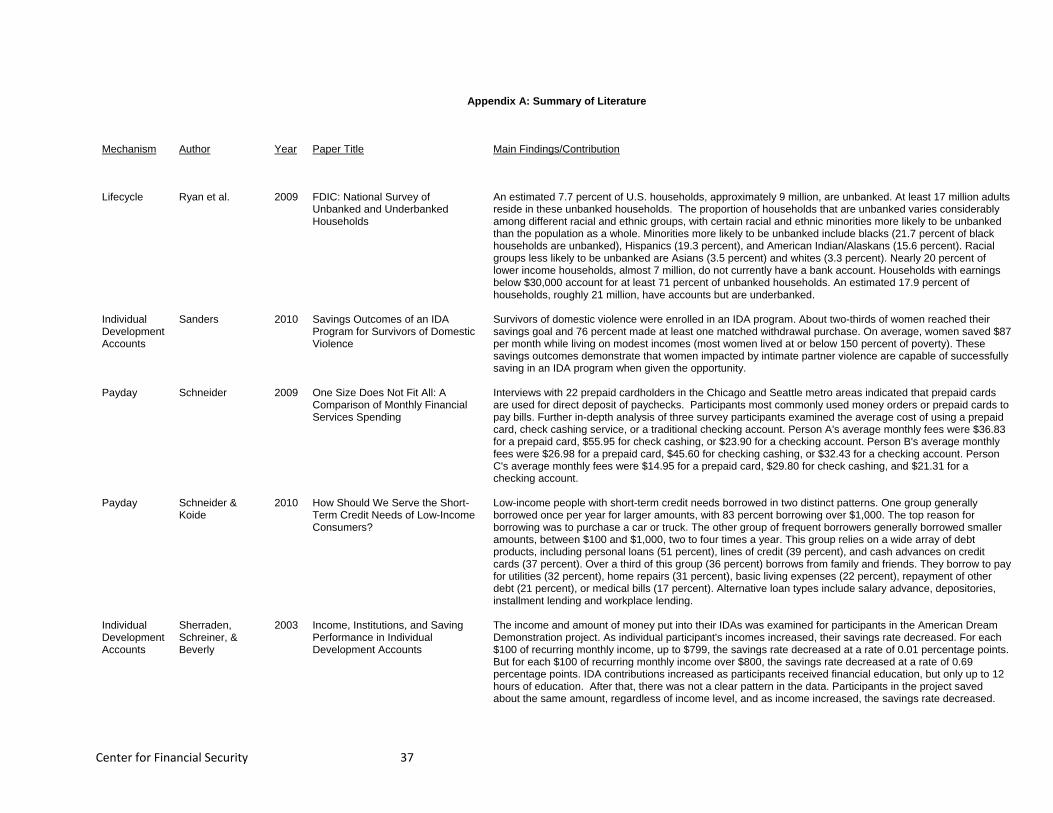
Center for Financial Security 37
Appendix A: Summary of Literature
Mechanism Author Year Paper Title Main Findings/Contribution
Lifecycle Ryan et al. 2009 FDIC: National Survey of Unbanked and Underbanked Households
An estimated 7.7 percent of U.S. households, approximately 9 million, are unbanked. At least 17 million adults reside in these unbanked households. The proportion of households that are unbanked varies considerably among different racial and ethnic groups, with certain racial and ethnic minorities more likely to be unbanked than the population as a whole. Minorities more likely to be unbanked include blacks (21.7 percent of black households are unbanked), Hispanics (19.3 percent), and American Indian/Alaskans (15.6 percent). Racial groups less likely to be unbanked are Asians (3.5 percent) and whites (3.3 percent). Nearly 20 percent of lower income households, almost 7 million, do not currently have a bank account. Households with earnings below $30,000 account for at least 71 percent of unbanked households. An estimated 17.9 percent of households, roughly 21 million, have accounts but are underbanked.
Individual Development Accounts
Sanders 2010 Savings Outcomes of an IDA Program for Survivors of Domestic Violence
Survivors of domestic violence were enrolled in an IDA program. About two-thirds of women reached their savings goal and 76 percent made at least one matched withdrawal purchase. On average, women saved $87 per month while living on modest incomes (most women lived at or below 150 percent of poverty). These savings outcomes demonstrate that women impacted by intimate partner violence are capable of successfully saving in an IDA program when given the opportunity.
Payday Schneider 2009 One Size Does Not Fit All: A Comparison of Monthly Financial Services Spending
Interviews with 22 prepaid cardholders in the Chicago and Seattle metro areas indicated that prepaid cards are used for direct deposit of paychecks. Participants most commonly used money orders or prepaid cards to pay bills. Further in-depth analysis of three survey participants examined the average cost of using a prepaid card, check cashing service, or a traditional checking account. Person A's average monthly fees were $36.83 for a prepaid card, $55.95 for check cashing, or $23.90 for a checking account. Person B's average monthly fees were $26.98 for a prepaid card, $45.60 for checking cashing, or $32.43 for a checking account. Person C's average monthly fees were $14.95 for a prepaid card, $29.80 for check cashing, and $21.31 for a checking account.
Payday Schneider & Koide
2010 How Should We Serve the Short-Term Credit Needs of Low-Income Consumers?
Low-income people with short-term credit needs borrowed in two distinct patterns. One group generally borrowed once per year for larger amounts, with 83 percent borrowing over $1,000. The top reason for borrowing was to purchase a car or truck. The other group of frequent borrowers generally borrowed smaller amounts, between $100 and $1,000, two to four times a year. This group relies on a wide array of debt products, including personal loans (51 percent), lines of credit (39 percent), and cash advances on credit cards (37 percent). Over a third of this group (36 percent) borrows from family and friends. They borrow to pay for utilities (32 percent), home repairs (31 percent), basic living expenses (22 percent), repayment of other debt (21 percent), or medical bills (17 percent). Alternative loan types include salary advance, depositories, installment lending and workplace lending.
Individual Development Accounts
Sherraden, Schreiner, & Beverly
2003 Income, Institutions, and Saving Performance in Individual Development Accounts
The income and amount of money put into their IDAs was examined for participants in the American Dream Demonstration project. As individual participant's incomes increased, their savings rate decreased. For each $100 of recurring monthly income, up to $799, the savings rate decreased at a rate of 0.01 percentage points. But for each $100 of recurring monthly income over $800, the savings rate decreased at a rate of 0.69 percentage points. IDA contributions increased as participants received financial education, but only up to 12 hours of education. After that, there was not a clear pattern in the data. Participants in the project saved about the same amount, regardless of income level, and as income increased, the savings rate decreased.
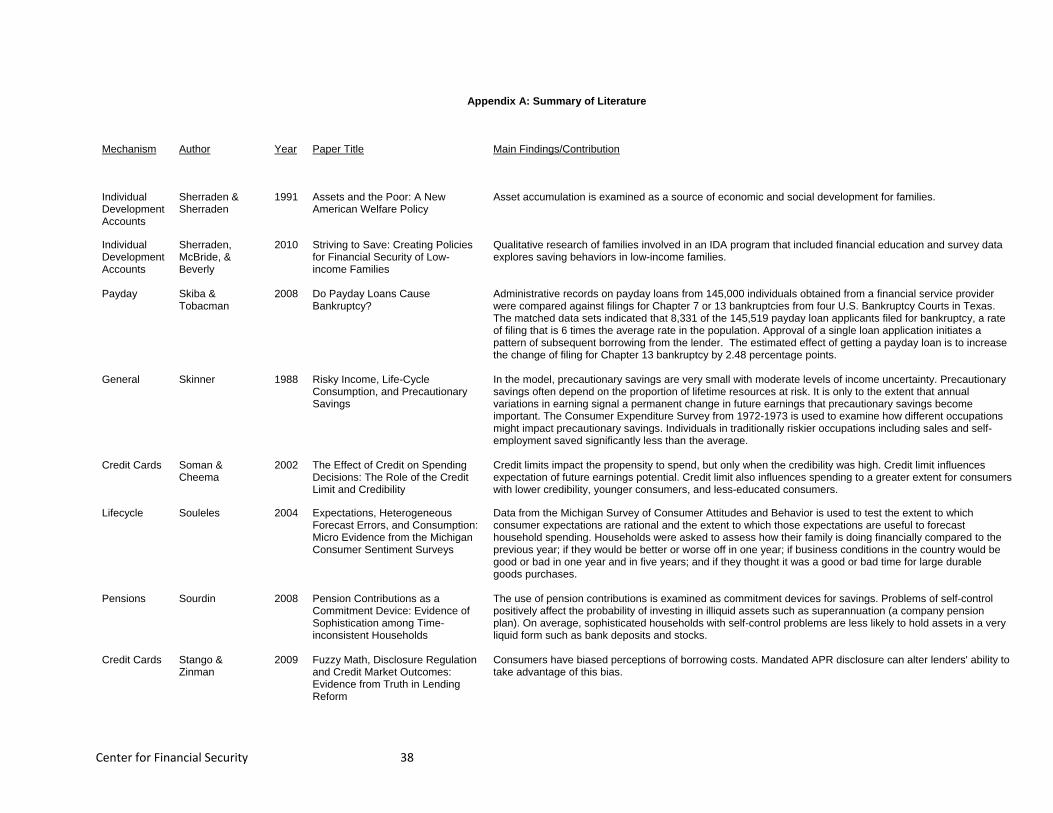
Center for Financial Security 38
Appendix A: Summary of Literature
Mechanism Author Year Paper Title Main Findings/Contribution
Individual Development Accounts
Sherraden & Sherraden
1991 Assets and the Poor: A New American Welfare Policy
Asset accumulation is examined as a source of economic and social development for families.
Individual Development Accounts
Sherraden, McBride, & Beverly
2010 Striving to Save: Creating Policies for Financial Security of Low-income Families
Qualitative research of families involved in an IDA program that included financial education and survey data explores saving behaviors in low-income families.
Payday Skiba & Tobacman
2008 Do Payday Loans Cause Bankruptcy?
Administrative records on payday loans from 145,000 individuals obtained from a financial service provider were compared against filings for Chapter 7 or 13 bankruptcies from four U.S. Bankruptcy Courts in Texas. The matched data sets indicated that 8,331 of the 145,519 payday loan applicants filed for bankruptcy, a rate of filing that is 6 times the average rate in the population. Approval of a single loan application initiates a pattern of subsequent borrowing from the lender. The estimated effect of getting a payday loan is to increase the change of filing for Chapter 13 bankruptcy by 2.48 percentage points.
General Skinner 1988 Risky Income, Life-Cycle Consumption, and Precautionary Savings
In the model, precautionary savings are very small with moderate levels of income uncertainty. Precautionary savings often depend on the proportion of lifetime resources at risk. It is only to the extent that annual variations in earning signal a permanent change in future earnings that precautionary savings become important. The Consumer Expenditure Survey from 1972-1973 is used to examine how different occupations might impact precautionary savings. Individuals in traditionally riskier occupations including sales and self-employment saved significantly less than the average.
Credit Cards Soman & Cheema
2002 The Effect of Credit on Spending Decisions: The Role of the Credit Limit and Credibility
Credit limits impact the propensity to spend, but only when the credibility was high. Credit limit influences expectation of future earnings potential. Credit limit also influences spending to a greater extent for consumers with lower credibility, younger consumers, and less-educated consumers.
Lifecycle Souleles 2004 Expectations, Heterogeneous Forecast Errors, and Consumption: Micro Evidence from the Michigan Consumer Sentiment Surveys
Data from the Michigan Survey of Consumer Attitudes and Behavior is used to test the extent to which consumer expectations are rational and the extent to which those expectations are useful to forecast household spending. Households were asked to assess how their family is doing financially compared to the previous year; if they would be better or worse off in one year; if business conditions in the country would be good or bad in one year and in five years; and if they thought it was a good or bad time for large durable goods purchases.
Pensions Sourdin 2008 Pension Contributions as a Commitment Device: Evidence of Sophistication among Time-inconsistent Households
The use of pension contributions is examined as commitment devices for savings. Problems of self-control positively affect the probability of investing in illiquid assets such as superannuation (a company pension plan). On average, sophisticated households with self-control problems are less likely to hold assets in a very liquid form such as bank deposits and stocks.
Credit Cards Stango & Zinman
2009 Fuzzy Math, Disclosure Regulation and Credit Market Outcomes: Evidence from Truth in Lending Reform
Consumers have biased perceptions of borrowing costs. Mandated APR disclosure can alter lenders' ability to take advantage of this bias.
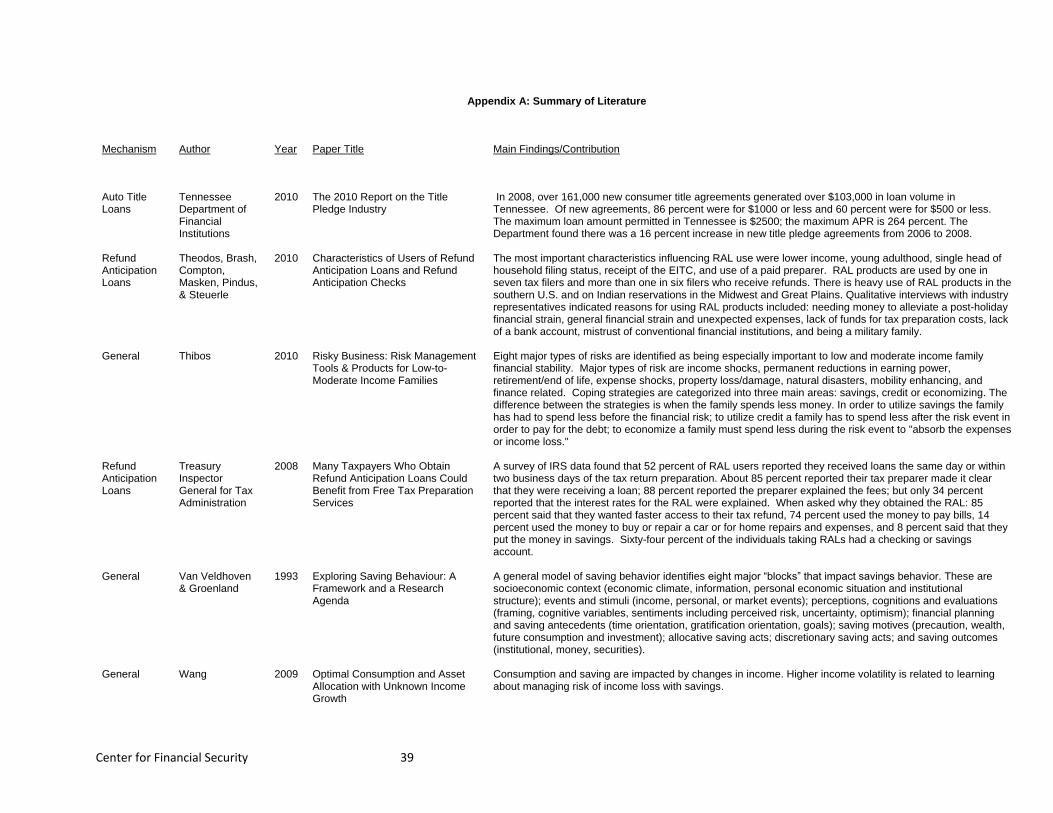
Center for Financial Security 39
Appendix A: Summary of Literature
Mechanism Author Year Paper Title Main Findings/Contribution
Auto Title Loans
Tennessee Department of Financial Institutions
2010 The 2010 Report on the Title Pledge Industry
In 2008, over 161,000 new consumer title agreements generated over $103,000 in loan volume in Tennessee. Of new agreements, 86 percent were for $1000 or less and 60 percent were for $500 or less. The maximum loan amount permitted in Tennessee is $2500; the maximum APR is 264 percent. The Department found there was a 16 percent increase in new title pledge agreements from 2006 to 2008.
Refund Anticipation Loans
Theodos, Brash, Compton, Masken, Pindus, & Steuerle
2010 Characteristics of Users of Refund Anticipation Loans and Refund Anticipation Checks
The most important characteristics influencing RAL use were lower income, young adulthood, single head of household filing status, receipt of the EITC, and use of a paid preparer. RAL products are used by one in seven tax filers and more than one in six filers who receive refunds. There is heavy use of RAL products in the southern U.S. and on Indian reservations in the Midwest and Great Plains. Qualitative interviews with industry representatives indicated reasons for using RAL products included: needing money to alleviate a post-holiday financial strain, general financial strain and unexpected expenses, lack of funds for tax preparation costs, lack of a bank account, mistrust of conventional financial institutions, and being a military family.
General Thibos 2010 Risky Business: Risk Management Tools & Products for Low-to-Moderate Income Families
Eight major types of risks are identified as being especially important to low and moderate income family financial stability. Major types of risk are income shocks, permanent reductions in earning power, retirement/end of life, expense shocks, property loss/damage, natural disasters, mobility enhancing, and finance related. Coping strategies are categorized into three main areas: savings, credit or economizing. The difference between the strategies is when the family spends less money. In order to utilize savings the family has had to spend less before the financial risk; to utilize credit a family has to spend less after the risk event in order to pay for the debt; to economize a family must spend less during the risk event to "absorb the expenses or income loss."
Refund Anticipation Loans
Treasury Inspector General for Tax Administration
2008 Many Taxpayers Who Obtain Refund Anticipation Loans Could Benefit from Free Tax Preparation Services
A survey of IRS data found that 52 percent of RAL users reported they received loans the same day or within two business days of the tax return preparation. About 85 percent reported their tax preparer made it clear that they were receiving a loan; 88 percent reported the preparer explained the fees; but only 34 percent reported that the interest rates for the RAL were explained. When asked why they obtained the RAL: 85 percent said that they wanted faster access to their tax refund, 74 percent used the money to pay bills, 14 percent used the money to buy or repair a car or for home repairs and expenses, and 8 percent said that they put the money in savings. Sixty-four percent of the individuals taking RALs had a checking or savings account.
General Van Veldhoven & Groenland
1993 Exploring Saving Behaviour: A Framework and a Research Agenda
A general model of saving behavior identifies eight major “blocks” that impact savings behavior. These are socioeconomic context (economic climate, information, personal economic situation and institutional structure); events and stimuli (income, personal, or market events); perceptions, cognitions and evaluations (framing, cognitive variables, sentiments including perceived risk, uncertainty, optimism); financial planning and saving antecedents (time orientation, gratification orientation, goals); saving motives (precaution, wealth, future consumption and investment); allocative saving acts; discretionary saving acts; and saving outcomes (institutional, money, securities).
General Wang 2009 Optimal Consumption and Asset Allocation with Unknown Income Growth
Consumption and saving are impacted by changes in income. Higher income volatility is related to learning about managing risk of income loss with savings.
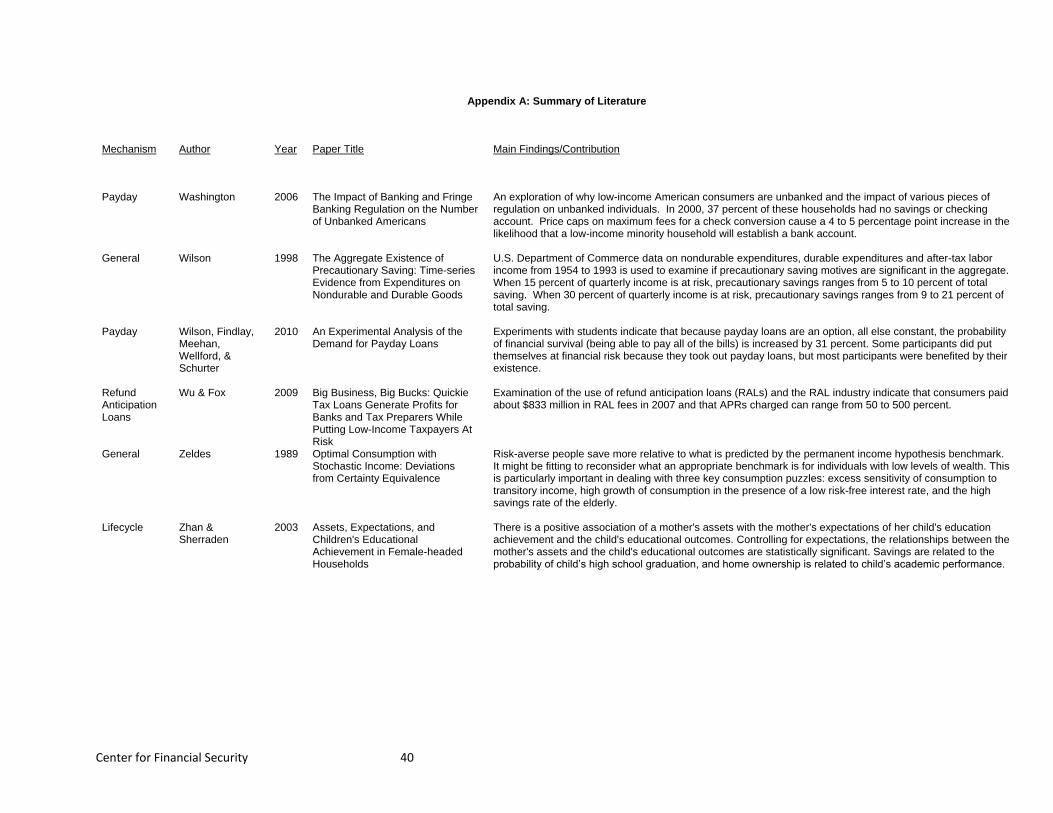
Center for Financial Security 40
Appendix A: Summary of Literature
Mechanism Author Year Paper Title Main Findings/Contribution
Payday Washington 2006 The Impact of Banking and Fringe Banking Regulation on the Number of Unbanked Americans
An exploration of why low-income American consumers are unbanked and the impact of various pieces of regulation on unbanked individuals. In 2000, 37 percent of these households had no savings or checking account. Price caps on maximum fees for a check conversion cause a 4 to 5 percentage point increase in the likelihood that a low-income minority household will establish a bank account.
General Wilson 1998 The Aggregate Existence of Precautionary Saving: Time-series Evidence from Expenditures on Nondurable and Durable Goods
U.S. Department of Commerce data on nondurable expenditures, durable expenditures and after-tax labor income from 1954 to 1993 is used to examine if precautionary saving motives are significant in the aggregate. When 15 percent of quarterly income is at risk, precautionary savings ranges from 5 to 10 percent of total saving. When 30 percent of quarterly income is at risk, precautionary savings ranges from 9 to 21 percent of total saving.
Payday Wilson, Findlay, Meehan, Wellford, & Schurter
2010 An Experimental Analysis of the Demand for Payday Loans
Experiments with students indicate that because payday loans are an option, all else constant, the probability of financial survival (being able to pay all of the bills) is increased by 31 percent. Some participants did put themselves at financial risk because they took out payday loans, but most participants were benefited by their existence.
Refund Anticipation Loans
Wu & Fox 2009 Big Business, Big Bucks: Quickie Tax Loans Generate Profits for Banks and Tax Preparers While Putting Low-Income Taxpayers At Risk
Examination of the use of refund anticipation loans (RALs) and the RAL industry indicate that consumers paid about $833 million in RAL fees in 2007 and that APRs charged can range from 50 to 500 percent.
General Zeldes 1989 Optimal Consumption with Stochastic Income: Deviations from Certainty Equivalence
Risk-averse people save more relative to what is predicted by the permanent income hypothesis benchmark. It might be fitting to reconsider what an appropriate benchmark is for individuals with low levels of wealth. This is particularly important in dealing with three key consumption puzzles: excess sensitivity of consumption to transitory income, high growth of consumption in the presence of a low risk-free interest rate, and the high savings rate of the elderly.
Lifecycle Zhan & Sherraden
2003 Assets, Expectations, and Children's Educational Achievement in Female-headed Households
There is a positive association of a mother's assets with the mother's expectations of her child's education achievement and the child's educational outcomes. Controlling for expectations, the relationships between the mother's assets and the child's educational outcomes are statistically significant. Savings are related to the probability of child’s high school graduation, and home ownership is related to child’s academic performance.