do natural disasters change savings and employment choices?€¦ · do natural disasters change...
TRANSCRIPT


1
Do Natural Disasters Change Savings and Employment Choices?
Evidence from Pakistan
Shaikh M.S.U. Eskander a,, Sam Fankhauser a, Shikha Jha b, Samavia Batool c, Ayesha Qaisrani c
a Grantham Research Institute on Climate Change and the Environment and Centre for Climate Change Economics and Policy, London School of Economics, Houghton Street, London WC2A 2AE, UK.
b Economic Research and Regional Cooperation Department, Asian Development Bank in Manila, Philippines.
c Sustainable Development Policy Institute, Islamabad, Pakistan.
This version: February 2018
Abstract
We investigate the economic response of rural households to natural disasters in Pakistan. In particular, we
explore to what extent households adjust their savings, and income strategies in response to floods. Using
a detailed panel dataset that was assembled concurrently with two major flood events, we find evidence of
an economic response, although adjustments appear to be temporary: affected farmers move away from
agriculture as an immediate response to floods, but they return within a year. Although flood exposure
lowers savings, adjustments in income strategies help farmers to overcome immediate losses and initiate
recovery: flood affected households allocate a significantly higher portion of their post-flood income than
unaffected households to replenishing livestock and seeds. The findings have policy implications in terms
of strategies to develop nonfarm employment opportunities and financing economic migration to reduce
income vulnerability.
JEL Codes: Q54, D13, D14, O13.
Keywords: Employment, Flood, Income, Pakistan, Savings.
Eskander: Grantham Research Institute on Climate Change and the Environment and Centre for Climate
Change Economics and Policy, London School of Economics, Houghton Street, London WC2A 2AE, UK
(email: [email protected]); Fankhauser: Grantham Research Institute on Climate Change and the
Environment and Centre for Climate Change Economics and Policy, London School of Economics, Houghton
Street, London WC2A 2AE, UK (email: [email protected]); Jha: Economic Research and Regional
Cooperation Department, Asian Development Bank in Manila, Philippines ([email protected]). Batool: Sustainable
Development Policy Institute, Islamabad, Pakistan ([email protected]). Qaisrani: Sustainable Development
Policy Institute, Islamabad, Pakistan ([email protected]). The authors thank, without implicating, Giles
Atkinson, Ed Barbier, Arlan Brucal, Kate Gannon, Matthew Kahn, and Akiko Terada-Hagiwara for useful
feedback and suggestions. The work was carried out as part of the Pathways to Resilience in Semi-arid
Economies (PRISE) research project. PRISE is part of the Collaborative Adaptation Research Initiative in Africa
and Asia (CARIAA), supported financially by the UK Department for International Development (DfID) and
the International Development Research Centre (IDRC). An earlier version of the paper is also associated to the
Asian Development Outlook Update 2016 (ADOU 2016) of the Asian Development Bank. The views expressed
in this work are those of the authors and do not necessarily reflect the views and policies of DfID, IDRC, the
Asian Development Bank, its Board of Governors or the governments they represent. Eskander and Fankhauser
also acknowledge the financial support of the Grantham Foundation for the Protection of the Environment,
and the ESRC Centre for Climate Change Economics and Policy. Corresponding author. Email: [email protected], cell: +44(0)78 5600 3276.
2
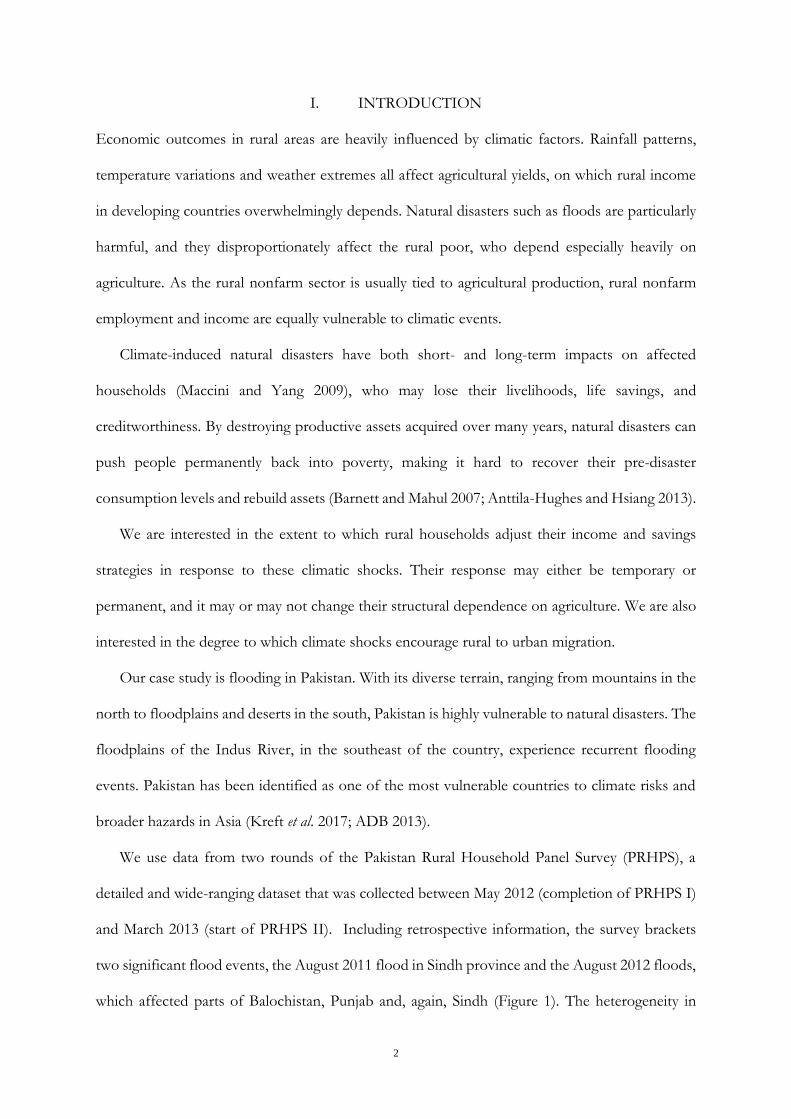
I. INTRODUCTION
Economic outcomes in rural areas are heavily influenced by climatic factors. Rainfall patterns,
temperature variations and weather extremes all affect agricultural yields, on which rural income
in developing countries overwhelmingly depends. Natural disasters such as floods are particularly
harmful, and they disproportionately affect the rural poor, who depend especially heavily on
agriculture. As the rural nonfarm sector is usually tied to agricultural production, rural nonfarm
employment and income are equally vulnerable to climatic events.
Climate-induced natural disasters have both short- and long-term impacts on affected
households (Maccini and Yang 2009), who may lose their livelihoods, life savings, and
creditworthiness. By destroying productive assets acquired over many years, natural disasters can
push people permanently back into poverty, making it hard to recover their pre-disaster
consumption levels and rebuild assets (Barnett and Mahul 2007; Anttila-Hughes and Hsiang 2013).
We are interested in the extent to which rural households adjust their income and savings
strategies in response to these climatic shocks. Their response may either be temporary or
permanent, and it may or may not change their structural dependence on agriculture. We are also
interested in the degree to which climate shocks encourage rural to urban migration.
Our case study is flooding in Pakistan. With its diverse terrain, ranging from mountains in the
north to floodplains and deserts in the south, Pakistan is highly vulnerable to natural disasters. The
floodplains of the Indus River, in the southeast of the country, experience recurrent flooding
events. Pakistan has been identified as one of the most vulnerable countries to climate risks and
broader hazards in Asia (Kreft et al. 2017; ADB 2013).
We use data from two rounds of the Pakistan Rural Household Panel Survey (PRHPS), a
detailed and wide-ranging dataset that was collected between May 2012 (completion of PRHPS I)
and March 2013 (start of PRHPS II). Including retrospective information, the survey brackets
two significant flood events, the August 2011 flood in Sindh province and the August 2012 floods,
which affected parts of Balochistan, Punjab and, again, Sindh (Figure 1). The heterogeneity in

3
flood exposure before and after the two survey rounds allows us to identify the impact of floods
on household decisions.
[Figure 1 about here]
There is by now a substantial literature on the adaptation response of households to climate
shock. We add to the body of knowledge with our focus on Pakistan and by exploring a wider set
of adaptation choices beyond farm-level adjustments (income, savings, migration).
Methodologically, we put forward an original identification strategy that takes advantage of the
fortuitous timing of the PRHPS, which creates a quasi-natural experiment.
Households that are aware of the potential impacts of common weather shocks try to sustain
consumption by adopting low-risk, low-return investment strategies and implementing mitigation
measures such as crop switching, levies to prevent flooding and supplementary irrigation to offset
lack of rainfall (Barnett and Mahul 2007). Beyond farm-level adaptation, households adopt coping
and adaptation strategies such as increased labor supply and land transactions (sell land or rent for
use) — within the same area — or sale of productive assets and temporary migration — to another
area (e.g., Duflo 2003; Jensen 2000; Banerjee 2007).
Responses to disasters may result in farmers either moving away from farm to nonfarm
employment or intensifying agricultural activities to compensate for the lost income. Eskander and
Barbier (2016) found that disaster-affected rural households intensify agricultural activities by
increasing their operational farm size through increased transactions in the land rental market. The
welfare effects of increases in agricultural and nonagricultural labor supply has also been studied
by Mueller and Quisumbing (2011).
While disaster-affected people may decide to migrate to less disaster-prone regions (e.g.,
Boustan, Kahn, and Rhode 2012; Hornbeck 2012), such migration is often temporary and
conditional on a household’s ability to find alternative employment while facing liquidity

4
constraints (Bryan, Chowdhury, and Mobarak 2014; Cattaneo and Peri 2016). Bohra-Mishra,
Oppenheimer, and Hsiang (2014) analyzed province-to-province movement of more than 7,000
households in Indonesia over 15 years to find that while there can be a nonlinear permanent
migration response to climatic variations, the evidence of permanent migration is minimal among
disaster-affected households. In Bangladesh, Penning-Rowsell, Sultana, and Thompson (2013)
found that rural people are less likely to migrate permanently, even in the face of extreme disasters,
although they may temporarily move to safer places. Mueller, Gray, and Kosec (2014) found that
floods have a modest to insignificant impact on long-term migration in Pakistan.
Against this backdrop, this paper investigates the impact of floods on economic behavior. It
explores two questions in particular: (i) Do flood-affected farmers move away from agriculture for
income in comparison to unaffected households? and (ii) Do flood-affected farmers have a lower
increase in their savings than the unaffected households?
Our empirical analysis suggests that although farmers in Pakistan immediately move away from
agriculture, they come back within a year of flood exposure. In addition, while both the 2011 and
2012 floods result in lower savings, flood-affected households allocate significantly higher
proportion of their post-flood incomes than the unaffected households to replenishing livestock
and seeds. Therefore, the observed changes in income strategies do not necessarily imply a
structural change; rather, they reflect flood-affected household’s short-term coping with the harms
of disaster.
The content of the remainder of this paper is as follows. Section II provides the background
of exposure to floods in Pakistan and develops a simple model to capture its income effects for
an agricultural economy. Section III describes data and variables used for empirical analysis in this
paper. Section IV specifies the empirical model. Section V reports and discusses the regression
results. Section VI summarizes the discussion and concludes.
5
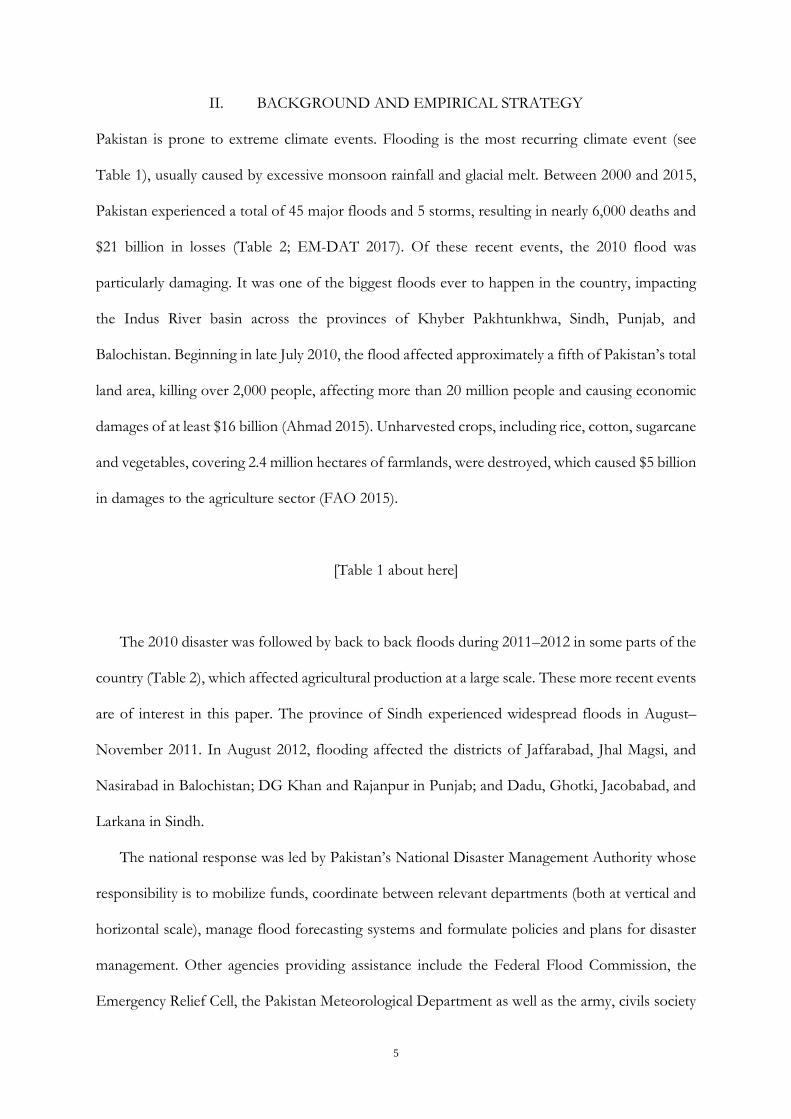
II. BACKGROUND AND EMPIRICAL STRATEGY
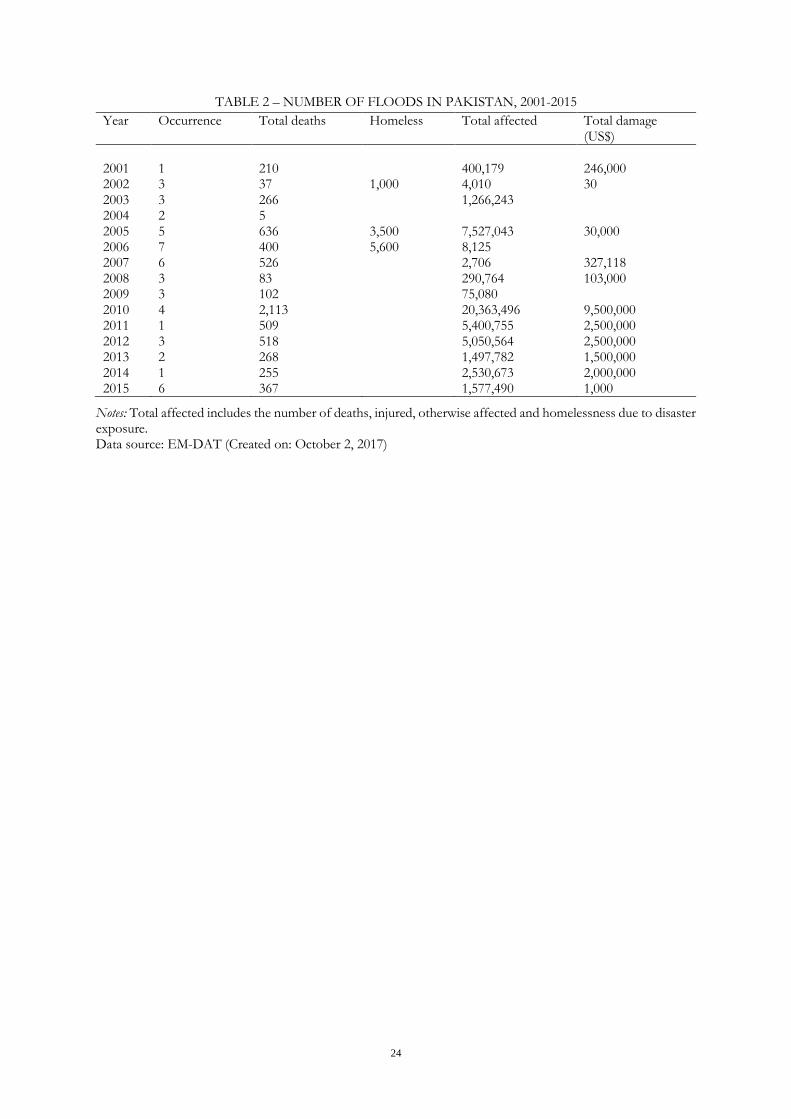
Pakistan is prone to extreme climate events. Flooding is the most recurring climate event (see
Table 1), usually caused by excessive monsoon rainfall and glacial melt. Between 2000 and 2015,
Pakistan experienced a total of 45 major floods and 5 storms, resulting in nearly 6,000 deaths and
$21 billion in losses (Table 2; EM-DAT 2017). Of these recent events, the 2010 flood was
particularly damaging. It was one of the biggest floods ever to happen in the country, impacting
the Indus River basin across the provinces of Khyber Pakhtunkhwa, Sindh, Punjab, and
Balochistan. Beginning in late July 2010, the flood affected approximately a fifth of Pakistan’s total
land area, killing over 2,000 people, affecting more than 20 million people and causing economic
damages of at least $16 billion (Ahmad 2015). Unharvested crops, including rice, cotton, sugarcane
and vegetables, covering 2.4 million hectares of farmlands, were destroyed, which caused $5 billion
in damages to the agriculture sector (FAO 2015).
[Table 1 about here]
The 2010 disaster was followed by back to back floods during 2011–2012 in some parts of the
country (Table 2), which affected agricultural production at a large scale. These more recent events
are of interest in this paper. The province of Sindh experienced widespread floods in August–
November 2011. In August 2012, flooding affected the districts of Jaffarabad, Jhal Magsi, and
Nasirabad in Balochistan; DG Khan and Rajanpur in Punjab; and Dadu, Ghotki, Jacobabad, and
Larkana in Sindh.
The national response was led by Pakistan’s National Disaster Management Authority whose
responsibility is to mobilize funds, coordinate between relevant departments (both at vertical and
horizontal scale), manage flood forecasting systems and formulate policies and plans for disaster
management. Other agencies providing assistance include the Federal Flood Commission, the
Emergency Relief Cell, the Pakistan Meteorological Department as well as the army, civils society

6
organizations and international NGOs. At a more local scale, irrigation departments, district
disaster management authorities, agriculture department, district coordination office played key
roles in flood warning and evacuation services.
Despite this concerted response, the human and economic cost of the floods was substantial.
The 2011 and 2012 floods each affected about 5 million people and caused around 500 deaths
(EM-DAT 2017).
[Table 2 about here]
We use household-level data to study the economic response of rural households to the 2011
and 2012 flood events. Column 1 of Table 3 confirms that all the surveyed households experience
at least some economic impacts, including a decreased dependence on farm income.
However, establishing the exact effects of disaster exposure requires random assignment of
treatment and control groups. Table 3 distinguishes 4 groups of households with different
exogenous exposure to the floods of 2011 and 2012. Treatment groups 1 and 2 include 190 and
101 households from the districts affected by the floods of 2011 and 2012 only, respectively.
Treatment group 3 includes 191 surveyed households from the districts affected by both floods.
Finally, control group 4 includes 1,455 households that are unaffected by either flood.
[Table 3 about here]
All four groups of households experienced a decreased dependence on farm income between
the two PRHPS rounds. However, in comparison to the control group, groups 1 and 3 experience
lower decrease, whereas the corresponding decrease is higher for group 2. That is, unconditional
decline in the dependence on farm income is higher for the households affected by only 2012
flood, but lower for other treatment groups, in comparison to the control group. Looking in to

7
the absolute changes in farm and nonfarm incomes offers further insights: while all 4 groups
experience increased nonfarm incomes, farm income increases for groups 1 and 4 but decreases
for groups 2 and 3. More precisely, in comparison to the control group, all the treatment groups
have lower increase in their nonfarm incomes; whereas treatment groups 2 and 3 experience
decreases in their farm incomes and treatment group 1 has higher increase in farm income.
Moreover, all three treatment groups have lower investments in livestock and seed; whereas only
the treatment group 1 has higher cash savings than the control group 4.
Table 3 thus suggests that households with different exposure to the 2011 and 2012 floods
experienced different levels of change in farm and nonfarm incomes and made different
adjustments in savings. However, these unconditional measures of flood-induced variations
require further investigation.
We evaluate whether exposure to floods predicts variations in changes in the sources of income
and savings behavior using a difference-in-differences approach. The difference-in-differences,
DD, of the effect of treatment on the dependent variable of interest is
(1) 𝐷𝐷 = 𝛥𝑎 − 𝛥𝑢,
where the first term, 𝛥𝑎 , gives the change in mean of the outcome variable for the treatment group
from the pre-treatment period to post-treatment period. The second term, 𝛥𝑢, gives the analogous
measure for the control group. The difference, 𝐷𝐷, indicates the effect of the treatment relative
to the control.
Using the DD framework in equation (1), we investigate two research questions:
i) Do flood-affected farmers move away from agriculture for income in comparison to
unaffected households?
ii) Do flood-affected farmers have a lower increase in their savings than the unaffected
households?

8
Based on the results from Table 3, we hypothesize that exposure to floods will result in farmers
moving away from agriculture, and reducing their cash savings to replenish livestock and seeds.
However, an in-depth investigation into the sources of such changes requires disentangling the
effects on farm and nonfarm incomes separately. Although we may assume that the effects of
disasters are more profound on farm than nonfarm income, changes in farm dependence may arise
from three alternative situations:
1. Increased dependence on agriculture, i.e., 𝐷𝐷 > 0, if either [𝛥𝑎 , 𝛥𝑢 ≥ 0, 𝛥𝑎 > 𝛥𝑢] or
[𝛥𝑎, 𝛥𝑢 ≤ 0, |𝛥𝑎| < |𝛥𝑢|].
2. Decreased dependence on agriculture, i.e., 𝐷𝐷 < 0, if either [𝛥𝑎 , 𝛥𝑢 ≥ 0, 𝛥𝑎 < 𝛥𝑢] or
[𝛥𝑎, 𝛥𝑢 ≤ 0, |𝛥𝑎| > |𝛥𝑢|].
3. Unchanged dependence on agriculture, 𝐷𝐷 = 0, if either [𝛥𝑎, 𝛥𝑢 ≥ 0, 𝛥𝑎 = 𝛥𝑢] or
[𝛥𝑎, 𝛥𝑢 ≤ 0, |𝛥𝑎| = |𝛥𝑢|].
Identifying the situation for our case study of Pakistan therefore requires empirical
investigation. We empirically investigate the direction of change in the dependence on agriculture,
which constitutes the largest sector of Pakistan’s economy by contributing about 24% of GDP
and employing around half of the labor force (PBS 2016), due to exposure to floods.
III. DATA AND VARIABLES
We use two rounds of the USAID-funded Pakistan Rural Household Panel Survey (PRHPS)
dataset, which were conducted in the districts affected by the 2010 flood. The sample is
representative of the rural areas of three provinces: Punjab, Sindh, and Khyber Pakhtunkhwa. The
first round of the survey, PRHPS I, was completed in April 2012, covering a total of 2,090
households in 76 primary sampling units in the rural areas of these three provinces. The second
round, PRHPS II, was conducted from April to May 2013, which re-interviewed 2,002 of the 2,090
households surveyed in PRHPS I. Each round of the survey covers data from the previous

9
production year (i.e., 2011 and 2012, respectively), on many topics such as sources of income,
consumption patterns, time use, assets and savings, loans and credit, education, migration,
economic shocks, participation in social safety nets, and household aspirations.
Table 4 describes and summarizes the outcome variables that we use in the empirical analysis.
The PRHPS dataset contains information on farm and nonfarm incomes, which form our outcome
variable: proportion of farm income. Table 3 shows that the average farm income increased slightly
from $3,555 to $3,640 between 2011 and 2012; whereas nonfarm income increased considerably
from $17 to $2,254 over the same period.1 As a result, the percentage share of farm income goes
down from almost 100% to only 59%. Moreover, cash savings fall from $376 to $352; spending
on the purchase of new livestock increases from $57 to $105.5; and spending on the purchase of
seed increases from $101 to $1,868.
[Table 4 about here]
Next, although there is some evidence of flood-induced variations in outcome variables of
interest (Table 3), these difference-in-differences estimates are unconditional, and require
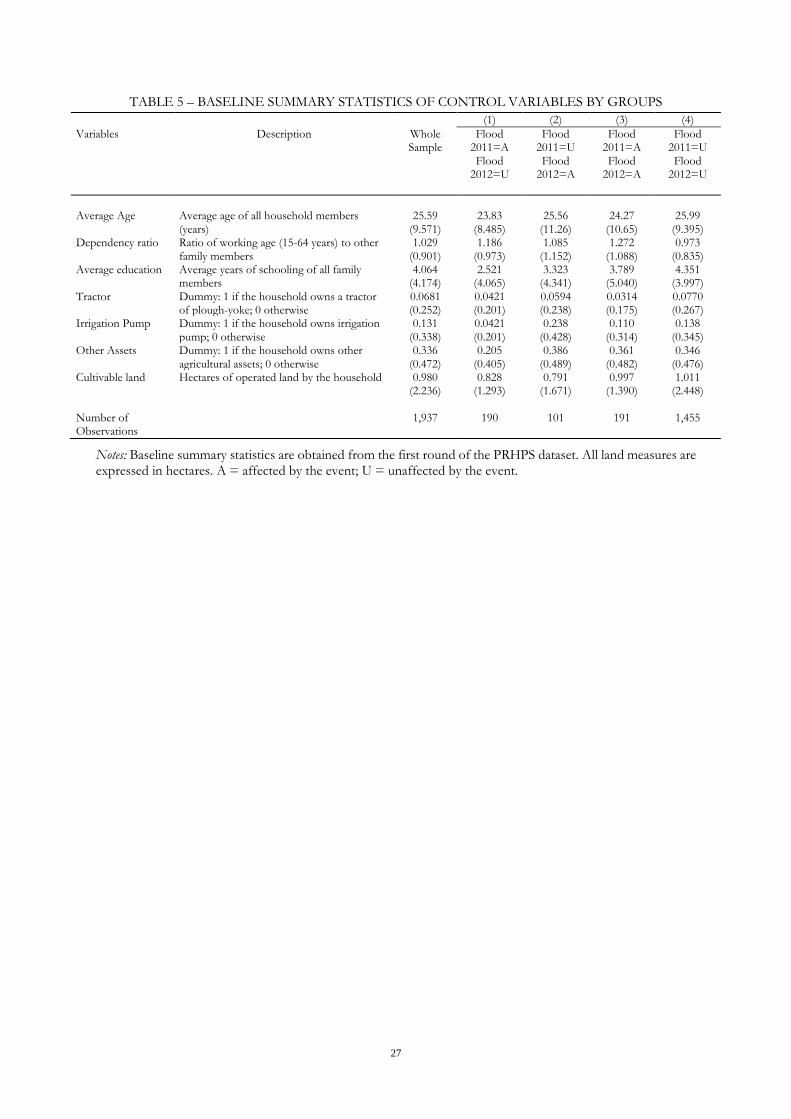
controlling for household and farm level attributes. Table 5 reports the baseline summary statistics
of the explanatory variables. Data from PRHPS I show that, on average, household members are
26 years old with 4 years of schooling. The dependency ratio is just over 1, implying almost one-
to-one ratio of working (aged 15–65 years) and dependent aged members. The average operational
farm size is 1 hectare. Among the households, 7% own a tractor or plow–yoke (i.e., the means of
cultivation), whereas 13% own an irrigation pump and 34% own other agricultural assets. When
we disaggregate these statistics by exposure to the floods of 2011 and 2012, we observe that there
are significant differences between the corresponding treatment and control groups in terms of
1 All incomes are expressed in US dollars, using an exchange rate that reflects purchasing power parity: the PPP exchange rates were Pakistani Rupees 25.25 and 24.35 for $1 on 12/31/2012 and 12/31/2011 respectively. These were used to convert and normalize all monetary figures.

10
their household and farm level attributes, which, therefore needs to be controlled for in the
following empirical investigation.
[Table 5 about here]
IV. EMPIRICAL SPECIFICATION
We evaluate whether variations in flood exposure predict income and savings changes among the
agricultural households from Pakistan. We first hypothesize that households may exhibit
accelerated movement from the farm to the nonfarm sector for income in response to flood
exposure. To explore this, we estimate the difference-in-differences model in equation (1)
employing the following random effect model that captures the structural change for household 𝑖
in time 𝑡 due to flood exposure:
(2) 𝑎𝑖𝑡 = 𝑔(𝐷𝑖𝑡, 𝑥𝑖 , 𝜖𝑖𝑡),
where 𝑎𝑖𝑡 denotes farm dependence in time 𝑡, which is estimated as farm income as proportion
of total income of household 𝑖 in time 𝑡. Table 3 shows that flood-affected households have a
higher change in their dependence on agriculture than the unaffected households.
Next, we evaluate the marginal propensity to save to investigate whether the income and
employment changes due to disaster exposure have been transmitted to household’s savings
behavior according to:
(3) 𝑠𝑖𝑡 = ℎ(�̂�𝑖𝑡, 𝜀𝑖𝑡),
where 𝑠𝑖𝑡 is savings, measured separately by annual cash savings, investment in new livestock, and
investment in seed stock, in time 𝑡. Assuming that any adjustment farmers make to their income
strategies are intended to overcome the harms of disaster, we can use the consequent changes in

11
their savings behavior as a measure of success of their coping strategies. Since income determines
a household’s potential savings behavior, we expect to observe similar patterns of change in
income strategies and savings behavior.
Spatial data on exposure to natural disasters come from the EM-DAT database. The 2011
flood that took place in August 2011 affected 4 PRHPS districts, whereas the 2012 flood that took
place in August 2012 between PRHPS I and II affected 3 out of 19 surveyed districts (Figure 2).
Table 3 reports that 20% and 15% of surveyed households were affected by 2011 and 2012 floods,
respectively.
We therefore include two dummy variables defining disaster exposure in the vector 𝐷𝑖 : (i)
Flood 2011 defined as 1 for the districts affected by the flood of 2011 (Dadu, Jacobabad,
Hyderabad, and Sanghar districts in Sindh province) and 0 otherwise, and (ii) Flood 2012 defined
as 1 for the districts affected by the flood of 2012 (DG Khan in Punjab province, and Dadu and
Jacobabad in Sindh province) and 0 otherwise.
[Figure 2 about here]
Our empirical approaches to estimating equations (2) and (3) involve specifying the
components of the vectors 𝐷𝑖𝑡 and 𝑥𝑖 . Vector 𝐷𝑖𝑡 includes our variables of interest defining the
flood exposure of a household between the survey years. In addition, vector 𝑥𝑖 includes the base
year household- and farm-level characteristics affecting farm and nonfarm incomes, and savings
opportunities. A household is defined to include the number of people that dine-in together from
the same pot. Household characteristics include the average age and average years of schooling of
all the household members, and dependency ratio. Farm-level characteristics include ownership of
a tractor (1 if the household owns a tractor or a plow–yoke, 0 if not), an irrigation pump (1 if the
household owns an irrigation pump, 0 if not), and other agricultural assets (1 if the household

12
owns other agricultural assets, 0 if not), as well as operational farm size (hectares of owned–
operated and rented–operated land).
V. RESULTS AND DISCUSSION
V.A Changes in Income Composition
Table 6 reports the regression results based on equation (2) for flood exposure in Pakistan.
Although we report the parameter estimates of control variables, we confine our discussion of
results only to the parameters of interest.2 Control variables are jointly statistically significant; and
except for the average age of the household members and ownership of tractors, all other control
variables are individually statistically significant, and exhibit expected directions of relationship
with the corresponding dependent variable.
[Table 6 about here]
Column 1 reports results from our main specification (2), which are then supported by
columns 2 and 3 where we separately look into the effects of flood exposure on farm and nonfarm
incomes. Key parameters of interest, i.e., the coefficients of dummies for 2011 and 2012 floods,
and their interaction, are either individually or jointly statistically significant (p<0.10).
The households affected by the 2012 flood saw a11.3% decrease in the proportion of their
income coming from agriculture, based on a reduction in farm income of $863 and increase in
nonfarm income of $80. We find the opposite effect for exposure to the 2011 flood: 2011 flood
victims have a 8.5% higher dependence on agriculture; with decreases in both farm and nonfarm
2 Estimates of our parameters of interest are similar without the control variables, therefore supporting our claim that the change in Pakistani households’ income strategy and savings behavior comes from disaster exposure.

13
incomes of $1,911 and $512, respectively.3 Two additional observations are important. First, farm
incomes in 2011 do not significantly differ between affected and unaffected households, perhaps
because everybody was still recovering from the 2010 flood when PRHPS data were collected.
Second, displaced households mostly depend on in-kind support for their sustenance, with limited
or no livelihood activities of their own (Najam-u-Din 2010). The economic inactivity of displaced
households implies that any variation in income composition between affected and unaffected
households is the result of changes in either the farm or, especially, nonfarm income, of unaffected
households.
This finding signifies the importance of the development of nonfarm enterprises in rural
Pakistan not only as an intermittent employment opportunity but also to diversify income in those
regions. However, it should be noted that since the rural nonfarm sector is also predominantly
agro-based (for example, wholesale and retail, transport and food processing), post-disaster
management of agriculture should go hand in hand with developing alternative livelihoods. It will
also be necessary to keep those opportunities accessible for the rural people with relatively lower
educational achievements for maximum impact. In addition to taking refuge during flood or other
natural disasters, locally available nonfarm employment opportunities can enable farmers and rural
households to earn supplementary incomes during regular lean seasons.
Second, although Pakistani households change their income strategy in response to flood
exposure, such changes are short-lived and do not necessarily imply a structural change. This is
evident from our findings that the dependence on agriculture differs by flood year: while 2011
flood victims have decreased nonfarm incomes, it has increased for 2012 flood victims.
3 The empirical conjecture that flood exposure increases soil depth of agricultural land in the following cropping season can potentially explain these opposite directions of change in farm dependence.

14
V.B Changes in Savings Behavior
We next investigate whether savings are also affected by flood exposure of the Pakistani farmers
according to specification (2) using three different modes of savings: cash savings, livestock
restocking and seed stocks. Table 3 further confirms the existence of unconditional differences in
changes in savings behavior of the flood-affected Pakistan households.
While any adjustment farmers make to their income strategies are intended to overcome the
harms of disaster, consequent changes in savings behavior indicate their future planning. Results
reported in Table 7 confirm the harmful effects of flood on savings: the cash savings of households
affected by the floods of 2011 and 2012 are $124 and $239 lower, respectively; their seed stocks
are $957 and $34 lower. That is, floods not only affect farmer’s immediate incomes, they also affect
their ability to overcome the losses by reducing their savings.
[Table 7 about here]
We further investigate this implication by estimating the marginal propensity to save according
to specification (3) using three different modes of savings. Two stage least squares regression
results are reported in Table 8. Results show that marginal propensities to save with respect to
farm income are statistically significantly estimated at 5.3%, 0.6% and 4.2% for cash savings, new
livestock and seed stock, respectively; whereas the corresponding figures with respect to nonfarm
income are 27.6% (significant), 1.1% (insignificant) and -21.2% (insignificant). Although
increments in both farm and nonfarm incomes significantly stimulate cash savings, the impact is
higher for the case of nonfarm income earners. On the other hand, only the increase in farm
income results in significantly higher investments in new livestock and seed stock.
[Table 8 about here]

15
Our results in Tables 7 and 8 also imply that while the wealthier (poorer) farmers will have
higher (lower) chances of higher future farm incomes, together with adverse income and savings
effects of flood exposure, higher propensities to invest in livestock and seeds may potentially
happen at the expense of lower allocations of income on other necessary consumption goods,
which might accrue longer-term welfare adversity within the affected household.4 In the wake of
disasters, such as floods, farmers often resort to distress coping mechanisms for their sustenance
when their regular means of livelihood are disrupted. A detailed Livelihood Recovery Appraisal of
flood affected households in Sindh, Punjab and Balochistan reveals that many households who
previously relied on agriculture for their livelihoods employed coping strategies such as distress
selling of household assets, taking loans and taking children out of school to sustain themselves
(Food Security Cluster Pakistan, 2013). Therefore, although the displacement period is usually
short-lived, they may entail further longer-term consequences on the displaced people, especially
the children and women.
V.C Migration Response to Flood Exposure
The short-lived nature of the decrease in the dependence on agriculture is consistent with the
existing literature on migration response to climatic change and climatic extremes in Pakistan
showing that although rising temperatures increase rural–urban migration, and thereby lower the
dependence on agriculture, floods do not significantly influence long-term migration in Pakistan
(Mueller, Gray, and Kosec 2014). Although liquidity constraints may be responsible for their
reluctance or inability to migrate permanently (e.g., Bryan, Chowdhury, and Mobarak 2014;
Cattaneo and Peri 2016), guaranteed availability of humanitarian aid in response to climatic
extremes such as floods and storms may also be responsible for slowing down the migration
response to floods (e.g., Looney 2012; Strömberg 2007) and also for facilitating farmers’ return to
4 However, this paper does not address the income and expenditure allocation issues, and leave this as a potential
future investigation.

16
their ancestral location. On the contrary, but almost equal, the estimated magnitude of the effects
of the 2011 and 2012 floods may also imply that such a return to ancestry happens within a year
of flood exposure.
[Figure 3 about here]
Using data from PRHPS rounds 1 and 2, Figure 3 shows monthly average number of migrants
during March 2011 to February 2012 and April 2012 to March 2013. Although migration took
place especially during the months of May to September, people ultimately come back to their
origin as the average number of migrants are very low over other months. These observations are
consistent with Najam-u-Din (2010) who observed the patterns of return of the displaced people
after the 2010 floods and noted that flood-displaced people tend to return in a relatively brief time,
even within a month’s time. While many return voluntarily, government policies may also be
responsible for forcing people to evacuate the temporary settlements and return to their areas of
ancestry (Brickle and Thomas 2014). For instance, government may cut down its support in
provision of facilities to the Internally Displaced Persons settlements, thus pushing people to move
back into their places of origin.
We investigate this conjecture using the structure outlined by equations (2) and (3) and using
“% of person months of members temporarily migrating outside home in last 12 months” as the dependent
variable. Tables 9 and 10 report the results that are parallel to those reported in Tables 6 and 7.
We find that flood-affected Pakistani farmers indeed have lower rates of migration; however, those
who were affected by both the floods of 2011 and 2012 have higher rates of migration (Table 9).
[Table 9 about here]

17
The results are mostly consistent with the changes in income composition reported in Table
6, suggesting that affected farmers do not migrate permanently. As Figure 3 shows, they tend to
come back to their ancestry within a year of flood-induced displacement. This reiterates the
findings of Brickle and Thomas (2014) who also concluded that flood-displaced people return to
their areas of origin within a year. However, those who migrate, at least temporarily, might even
have higher agricultural incomes. Two stage regression results investigating the income effects of
flood-induced migration, as reported in Table 10, show that families with higher temporary
migration have higher proportion of farm income and this higher dependence on agriculture
comes from farming intensification as shown in Table 6. It has been observed that post floods,
farmers intensify their agricultural activities to make up for the lost income from farming activities,
and thus there may be an increase in the agricultural incomes (Food Security Cluster 2013).
Furthermore, they may even change their cropping patterns to enhance agricultural returns. For
instance, it was observed that farmers who have been affected only once by floods are more likely
to use flood-resistant crops in the following cropping season as compared to those who have been
affected twice or more times. Hence, those who were affected in the floods of 2011 may have
invested more in agriculture in 2012.
[Table 10 about here]
Farmers generally tend to resume agricultural activities in their regions of origin after floods.
However, as floods become more frequent, many will not have the means to continue farming on
silted land and invest in seeds, fertilizers, etc. to attain agricultural profits (Arai 2012). With floods
recurring more often, many farming households may shift towards nonfarming livelihood activities
or diversify their sources of income (Food Security Cluster 2013). Because of limited alternative
economic opportunities in rural areas, many frequent flood victims may migrate in search of
nonfarm income sources (Salik et. al. 2017). Therefore, results in Table 10 further support our

18
findings in Table 9 and, in turn, provide important supports to our main findings that are reported
in Tables 6 and 7.
VI. CONCLUSIONS
This paper explores to what extent rural households in Pakistan adjust their income strategies and
savings behavior in response to floods. Although Pakistani farmers move away from agriculture
as an immediate response to disasters, they return to agriculture within a year. The observed
changes in employment strategies are not permanent and in fact they are accompanied by increased
investments in livestock and seed and decreased cash savings. The fact that Pakistani farmers
allocate a higher proportion of their incomes on replenishing livestock and seeds shows a
determination to revive their post-disaster agricultural activities. While repeated flood victims have
higher rates of temporary migration, even these households intensify their farming activities. Thus,
while flood exposure changes the income composition of Pakistani farmers, such changes are only
short-term coping strategies and do not imply any longer term structural change.
Our empirical results carry important implications for developing countries with frequent
exposure to natural disasters. Although forward-looking agents usually save to smooth their
consumption during disasters, the high frequency of climate shocks adversely affects the
accumulation of cash savings between successive events. These harmful effects are further
heightened in the case of low-income countries such as Pakistan. Farmers often set their primary
focus on meeting immediate subsistence needs while experiencing frequent disaster events and,
therefore, may not be able to save to combat any future risk of disasters.
This puts a premium on support mechanisms and social safety nets (Davies et al. 2009). In
Pakistan, international aid agencies have piloted with some success a cash-for-work schemes aimed
at rebuilding of infrastructure as well as providing employment and help reassembling the village
economy (Arai 2012; ILO 2010). In contrast, insurance programs are still scarce in the rural areas

19
of low-income countries and where they exist they can be overwhelmed when a large number of
people is simultaneously affected.
However, ultimately vulnerability will have to be reduced permanently through investment in
adaptive capacity and a dispassionate look at the vulnerability profile of current economic
practices. The recent floods have revealed severe policy and implementation issues regarding flood
risk management in Pakistan, which have compounded the effects on physical and human capital.
Pakistan’s development roadmap, Vision 2025, states that efforts will be made to revitalize the
nonfarm sector in rural areas by initiating job-schemes and providing business support. However,
much of the focus for rural development remains the agriculture sector. The National Climate
Change Policy of Pakistan (2012) is silent about creating nonfarm livelihood opportunities,
although the Framework for Implementation of the National Climate Change Policy (2014)
mentions the development of industrial estates to provide employment to rural labor. Sustainable
rural development will require much more attention on climate-resilient agriculture and nonfarm
employment opportunities.
Exposure to disasters and the prevailing coping strategies, in Pakistan and elsewhere, have
long-lasting impacts on the income and savings of affected households. While farmers take into
account seasonal risks and uncertainties in their agricultural practices, with climate change the
magnitude and frequency of climate shocks is changing. It is for these reasons that Sustainable
Development Goal 13 (Climate Action) emphasizes the need to strengthen resilience and adaptive
capacity to climate-related hazards and natural disasters.

20
FIGURES
Figure 1: Timeline of Events, 2010-2013.

21
Figure 2: Pakistani Regions affected by the floods of 2011 and 2012

22
Figure 3: Monthly average number of migrants from household
Sources: Data comes from the Pakistan Rural Household Panel Survey (PRHPS) I and II.

23
TABLES
TABLE 1 – NUMBER OF DISASTERS BY TYPES IN PAKISTAN, 1900-2015
Disaster types
Occurrence
Total deaths
Homeless
Total affected
Total damage (US$)
Drought 1 143 2,200,000 247,000 Earthquake 31 143,734 5,187,485 7,275,388 5,329,755 Epidemic 11 308 18,978 Extreme temperature 17 2,774 80,574 18,000 Flood 93 17,179 4,241,775 79,381,455 20,971,178 Insect infestation 1 Landslide 22 789 3,300 34,154 18,000 Mass movement (dry) 2 63 Storm 27 11,995 234,090 2,604,699 1,715,036
Notes: Total affected includes the number of deaths, injured, otherwise affected and homelessness due to disaster exposure. Data source: EM-DAT (Created on: October 2, 2017)
24
TABLE 2 – NUMBER OF FLOODS IN PAKISTAN, 2001-2015
Year
Occurrence
Total deaths
Homeless
Total affected
Total damage (US$)
2001 1 210 400,179 246,000 2002 3 37 1,000 4,010 30 2003 3 266 1,266,243 2004 2 5 2005 5 636 3,500 7,527,043 30,000 2006 7 400 5,600 8,125 2007 6 526 2,706 327,118 2008 3 83 290,764 103,000 2009 3 102 75,080 2010 4 2,113 20,363,496 9,500,000 2011 1 509 5,400,755 2,500,000 2012 3 518 5,050,564 2,500,000 2013 2 268 1,497,782 1,500,000 2014 1 255 2,530,673 2,000,000 2015 6 367 1,577,490 1,000
Notes: Total affected includes the number of deaths, injured, otherwise affected and homelessness due to disaster exposure. Data source: EM-DAT (Created on: October 2, 2017)

25
TABLE 3 – CHANGES IN OUTCOME VARIABLES BY TREATMENT AND CONTROL GROUPS
(1) (2) (3) (4)
Changes in Whole Sample Flood 2011=A Flood 2012=U
Flood 2011=U Flood 2012=A
Flood 2011=A Flood 2012=A
Flood 2011=U Flood 2012=U
Share of Farm Income
-0.409 (0.476)
-0.265 (0.433)
-0.613 (0.456)
-0.325 (0.456)
-0.425 (0.478)
Farm Income 84.48
(22,641) 767.7
(3,783) -250.3 (6,398)
-1,083 (4,100)
171.8 (25,989)
Nonfarm Income
2,237 (4,152)
1,016 (2,723)
2,194 (2,521)
1,567 (2,730)
2,488 (4,502)
Cash Savings -22.99 (3,739)
122.3 (1,686)
-34.55 (362.6)
-722.9 (3,579)
50.71 (4,061)
New Livestock 48.80
(790.7) -23.13 (343.3)
24.40 (868.4)
41.58 (771.2)
60.84 (828.6)
Seed Stock 1,766
(22,191) 1,891
(4,336) -71.30 (496.1)
1,445 (2,972)
1,920 (25,530)
Number of Observations
1,937 190 101 191 1,455
Notes: A= affected by the event; U= unaffected by the event.

26
TABLE 4 – SUMMARY STATISTICS OF OUTCOME VARIABLES
Outcome Variables
Description Round 1
Round 2
Flood 2011 Exposure to the 2011 flood: 1 if affected regions, 0 if otherwise 0.197 Flood 2012 Exposure to the 2012 flood: 1 if affected regions, 0 if otherwise 0.151 Farm income Total annual household income from agricultural activities, last 12
months ($) 3,555
(12,232) 3,640
(22,285) Nonfarm income Total annual household income from non-agricultural activities, last
12 months ($) 16.87
(367.8) 2,254
(4,159) New Livestock Total annual expenditure on the purchase of new livestock, last 12
months ($) 56.66
(447.2) 105.5
(649.2) Cash Savings Total annual cash savings by all the household members, last 12
months ($) 375.5
(2,971) 352.5
(2,498) Seed stock Total value of the seed stocked for next farming season, last 12
months ($) 101.2
(330.9) 1,868
(22,194) Share of farm income
Farm income as proportion of total household income, last 12 months
0.997 (0.0507)
0.589 (0.475)
Number of Observations
1,937 1,937
Note: All monetary values are expressed in US$PPP at the rates of 24.35 and 25.25 Pakistani Rupees per US$ for rounds 1 and 2, respectively.
27
TABLE 5 – BASELINE SUMMARY STATISTICS OF CONTROL VARIABLES BY GROUPS
(1) (2) (3) (4)
Variables Description Whole Sample
Flood 2011=A Flood
2012=U
Flood 2011=U Flood
2012=A
Flood 2011=A Flood
2012=A
Flood 2011=U Flood
2012=U
Average Age Average age of all household members
(years) 25.59
(9.571) 23.83
(8.485) 25.56
(11.26) 24.27
(10.65) 25.99
(9.395) Dependency ratio Ratio of working age (15-64 years) to other
family members 1.029
(0.901) 1.186
(0.973) 1.085
(1.152) 1.272
(1.088) 0.973
(0.835) Average education Average years of schooling of all family
members 4.064
(4.174) 2.521
(4.065) 3.323
(4.341) 3.789
(5.040) 4.351
(3.997) Tractor Dummy: 1 if the household owns a tractor
of plough-yoke; 0 otherwise 0.0681 (0.252)
0.0421 (0.201)
0.0594 (0.238)
0.0314 (0.175)
0.0770 (0.267)
Irrigation Pump Dummy: 1 if the household owns irrigation pump; 0 otherwise
0.131 (0.338)
0.0421 (0.201)
0.238 (0.428)
0.110 (0.314)
0.138 (0.345)
Other Assets Dummy: 1 if the household owns other agricultural assets; 0 otherwise
0.336 (0.472)
0.205 (0.405)
0.386 (0.489)
0.361 (0.482)
0.346 (0.476)
Cultivable land Hectares of operated land by the household 0.980 (2.236)
0.828 (1.293)
0.791 (1.671)
0.997 (1.390)
1.011 (2.448)
Number of Observations
1,937 190 101 191 1,455
Notes: Baseline summary statistics are obtained from the first round of the PRHPS dataset. All land measures are expressed in hectares. A = affected by the event; U = unaffected by the event.

28
TABLE 6 – FLOOD-INDUCED CHANGES IN INCOME COMPOSITION
Variables Share of Farm Income Farm Income Nonfarm Income
2012 Flood -0.113*** -862.527 79.823 (0.042) (908.913) (102.393) 2011 Flood 0.085** -1,911.283*** -511.810*** (0.036) (635.871) (177.817) 2011 Flood × 2012 Flood 0.071 1,829.665* 114.504 (0.064) (1,105.616) (230.041) Average Age 0.001 -13.939 -0.499 (0.001) (17.388) (5.029) Average education -0.007*** 220.680** 149.133*** (0.002) (96.722) (20.339) Dependency ratio 0.028*** -104.142 -306.858*** (0.008) (173.413) (65.970) Tractor -0.002 4,873.195*** 79.634 (0.016) (1,821.895) (178.212) Irrigation Pump 0.075*** 1,801.604* -536.057*** (0.018) (1,067.497) (149.170) Other Assets 0.087*** -290.009 -375.973** (0.016) (889.919) (157.148) Cultivable land 0.015*** 2,827.987*** -59.823*** (0.004) (892.407) (13.460) Constant 0.716*** 242.217 1,191.333*** (0.034) (694.200) (242.530) Number of Observations 3,788 3,788 3,788 Number of households 1,894 1,894 1,894 Overall R2 0.0554 0.166 0.0636
Notes: Robust standard errors clustered at the union level are shown in parentheses. ***,** and * represent statistical significance at 1, 5 and 10 percent levels, respectively.

29
TABLE 7 – FLOOD-INDUCED CHANGES IN SAVINGS
(1) (2) (3) Variables Cash Savings New Livestock Seed Stock
2012 Flood -239.413** 43.924 -956.991** (116.924) (53.171) (446.215) 2011 Flood -123.680* -28.382 -34.364 (70.379) (18.182) (465.280) 2011 Flood × 2012 Flood 480.245** 8.730 520.949 (210.898) (58.584) (455.560) Average Age 3.945 -0.216 -14.419 (5.483) (0.782) (16.592) Average education 65.971*** 4.054* -32.814 (15.232) (2.427) (42.198) Dependency ratio -31.589 -5.951 -287.668* (49.573) (8.068) (148.229) Tractor 561.231 96.006 -1,492.808* (441.427) (62.664) (851.528) Irrigation Pump 175.619 39.976 -1,466.201 (206.618) (33.502) (1,217.938) Other Assets -97.272 30.329 1,993.701 (108.596) (22.724) (1,523.112) Cultivable land 94.432** 4.448 177.709 (48.041) (6.735) (122.068) Constant -91.889 47.934** 1,343.308** (169.520) (23.521) (563.531) Number of Observations 3,788 3,788 3,788 Number of households 1,894 1,894 1,894 Overall R2 0.0280 0.00929 0.00430
Notes: Robust standard errors clustered at the union level are shown in parentheses. ***,** and * represent statistical significance at 1, 5 and 10 percent levels, respectively.

30
TABLE 8 – MARGINAL PROPENSITY TO SAVE
(1) (2) (3) Variables Cash Savings New Livestock Seed Stock
Farm Income 0.053*** 0.006** 0.042* (0.012) (0.002) (0.022) Nonfarm Income 0.276*** 0.011 -0.212 (0.082) (0.014) (0.177) Constant -154.633** 48.118*** 1,092.721*** (73.457) (16.543) (286.704) Number of Observations 3,788 3,788 3,788 Number of households 1,894 1,894 1,894 Overall R2 0.0323 0.00405 1.39e-05
Notes: Robust standard errors clustered at the union level are shown in parentheses. ***,** and * represent statistical significance at 1, 5 and 10 percent levels, respectively. We do not report the first stage of the regression, but will provide results upon request.

31
TABLE 9 – MIGRATION RESPONSE TO FLOOD EXPOSURE
Variables Coefficient
2012 Flood -1.088*** (0.380) 2011 Flood -1.369*** (0.292) 2011 Flood × 2012 Flood 1.941*** (0.538) Average Age -0.023** (0.011) Average education -0.075*** (0.021) Dependency ratio -0.260** (0.108) Tractor -0.360 (0.379) Irrigation Pump -0.363 (0.290) Other Assets -1.093*** (0.206) Cultivable land 0.123*** (0.045) Constant 2.832*** (0.376) Number of Observations 3,788 Number of households 1,894 Overall R2 0.0266
Notes: Robust standard errors clustered at the union level are shown in parentheses. ***,** and * represent statistical significance at 1, 5 and 10 percent levels, respectively. Outcome variable, migration, is defined as “% of total household Person months of temporary migration in the last 12 months”.

32
TABLE 10 – INCOME EFFECTS OF FLOOD-INDUCED MIGRATION
(1) (2) (3) Variables Share of Farm Income Farm Income Nonfarm Income
Temporary migration -0.045*** -850.478* 98.979 (0.010) (434.746) (68.455) Constant 0.843*** 4,561.578*** 1,029.797*** (0.013) (584.577) (92.047) Number of Observations 3,788 3,788 3,788 Number of households 1,894 1,894 1,894 Overall R2 0.00270 0.000432 0.00152
Notes: Robust standard errors clustered at the union level are shown in parentheses. ***,** and * represent statistical significance at 1, 5 and 10 percent levels, respectively. Outcome variables follow the definitions in Table 4; whereas temporary migration is defined as “% of total household Person months of temporary
migration in the last 12 months”. We do not report the first stage of the regression, but will provide results upon request.

33
REFERENCES
Ahmad, N. (2015), ‘Economic losses from disaster’, National Briefing. LEAD Pakistan.
Anttila-Hughes, J.K., and S.M. Hsiang (2013), ‘Destruction, Disinvestment, and Death: Economic
and Human Losses Following Environmental Disaster’, Available at SSRN 2220501.
Arai, T. (2012), ‘Rebuilding Pakistan in the Aftermath of the Floods: Disaster Relief as Conflict
Prevention’, Journal of Peace-building and Development 7(1): 51-65.
Asian Development Bank (2013), ‘The Rise of Natural Disasters in Asia and the Pacific: Learning from
ADB’s Experience’, Manila: Asian Development Bank.
Banerjee, L. (2007), ‘Effect of Flood on Agricultural Wages in Bangladesh: An Empirical
Analysis’, World Development 35(11): 1989–2009.
Barnett, B.J., and O. Mahul (2007), ‘Weather Index Insurance for Agriculture and Rural Areas in
Lower-Income Countries’, American Journal of Agricultural Economics 89(5): 1241–1247.
Bohra-Mishra, P., M. Oppenheimer, and S.M. Hsiang (2014), ‘Nonlinear Permanent Migration
Response to Climatic Variations but Minimal Response to Disasters’, Proceedings of the
National Academy of Sciences 111(27): 9780–9785.
Boustan, L.P., M.E. Kahn, and P.W. Rhode (2012), ‘Moving to Higher Ground: Migration
Response to Natural Disasters in the Early Twentieth Century’, American Economic
Review 102(3): 238–244.
Brickle, L. and A. Thomas (2014), ‘Rising waters, displaced lives’, Forced Migration Review: Crisis,
No. 45.
Bryan, G., S. Chowdhury, and A.M. Mobarak (2014), ‘Underinvestment in a Profitable
Technology: The Case of Seasonal Migration in Bangladesh’, Econometrica 82(5): 1671–
1748.
Cattaneo, C., and G. Peri (2016), ‘The Migration Response to Increasing Temperatures’, Journal of
Development Economics 122: 127–146.
Davies, M., B. Guenther, J. Leavy, T. Mitchell, and T. Tanner (2009), ‘Climate Change Adaptation,
Disaster Risk Reduction and Social Protection: Complementary Roles in Agriculture and
Rural Growth?’, Institute of Development Studies, IDS Working Papers 2009, no. 320.
Duflo, E. (2003), ‘Grandmothers and Granddaughters: Old Age Pensions and Intrahousehold
Allocation in South Africa’, World Bank Economic Review 17(1): 1-25.
EM-DAT (2017), The CRED/OFDA International Disaster Database. Brussels: Université
Catholique de Louvain. http://www.emdat.be
Eskander, S., and E. Barbier (2016), ‘Adaptation to Natural Disasters through the Agricultural
Land Rental Market: Evidence from Bangladesh’, Working Paper 236. Grantham Research
Institute on Climate Change and the Environment.
Food and Agriculture Organization (2015), ‘The impact of disasters on agriculture and food
security’, United Nations.
Food Security Cluster Pakistan (2013), ‘Livelihood Recovery Appraisal 2013 of Households
Affected by Flooding in 2012 in Punjab, Sindh and Balochistan’.
Hornbeck, R. (2012), ‘The Enduring Impact of the American Dust Bowl: Short- and Long-Run
Adjustments to Environmental Catastrophe’, American Economic Review 102(4): 1477-1507.
International Labor Organization (2010), ‘Pakistan's Devastating Floods - Rebuilding Lives and
Livelihoods’, Word for Work - The Magazine of the ILO. No. 70.

34
Jensen, R. (2000), ‘Agricultural Volatility and Investments in Children’, American Economic
Review 90(2): 399-404.
Kreft, S., D. Eckstein, and I. Melchior (2017), ‘Global climate risk index 2017: Who Suffers Most
from Extreme Weather Events? Weather-related Loss Events in 2015 and 1996 to 2015’,
Briefing paper. German Watch. Bonn.
Looney, R. (2012), ‘Economic Impacts of the Floods in Pakistan’, Contemporary South Asia 20(2):
225-241.
Maccini, S.L., and D. Yang (2009), ‘Under the Weather: Health, Schooling, and Economic
Consequences of Early-Life Rainfall’, American Economic Review 99(3): 1006–1026.
Mueller, V., and A. Quisumbing (2011), ‘How Resilient Are Labour Markets to Natural Disasters?
The Case of the 1998 Bangladesh Flood’, Journal of Development Studies 47(12): 1954-1971.
Mueller, V., C. Gray, and K. Kosec (2014), ‘Heat Stress Increases Long-Term Human Migration
in Rural Pakistan’, Nature Climate Change 4(3): 182-185.
Najam-u-Din (2010), 'Internal Displacement in Pakistan: Contemporary Challenges', Human
Rights Commission of Pakistan.
Pakistan Bureau of Statistics (2014), http://www.pbs.gov.pk/
Penning-Rowsell, E.C., P. Sultana, and P.M. Thompson (2013), ‘The “Last Resort”? Population
Movement in Response to Climate-Related Hazards in Bangladesh’, Environmental Science
and Policy 27: S44-S59.
PRHPS (2012), Pakistan Rural Household Panel Survey Round 1, International Food Policy
Research Institute and Innovative Development Strategies 2014.
PRHPS (2013), Pakistan Rural Household Panel Survey Round 2, International Food Policy
Research Institute and Innovative Development Strategies 2016.
Salik, K.M., A. Qaisrani, M.A. Umar, and S.M. Ali (2017), ‘Migration Futures in Asia and Africa:
Economic Opportunities and Distributional Effects - the Case of Pakistan’, Pathways to
Resilience in Semi-arid Economies. Sustainable Development Policy Institute.
Strömberg, D. (2007), ‘Natural Disasters, Economic Development, and Humanitarian Aid’, Journal
of Economic Perspectives 21(3): 199-222.
Thomas, T.S., K. Mainuddin, C. Chiang, A. Rahman, A. Haque, N. Islam, S. Quasem, and Y. Sun
(2013), ‘Agriculture and Adaptation in Bangladesh: Current and Projected Impacts of
Climate Change’, Vol. 1281. International Food Policy Research Institute (IFPRI).
World Bank (2015), World Development Indicators 2015. World Bank Publications.